Article

Acid Mine Drainage Treatment Using a Process Train with Laterite Mine Waste, Concrete Waste, and Limestone as Treatment Media

by
Casey Oliver A. Turingan
1,*,
Kristina S. Cordero
1,
Aileen L. Santos
1,
Gillian Sue L. Tan
1,
Carlito B. Tabelin
2,
Richard D. Alorro
3 and
Aileen H. Orbecido
1
1
Department of Chemical Engineering, De La Salle University, Manila 1004, Philippines
2
School of Minerals and Energy Resources Engineering, The University of New South Wales, Sydney, NSW 2052, Australia
3
Western Australia School of Mines: Minerals, Energy and Chemical Engineering, Curtin University, Kalgoorlie Campus, Kalgoorlie, WA 6430, Australia
*
Author to whom correspondence should be addressed.
Water 2022, 14(7), 1070; https://doi.org/10.3390/w14071070
Submission received: 15 February 2022 / Revised: 24 March 2022 / Accepted: 25 March 2022 / Published: 29 March 2022

Abstract

:
Without treatment, the harmful effects of acid mine drainage (AMD) lead to the destruction of surrounding ecosystems, including serious health impacts to affected communities. Active methods, like chemical neutralization, are the most widely used approach to AMD management. However, these techniques require constant inputs of energy, chemicals, and manpower, which become unsustainable in the long-term. One promising and sustainable alternative for AMD management is to use passive treatment systems with locally available and waste-derived alkalinity-generating materials. In this study, the treatment of synthetic AMD with laterite mine waste (LMW), concrete waste, and limestone in a successive process train was elucidated, and the optimal process train configuration was determined. Six full factorial analyses were performed following a constant ratio of 0.75 mL AMD/g media with a 15-min retention time. The evolution of the pH, redox potential (Eh), total dissolved solids (TDS), heavy metals concentration, and sulfates concentrations were monitored as the basis for evaluating the treatment performance of each run. LMW had the highest metal and sulfates removal, while concrete waste caused the largest pH increase. A ranking system was utilized in which each parameter was normalized based on the Philippine effluent standards (DENR Administrative Order (DAO) 2016–08 and 2021–19). Run 4 (Limestone-LMW-Concrete waste) showed the best performance, that is, the pH increased from 1.35 to 8.08 and removed 39% Fe, 94% Ni, 72% Al, and 52% sulfate. With this, the process train is more effective to treat AMD, and the order of the media in treatment is significant.

1. Introduction

The expansion of mining operations worldwide will intensify to meet global demands for minerals and metals for the clean energy transition [1,2,3,4,5]. Consequently, environmental problems related to waste rocks/overburden, tailings, and mine drainage will continue to increase [6,7]. The Philippines is ranked fifth in the world with the highest mineral sources, which include gold, nickel, copper, and chromite [8]. For example, the country’s copper–gold deposit is one of the largest worldwide, and its mineral wealth was estimated at $840 million in 2012 [9,10]. Many mineral deposits in the Philippines remain undeveloped, but the mining industry landscape is rapidly changing as the government pushes for the development of these resources to grow the economy.
Acid mine drainage (AMD), one of the most notorious and persistent mining-related problems, is defined as acidic discharges containing hazardous heavy metals (e.g., copper (Cu) and manganese (Mn)) and environmentally-regulated sulfate (SO42) [4,11]. Copper is an essential micronutrient but is toxic at high concentrations, especially to fishes [12], while Mn could cause damage to the central nervous system like the effects of lead poisoning [13]. Historic and abandoned mines are common sources of AMD and continue to pollute the environment, even after decades of closure [14]. In Japan, for example, some decommissioned mines have been generating AMD from tailings storage facilities (TSFs) and old-mine workings for over 40 years [15,16]. AMD is generally not a problem in active mines, as the interactions of wastes and water are too brief due to continuous pumping of water out of the site to prevent flooding. Moreover, tailings from flotation circuits for sulfide processing have residual alkalinity because they are operated around pH 10 [17,18]. Given enough time after mine closure, sulfide minerals in the wastes and mine workings react with water and oxygen, which leads to AMD formation.
Sulfide minerals like pyrite (FeS2), arsenopyrite (FeAsS2), chalcopyrite (CuFeS2), and pyrrhotite (FeS) are the main contributors to AMD formation [19,20]. Among them, pyrite is the most abundant gangue sulfide mineral in porphyry ore deposits and mineralized veins [21]. The oxidation of pyrite is an electrochemical process accelerated in the presence of oxidants like O2 and ferrous ions (Fe3+) [22]. This process starts when pyrite is exposed to water and oxygen (Equation (1)) and is accelerated with time as the pH drops below 4 due to the higher solubility of Fe3+ coupled with the mediation of microorganisms like iron-oxidizing bacteria (Equations (2)–(4)) [11,23].
FeS2 (s) + 15/4O2 + 7/2H2O → 4H+ + 2SO42− + Fe(OH)3
FeS2 + 14Fe3+ + 8H2O → 15Fe2+ + 2SO42− + 16H+
4Fe2+ + O2 + 4H+ → 4Fe3+ + 2H2O
FeS2 (s) + 15/4O2 + 1/2H2O → H+ + 2SO42− + Fe3+
Although AMD is mostly formed due to the exposure of sulfide minerals to oxygen and water, there are additional factors that contribute to its formation. The major factors are the. moisture content in the atmosphere, presence of oxidants, pH levels, temperature, chemical activity of ferric iron, and surface area of exposed sulfide minerals [24]. Coexisting minerals are also important, because most of them are soluble under acidic conditions, releasing ions like Ca2+, Al3+, and dissolved Si that could interfere with heavy metal precipitation reactions during treatment [25]. All these factors must be taken into consideration in the selection of the most suitable treatment strategy for AMD.
AMD treatment strategies are broadly classified into active and passive methods [26]. Active treatment requires the constant input of energy, chemicals, and manpower, while passive strategies rely on naturally-occurring physical, geochemical, and biological processes in the environment with little external input of energy. Active treatment strategies are very effective but become costly and unsustainable in the long-term [26]. This is because AMD formation could persist for hundreds to thousands of years [27,28]. As an alternative, researchers have developed technologies that allow natural chemical and biological treatments for passively treating AMDs [29]. However, these processes (specifically, their elemental concentrations, flow volumes, and site characteristics) must be properly determined before designing the treatment process [29,30]. Passive treatments are also only best suited for AMDs which have a low acidity (<800 mg/CaCO3/L), low flow rates (<50 L/s), and low acidity loads (<100–150 kg of CaCO3/day) [31]. Because AMD treatments are continuous, passive treatments, which are naturally-occurring, are more economical and sustainable in the long run than active treatments. However, it must be noted that the life expectancy of passive treatment systems highly depends on the mass of organic matter and correct implementation in the system [31].
A single substrate/medium is often used to treat AMDs in passive systems. However, since some media have their own limitations that can affect the efficiency of the treatment process, researchers have studied the feasibility of using mixed substrates, which refer to two or more media combined with their corresponding ratios, in treating AMDs [32,33,34,35,36]. For example, it was observed that mushroom compost was able to reduce sulfate efficiently, while activated sludge reduced heavy metal concentrations in the treatment [37]. In other words, the media utilized in mixed substrates can complement each other’s strengths, improving the neutralization and reduction of the metals concentration to attain the required standards. In this study, a process train, which is a successive treatment using batch experiments, was utilized.
The three neutralizing agents utilized in this study were limestone, laterite mine waste (LMW), and concrete waste. Limestone, a sedimentary rock which consists of mostly CaCO3, is the most widely used media for AMD treatment, as it is the least expensive for acid neutralization and thee reduction of heavy metals [29,38,39]. However, limestone is less efficient in iron-rich AMDs due to “armoring” that reduces its solubility [29]. Meanwhile, to reduce the sources of pollution of nickel mine wastes, LMW, which contains goethite, an iron-rich oxyhydroxide mineral, has been repurposed, characterized, and found to potentially treat AMDs [40,41,42]. Due to its large surface area and numerous active sites for reactions to occur, LMW can also remove about 99% of Al3+ and Fe, 94% Ni, and 93% SO42 [21]. Finally, concrete waste, a byproduct from local demolition sites, contains alkaline materials like cement, CaO, and CaCO3 that can neutralize AMD [43].
Although the effects of LMW, concrete waste, and limestone as a single substrate have been evaluated in previous studies [21,42], not all results obtained passed the Philippine effluent standards (DAO 2016–08 and 2021–19) [44,45]. In this study, the potential use of mixed substrates for AMD treatment was investigated. Specifically, this study aimed to (i) understand the efficiency of mixed substrate media through process trains and (ii) characterize the media and evaluate the effects of composition on AMD treatment. With this, the efficiency of process trains in AMD treatments was further understood.

2. Materials and Methods

2.1. Materials and Reagents

Laterite mine waste (LMW), concrete waste, and limestone were the three media used in the process trains with different configurations. The limestone and LMW were obtained from a nickel mining site located in Surigao, Philippines. Meanwhile, concrete waste was collected from a construction site located in Metro Manila. The limestone and concrete waste were crushed and sieved, accordingly passing through mesh sizes 4–8, while the LMW was already in a powdered form with a clay-like soil appearance.

2.2. Synthetic Acid Mine Drainage Preparation and Analysis

The synthetic acid mine drainage used for the evaluation of the process trains treatment was prepared based on the data of the AMD from a local mine site. The following reagents with their respective concentrations were used as shown in Table 1. A total of 14.6 L was needed for this study; therefore, 20 L synthetic AMD was prepared to ensure that a sufficient amount was available for the entire experiment. Each reagent was dissolved completely in distilled water before they were mixed and filled up with more distilled water until it reached 20 L.
The parameters considered for the synthetic AMD and water quality in the study were as follows: pH level, redox potential (Eh), electric conductivity (EC), total dissolved solids (TDS), and the concentration of metals (Fe, Al, Ni) and sulfates present. pH and Eh were tested using the Orion Star A211 pH Benchtop Meter, while the EC and TDS were tested using the Orion Star A212 conductivity Benchtop Meter. On the other hand, Fe, Ni, Al, Cu, and sulfates were tested using an Inductively Coupled Plasma–Atomic Emission Spectroscopy (ICP-AES) using the Agilent 5110 ICP-OES and Turbidimetric Method, respectively. The water quality of synthetic AMD is shown in Table 2.

2.3. Characterization of Neutralizing Agents

The three types of neutralizing agents were analyzed for their specific surface area, whole rock chemistry, and mineralogy. The specific surface area of limestone and concrete waste were estimated from an empirical method [46], which was based on the mesh size and the weight of the particles of the two media. Meanwhile, the specific surface area of LMW was determined through the BET method. Furthermore, the chemistry of the media was determined using X-ray Fluorescence spectroscopy (XRF, Horiba MESA-50 X-ray Fluorescence Analyzer, HORIBA, Kyoto, Japan). Lastly, X-ray Diffraction (XRD, Shimadzu LabX XRD-6100 X-ray Diffractometer, Shimadzu Scientific Instruments, Columbia, MD, USA) was used to analyze the structure of crystalline materials and identify the mineral composition of each medium. The physical analysis of the media was not conducted due to time constraints; however, a previous study was able to analyze the bulk density and specific gravity of LMW through the steel ring method and ASTM D 854-00, respectively. It was found that the bulk density was 0.7925 g/cm3, while the specific gravity was 2.3219 [40].

2.4. Process Train: Six Full Factorial Analysis

Successive process trains were evaluated in a laboratory-scale set-up, and a full factorial analysis was performed. A schematic diagram of the experimental set-up is shown in Figure 1. Three polyester reactors were used and contained the corresponding media for each process train; the first two were big reactors, while the third was a smaller reactor. There were four sampling points, as shown in the diagram. The first sampling point correspondd to raw synthetic AMD, while the other sampling points collected (400 mL each) the treated AMD after each media in the process train. A 15-min retention time was employed for each reactor before the sample collection; then, the transferring of the treated AMD solution to the next reactor to be treated by the next media was performed. It must be noted that the media was not transferred to the next reactor; thus, no layering occurred in the experiment. Based on a study, it was found that the retention time varied between 1–60 min and did not have many significant effects on the results [40]. However, based on the graphs presented, the 15-min retention time showed the optimized performance for the overall parameters. The volume of the remaining treated AMD from the previous reactor was measured before each transfer to the next reactor to ensure that the 0.75 g/mL media-to-AMD ratio was retained.
The experimental design consisted of 6 different combinations of process trains as shown in Table 3. As mentioned, each reactor consisted of only one media, and no layering occurred.
Since at least 400 mL of samples were required in each of the sampling points 2 to 4, the volume of the synthetic AMD and the amount of each media were computed to ensure that there were enough samples collected, considering water loss from the media. For the limestone and concrete waste, 10% loss was assumed due to the absorption of the AMD. Meanwhile, 1/3 or 33.3% loss was accounted for the LMW, as the absorption was high due to its clay-like soil property. Considering these losses, the amount of AMD and media required for each process train are summarized in Table 4. Each process train required a different amount of AMD and media, but each strictly followed the ratio of 0.75 mL AMD/g media. Heavy metal and sulfates compositions of the samples were measured through ICP-AES and the Turbidimetric Method, respectively, like the synthetic AMD.

2.5. Geochemical Modeling

Geochemical modeling plays an important role in simulating interactions, such as predicting changes in pH and solute concentrations, that occur in AMD treatment [47]. PHREEQC Interactive (version 3.6.2) is a software that can be used to further understand and complement the trends of the experimental results in treating AMDs, wherein the database utilized for this study is minteq v4. One of the features of the geochemical model used in the study was the calculation of the saturation indices of potential precipitates. The saturation index is defined as the logarithm of the ratio of the ion-activity product to the solubility product constant [48]. It can be a positive, zero, or a negative value, which indicates that the mineral in the solution is in supersaturation, equilibrium, or undersaturation [49]. More specifically, a positive saturation index with a higher magnitude indicates that a certain compound is most likely to precipitate, while a negative saturation index indicates that a compound would unlikely precipitate.

2.6. Ranking Method

The ranking method is one of the simplest methods of evaluating quantitative data. It is known as the level of measurements that shows the extent of priorities between objects or attributes. The ranking system utilized in the analysis to determine the best process train was solely based on the closeness of the parameters to their corresponding standard effluent values. Several parameters were evaluated per process train, which included pH and heavy metals (Fe and Ni) and sulfates removal efficiencies. Other parameters, such as the Eh, EC, and TDS, were no longer due to the lack of acceptable values in local water effluent standards [44,45]. In addition, the mentioned parameters, including the Al concentration, were not included in the standards.
To determine the best process train, the parameters of each process train were first normalized according to the corresponding standards from the DAO 2016–08 and 2021–19 in a range of 0–1 using Equation (5). The normalized values were obtained by first getting the difference of the effluent value and the initial value, which shows the change in the parameter of the AMD after the treatment. The difference of the standard value and initial value were then obtained, after which, the ratio of the two were evaluated. Since the standards indicated were in a range, normalized values that were lower than 0 and greater than 1 were considered. Specifically, if the effluent concentration was lower than the standard, the normalized values would be greater than 1. On the other hand, if the effluent was lower than the initial but higher than the standard, it would have a normalized value between 0–1. Conversely, if the effluent is higher than the initial, it would have a negative normalized value, as this indicates that there is an increase in the concentration.
Normalized   Value = X e X i X s X i
where X e is the effluent value, X i is the initial value, and X s is the standard value.
By obtaining the normalized values for each parameter, the overall treatment efficiency of the runs could be compared. That is, the larger the number, the more ideal it was, as it indicated a better treatment efficiency achieved and vice versa. After this, the total score of all parameters in each process train were obtained and tabulated. Each parameter would have had an equal weight in determining the best process train to minimize prejudices. The run with the highest overall score was deemed as the best and most efficient process train out of the six configurations.

3. Results

3.1. Chemical and Mineralogical Compositions of Neutralizers

As previously mentioned, the whole rock chemistry of each media was tested using the XRF. The composition of each media is shown in Table 5.

3.2. Mineralogy

As mentioned, the mineralogy of each media was tested using XRD. The resulting peaks, which indicate the corresponding minerals present in each media, are shown in Figure 2.

3.3. Specific Surface Area

The specific surface area of LMW, limestone, and concrete waste were obtained and are presented in Table 6.

3.4. Geochemical Modeling: Potential Precipitates

Despite the use of PHREEQC to model the treatment of AMD, the parameters measured and included were limited to pH, Fe, Al, Ni, Cu, Mn, and sulfates. The simulation determined the thermodynamically favorable precipitates (Table S1) of the system at each sampling point, given the characteristics of the AMD and treatment media. The carbonates of Fe, Al, and Ni were not considered in the possible precipitates since they are thermodynamically less stable than Fe and Al oxyhydroxides [50,51]. Moreover, Ni has been previously observed to have the potential for sorption and coprecipitation in the presence of Fe and Al oxides [52,53] These precipitates were examined in an attempt to understand the increasing and decreasing trends of the different physicochemical properties and the heavy metals and sulfates removal that will be discussed in the next section.

3.5. Geochemical Modeling: Effect of Media to pH Level

To further understand the effect of the media limestone and concrete waste on the raw synthetic AMD, the expected pH level of the treated AMD was determined using PHREEQC, wherein the majority base oxide component, which was the calcium oxide, and the specific surface area of the media and the measured parameters, such as pH, Fe, Al, Ni, sulfates, Cu, and Mn, were considered. This is presented in Figure 3. However, due to the LMW having no available kinetic data to be coded, it has been excluded in this section. Furthermore, the generated trends were compared with the experimental trends obtained in the next sections.

3.6. Effect of Process Trains on the Physicochemical Parameters

The physicochemical properties, specifically pH, Eh, EC, and TDS, at each sampling point were tested and graphed as presented in Figure 4. Through these graphs, the effect of each media in the AMD treatment can be observed visually.

3.7. Effect of Alkalinity-Generating Agent on Heavy Metals and Sulfates Removal

The %removal of Fe, Ni, Al, and sulfates at each sampling point of the process train were calculated and are summarized in Table 7. The tabular data presented shows a relative metric of the initial and final results of the AMD treatment. The negative %removal would mean that the concentration of heavy metals and sulfates increased rather than decreased, which may possibly be due to the metal concentrations present in the media itself that may have leached out, contributing to the increase.
The heavy metals and SO42− concentrations at each sampling point were tested and graphed as presented in Figure 5. Through these graphs, the effectivity of the media in the AMD treatment, in terms of heavy metals and sulfates removal, can be observed visually.

3.8. Performance Evaluation of Process Trains

A summary of the effluents of each process train as compared to the DAO 2016–08 effluent standards is presented in Table 8. The effluents that are in a red font indicate that they did not attain the standards.

3.9. Ranking Method of Analysis

The normalized values of pH, Fe, Ni, and sulfates were calculated using Equation (5) and are summarized in Table 9.

4. Discussion

4.1. Whole Rock Chemistry and Mineralogy

As seen in Table 5, LMW mainly consists of amphoteric oxides, such as Fe2O3 and Al2O3, which account for 52.51% and 40.16%, respectively, of the composition. Amphoteric oxides can act as an acid or base, thus possibly raising or lowering the pH of the AMD. On the other hand, some basic oxides present in the LMW used in the experiment were CaO (0.08%) and NiO (2.33%). Although basic oxides have the tendency to react to sulfuric acid, the lower composition of these basic oxides indicate that they can raise the pH level of the AMD by a little. Lastly, the acid oxide present in the LMW is SiO2, which accounts for 2.91% of the bulk chemistry of LMW. This is only considered as a very weak acidic oxide, and thus, it would not react with sulfuric acid nor help in alkalinity-generating the AMD [54].
The limestone used in the experiment was mostly composed of CaO (86.66). Since the basic oxide was the main composition of the limestone, this suggests that the media could increase the pH level. On the other hand, amphoteric oxides, specifically Fe2O3 (0.49%) and Al2O3 (12.77%), were present but had an insignificant impact compared to the basic oxides. There was also no presence of SiO2, which could possibly have hindered the neutralization process [54].
Lastly, the concrete waste was mostly composed of basic oxide, specifically CaO (59.37%). Given the percent composition, it can indicate that the media would have been able to increase the pH of the AMD. Although the SiO2 concentration of the concrete waste was 18.92%, this is also considered as a weak acidic oxide, and thus, it would also not interfere in the neutralization process of CaO [
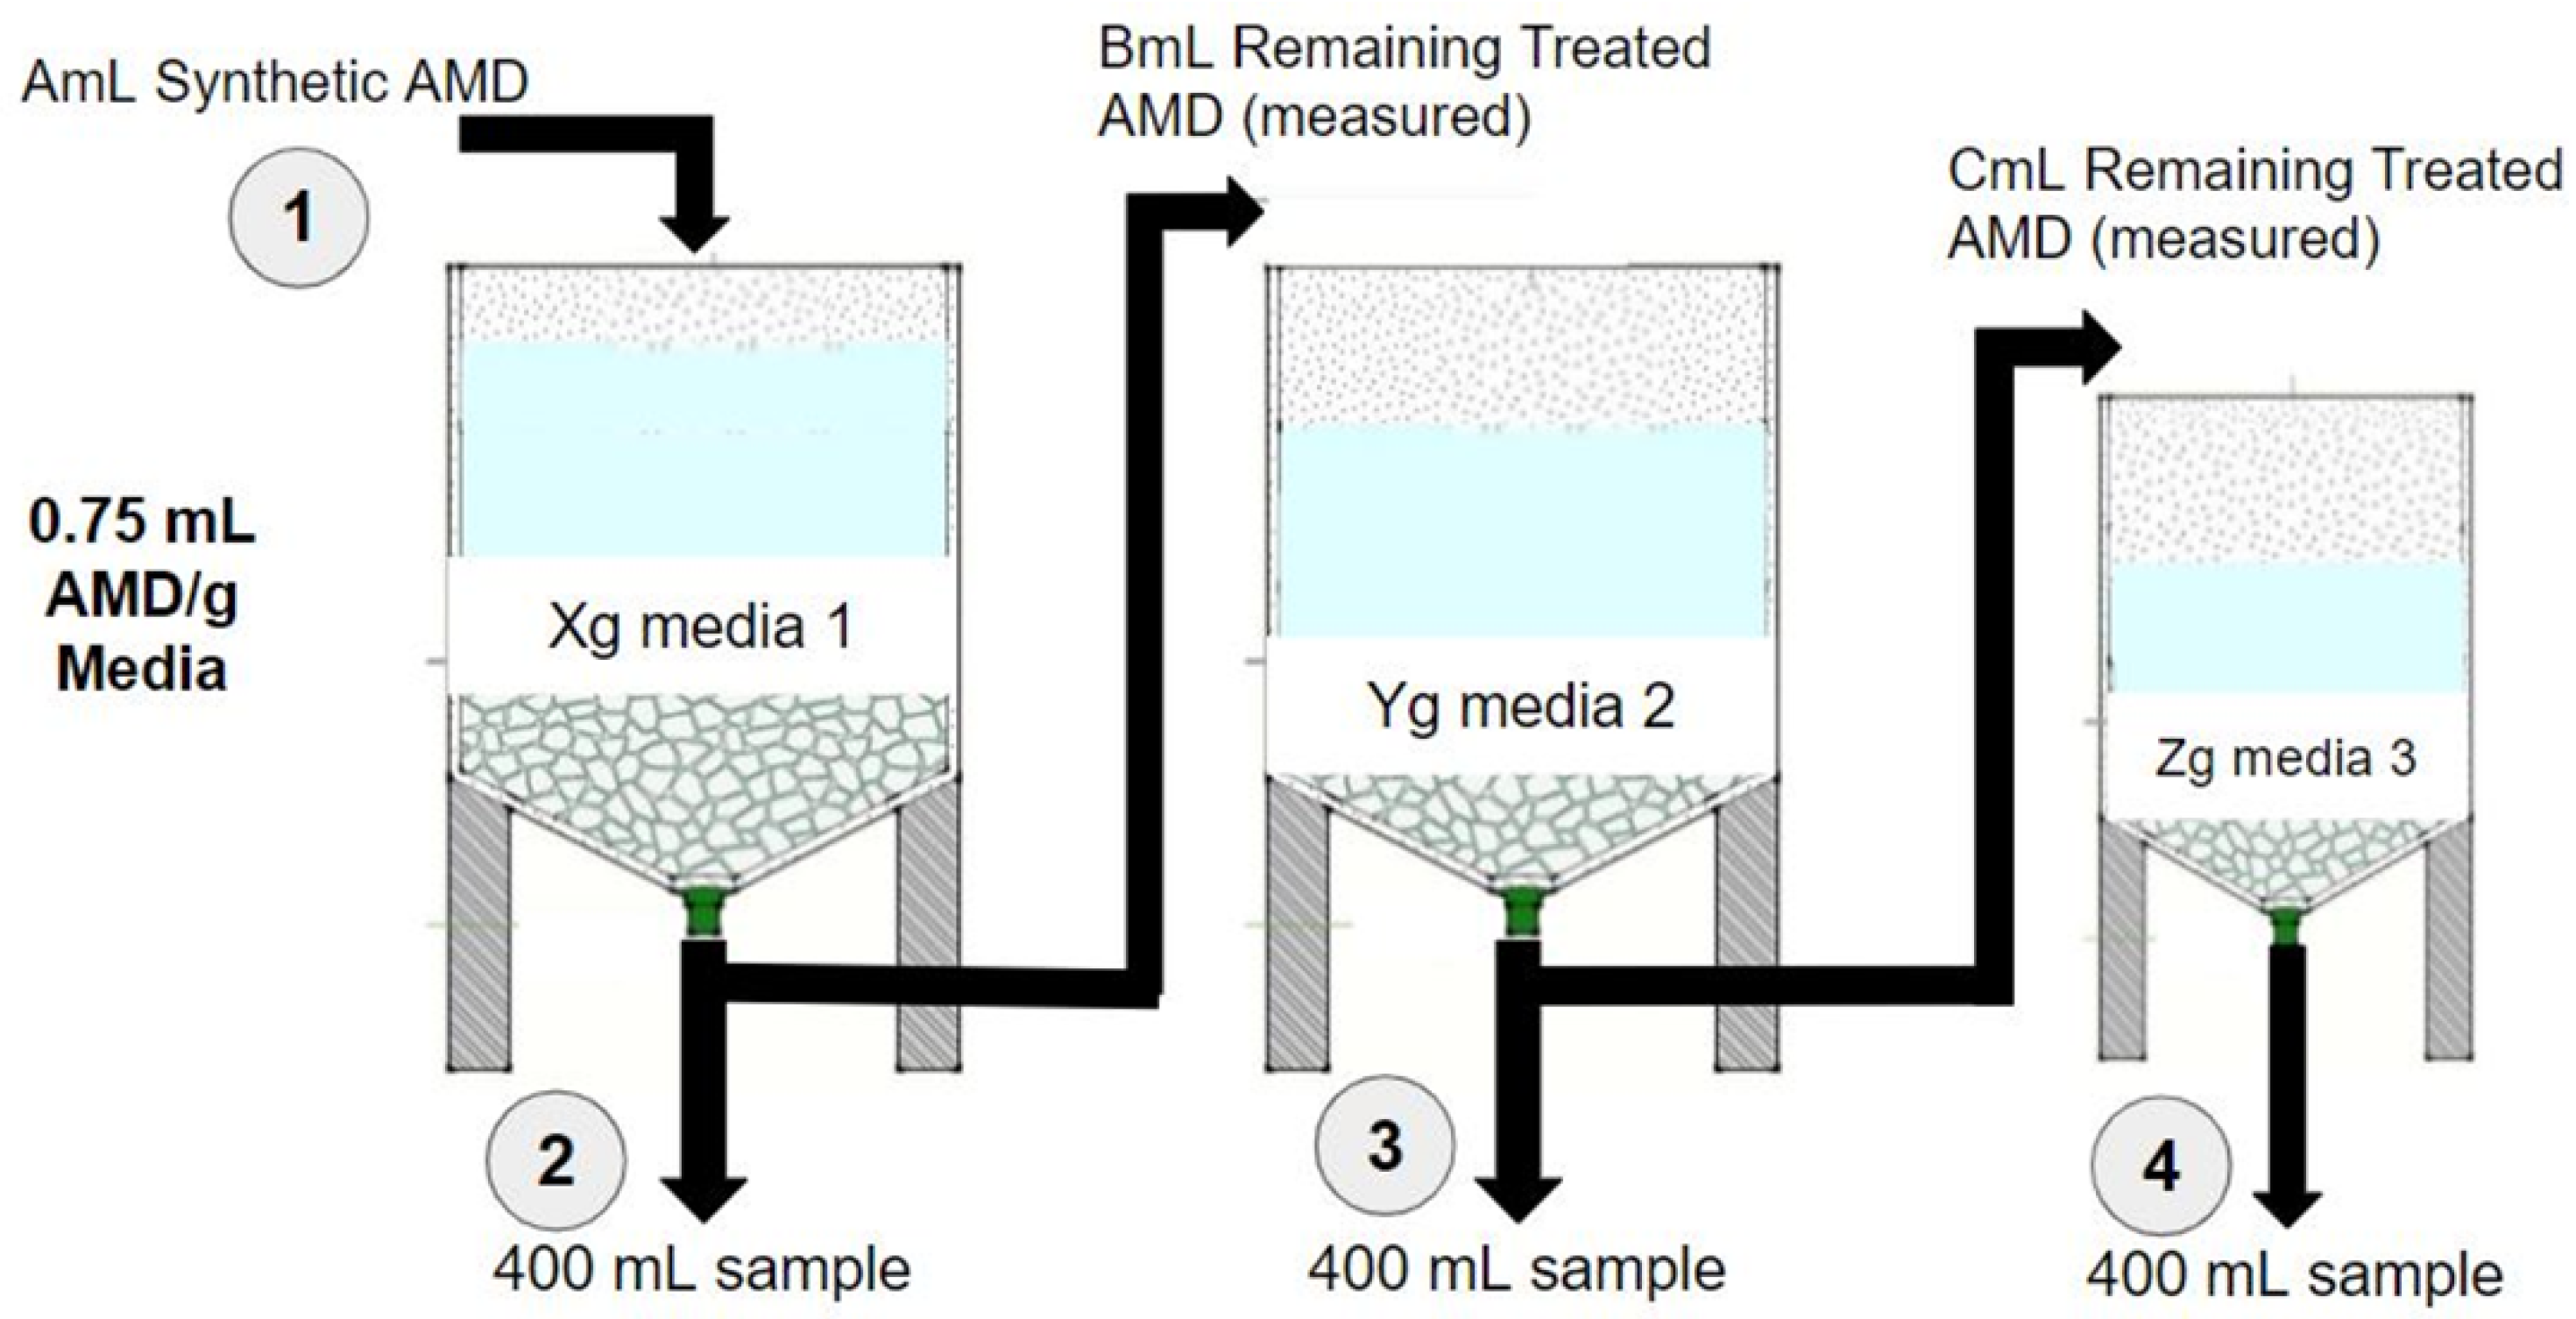
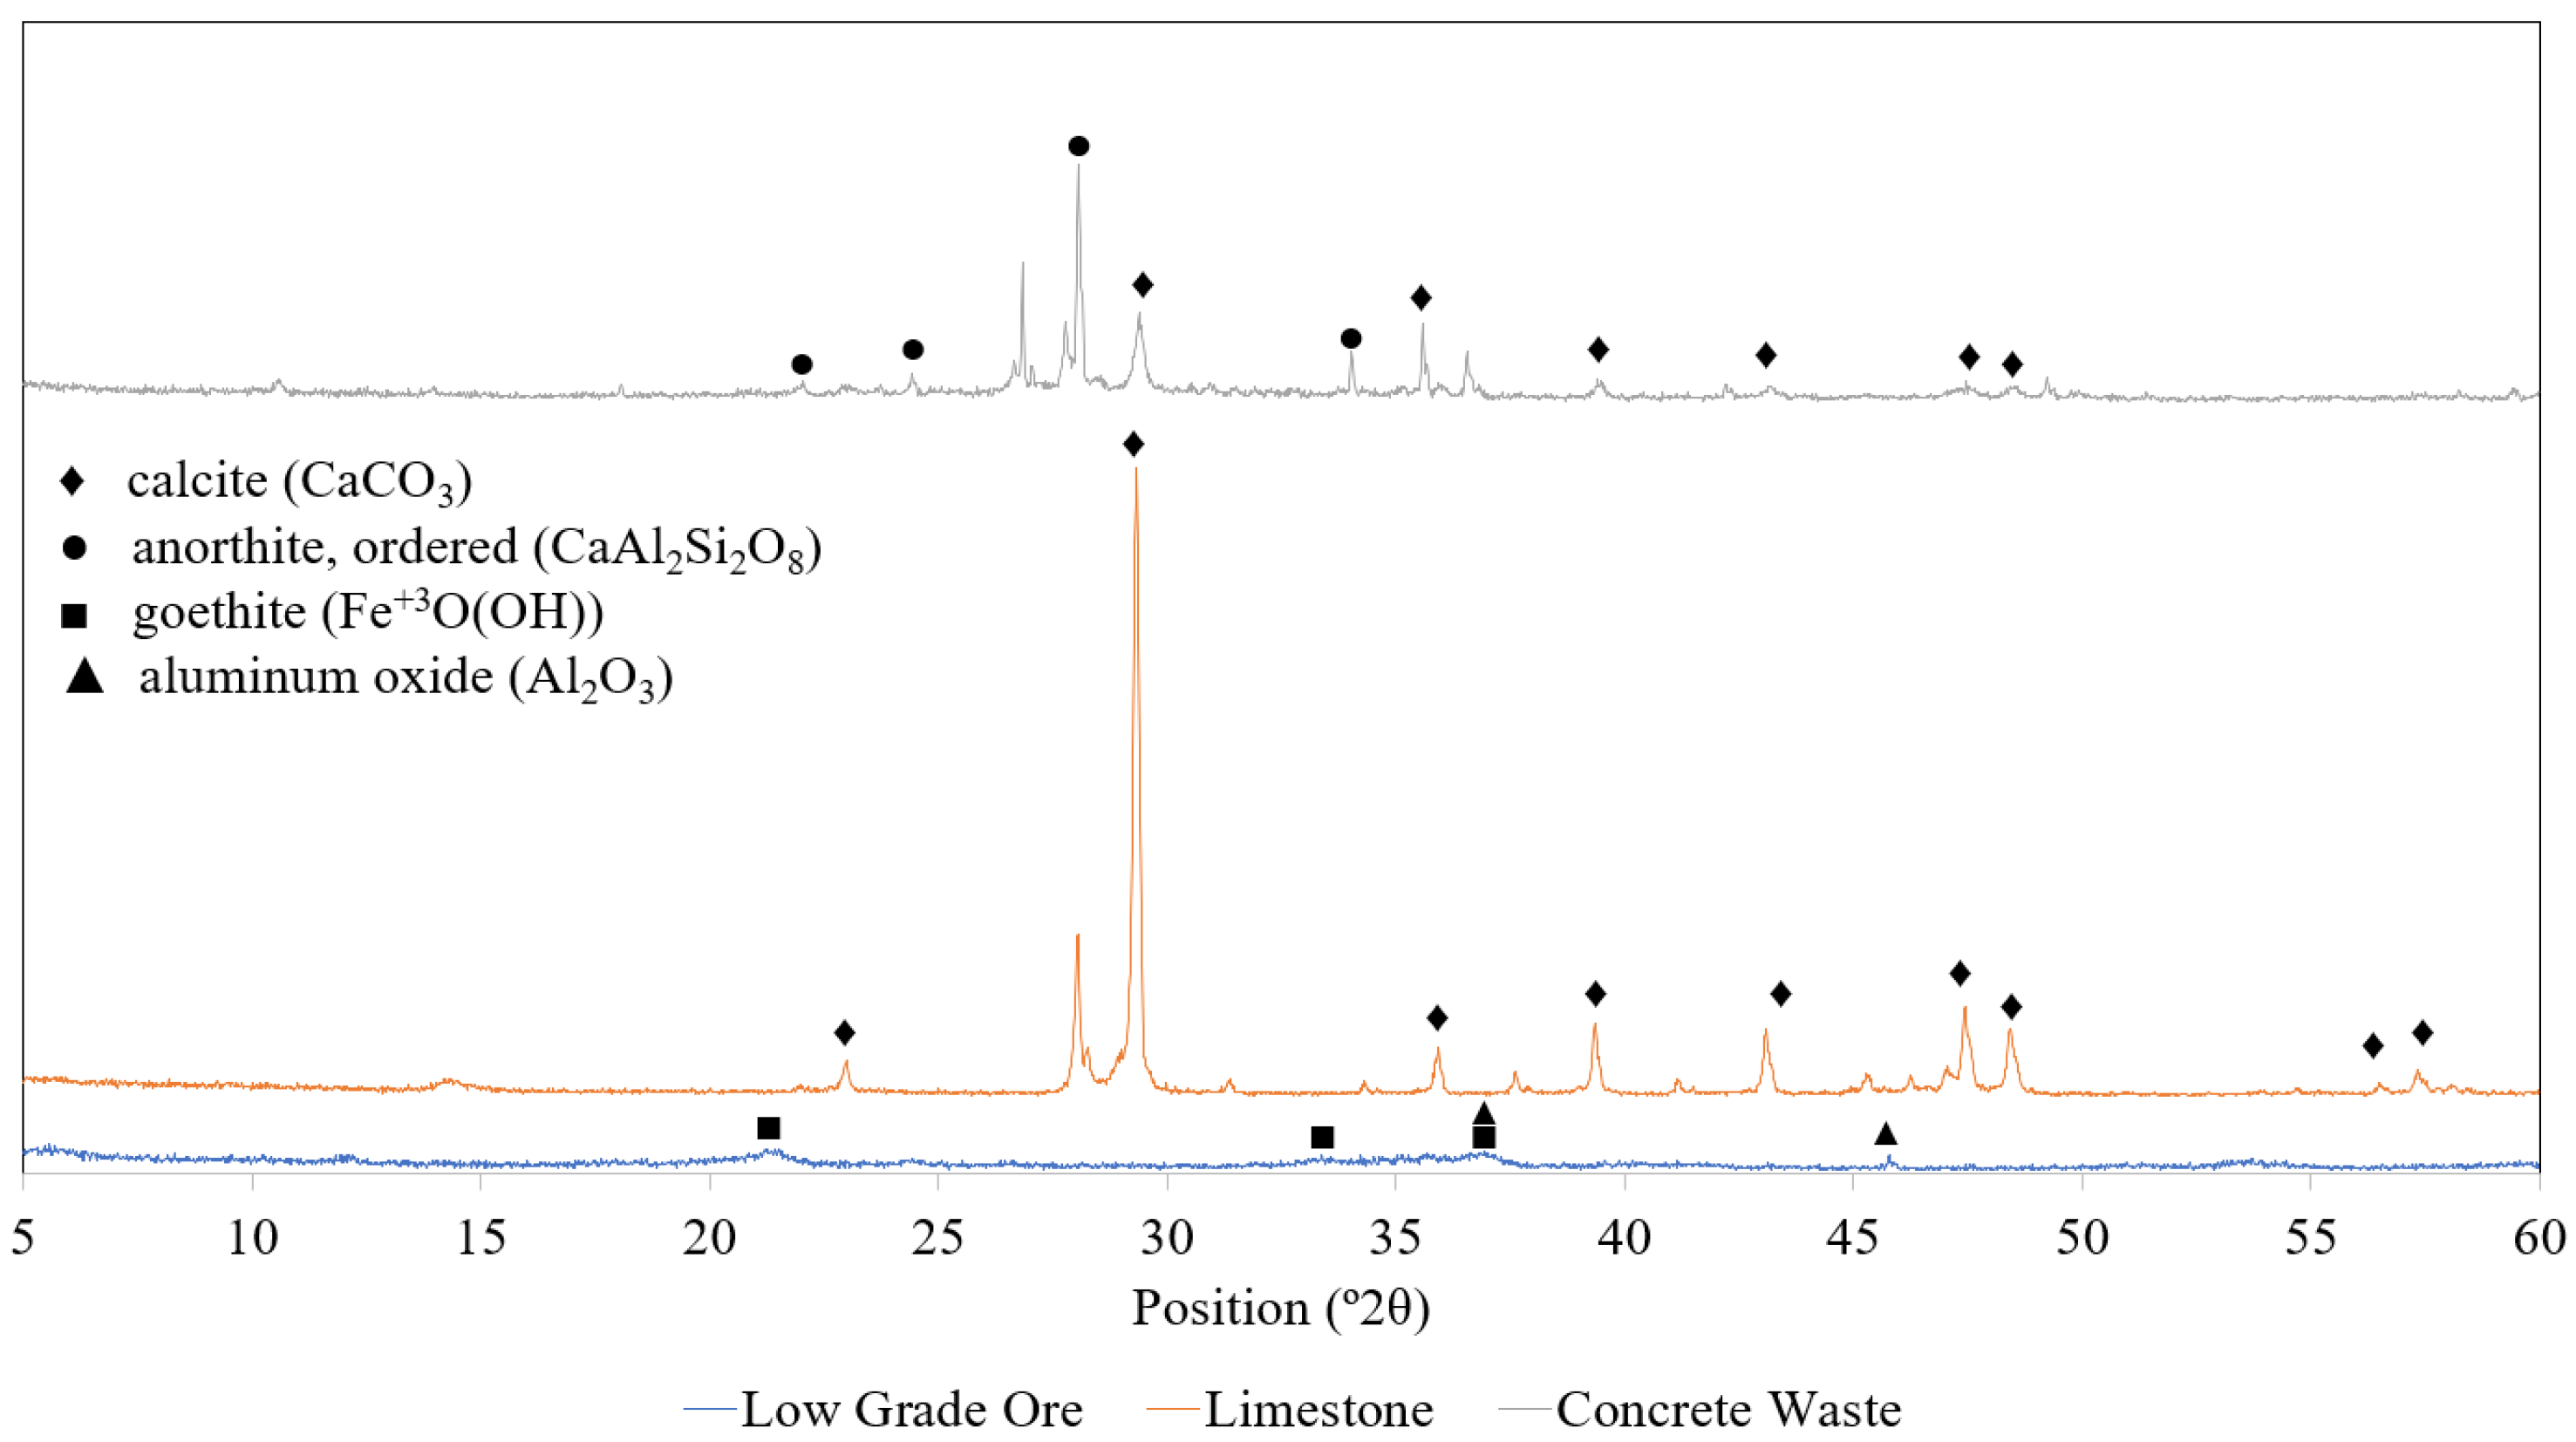
54]. Moreover, it may have been present in the anorthite identified in the material, which further diminished its contribution due to its low solubility relative to that of calcite. Meanwhile, the compounds for the XRD results were analyzed based on the XRF results and the known metals present in the AMD. As seen in Figure 2, the corresponding peaks indicate the minerals present in each media. For the mineralogy of limestone, it was mainly composed of mineral calcite (CaCO3), which is consistent with the XRD results from past studies [21,55].
As for concrete waste, it was observed that mineral anorthite (CaAl2Si2O8) was the main component of concrete waste along with calcite. Anorthite is a calcium-rich feldspar mineral that is a rock-forming material used for manufacturing glass, cement, and ceramics [56]. The result is different from a study where the main components of the concrete studied were portlandite, shale, fly ash, and quartz [53]. However, in another study, the XRD result of the concrete waste studied had significant peaks on quartz, calcite, and feldspar, which included anorthite, ettringite, and albite. Anorthite and calcite were observed to increase the alkalinity of wastewater despite having a material efficiency reduction due to armoring [57,58].
On the other hand, goethite (Fe3+O(OH)) was observed to be the main mineral component of LMW, along with alumina (Al2O3). Goethite is an iron oxide hydroxide that is one of the most thermodynamically stable. It has been widely studied due to its adsorption capacity and potential utilization in the protection of the environment. Goethite is commonly formed with a poorly crystalline structure that is abundant in impurities and surface hydroxyl groups, which contribute to better surface activities and large surface areas. Thus, this implies that the mineral has great potential to be utilized as catalyst or adsorbent especially for cations and organic substances. To be more specific, goethite can adsorb nutrients, heavy metals, and soil organic carbon to reduce further release of chemicals in the environment [59].

4.2. Specific Surface Area

The specific surface area of LMW was determined by BET method, and the result was 138.5 m2/g. Due to its large specific surface area and numerous active sites, this may suggest why it has a good performance in reducing the heavy metals and sulfates concentration. Meanwhile, for the specific surface area of limestone and concrete waste, they were estimated from an empirical method [46], as they depended on the mesh size and the weight of the particles of the two media. The amount of particles used in each mesh was multiplied to the surface area factor provided in the study to obtain the specific surface area.
For limestone, the corresponding surface area for particles passing through mesh +5 and mesh +8 was 2.48 and 4.94 m2, respectively. The specific surface area was determined to be approximately 0.70 m2/kg. On the other hand, the corresponding surface area for concrete waste passing through mesh +4, +5, and +8 was 2.77, 0.65, and 2.26 m2, respectively. The specific surface area of the concrete waste was determined to be approximately 0.54 m2/kg. The specific surface area of the media can be seen in Table 6.

4.3. Geochemical Modeling: Potential Precipitates and Effect to pH Level

Through PHREEQC, it was observed that more precipitates were thermodynamically favored to form after each treatment. This may suggest that more heavy metals were able to be reduced after the entire run, and thus, further neutralization of the solution was achieved. Generally, each run had the same potential precipitates, but the saturation indices differed per sampling points. It was also observed that LMW, as the first media in Runs 5 and 6, only had one potential precipitate. Its low pH value may have contributed to its poor performance, adding to the fact that the optimal solubility of heavy metals had not yet been reached.
With Runs 1 and 2, which had concrete waste as their first media, the pH level was expected to reach 5.24 at the 15-min time mark. Moreover, it was determined to have a pH level of 5.56 at 60 min. In comparison to the actual data gathered from the experiment, concrete waste was able to raise the pH to around 6.0–6.3. The difference in the trend may have been due to the specific surface area of the concrete waste, since the one used in PHREEQC was derived from a study [46]. Nonetheless, it was observed that the available concrete waste utilized was unable to neutralize the raw AMD.
On the other hand, for Runs 3 and 4, which had limestones as their first media, it was expected to raise the pH level more, as it contains more calcium oxide. With the simulation, the pH level was raised to 5.315 at the 15-min time mark. It further increased to 5.671 at 60 min. Compared to the actual data gathered, the pH was around 5.5, which was very close to the simulation. However, in the actual data, concrete waste was able to raise a higher pH level than the limestone, which may have been caused by portlandite, a product during the formation of concrete [60]. Hence, this shows that both limestone and concrete waste as a single media do not have the ability to neutralize the raw AMD within 60 min.

4.4. Effect of an Alkalinity-Generating Agent of pH, Eh, EC, and TDS

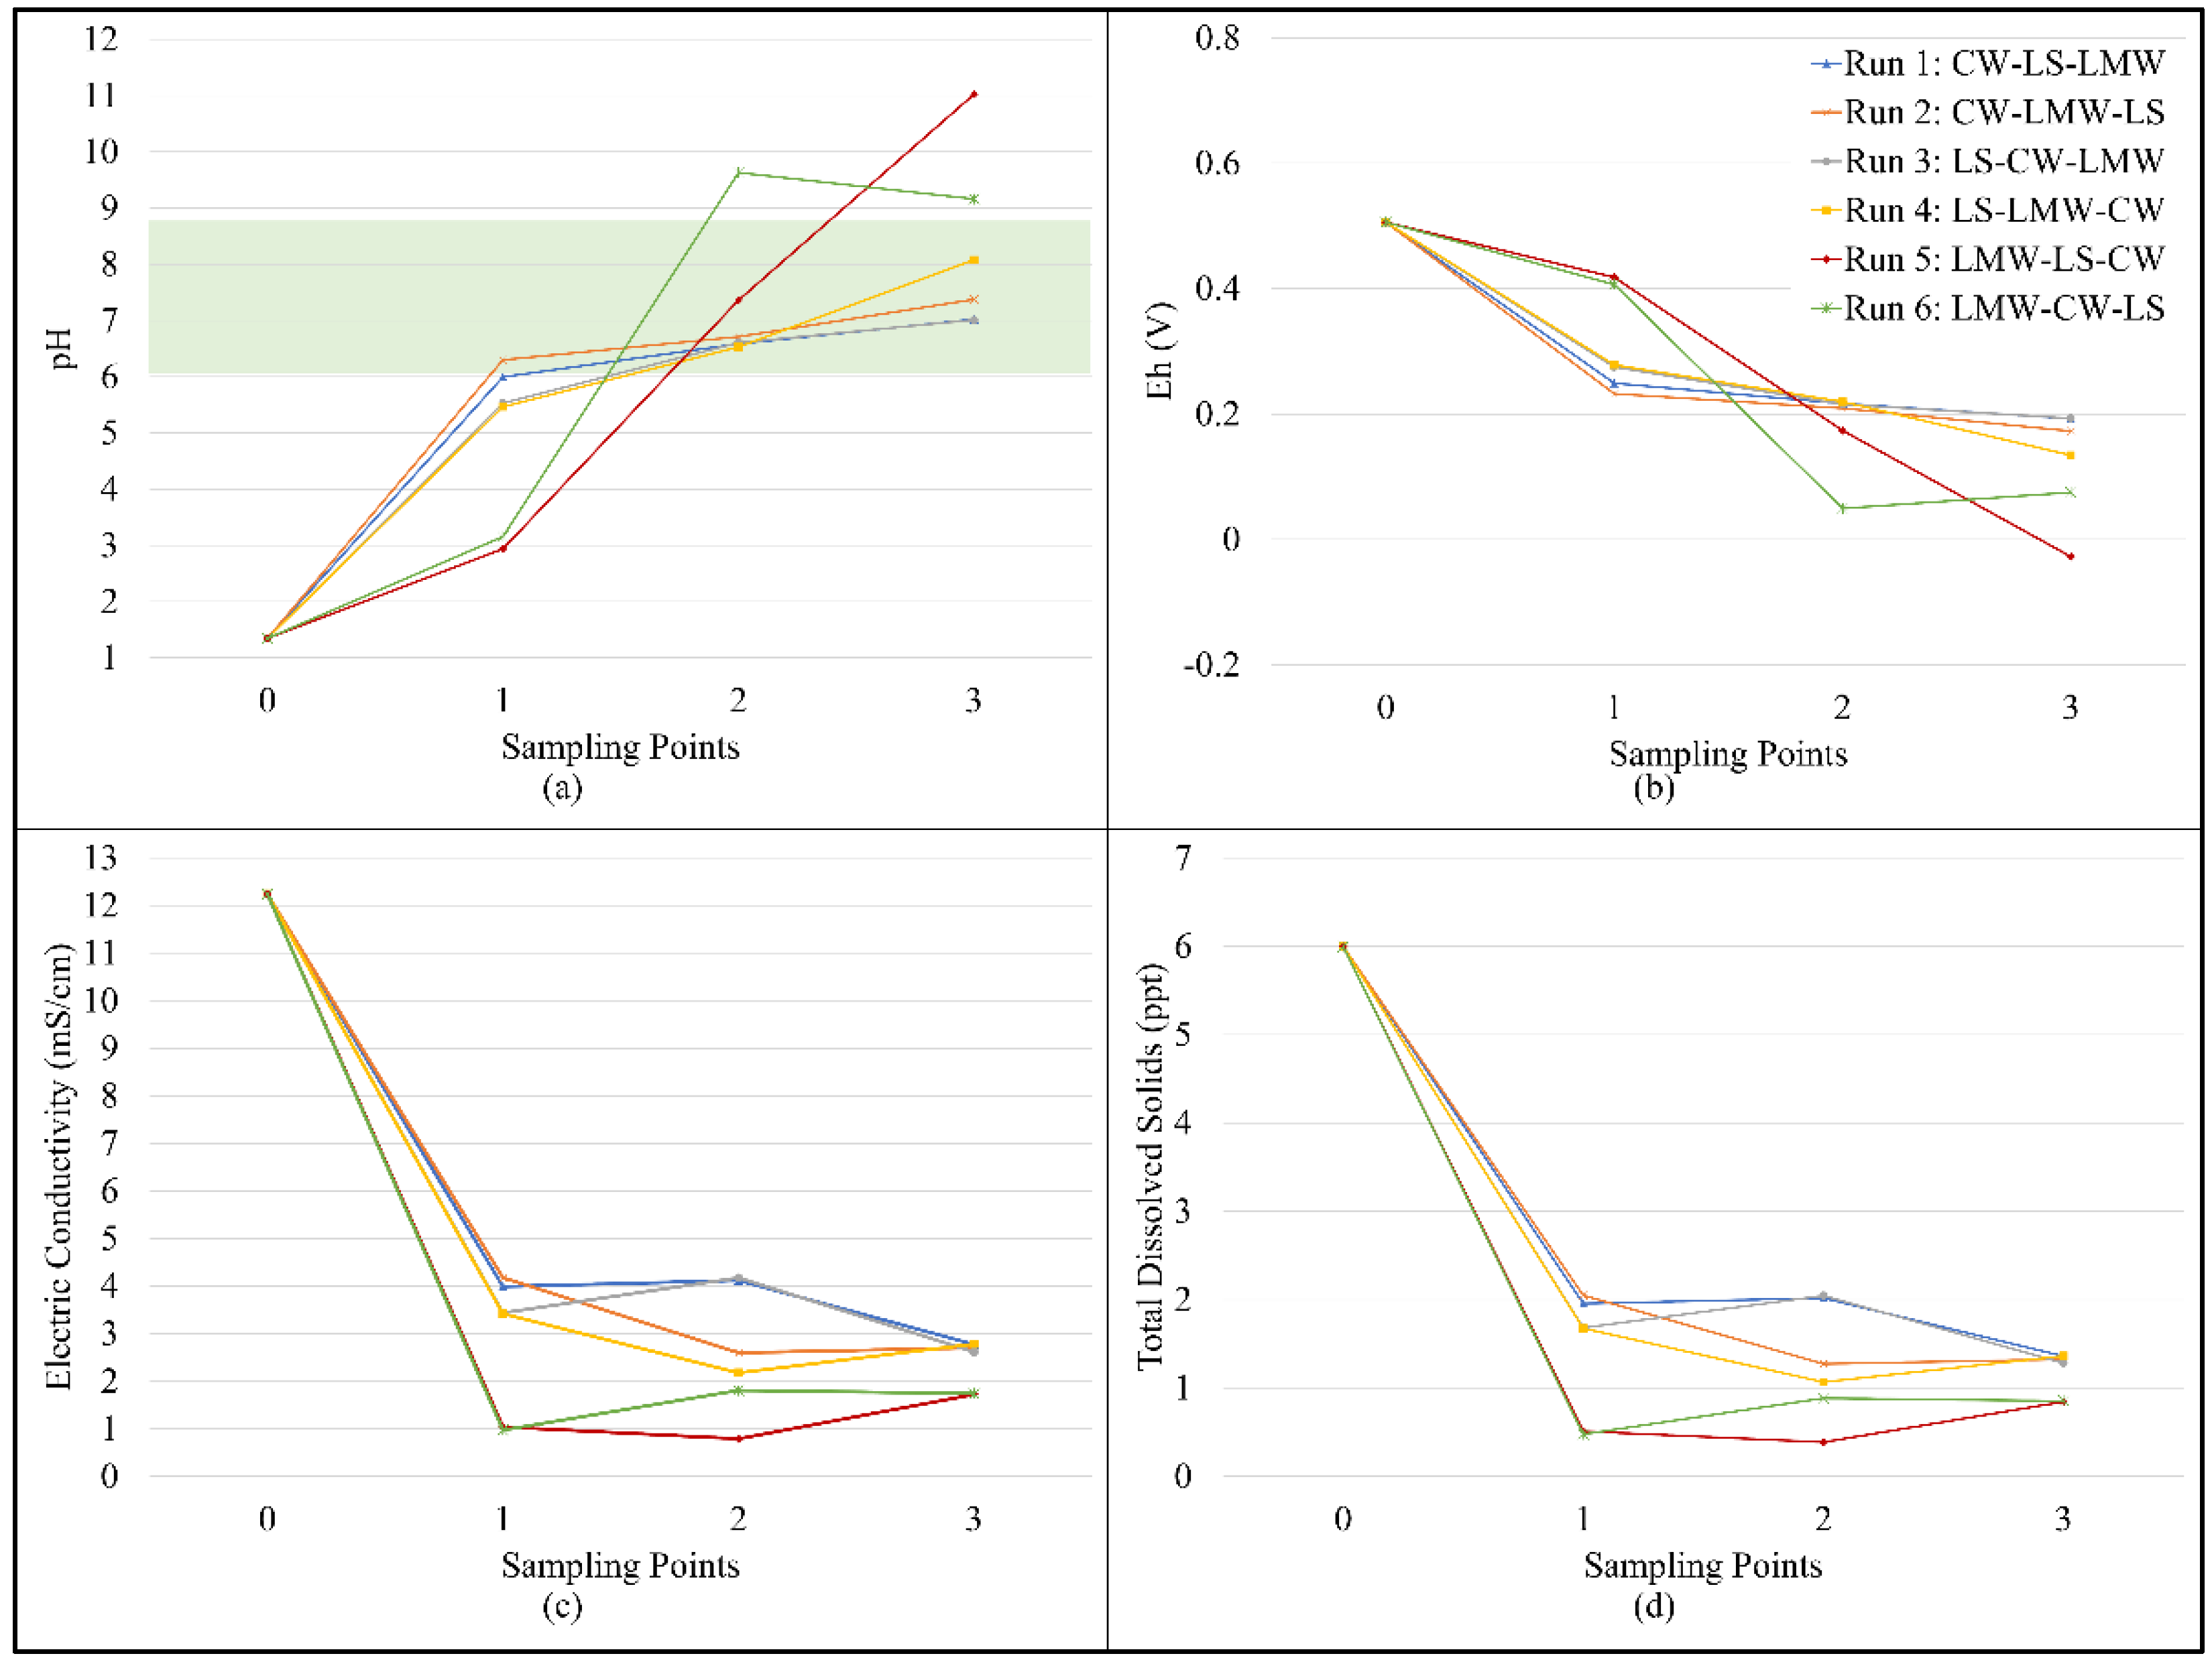
The pH values throughout the sampling points for six runs were measured and graphed, as seen in Figure 4a. With the initial pH value of raw synthetic AMD being 1.35, the highest recorded pH value of treated AMD was 11.03 at Run 5, having the media order of LMW, limestone, and concrete waste. Moreover, it could be observed that Runs 1, 2, 3, 4, and 5 increased throughout the process, while Run 6 increased and then decreased after the treatment of the third media. The observed inconsistency and abnormality of Run 6 as compared to the other runs may have been affected by the experimental and human error that occurred, in which the collected effluent was lacking. With regards to the effect of media in increasing the pH value, it was determined that concrete waste was observed to have the greatest increase in the pH of synthetic AMD, followed by limestone and then LMW. The observed ranking of media according to its effectiveness in increasing the pH value agrees with a past study [21]
From its initial pH, the synthetic AMD was not neutralized by the three media after the first media treatment. With CaO being the most abundant basic oxide found in the three media, it was used as a basis in predicting the effectiveness of neutralizing the pH value. It was determined that limestone, concrete waste, and LMW had 86.66%, 59.37%, and 0.08% CaO content, respectively. Given this, it was expected that limestone would be the most effective media with regards to raising the pH value. However, concrete waste increased the pH above 5.5, with Run 1 and 2 even reaching pH 6, showing better results than the PHREEQC simulation in Figure 3. The higher pH may have been due to the presence of portlandite, which is formed during the hydration process of cement [60,61]. The products of its dissolution and higher solubility relative to the calcite can contribute to the pH difference observed in the results of the experiment [62,63]. Additionally, the presence of anorthite in concrete waste may have resulted in an increased release of Ca, starting from its surface [64]
Moreover, the interesting increasing trends of Runs 5 and 6, especially the latter one, were caused by the possible formation of more precipitates in the treatment using the second media. Based on PHREEQC, the suggested precipitate of the first media (LMW) was only cuprous ferrite, due to having a low pH. After further neutralization of the second media, a lot of precipitates were possible to form, and these were observed to significantly increase the pH of the solution. Comparing the two runs, Run 6 with concrete waste as the second media showed a greater capability of neutralizing the solution with precipitates that had higher saturation indices, possibly due to less armoring in contrast with limestone.
With the three media having the ability to raise the pH values, the final pH value in every process train showed neutral and basic pH values. According to DAO 2016–08 water type class C effluent standards, the required pH value ranges from 6.5 to 9.00, and it was determined that Runs 1, 2, 3, and 4 complied with the standards, having a final pH value of 7.02, 7.375, 7.01, and 8.08, respectively. On the other hand, Runs 5 and 6 exceeded the range of standards, having a pH value of 11.025 and 9.16, respectively.
The Eh at every sampling point for the six runs of the process train were graphed, as shown in Figure 4b. The measured Eh value of the raw synthetic AMD was determined to be 0.506V, which showed an oxidizing state of the solution, which was mainly due to the presence of sulfuric acid that lowered the pH of solution. In a past study in which the Eh values were measured for abandoned and active mining areas, the values were determined to be around 0.697–0.790 V [65]. However, the Eh value measured from the past study [21] was 0.46V and around 0.484–0.488 V from another past study [42].
As can be seen in Figure 4b, the acid mine drainage that passed through the first media (sampling point 2) showed a decrease from the initial value. This indicates that the limestone, concrete waste, and LMW had a significant effect with respect to reducing of the Eh value. Furthermore, the observed inverse relationship between Eh and pH value increases is consistent with the equation presented by Favre et al. and the results of other studies [66,67]. To further analyze the media, it could be observed that runs 1 and 2, which had concrete waste as the first media, showed a more significant drop in the Eh value as compared to runs 5 and 6, which had LMW as the first media. With this, it can be concluded that concrete waste is more effective than limestone, while limestone is more effective than LMW. The observed order of media effectiveness agrees with the past study [21]. The highest measured Eh of the treated AMD was found to be 0.418 V, which could be seen at Run 5 sampling point 2 right after the LMW, while the lowest measured Eh was found to be −0.027 mV at Run 5 sampling point 4 right after the concrete waste.
The electric conductivity is directly proportional to the number of ions present in a solution [65]. With this, the conductivity of a synthetic acid mine drainage can indicate the number of dissolved substances, minerals, and chemicals present in water. It can be observed in Figure 4c that the electric conductivities of all runs were significantly reduced by the first media of each process train. This may also have ben due to the possible precipitates as supported by PHREEQC. The results of the experiment agree with the past study [21], where the conductivities of the AMD treated with LMW were found to be lowest at an AMD/media ratio of 0.75 mL/g. In addition to this, LMW is also said to absorb metals, Ni, Cu, Mn, Al, and sulfates better than limestone, as goethite has a high specific surface area with a good surface activity, as it often has a poor crystalline structure and is rich in impurities [55]. Since Run 5, which had LMW, limestone, and concrete waste as the first, second, and third media, respectively, had the lowest conductivity among all 6 runs, it can be concluded that this was the best process train with regards to conductivity. In addition to this, it can also be concluded that a process train was indeed effective, as the conductivity of this paper was lower than the past study which yielded 2 mS/cm for LMW alone [21].
Meanwhile, the trend of the total dissolved solids of the process trains at each sampling point is shown in Figure 4d. AMD is typically characterized by high total dissolved solids as well as high heavy metals and sulfates concentrations. Based on the initial characteristics of the synthetic AMD in this experiment, the amount of TDS was determined to be very high (5998 ppm) as compared to other studies [21,43]. Based on the graph, each of the first media of all the process trains were able to significantly decrease the initial TDS level of the synthetic AMD. This shows that all media could reduce the TDS level effectively.

4.5. Effect of Alkalinity-Generating Agent to Heavy Metals and Sulfates Removal

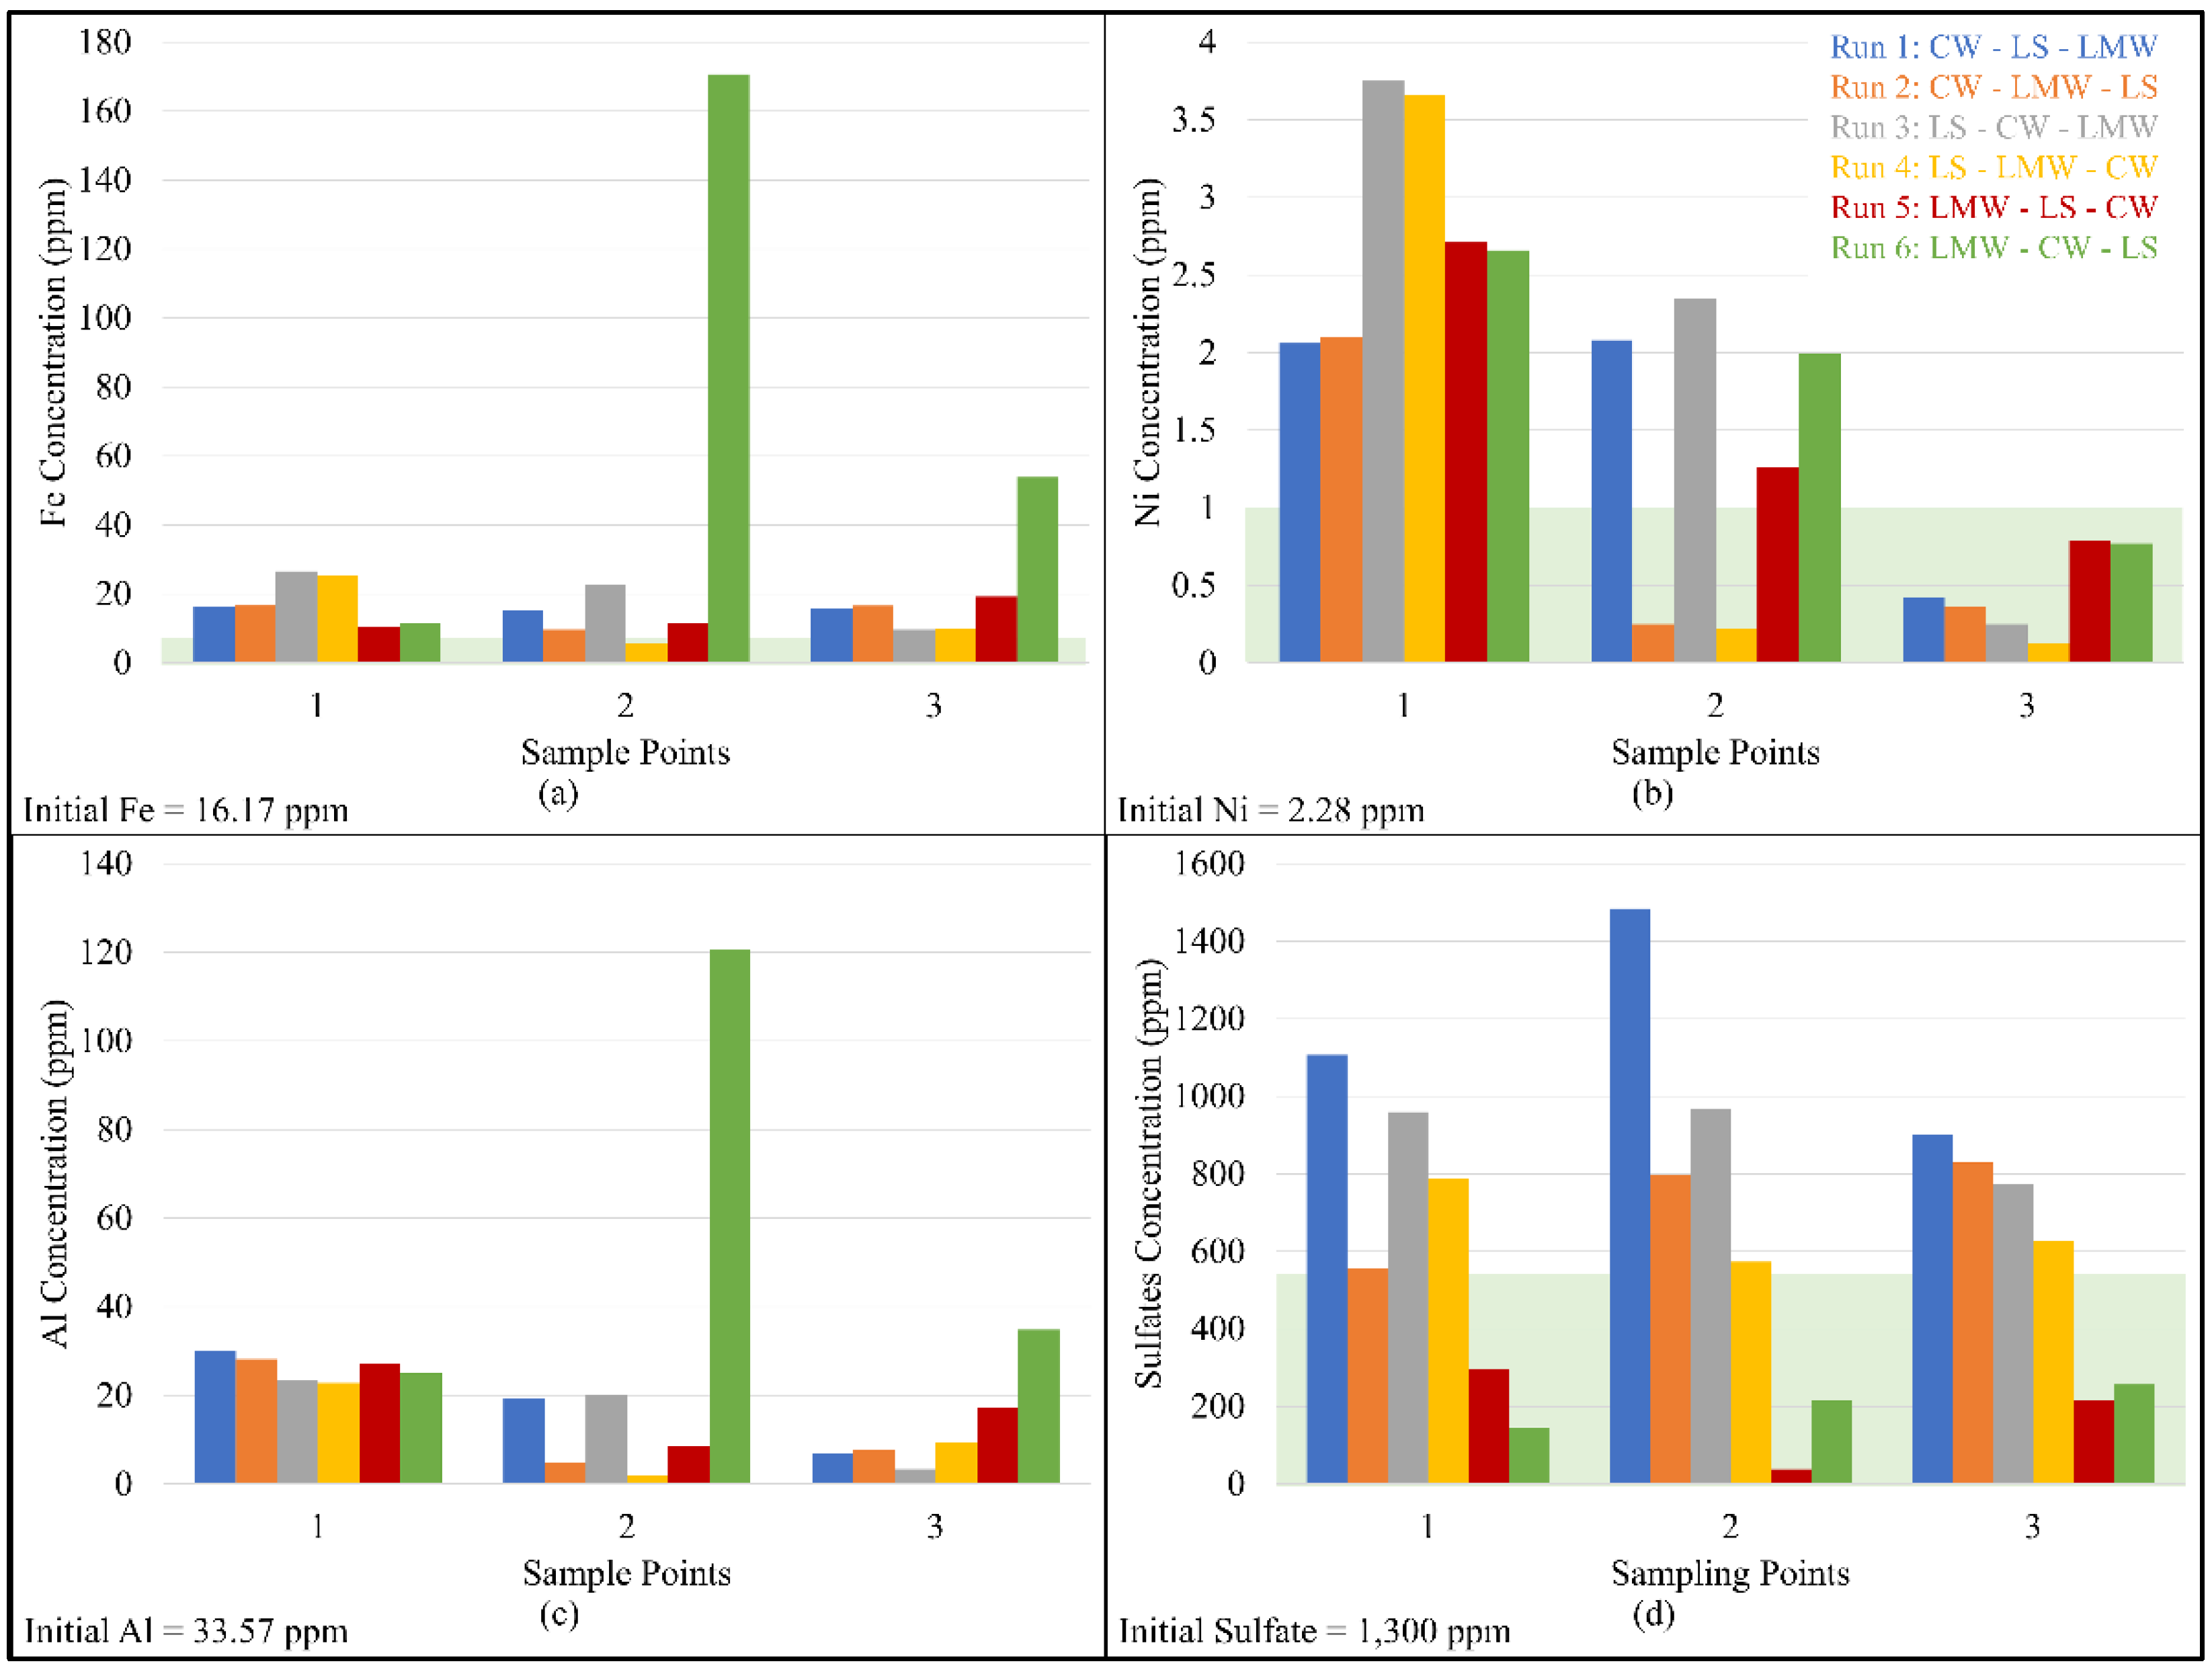
The change in the concentration of Fe in terms of ppm throughout the sampling points of the six runs is shown in Figure 5a. With an initial concentration of Fe measured to be 16.17 mg/L or ppm, the concentration of Fe in the treated AMD was also measured. Upon analyzing the data obtained, the lowest concentration was found to be at 5.54 ppm, which was around 65.74% Fe removal. However, this concentration was recorded from Run 4 at sampling point 3, which had passed through limestone and LMW, which did not account for the effect of the entire process train. As seen in Figure 5a, there was no observable trend present in the graph aside from Run 3, wherein the concentration decreased linearly.
To analyze the performance of the process train, the highest and lowest final concentration of Fe were identified. The highest final concentration measured was 53.88 ppm, which accounted for −233.21% removal in the sixth run, having the media order of LMW, concrete waste, and limestone. In this run, the Fe concentration had a drastic increase after being in contact with LMW and concrete waste. On the other hand, the lowest final concentration was determined to be 9.67 ppm, which was equivalent to around 40.20% Fe removal. The lowest final concentration occurred at Run 3, having a media order of limestone, concrete waste, and LMW. The decrease in concentration occurred specifically after the synthetic AMD passed through concrete waste and LMW.
It can be observed from the data that the LMW had the most effective Fe removal among all the media, followed by concrete waste and then limestone. From the past study, it was also concluded that cement waste was the most effective in terms of Fe, followed by LMW and then limestone [21]. The ability of LMW to achieve the highest removal percentage in this study was due to the adsorption process aided by the goethite content of LMW. On the other hand, the rather inefficient removal of Fe using the media limestone could have been due to its low solubility property, as it sometimes forms an external coating, commonly known as armor, when exposed [29].
According to DAO class C effluent standards, the required Fe concentration would be 7.5 mg/L or ppm. With this, it can be concluded that none of the process trains reached the standard. However, it can be noted that Runs 3 and 4 had a concentration value closest to the standard.
The trends of each process train with regards to the Ni concentrations per sampling point are seen in Figure 5b. The Ni concentration of the synthetic solution was 2.28 ppm. From the figure, it can be observed that the Ni concentration at some sampling points increased in contrast to the idea of decreasing all the way. This may be explained by the metals present in the media itself. Specifically, in the second sampling point, Runs 3, 4, 5, and 6 had an increase in the Ni concentration to around a range of 3.66–3.75 and 2.66–2.71 for Runs 3 and 4 and Runs 5 and 6, respectively, as shown in Table 7. Based on the XRF of the media, the Ni component of the limestone and LMW were seen to have a higher concentration than that of the concrete waste, thus suggesting that the Ni concentration of the media may have contributed to the increasing trend. Another factor which may also have contributed to the increasing trend was the residence time. From a past study, the % Ni removal decreases with increasing time [42]. It was seen that the highest removal was at the first minute, while it decreased with time which peaked at around 10–15 min.
The highest %removal of the Ni concentration for limestone accounted for 61.31%, which was at Run 6 at 0.77 ppm. Meanwhile, the highest %removal of the Ni concentration for LMW accounted for a 93.99% removal, which was at Run 4 at 0.22 ppm. On the other hand, for concrete waste, the highest Ni concentration %removal accounted for 40.91% at Run 4 with 0.13 ppm. However, it must be noted that the %removal of each media at the different sampling points did not have a clear trend. For example, limestone at different sampling points may have a negative %removal, which may have been due to the existing metal concentration in the media. In general, concrete waste has shown the greatest efficiency in terms of lowering Ni concentrations in all sampling points as compared to limestone and LMW, which rather increased the metal concentration at some sampling points.
In addition, LMW was seen to have better removal efficiency than limestone. This shows consistency with a past study [21]. However, in terms of the highest %removal efficiency achieved, LMW showed the greatest across all process trains. except Runs 5 and 6 where the pH was low. The optimum pH for the relative solubility of Ni as a metal hydroxide was at pH 10. Based on the data, the %Ni removal of LMW increased with an increasing pH, ranging from 6.5–7.0 [65], which may suggest why it had a greater efficiency in %Ni removal as compared to having a lower pH at around 4.0 from a past study [21]. Moreover, it was evident that LMW showed the greatest efficiency for Ni removal due to its poor crystalline structures and large surface areas available for activities; thus, it has a greater capability to adsorb Ni and other heavy metals. Nonetheless, all three media showed that they were capable of removing Ni concentrations.
Meanwhile, for the analysis of the Ni concentration in each process train, the lowest detected final Ni concentration was Run 4 at 0.13 ppm, which accounted for 94.30% removal. This was then followed by Runs 3, 2, 1, 6, and 5, which accounted for 89.04% (0.25 ppm), 84.21% (0.36 ppm), 81.58% (0.42 ppm), 66.23% (0.77 ppm), and 65.35% (0.79 ppm), respectively, as presented in Table 7. Run 4 (Limestone–LMW–Concrete waste) showed the greatest %Ni removal, which may be attributed to the highest %Ni removal achieved by LMW and concrete waste in the process out of all six configurations. Additionally, LMW should be placed in the middle order so that the next media would be able to remove more %Ni, as it contains the highest Ni concentration among the three media. Concrete waste should then be placed after LMW, since it has a greater capability to remove Ni as compared to limestone.
On the other hand, Run 5 (LMW–Limestone–Concrete waste) had the lowest %Ni removal, which may be attributed to the negative %removal achieved by the LMW. According to DAO 2016–08 water type class C effluent standards, the required Ni concentration is 1.0 mg/L or ppm. With this, it can be concluded that all the process trains were able to comply with the DAO2016–08 standard. This shows that utilizing a process train of media to treat AMD is more effective than utilizing a single media with regards to Ni removal, despite having Ni concentrations in the media itself.
The comparison of the Al concentrations at each sampling point is presented in Figure 5c. The initial Al concentration of the synthetic AMD was 33.57 ppm. Although the treatment aimed to lower the Al concentration to reduce the risks it could impose on the environment, there were no available data on this in the DAO 2016–08. This means that the Philippines does not have a guideline yet on safe levels of Al; however, some studies indicate that the lower the water’s pH, the higher the levels of Al [31]. According to the United States Environmental Protection Agency [68], the recommended Al concentration of freshwater for 1 h is 0.001–4.8 ppm and for 4 days is 0.0063–3.2 ppm. Since there is no Philippine standard, the Al concentration will not be included in determining the best process train.
Like the previously discussed metals, the percent removal of the heavy metals may increase from the previous sampling point due to the presence of Al in the media and the ability of the media to remove Al. According to the discussed chemistry of the media, LMW contained the highest Al composition of 33.74%, followed by limestone, which contained 9.74% Al, and concrete waste, which contained 4.57% Al. Despite the high Al composition in LMW, this media is said to perform best with regards to Al removal [59].
In general, the Al concentrations of all runs were lowered (Table 7) as compared to the initial concentration. Run 3 had the highest Al removal of 89.99%. followed by Run 1 (79.83%), Run 2 (77.30%), Run 4 (71.76%), Run 5 (48.50%), and Run 6 (−3.84%). Looking at Figure 5c and the negative percent removal, it is possible that there were impurities present in the synthetic AMD at Run 6. especially at sampling point 3. where a sudden increase was observed. It may be possible that the Al present in both the AMD and media were not easily removed by the second media of Run 6, concrete waste, since it was the least efficient media in terms of Al removal. The results obtained in the Al removal also agree with the results of the previously reported pH levels, as an optimum pH level suggests a lower Al concentration.
The change in the concentration of sulfates in terms of ppm with respect to each sampling point of the six runs are shown in Figure 5d. Having an initial concentration of 1300 ppm, the concentration of sulfates in the treated AMD at all sampling points were also measured. The lowest measured sulfates concentration was determined to be 38.24 ppm, which accounted for 97.06% removal. However, this measured concentration was obtained from sampling point 3 of Run 5, wherein the treated media had passed through LMW and limestones. Therefore, it does not account for the overall performance of the process train. As seen in the figure, there was no observable trend in the change of the concentration of sulfates aside from Runs 2 and 6, in which the concentration of sulfates increased throughout the sampling points.
To assess the performance of the six different process trains, the final sulfates concentration of the runs was analyzed. The highest final concentration determined was 900 ppm, which accounted for 30.77% removal, determined in the first run having the media order of concrete waste, limestone, and LMW. In this run, the sulfates concentration had an increase after being in contact with concrete waste and limestone. On the other hand, the lowest final concentration measured was 15.95 ppm. which accounted for 83.39% removal, and it was determined to be the fifth run, having the media order of LMW, limestone, and concrete waste.
It can be observed from the data that the LMW had the most effective sulfates removal among all the media, followed by concrete waste and then limestone. A study has utilized sulfates for generating adsorption models, as sulfates have one surface complex that is dominant; in that study, goethite was used, as it has been efficient in the adsorption of sulfates [69]. From the past study, it was also concluded that LMW was determined to be the most effective media in terms of the removal of sulfates, followed by concrete waste and then limestone at an AMD-to-media ratio on 0.75 mL/g [21]. However, with LMW being dependent on the adsorption mechanism for sulfate removal, the observed treatment efficiency may not hold true when the media is used for the continuous flow treatment of AMD. This is where the sequential design of the process train, allowing the replacement of each material individually, becomes beneficial.
According to DAO class C effluent standards, the required sulfates concentration would be 550 mg/L or ppm. With this, it can be concluded that Run 5 and 6 complied with the standards, with both having a final concentration of 215.95 ppm and 256.61 ppm, respectively. Both Runs 5 and 6 had LMW as their first media.

4.6. Ranking Method of Analysis

As can be seen from Table 8, each process train had at least two parameters that did not pass the standard. With that, the closeness of each parameter of all the runs were evaluated based on the DAO standards to determine the best process train. The initial pH value of the synthetic AMD was 1.35, while the standard value was at 6.5–9.0. The normalized values for the pH concentration for each process train are shown in Table 9. From the calculated values, all process trains, except Runs 5 and 6, were beyond 1, which means that they had reached the required DAO standard. Run 4 (Limestone–LMW–Concrete Waste) was seen to have the highest normalized value closest to 1, which indicated that it was the process train closest to the average value of the standard range. This was then followed closely by Run 2 (Concrete Waste–LMW–limestone), while the farthest was Run 5 (LMW–Limestone–Concrete Waste).
The normalized values for the Fe concentration for each process train were calculated and shown in Table 9. The initial Fe value of the synthetic AMD was 16.17 ppm. while the DAO standard value is 7.50 ppm. From the calculated values, all Runs were below 1, which means that none of them reached the required standard. Negative values were observed, which indicates that the recorded Fe concentration at some sampling points increased rather than decreased. Run 3 (Limestone–Concrete Waste–LMW) was seen to have a normalized value closest to 1, which indicates that it was closest to the standard value. This was then followed closely by Run 4 (Limestone–LMW–Concrete Waste), while the farthest is Run 6.
In addition to this, the normalized values for the Ni concentration for each process train were also calculated and are shown in Table 9. The initial Ni value of the synthetic AMD was 2.28 ppm, while the standard value was at 1.0 ppm. It can be observed that all Runs surpassed 1, which means that all of them reached the required standard. Run 4 (Limestone–LMW–Concrete Waste) showed the highest normalized value, which indicates that the concentration was the lowest and by far the most ideal one, while Run 5 (LMW–Limestone–Concrete Waste) was the highest among the six process trains but still complying with the standard.
Lastly, the normalized values for the sulfates concentration for each process train were calculated and are summarized in Table 9. The initial sulfates concentration of the synthetic AMD was 1300 ppm. while the standard value is 550 ppm. It can be observed that only Run 5 (LMW–Limestone–Concrete Waste) and 6 (LMW–Concrete Waste–Limestone) surpassed 1, which means that they were the only ones who reached the required DAO2016–08 standard. Run 5 showed the highest normalized value, which indicates that the concentration was the lowest and most ideal among all the process trains, while Run 1 (Concrete Waste–Limestone–LMW) was the farthest from the standard.
Based on Table 9, the highest overall normalized value was 4.62, which was Run 4. This was then followed by Runs 3 (4.14), 2 (3.25), 1 (3.12), 5 (3.04), and then 6 (−1.68). Although the overall normalized values were somewhat close to each other, Run 4 was seen as the best process train among the six configurations. This is principally due to having more parameters that complied or at least were close to the effluent standards indicated in the DAO 2016–08.
In run 4, which included limestone, LMW, and concrete waste as the first, second, and third media, respectively, it could be observed that the order of the media is also an important factor to consider for the treatment of AMD. Specifically, in Run 4, the limestone, which was the first media, mainly neutralized the synthetic solution, since it exhibited limitations in %metal removal, possibly due to the armoring. LMW, which was the second media, continued to neutralize the solution and remove most of the metal concentrations. It was observed that LMW had the highest %metal removal in terms of Fe, Ni, and sulfates due to the mineral goethite present in the media, which has good surface activities and removes metals through adsorption. Concrete waste was the third media, which further neutralized and removed heavy metals and sulfates concentrations efficiently. Since LMW may contain more metal concentrations, the concrete waste would be the one to efficiently remove it.
Meanwhile, Run 6 could be observed as the worst process train among all configurations. LMW, the first media in the process train, was not able to neutralize the pH efficiently, as it was the least-capable neutralizing agent among the three media. Although LMW is supposed to remove most metal concentrations, the relative solubility of the metals requires an optimum pH which is higher than the pH attained in this sampling point. This then indicates that LMW was not able to remove the metal concentrations effectively. Concrete waste and limestone, as the second and third media, respectively, were able to continuously neutralize the solution and remove heavy metals; however, the Fe concentration peaked the highest at these two sampling points, and they were not able to comply with the standard. There is a possibility that the sample collected after the second media may have contained a lot of LMW, because in the experimental run during the collection of the second reactor, the treated solution was somewhat stuck, and the solution that flows up contained fine particles of LMW, which may suggest why the Fe concentration peaked.

5. Conclusions

The aim of this paper was to determine the best process train by utilizing three locally available media, specifically laterite mine waste (LMW), concrete waste, and limestone, to treat synthetic AMD. Six full-factorial process trains were chosen for the experiment. Through XRF and XRD, limestone was found to be mostly composed of calcite, while concrete waste contained anorthite along with calcite. LMW, on the other hand, was mainly composed of goethite along with alumina. These minerals helped understand the potential of the media for the neutralization and alkalinization of AMD.
After comparing all the measurements at the end of each run to the type C effluent standards indicated in the DAO 2016–08 and 2021–19, it can be said that a process train is a more effective way of treating AMDs as compared to single media. In this study, more parameters, as compared to the past studies [21,42], passed or were at least close to the standards. However, since there were still some standards that still had to be met, it is still recommended to conduct further studies, such as utilizing other media in the process train or utilizing only around two media in the process train. If this study, in which the same media that were used were to be improved as well, it would be recommended to conduct the experiments for multiple trials to minimize random errors. Despite Run 6 being deemed to be the worst process train, it is possible that the sample contained media, hence the reason why it had abnormal concentrations of some of the heavy metals. Although the 15-min retention time was already recommended by previous studies, it can still influence the process train. Another study with a 10-min retention time can also be done to possibly make all parameters pass the DAO standards. Future studies may evaluate the capacity of Run 4, the process train with the highest treatment efficiency, to determine how much AMD may be treated before any of the treatment materials reach their breakthrough point.

Supplementary Materials

The following are available online at https://www.mdpi.com/article/10.3390/w14071070/s1, Table S1: Potential Precipitates at Each Sampling Point (Top 5).

Author Contributions

Conceptualization, A.H.O. and C.O.A.T.; methodology, A.H.O., C.B.T. and C.O.A.T.; validation, C.O.A.T., A.H.O. and R.D.A.; writing-original draft preparation, K.S.C., A.L.S. and G.S.L.T.; writing-review and editing, C.O.A.T., C.B.T., R.D.A. and A.H.O.; visualization, K.S.C., A.L.S. and G.S.L.T.; supervision, C.O.A.T., C.B.T. and A.H.O.; Software, C.O.A.T. and C.B.T.; project administration, A.H.O.; funding acquisition, A.H.O. All authors have read and agreed to the published version of the manuscript.

Funding

This research was funded by the National Research Council of the Philippines (NRCP), Project No. G-71 and the De La Salle University Manila—University Research Coordination Office (URCO), Project No. 50F S 3TAY19-3TAY20.

Institutional Review Board Statement

Not Applicable.

Informed Consent Statement

Not Applicable.

Data Availability Statement

The data supporting the findings of this study are available within the article and its Supplementary Materials.

Acknowledgments

The researchers would like to acknowledge Agata Mining Ventures Inc. (AMVI, Agusan Del Norte, Philippines) for their support through the provision of raw materials or media used in this research.

Conflicts of Interest

The authors declare no conflict of interest.

References

  1. EY. Mining in Rapid-Growth Economies. 2013. Available online: https://www.ey.com/Publication/vwLUAssets/EY_-_Mining_in_rapid-growth_economies/$FILE/EY-Mining-in-rapid-growth-economies.pdf (accessed on 5 February 2022).
  2. Committee on Technologies for the Mining Industries. In Evolutionary and Revolutionary Technologies for Mining; National Academy Press: Washington, DC, USA, 2002.
  3. Samal, D.K.; Sukla, L.B.; Pattanaik, A.; Pradhan, D. Role of microalgae in treatment of acid mine drainage and recovery of valuable metals. Mater. Today Proc. 2020, 30, 346–350. [Google Scholar] [CrossRef]
  4. Park, I.; Tabelin, C.B.; Jeon, S.; Li, X.; Seno, K.; Ito, M.; Hiroyoshi, N. A review of recent strategies for acid mine drainage prevention and mine tailings recycling. Chemosphere 2019, 219, 588–606. [Google Scholar] [CrossRef] [PubMed]
  5. Kefeni, K.K.; Mamba, B.B. Evaluation of charcoal ash nanoparticles pollutant removal capacity from acid mine drainage rich in iron and sulfate. J. Clean. Prod. 2019, 251, 119720. [Google Scholar] [CrossRef]
  6. Tabelin, C.B.; Park, I.; Phengsaart, T.; Jeon, S.; Villacorte-Tabelin, M.; Alonzo, D.; Yoo, K.; Ito, M.; Hiroyoshi, N. Cop-per and critical metals production from porphyry ores and E-wastes: A review of resources availability, processing/recycling challenges, socio-environmental aspects, and sustainability issues. Resour. Conserv. Recycl. 2021, 170, 105610. [Google Scholar] [CrossRef]
  7. Tabelin, C.B.; Dallas, J.; Casanova, S.; Pelech, T.; Bournival, G.; Saydam, S.; Canbulat, I. Towards a low-carbon society: A review of lithium resource availability, challenges and innovations in mining, extraction and recycling, and future perspectives. Miner. Eng. 2021, 163, 106743. [Google Scholar] [CrossRef]
  8. Quintans, J.D. Mining Industry in the Philippines. The Manila Times. 2017. Available online: https://www.manilatimes.net/2017/09/04/supplements/mining-industry-philippines/348610/ (accessed on 5 February 2022).
  9. Crost, B.; Felter, J.H. Extractive resource policy and civil conflict: Evidence from mining reform in the Philippines. J. Dev. Econ. 2020, 144, 102443. [Google Scholar] [CrossRef]
  10. Chavez, L. Fast Facts: Mining in the Philippines. 2012. Available online: https://www.rappler.com/business/special-report/whymining/whymining-latest-stories/11983-fast-facts-mining-philippines (accessed on 5 February 2022).
  11. Akcil, A.; Koldas, S. Acid Mine Drainage (AMD): Causes, treatment and case studies. J. Clean. Prod. 2006, 14, 1139–1145. [Google Scholar] [CrossRef]
  12. Tabelin, C.B.; Igarashi, T.; Villacorte-Tabelin, M.; Park, I.; Opiso, E.M.; Ito, M.; Hiroyoshi, N. Arsenic, selenium, boron, lead, cadmium, copper, and zinc in naturally contaminated rocks: A review of their sources, modes of enrichment, mechanisms of release, and mitigation strategies. Sci. Total Environ. 2018, 645, 1522–1553. [Google Scholar] [CrossRef]
  13. Rutchik, J.S.; Zheng, W.; Jiang, Y.M.; Mo, X.E. How does an occupational neurologist assess welders and steelworkers for a manganese-induced movement disorder? An international team’s experiences in Guangxi, China, part II. J. Occup. Environ. Med. 2012, 54, 1562–1564. [Google Scholar]
  14. Rezaie, B.; Anderson, A. Sustainable Resolutions for Environmental Threat of the Acid Mine Drainage. 2020. Available online: https://www.sciencedirect.com/science/article/pii/S004896972030721X?via%3Dihub (accessed on 5 February 2022).
  15. Tomiyama, S.; Igarashi, T.; Tabelin, C.B.; Tangviroon, P.; Ii, H. Acid mine drainage sources and hydrogeochemistry at the Yatani mine, Yamagata, Japan: A geochemical and isotopic study. J. Contam. Hydrol. 2019, 225, 103502. [Google Scholar] [CrossRef]
  16. Tomiyama, S.; Igarashi, T.; Tabelin, C.B.; Tangviroon, P.; Ii, H. Modeling of the groundwater flow system in exca-vated areas of an abandoned mine. J. Contam. Hydrol. 2020, 230, 103617. [Google Scholar] [CrossRef]
  17. Aikawa, K.; Ito, M.; Segawa, T.; Jeon, S.; Park, I.; Tabelin, C.B.; Hiroyoshi, N. Depression of lead-activated sphalerite by pyrite via galvanic interactions: Implications to the selective flotation of complex sulfide ores. Miner. Eng. 2020, 152, 106367. [Google Scholar] [CrossRef]
  18. Hornn, V.; Park, I.; Ito, M.; Shimada, H.; Suto, T.; Tabelin, C.B.; Jeon, S.; Hiroyoshi, N. Agglomeration-flotation of finely ground chalcopyrite using surfactant-stabilized oil emulsions: Effects of co-existing minerals and ions. Miner. Eng. 2021, 171, 107076. [Google Scholar] [CrossRef]
  19. Park, I.; Tabelin, C.B.; Seno, K.; Jeon, S.; Inano, H.; Ito, M.; Hiroyoshi, N. Carrier-microencapsulation of arsenopy-rite using Al-catecholate complex: Nature of oxidation products, effects on anodic and cathodic reactions, and coating stabil-ity under simulated weathering conditions. Heliyon 2020, 6, e03189. [Google Scholar] [CrossRef] [Green Version]
  20. Tabelin, C.B.; Silwamba, M.; Paglinawan, F.C.; Mondejar, A.J.S.; Duc, H.G.; Resabal, V.J.; Opiso, E.M.; Igarashi, T.; Tomiyama, S.; Ito, M.; et al. Solid-phase partitioning and release-retention mechanisms of copper, lead, zinc and arsenic in soils impacted by artisanal and small-scale gold mining (ASGM) activities. Chemosphere 2020, 260, 127574. [Google Scholar] [CrossRef]
  21. Turingan, C.; Singson, G.; Melchor, B.; Alorro, R.; Beltran, A.; Orbecido, A. A comparison of the acid mine drainage (AMD) neutralization potential of low grade nickel laterite and other alkaline-generating materials. IOP Conf. Ser. Mater. Sci. Eng. 2020, 778, 012142. [Google Scholar] [CrossRef]
  22. Tabelin, C.B.; Veerawattananun, S.; Ito, M.; Hiroyoshi, N.; Igarashi, T. Pyrite oxidation in the presence of hematite and alumina: I. Batch leaching experiments and kinetic modeling calculations. Sci. Total Environ. 2017, 580, 687–698. [Google Scholar] [CrossRef]
  23. Simate, G.S.; Ndlovu, S. Acid mine drainage: Challenges and opportunities. J. Environ. Chem. Eng. 2014, 2, 1785–1803. [Google Scholar] [CrossRef]
  24. Aggarwal, C. A Report on Studies on Acid Mine Drainage Generation and Its Effect on Mining Equipment. 2017. Available online: http://www.researchgate.net/publication/320015185_A_Report_on_Studies_on_Acid_Mine_Drainage_Generation_and_its_effevt_on_Mining_Equipment (accessed on 5 February 2022).
  25. Igarashi, T.; Herrera, P.S.; Uchiyama, H.; Miyamae, H.; Iyatomi, N.; Hashimoto, K.; Tabelin, C.B. The two-step neutralization ferrite-formation process for sustainable acid mine drainage treatment: Removal of copper, zinc and arsenic, and the influence of coexisting ions on ferritization. Sci. Total Environ. 2020, 715, 136877. [Google Scholar] [CrossRef]
  26. Trumm, D. Selection of active and passive treatment systems for AMD—Flow charts for New Zealand conditions. N. Z. J. Geol. Geophys. 2010, 53, 195–210. [Google Scholar] [CrossRef]
  27. Tabelin, C.; Sasaki, A.; Igarashi, T.; Tomiyama, S.; Villacorte-Tabelin, M.; Ito, M.; Hiroyoshi, N. Prediction of acid mine drainage formation and zinc migration in the tailings dam of a closed mine, and possible countermeasures. MATEC Web Conf. 2019, 268, 06003. [Google Scholar] [CrossRef]
  28. Davis, R.A.; Welty, A.T.; Borrego, J.; Morales, J.A.; Pendon, J.G.; Ryan, J.G. Rio Tinto estuary (Spain): 5000 years of pollution. Environ. Geol. 2000, 39, 1107–1116. [Google Scholar] [CrossRef]
  29. Skousen, J.G.; Sextone, A.; Ziemkiewicz, P. Acid Mine Drainage Control and Treatment. 2000. Available online: https://www.researchgate.net/publication/253085017 (accessed on 6 February 2022).
  30. Zipper, C.; Skousen, J.; Jage, C. Passive Treatment of Acid-Mine Drainage. 2011. Available online: https://vtechworks.lib.vt.edu/bitstream/handle/10919/56136/460-133.pdf?sequence=1 (accessed on 16 March 2022).
  31. Taylor, J.; Pape, S.; Murphy, N. Summary of Passive and Active Treatment Technologies for Acid and Metalliferous Drainage (AMD). 2005. Available online: https://www.earthsystems.com.au/wp-content/uploads/2012/02/AMD_Treatment_Technologies_06.pdf (accessed on 8 February 2022).
  32. Ford, K. Passive Treatment Systems for Acid Mine Drainage. 2003. Available online: https://digitalcommons.unl.edu/cgi/viewcontent.cgi?article=1018&context=usblmpub (accessed on 6 February 2022).
  33. Bernier, L.R. The potential use of serpentinite in the passive treatment of acid mine drainage: Batch experiments. Environ. Earth Sci. 2005, 47, 670–684. [Google Scholar] [CrossRef]
  34. Kusin, F.M.; Aris, A.; Misbah, A.S.A. A Comparative Study of Anoxic Limestone Drain and Open Limestone Channel for Acidic Raw Water Treatment. Int. J. Eng. Technol. 2013, 13, 87–92. [Google Scholar]
  35. Kimos, A. Successive Alkalinity-Producing System (SAPS). Buildipedia. 2011. Available online: http://buildipedia.com/aec-pros/engineering-news/successive-alkalinity-producing-systems-saps#:~:text=A%20successive%20alkalinity%2Dproducing%20system,of%20organic%20material%20and%20limestone (accessed on 6 February 2022).
  36. Ordonez, A.; Loredo, J.; Pendas, F. A Successive Alkalinity Producing System (SAPS) as Operational Unit in a Hybrid Passive Treatment System for Acid Mine Drainage. In Proceedings of the International Mine Water Association 2012—IMWA Proceedings, Sevilla, Spain, 13–17 September 1999. [Google Scholar]
  37. Muhammad, S.N.; Kusin, F.M.; Zahar, M.S.M.; Halimoon, N.; Yusuf, F.M. Passive Treatment of Acid Mine Drainage Us-ing Mixed Substrates: Batch Experiments. Procedia Environ. Sci. 2015, 30, 157–161. [Google Scholar] [CrossRef] [Green Version]
  38. Hammarstrom, J.M.; Sibrell, P.L.; Belkin, H. Characterization of limestone reacted with acid-mine drainage in a pulsed limestone bed treatment system at the Friendship Hill National Historical Site, Pennsylvania, USA. Appl. Geochem. 2003, 18, 1705–1721. [Google Scholar] [CrossRef]
  39. Brahaita, L.; Pop, L.; Baciu, C.; Mihaiescu, R. The Efficiency of Limestone in Neutralizing Acid Mine Drainage—A Laboratory Study. 2017. Available online: https://www.researchgate.net/publication/312586962_THE_EFFICIENCY_OF_LIMESTONE_IN_NEUTRALIZING_ACID_MINE_DRAINAGE_-_A_LABORATORY_STUDY. (accessed on 6 February 2022).
  40. Carmignano, O.; Vieira, S.S.; Brandão, P.R.; Bertoli, A.; Lago, R. Serpentinites: Mineral Structure, Properties and Technological Applications. J. Braz. Chem. Soc. 2020, 31, 2–14. [Google Scholar] [CrossRef]
  41. Geology Science. Available online: https://geologyscience.com/minerals/goethite/#:~:text=Goethite%20is%20a%20common%20mineral.&text=It%20forms%20as%20a%20weathering,of%20an%20iron%20ore%20deposit (accessed on 5 February 2022).
  42. Turingan, C.O.A.; Fabella, D.J.A.; Sadol, K.A.N.; Beltran, A.B.; Alorro, R.D.; Orbecido, A.H. Comparing the performance of low-grade nickel ore and limestone for treatment of synthetic acid mine drainage. Asia Pac. J. Chem. Eng. 2020, 15, e2457. [Google Scholar] [CrossRef]
  43. Sephton, M.G.; Webb, J. Application of Portland cement to control acid mine drainage generation from waste rocks. Appl. Geochem. 2017, 81, 143–154. [Google Scholar] [CrossRef]
  44. Department of Environment and Natural Resources, Environmental Management Bureau. DAO No. 2016-08. Water Quality Guidelines and General Effluent Standards of 2016. Available online: https://emb.gov.ph/wp-content/uploads/2019/04/DAO-2016-08_WATER-QUALITY-GUIDELINES-AND-GENERAL-EFFLUENT-STANDARDS.pdf (accessed on 5 February 2022).
  45. Department of Environment and Natural Resources, Environmental Management Bureau. DAO No. 2021-19. Updated Water Quality Guidelines (WQG) and General Effluent Standards (GES) for Selected Parameters. Available online: https://emb.gov.ph/wp-content/uploads/2021/07/DAO-2021-19-UPDATED-WQG-AND-GES-FOR-SELECTED-PARAM.pdf (accessed on 5 February 2022).
  46. Panda, R.; Das, S.S.; Sahoo, P. An empirical method for estimating surface area of aggregates in hot mix asphalt. J. Traffic Transp. Eng. Engl. Ed. 2016, 3, 127–136. [Google Scholar] [CrossRef] [Green Version]
  47. Cravotta, C.A., III. Interactive PHREEQ-N-AMD Treat water-quality modeling tools to evaluate performance and design of treatment systems for acid mine drainage. Appl. Geochem. 2021, 126, 104845. [Google Scholar] [CrossRef]
  48. Drever, J.I.; Holland, H.D.; Turekian, K.K. Surface and Ground Water, Weathering, and Soils: Treatise of Geochemistry; Elsevier: Amsterdam, The Netherlands, 2005; Volume 5, p. 45. [Google Scholar]
  49. Parkhurst, D.L.; Appelo, C.A.J. User’s Guide to PHREEQC (Version 2). Available online: https://pubs.usgs.gov/wri/1999/4259/report.pdf (accessed on 16 March 2022).
  50. Costello, C. Acid Mine Drainage: Innovative Treatment Technologies; Environmental Protection Agency Office of Solid Waste and Emergency Response: Washington, DC, USA, 2003. [Google Scholar]
  51. Kaur, G.; Couperthwaite, S.J.; Hatton-Jones, B.W.; Millar, G.J. Alternative neutralization materials for acid mine drainage treatment. J. Water Process Eng. 2018, 22, 46–58. [Google Scholar] [CrossRef] [Green Version]
  52. Miller, A.; Wildeman, T.; Figueroa, L. Zinc and nickel removal in limestone based treatment of acid mine drainage: The rela-tive role of adsorption and co-precipitation. Appl. Geochem. 2013, 37, 57–63. [Google Scholar] [CrossRef]
  53. Olds, W.E.; Tsang, D.C.W.; Weber, P.A.; Weisener, C.G. Nickel and Zinc Removal from Acid Mine Drainage: Roles of Sludge Surface Area and Neutralising Agents. J. Min. 2013, 2013, 698031. [Google Scholar] [CrossRef]
  54. Clark, J. Acid-Base Behavior of the Oxides. 2020. Available online: https://chem.libretexts.org/Bookshelves/Inorganic_Chemistry/Supplemental_Modules_and_Websites_(Inorganic_Chemistry)/De-scrip-tive_Chemistry/Elements_Organized_by_Period/Period_3_Elements/Acid-base_Behavior_of_the_Oxides#:~:text=OH)4-,Silicon%20dioxide%20(silicon(IV)%20oxide),acidic%2C%20reacting%20with%20strong%20bases (accessed on 7 February 2022).
  55. Soler, J.M.; Boi, M.; Mogollón, J.L.; Cama, J.; Ayora, C.; Nico, P.; Tamura, N.; Kunz, M. The passivation of calcite by acid mine water. Column experiments with ferric sulfate and ferric chloride solutions at pH 2. Appl. Geochem. 2008, 23, 3579–3588. [Google Scholar] [CrossRef] [Green Version]
  56. Britannica, T. Editors of Encyclopaedia. Anorthite. Encyclopedia Britannica. 2018. Available online: https://www.britannica.com/science/anorthite (accessed on 7 February 2022).
  57. Golab, A.N.; Peterson, M.A.; Indraratna, B. Selection of potential reactive materials for a permeable reactive barrier for reme-diating acidic groundwater in acid sulphate soil terrains. Q. J. Eng. Geol. Hydrogeol. 2006, 39, 209–223. [Google Scholar] [CrossRef] [Green Version]
  58. Regmi, G.; Indraratna, B.; Nghiem, L.D.; Banasiak, L. Evaluating waste concrete for the treatment of acid sulphate soil groundwater from coastal floodplains. Desalin. Water Treat. 2011, 32, 126–132. [Google Scholar] [CrossRef] [Green Version]
  59. Liu, H.; Chen, T.; Frost, R.L. An overview of the role of goethite surfaces in the environment. Chemosphere 2013, 103, 1–11. [Google Scholar] [CrossRef] [Green Version]
  60. Shabalala, A.N.; Ekolu, S.O.; Diop, S.; Solomon, F. Pervious concrete reactive barrier for removal of heavy metals from acid mine drainage—Column study. J. Hazard. Mater. 2017, 323, 641–653. [Google Scholar] [CrossRef]
  61. Jones, S.N.; Cetin, B. Evaluation of waste materials for acid mine drainage remediation. Fuel 2017, 188, 294–309. [Google Scholar] [CrossRef]
  62. Rumble, J. CRC Handbook of Chemistry and Physics, 99th ed.; Taylor and Francis: Milton Park, Oxfordshire, UK, 2018; pp. 5–188. [Google Scholar]
  63. Benjamin, M.M. Water Chemistry; McGraw-Hill: New York City, NY, USA, 2002. [Google Scholar]
  64. Amrhein, C.; Suarez, D.L. Some factors affecting the dissolution kinetics of anorthite at 25 °C. Geochim. Cosmochim. Acta 1992, 56, 1815–1826. [Google Scholar] [CrossRef]
  65. Hatar, H.; Rahim, S.A.; Razi, W.M.; Sahrani, F.K. Heavy metals content in acid mine drainage at abandoned and active mining area. AIP Conf. Proc. 2013, 1571, 641–646. [Google Scholar] [CrossRef] [Green Version]
  66. Favre, F.; Stucki, J.W.; Boivin, P. Redox properties of structural Fe in ferruginous smectite. A discussion of the standard po-tential and its environmental implications. Clays Clay Miner. 2006, 54, 466–472. [Google Scholar] [CrossRef]
  67. Sintorini, M.M.; Widyatmoko, H.; Sinaga, E.; Aliyah, N. Effect of pH on metal mobility in the soil. In IOP Conference Series: Earth and Environmental Science, Proceedings of the 5th International Seminar on Sustainable Urben Development, Virtual Conference, Indonesia, 5–6 August 2020; IOP Publishing: Bristol, UK, 2021; Volume 737, p. 012071. [Google Scholar]
  68. World Health Organization. Total Dissolved Solids in Drinking Water. 2003. Available online: https://www.who.int/water_sanitation_health/dwq/chemicals/tds.pdf (accessed on 8 February 2022).
  69. Rietra, R.P.J.J.; Hiemstra, T.; van Riemsdijk, W.H. Sulfate Adsorption on Goethite. J. Colloid Interface Sci. 1999, 218, 511–521. [Google Scholar] [CrossRef]
Figure 1. Schematic diagram of successive process train set-up.
Water 14 01070 g001
Figure 2. XRD patterns of concrete waste, limestone, and LMW.
Water 14 01070 g002
Figure 3. pH plot of limestone and concrete waste.
Water 14 01070 g003
Figure 4. Change in (a) pH with Type C effluent standard highlighted in green [44,45], (b) Eh, (c) EC, and (d) TDS after each treatment media.
Water 14 01070 g004
Figure 5. Change in (a) Fe, (b) Ni, (c) Al, and (d) sulfates concentration with Type C effluent standards highlighted in green [44,45].
Water 14 01070 g005
Table 1. Amount of reagents used for the preparation of synthetic acid mine drainage (AMD).
ReagentMass (g)Grade (%)
FeSO4∙7H2O1.9999
NiSO4∙6H2O0.26898
(Al)2(SO4)3∙18H2O9.8898
CuSO4∙5H2O1.5799.8
MnSO4∙H2O0.61699
H2SO425.98 mL95–98
Table 2. Characteristics of raw synthetic AMD.
ParametersExperimental Values
pH1.35
Eh (V)0.51
Conductivity (mS/cm)12.2
TDS (mg/L)5998
Iron(mg/L)16.2
Aluminum (mg/L)2.28
Copper (mg/L)16.58
Nickel (mg/L)33.6
Sulfate (mg/L)1300
Table 3. Process train configurations.
Process Train No.Media 1Media 2Media 3
1Concrete WasteLimestoneLaterite Mine Waste
2Concrete WasteLaterite Mine WasteLimestone
3LimestoneConcrete WasteLaterite Mine Waste
4LimestoneLaterite Mine WasteConcrete Waste
5Laterite Mine WasteLimestoneConcrete Waste
6Laterite Mine WasteConcrete WasteLimestone
Table 4. Volume of AMD and weight of media per run.
Process Train No.Volume of AMD and Mass of MediaMedia 1Media 2Media 3
1 (CW-LS-LMW)Synthetic AMD (mL)23001250675
Treatment Media (g)30671667900
2 (CW-LMW-LS)Synthetic AMD (mL)23001425500
Treatment Media (g)30671900667
3 (LS-CW-LMW)Synthetic AMD (mL)23001250675
Treatment Media (g)30671667900
4 (LS-LMW-CW)Synthetic AMD (mL)23001425500
Treatment Media (g)30671900667
5 (LMW-LS-CW)Synthetic AMD (mL)23001056500
Treatment Media (g)30671407667
6 (LMW-CW-LS) Synthetic AMD (mL)23001056500
Treatment Media (g)30671407556
Table 5. Percent oxide composition of each treatment media.
Metal OxideMedia Composition (wt %)
LMWLimestoneConcrete Waste
Fe2O352.50.4914.3
Al2O340.212.85.83
CaO0.0886.759.4
NiO2.330.050.03
SiO22.91018.9
Others2.010.031.54
Table 6. Specific surface area of each media.
MediaSpecific Surface Area
LMW138.5 m2/g
Limestone0.0007 m2/g
Concrete Waste0.00054 m2/g
Table 7. % metal removal of the process trains.
Process Train No.Order of Media%Removal
Fe (%)Ni (%)Al (%)SO42− (%)
Process Train # 1 (CW-LS-LMW)1st−0.629.6510.2514.85
2nd5.138.7742.09−14.15
3rd1.8681.5879.8330.77
Process Train # 2 (CW-LMW-LS)1st−3.157.8916.0957.23
2nd40.0789.0485.6138.62
3rd−2.7284.2177.3036.23
Process Train # 3 (LS-CW-LMW)1st−64.56−64.4730.5926.15
2nd−41.13−3.0739.9525.46
3rd−40.2089.0489.9940.46
Process Train # 4 (LS-LMW-CW)1st−56.52−60.5332.0839.38
2nd65.7490.3594.4655.92
3rd38.9094.3071.7651.69
Process Train # 5 (LMW-LS-CW)1st35.81−18.8619.1277.22
2nd27.9544.7474.4197.06
3rd−19.2365.3548.5083.39
Process Train # 6 (LMW-CW-LS)1st29.00−16.6723.5388.74
2nd−955.612.72−259.383.48
3rd−233.266.23−3.8480.26
Table 8. Comparison between the Effluents and the DAO 2016–08 and 2021–19 Standards.
Process Train No.ParametersEffluentDAO Standard
Process Train # 1 (CW-LS-LMW)pH7.026.5–9.0
Fe15.87.5
Ni0.421
Sulfates900550
Process Train # 2 (CW-LMW-LS)pH7.386.5–9.0
Fe16.67.5
Ni0.361
Sulfates829550
Process Train # 3 (LS-CW-LMW)pH7.016.5–9.0
Fe9.677.5
Ni0.251
Sulfates774550
Process Train # 4 (LS-LMW-CW)pH8.086.5–9.0
Fe9.887.5
Ni0.131
Sulfates628550
Process Train # 5 (LMW-LS-CW)pH11.06.5–9.0
Fe19.37.5
Ni0.791
Sulfates216550
Process Train # 6 (LMW-CW-LS)pH9.166.5–9.0
Fe53.97.5
Ni0.771
Sulfates257550
Note: CW—concrete waste, LS—limestone, LMW—laterite mine waste; values indicated in red are beyond effluent standards [42,43].
Table 9. Normalized values of each process train.
Process Train 1Process Train 2Process Train 3Process Train 4Process Train 5Process Train 6
ParameterNormalized Values
pH1.101.171.101.320.7900.98
Fe concentration0.035−0.0510.7500.725−0.359−4.35
Ni concentration1.451.501.591.681.161.18
Sulfates0.5330.6280.7010.8961.451.39
Total3.123.254.144.623.04−1.68
Publisher’s Note: MDPI stays neutral with regard to jurisdictional claims in published maps and institutional affiliations.

