Article

Zinnia (Zinnia elegans L.) and Periwinkle (Catharanthus roseus (L.) G. Don) Responses to Salinity Stress

Faculty of Agrobiotechnical Sciences Osijek, University of Josip Juraj Strossmayer of Osijek, 31000 Osijek, Croatia
*
Author to whom correspondence should be addressed.
Water 2022, 14(7), 1066; https://doi.org/10.3390/w14071066
Submission received: 8 February 2022 / Revised: 18 March 2022 / Accepted: 25 March 2022 / Published: 28 March 2022
(This article belongs to the Special Issue Climate, Water, and Soil)

Abstract

:
The study of salinity stress in irrigated floriculture can make a significant contribution to the preservation of freshwater sources. To analyze the morphological and aesthetic responses of zinnia (Zinnia elegans L.) and periwinkle (Catharanthus roseus (L.) G. Don) to different salinity stress levels, the following treatments were performed: s0 = municipal water (control), s1 = 3 dS m−1, s2 = 4.5 dS m−1, and s3 = 6 dS m−1. The growth of zinnia (flower number, plant height, branch and leaf number, total fresh and dry biomass, and root length) was linearly reduced by increasing salinity levels, while all observed periwinkle traits for the s2 salinity treatment were either equal to or greater than the control treatment (n.s.) and a further increase in salinity stress showed a significant (p < 0.01) decrease. The first flower buds on zinnia appeared with the control treatment (s0), while for periwinkle the first flower bud appeared with the s1 treatment. With regard to both zinnia and periwinkle leaf necrosis, drying and firing occurred during the third week in the s2 and s3 treatments. Zinnia proved to be sensitive to salinity, while periwinkle showed mild tolerance to salinity stress, up to 3 dS m−1.

1. Introduction

A literature review has shown that agriculture accounts for 70% of freshwater withdrawals, which is equivalent to 2700 km3 year−1 [1], and is often mentioned as the main cause of water scarcity in the future [2]. There are three major theoretical and conceptual frameworks for the mentioned problem, i.e., the increasing world population [3,4], which leads to increasing demand for food, climate change [5,6], and drought [7,8]. Consequently, the competition for high-quality irrigation water among different crops is becoming more intense, resulting in lower water quality.
Plants’ reactions to stress caused by drought or salinity is manifested in various metabolic and morphological changes that are very similar, especially at the beginning, that is, at the early stage of the stress. The reason is that soil salinity reduces the ability of plants to absorb water, so the symptoms of lack of water, i.e., drought, are visible. This has been explored in a prior study by Munns [9]. The author claims that salinity reduces the ability of plants to take up water, and this quickly causes reductions in growth rates, along with a suite of metabolic changes identical to those caused by water stress. Salinity causes osmotic and ionic stress in plants, mainly due to the accumulation of toxic Na+ and Cl ions in plant tissues [10]. A previous study by Ravindran et al. [11] shows that salinity affects about one-third of irrigated land, causing a significant reduction in crop productivity. A large number of studies in the broader literature have examined the plant stress caused by high salinity levels of irrigation water [12,13,14,15]. They state that plants respond to saline stress with a variety of different mechanisms, whereby the level of salt stress depends on the crop species [16,17], the frequency and length of exposure [18,19,20], and the salinity level [21,22].
In floriculture, the use of saline water requires an understanding of plant response to the salinity effects of irrigation [23]. Previously published studies conducted on a variety of flower species have indicated that salt stress causes a decrease in plant height [24,25,26], leaf dry weight, and flower number [27,28,29]. On the one hand, some effects of salinity could be desirable, such as decreased length and/or the number of internodes, while, on the other hand, some effects could be undesirable, such as chlorosis and marginal leaf necrosis, which is of crucial importance for ornamental plants, i.e., their aesthetic value, which is an important component of ornamental plants. In terms of aesthetic value, it is important to emphasize the importance of the negative impact of saline stress, which is primarily manifested in morphological changes, such as shoot and leaf growth reduction, leaf necrosis, as well as the quality of the flower (size and color). For example, Sun et al. [30] reported that marigold plants began to show foliar salt damage (leaf burn and necrosis) at 6 weeks after the initiation of salt treatment.
Zinnia (Zinnia elegans) and periwinkle (Catharanthus roseus (L.) G. Don) are highly valued species in the horticultural industry, and are often planted in gardens, flower beds, or pots as summer flowering plants. It must also be mentioned that the periwinkle is often considered as an important source of pharmaceutical materials used in cancer treatment [31,32]. The impact of different irrigation or drought treatments on zinnia and periwinkle has been the subject of many studies [25,33,34]. However, as water scarcity and the consequent use of lower quality water has come to be of increasing importance in ornamental plant growing, as well as landscaping, more studies are needed to assess the effects of salinity on the growth and aesthetic value of zinnia and periwinkle. Therefore, this study, through an assessment of the adaptability of and reactions to different salinity levels in zinnia and periwinkle plants, aimed to determine their morphological responses and aesthetic values and hence the possibility of preserving freshwater sources by using irrigation water of lower quality in floriculture.

2. Materials and Methods

2.1. Plant Material

The greenhouse pot experiment was performed in Orahovica, Continental Croatia (45°32′ N 17°53′ E), in April 2020, on zinnia (Zinnia elegans L.) and periwinkle (Catharanthus roseus (L.) G. Don). The pot trial was conducted as a randomized complete design with four repetitions.
Zinnia (MaggellanTM Scarlet) and Periwinkle (Madagascar) seeds were purchased from Syngenta Seeds (Downers Grove, IL, USA). Before sowing, the flower seeds were sterilized with 70% ethanol and washed with distilled water. Then, the seeds were sown in a plastic tray for seedlings on the substrate Substral, Terra Osmocote® (Evergreen Garden Care, Warszawa, Poland). At early stage, both zinnia and periwinkle seedlings were grown in the same growing conditions (25.6 °C ± 1.3 °C air temperature, 24 °C water temperature, and 55% relative humidity) to achieve as uniform an initial growth as possible.
At the four-leaf stage, seedlings were transplanted into plastic pots (450 mL, 10 cm h, 11.5 cm Ø) on 2 May 2020. A size of pot that would place no restrictions on plant growth was chosen. The pots were filled with growing medium (Vigorplant, Fombio, Italy), composed of perlite and peat (0–10 mm). The upper part of the pot was left empty, i.e., the pots were not filled with substrate to the very top or edge, to avoid surface run-off and loss of irrigation rate.
Plants were grouped in four repetitions of ten plants per treatment, that is, 320 plants in total = 10 plants × 4 salinity stress × 4 repetitions = 160. Thereafter, plants were subjected to salinity stress for 35 days.

2.2. Salinity Stress Treatment

Four salinity stress treatments were performed: s0 = municipal water (control), s1 = 3 dS m−1, s2 = 4.5 dS m−1, and s3 = 6 dS m1. Plants were irrigated with municipal water, the main indicator and chemical parameters of which are presented in Table 1.
As mentioned earlier, the source of irrigation water was municipal water, and therefore the water quality evaluation was according to Directive 2020/2184, which determines the quality of water intended for human consumption [35]. Regarding water quality for irrigation, there are no potential problems, that is, the water can be used without any restrictions [36].
Salinity stress was achieved by adding different amounts of NaCl, MgSO4, and CaCl2 to irrigation water, whereby, for EC = 1 dS m−1, 169.3 mg/L of NaCl, 91.2 mg/L of MgSO4, and 163.7 mg/L of CaCl2 is added. The EC was measured using an HM Digital COM-80 EC/TDS meter, factory calibrated (HM digital, Inc., Redondo Beach, CA, USA) continuously during the study.
Since the study treatment was salinity stress, i.e., higher salt concentrations in irrigation water, the irrigation time was determined by gravimetric method due to the impact of salt on the moisture sensors readings. The following procedure was performed to determine available water capacity (AWC—the maximum amount of plant-available water) and irrigation rate per pot. The mass of the empty pot was weighed first. Then, three samples of 100 g of air-dried substrate were placed in paper bags and dried in an oven (104 °C) until constant weight. After cooling, the samples were weighed again, and moisture content (g/g) was calculated as an average of three samples. The amount of air-dried substrate per pot was determined so that the moisture content (g/g) of the air-dried substrate was accounted for.
It is important to determine the amount of water needed to refill the water content to maximum water holding capacity (MWHC). The following procedure was taken to determine MWHC. Substrate samples were placed in three containers with perforated bottoms so that the excess water could drain. The filter paper was placed on the top of the substrate so that the water could evenly and slowly infiltrate into the substrate. After the substrate was saturated (when water drainage occurs), the containers were covered with plastic to prevent evaporation. After two days, when all excess water was drained, 100 g of the substrate was sampled from the middle of each container, and the MWHC was determined according to a standard gravimetric method. Irrigation rate, expressed as mass equivalent of moisture, was determined to bring the water content (WC) of each pot to MWHC. The plants were well-irrigated (80–100% AWC) manually (each pot separately) so that drought stress would be avoided and excluded from the study and to reduce runoff as much as possible. Pot weights were checked daily (in the morning, 08:00–09:00) and the target moisture level was maintained during the entire experimental period. The growth index (GI) was used to compare plant growth with different salinity stress treatments. The method was presented by Warsaw et al. [37]:
GI = (plant width A + plant width perpendicular to plant width A + plant height)/3
where GI is growth index, plant width A was the widest plant width on an east-to-west axis, plant width perpendicular to plant width A was the widest plant width measured on a north-to-south axis, and plant height was measured from the container rim.

2.3. Data Collection

During the experimental period, the pots could be moved as needed for weight measurements and then put back. At the end of the experimental period, flower number (n), plant height (cm), branch number (n), leaf number (n), fresh and dry biomass (g), and root length (cm) were measured for five random healthy plants per treatment. Only fully opened flowers were taken into analysis.
The root of the plant was carefully separated from the substrate and washed with tap water to measure the length. Plant biomass was dried in the oven at 70 °C until constant weight.
To evaluate leaf RWC, leaf samples were taken and weighed (fresh weight, FW). Then, the leaf samples were placed in distilled water for one day (24 h) and weighted again (turgid weight, TW). RWC was calculated according to Pieczynski et al. [38]. Water use efficiency (WUE) was determined according to Heidari et al. [39]:
WUE = fresh weight (g)/net irrigation rate (mm)
These measurements were taken for five randomly selected plants for each study treatment after 28 days. The remaining plants were observed over the next week to assess aesthetic value, mortality, and leaf necrosis. The following observations were performed at the end of the experimental period to classify the aesthetic value of zinnia and periwinkle: healthy plants with green leaves; number of dry, chlorotic leaves; leaf firing; and dead plant number.

2.4. Statistical Analysis

To compare all salinity treatments, statistical analyses were conducted with STATISTICA 13 (StatSoft, Inc., Tulsa, OK, USA). Data were analysed using analysis of variance (one-way ANOVA). A protected least significant difference (LSD) procedure was used to separate the differences at probability levels of 0.05 and 0.01. Linear correlations between the tested parameters were evaluated using Student’s t-tests. A correlation analysis was performed by measuring a linear dependence between two variables, and the strength of the correlation was expressed as the r coefficient. The r2 coefficient was used to test how close the data were for salinity stress and tested variables.

3. Results

3.1. Growing Conditions and Irrigation Scheduling

For the experimental period, the average RH in the greenhouse was 57.6%, the average daily temperature was 27.3 °C, while the average night temperature was 20.8 °C. Irrigation rates ranged from 0.04 to 0.1 L/pot/day for zinnia and from 0.03 to 0.09 L/pot/day for periwinkle (Figure 1). The net irrigation rate was 2.28 L/pot for zinnia and 2.38 L/pot for periwinkle.

3.2. Effect of Salinity Stress on Zinnia Growth

The growth of zinnia was significantly (p < 0.01) affected by salinity stress, except for plant height (Table 2). All tested variables were reduced as salinity stress became more pronounced. Compared with the control treatment, the flower number was reduced by 20% (s1) and 40% (s2), while with the s3 treatment the flowers were completely absent. Plant height ranged from 21.02 (s0) to 16.51 cm (s3), although without significant differences (n.s.). There was no difference in branch number between the control treatment (s0) and the s1 treatment (3 dS m−1), while with further salinity stress levels branch number was significantly (p < 0.01) decreased, by 25% (c2) and 50% (c3). Similar trends were noted for the remaining variables. For example, total fresh biomass ranged from 11.1 g/plant (s0) to 5.3 g/plant (c3); salinity stress significantly reduced fresh biomass, by 31.5% (s2) and 52.3% (s3). Furthermore, by increasing the salinity level, total dry mass was significantly (p < 0.01) reduced, by 25% (s2) and 53.6% (s3). Root length was significantly (p < 0.01) reduced with s2 (55.2%) and s3 (64.3%).

3.3. Effect of Salinity Stress on Periwinkle Growth

The growth of periwinkle was significantly influenced by salinity treatment (Table 3).
Flower number was significantly (p < 0.01) modified by salinity levels. An interesting observation was that flower number with the s1 salinity treatment was by 10.7% higher than the control treatment, while a further increase in salinity decreased flower number by 14.3% (s2) and 35.7% (s3).
The same trend was noted for all tested variables. Plant height ranged from 65.38 cm (s1) to 43.16 mm (s3). A significant (p < 0.05) impact of salinity stress was noted only for the s3 treatment. The maximum number of branches was also recorded for the s1 treatment (11.84). With a further increase in salinity, the number of branches was significantly (p < 0.01) reduced, by 21.1% (s2) and 56.7% (s3). As for leaf number, the maximum number was recorded with the s1 treatment (306.8), while further increase in salinity reduced leaf number, by 11.4% (s2) and 40.8% (s3). Total fresh biomass ranged from 28.36 g (s1) to 22.80 g (s3). Significantly (p < 0.01) lower fresh weight was recorded with the s2 (−11.2%) and s3 (−16.8%) salinity treatments. In addition, the maximum dry biomass was recorded with the s1 treatment (3.3 g). Significantly (p < 0.01) lower dry biomass was recorded for the s2 (−14.3%) and s3 (−35.7%) treatments. Compared to the control treatment, root length was 5.6% (n.s.) higher with the s1 treatment, while with a further increase in salinity the root length was significantly (p < 0.01) reduced, by 28.2% (s2) and 29.9% (s3).

3.4. Leaf Relative Water Content (RWC), Water Use Efficiency (WUE), and Growth Index (GI)

The RWC, WUE, and GI values for zinnia and periwinkle are presented in Table 4. RWC ranged from 74.2% (s0) to 52.4% (s3) in zinnia, and from 75.4% to 59.3% in periwinkle. As for WUE, it was in a range from 6.07 g/L (s0) to 2.9 g/L (s3) in zinnia and from 14.13 g/L (s0) to 11.75 g/L (s3) in periwinkle. GI in zinnia ranged from 27.01 cm (s0) to 12.2 cm (s3) and from 39.41 cm (s1) to 19.18 cm (s3) in periwinkle.
Significant correlations (p < 0.05) for zinnia were found only between salinity and plant height (r = −0.95, Figure 2) and salinity and leaf number (r = −0.97, Figure 3). Both correlations showed negative trends.
The results of the correlation analysis for zinnia are presented in Table 5. Strong positive correlations were found between flower number and plant height (r = 0.97), flower number and branch number (r = 0.96), flower number and leaf number (r = 0.96), flower number and total fresh biomass (r = 0.95), and flower number and total dry biomass (r = 0.98).
Furthermore, strong positive correlations were found between plant height and leaf number (r = 0.97), branch number and leaf number (r = 0.95), branch number and total fresh biomass (r = 0.99). In addition, a strong positive correlation was found between leaf number and total fresh biomass (r = 0.96), leaf number and total dry biomass (r = 0.96), and leaf number and root length (r = 0.97). A strong positive correlation was also found between total fresh biomass and total dry biomass (r = 0.98) and between total fresh biomass and root length (r = 0.95).
The results of the correlation analysis for periwinkle are presented in Table 6. Strong positive correlations were found between flower number and branch number (r = 0.99), flower number and leaf number (r = 0.97), flower number and total fresh biomass (r = 0.97), and flower number and total dry biomass (r = 0.99).
Furthermore, strong positive correlations were found between plant height and leaf number (r = 0.95) and between plant height and total fresh biomass (r = 0.98). In addition, strong positive correlations were found between branch number and leaf number (r = 0.95), branch number and total fresh biomass (r = 0.96), and branch number and total dry biomass (r = 0.99). Strong positive correlations were also found between total fresh biomass and total dry biomass (r = 0.97) and between total fresh biomass and root length (r = 0.97).

3.5. Aesthetic Value

Aesthetic value was analysed in zinnia and periwinkle through visual observation. The first zinnia flower buds in the s1, s2, and s3 treatments appeared two to three days later than those in the control (s0) treatment. Necrotic changes, drying, and firing occurred on a majority of leaves in the s2 and s3 treatments, 3 weeks after transplanting. At the end of the experimental period, mortality in the s2 treatment was 80%, while in the s3 treatment all plants died (mortality 100%, Figure 4).
The first flower buds on periwinkle were noted eight days after transplantation to the s1 treatment. Over the next five days, flower buds appeared with the other salinity treatments as well. Leaf necrosis, chlorosis, and firing were noted during the third week in the s2 treatment and later in the s3 treatment, too. At the end of the experimental period, over the next five days, more flower buds appeared with the other treatments as well. More than 55% of plants in the s2 treatment and 70% of plants in the s3 treatment died (Figure 5). With the s0 and s1 treatments, all zinnia as well as periwinkle plants survived till the end of the experimental period (0% mortality, Figure 4 and Figure 5) with healthy green leaves and vivid flower color.

4. Discussion

Increasing the salinity of irrigation water inhibited the growth of zinnia. All tested variables exhibited decreasing linear trends with increasing salinity stress levels. This shows that zinnia is sensitive to salinity stress, even with lower (3 dS m−1) salinity levels. Our finding is in agreement with Macherla and McAvoy [40], who claim that zinnia can be irrigated with saline water up to 0.5 g·L−1 NaCl (an EC of 1 dS·m−1) in a 5-week production cycle without adverse effects on growth.
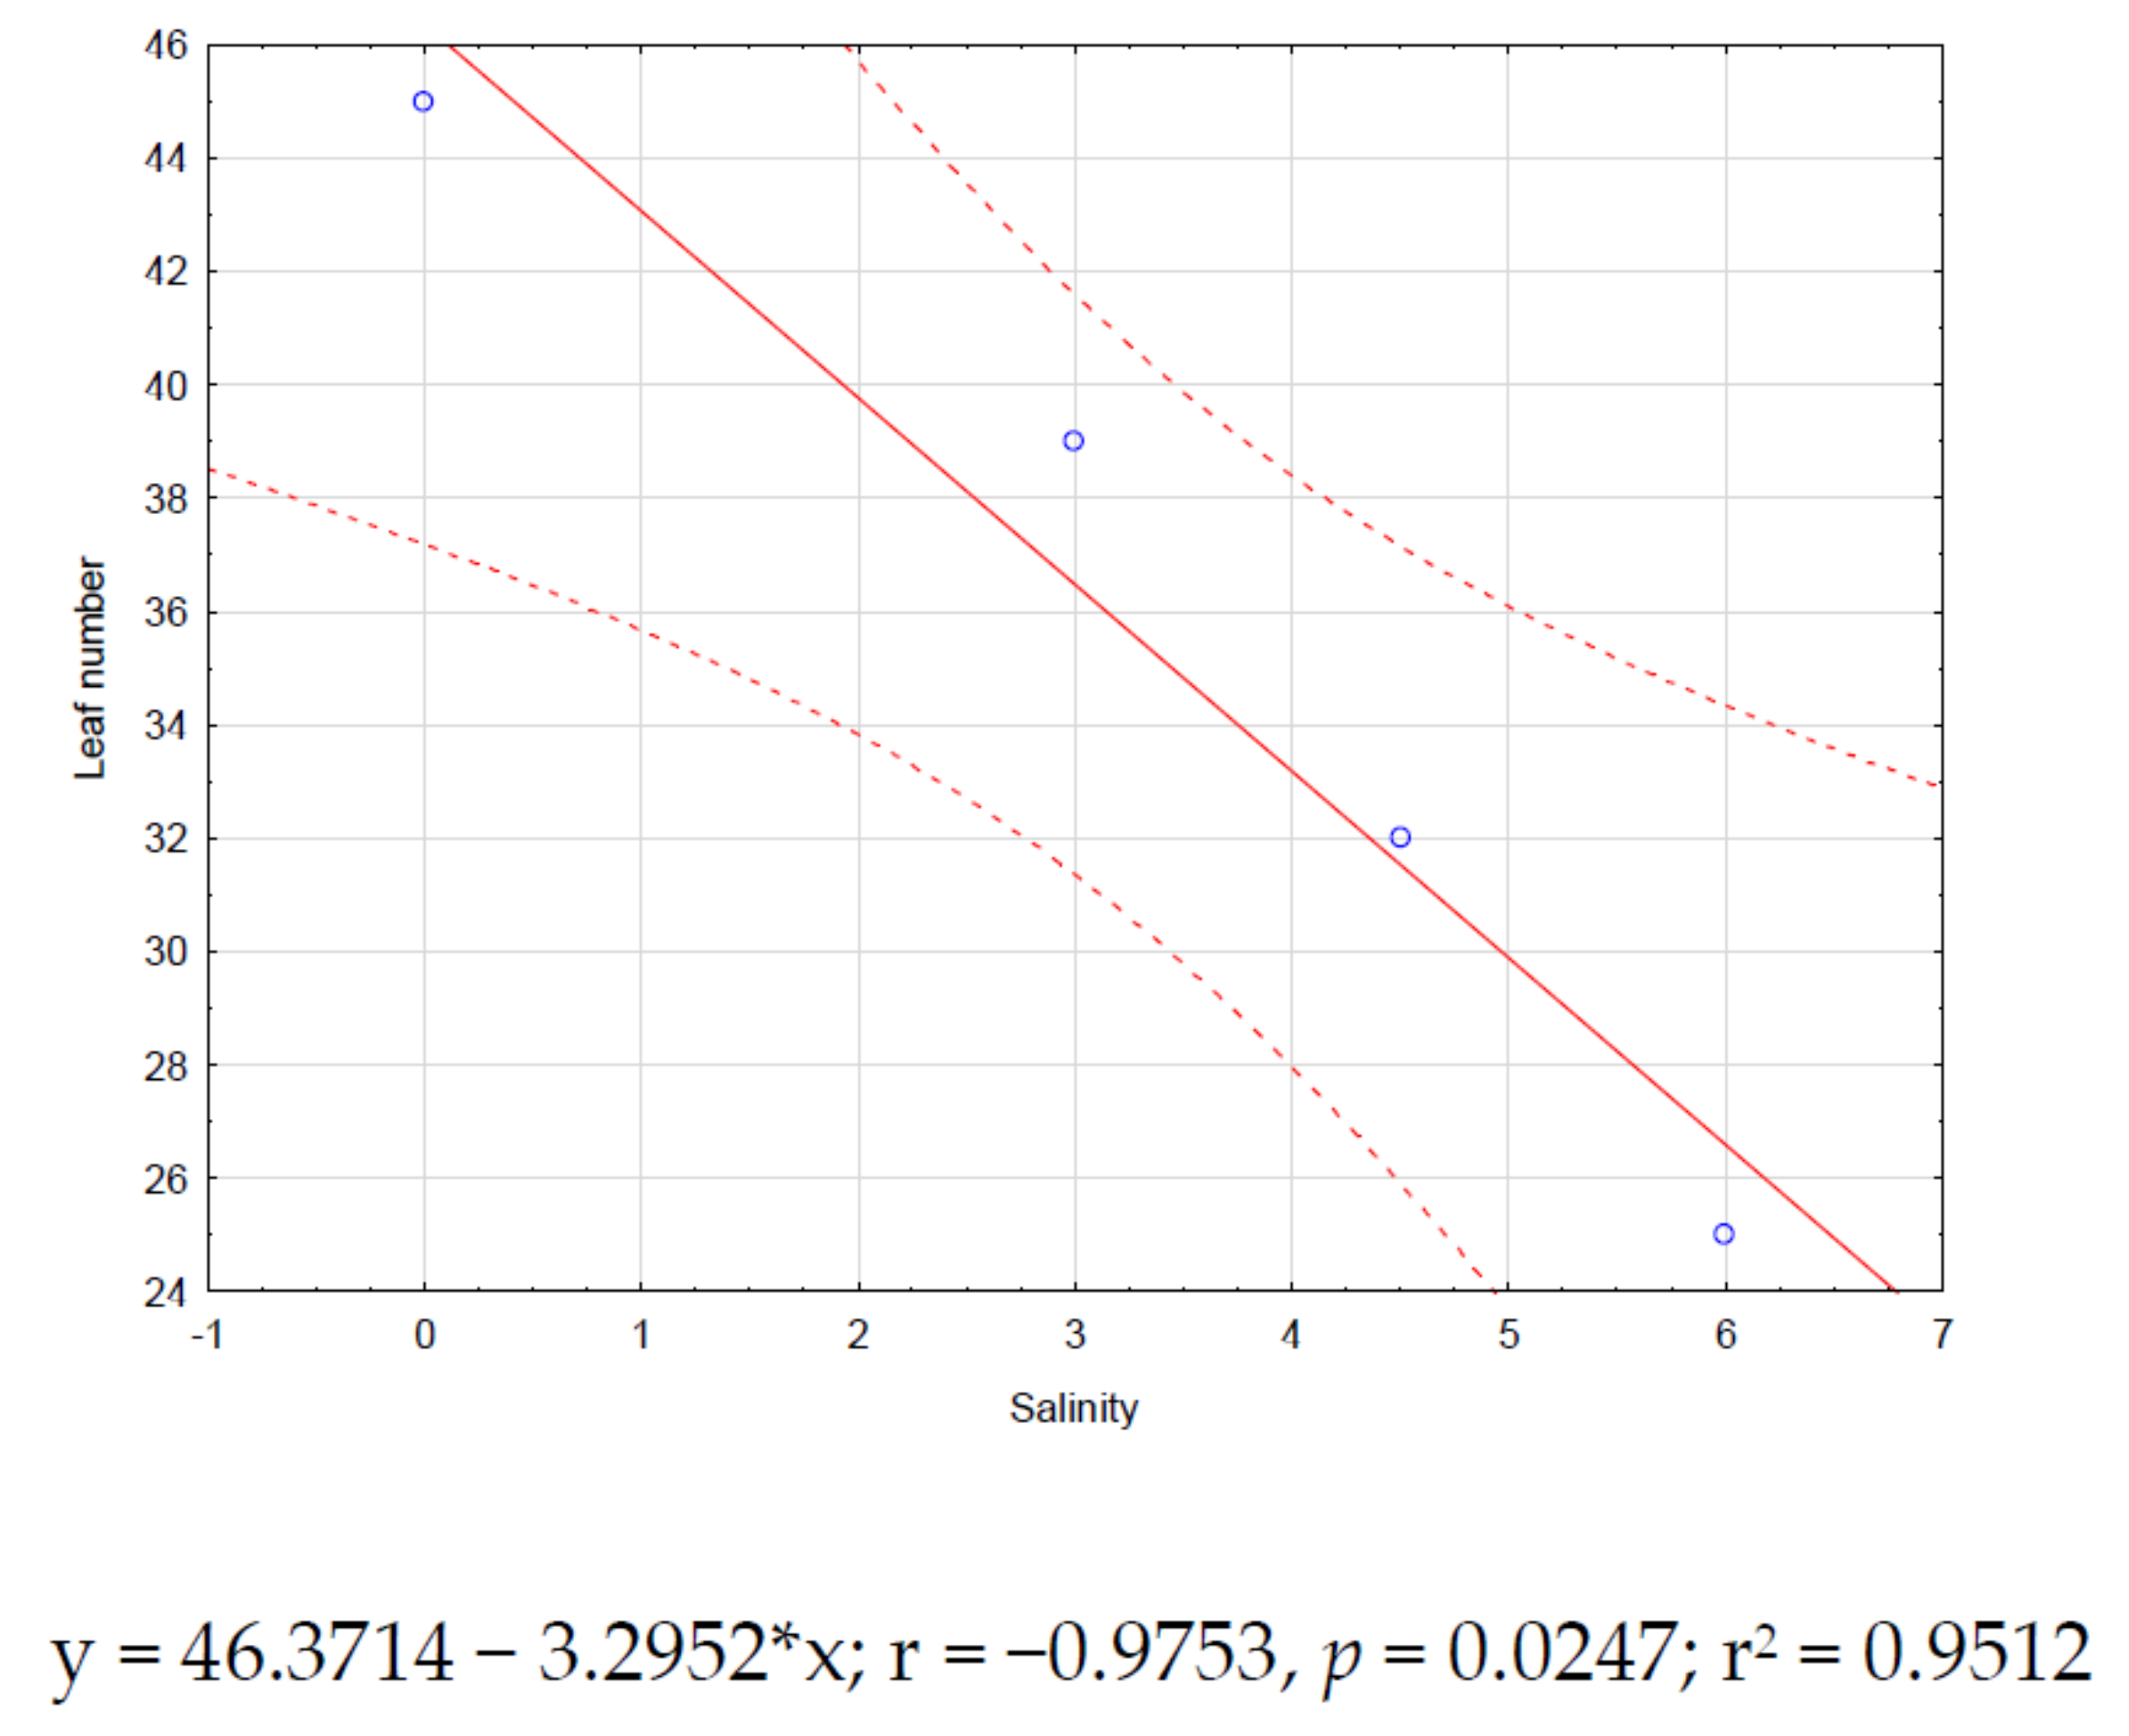
Due to intolerance to salinity stress, the GI was reduced by 23.5% (s1), 39.6% (s2), and 54.8% (s3). This indicates reduced biomass, which, in addition to the decrease in leaf number, indicates reduced photosynthetic activity. The reduced root length with salinity treatment is also a very important subject to address. As previously reported by Duan et al. [41], roots are highly sensitive to changes in their surrounding environment and root system responses to stress, such as salinity and drought, can be very dynamic and complex in nature. This was confirmed by our research, considering that even the smallest increase in salt caused a decrease in the zinnia roots. Yasemin et al. [42] also claimed that root lengths of all zinnia cultivars were dramatically decreased by salt stress. Furthermore, high salinity levels (s2 and s3) caused leaf drying, brown leaves (firing), and pale coloring of the flowers, which changes are, of course, very similar to symptoms of drought stress. This has previously been reported by Taiz and Zelger [43]. The authors claimed that salinity can have similar effects to water stress on plant growth, except for the addition of ion cytotoxicity, which appears with excess salt in soil.
A notable leaf firing (visual browning) has been observed in zinnia plants in the s2 and s3 salinity treatments. This observation is in accordance with Xiang et al. [44]. The authors claimed that leaf firing increased as salinity levels increased, as previously reported by Sifers and Beard [45]. The increase in the percentage of leaf firing associated with less water availability to plants might be due to shorter roots, density, and biomass, or relatively higher evapotranspiration rates during progressive water stress.
Due to high salinity stress levels, plants absorb less water, which in our study resulted in lower GI with the treatments with higher salinity levels (s1, s2, and s3). The linear decrease in fresh and dry biomass with the salinity treatments in our study was, of course, associated with reductions in leaf number. This is in accordance with Escalona et al. [
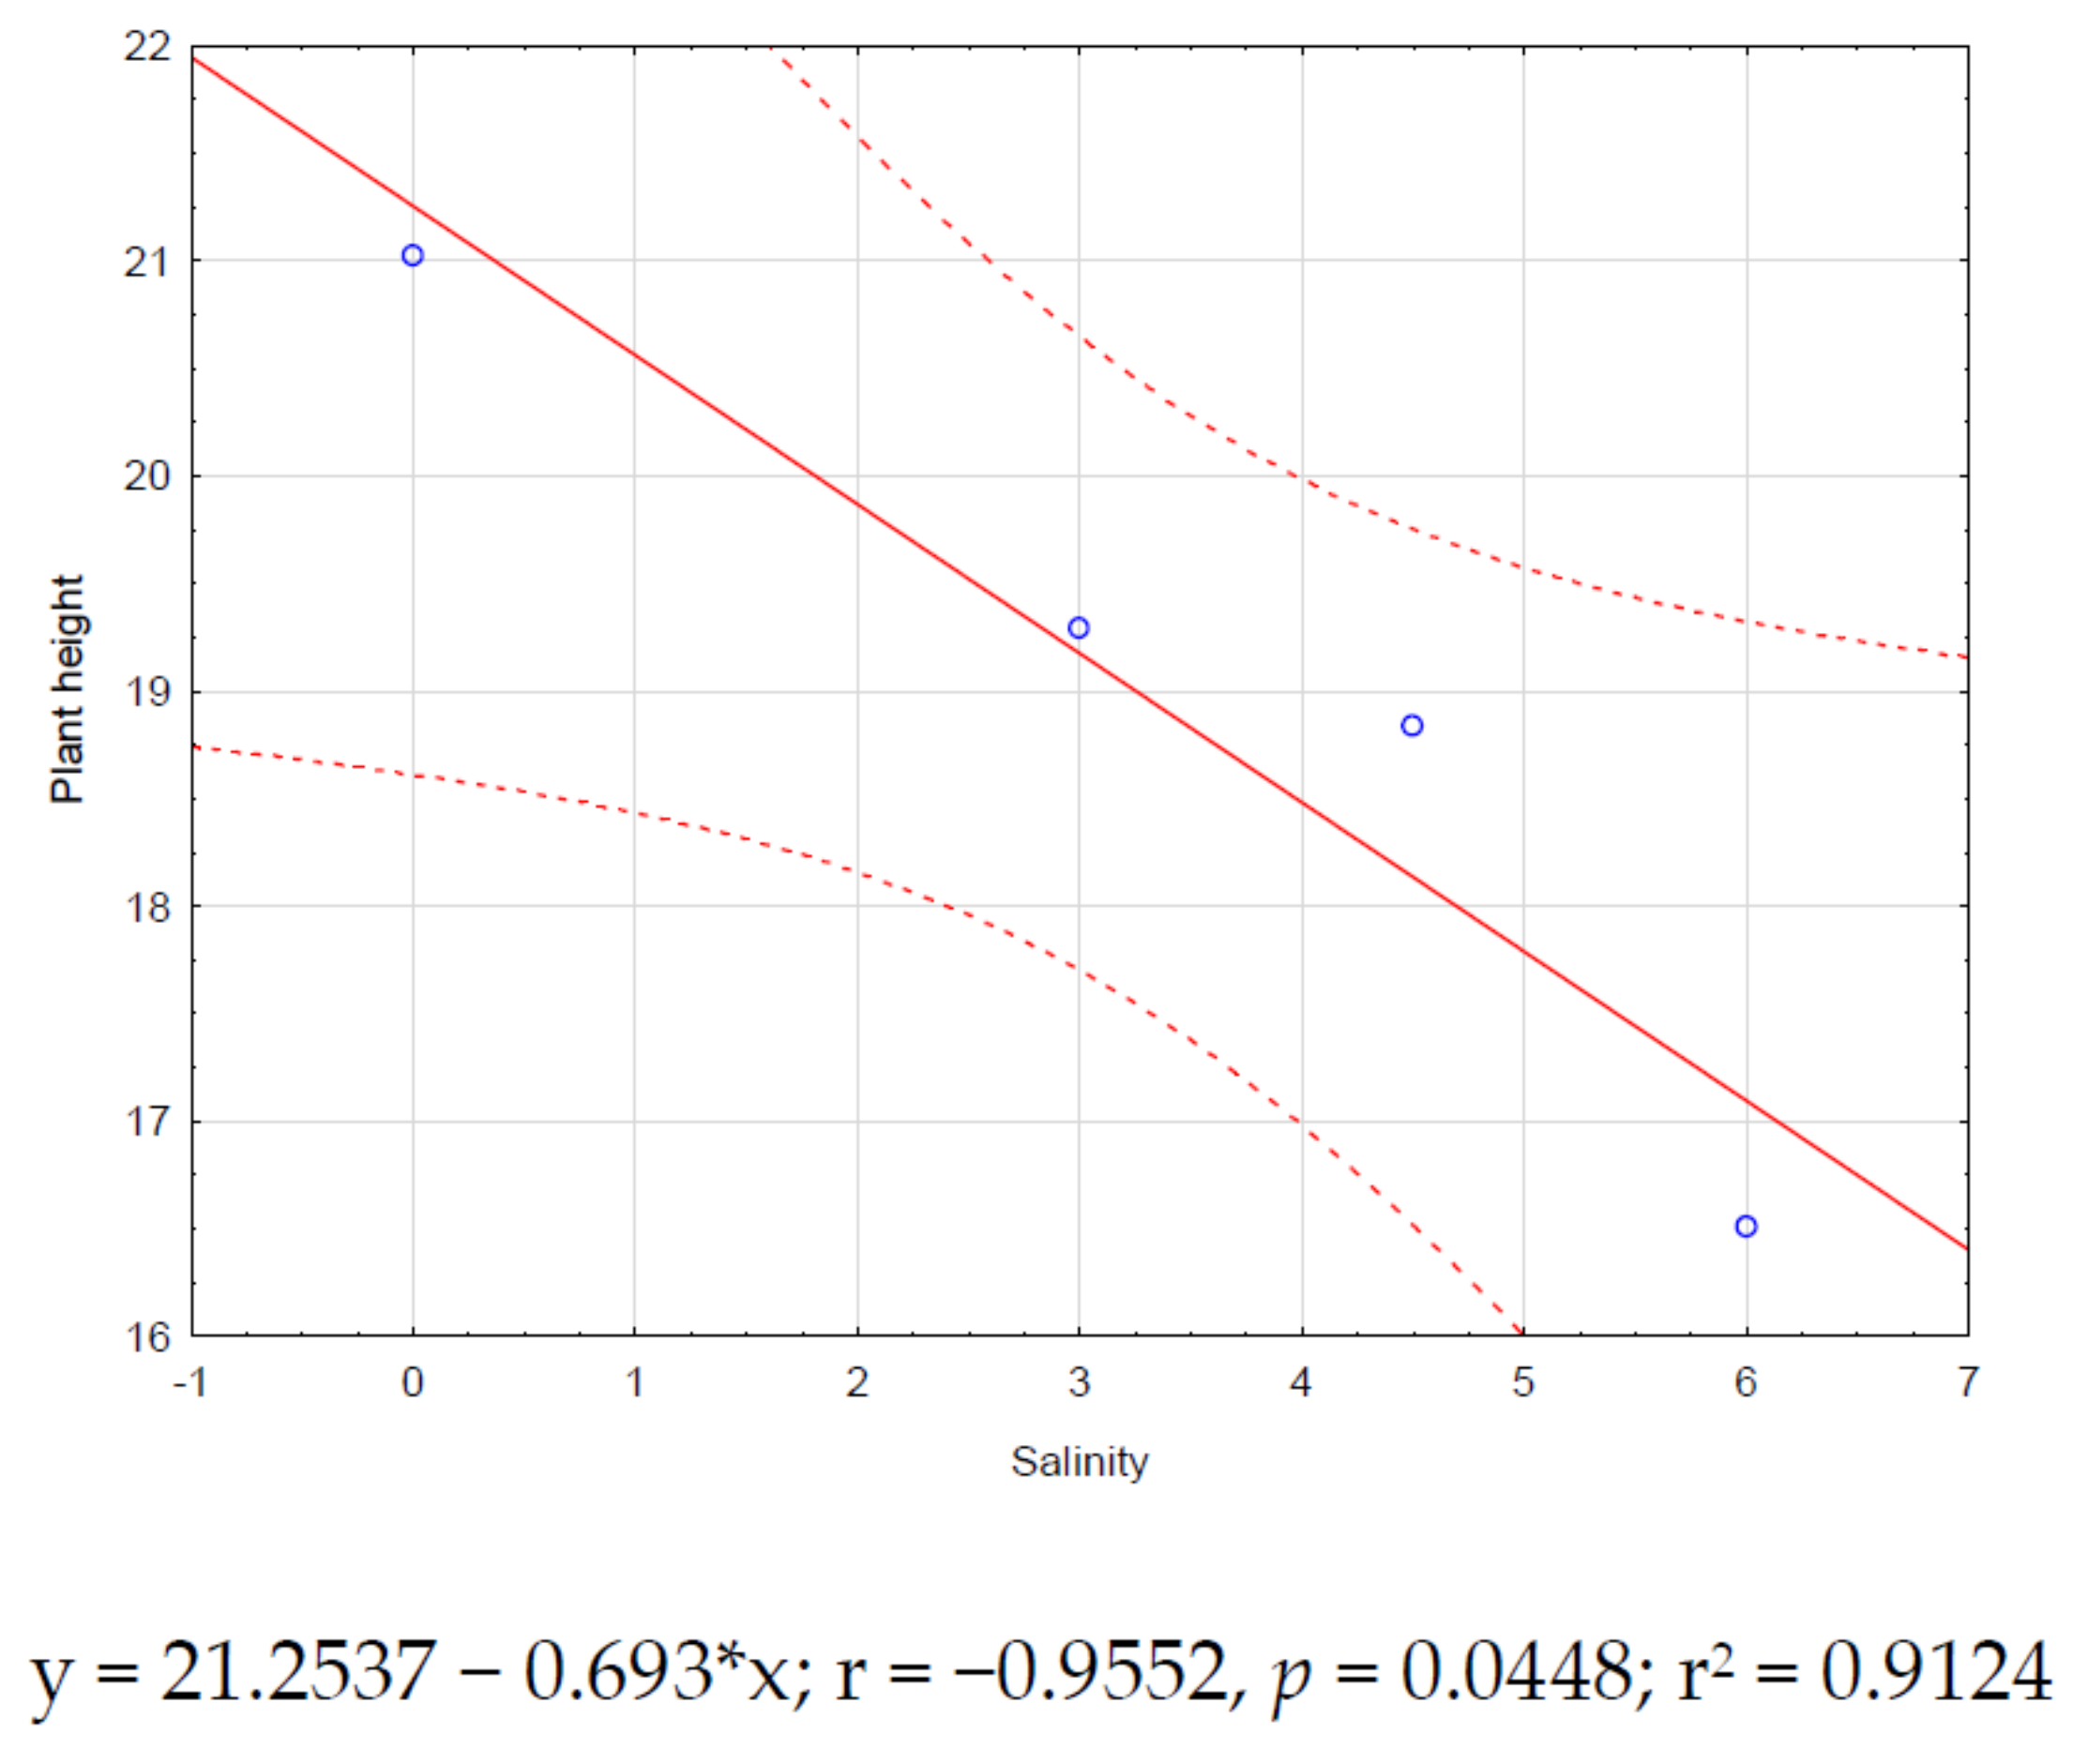
46]. The authors claimed that, in their study, increases in salinity affected plant growth, causing decreases in biomass and plant height. As for our study, plant height was also significantly reduced by salinity treatment.
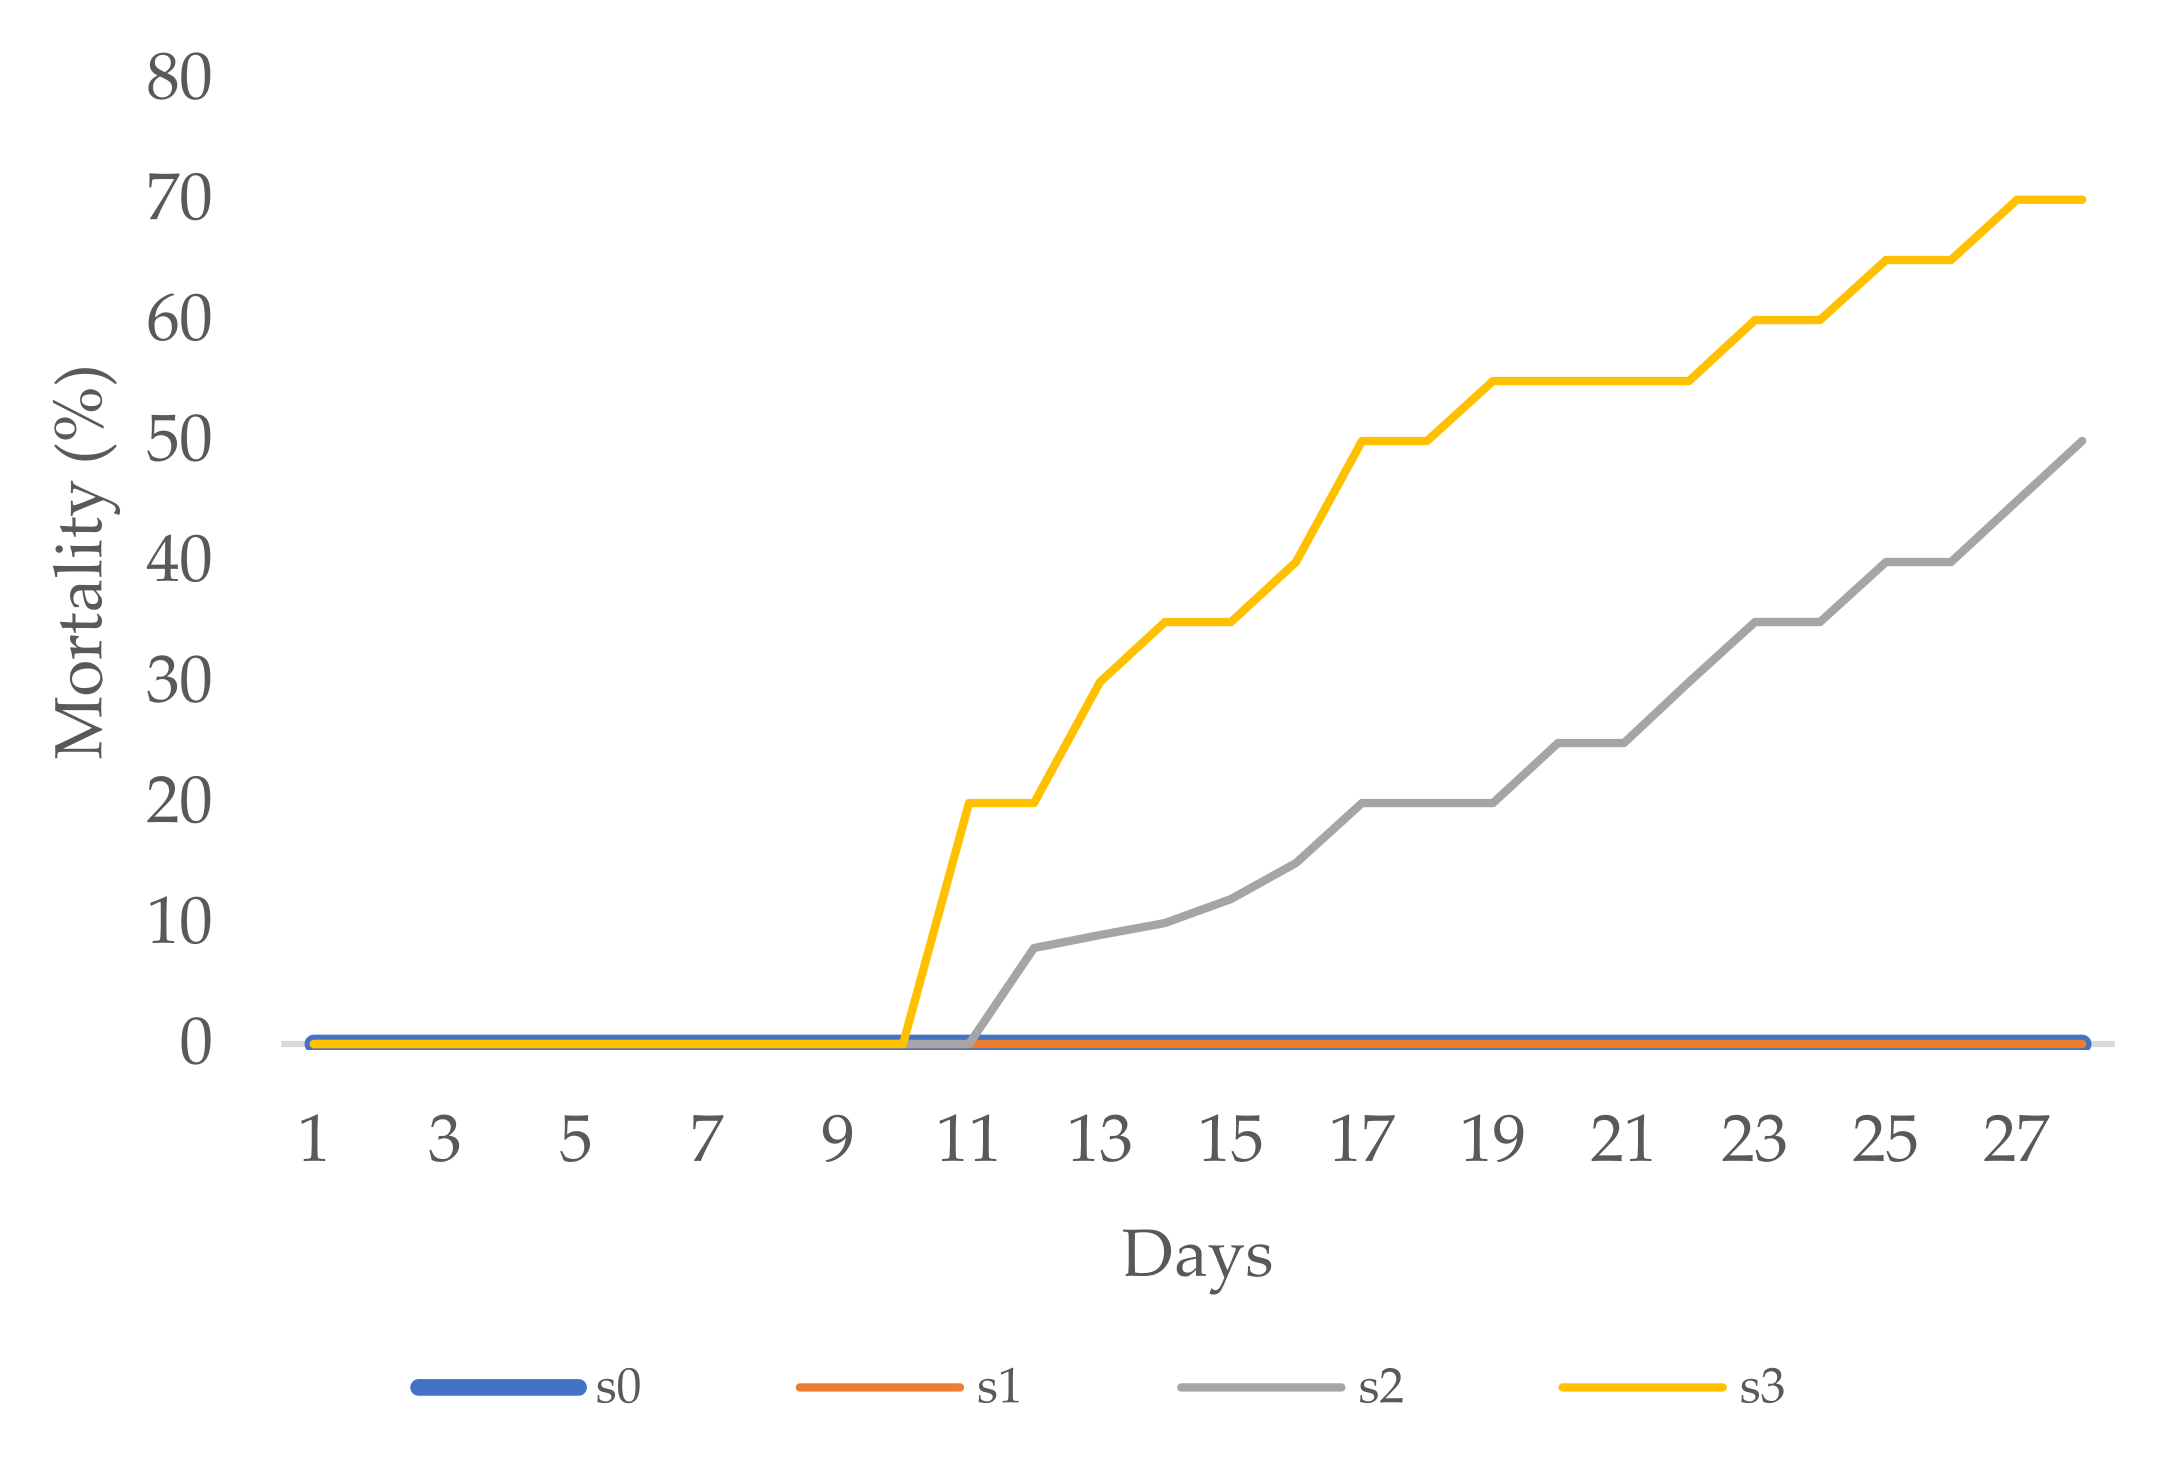
First zinnia mortality occurred early in the first week of the experiment with the s3 salinity treatment. By the end of the experimental period, all plants in the s3 treatment and 80% in the s2 treatment died. This is in agreement with the study results of Niu et al. [25]. The authors stated that all zinnia plants died by the end of the treatment at EC 6.0 and EC 8.2 as a result of high salinity in the root zone. In some studies, even higher salinity stress was applied, which, of course, caused plant death. For example, Villarino and Mattson [29] studied the impact of different salinity levels on fourteen floriculture species, and for zinnia plant they reported that Z. angustifolia was sensitive to salt stress and that plants did not survive at an EC of 14.0 dS m−1. The authors also emphasized that the sensitivity of zinnia to salinity stress is species-dependent. In our study, plants were irrigated according to daily water use and therefore the runoff was negligible. This is, of course, difficult to achieve when irrigating in gardens, flower beds, or parks, where overwatering can easily occur and, consequently, salt leaching into deeper soil layers. We consider it important to emphasize proper irrigation scheduling, since high salinity water frequently increases the accumulation of salts in the soil. As for flowering time, given that the first flowers in the s1, s2, and s3 treatments appeared two days later compared to the control treatment (s0), it could be stated that the difference in time to flower may be commercially insignificant.
A certain degree of tolerance to increased salt content in irrigation water has been noted in periwinkle. Moderate tolerance to salinity was also reported by Cai et al. [47]. According to their study on five rose genotypes subjected to salinity levels of 1.5, 4.0, and 8.0 dS m−1, most genotypes tested were moderately tolerant to salinity from 3.0 to 4.0 dS m−1. In our study, all tested variables in the s1 salinity treatment were higher than or the same as in the control treatment (s0), although without statistical significance. A further increase in salinity stress caused a decrease in all tested variables the same as for zinnia plants.
Interestingly, the first appearance of buds was observed in the s1 treatment, but it must be emphasized that this was only a few days earlier compared to the other salinity treatments. As with zinnias, this time difference cannot be considered commercially significant. Although the aim of this paper was not to compare the two flower species, it is important to point out that the mild tolerance of periwinkle to increased salt content is also manifested in mortality. Although the appearance of the first dead plants was noticed very early, as in zinnia, ultimately, at the end of the experimental period, the mortality percentage in periwinkle was lower. This indicates a better tolerance of periwinkle to the increased salt content in irrigation water. The study by Niu et al. [
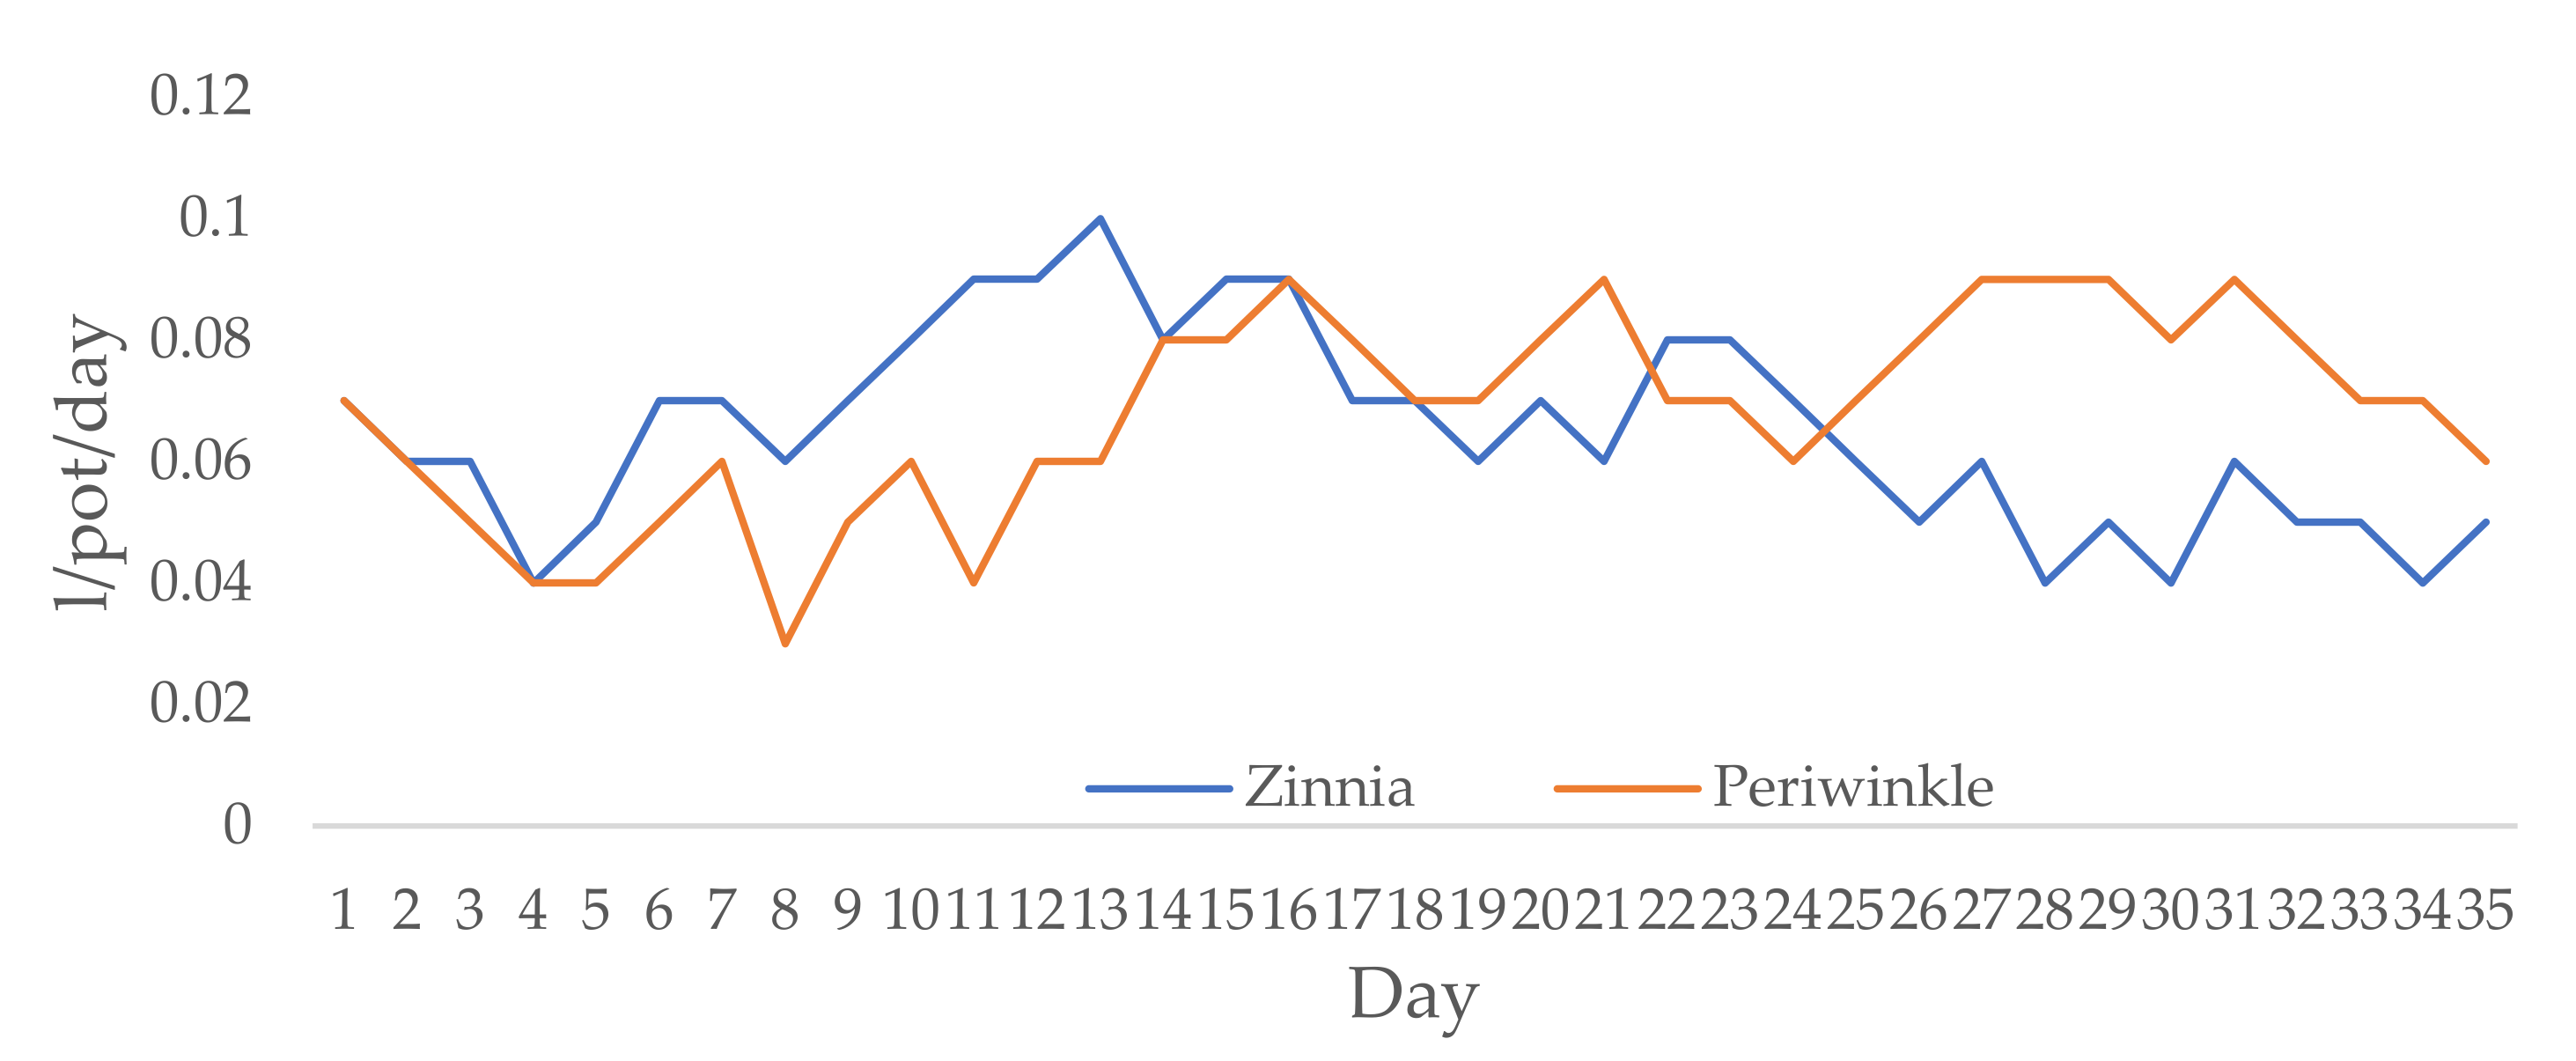
25] showed a linear decrease in dry weight and GI as the salinity of irrigation water increased. In our study, a linear decrease was noted for RWC and GI as well. As for WUE, a slightly higher WUE was noted in the s1 salinity treatment in comparison to the control treatment, yet without statistical significance. This is in agreement with Zapryanova and Atanassova’s [48] study. The authors claimed that in their study plants treated with high NaCl concentrations manifested a significant delay in bud formation compared to control plants. In their research, the effect of increased salt concentration was observed in Tagetes patula and Ageratum mexicanum. In conclusion, the authors stated that salt tolerance was species-specific, and that the tagetes were more tolerant. From our results, it is clear that salinity higher than 3 dS m−1 has a negative effect on periwinkle morphology, which is in line with study results by Neves et al. [49]. In their study, water salinity had a decreasing effect on leaf biomass, stem biomass, and flower biomass. Furthermore, the authors claimed that maximum flower production was estimated at a salinity level of 3.9 dS m−1. In our study, the maximum flower number was at a salinity level of 3 dS m−1, although without significant differences in relation to the control treatment. As for aesthetic value, contrary to the findings of Huang and Cox [50], we found considerable chlorosis on the periwinkle leaf, which, according to Römheld [51], is usually associated with a Fe deficiency due to a reduction in Fe availability at high pH levels.
Consequently, the RWC, WUE, and GI of zinnia were linearly reduced by increasing the salinity level, while the maximum values for periwinkle were recorded in the s1 salinity treatment. However, it is important to emphasize that the values for the s1 treatment are very close to the control treatment (s0) and that, of course, a further increase in salinity in the s2 and s3 salinity treatments caused the decreases. The results of our study are in line with previous studies on different crops stating that salinity stress reduces the WUE [52,53,54], RWC [55,56,57], and GI [58,59].
The notable contribution of the results of this study is that salinity stress is observed through variables that are important to flower growers, i.e., first flower bud appearance, aesthetic value, and plant survival given mild and severe salinity stress levels. Future research should consider the potential effects of salinity stress more carefully, for example, examining more incremental levels of salinity stress (EC 0, 0.5, 1, 1.5, … 3), which could indicate a limitation of this research. Furthermore, future studies could investigate the association between (un)treated wastewater and salinity levels, the use of wastewater from various sources to irrigate ornamental species, and ways of modifying irrigation scheduling when ornamental plants are irrigated with water of poor quality.

5. Conclusions

The morphological parameters and aesthetic value of zinnia and periwinkle were modified by different salinity stress levels. The zinnia cultivar used in this study was sensitive to even lower salinity stress levels and, therefore, should not be planted in areas with high soil salinity or when alternative waters with high salinity may be used for irrigation. The negative effects of salt on the aesthetic values of zinnia and periwinkle were also noted. As for periwinkle, a certain degree of tolerance of increased salt content was recorded, which in our study was up to 3 dS m−1. This allows the conclusion that periwinkle can potentially be utilized in freshwater landscape conservation.

Author Contributions

Conceptualization, M.M., J.Š. and A.K.; methodology, M.M. and A.K.; formal analysis, B.P. and A.B.; investigation, M.M. and J.Š.; data curation, D.B. and A.S.; writing—original draft preparation, M.M., A.K., J.Š., B.P., A.B., D.B. and A.S.; writing—review and editing, M.M., A.K., J.Š., B.P., A.B., D.B. and A.S. All authors have read and agreed to the published version of the manuscript.

Funding

This research received no external funding.

Conflicts of Interest

The authors declare no conflict of interest.

References

  1. Food and Agriculture Organization of the United Nations (FAO). AQUASTAT Database. 2012. Available online: http://www.fao.org/nr/aquastat (accessed on 20 December 2021).
  2. Food and Agriculture Organization of the United Nations (FAO). The Global Framework on Water Scarcity in Agriculture. 2018. Available online: https://www.fao.org/documents/card/en/c/8dd680fd-70d3-4725-8d9f-30f9a02455a0/ (accessed on 20 December 2021).
  3. Mancosu, N.; Snyder, R.L.; Kyriakakis, G.; Spano, D. Water Scarcity and Future Challenges for Food Production. Water 2015, 7, 975–992. [Google Scholar] [CrossRef]
  4. Boretti, A.; Rosa, L. Reassessing the projections of the World Water Development Report. NPJ Clean Water 2019, 2, 15. [Google Scholar] [CrossRef]
  5. Mukheibir, P. Water Access, Water Scarcity, and Climate Change. Environ. Manag. 2010, 45, 1027–1039. [Google Scholar] [CrossRef] [Green Version]
  6. Gosling, S.N.; Arnell, N.W. A global assessment of the impact of climate change on water scarcity. Clim. Change 2016, 134, 371–385. [Google Scholar] [CrossRef] [Green Version]
  7. Rey, D.; Holman, I.P.; Knox, J.W. Developing drought resilience in irrigated agriculture in the face of increasing water scarcity. Reg. Environ. Chang. 2017, 17, 1527–1540. [Google Scholar] [CrossRef] [PubMed] [Green Version]
  8. Dobson, B.; Coxon, G.; Freer, J.; Gavin, H.; Mortazavi-Naeini, M.; Hall, J.W. The spatial dynamics of droughts and water scarcity in England and Wales. Water Resour. Res. 2020, 56, e2020WR027187. [Google Scholar] [CrossRef]
  9. Munns, R. Comparative physiology of salt and water stress. Plant Cell Environ. 2002, 25, 239–250. [Google Scholar] [CrossRef]
  10. Oyiga, B.C.; Sharma, R.; Shen, J.; Baum, M.; Ogbonnaya, F.; Léon, J.; Ballvora, A. Identification and characterization of salt tolerance of wheat germplasm using a multivariable screening approach. J. Agron. Crop Sci. 2016, 202, 472–485. [Google Scholar] [CrossRef]
  11. Ravindran, K.C.; Venkatesan, K.; Balakrishnan, V.; Chellappan, K.P.; Balasubramanian, T. Restoration of saline land by halophytes for Indian soils. Soil Biol. Biochem. 2007, 39, 2661–2664. [Google Scholar] [CrossRef]
  12. Sarmoum, R.; Haid, S.; Biche, M.; Djazouli, Z.; Zebib, B.; Merah, O. Effect of Salinity and Water Stress on the Essential Oil Components of Rosemary (Rosmarinus officinalis L.). Agronomy 2019, 9, 214. [Google Scholar] [CrossRef] [Green Version]
  13. Abrar, M.M.; Saqib, M.; Abbas, G.; Atiq-ur-Rahman, M.; Mustafa, A.; Shah, S.A.A.; Mehmood, K.; Maitlo, A.A.; ul-Hassan, M.; Sun, N.; et al. Evaluating the Contribution of Growth, Physiological, and Ionic Components towards Salinity and Drought Stress Tolerance in Jatropha curcas. Plants 2020, 9, 1574. [Google Scholar] [CrossRef]
  14. Alvino, A.; Ferreira, M.I.F.R. Refining Irrigation Strategies in Horticultural Production. Horticulturae 2021, 7, 29. [Google Scholar] [CrossRef]
  15. Romero-Trigueros, C.; Gambín, J.M.B.; Nortes Tortosa, P.A.; Cabañero, J.J.A.; Nicolás, E. Isohydricity of Two Different Citrus Species under Deficit Irrigation and Reclaimed Water Conditions. Plants 2021, 10, 2121. [Google Scholar] [CrossRef] [PubMed]
  16. Acosta-Motos, J.R.; Ortuño, M.F.; Bernal-Vicente, A.; Diaz-Vivancos, P.; Sanchez-Blanco, M.J.; Hernandez, J.A. Plant Responses to Salt Stress: Adaptive Mechanisms. Agronomy 2017, 7, 18. [Google Scholar] [CrossRef] [Green Version]
  17. Roy, S.; Chowdhury, N. Salt Stress in Plants and Amelioration Strategies: A Critical Review. In Abiotic Stress in Plants; Fahad, S., Saud, S., Chen, Y., Wu, C., Wang, D., Eds.; Intech Open Limited: London, UK, 2020. [Google Scholar]
  18. Rahavi, S.M.; Kovalchuk, I. Changes in homologous recombination frequency in Arabidopsis thaliana plants exposed to stress depend on time of exposure during development and on duration of stress exposure. Physiol. Mol. Biol. Plants 2013, 19, 479–488. [Google Scholar] [CrossRef] [Green Version]
  19. Ma, Y.; Dias, M.C.; Freitas, H. Drought and Salinity Stress Responses and Microbe-Induced Tolerance in Plants. Front. Plant Sci. 2020, 11, 591911. [Google Scholar] [CrossRef] [PubMed]
  20. Shahid, M.A.; Sarkhosh, A.; Khan, N.; Balal, R.M.; Ali, S.; Rossi, L.; Gómez, C.; Mattson, N.; Nasim, W.; Garcia-Sanchez, F. Insights into the Physiological and Biochemical Impacts of Salt Stress on Plant Growth and Development. Agronomy 2020, 10, 938. [Google Scholar] [CrossRef]
  21. Hussain, S.C.; Xiaochuang, Z.; Chu, Z.; Lianfeng, K.; Maqsood, A.; Fiaz, S.; Zhang, J.; Jin, Q. Sodium chloride stress during early growth stages altered physiological and growth characteristics of rice. Chil. J. Agric. Res. 2018, 78, 183–197. [Google Scholar] [CrossRef]
  22. Bimurzayev, N.; Sari, H.; Kurunc, A.; Doganay, K.H.; Asmamaw, M. Effects of different salt sources and salinity levels on emergence and seedling growth of faba bean genotypes. Sci. Rep. 2021, 11, 18198. [Google Scholar] [CrossRef]
  23. Grieve, C.M. Review: Irrigation of floricultural and nursery crops with saline wastewaters. Isr. J. Plant Sci. 2011, 59, 187–196. [Google Scholar] [CrossRef]
  24. Valdez-Aguilar, L.A.; Grieve, C.M.; Poss, J. Salinity and Alkaline pH in Irrigation Water Affect Marigold Plants: I. Growth and Shoot Dry Weight Partitioning. Hortscience 2009, 44, 1719–1725. [Google Scholar] [CrossRef] [Green Version]
  25. Niu, G.; Rodriguez, D.S.; Wang, Y.T. Impact of Drought and Temperature on Growth and Leaf Gas Exchange of Six Bedding Plant Species Under Greenhouse Conditions. Hortscience 2006, 41, 1408–1411. [Google Scholar] [CrossRef]
  26. El-Nashar, Y.; Hassan, B.A. Effect of saline irrigation water levels on the growth of two Zinnia elegans L. cultivars. Sci. J. Flowers Ornam. Plants 2020, 7, 425–445. [Google Scholar] [CrossRef]
  27. Aydinsakir, K.; Tepe, A.; Buyuktas, D. Effects of saline irrigation water applications on quality characteristics of freesia grown in greenhouse. Akdeniz Üniversitesi Ziraat Fakültesi Derg. 2010, 23, 65–72. [Google Scholar]
  28. Carter, C.T.; Grieve, C.M. Growth and Nutrition of Two Cultivars of Zinnia elegans Under Saline Conditions. HortScience 2010, 45, 1058–1063. [Google Scholar] [CrossRef] [Green Version]
  29. Villarino, G.H.; Mattson, N.S. Assessing tolerance to sodium chloride salinity in fourteen floriculture species. HortTechnology 2011, 21, 539–545. [Google Scholar] [CrossRef] [Green Version]
  30. Sun, Y.; Niu, G.; Perez, C.; Pemberton, H.B.; Altland, J. Responses of Marigold Cultivars to Saline Water Irrigation. HortTechnology 2018, 28, 166–171. [Google Scholar] [CrossRef] [Green Version]
  31. Favali, M.; Muestti, R.; Benvenuti, S.; Bianchi, A.; Pressacco, L. Catharanthus roseus L. plants and explants infected with phytoplasmas: Alkaloid production and structural observations. Protoplasma 2004, 223, 45–51. [Google Scholar] [CrossRef] [PubMed]
  32. El-Sheikh, N.; Farouk, S.; Mohamed, Z.; Arafa, A. Growth, as well as Leaf and Stem Anatomy in Periwinkle Plant as Affected by Certain Biotic and Abiotic Elicitors. J. Plant Prod. 2019, 10, 283–291. [Google Scholar] [CrossRef] [Green Version]
  33. Cartmill, A.D.; Valdez-Aguilar, L.A.; Bryan, D.L.; Alarcón, A. Arbuscular mycorrhizal fungi enhance tolerance of vinca to high alkalinity in irrigation water. Sci. Hortic. 2008, 115, 275–284. [Google Scholar] [CrossRef]
  34. Toscano, S.; Romano, D. Morphological, Physiological, and Biochemical Responses of Zinnia to Drought Stress. Horticulturae 2021, 7, 362. [Google Scholar] [CrossRef]
  35. European Parliament and the Council of European Union. Directives on the Quality of Water Intended For Human Consumption. Available online: https://eur-lex.europa.eu/legal-content/EN/TXT/PDF/?uri=CELEX:32020L2184&from=ES (accessed on 2 January 2022).
  36. Ayers, R.S.; Westcot, D.W. Water Quality for Agriculture. FAO Irrigation and Drainage Paper. Available online: https://www.fao.org/3/t0234e/t0234e01.htm (accessed on 2 January 2022).
  37. Warsaw, A.L.; Fernandez, R.T.; Cregg, B.M.; Andresen, J.A. Container-grown Ornamental Plant Growth and Water Runoff Nutrient Content and Volume Under Four Irrigation Treatments. Hortscience 2009, 44, 1573–1580. [Google Scholar] [CrossRef] [Green Version]
  38. Pieczynski, M.; Marczewski, W.; Hennig, J.; Dolata, J.; Bielewicz, D.; Piontek, P.; Wyrzykowska, A.; Krusiewicz, D.; Strzelczyk-Zyta, D.; Konopka-Postupolska, D.; et al. Down-regulation of CBP80 gene expression as a strategy to engineer a drought-tolerant potato. Plant Biotechnol. J. 2013, 11, 459–469. [Google Scholar] [CrossRef] [PubMed]
  39. Heidari, Z.; Nazarideljou, M.J.; Danesh, Y.R.; Khezrinejad, N. Morphophysiological and Biochemical Responses of Zinnia elegans to Different Irrigation Regimes in Symbiosis with Glomus mosseae. Int. J. Hortic. Sci. 2016, 3, 19–32. [Google Scholar]
  40. Macherla, K.; McAvoy, R.J. The Effect of Salinity on the Growth and Nutrient Status of Zinnia Grown under Short- and Long-cycle Subirrigation Management. HortScience 2017, 52, 770–773. [Google Scholar] [CrossRef]
  41. Duan, L.; Sebastian, J.; Dinneny, J.R. Salt-stress regulation of root system growth and architecture in Arabidopsis seedlings. In Plant Cell Expansion; Humana Press: New York, NY, USA, 2015; pp. 105–122. [Google Scholar]
  42. Yasemin, S.; Değer, A.G.; Köksal, N. The Effects of Salt Stress in Zinnia (Zinnia sp.) Cultivars during Seed Germination and at the Early Stages of Seedling Growth. Turk. J. Agric. Res. 2020, 7, 253–265. [Google Scholar]
  43. Taiz, L.; Zeiger, E. Plant Physiology, 5th ed.; Sinauer Associates Inc.: Sunderland, MA, USA, 2009. [Google Scholar]
  44. Xiang, M.; Moss, J.Q.; Martin, D.L.; Su, K.; Dunn, B.L.; Wu, Y. Evaluating the Salinity Tolerance of Clonal-type Bermudagrass Cultivars and an Experimental Selection. HortScience 2017, 52, 185–191. [Google Scholar] [CrossRef] [Green Version]
  45. Sifers, S.I.; Beard, J.B. Comparative inter- and intraspecific leaf firing soil drying. Intl. Turfgrass Soc. Res. J. 2000, 9, 291–296. [Google Scholar]
  46. Escalona, A.; Salas-Sanjuán, M.C.; Santos, D.; Guzmán, M. The effect of water salinity on growth and ionic concentration and relation in plant tissues in Zinnia elegans and Tagetes erecta for use in urban landscasping. Itea-Inf. Tec. Econ. Agrar. 2014, 110, 325–334. [Google Scholar]
  47. Cai, X.; Niu, G.; Starman, T.; Hall, C. Response of six garden roses (Rosa × hybrida L.) to salt stress. Sci. Hortic. 2014, 168, 27–32. [Google Scholar] [CrossRef]
  48. Zapryanova, N.; Atanassova, B. Effects of Salt Stress on Growth and Flowering of Ornamental Annual Species. Biotechnol. Biotechnol. Equip. 2009, 23, 177–179. [Google Scholar] [CrossRef] [Green Version]
  49. Neves, A.L.R.; de Lacerda, C.F.; de Oliveira, A.C.; Sousa, C.H.C.; Oliveira, F.I.F.; Ribeiro, M.D.S.D.S. Quantitative and qualitative responses of Catharanthus roseus to salinity and biofertilizer. R. Bras. Eng. Agríc. Ambiental 2018, 22, 22–26. [Google Scholar] [CrossRef] [Green Version]
  50. Huang, Z.T.; Cox, D.A. Salinity effects on annual bedding plants in a peat-perlite medium and solution culture. J. Plant Nutr. 1988, 11, 145–159. [Google Scholar] [CrossRef]
  51. Römheld, V. The chlorosis paradox: Fe inactivation as a secondary event in chlorotic leaves of grapevine. J. Plant Nutr. 2000, 23, 1629–1643. [Google Scholar] [CrossRef]
  52. Lea-Cox, J.D.; Syvertsen, J.P. Salinity Reduces Water Use and Nitrate-N-use Efficiency of Citrus. Ann. Bot. 1993, 72, 47–54. [Google Scholar] [CrossRef]
  53. Gholipoor, M.; Soltani, A.; Shekari, F. Effects of salinity on water use efficiency and its components in chickpea (Cicer arietinum L.). Acta Agron. Hung. 2002, 50, 127–134. [Google Scholar] [CrossRef] [Green Version]
  54. Yang, H.; Shukla, M.K.; Mao, X.; Kang, S.; Du, T. Interactive Regimes of Reduced Irrigation and Salt Stress Depressed Tomato Water Use Efficiency at Leaf and Plant Scales by Affecting Leaf Physiology and Stem Sap Flow. Front. Plant Sci. 2009, 10, 160. [Google Scholar] [CrossRef]
  55. Polas, M.A.S.; Sakil, M.A.; Tahjib-Ul-Arif, M.; Hossain, M.A. Effect of salinity on osmolytes and relative water content of selected rice genotypes. Trop. Plant Res. 2019, 5, 227–232. [Google Scholar] [CrossRef]
  56. Meguekam, T.L.; Moualeu, D.P.; Taffouo, V.D.; Stützel, H. Changes in plant growth, leaf relative water content and physiological traits in response to salt stress in peanut (Arachis hypogaea L.) varieties. Not. Bot. Horti Agrobot. Cluj-Napoca 2021, 49, 12049. [Google Scholar] [CrossRef]
  57. He, J.; Ng, O.W.J.; Qin, L. Salinity and Salt-Priming Impact on Growth, Photosynthetic Performance, and Nutritional Quality of Edible Mesembryanthemum crystallinum L. Plants 2022, 11, 332. [Google Scholar] [CrossRef]
  58. Talei, D.; Kadir, M.A.; Yusop, M.K.; Valdiani, A.; Abdullah, M.P. Growth indices and salinity tolerance threshold in a medicinal plant Andrographis paniculata Nees. J. Med. Plant Res. 2013, 7, 104–110. [Google Scholar]
  59. Sadaqat Shah, S.; Li, Z.; Yan, H.; Shi, L.; Zhou, B. Comparative Study of the Effects of Salinity on Growth, Gas Exchange, N Accumulation and Stable Isotope Signatures of Forage Oat (Avena sativa L.) Genotypes. Plants 2020, 9, 1025. [Google Scholar] [CrossRef] [PubMed]
Figure 1. Irrigation rates (L/pot/day) for zinnia and periwinkle.
Water 14 01066 g001
Figure 2. Zinnia correlation between salinity and plant height.
Water 14 01066 g002
Figure 3. Zinnia correlation between salinity and leaf number.
Water 14 01066 g003
Figure 4. Zinnia mortality (%).
Water 14 01066 g004
Figure 5. Periwinkle mortality (%).
Water 14 01066 g005
Table 1. Indicator and chemical parameters of irrigation water.
Temp.TurbidityColorOdorEC
Unit°CNTUPt/Co
Range22–25420 2.5 dS m−1
Value241.06<3-0.63
ParameterpHChloriteAmmoniumNitriteNitrate
MAC6.5–9.50.25 mg/L0.5 mg NH4/L0.50 mg NO2/L50 mg NO3/L
Value7.730.13<0.01<0.0011.32
ParameterIronManganeseAluminiumPhosphateSulphateTDS
MAC200 µg/L50 µg/L200 µg/L300 µg P/L250 mg SO4/L<450 mg/L
Value<119508.4720.2349.6
MAC = maximum allowable concentration; TDS = total dissolved slats.
Table 2. Effect of salinity stress treatment on zinnia flower number (n), plant height (cm), branch number (n), leaf number (n), total fresh biomass (g/plant), total dry biomass (g/plant), and root length (cm).
Salinity LevelFlower NumberPlant HeightBranch NumberLeaf NumberTotal Fresh BiomassTotal Dry BiomassRoot Length
ncmnnggcm
s0521.0244511.12.84.73
s1419.2943910.92.73.98
s2318.843327.62.12.12
s3016.512255.31.31.69
LSD0.010.7934.8190.2988.6141.2640.3511.132
LSD0.051.0826.2480.46111.5442.0850.4981.936
Fvalue36.242 **2.692 n.s.49.318 **6.748 **7.358 **39.252 **6.698 **
s0 = control; s1 = 3 dS m−1; s2 = 4.5 dS m−1; s3 = 6 dS m−1; ** = p < 0.01; n.s. = non-significant.
Table 3. Effect of salinity stress treatment on periwinkle flower number (n), plant height (cm), branch number (n), leaf number (n), total fresh biomass (g/plant), total dry biomass (g/plant), and root length (cm).
Salinity LevelFlower NumberPlant HeightBranch NumberLeaf NumberTotal Fresh Biomass Total Dry BiomassRoot Length
ncmnnggcm
s02865.229.26294.527.412.815.35
s13165.3811.84306.828.363.316.21
s22452.317.31261.024.352.411.02
s31843.164.01174.322.801.810.76
LSD0.016.9922.344.84201.31.910.4132.73
LSD0.055.7814.923.52118.91.450.5641.76
Fvalue39.584 **3.39 *5.361 **6.45 *5.648 **42.264 **5.683 **
s0 = control; s1 = 3 dS m−1; s2 = 4.5 dS m−1; s3 = 6 dS m−1; * = p < 0.05; ** = p < 0.01; n.s. = non-significant.
Table 4. Relative water content (RWC, %) and water use efficiency (WUE, g/L) and growth index (GI, cm) of zinnia and periwinkle with different salinity treatments (s0 = control; s1 = 3 dS/m; s2 = 4.5 dS/m; s3 = 6 dS/m).
Salinity StressRWC (%)WUE (g/L)GI (cm)
ZinniaPeriwinkleZinniaPeriwinkleZinnia Periwinkle
s074.275.46.0714.1327.0138.92
s169.874.95.9614.6220.6539.41
s268.768.84.1512.5516.3226.73
s352.459.32.9011.7512.1219.18
Table 5. Correlation coefficients between tested zinnia variables (significant correlations are marked in bold, p < 0.05, N = 80).
Flower NumberPlant HeightBranch NumberLeaf NumberTotal Fresh Biomass Total Dry Biomass
FN-
PH0.97-
BN0.960.91-
LN0.960.970.95-
TFB0.950.900.990.96-
TDB0.980.940.990.960.98-
RL0.880.880.920.970.950.92
FN = flower number; PH = plant height; BN = branch number; LN = leaf number; TFB = total fresh biomass; TDB = total dry biomass; RL = root length.
Table 6. Correlation coefficients between tested periwinkle variables (significant correlations are marked in bold, p < 0.05, N = 80).
Flower NumberPlant HeightBranch NumberLeaf NumberTotal Fresh Biomass Total Dry Biomass
FN-
PH0.97-
BN0.990.94-
LN0.970.950.95-
TFB0.970.980.960.92-
TDB0.990.940.990.940.97-
RL0.910.940.900.820.970.91
FN = flower number; PH = plant height; BN = branch number; LN = leaf number; TFB = total fresh biomass; TDB = total dry biomass; RL = root length.
Publisher’s Note: MDPI stays neutral with regard to jurisdictional claims in published maps and institutional affiliations.

