
Investigating the Linkage between Extreme Rainstorms and Concurrent Synoptic Features: A Case Study in Henan, Central China


1
Institute of Natural Resource Owner’s Equity, Chinese Academy of Natural Resources Economics, Beijing 101149, China
2
Harvard Medical School, Harvard University, Cambridge, MA 02138, USA
3
School of Civil and Environmental Engineering, University of New South Wales, Sydney, NSW 2052, Australia
4
State Key Laboratory of Hydrology-Water Resources and Hydraulic Engineering, Hohai University, Nanjing 210098, China
5
CMA-HHU Joint Laboratory for Hydrometeorological Studies, Hohai University, Nanjing 210098, China
6
College of Hydrology and Water Resources, Hohai University, Nanjing 210098, China
*
Author to whom correspondence should be addressed.
†
These authors contributed equally to this work.
Water 2022, 14(7), 1065; https://doi.org/10.3390/w14071065
Submission received: 28 February 2022
/
Revised: 20 March 2022
/
Accepted: 26 March 2022
/
Published: 28 March 2022
(This article belongs to the Special Issue Statistics in Hydrology)
Abstract
:Extraordinary floods are linked with heavy rainstorm systems. Among various systems, their synoptic features can be quite different. The understanding of extreme rainstorms by their causative processes may assist in flood frequency analysis and support the evaluation of any changes in flood occurrence and magnitudes. This paper aims to identify the most dominant meteorological factors for extreme rainstorms, using the ERA5 hourly reanalysis dataset in Henan, central China as a case study. Past 72 h extreme precipitation events are investigated, and six potential factors are considered in this study, including precipitable water (PW), the average temperature (Tavg) of and the temperature difference (Tdiff) between the value at 850 hPa and 500 hPa, relative humidity (RH), convective available potential energy (CAPE), and vertical wind velocity (Wind). The drivers of each event and the dominant factor at a given location are identified using the proposed metrics based on the cumulative distribution function (CDF). In Henan, central China, Wind and PW are dominant factors in summer, while CAPE and Wind are highly related factors in winter. For Zhengzhou city particularly, Wind is the key driver for summer extreme rainstorms, while CAPE plays a key role in winter extreme precipitation events. It indicates that the strong transport of water vapor in summer and atmospheric instability in winter should receive more attention from the managers and planners of water resources. On the contrary, temperature-related factors have the least contribution to the occurrence of extreme events in the study area. The analysis of dominant factors can provide insights for further flood estimations and forecasts.
1. Introduction
According to the IPCC Sixth Assessment Report, global warming will lead to the increase of extreme weather events; for example, the increase of extremely hot days and heatwaves is very likely to occur on almost all lands, and extreme precipitation magnitude and frequency are very likely to rise in many areas [1]. Extreme precipitation events have a very strong destructive effect. For instance, on 17–21 July 2021, an extremely heavy rainstorm hit Zhengzhou city in Henan, central China. The whole city was flooded, the traffic system was paralyzed, and power was interrupted for more than weeks. The estimated economic loss exceeded CNY 120 billion, with hundreds of lives lost in the end. Extraordinary floods are linked with heavy rainstorm systems, and their synoptic features differ from each other. Therefore, the understanding of heavy rainstorm floods by their causative processes may assist in flood frequency analysis and support the evaluation of any changes in flood occurrence and magnitudes [2].
The method of using numerical weather prediction (NWP) models to simulate the physical process of storm formation and estimate design rainfalls can be found in the National Research Council [3]. This approach links atmospheric processes with rainfall in a quantitative way. Abbs [4] investigated and estimated the probable maximum precipitation (PMP) with an NWP model, and the key message from this study and other studies [5,6] is that the linear assumption between precipitation and available moisture (i.e., precipitable water) of conventional PMP estimates [7] was not always valid. Recently, some researchers used forecasts from NWP models or regional climate models (RCMs) to estimate PMP and pointed out that climate change may affect the estimates of PMPs [8,9,10,11,12,13,14]. Other studies applied NWP models to explore the cause of specific extreme precipitation events, particularly in urban areas, such as Mumbai, India, in 2005 [15]; Nashville, Tennessee, the United States, in 2010 [16]; Beijing, China, in July 2012 [17]; Guangzhou, China, in July 2017 [18]; Istanbul, Turkey, in 2017 [19]; North-Rhine Westphalia and adjacent Rhineland-Palatinate, Germany, in 2021 [20]; and Henan, China, in July 2021 [21]. Furthermore, some studies have systematically assessed the relationship between several atmospheric variables (e.g., moisture, wind convergence, and wind vertical velocity) and convective rainfall state [22], peak rainfall intensity [23], or sustained rainfall deficit [24,25]. These studies provided a systematic analysis of the relationship between extreme precipitation and meteorological factors, but most of them only investigated their qualitative relationship for specific events at a given location and did not take enough account of the spatial patterns.
The analysis of spatial patterns necessitates the proper method and high-resolution data. Chen and Hossain [10] investigated the concurrent synoptic features for the extreme rainstorms over the continental United States at a coarse spatio-temporal scale using regional (NARR) and global (ERA-Interim) reanalysis products, which indicated the usefulness of atmospheric reanalysis products and provided a practicable way to explore the spatial variations of the relation between atmosphere variables and extreme rainstorms. Recently, a new generation of ERA (ERA5) data was released, providing hourly estimates of a mass of atmospheric, land, and oceanic climate variables with 30 km grid resolution [26]. Based on this dataset, the relations can be evaluated at a high spatio-temporal resolution, especially over a localized region. Therefore, this paper applies the method of Chen and Hossain [10] and ERA5 data to analyze the relations between the meteorological factors and extreme rainfall events quantitively and investigates the main factors influencing rainstorms in Henan, central China.
While studies on extreme rainfall events have mostly focused on a specific location with historical observations, this study takes advantage of a high spatial-temporal resolution data–ERA5 to analyse the spatial patterns of the key driver for the extreme rainfall and explore the pattern variations in different seasons. The results can provide a more systematic and deeper understanding of the synoptic causes of extreme precipitation, which helps to identify the relevant mechanisms from a regional perspective and improve the forecast accuracy of the extreme rainfall.
The paper is organized as follows: Section 2 introduces the study area, ERA5 reanalysis data, and the diagnosis factors used in this study. Section 3 presents the methods to identify the driver of an extreme event and derive the domain factor at a demo location. Section 4 shows the analysis results, which are the spatial distributions of the dominant factors on extreme rainstorms in the entire period or different seasons from 1981 to 2021. Conclusions are summarized in Section 5.
2. Study Area and Dataset
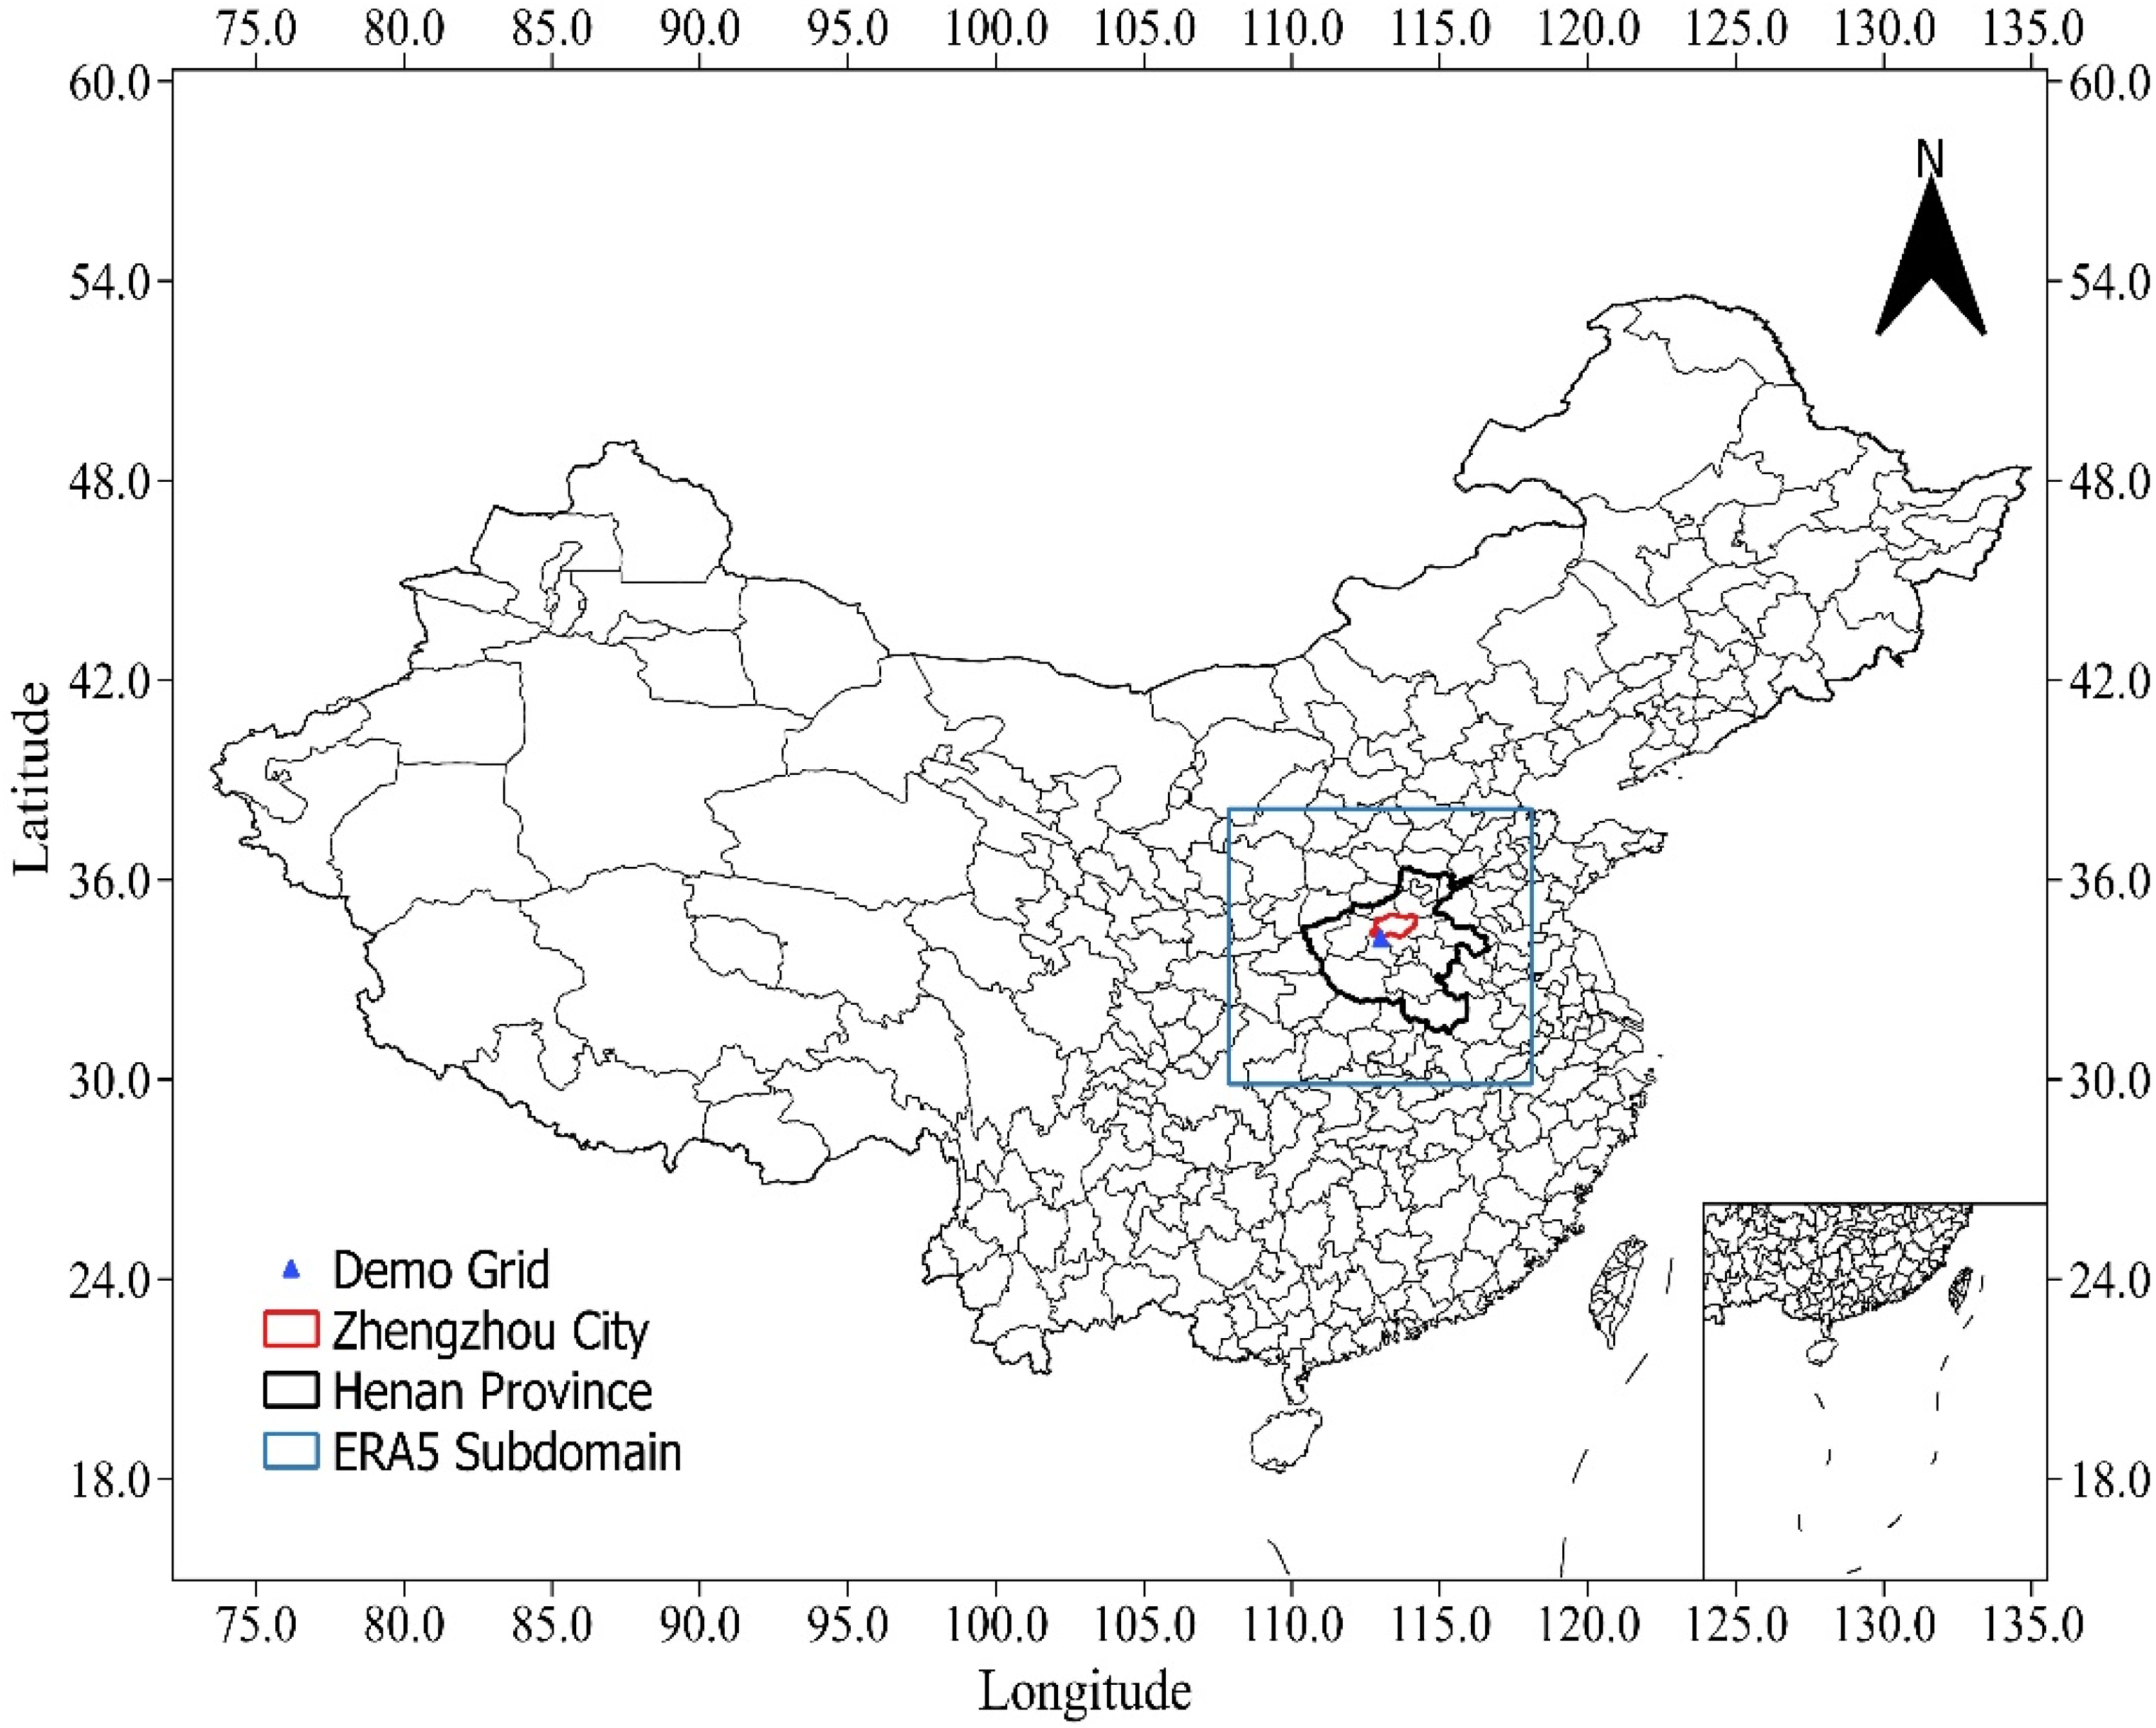
Henan province is located in the central part of China, as shown in Figure 1. This region experienced a severe flood caused by extraordinary heavy rainfall in 1975 [27], and it was hit by another extreme rainstorm recently on 18–22 July 2021. On 20 July 2021, the daily rainfall and hourly rainfall of many national meteorological observatories in Zhengzhou city (represented by red polygon in Figure 1) exceeded the historical largest value since the meteorological record began [21]. In Henan province, more than 65% of the precipitation falls in summer, and most of them are short-duration heavy precipitation. This is also the feature of most watersheds in China. Therefore, this area can be regarded as a classic example to investigate the atmosphere characteristics of extreme storm events in China.
This study applies ERA5 data to implement the investigation. ERA5 data are the latest generation of ECMWF global reanalysis product. From ERA5 data, hourly precipitation estimates, and six atmospheric variables, including precipitable water (PW), the temperature at 850 hPa and 500 hPa (T850 and T500), relative humidity (RH), convective available potential energy (CAPE), and vertical wind velocity (Wind) at 700 hPa are obtained. They cover the period of 1981–2021 and the region represented by a blue box in Figure 1. Average temperature ( ) and temperature difference () are computed based on the temperature at two different pressure levels. In the end, CAPE, PW, Wind, RH, Tavg, and Tdiff are considered as potential meteorological factors in this study, and these variables are often used in extreme weather events [10,22,28].
3. Methodology
In order to find the dominant meteorological factor at a given location, we first needed to identify the driver for each extreme event. The largest 50 rainfall events with a duration of 72 h (i.e., 3 days) from 1981 to 2021 were extracted and used for analysis. Once drivers of all 50 events were identified, the percentage of extreme events that are linked to each driver variable was calculated, and the meteorological variable with the greatest percentage was defined as the dominant factor at the specific location. The following subsections will introduce the metrics used to identify the driver of each extreme event and the dominant factor of a certain region. The details are explained using the extracted extreme events from ERA5 data at a demo grid near Zhengzhou city (the blue triangle in Figure 1).
3.1. Extraction of Extreme Events
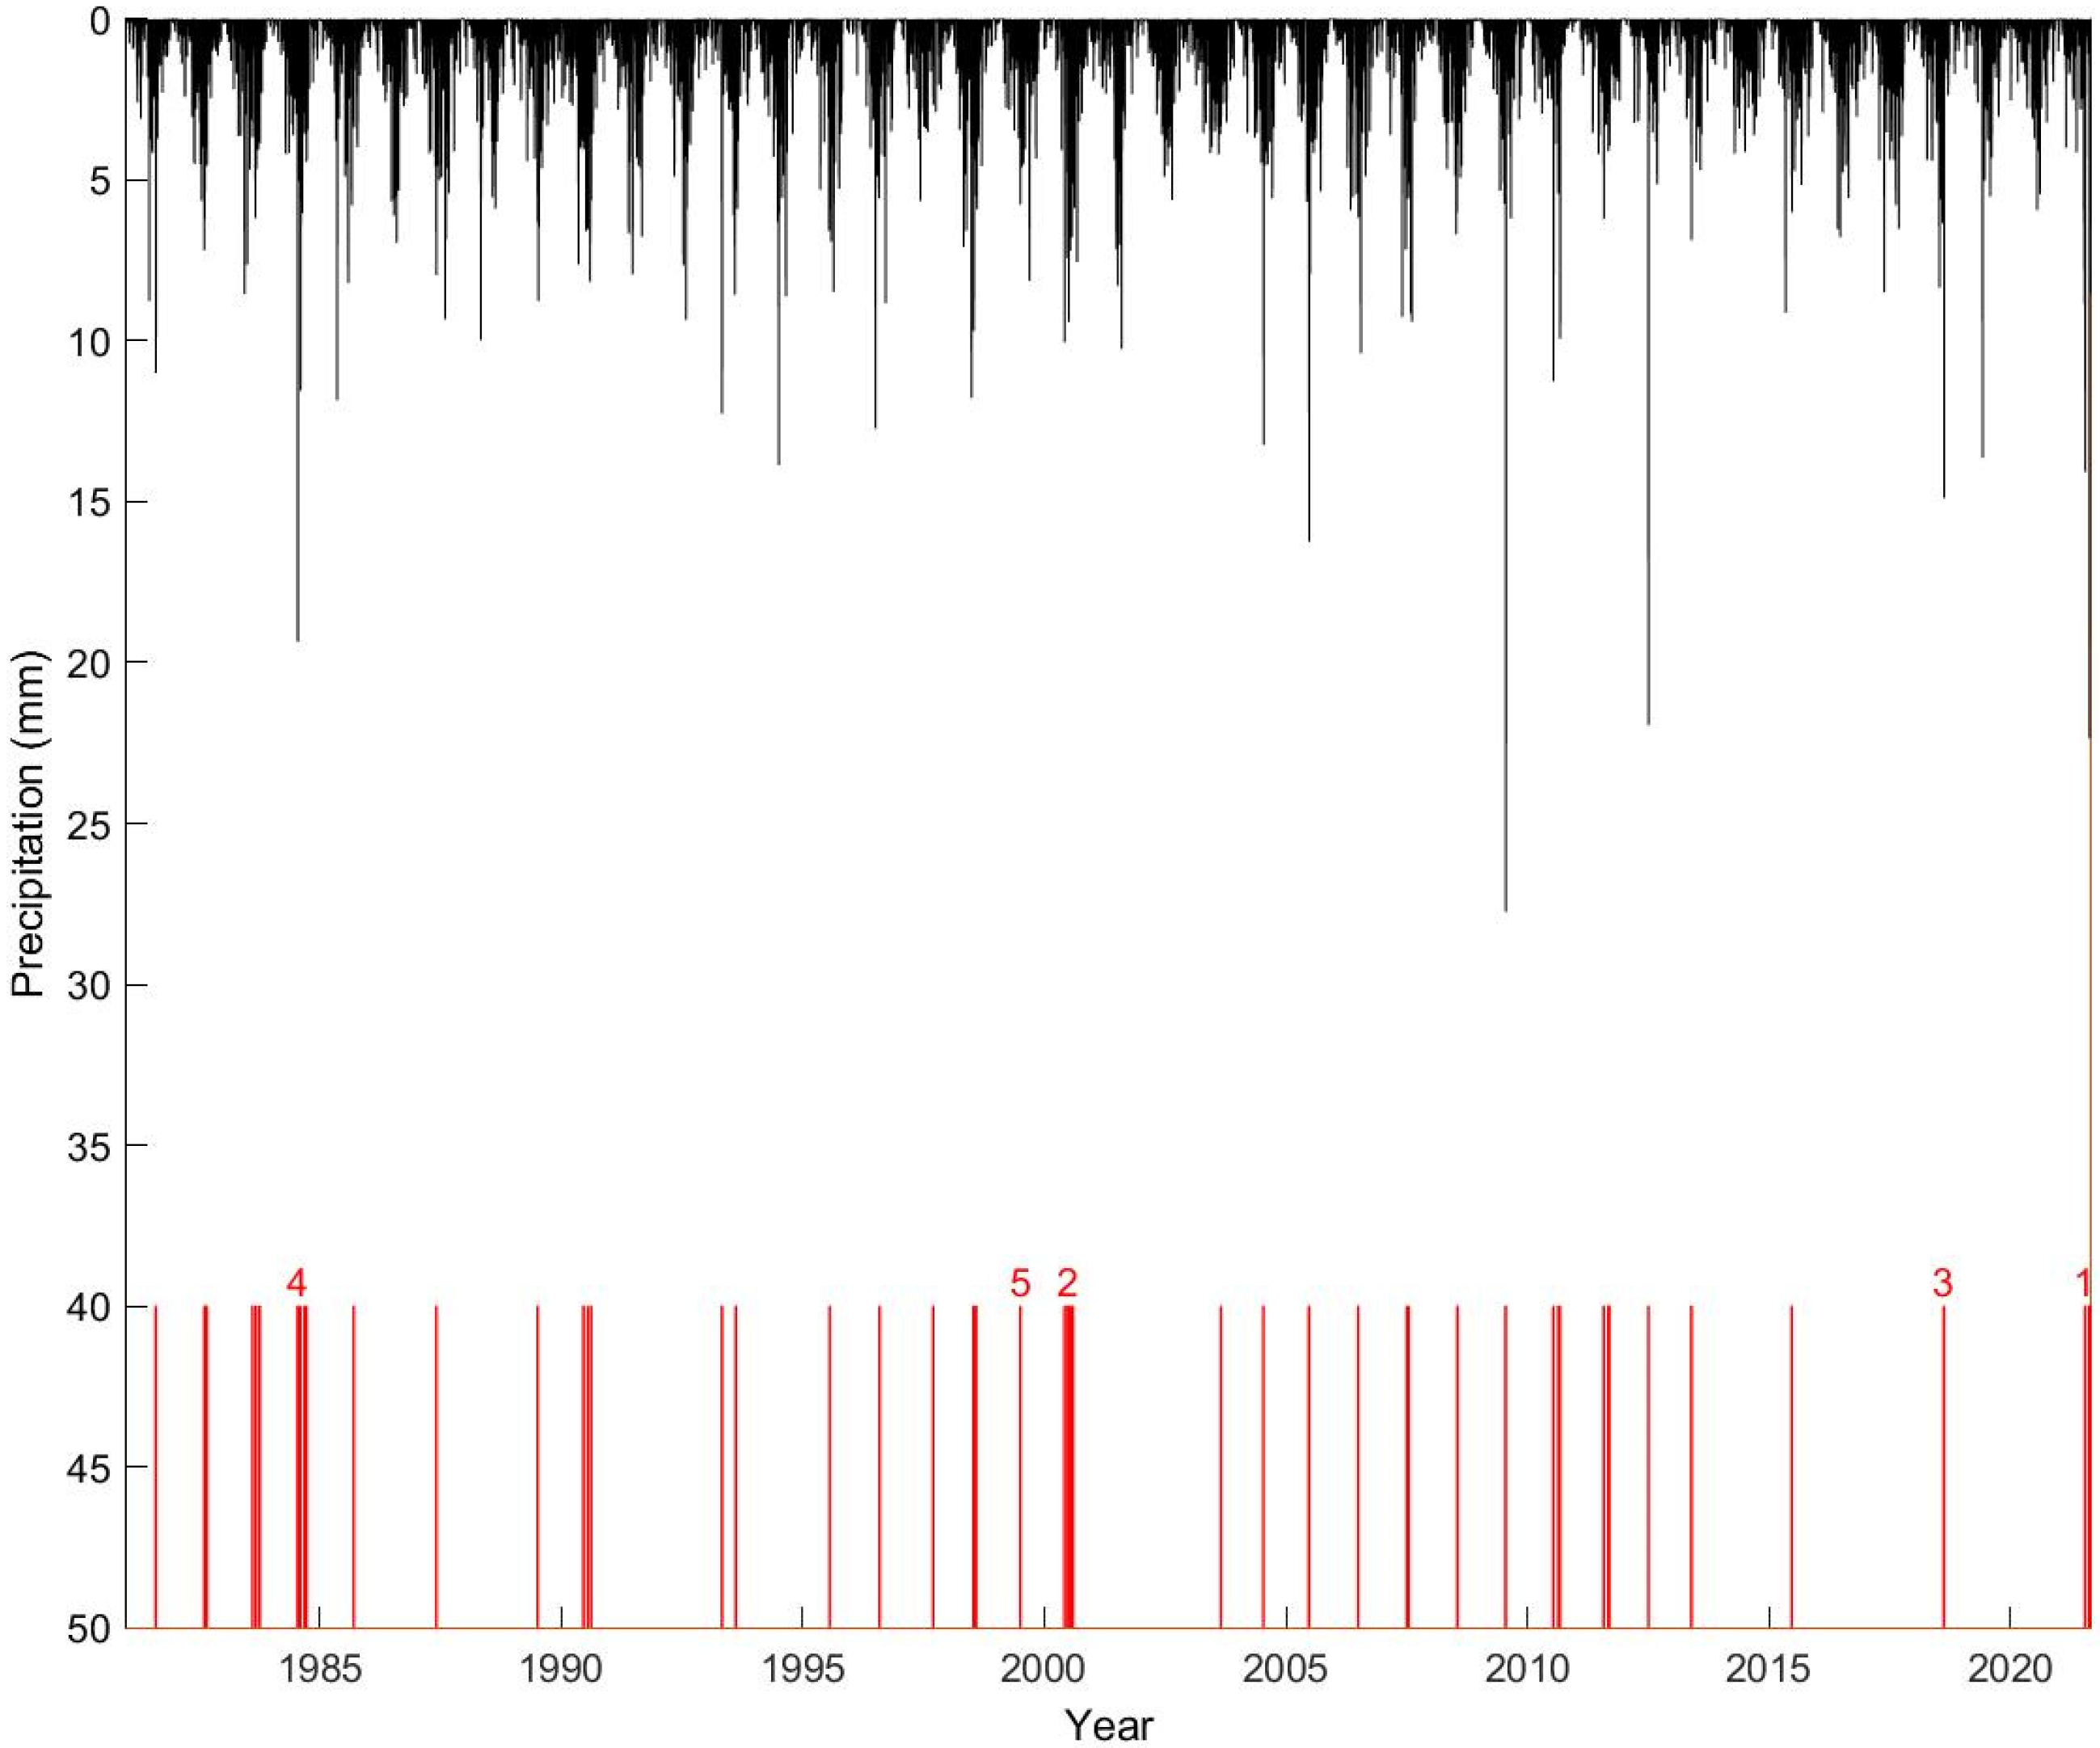
Analyzing the hourly precipitation data in the entire historic period at a demo grid, the 50 extreme events corresponding to the first 50 largest 72 h accumulated precipitation were selected. Figure 2 demonstrates the time series of precipitation (black line) and the selected extreme events. Each red bar represents one extreme event, while the order of the five largest events is given by a red number. The start time of each event and their accumulated precipitation amount is listed in Table 1.
It should be noted that the rainfall amount in this grid is underestimated by ERA5. For instance, on 20 July 2021, according to the observation data, the highest hourly rainfall in Zhengzhou city is over 200 mm, but in the ERA5 data, the value in this grid is only 22.4 mm. Some studies focusing on the post-processing of the rainfall data [29,30,31,32] may help to deal with this underestimation problem, but this study still implements the analysis on the raw ERA5 data without treatment. If this method is implemented on the more precise observations or post-processing data, the results might be different, but the difference will not be significant. The extreme event is the definition for the relative relationship and the absolute value will not influence the probability of event occurrence. Furthermore, although the total rainfall amount is underestimated, the ERA5 product correctly simulates the timing of the Zhengzhou extreme event beginning on 18 July 2021, which ensures the correct duration of the extreme events.
3.2. Driver Identification of an Extreme Event
The concurrence between an extreme synoptic condition and an extreme precipitation event can be quantified by a metric based on the cumulative distribution function (CDF) of the hourly values in the entire period. The proposed metric M for an atmospheric variable i and a storm event j is defined as follows:
where is the hourly value of atmospheric variable i (i represents CAPE, PW, Wind, RH, Tavg, and Tdiff, respectively, in this study) during the 72 h of the identified storm event j. is the value of the atmospheric variable i corresponding to the CDF of ( 0.95 is adopted in the study), which can be regarded as the threshold of the extreme condition. For each specific event, the percentage of the atmospheric variable i reaching the extreme condition () can be calculated. If the percentage exceeds ( 15% is adopted in the study), representing that the extreme condition maintains over a certain duration (), then the atmospheric variable i can be identified as the driver of the extreme event j, and its value of metric M is 1.
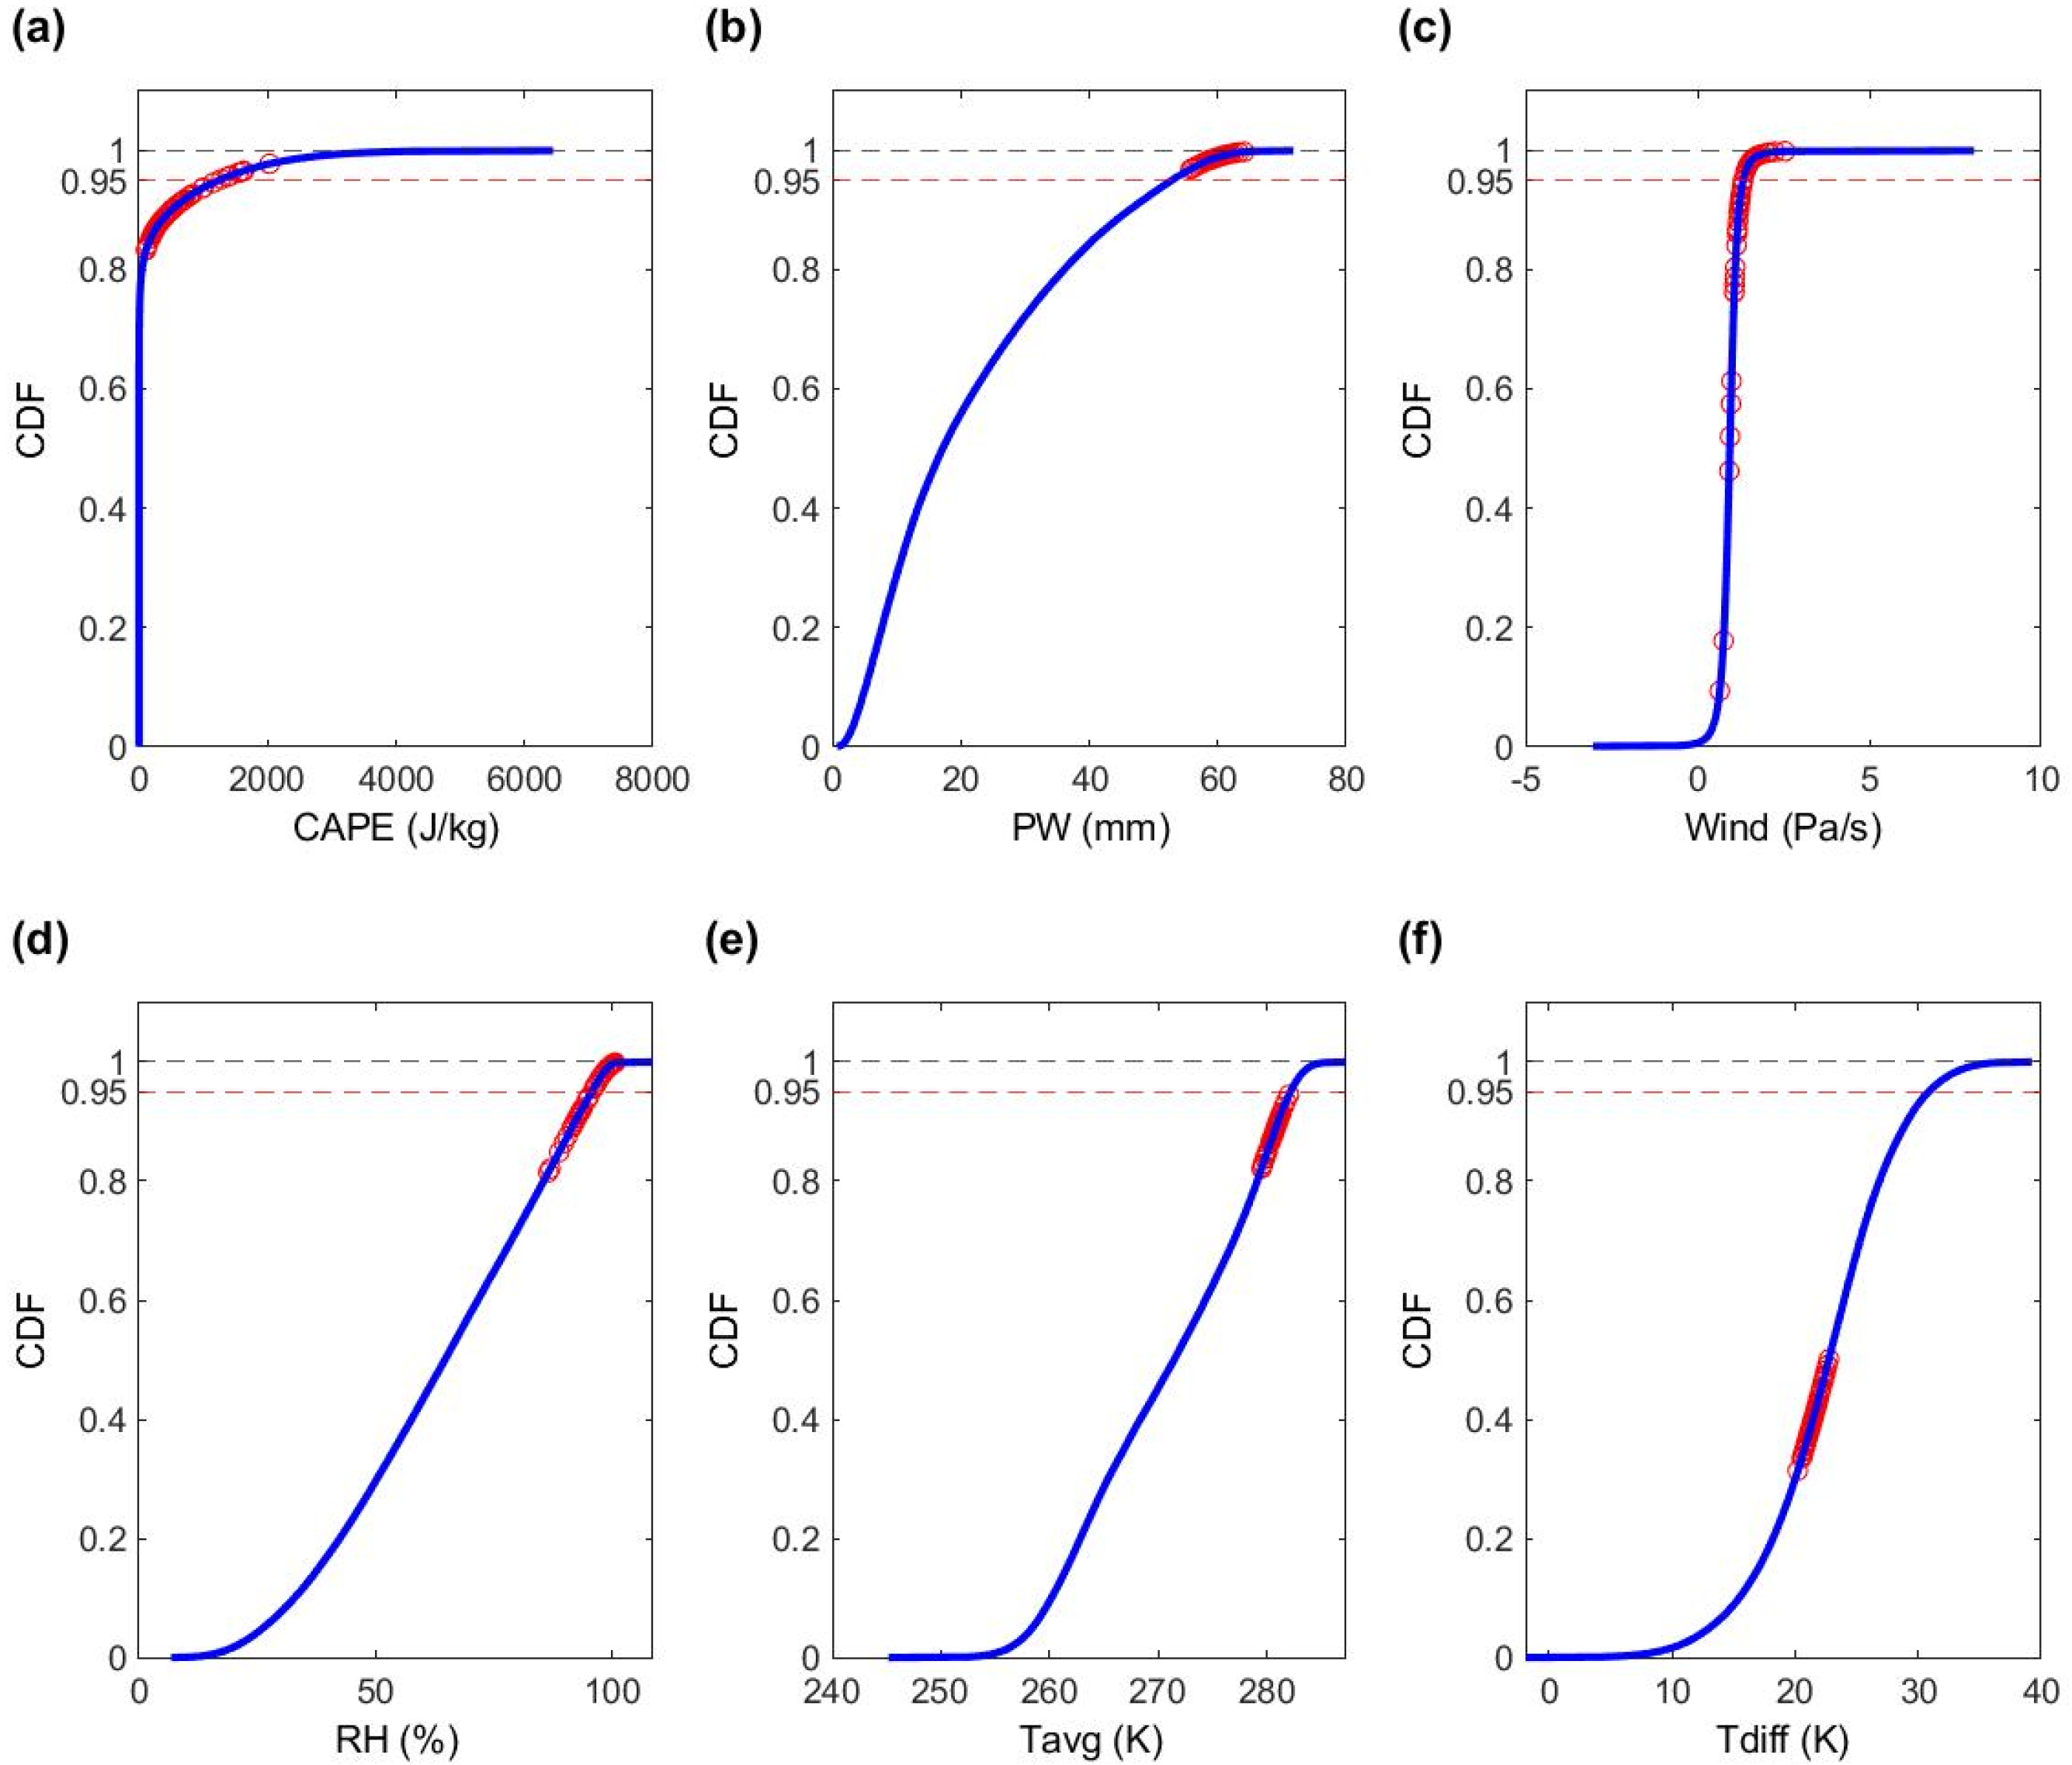
Taking the first largest event as an example, Figure 3 presents the cumulative probabilities of all the values (blue lines) and the cumulative probabilities of the values in the first largest event (red circles) for each atmospheric variable at the demo grid. It clearly shows that some values of CAPE, PW, Wind, and RH meet the extreme condition (CDF of 95%, represented by a horizontal red dashed line), and the exceeding percentages are 10%, 100%, 59%, and 67%, repressively. According to , PW, Wind, and RH are regarded as the drivers of the first largest event, and their M values in Table 1 are 1.
3.3. Dominant Factor Analysis at a Given Location
Once the driver for each extreme precipitation event is identified by the metric M, the dominant factor, F, is defined as the driver with the largest percentage of the extreme events that are related to the following:
where N is the total number of extreme events investigated (N = 50 in this study). The 50 largest events at the demo grid are shown in Table 1, including their starting time, accumulated precipitation, and associated meteorological drivers. In summary, there are 8, 40, 45, 37, 8, and 1 events related to CAPE, PW, Wind, RH, Tavg, and Tdiff, respectively, and the percentage of the extreme event (R) is 16%, 80%, 90%, 74%, 16%, and 2%, respectively. Therefore, Wind with the maximum R = 90% is regarded as the dominant factor at the demo grid.
The above processes demonstrate how the dominant factor at one specific grid is derived. In the following sections, we will show the spatial variation of dominant factors when extreme precipitation events are taken from the entire period or different seasons.
4. Results and Discussions
4.1. Spatial Patterns of the Dominant Factor in the Entire Period
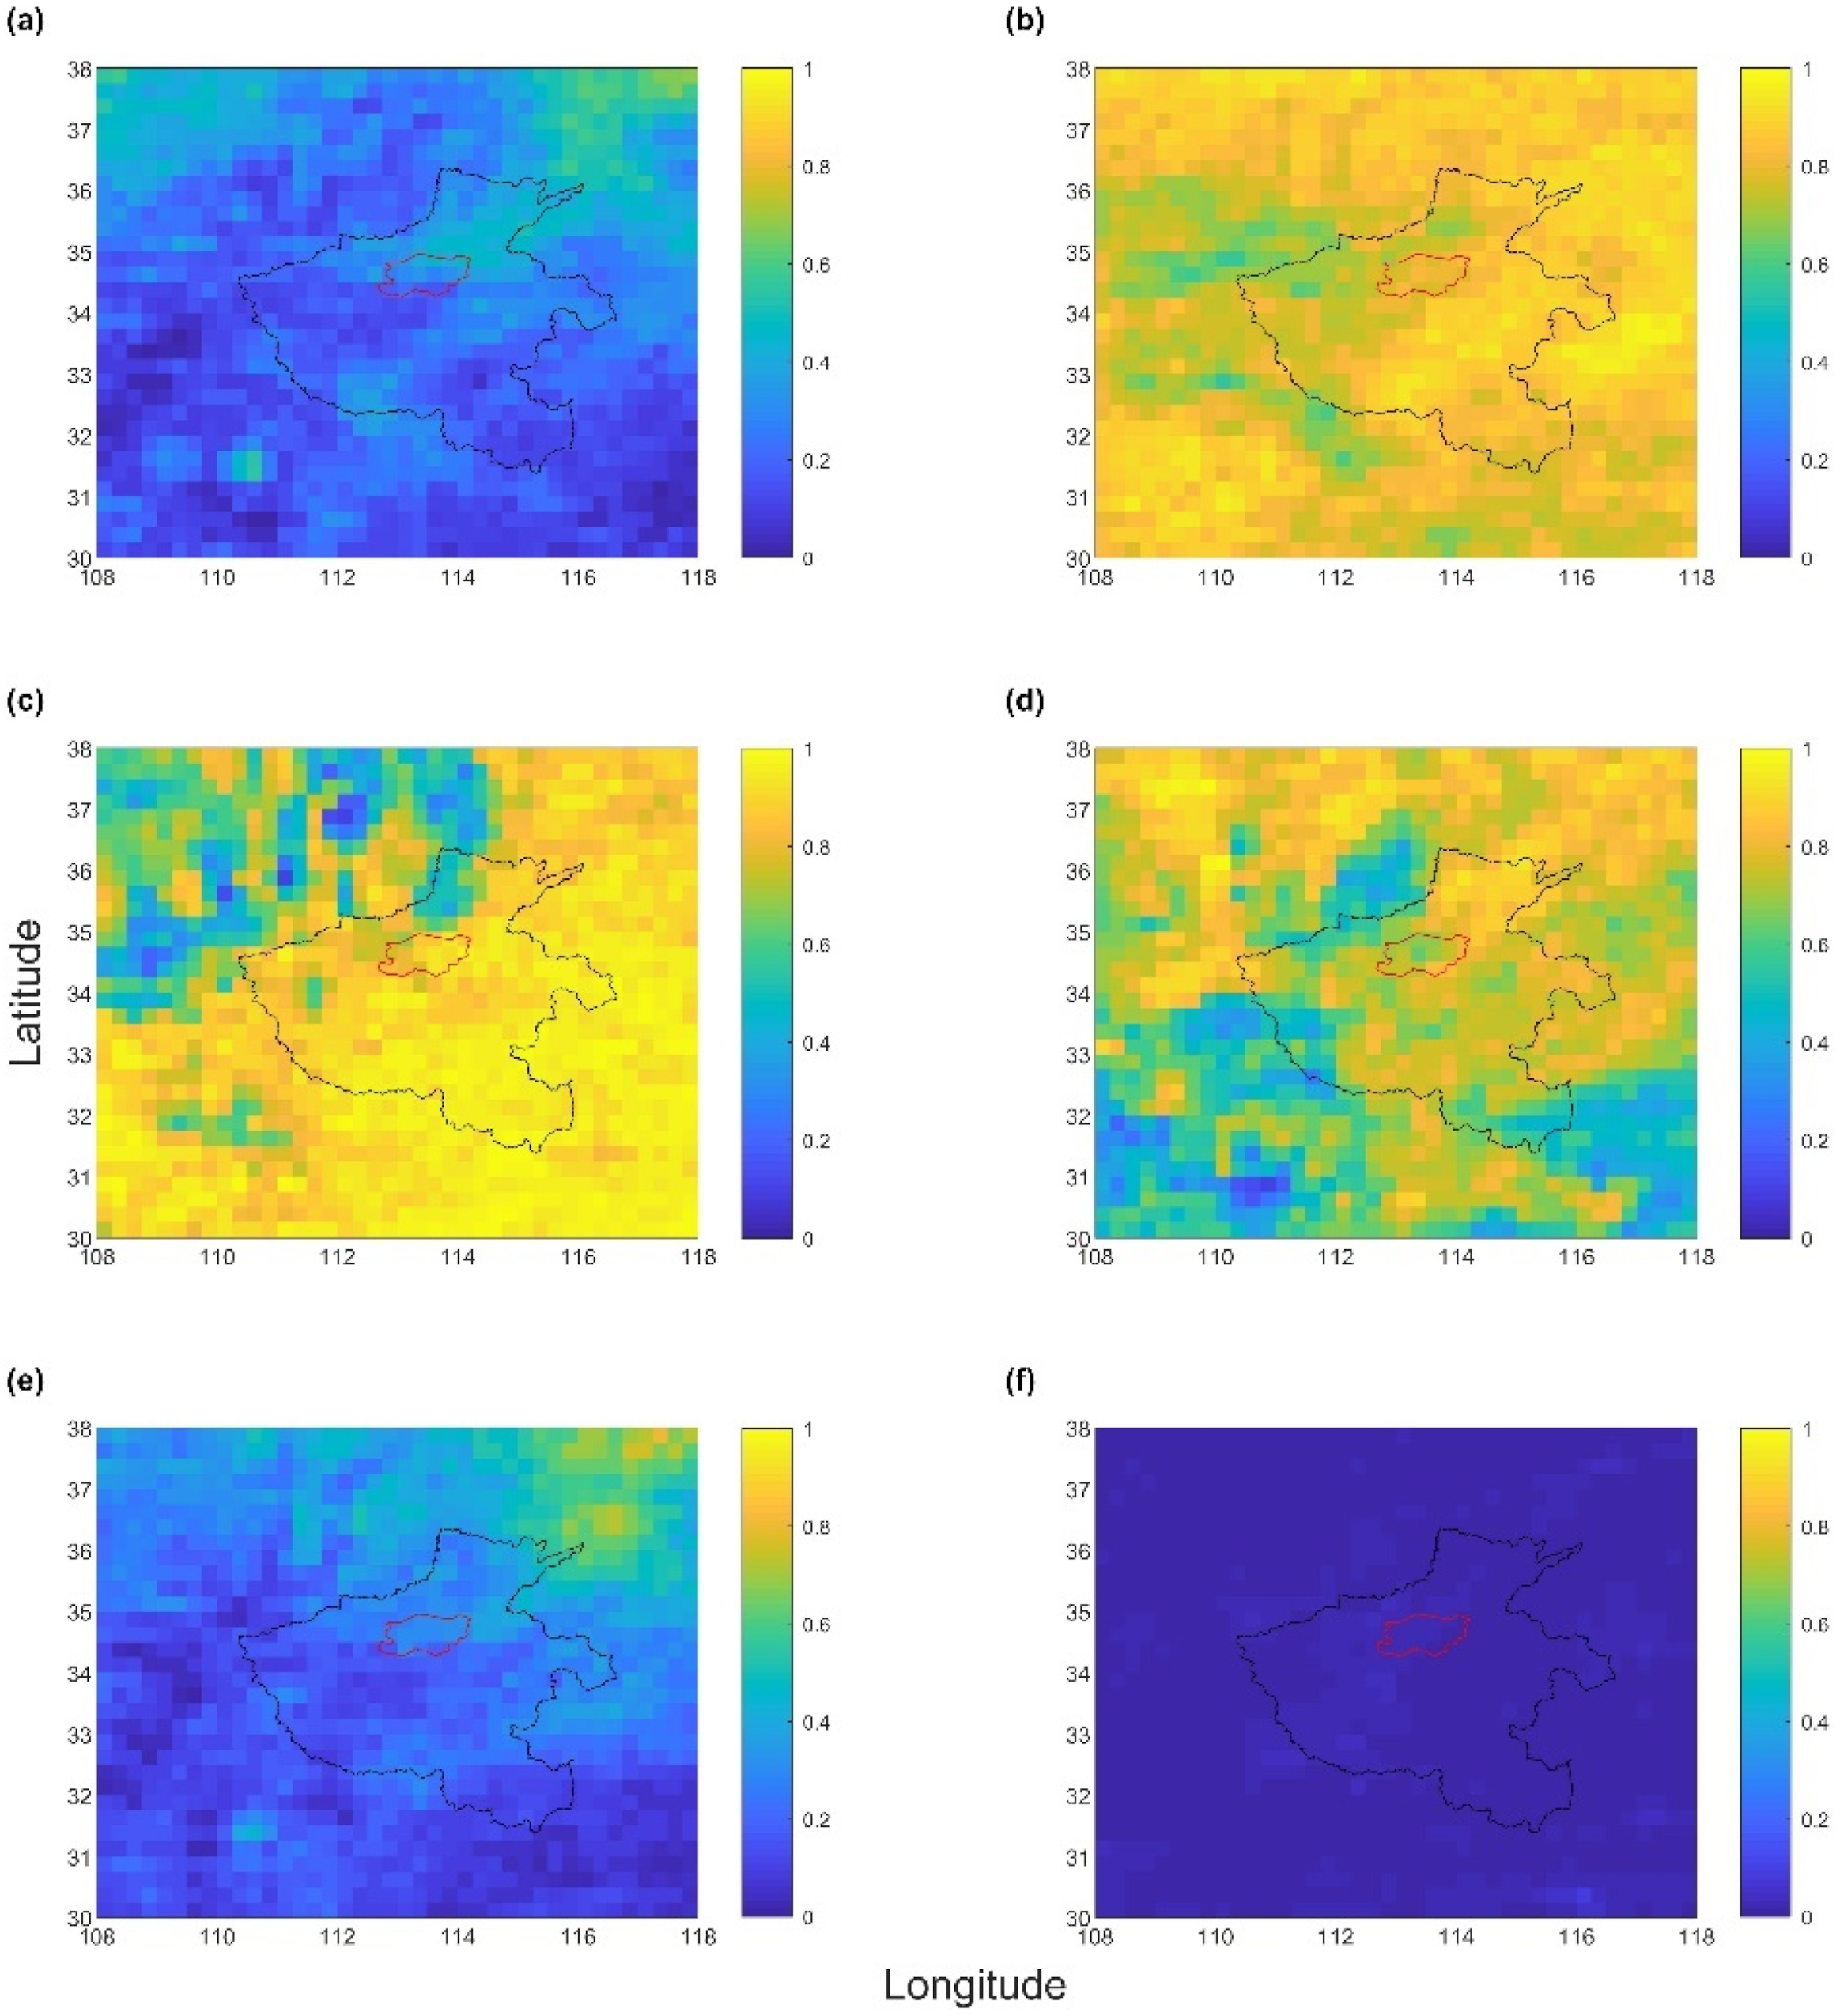
As demonstrated in the method section, in order to obtain the dominant factor for each location, we needed to find drivers for each event and calculate the percentage of the extreme events that are related to the corresponding driver. Figure 4 presents the percentage of extreme events that are related to extreme atmospheric variables across the Henan province. It is clearly shown that PW, Wind, and RH are the most common drivers for extreme precipitation events in Henan (black polygon), while CAPE and Tavg are relatively less. There is no obvious link between Tdiff and the occurrence of extreme precipitation events. PW is the indicator of available moisture in the system, mainly affected by Tavg and RH. Figure 4 demonstrates that PW and RH have a close spatial pattern and play a much more significant role in extreme events than Tavg. It illustrates that compared with the temperature indicator Tavg, the moisture indicators RH and PW are more sensitive to extreme rainstorm events. The moisture is the determinant of how much rain will fall, and it is direct to the formation of rainfall. The temperature affects how much moisture can be contained. The moisture here is potential content and not the actual content. That is most likely the reason why Tavg has no obvious relation with extreme precipitation events.
Based on the results of Figure 4, the spatial variation of dominant meteorological factors across the Henan province is shown in Figure 5. It can be seen that most areas, including Zhengzhou city, are dominated by Wind, while few regions are dominated by RH or PW. Vertical wind velocity (referred to as Wind) is the velocity between pressure levels, and the vertical velocity at 700 hPa is most related to precipitation processes [10,23]. Previous studies have shown that the moisture needed for extreme precipitation events cannot be met by PW [10,33]. Vertical wind velocity, representative of the large-scale horizontal convergence, draws moisture from the surrounding area to supply the moisture needed for the extreme event. That is why PW is less dominant than Wind in the formation of extreme rainfall.
4.2. Spatial Patterns of the Dominant Factor in Different Seasons
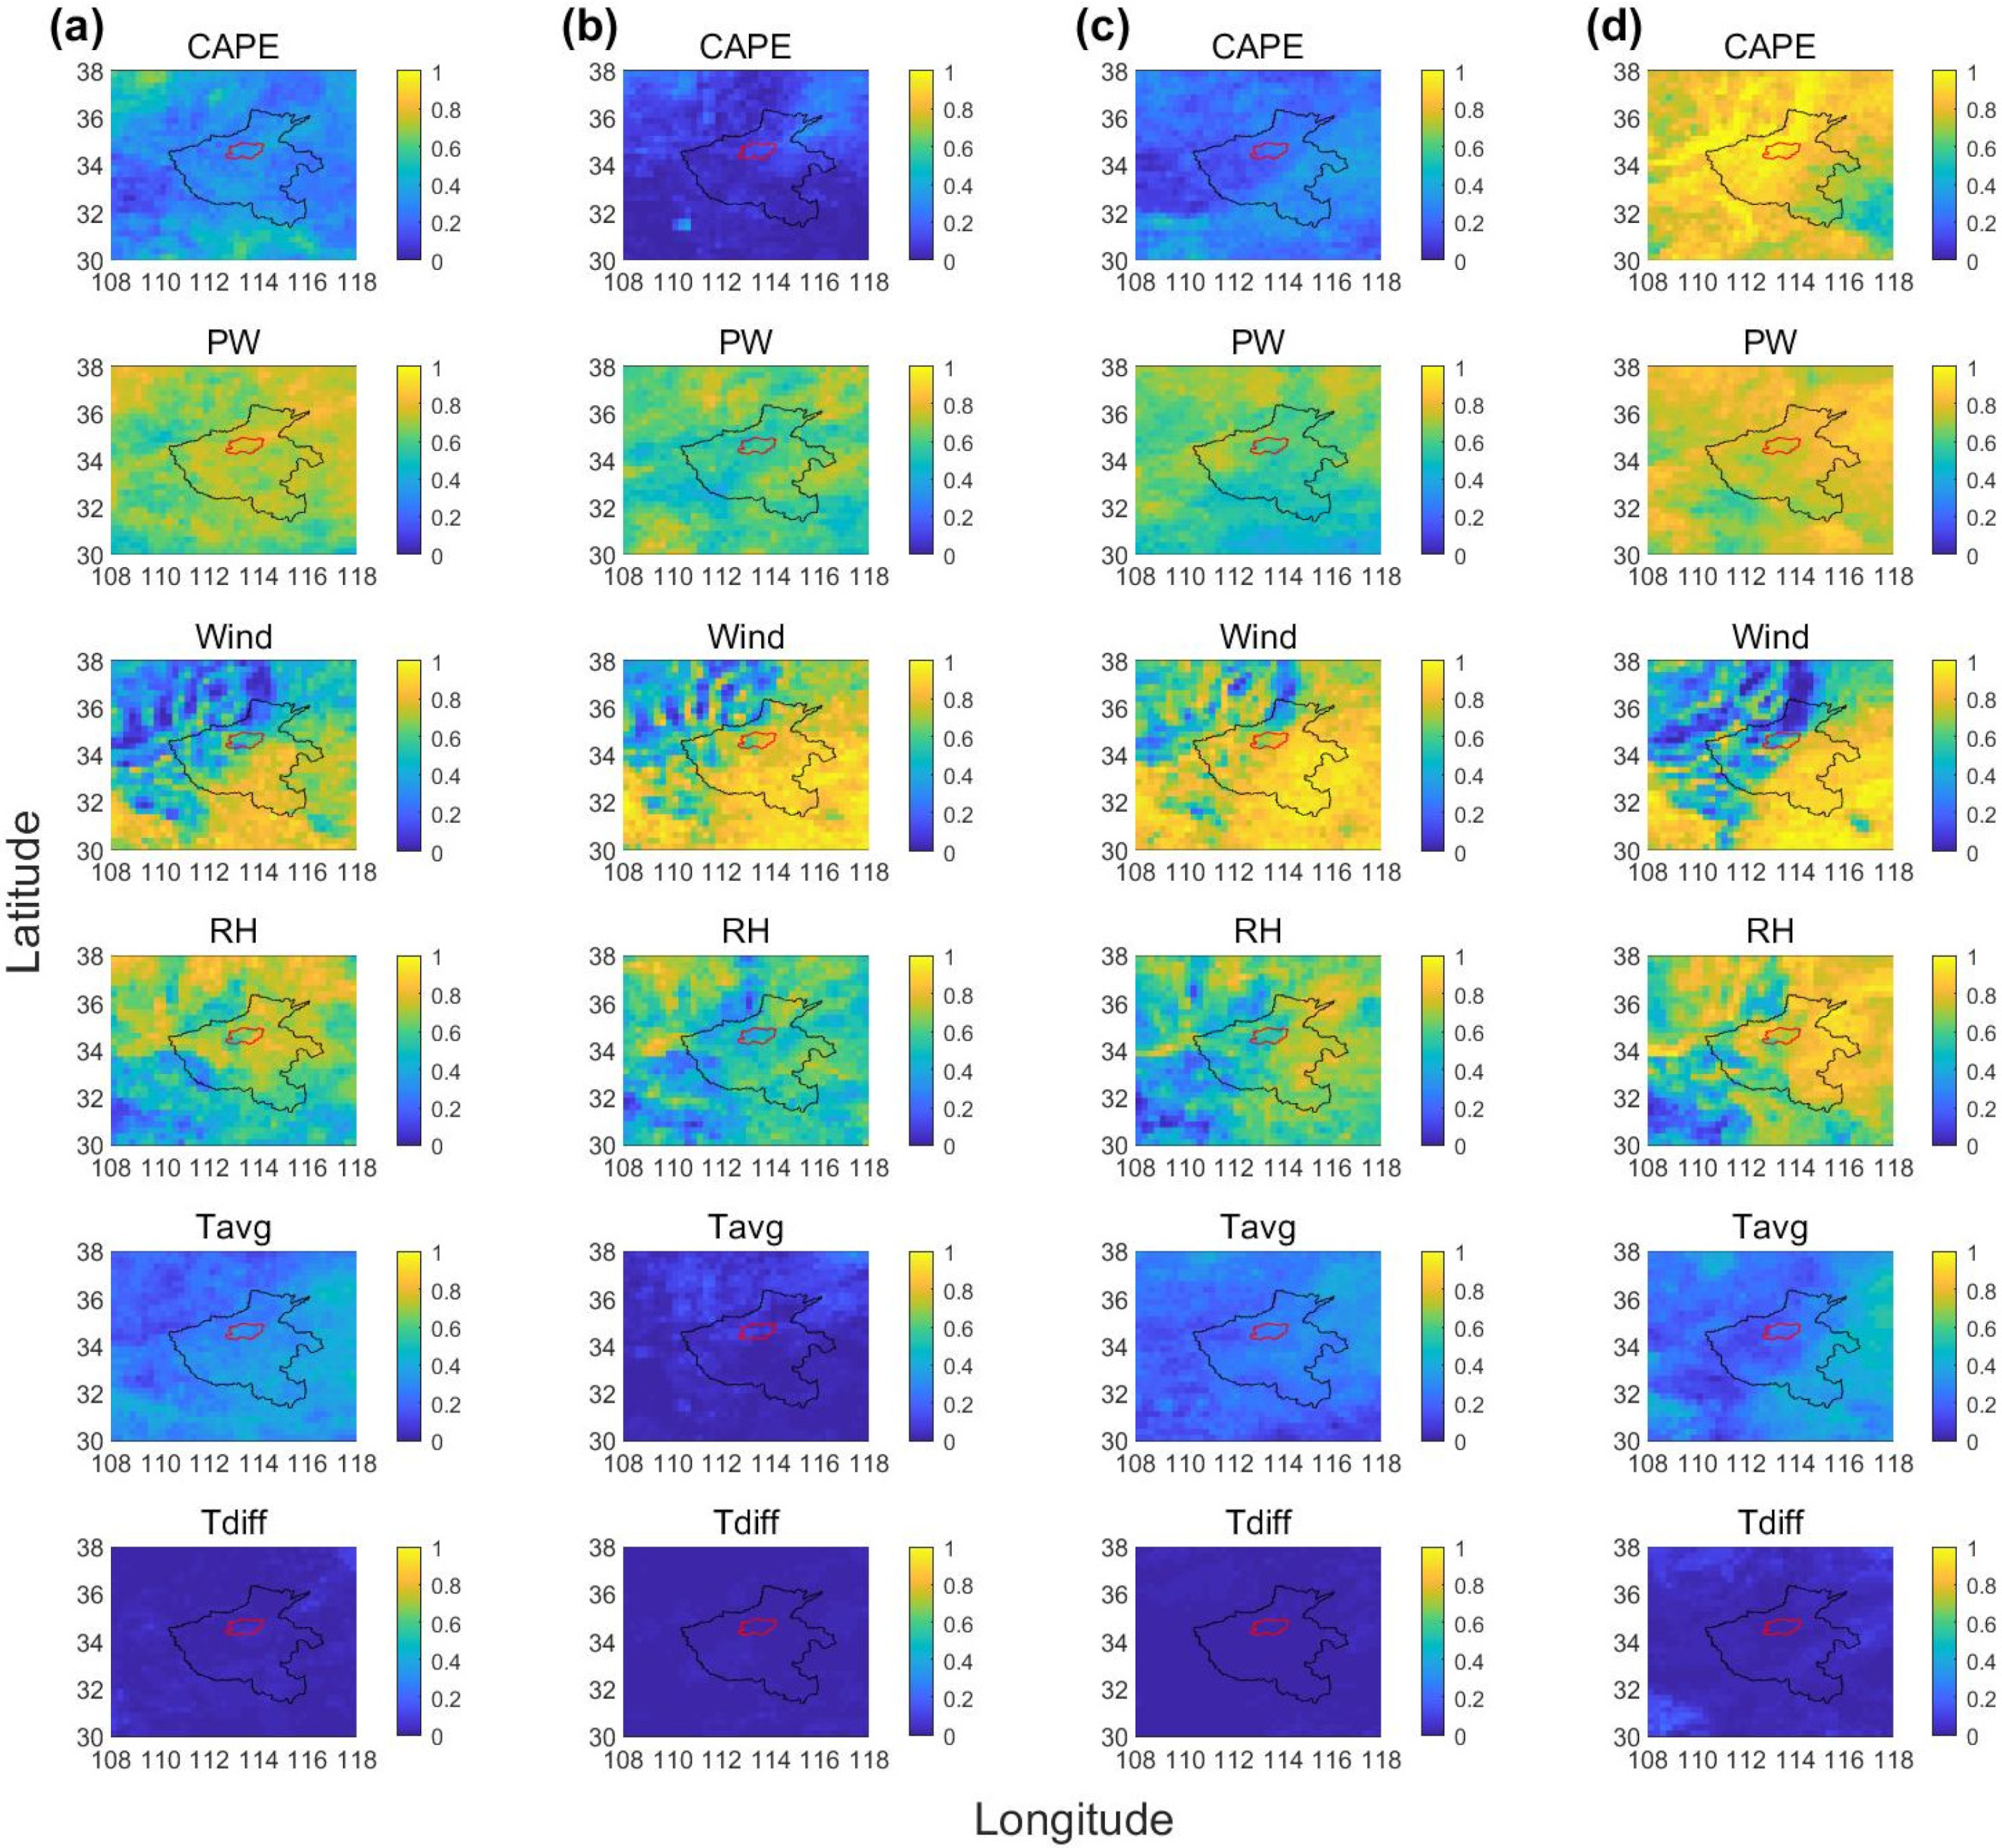
Except for the analysis based on extreme events of the whole year, the dominant factors were reanalyzed for different seasons to explore a deeper understanding of the causes of the extreme precipitation. The percentage of extreme events in each season is 4.742% (Spring, March to May), 82.127% (Summer, June to August), 13.128% (Autumn, September to November), and 0.003% (Winter, December to February), respectively. Over 80% of extreme events occur during the summer, while less than 20% of extreme precipitation events mainly happen in the autumn and spring. Due to the effect of the temperate monsoon climate, it is expected that the extreme precipitation event in this region is generally concentrated within the summer season. Therefore, the summer results (Figure 6b) are the most similar to the yearly based analysis (Figure 4). This also indicates that the dominant factors found here are stable, and it agrees with the finding in Chen and Hossain [10]. In addition, regarding the percentage of extreme events that are related to wind and RH, the patterns are stable across seasons. This is because the two drivers show less seasonal variability, and it is relatively easier to reach extreme values in all seasons.
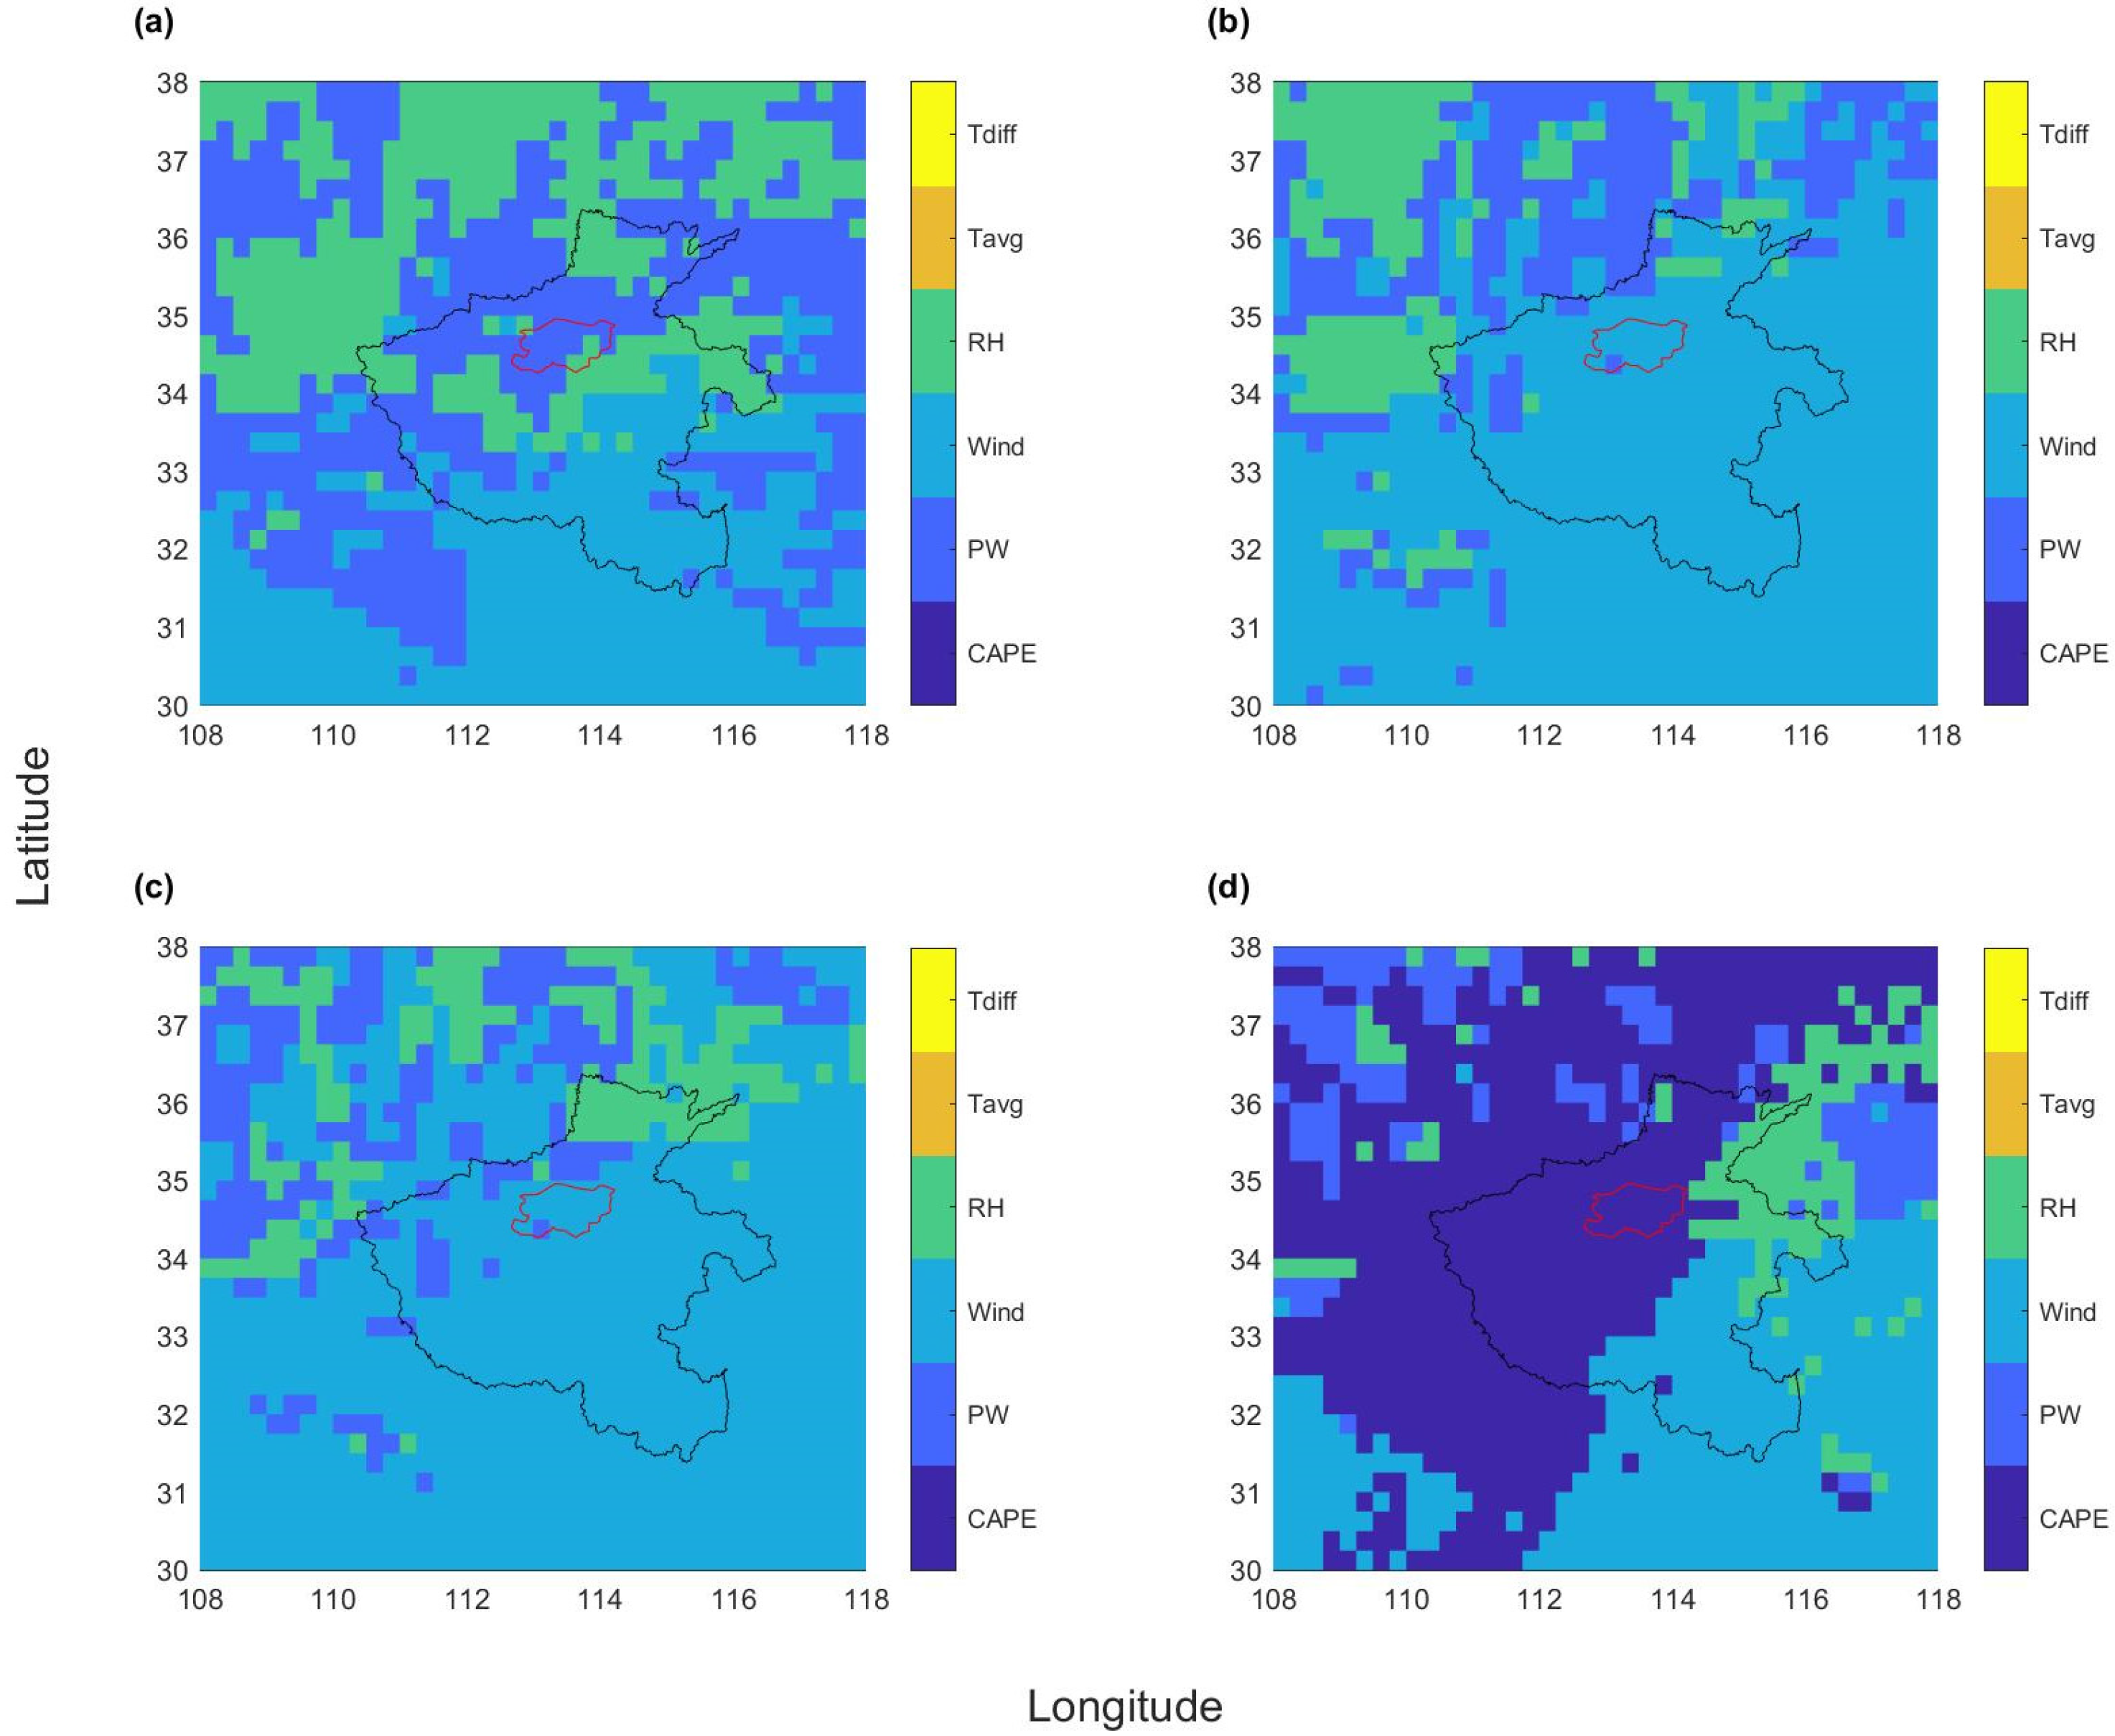
Figure 6 demonstrates that spring, autumn, and summer have similar spatial patterns, but winter is quite different. The key difference focuses on the patterns of CAPE. As documented at the ECMWF website, CAPE is a measurement of atmospheric stability and can be used to assess the potential of convection development. In winter, CAPE is identified as the driver of extreme precipitation events over the study area (Figure 6d), and it is also shown in Figure 7 as the dominant factor in the northern part of Henan province, including Zhengzhou city. However, in summer, CAPE has few effects on extreme events in Figure 6b. This finding is in agreement with the study of Lepore, Veneziano [34]. Most of the precipitation in winter comes from snow, and it has a different causative process from rainstorms in summer. High moisture indicated by PW ensures the initialization of rainstorms, while an unstable weather system caused by a high CAPE and Wind leads to snow in winter [10]. Based on the above analyses at a seasonal scale, the seasonal variability of these physically dominant factors was investigated, and it should be considered in the trend estimation of extreme precipitation due to the various causative processes.
4.3. Considerations of other Factors
In agreement with this study, other studies also found that precipitable water (PW) is often related to precipitation extreme events [35], and wind velocity is more likely to be the dominant factor of summer extreme precipitation events in some regions [10,23]. Besides, other factors, such as topography [36], urbanization-induced urban heat island and aerosol effects [37,38], and global climate change [39], also influenced the occurrence of extreme storms. Compared with variables discussed in this study, those factors are more likely to be static or show little variations in a long time. However, their effects on the spatial pattern are non-negligible and could influence the classification of extreme rainfall events (such as storms, warm/cold front, or tropical cyclones [40]). Therefore, further study is necessary regarding the comprehensive effects of the short-term and long-term variability on extreme precipitation events.
To summarize, it is important to understand how extreme precipitation events are linked to different types of weather circulation patterns, and reanalysis of data can support these subsequent studies due to the high temporal and spatial resolutions.
5. Conclusions
This study explores the characteristics of extreme precipitation events over the Henan province, central China using the latest ERA5 dataset. Over a ~41-y period, the largest 50 rainstorm events with the 72 h duration at each grid cell were extracted. The driver of these events was identified using the criteria based on the cumulative distribution function. A single atmospheric variable that controls the largest number of the 50 events was regarded as the dominant factor. The findings from the results are as follows:
- Over the entire study region, extreme precipitation events mostly happen in summer (from June to August).
- For the entire period, PW, Wind, and RH are the most common drivers for extreme precipitation events over the Henan province.
- For the different seasons, across the Henan region, Wind and PW are dominant factors in summer, while Wind and CAPE are highly related factors in winter. For Zhengzhou city particularly, Wind is the key driver for summer, while CAPE plays a key role in winter.
- Temperature-related variables have the lowest contribution to the occurrence of extreme events in the study area.
According to the proposed metric in this study, we can classify each event based on the various atmospheric variables and then identify the dominant factor. The analysis of dominant factors can provide insights for further flood estimations and forecasts. For instance, selecting annual maximum precipitation events with extreme Wind and PW values will likely identify the events that will maximize a storm. Besides, based on this method, further studies can be carried out by considering more factors, such as topography and global warming, to explore more findings on the formation of extreme rainfall and floods.
Author Contributions
Conceptualization, Z.J.; methodology, Y.L.; validation, Z.J. and X.W.; formal analysis, Y.L.; writing—original draft preparation, Y.L.; writing—review and editing, Z.J. and X.W.; funding acquisition, X.W. All authors have read and agreed to the published version of the manuscript.
Funding
This research was funded by the National Natural Science Foundation of China, grant number 52109015; the Fundamental Research Funds for the Central Universities, grant number B220202030; and Jiangsu Planned Projects for Postdoctoral Research Funds, grant number 2021K046A.
Institutional Review Board Statement
Not applicable.
Informed Consent Statement
Not applicable.
Data Availability Statement
ECMWF Reanalysis v5 (ERA5) dataset provided by the European Centre for Medium-Range Weather Forecasts, and the data can be accessed and downloaded from Copernicus Climate Change Service (C3S) at Website: https://cds.climate.copernicus.eu/ (accessed on 7 December 2021).
Acknowledgments
This research has been supported by the National Natural Science Foundation of China (grant no. 52109015), the Fundamental Research Funds for the Central Universities (grant no. B220202030), and Jiangsu Planned Projects for Postdoctoral Research Funds (grant no. 2021K046A).
Conflicts of Interest
The authors declare no conflict of interest.
References
- Seneviratne, S.I.; Zhang, X.; Adnan, M.; Badi, W.; Dereczynski, C.; Luca, A.D.; Ghosh, S.; Iskandar, I.; Kossin, J.; Lewis, S.; et al. Weather and Climate Extreme Events in a Changing Climate. In Climate Change 2021: The Physical Science Basis. Contribution of Working Group I to the Sixth Assessment Report of the Intergovernmental Panel on Climate Change; Masson-Delmotte, V., Zhai, P., Pirani, A., Connors, S.L., Péan, C., Berger, S., Caud, N., Chen, Y., Goldfarb, L., Gomis, M.I., et al., Eds.; Cambridge University Press: Cambridge, UK, 2021; in press. [Google Scholar]
- Zhan, D.; Zou, J. Heavy Rain Storm Floods in China and their Estimation; Singh, V.P., Ed.; Springer: Dordrecht, The Netherlands, 1987; pp. 35–44. [Google Scholar] [CrossRef]
- National Research Council. Estimating Bounds on Extreme Precipitation Events: A Brief Assessment; National Academies Press: Washington, DC, USA, 1994. [Google Scholar]
- Abbs, D.J. A numerical modeling study to investigate the assumptions used in the calculation of probable maximum precipitation. Water Resour. Res. 1999, 35, 785–796. [Google Scholar] [CrossRef]
- Chen, L.-C.; Bradley, A.A. How does the record July 1996 Illinois rainstorm affect probable maximum precipitation estimates? J. Hydrol. Eng. 2007, 12, 327–335. [Google Scholar] [CrossRef]
- Chen, L.-C.; Bradley, A.A. Adequacy of using surface humidity to estimate atmospheric moisture availability for probable maximum precipitation. Water Resour. Res. 2006, 42, W09410. [Google Scholar] [CrossRef] [Green Version]
- WMO. Manual on Estimation of Probable Maximum Precipitation (PMP); World Meteorological Organization: Geneva, Switzerland, 2009. [Google Scholar]
- Chen, X.; Hossain, F. Revisiting extreme storms of the past 100 years for future safety of large water management infrastructures. Earth’s Future 2016, 4, 306–322. [Google Scholar] [CrossRef]
- Chen, X.; Hossain, F.; Leung, L.R. Probable Maximum Precipitation in the U.S. Pacific Northwest in a Changing Climate. Water Resour. Res. 2017, 53, 9600–9622. [Google Scholar] [CrossRef] [Green Version]
- Chen, X.; Hossain, F. Understanding Model-Based Probable Maximum Precipitation Estimation as a Function of Location and Season from Atmospheric Reanalysis. J. Hydrometeorol. 2018, 19, 459–475. [Google Scholar] [CrossRef]
- Rouhani, H.; Leconte, R. A novel method to estimate the maximization ratio of the Probable Maximum Precipitation (PMP) using regional climate model output. Water Resour. Res. 2016, 52, 7347–7365. [Google Scholar] [CrossRef] [Green Version]
- Klein, I.M.; Rousseau, A.N.; Frigon, A.; Freudiger, D.; Gagnon, P. Evaluation of probable maximum snow accumulation: Development of a methodology for climate change studies. J. Hydrol. 2016, 537, 74–85. [Google Scholar] [CrossRef]
- Ben Alaya, M.A.; Zwiers, F.; Zhang, X. Evaluation and Comparison of CanRCM4 and CRCM5 to Estimate Probable Maximum Precipitation over North America. J. Hydrometeorol. 2019, 20, 2069–2089. [Google Scholar] [CrossRef]
- Ben Alaya, M.A.; Zwiers, F.W.; Zhang, X. Probable maximum precipitation in a warming climate over North America in CanRCM4 and CRCM5. Clim. Change 2020, 158, 611–629. [Google Scholar] [CrossRef]
- Kumar, A.; Dudhia, J.; Rotunno, R.; Niyogi, D.; Mohanty, U.C. Analysis of the 26 July 2005 heavy rain event over Mumbai, India using the Weather Research and Forecasting (WRF) model. Q. J. R. Meteorol. Soc. 2008, 134, 1897–1910. [Google Scholar] [CrossRef]
- Moore, B.J.; Neiman, P.J.; Ralph, F.M.; Barthold, F.E. Physical processes associated with heavy flooding rainfall in Nashville, Tennessee, and vicinity during 1–2 May 2010: The role of an atmospheric river and mesoscale convective systems. Mon. Weather Rev. 2012, 140, 358–378. [Google Scholar] [CrossRef]
- Liu, L.; Jensen, M.B. Climate resilience strategies of Beijing and Copenhagen and their links to sustainability. Water Policy 2017, 19, 997–1013. [Google Scholar] [CrossRef]
- Yin, J.; Zhang, D.-L.; Luo, Y.; Ma, R. On the Extreme Rainfall Event of 7 May 2017 over the Coastal City of Guangzhou. Part I: Impacts of Urbanization and Orography. Mon. Weather Rev. 2020, 148, 955–979. [Google Scholar] [CrossRef]
- Koç, G.; Natho, S.; Thieken, A.H. Estimating direct economic impacts of severe flood events in Turkey (2015–2020). Int. J. Disaster Risk Reduct. 2021, 58, 102222. [Google Scholar] [CrossRef]
- Fekete, A.; Sandholz, S. Here Comes the Flood, but Not Failure? Lessons to Learn after the Heavy Rain and Pluvial Floods in Germany 2021. Water 2021, 13, 3016. [Google Scholar] [CrossRef]
- Wang, H.; Hu, Y.; Guo, Y.; Wu, Z.; Yan, D. Urban flood forecasting based on the coupling of numerical weather model and stormwater model: A case study of Zhengzhou city. J. Hydrol. Reg. Stud. 2022, 39, 100985. [Google Scholar] [CrossRef]
- Davies, L.; Jakob, C.; May, P.; Kumar, V.V.; Xie, S. Relationships between the large-scale atmosphere and the small-scale convective state for Darwin, Australia. J. Geophys. Res. Atmos. 2013, 118, 11534–11545. [Google Scholar] [CrossRef]
- Loriaux, J.M.; Lenderink, G.; Siebesma, A.P. Peak precipitation intensity in relation to atmospheric conditions and large-scale forcing at midlatitudes. J. Geophys. Res. Atmos. 2016, 121, 5471–5487. [Google Scholar] [CrossRef] [Green Version]
- Jiang, Z.; Rashid, M.M.; Johnson, F.; Sharma, A. A wavelet-based tool to modulate variance in predictors: An application to predicting drought anomalies. Environ. Model. Softw. 2021, 135, 104907. [Google Scholar] [CrossRef]
- Jiang, Z.; Sharma, A.; Johnson, F. Refining Predictor Spectral Representation Using Wavelet Theory for Improved Natural System Modeling. Water Resour. Res. 2020, 56, e2019WR026962. [Google Scholar] [CrossRef]
- Hersbach, H.; Bell, B.; Berrisford, P.; Hirahara, S.; Horányi, A.; Muñoz-Sabater, J.; Nicolas, J.; Peubey, C.; Radu, R.; Schepers, D.; et al. The ERA5 global reanalysis. Q. J. R. Meteorol. Soc. 2020, 146, 1999–2049. [Google Scholar] [CrossRef]
- Zeyi, C.; Zuoshu, W.; Zaitao, P. A numerical study on forecasting the Henan extraordinarily heavy rainfall event in August 1975. Adv. Atmos. Sci. 1992, 9, 53–62. [Google Scholar] [CrossRef]
- Fengmei, Y.; Chongyi, E. Correlation analysis between sand-dust events and meteorological factors in Shapotou, Northern China. Environ. Earth Sci. 2010, 59, 1359–1365. [Google Scholar] [CrossRef]
- Hamill, T.M.; Scheuerer, M. Probabilistic Precipitation Forecast Postprocessing Using Quantile Mapping and Rank-Weighted Best-Member Dressing. Mon. Weather Rev. 2018, 146, 4079–4098. [Google Scholar] [CrossRef]
- Vannitsem, S.; Bremnes, J.B.; Demaeyer, J.; Evans, G.R.; Flowerdew, J.; Hemri, S.; Lerch, S.; Roberts, N.; Theis, S.; Atencia, A.; et al. Statistical Postprocessing for Weather Forecasts: Review, Challenges, and Avenues in a Big Data World. Bull. Am. Meteorol. Soc. 2021, 102, E681–E699. [Google Scholar] [CrossRef]
- Wang, Q.J.; Zhao, T.; Yang, Q.; Robertson, D. A Seasonally Coherent Calibration (SCC) Model for Postprocessing Numerical Weather Predictions. Mon. Weather Rev. 2019, 147, 3633–3647. [Google Scholar] [CrossRef]
- Wu, X.; Marshall, L.; Sharma, A. Quantifying input error in hydrologic modeling using the Bayesian Error Analysis with Reordering (BEAR) approach. J. Hydrol. 2021, 598, 126202. [Google Scholar] [CrossRef]
- Kunkel, K.E.; Karl, T.R.; Easterling, D.R.; Redmond, K.; Young, J.; Yin, X.; Hennon, P. Probable maximum precipitation and climate change. Geophys. Res. Lett. 2013, 40, 1402–1408. [Google Scholar] [CrossRef]
- Lepore, C.; Veneziano, D.; Molini, A. Temperature and CAPE dependence of rainfall extremes in the eastern United States. Geophys. Res. Lett. 2015, 42, 74–83. [Google Scholar] [CrossRef]
- Kim, S.; Sharma, A.; Wasko, C.; Nathan, R. Linking Total Precipitable Water to Precipitation Extremes Globally. Earth’s Future 2022, 10, e2021EF002473. [Google Scholar] [CrossRef]
- Su, A.; Lü, X.; Cui, L.; Li, Z.; Xi, L.; Li, H. The Basic Observational Analysis of “7.20” Extreme Rainstorm in Zhengzhou. Torrential Rain Disasters 2021, 40, 445–454. (In Chinese) [Google Scholar] [CrossRef]
- Zhong, S.; Qian, Y.; Zhao, C.; Leung, R.; Wang, H.; Yang, B.; Fan, J.; Yan, H.; Yang, X.Q.; Liu, D. Urbanization-induced urban heat island and aerosol effects on climate extremes in the Yangtze River Delta region of China. Atmos. Chem. Phys. 2017, 17, 5439–5457. [Google Scholar] [CrossRef] [Green Version]
- Zhong, S.; Qian, Y.; Zhao, C.; Leung, R.; Yang, X.-Q. A case study of urbanization impact on summer precipitation in the Greater Beijing Metropolitan Area: Urban heat island versus aerosol effects. J. Geophys. Res. Atmos. 2015, 120, 10903–10904. [Google Scholar] [CrossRef]
- Oscar-Júnior, A.C. Precipitation Trends and Variability in River Basins in Urban Expansion Areas. Water Resour. Manag. 2021, 35, 661–674. [Google Scholar] [CrossRef]
- Cipolla, G.; Francipane, A.; Noto, L.V. Classification of Extreme Rainfall for a Mediterranean Region by Means of Atmospheric Circulation Patterns and Reanalysis Data. Water Resour. Manag. 2020, 34, 3219–3235. [Google Scholar] [CrossRef]
Figure 1.
The study area of Henan province and Zhengzhou city in central China.

Figure 2.
Hourly precipitation (black line) and the 50 highest extreme rainstorms at the demo grid near Zhengzhou city from 1981 to 2021. The red number indicates the order of the first five largest events.
Figure 2.
Hourly precipitation (black line) and the 50 highest extreme rainstorms at the demo grid near Zhengzhou city from 1981 to 2021. The red number indicates the order of the first five largest events.

Figure 3.
Demonstration of driver identification of the first largest event at the demo grid. The result of each atmospheric variable is shown in a subfigure with (a) CAPE, (b) PW, (c) Wind, (d) RH, (e) Tavg, and (f) Tdiff, separately. The blue line presents the cumulative distribution curve (CDF) of all hourly values in the entire period from 1981 to 2021. The red circles present the cumulative probabilities of the hourly values during the 72 h after the first largest event began. The CDF of 95% (horizontal red dashed line) is defined as the threshold of the extreme condition.

Figure 4.
Percentage of extreme events that are related to each atmospheric variable across the Henan province in the entire period from 1981 to 2021. (a) CAPE; (b) PW; (c) Wind; (d) RH; (e) Tavg; and (f) Tdiff. The black polygon presents the border of Henan province, while the red polygon is the boundary of Zhengzhou city.

Figure 5.
Dominant factors of extreme rainstorms across the Henan province. The black polygon presents the border of Henan province, while the red polygon is the boundary of Zhengzhou city.
Figure 5.
Dominant factors of extreme rainstorms across the Henan province. The black polygon presents the border of Henan province, while the red polygon is the boundary of Zhengzhou city.

Figure 6.
Percentage of extreme events that are related to each atmospheric variable across the Henan province for the spring (a), summer (b), autumn (c), and winter (d), respectively. The black polygon presents the border of Henan province, while the red polygon is the boundary of Zhengzhou city.
Figure 6.
Percentage of extreme events that are related to each atmospheric variable across the Henan province for the spring (a), summer (b), autumn (c), and winter (d), respectively. The black polygon presents the border of Henan province, while the red polygon is the boundary of Zhengzhou city.

Figure 7.
Dominant factors of extreme rainstorms across the Henan province in different seasons. (a) spring; (b) summer; (c) autumn; and (d) winter. The black polygon presents the border of Henan province, while the red polygon is the boundary of Zhengzhou city.
Figure 7.
Dominant factors of extreme rainstorms across the Henan province in different seasons. (a) spring; (b) summer; (c) autumn; and (d) winter. The black polygon presents the border of Henan province, while the red polygon is the boundary of Zhengzhou city.


Table 1.
List of the largest 50 extreme events with identified drivers at the demo grid.
| Event Order | Start Time | Accumulated 72 h Precipitation (mm) | M1 | |||||
|---|---|---|---|---|---|---|---|---|
| CAPE | PW | Wind | RH | Tavg | Tdiff | |||
| 1 | 2021-07-18 21:00:00 | 234.92 | 0 | 1 | 1 | 1 | 0 | 0 |
| 2 | 2000-07-03 00:00:00 | 223.94 | 0 | 1 | 1 | 1 | 0 | 0 |
| 3 | 2018-08-16 07:00:00 | 182.18 | 0 | 1 | 1 | 0 | 0 | 0 |
| 4 | 1984-07-16 07:00:00 | 150.53 | 1 | 1 | 1 | 1 | 0 | 0 |
| 5 | 1999-07-03 15:00:00 | 149.99 | 0 | 1 | 1 | 1 | 0 | 0 |
| 6 | 2009-07-20 00:00:00 | 144.32 | 1 | 1 | 1 | 0 | 1 | 0 |
| 7 | 2021-08-19 14:00:00 | 139.27 | 0 | 1 | 1 | 1 | 0 | 0 |
| 8 | 2010-07-16 04:00:00 | 130.87 | 0 | 1 | 1 | 1 | 0 | 0 |
| 9 | 2021-08-28 03:00:00 | 125.42 | 0 | 1 | 1 | 1 | 0 | 0 |
| 10 | 2000-08-03 09:00:00 | 123.12 | 0 | 1 | 1 | 1 | 0 | 0 |
| 11 | 2004-07-14 07:00:00 | 122.64 | 0 | 1 | 1 | 1 | 0 | 0 |
| 12 | 2000-06-24 23:00:00 | 120.97 | 0 | 1 | 1 | 1 | 0 | 0 |
| 13 | 1996-08-02 05:00:00 | 111.64 | 0 | 1 | 1 | 1 | 1 | 0 |
| 14 | 2000-07-12 18:00:00 | 110.28 | 0 | 1 | 1 | 1 | 0 | 0 |
| 15 | 1990-06-17 02:00:00 | 109.47 | 0 | 1 | 1 | 0 | 0 | 0 |
| 16 | 1995-07-22 09:00:00 | 109.13 | 1 | 1 | 1 | 1 | 1 | 0 |
| 17 | 1993-04-29 06:00:00 | 109.00 | 0 | 0 | 1 | 1 | 0 | 0 |
| 18 | 1990-08-13 02:00:00 | 109.00 | 0 | 1 | 1 | 1 | 0 | 0 |
| 19 | 1984-09-21 14:00:00 | 106.25 | 0 | 0 | 1 | 1 | 0 | 0 |
| 20 | 2010-09-04 01:00:00 | 105.82 | 0 | 1 | 1 | 1 | 0 | 0 |
| 21 | 1982-08-11 15:00:00 | 101.03 | 0 | 1 | 1 | 1 | 0 | 0 |
| 22 | 2011-09-11 23:00:00 | 100.94 | 0 | 0 | 1 | 1 | 0 | 0 |
| 23 | 2013-05-24 04:00:00 | 94.25 | 0 | 0 | 1 | 1 | 0 | 0 |
| 24 | 1998-08-03 11:00:00 | 93.30 | 0 | 1 | 1 | 1 | 1 | 0 |
| 25 | 2000-06-01 10:00:00 | 92.92 | 0 | 1 | 0 | 1 | 0 | 0 |
| 26 | 2011-07-31 09:00:00 | 92.74 | 0 | 0 | 1 | 1 | 0 | 0 |
| 27 | 1990-07-19 11:00:00 | 90.09 | 1 | 1 | 1 | 1 | 1 | 0 |
| 28 | 2011-09-04 01:00:00 | 89.85 | 0 | 1 | 0 | 1 | 0 | 0 |
| 29 | 2003-08-27 20:00:00 | 89.11 | 0 | 1 | 1 | 0 | 0 | 0 |
| 30 | 1984-08-06 07:00:00 | 88.28 | 1 | 1 | 1 | 1 | 0 | 0 |
| 31 | 2005-06-24 17:00:00 | 88.15 | 0 | 1 | 1 | 0 | 0 | 0 |
| 32 | 1983-08-09 11:00:00 | 85.46 | 0 | 1 | 1 | 1 | 0 | 0 |
| 33 | 1983-09-04 22:00:00 | 85.25 | 0 | 1 | 1 | 1 | 0 | 0 |
| 34 | 2012-07-04 03:00:00 | 85.16 | 0 | 1 | 1 | 0 | 0 | 0 |
| 35 | 1985-09-13 11:00:00 | 84.97 | 0 | 0 | 1 | 0 | 0 | 0 |
| 36 | 1983-10-03 03:00:00 | 84.93 | 0 | 0 | 1 | 0 | 0 | 0 |
| 37 | 2015-06-22 12:00:00 | 84.71 | 0 | 1 | 1 | 0 | 0 | 0 |
| 38 | 1993-08-12 10:00:00 | 84.34 | 0 | 1 | 1 | 1 | 0 | 0 |
| 39 | 2008-07-20 08:00:00 | 84.26 | 0 | 1 | 0 | 0 | 0 | 0 |
| 40 | 1984-09-06 17:00:00 | 84.18 | 0 | 1 | 1 | 1 | 0 | 0 |
| 41 | 1989-07-04 10:00:00 | 82.94 | 0 | 1 | 0 | 1 | 0 | 0 |
| 42 | 2006-07-01 10:00:00 | 82.75 | 0 | 1 | 1 | 1 | 1 | 0 |
| 43 | 2007-07-18 02:00:00 | 82.00 | 1 | 1 | 1 | 0 | 1 | 0 |
| 44 | 2007-07-03 22:00:00 | 81.92 | 0 | 1 | 1 | 1 | 0 | 0 |
| 45 | 1987-05-31 06:00:00 | 81.82 | 1 | 0 | 1 | 1 | 0 | 1 |
| 46 | 1982-08-28 07:00:00 | 81.56 | 0 | 1 | 1 | 1 | 0 | 0 |
| 47 | 1998-07-14 07:00:00 | 80.70 | 1 | 1 | 1 | 1 | 1 | 0 |
| 48 | 1997-09-12 03:00:00 | 79.52 | 0 | 0 | 1 | 0 | 0 | 0 |
| 49 | 2010-08-22 03:00:00 | 79.25 | 0 | 0 | 1 | 0 | 0 | 0 |
| 50 | 1981-08-09 02:00:00 | 78.79 | 0 | 1 | 0 | 1 | 0 | 0 |
Note: 1 M = 1 means the factor is the driver of the extreme rainstorm, while M = 0 means it is not.
Publisher’s Note: MDPI stays neutral with regard to jurisdictional claims in published maps and institutional affiliations. |
© 2022 by the authors. Licensee MDPI, Basel, Switzerland. This article is an open access article distributed under the terms and conditions of the Creative Commons Attribution (CC BY) license (https://creativecommons.org/licenses/by/4.0/).
Share and Cite
MDPI and ACS Style
Lang, Y.; Jiang, Z.; Wu, X. Investigating the Linkage between Extreme Rainstorms and Concurrent Synoptic Features: A Case Study in Henan, Central China. Water 2022, 14, 1065. https://doi.org/10.3390/w14071065
AMA Style
Lang Y, Jiang Z, Wu X. Investigating the Linkage between Extreme Rainstorms and Concurrent Synoptic Features: A Case Study in Henan, Central China. Water. 2022; 14(7):1065. https://doi.org/10.3390/w14071065
Chicago/Turabian StyleLang, Yu, Ze Jiang, and Xia Wu. 2022. "Investigating the Linkage between Extreme Rainstorms and Concurrent Synoptic Features: A Case Study in Henan, Central China" Water 14, no. 7: 1065. https://doi.org/10.3390/w14071065
Note that from the first issue of 2016, this journal uses article numbers instead of page numbers. See further details here.