
Developing an Optimized Policy Tree-Based Reservoir Operation Model for High Aswan Dam Reservoir, Nile River


1
Department of Civil and Environmental Engineering, University of South Carolina, C206, 300 Main St., Columbia, SC 29208, USA
2
Oceanography Department, Faculty of Science, Alexandria University, Alexandria 21151, Egypt
3
School of Environment and Society, Tokyo Institute of Technology, Meguro-Ku, Tokyo 152-8552, Japan
4
Irrigation and Hydraulics Engineering Department, College of Engineering, Mansoura University, 60 Elgomhoria Street, Mansoura 35516, Egypt
*
Author to whom correspondence should be addressed.
Water 2022, 14(7), 1061; https://doi.org/10.3390/w14071061
Submission received: 7 February 2022
/
Revised: 18 March 2022
/
Accepted: 24 March 2022
/
Published: 28 March 2022
(This article belongs to the Section Water Resources Management, Policy and Governance)
Abstract
:The impacts of climate change on the Nile River and Grand Ethiopian Renaissance Dam (GERD) along with the increased water demand downstream suggest an urgent need for more efficient management of the reservoir system that is well-informed by accurate modeling and optimization of the reservoir operation. This study provides an updated water balance model for Aswan High Dam Reservoir, which was validated using combined heterogeneous sources of information, including in situ gauge data, bias-corrected reanalyzed data, and remote sensing information. To investigate the future challenges, the spatial distribution of the annual/seasonal Aswan High Dam Reservoir surface air temperature trends over the period from 1979 to 2018 was studied. An increase of around 0.48 °C per decade in average annual temperature was detected, a trend that is expected to continue until 2100. Moreover, a set of machine learning models were developed and utilized to bias-correct the reanalyzed inflow and outflow data available for Aswan High Dam Reservoir. Finally, a policy tree optimization model was developed to inform the decision-making process and operation of the reservoir system. Results from the historical test simulations show that including reliable inflow data, accurate estimation of evaporation losses, and including new regulations and added projects, such as the Toshka Project, greatly affect the simulation results and guide managers through how the reservoir system should be operated in the future.
1. Introduction
Surface water reservoirs are important parts of water systems; therefore, their optimal operation is key for effective management of water resources [1]. It is expected that more countries will face water shortages in the near future, and as a result, more conflicts and competition over shared limited rivers and lakes [2]. Studying reservoir systems involves developing operational simulation models. Reservoir simulation models help operators and managers to better assess the different operation policies and make informed decisions under changing climate. These models provide great perspective on current and future water budgets and help estimate water losses from reservoirs, as measuring losses is often a challenging task. For example, the evaporation loss from the surface of a water reservoir has been considered as a paramount factor in planning and operating reservoir systems, especially in arid and semi-arid regions [3]. Thus, finding ways to reduce the amount of evaporation loss from a reservoir, or by keeping the reservoir surface constant, plays an important role in designing optimal operation policies [4].
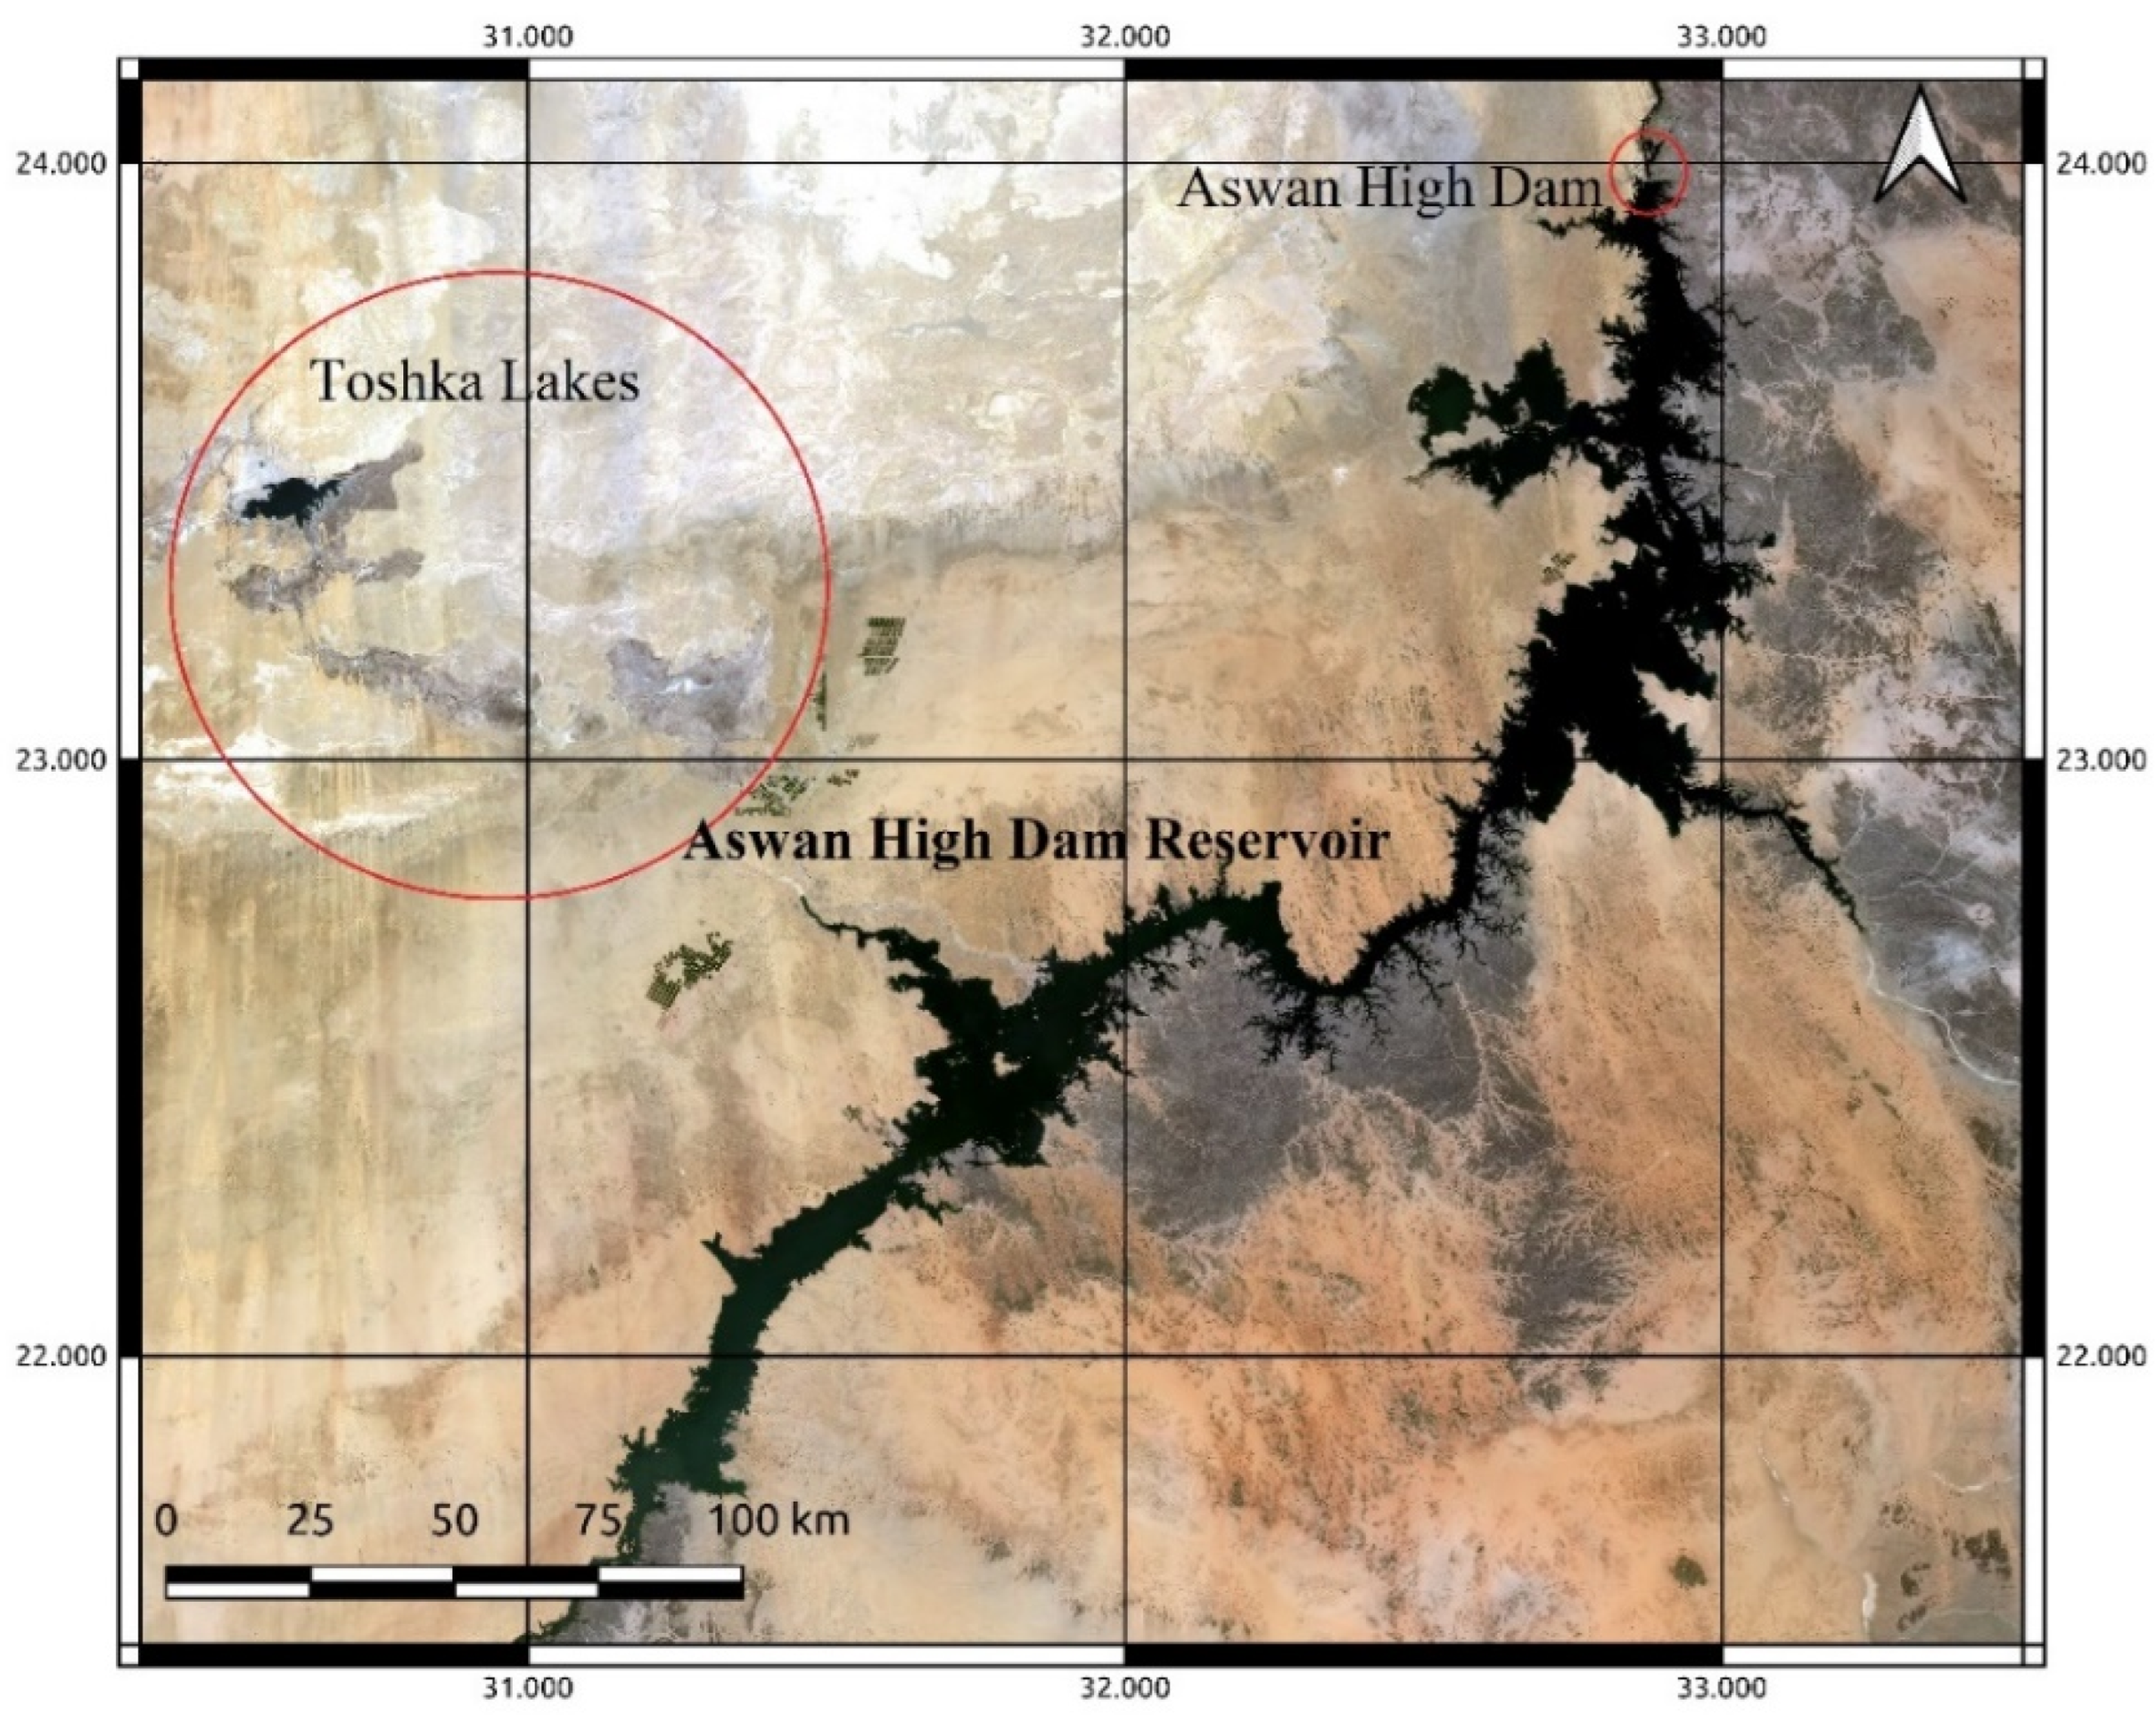
Different simulations and optimization analysis techniques have been developed to study reservoir systems, estimate losses from the reservoir systems, and offer appropriate operational policies [5,6]. One of the important surface water reservoirs is the Aswan High Dam Reservoir (AHDR). This reservoir retains the water in Lake Nasser and Lake Nubia as a result of the construction of Aswan High Dam (AHD) in 1964. After the Soviet Union offered to build the Aswan High Dam in 1958, the construction of the dam started in 1960 and was completed in 1964. This was followed by filling the reservoir until its construction was finalized in 1970. This enabled the reservoir to reach its full capacity in 1976 [7]. As seen in Figure 1, Aswan High Dam Reservoir extends from latitudes 21.8 to 24.0° N and longitudes 31.3 to 33.1° E in Egypt and Sudan [8,9]. Aswan High Dam Reservoir is considered one of the largest man-made reservoirs in the world [10], with an overall length of more than 500 km and a surface area of 5000 km2. The full capacity of the Aswan High Dam Reservoir at the level 182 m is estimated to be 162.3 BCM [11,12]. Considering the limited amount of freshwater resources in Egypt, Aswan High Dam Reservoir is considered the national freshwater bank for the Egyptians. However, this reservoir has considerable rates of evaporation loss (on average 12 BCM annually) [13]. In addition to the existing water scarcity situation in Egypt, and as suggested by recent studies, Egypt will face over the next decades the need for an additional source of water as large as the Nile to be able cover its rapidly increasing demand [14]. After the construction of the Grand Ethiopian Renaissance Dam (GERD), cooperation will be urgently needed for the joint operation of these big dams on the Nile River [15,16,17]. More detailed climate change impact studies should be conducted to study not only the increased amount of losses due to evaporation from these reservoirs, but also future changes in demand; additionally, the Nile flow variability should be addressed [18]. A recent global analysis of the climate change risk to hydropower projects concluded that Aswan High dam will be at the highest risk of flooding and scarcity under 2050 pessimistic scenarios [19]. This study investigated the future challenges, examined the spatial distribution of the annual/seasonal Aswan High Dam Reservoir surface air temperature trends over the period from 1979 to 2018, and predicted future increasing trends until 2100.
Global initiatives started to build a regularly updated database of global dams to facilitate basin and global-scale management [20]. Various successful attempts [18,21,22,23,24,25] were undertaken to overcome challenges associated with the scarcity and sharing of reliable long-term hydrological data for the Nile River Basin using remote sensing data, and reanalyzed data and regional and global model outputs. A satellite-based framework [26] has been developed to include the Variable Infiltration Capacity (VIC) hydrologic model information for efficient near real-time hydrological data sharing. Moreover, the model was required by satellite observations, while the Aswan High Dam Reservoir storage was estimated using altimeter data and visible imagery of the reservoir area. Another study [27] assessed the average annual/seasonal variation of terrestrial total water mass on the River Nile Basin and extracted underground water data from the Gravity Recovery and Climate Experiment (GRACE). Furthermore, GRACE products were utilized to examine the trend dynamics of terrestrial water storage in the Nile River Basin [21]. A recent study [28] investigated the terrestrial water storage anomalies (TWSA) measured by GRACE satellites to fill the gap in the field hydrological data for the region. Reservoir assessment tools also can be developed based on combinations of satellites, operational hydrological model outputs, and long-term field observations to quantify the dynamics of reservoir operations around the world [29]. The need to search for new sources of information and gather reliable data measurements calls for development of new and robust operational rules for multi-purpose reservoir management that are supported by state-of-the-art simulation-optimization models and performance assessment measures [30,31,32,33]. This study sought to develop and test a set of machine learning models to bias-correct the reanalyzed inflow and outflow data available for Aswan High Dam Reservoir. Moreover, a policy tree optimization model was developed to inform the decision-making process and operation of the reservoir system.
Machine learning is one of the trending approaches for modeling that has been applied so far in various fields. A model based on neural network (NN) theory along with stochastic dynamic programming (SDP) has been suggested to generate reliable and less vulnerable policies for AHD [34]. Moreover, the artificial bee colony (ABC) algorithm was utilized to provide decision-makers with the optimum release curves based on demand [35]. The proposed release policy meets demand for 98% of the total period (historical data for 18 years). The operating rules for the Aswan High Dam have been re-evaluated through an integrated remote sensing approach applying the surface energy balance algorithm for land (SEBAL) for accurate evapotranspiration estimation of the stresses downstream [36]. Moreover, a variety of machine learning and metaheuristic techniques have been used in past studies of reservoir operation [37,38,39,40,41,42]. A recent review study highlights the increasing trend of studies on reservoir optimization including mathematical programming, open-loop decisions, rule curves, dynamic programming, approximation in value space, and approximation in policy space [43].
In the current study, an accurate simulation model that incorporates various elements affecting the reservoir was developed. This model evaluates the effects of different management scenarios and policies for the operation of the dam. In the absence of continuous and reliable observed data, reanalyzed and historical simulation data were first bias-corrected using linear regression (LR) and various machine learning methods. After preprocessing the input data, a developed water budget simulation model was used to simulate the reservoir operation and evaluate the accuracy of the data, gained from different sources, by comparing the simulation results with historical reservoir level data. Finally, a policy tree optimization model was then implemented to find the optimized structure of a policy tree for Aswan High Dam Reservoir. The input data for the model incorporated various historical in situ data along with remote sensing and bias-corrected inflow and outflow data. In the following sections, first more information and background on AHD are presented. Then, the data and methodology section provides detailed explanations on the used data and their sources, such as remote sensing and historical data, and methods for analyzing data and developing the policy tree optimization model are discussed. This is followed by an overview of the projected surface air temperatures under the four representative concentration pathway climate change scenarios. Finally, the results and conclusions are presented for the application of the policy tree optimization model to Aswan High Dam Reservoir.
2. Aswan High Dam Reservoir Case Study
Aswan High Dam Reservoir, located on the Nile River at the border of Egypt and Sudan, is an artificial reservoir formed as a result of construction of the Aswan High Dam. Aswan High Dam Reservoir is one of the world’s largest artificial lakes. The construction of the dam started in 1964 and was completed in 1970; dam operation started in 1976. The water demand downstream of the reservoir is approximately 55.5 BCM/year, based on an average natural flow of 84 BCM/year, with an annual allocation of 18.5 BCM/year for Sudan. The evaporation losses from the reservoir are on average 10 BCM/year [44]. AHD plays a pivotal role in the water resources and economic sectors of Egypt, and as a result, the operation of the reservoir has an enormous impact on Egypt and part of the Sudanese territories. The advantage of building this large dam, instead of a series of smaller dams, is that it is able to help Egypt have better protection against long-term floods and droughts. For example, AHD played an important role in mitigating the droughts between 1979–1987 and the floods between 1998–2002 [45]. The location of the lake is shown in Figure 1. AHDR has several outflows, including the main spillway, the emergency spillways, the Toshka uncontrolled spillway, and the water pumped for the Toshka Project.
As mentioned before, reliable assessment of evaporation is crucial in the water balance modeling of the lake [46]. Many researchers [47,48,49,50,51] have investigated the evaporation in Aswan High Dam Reservoir and concluded that the evaporation through the lake ranged between 12 to 16 BCM/Year. The Ministry of Irrigation and Water Resources in Egypt states that the yearly mean of daily evaporation in the Aswan High Dam Reservoir is 7.54 mm/day with a maximum value of 10.8 mm/day in June and a minimum value of 3.95 mm/day in December [47]. Another study [52] analyzed 10-year evaporation data covering seasonal and interannual variations and concluded that, with a coefficient of variation of 63%, the mean evaporation rate for Aswan High Dam Reservoir was 5.88 mm per day, based on the Bowen ratio energy budget method. A detailed study [53] investigated the sensitivity and predicted the uncertainty of 12 evaporation models to estimate long-term evaporation based on 10 years of data. However, the error standard deviation of the best model, the Bowen ratio energy budget (BREB) method, was 1.67 BCM per year based on the previous calculations by [48]. In 2016, a study [54] applied the bulk aerodynamic method over 20 years (1995/1996 to 2014/2015) and estimated the evaporation losses from 12.004 BCM to 15.53 BCM in 1995/1996 and 2007/2008, respectively, with an average of 13.62 BCM per year. Using GIS and remote sensing techniques [55], monthly evaporation rates were investigated. The average annual evaporation rates in the year 2006 were also estimated based on Aswan High Dam Authority (AHDA), surface energy balance system (SEBS) and Terra Moderate Resolution Imaging Spectroradiometer (MOD16ET), at about 6.93, 6.38, and 6.61 mm/d, respectively. In 2019, it was proposed to calculate the accurate spatial distribution of evaporation in the lake using a co-active neuro-fuzzy inference system (CANFIS) [56]. CANFIS was also used in another study for evaporation prediction in AHD [57]. From the literature, there are considerable differences between different methods of estimation regarding evaporation from the reservoir.
For the operation of the reservoir, its storage has been divided into three zones: the dead storage zone with a volume of 31.6 BCM and a top elevation of 147 m; the live storage zone with a volume of 89.7 BCM and elevation of about 175 m; and the flood control zone, which is nearly 40 BCM in volume and lies between the elevations of 175 and 182 m [58]. The operational policy is designed to provide for downstream demand as well as prevent river damage. There are a few restrictions in place such as a maximum release of 250 MCM/day to avoid downstream erosion and maintain water levels around 175 m at the beginning of the water year (August 1st) to fulfill high and low flood requirements. After the water level rises above 178 m, the 30 sluices of the emergency spillway are used to release the extra water, if necessary, to prevent flooding. Additionally, the uncontrolled Toshka spillway starts releasing the water towards the Toshka depression after the water level reaches above 178 m. Mubarak Pumping Station, located on the left bank of the reservoir, pumps water into El Sheikh Zayed Canal flowing to the Toshka Project. The New Valley Project in Toshka was developed in the Western Desert by the Egyptian government along with the huge Mubarak Pumping Station with a maximum discharge of 300 m3/s [59].
One of the mail challenges of developing an accurate long-term water budget model for the AHD reservoir is the existence of the Toshka lakes [60]. In the flood season of 1998, the water started to enter the Toshka depressions when the water level was above 178 m above MSL [61]. In the same study, it was predicted that the Toshka lakes would start to vanish in 2012 and disappear gradually by 2019. Globally, surface water temperatures (SSTs) of the lakes have increased at an average rate of 0.34 °C per decade, similar to air temperature trends [62], and are expected to increase 16% by 2100. This increase may be also dependent on some local factors, such as solar radiation in this region, which is characterized by the highest solar energy potential in the world [63]. In 2009, a study [64] evaluated the expected evaporation losses from the Aswan High Dam Reservoir and concluded the change would be quite negligible with an increase of only 0.29% due to the combined impact of temperature rise, which would raise the humidity and reduce the wind speed. With the population increasing and no other major water resources available, developing an efficient long-term management plan for the reservoir to mitigate the effects of climate fluctuation in the Nile River Basin is becoming both more challenging and crucial [65].
3. Data and Methodology
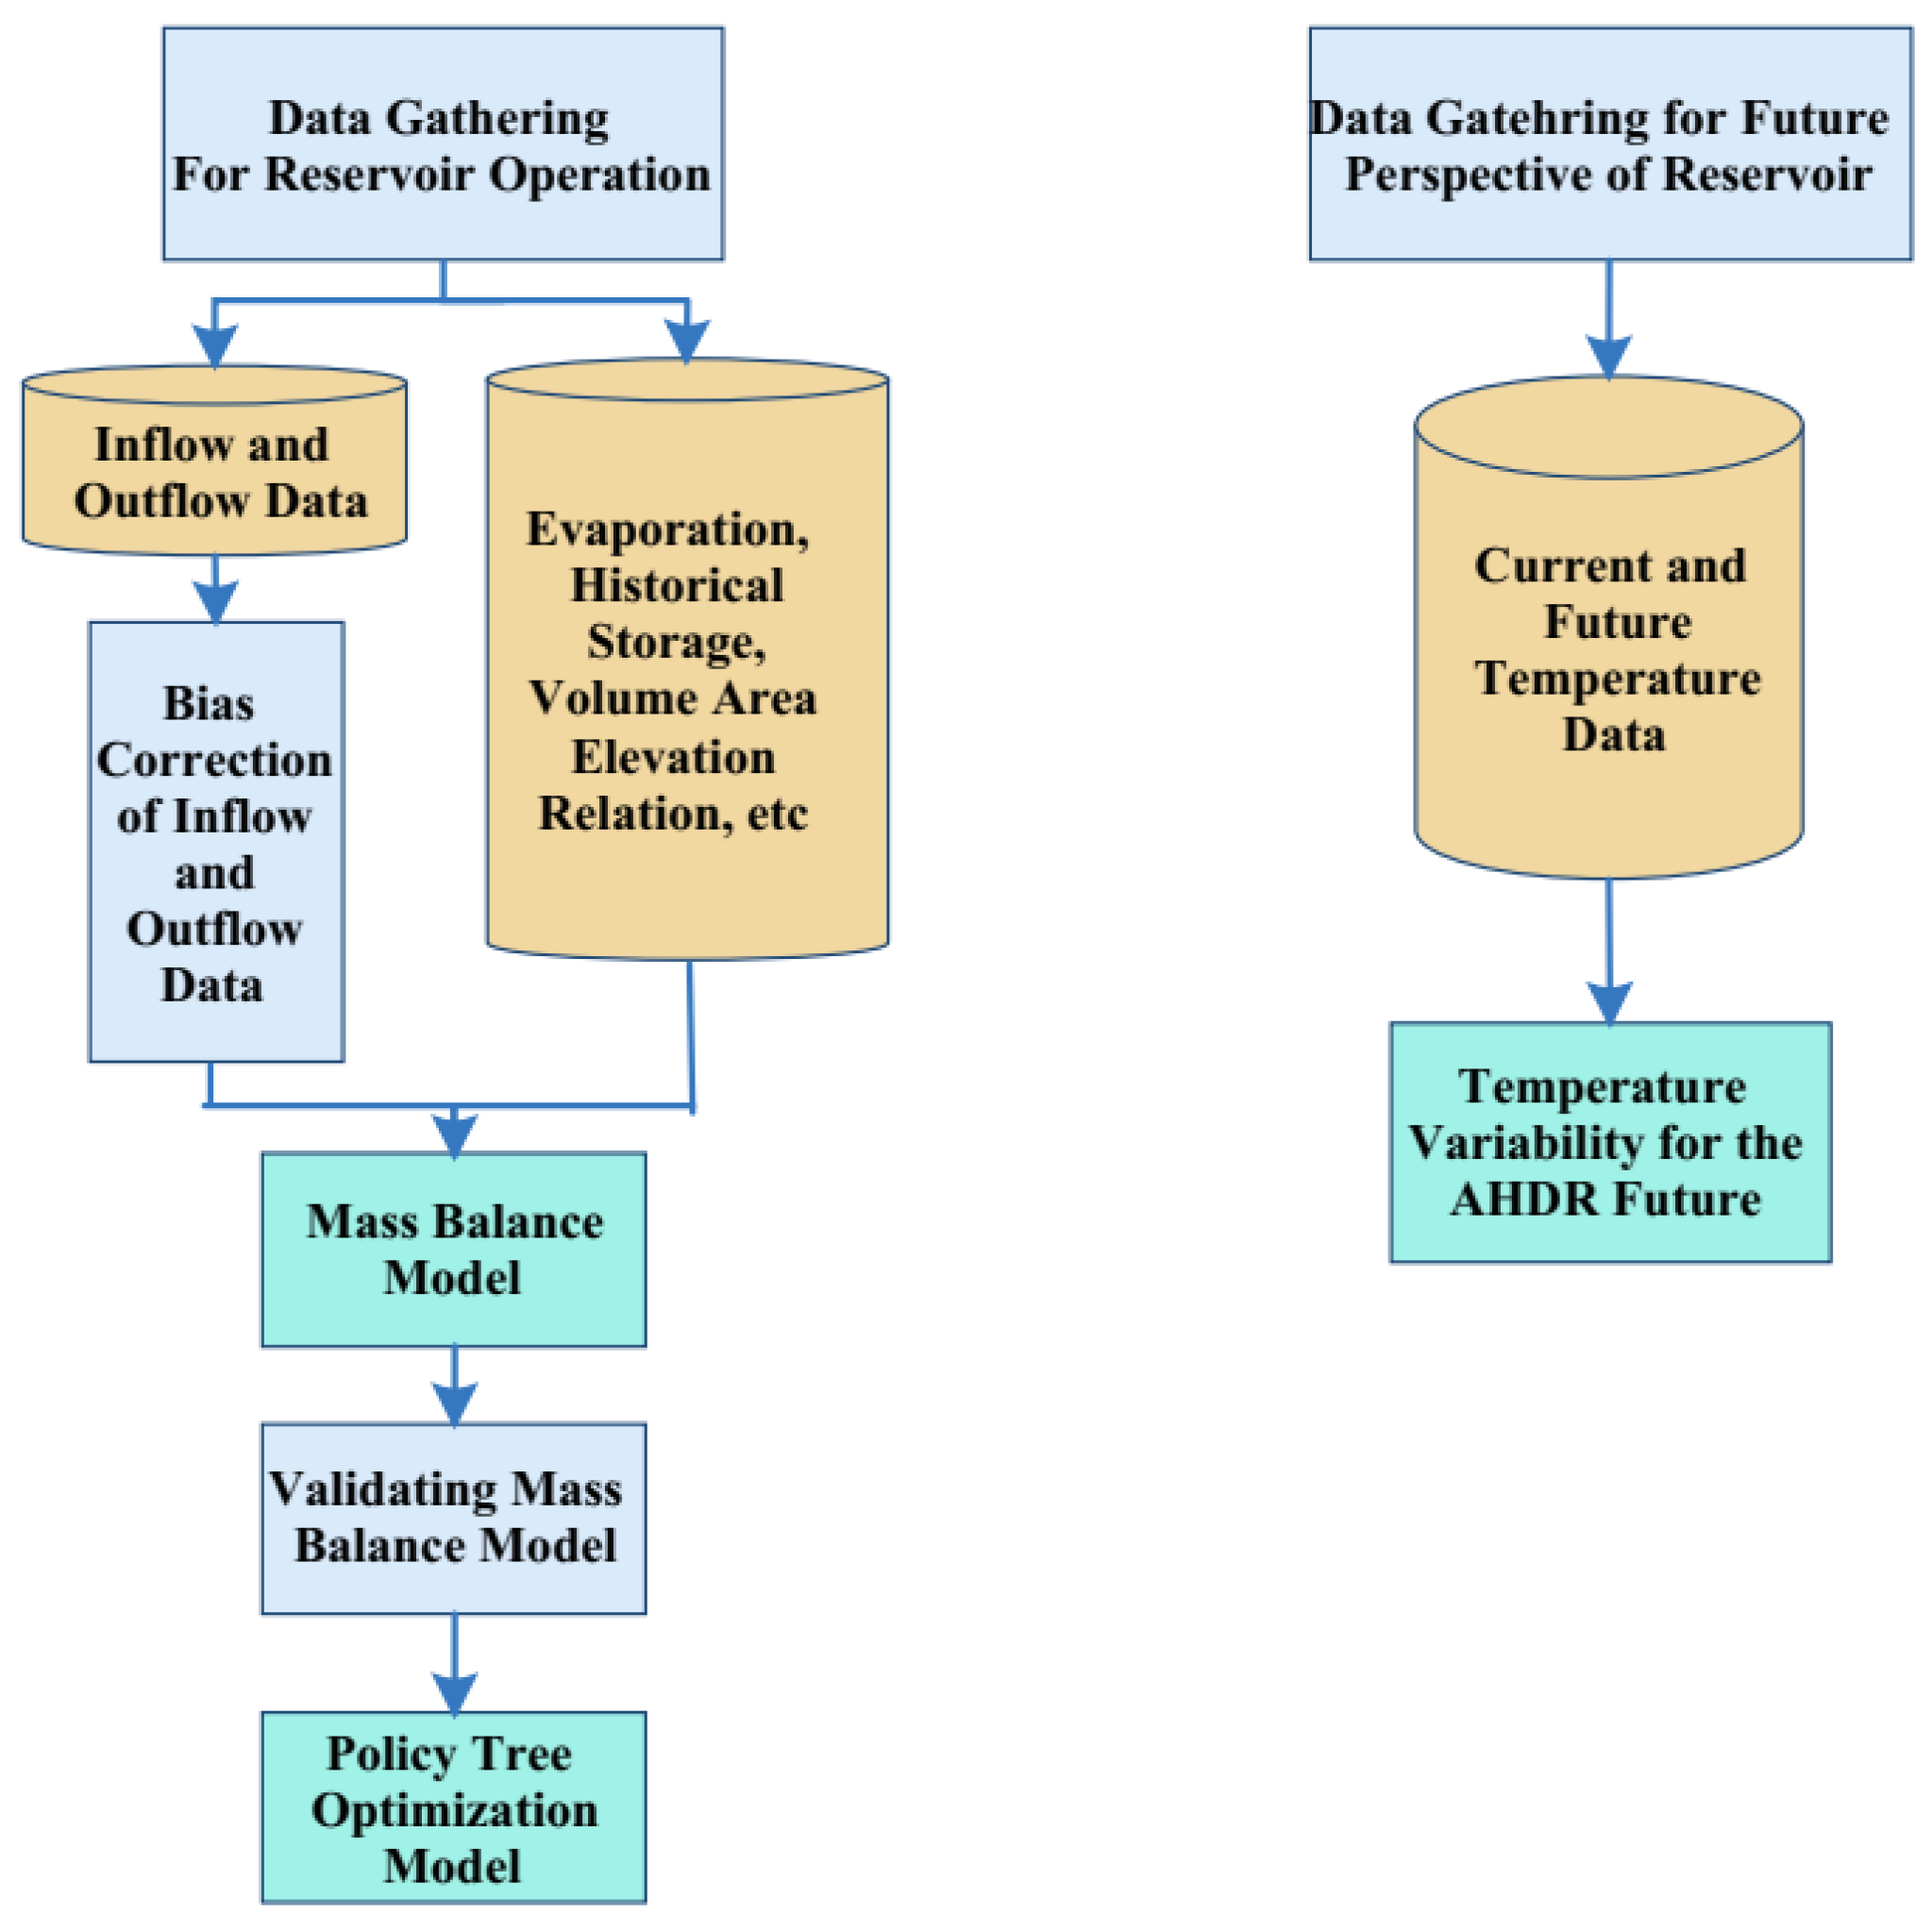
In this section, the steps of the methodology are presented. First, the sources of data used for simulation of the reservoir operation are described and the future perspectives on the reservoir and corresponding data sources are presented. Then, the bias correction process for the reservoir inflow and outflow data is explained, and finally, the simulation model and policy tree optimization model are described in detail. Figure 2 shows the general steps of the methodology.
3.1. Data Gathering
3.1.1. Nile River Discharge
Nile River discharge data were obtained from the Global Flood Awareness System (GloFAS) from 1979-01-01 up to near real-time. This dataset was freely downloaded from the Copernicus Emergency Management Service (CEMS) via (https://cds.climate.copernicus.eu/cdsapp#!/dataset/cems-glofas-historical?tab=overview, accessed on 20 March 2022).
These data were simulated by forcing the hydrological river routing model with modeled gridded runoff data from global reanalysis. The land surface model that produced the runoff was HTESSEL, and the river routing model component was LISFLOOD, run with a 0.1° × 0.1° spatial resolution at a daily time step. It has been shown that this dataset provides a relevant tool to estimate how much water is flowing in rivers [66].
Observed data for the River Nile discharge located at Aswan High Dam Station (1979–1984), Dongola Station (1979–1984) were freely extracted from the Center for Sustainability and the Global Environment (SAGE; http://nelson.wisc.edu/sage/data-and-models/riverdata/keysearch.php?numfiles=50&startnum=1100, accessed on 20 March 2022). The data were used to perform bias correction for the modeled Nile River discharge data.
3.1.2. Total Precipitation (TP)
Hourly gridded TP data (1979–2018) were extracted from the ERA5 database (ERA5, fully described in the upper section about T2m ERA5). Three-hourly gridded data from Tropical Rainfall Measuring Mission (TRMM) data with a 0.25° spatial grid (TRMM-3B42-V7), 1998–2018 were collected. They used precipitation product (TRMM-3B42-V7) to merge gauge measurements with multiple satellites and space-borne sensors, including infrared, microwave, and radar data. TRMM-3B42-V7 provides a scientific tool to study TP dynamics over a finer spatiotemporal resolution with some uncertainties [67,68,69]. (Due to data availability, ERA5 TP was used only from 1979 to 1997 and TRMM data was used for the remaining period (1998–2018).
3.1.3. Total Evaporation (TE)
Two different sources (Gleam; [51] and Global Land Evaporation Amsterdam Model (GLEAM-https://www.gleam.eu/, accessed on 20 March 2022) were used separately to estimate open-water evaporation over the High Aswan Dam Reservoir.
- Daily gridded data from GLEAM (GLEAM v3.3b), 2003–2020 were mainly based on satellite data [70].
- Ref. [51] described a model to estimate TE (= 0.06164 (1 + 0.062633 u) (1-RH) es), with known values for relative humidity (RH), wind speed at 2 m height above ground (m/s), and the saturated vapor pressure (mb).
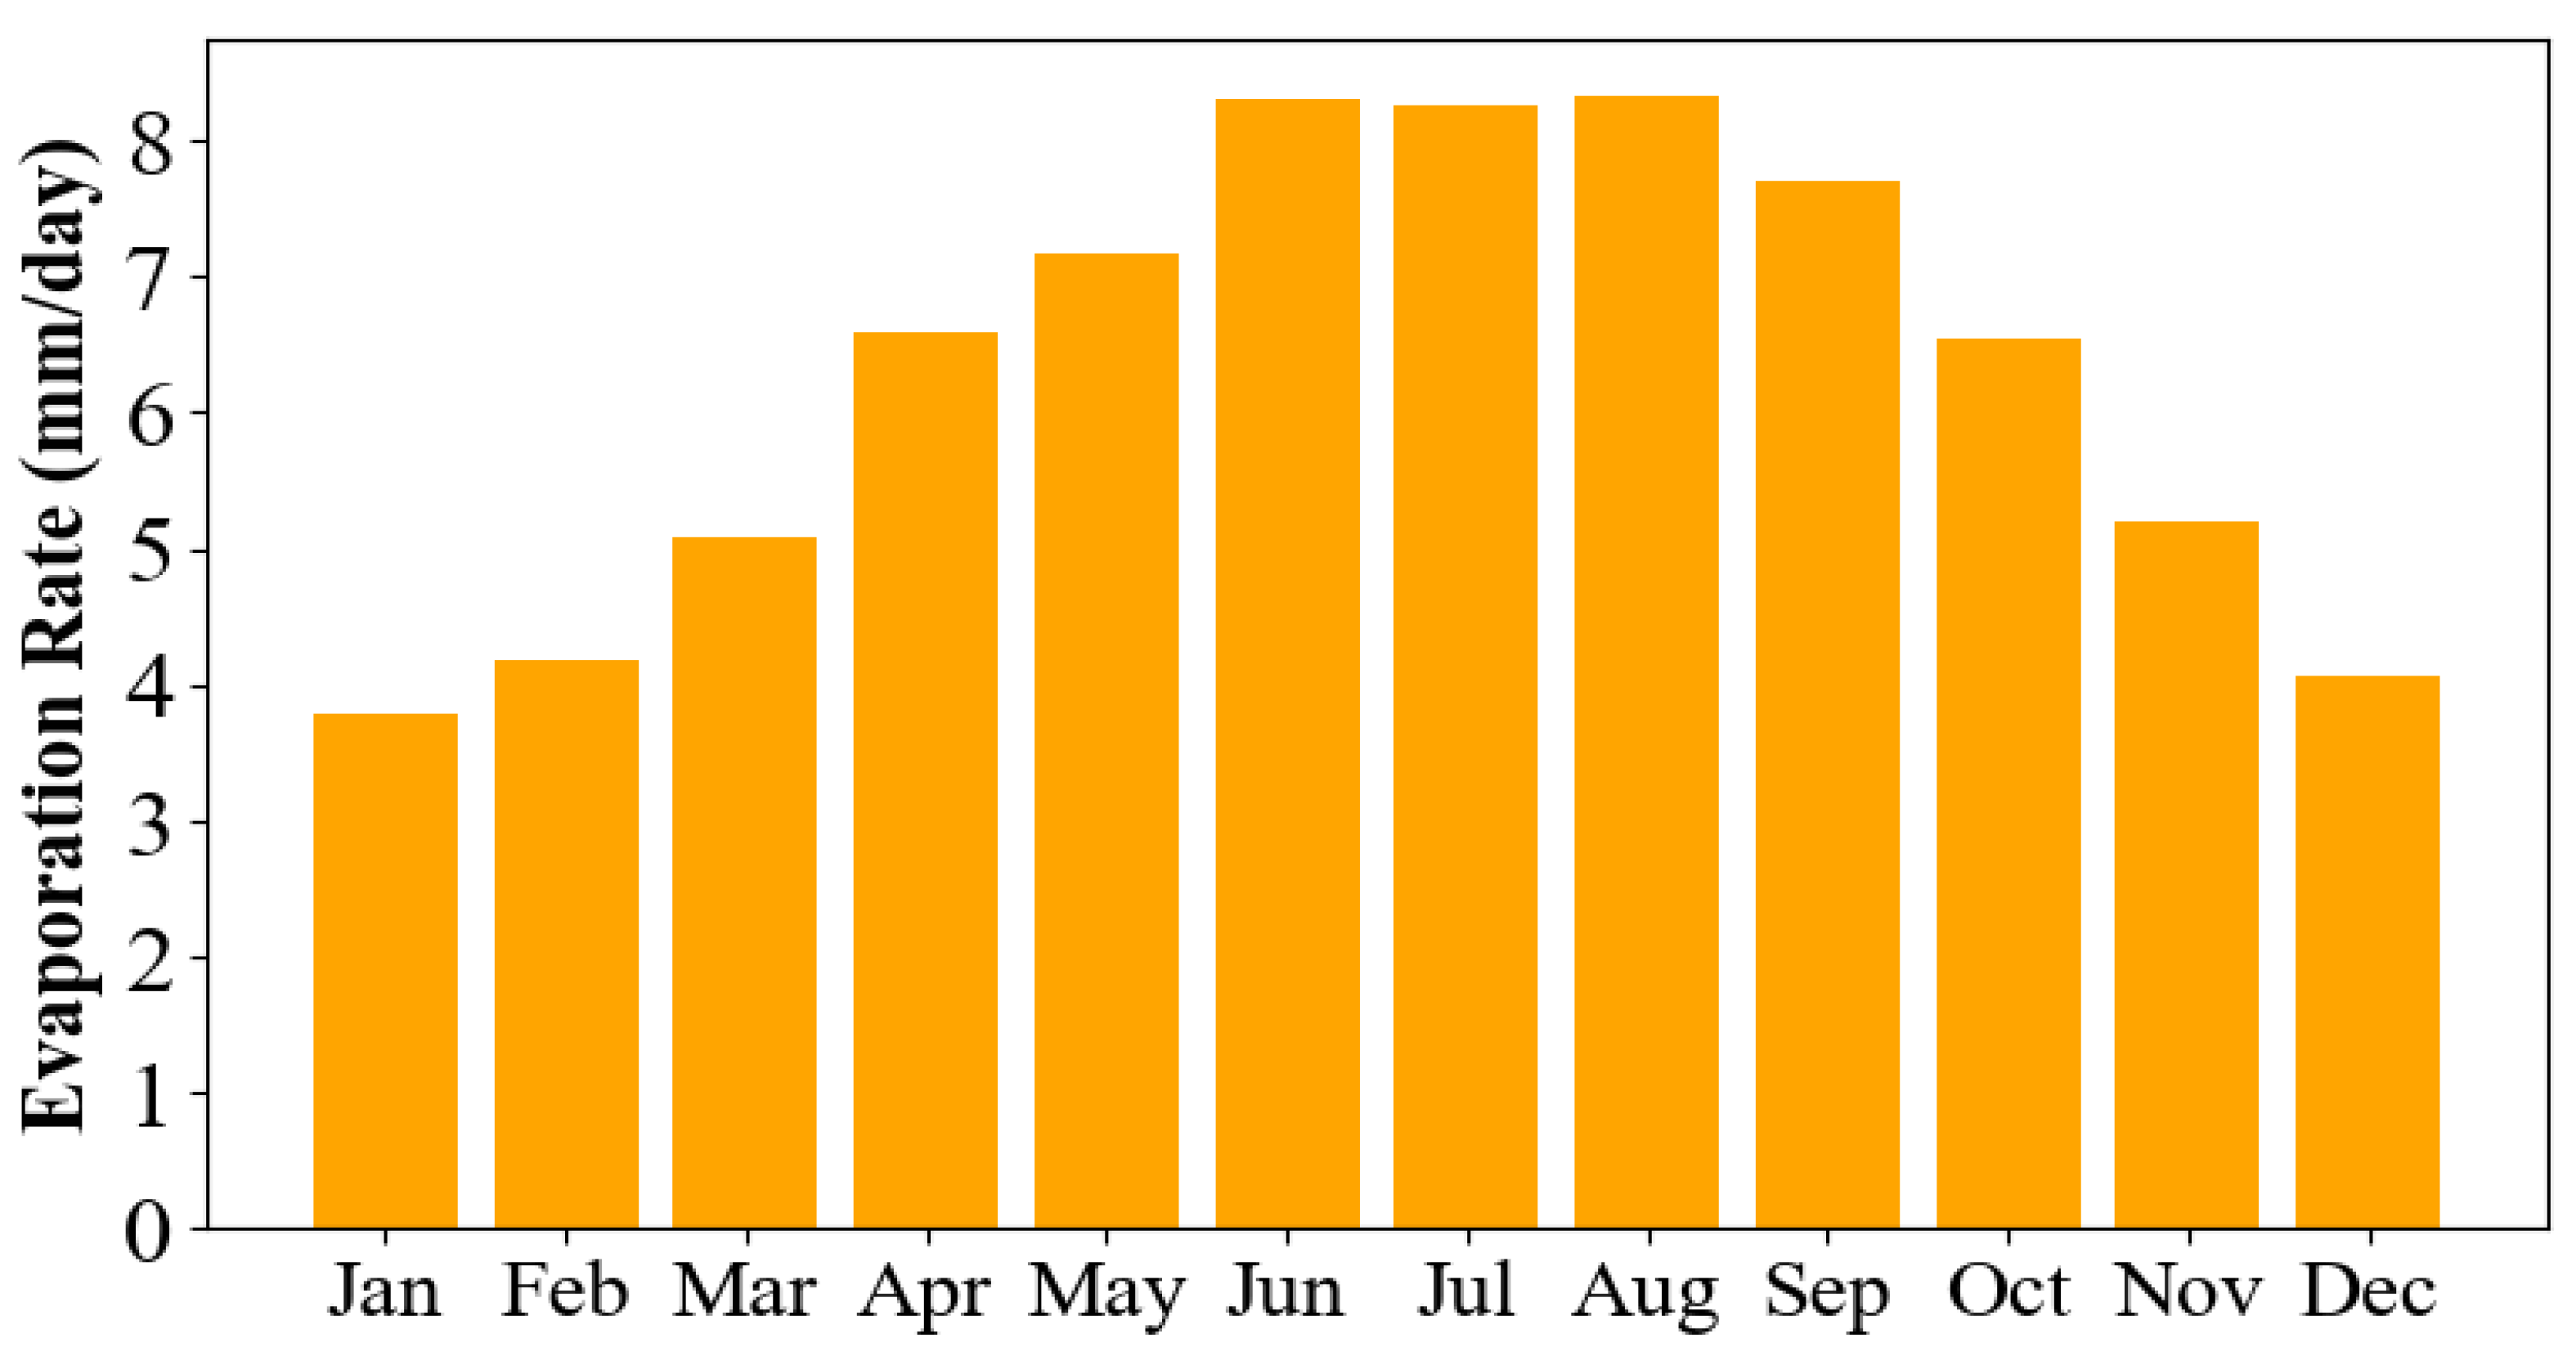
Total evaporation datasets were used as inputs to the model, and a comparison between the simulation results and historical observation of the lake elevation was performed. The average monthly evaporation rate used during the simulation is presented in Figure 3.
3.1.4. Historical Lake Elevation Data
The data from the following sources were directly used in the model as a reference to calculate the accuracy of the simulation.
3.2. Future Perspectives for Sustainable Management of the Aswan High Dam Reservoir
For future management of Aswan High Dam Reservoir, it is important to understand the current and future warming variability. Modeling the future warming dynamic for Aswan High Dam Reservoir is the key factor to project future evaporation, which has a significant effect on water balance calculations. Evaporation projection merits our consideration and will be discussed in our future work. However, the temperature variability for the Aswan High Dam Reservoir future has been discussed here.
Hourly gridded T2m data, from 1979 to 2018, were extracted freely from the ERA5 with a spatial resolution of 0.25° × 0.25° (https://cds.climate.copernicus.eu/cdsapp#!/dataset/reanalysis-era5-single-levels?tab=form, accessed on 20 March 2022). ERA5 replaced the successful old version (ERA-Interim) with a significant improvement in its model physics and core dynamics [73]. According to C3S (2017), ERA5 is strongly recommended to analyze the current climate correctly.
Daily simulated data on surface air temperature (Tas) for the 2006–2100 period were extracted based on three different Geophysical Fluid Dynamics Laboratory (GFDL) general circulation models; GFDL-ESM2M [74,75], GFDL-CM3 [76], and GFDL-ESM2G [74,75]. Each model contains daily data covering the four Coupled Model Intercomparison Project, phase five (CMIP5) future emission scenarios with a coarse grid resolution of 2° × 2°; RCP2.6, RCP4.5, RCP6.0, and RCP8.5. These realizations are freely available via the GFDL website (ftp://nomads.gfdl.noaa.gov/CMIP5/output1/NOAA-GFDL, accessed on 20 March 2022). For these three simulations, the GFDL model ensemble mean was also calculated. Direct annual biases (T2m minus Tas) were calculated for the four simulations (Ensemble mean, GFDL-ESM2M, GFDL-CM3, and GFDL-ESM2G) to evaluate their performance in describing the study area surface air temperature. Only the simulations that realistically described the T2m over the overlapped period (2006 to 2018) were used to project Tos through 2100.
3.3. Bias Correction
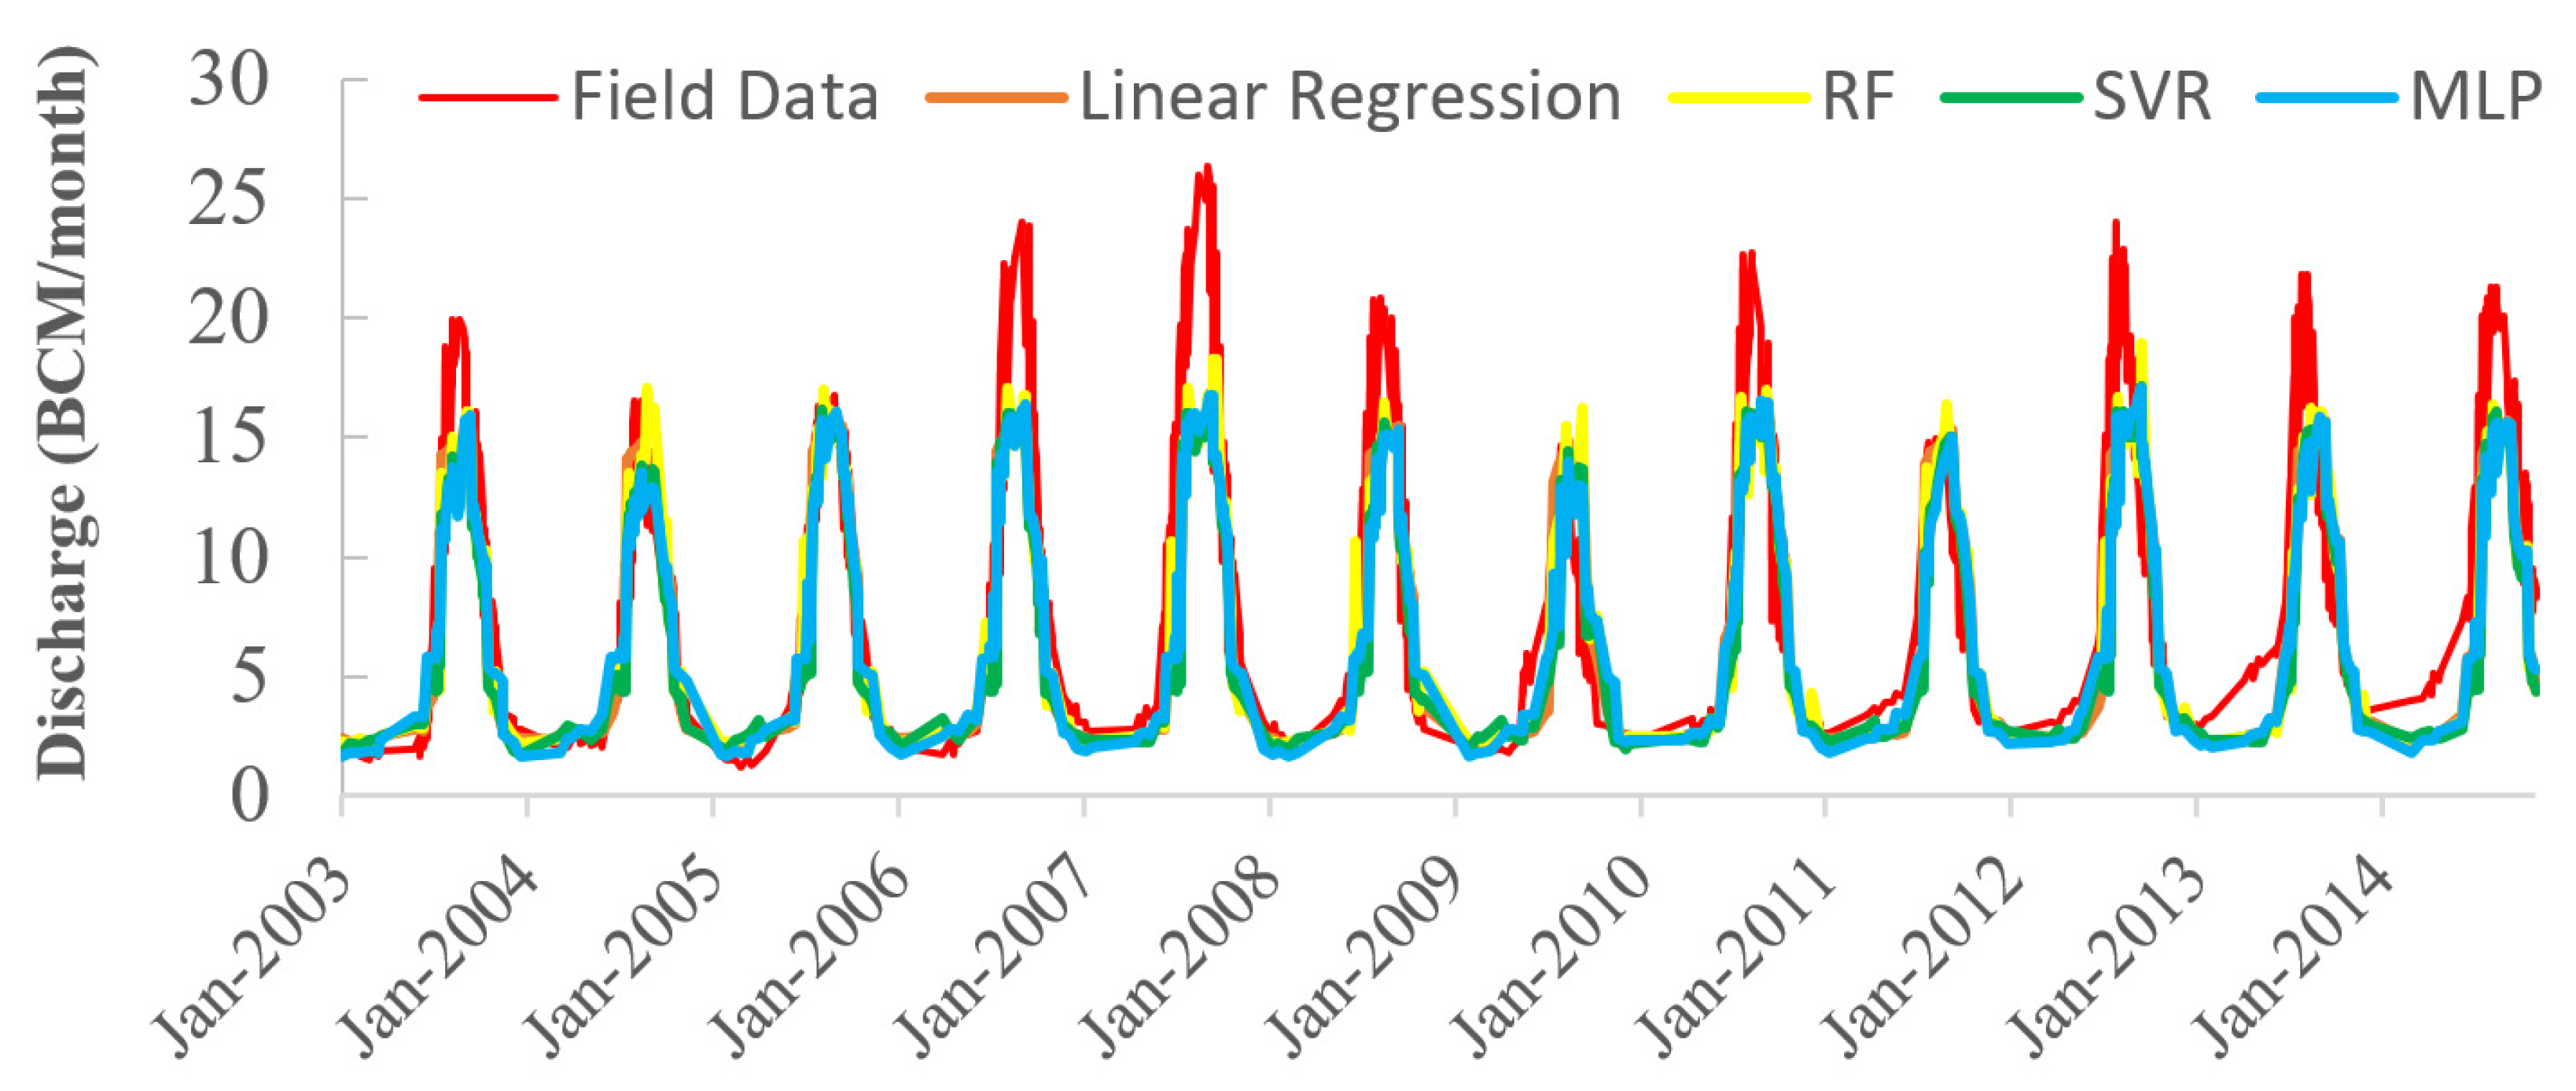
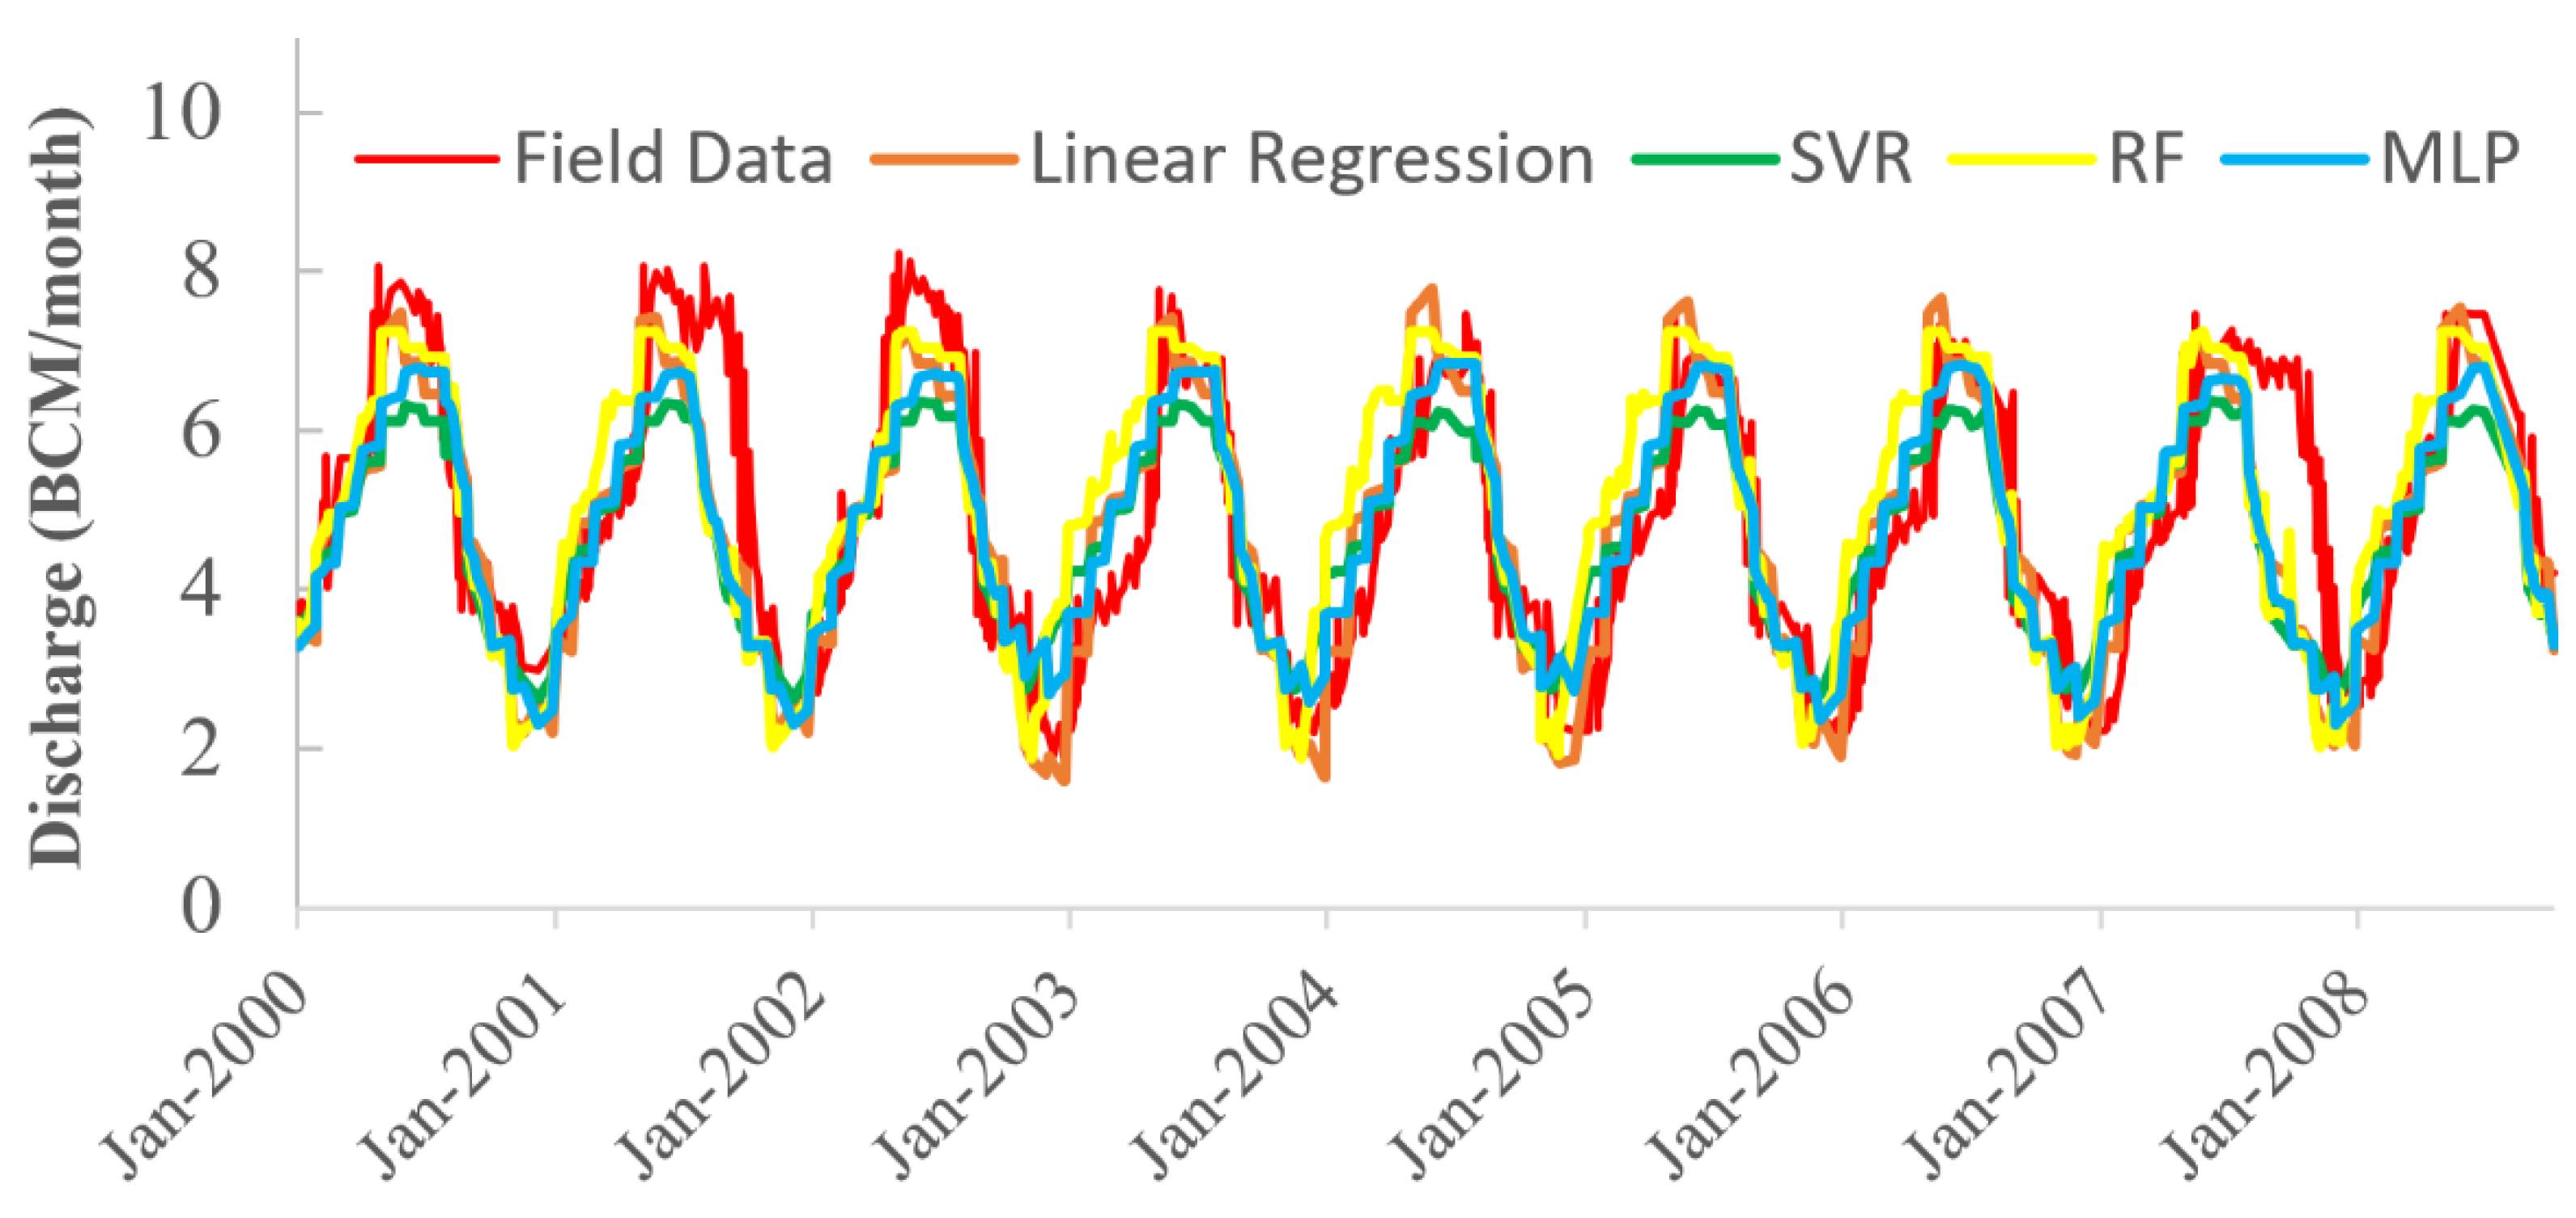
In this study, GloFAS data were used for reservoir inflow and outflow. These data were strongly biased, so bias correction was needed before using them in modeling. The data were split into training and validation datasets, and then, several different methods were used and evaluated. First, an LR function was fit to the training dataset. The same process was applied using three different machine learning methods, random forest (RF), support vector regression (SVR), and multilayer perceptron (MLP). The inputs of the machine learning (ML) models were the modeled streamflow data, historical streamflow data and the number of months. Each ML model was first trained, and the hyperparameter was tuned using the training dataset. In the next step, the LR and the three ML models were utilized to bias-correct the validation dataset, and the results were compared. The flowchart of the bias-correction procedure is illustrated in Figure 4.
Since the reservoir plays a significant role in regulating the flow, the outflow follows a simple pattern based on downstream demand. This changes the pattern and complexity of the outflow compared to inflow. Different machine learning models perform better on inflow and outflow. RF was chosen as the most accurate method for bias correction of the inflow data, and MLP was chosen for outflow data based on the results of the validation. The bias correction results are shown in Figure 5 and Figure 6, and the Nash–Sutcliffe, R-squared, and RMSE calculated for each method are presented in Table 1. The NSE and R-squared for the best method of inflow and outflow bias corrections were both more than 0.6, which was satisfactory. The time period shown in Figure 5 and Figure 6 is the period of available field data for Dongola and Downstream of AHD. After validating the machine learning models during this period, the trained models were used to bias-correct the inflow and outflow of the reservoir during the modeling period. These bias-corrected and validated data were then used in the simulation model, which is described in the following.
3.4. Simulation Model
A mass balance model was developed in python for the simulation of reservoir operation and water budget assessment. The evaporation and reservoir losses were given to the model in mm. To convert these losses to volume, first reservoir surface area was estimated using the volume-elevation-area curve, then evaporation losses and effective rainfall volume were calculated based on the following formula:
where PR is the precipitation volume, L is the evaporation loss volume, and P and Ev are precipitation and evaporation loss height, respectively.
After calculating the losses and precipitation, the outflow from Toshka via uncontrolled spillway was estimated using the formula developed by [71]:
in which El is the storage elevation.
Hydropower generation was estimated using the following formula:
specific weight of water, water released for hydropower generation, the efficiency of turbines (0.85), number of hours in the modeling time step and the head over the turbines calculated as the difference between reservoir elevation and turbine elevation:
The mass balance equation for the Aswan High Dam Reservoir was formulated as Equation (6):
where I is the inflow to the reservoir, R is downstream release, SLoss is seepage losses and TProject is the volume of water pumped in Mubarak Pumping station to supply the demands at Toshka Project. Seepage losses and Toshka Project demand volumes were given to the model as input data. The reservoir storage was simulated using this mass balance model and then the results were compared with historical storage data to test the accuracy of the model and input data. This validated mass balance model for AHD was then used to test the policy tree optimization model.
3.5. Policy Tree Optimization Model
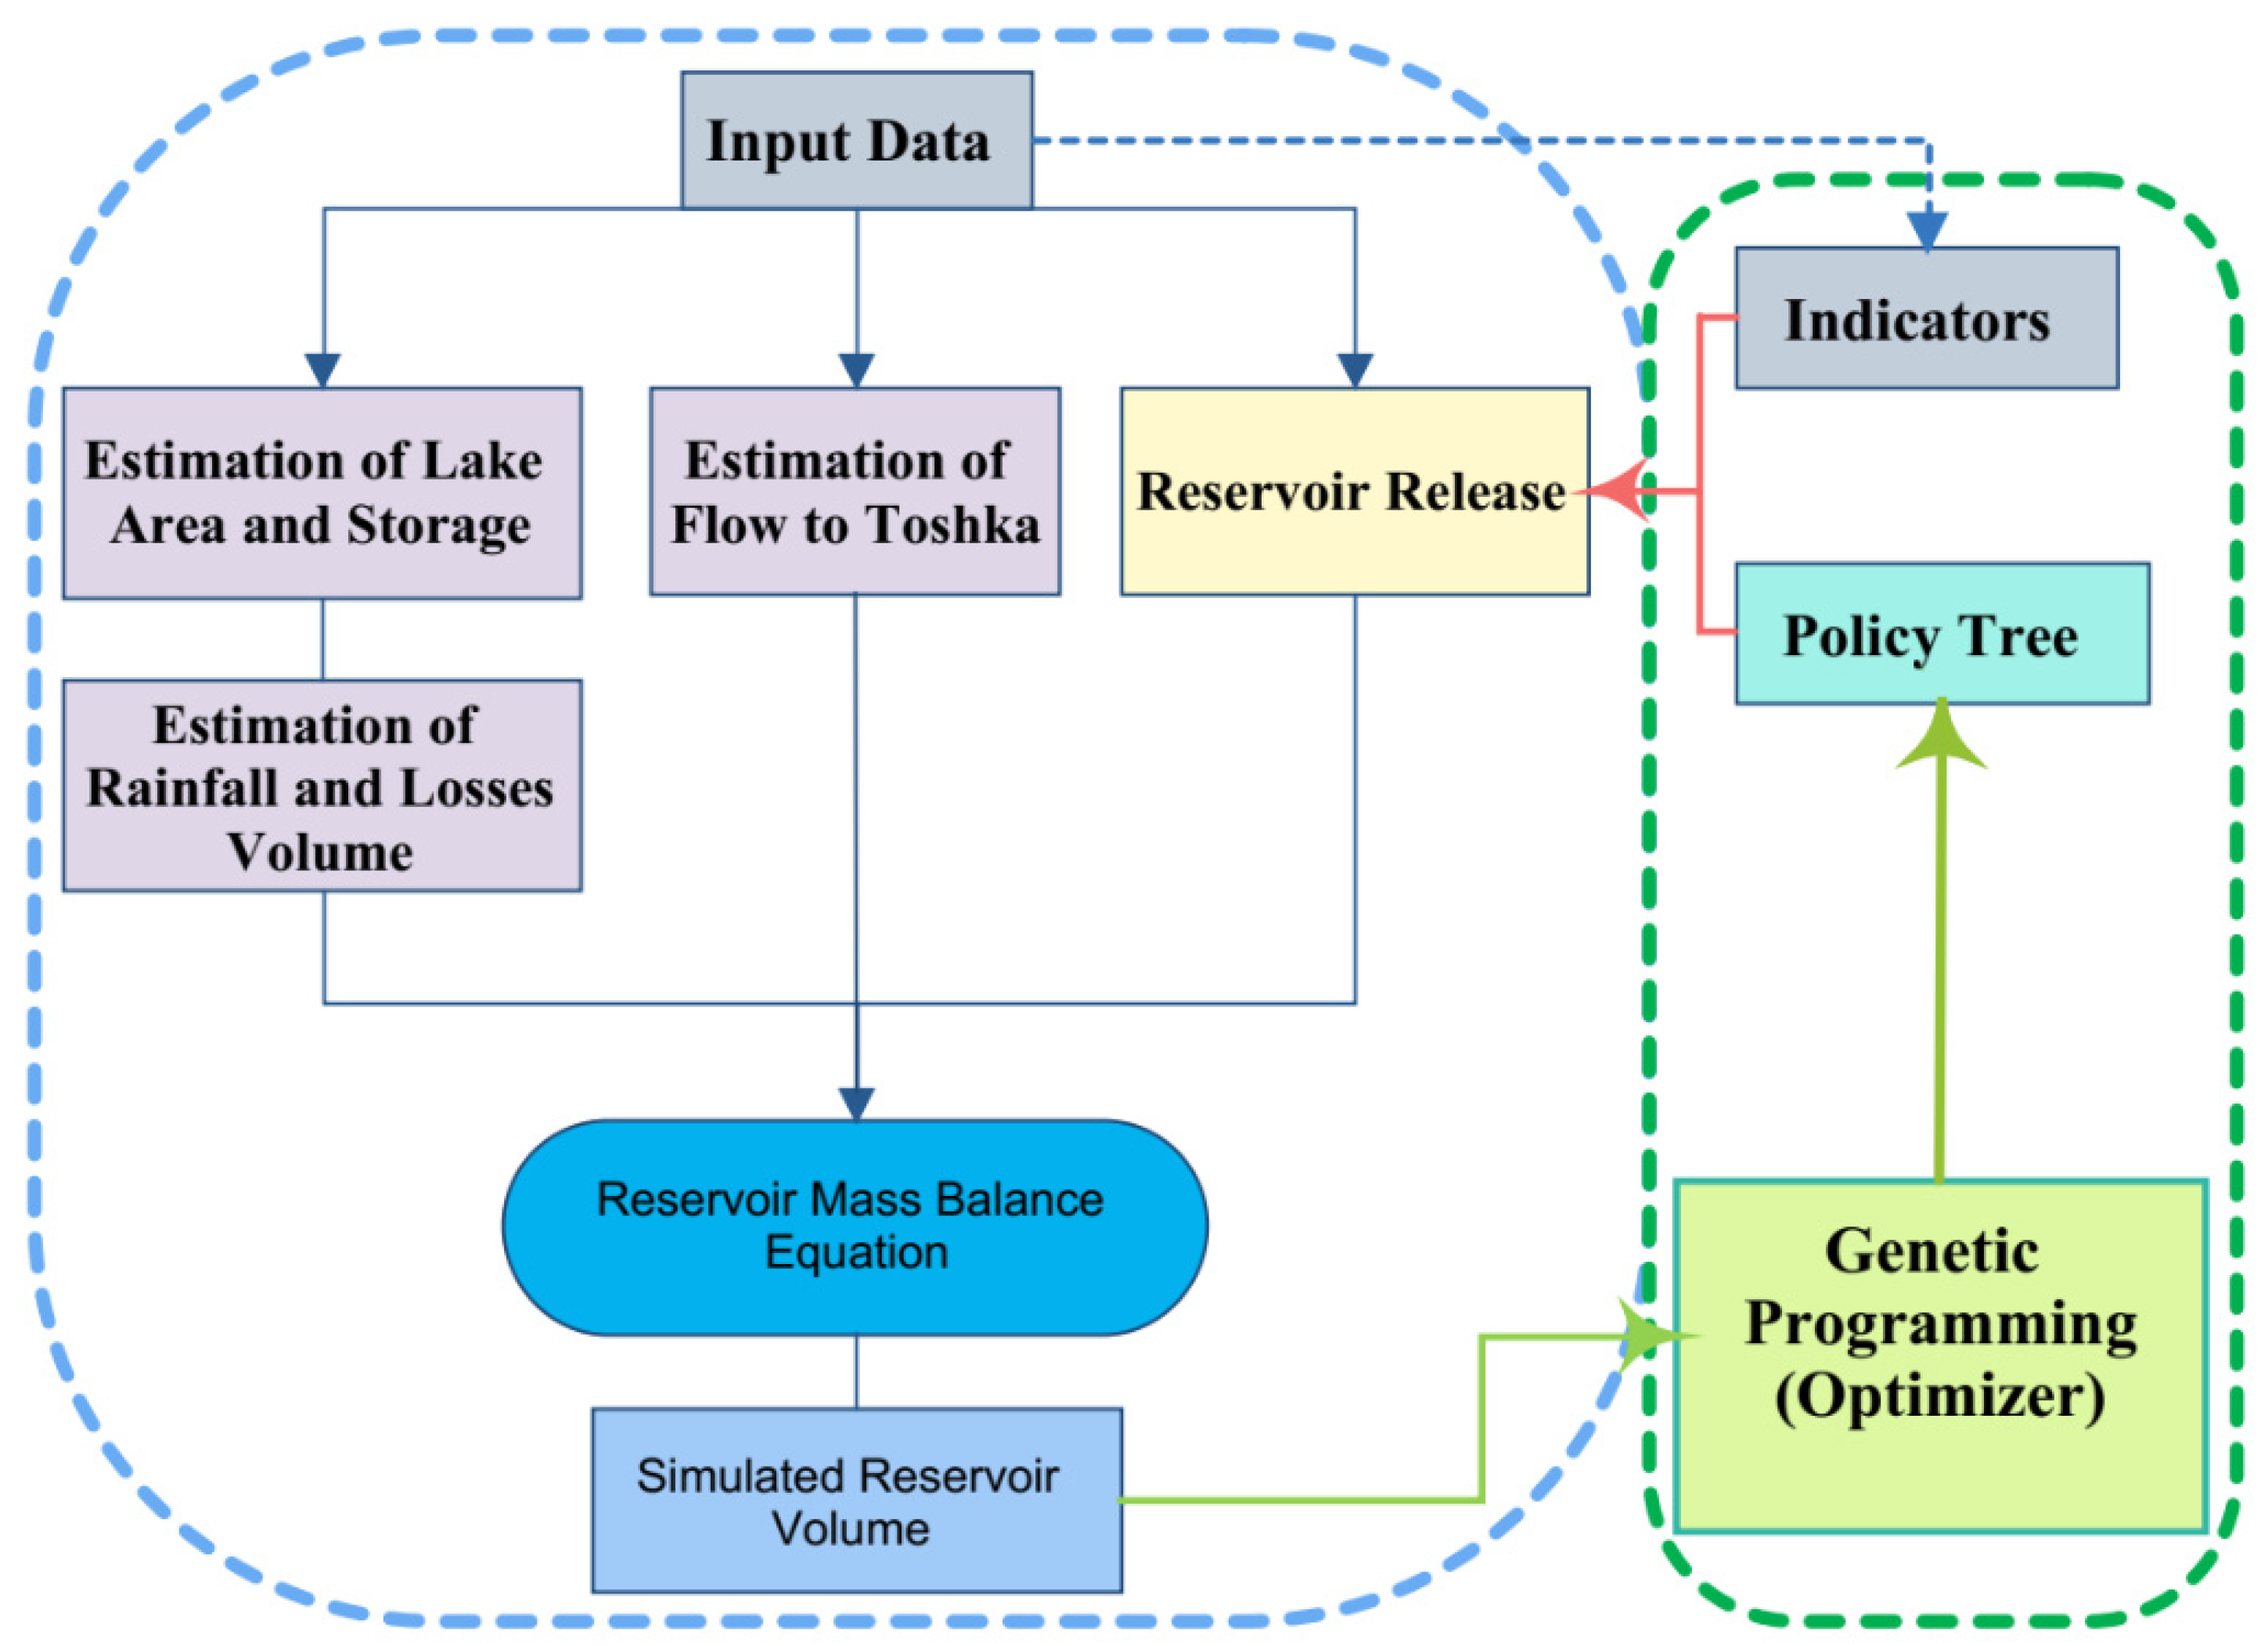
In order to improve the current operation of the AHD, a policy tree optimization model was used to find the optimized policy tree for the reservoir operation. The mass balance model was modified to be able to run based on a pre-defined policy tree, integrated with a policy tree optimization model developed by Herman and Giuliani (2018) [77], and tested for 10 years between 1997 and 2007. This algorithm optimized the structure of the policy tree using genetic programming.
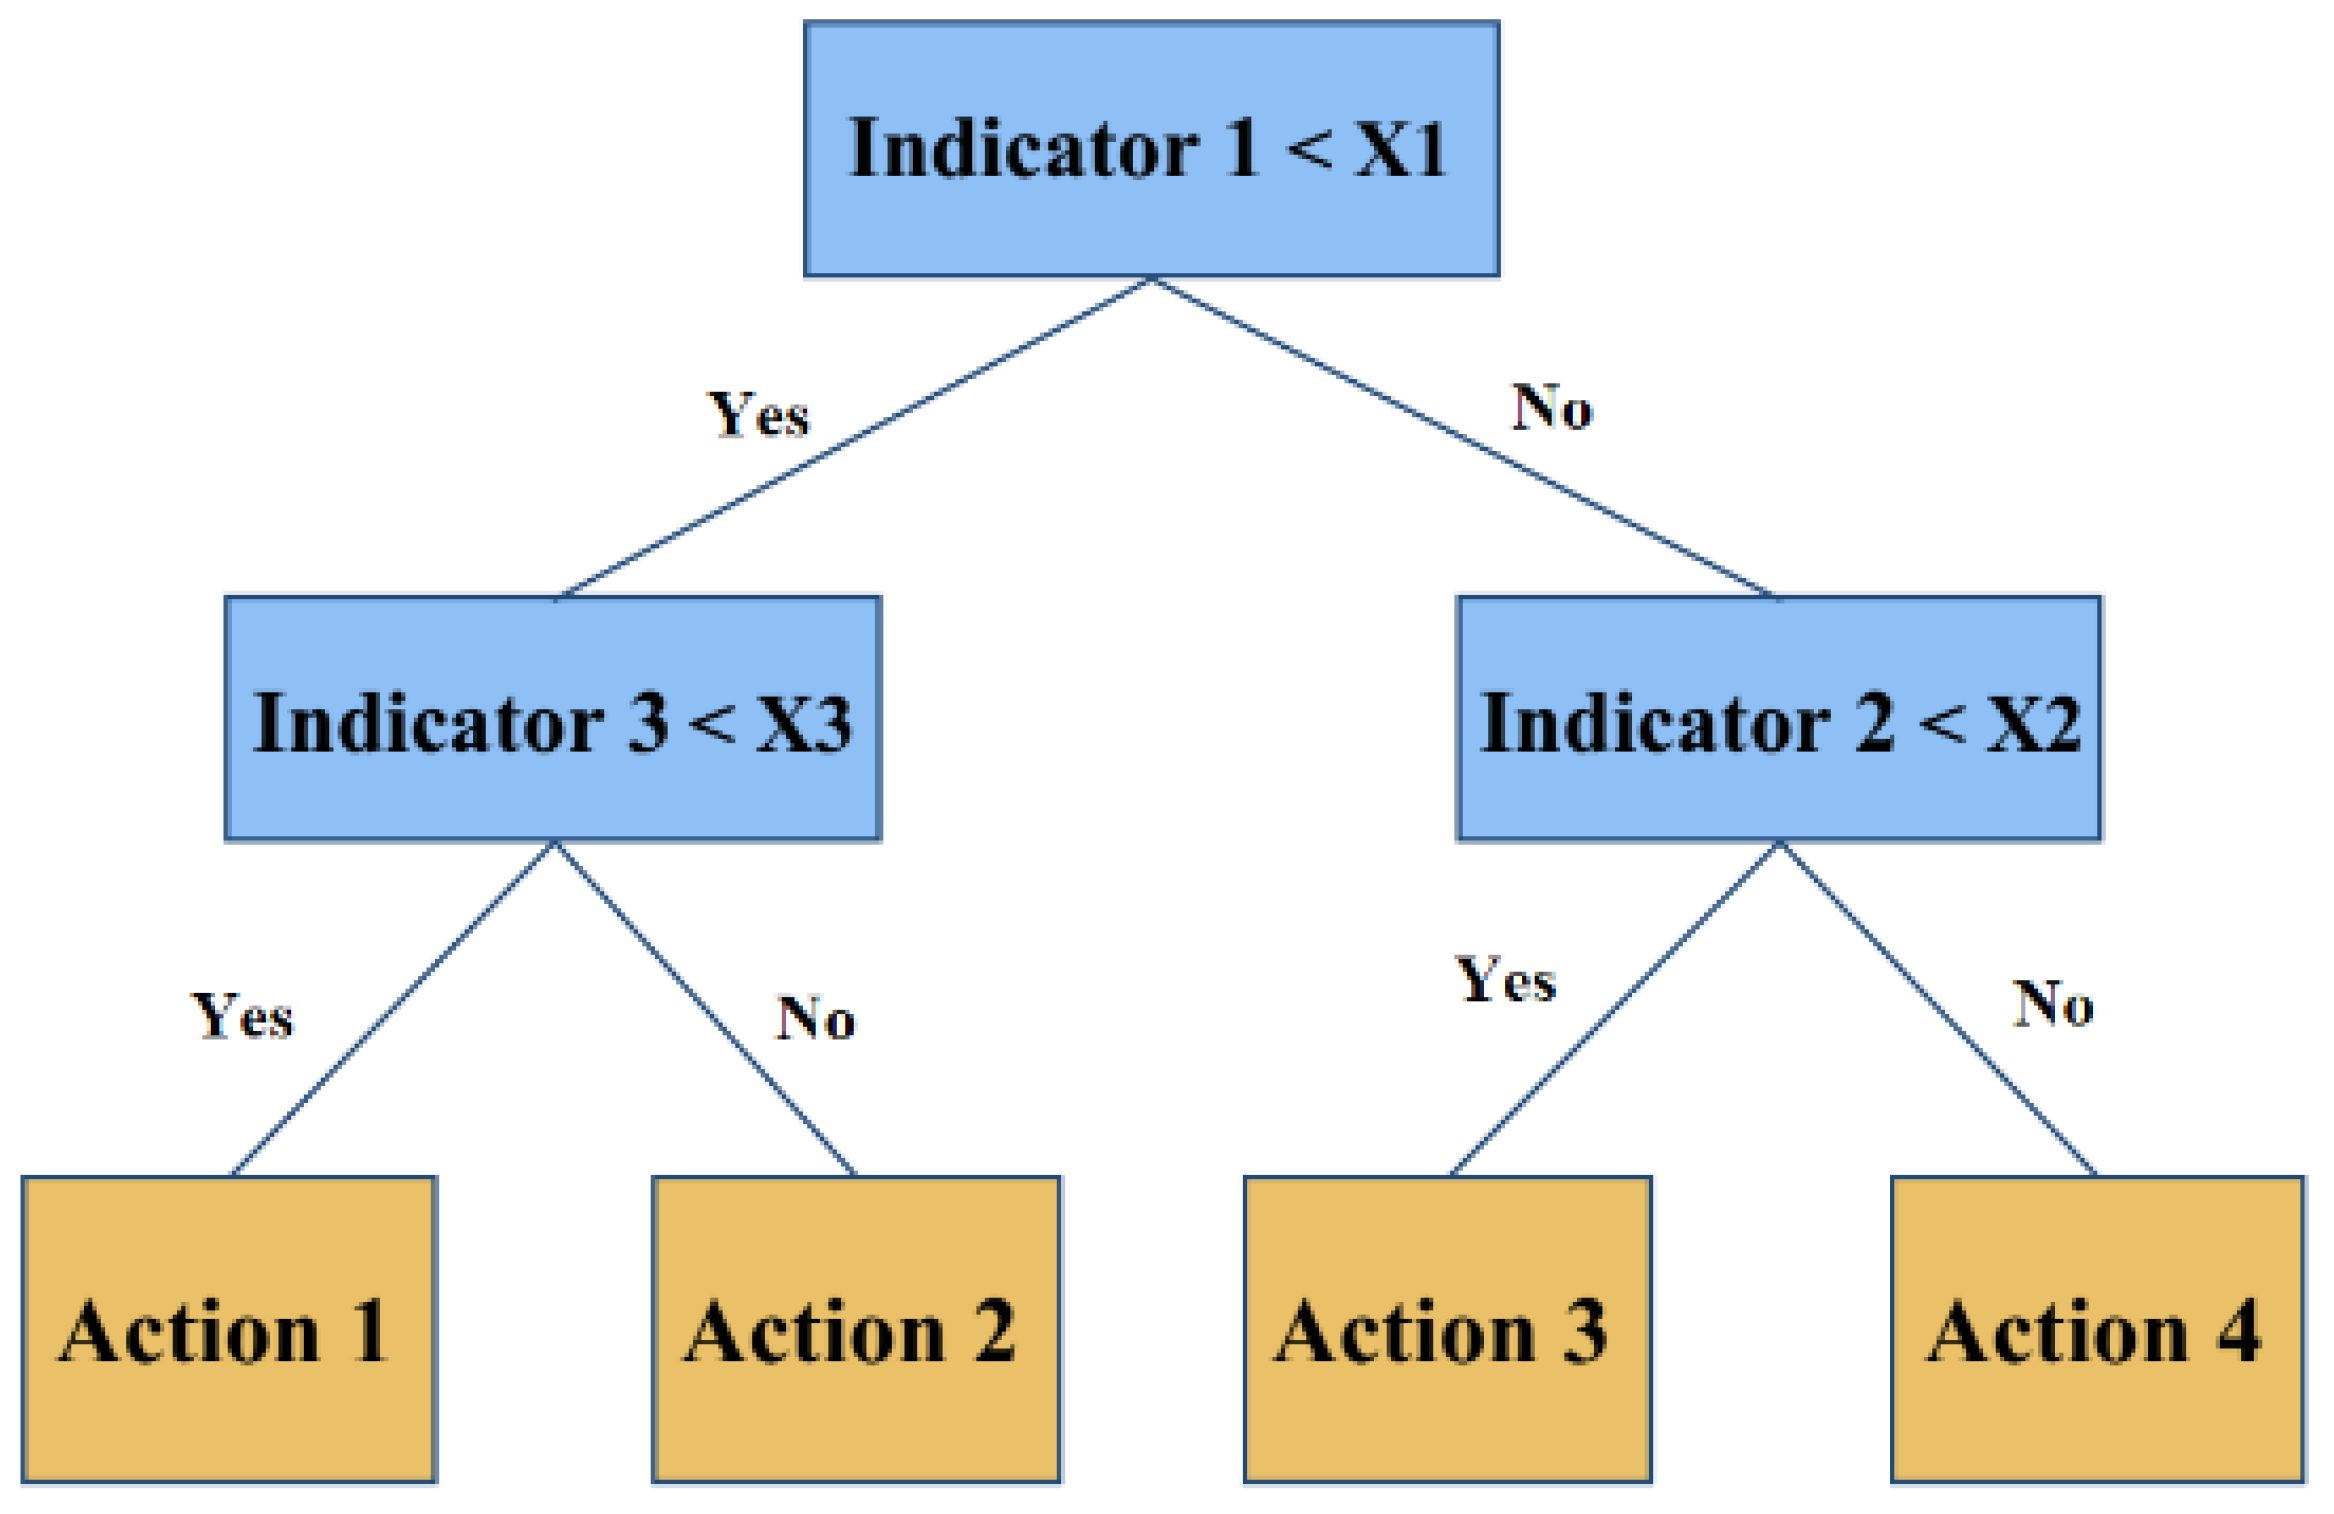
A policy tree optimization algorithm, unlike a traditional optimization algorithm, optimizes a set of predefined policies instead of a decision variable. A policy tree is a set of decisions that are triggered based on thresholds of the defined indicators such as the number of the month or reservoir inflow. Figure 7 shows a sample policy tree. In this study, we used three indictors: number of months, inflow to reservoir and reservoir storage. Based on the thresholds and the current value of the indicators, a policy was chosen in each month. The policies in this study included flood control release, release demand (releasing exactly as much water as downstream demand) and four hedging policies (releasing 60, 70, 80, and 90 percent of downstream demand).
The structure of such policy trees is optimized in an iterative scheme using the mutation and cross-over processes and based on the output of fitness or evaluation functions that measure the efficiency of policy trees. Cross-over is the process of creating a tree by randomly combining two chosen decision trees, called parents. The mutation is the random changes made in a tree to ensure diversity, i.e., making sure the population is exploring a wide and diverse decision space.
After the generation of a population in an iteration, the population is evaluated using the fitness function, which is the reservoir simulation model.
The structure of the optimization algorithm is illustrated in Figure 8. The objective function of the policy tree model is minimizing the sum of shortage cost and flood cost. Flood cost itself is composed of two parts, the flood cost of exceeding the maximum release of the reservoir and cost of going above the 178 m elevation:
4. Results and Discussion
4.1. Historical Simulations
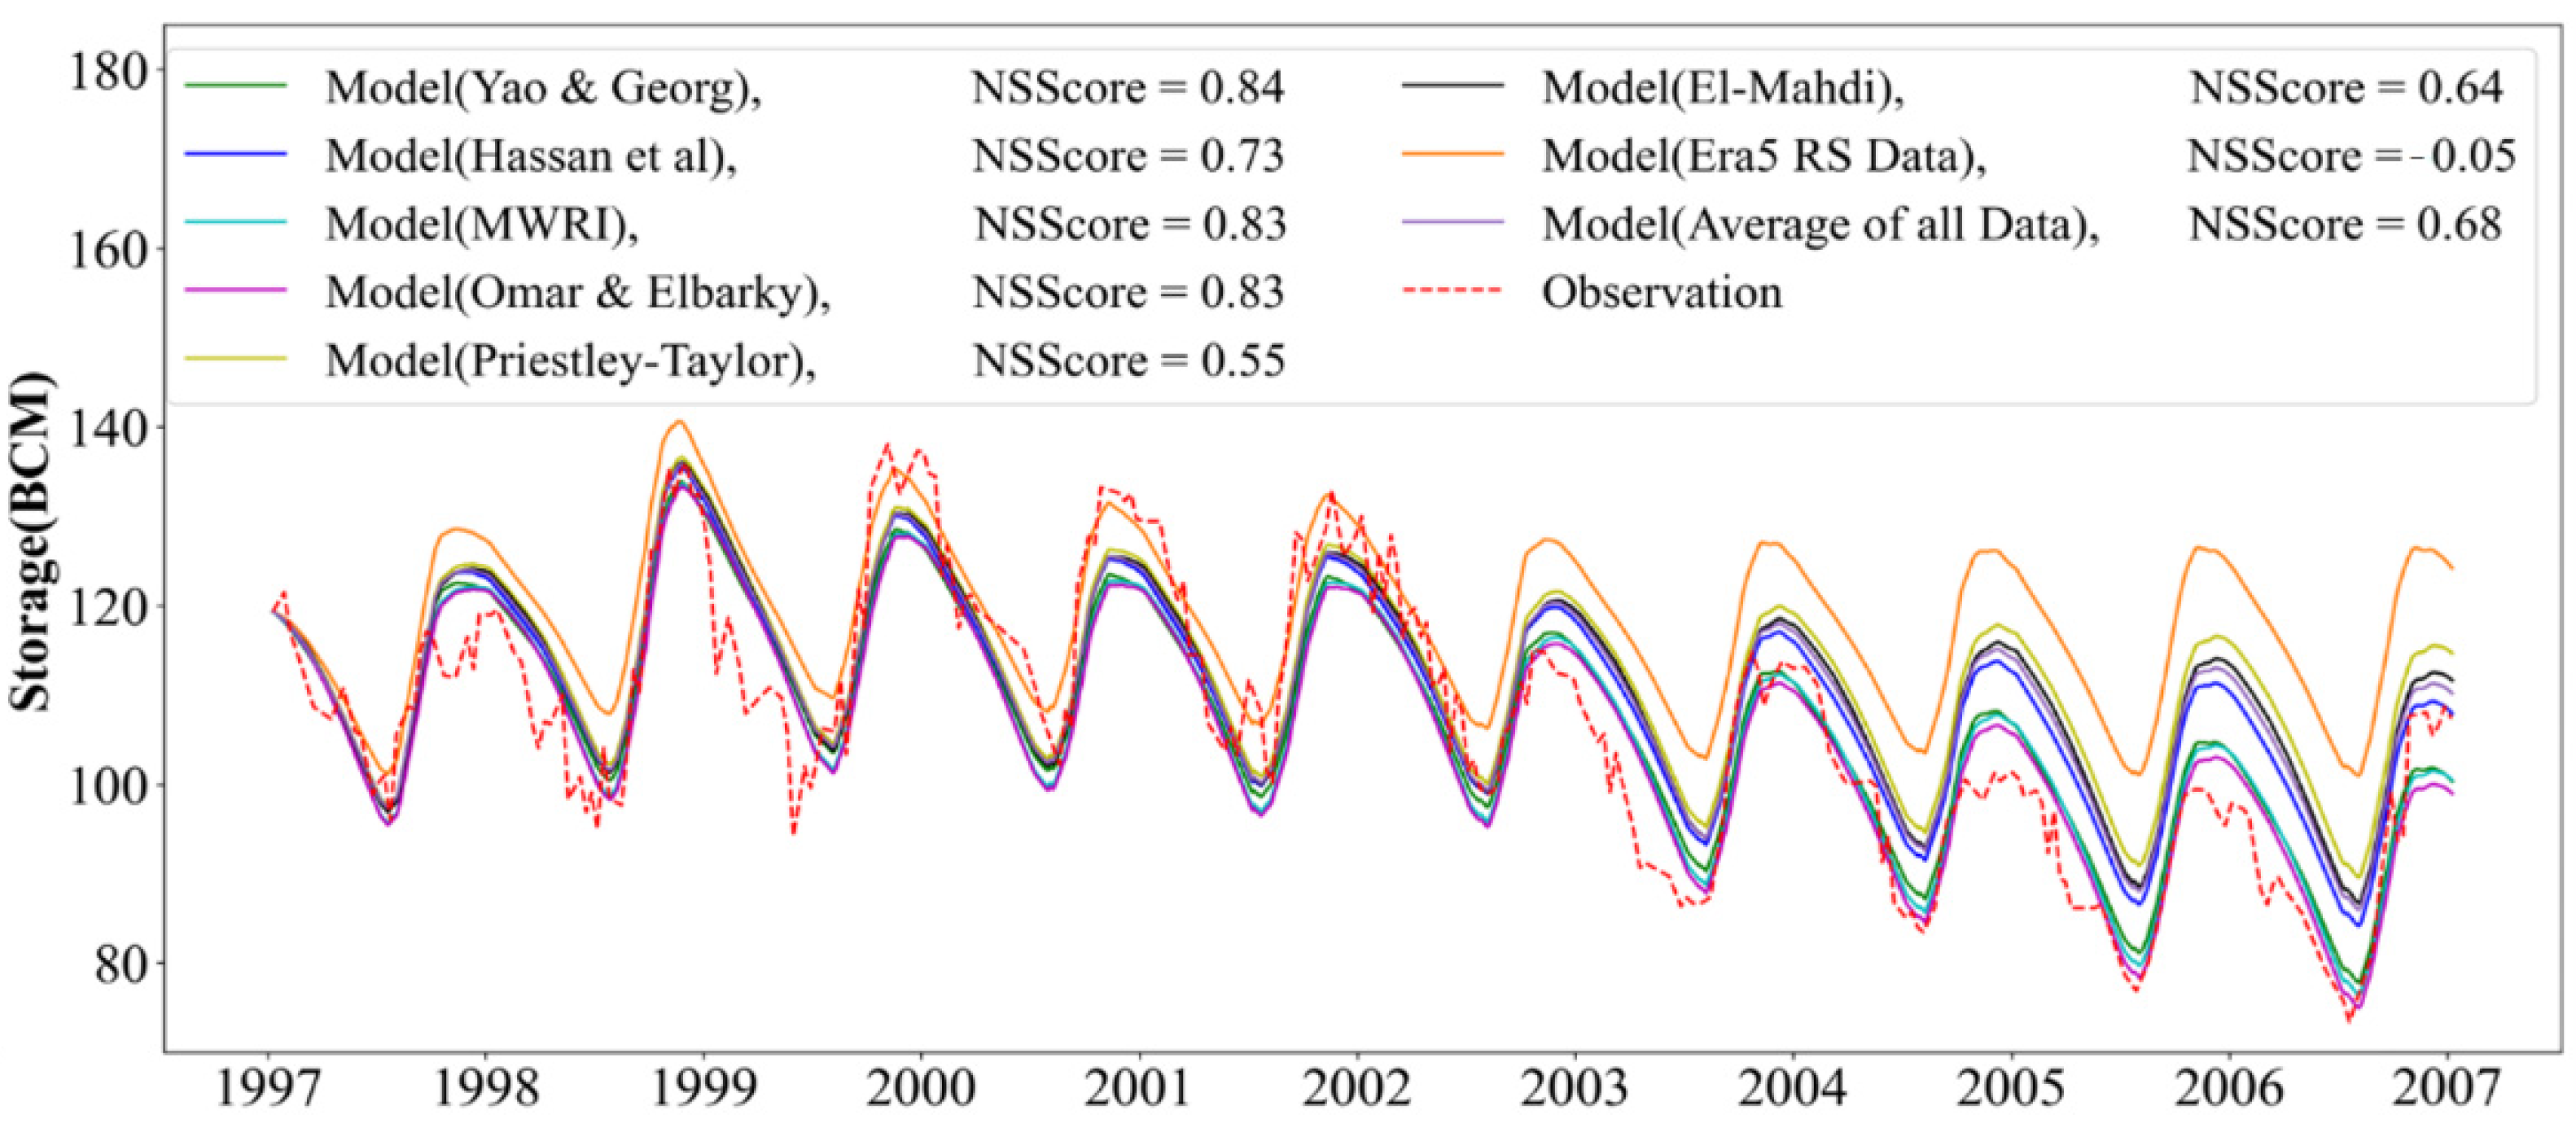
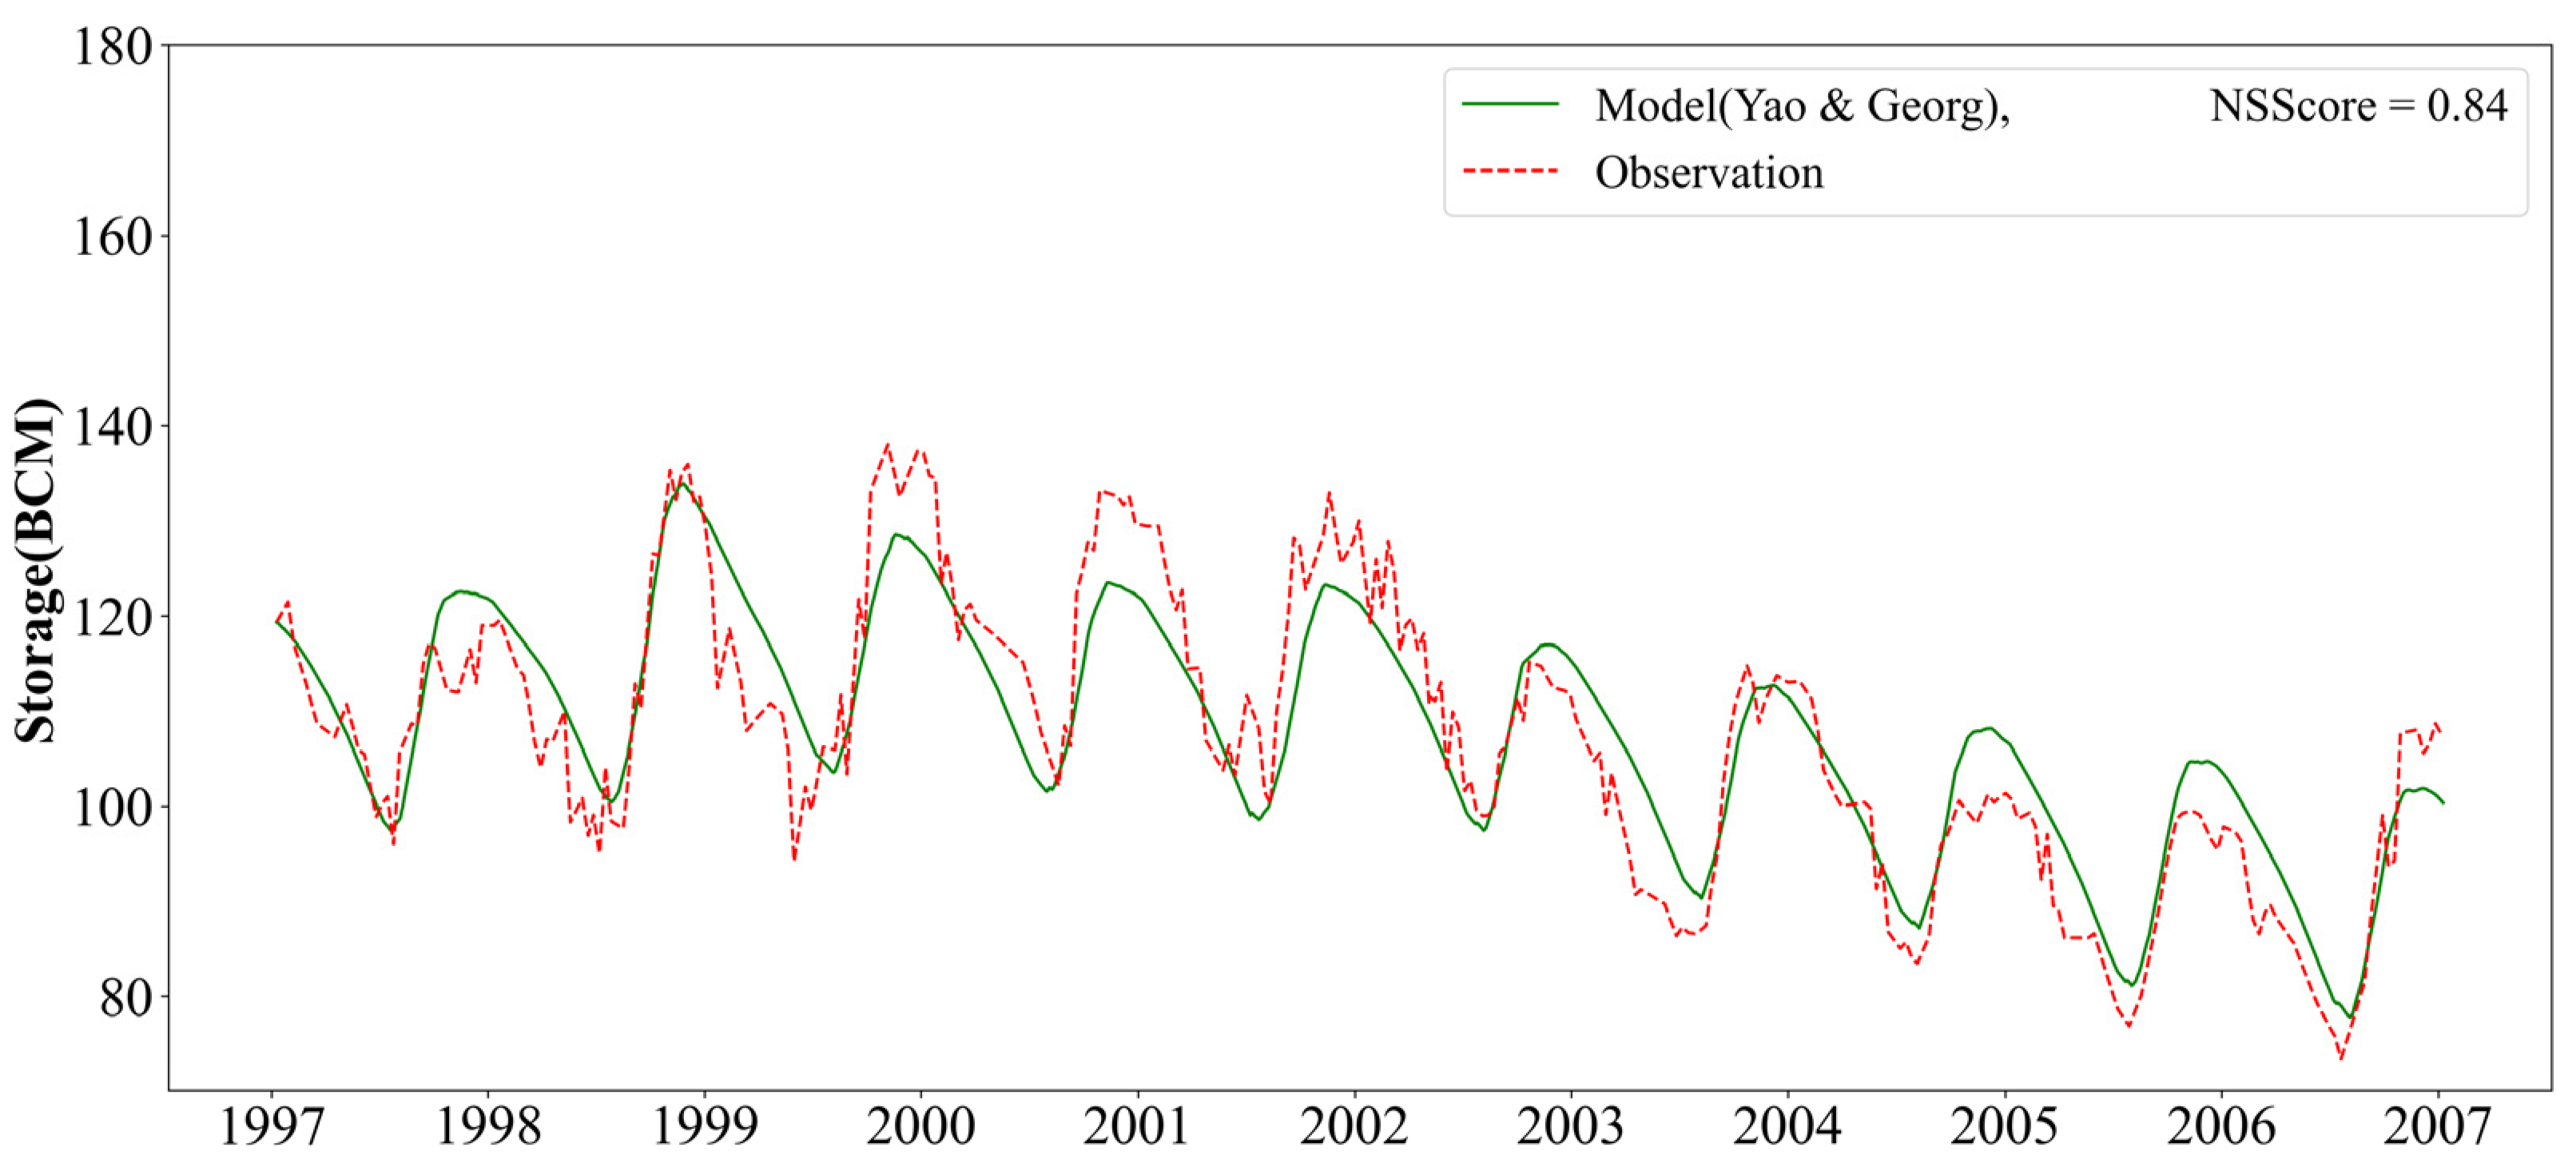
In this section, the historical simulation results are presented to validate the accuracy of the mass balance model. There are many different estimations of the average monthly evaporation rate from the reservoir, which are affected by different climate factors. We used evaporation estimation from various studies [51,73,78,79,80,81], as well as the average from all studies, in our simulation model to see which one produced the most accurate estimation of reservoir water level. Figure 9 shows the resulting simulation based on all evaporation data. As the Figure shows, many of these studies seem to underestimate the evaporation rates. Among them, the evaporation estimation by Yao and Georgakakos (2003) resulted in the most accurate simulation. The simulation result using Yao and Georgakakos evaporation rate estimation is shown in Figure 10 separately. As the Figure and the NSE values show, the simulation showed very good agreement with historical data, so we chose this estimation as evaporation to estimate Toshka spillway flow and hydropower generation. The historical simulations conducted in this study showed that using different estimations of monthly evaporation rate would change the results significantly. This is expected in such a vast reservoir, where small changes in the evaporation rate drastically change the total evaporation volume.
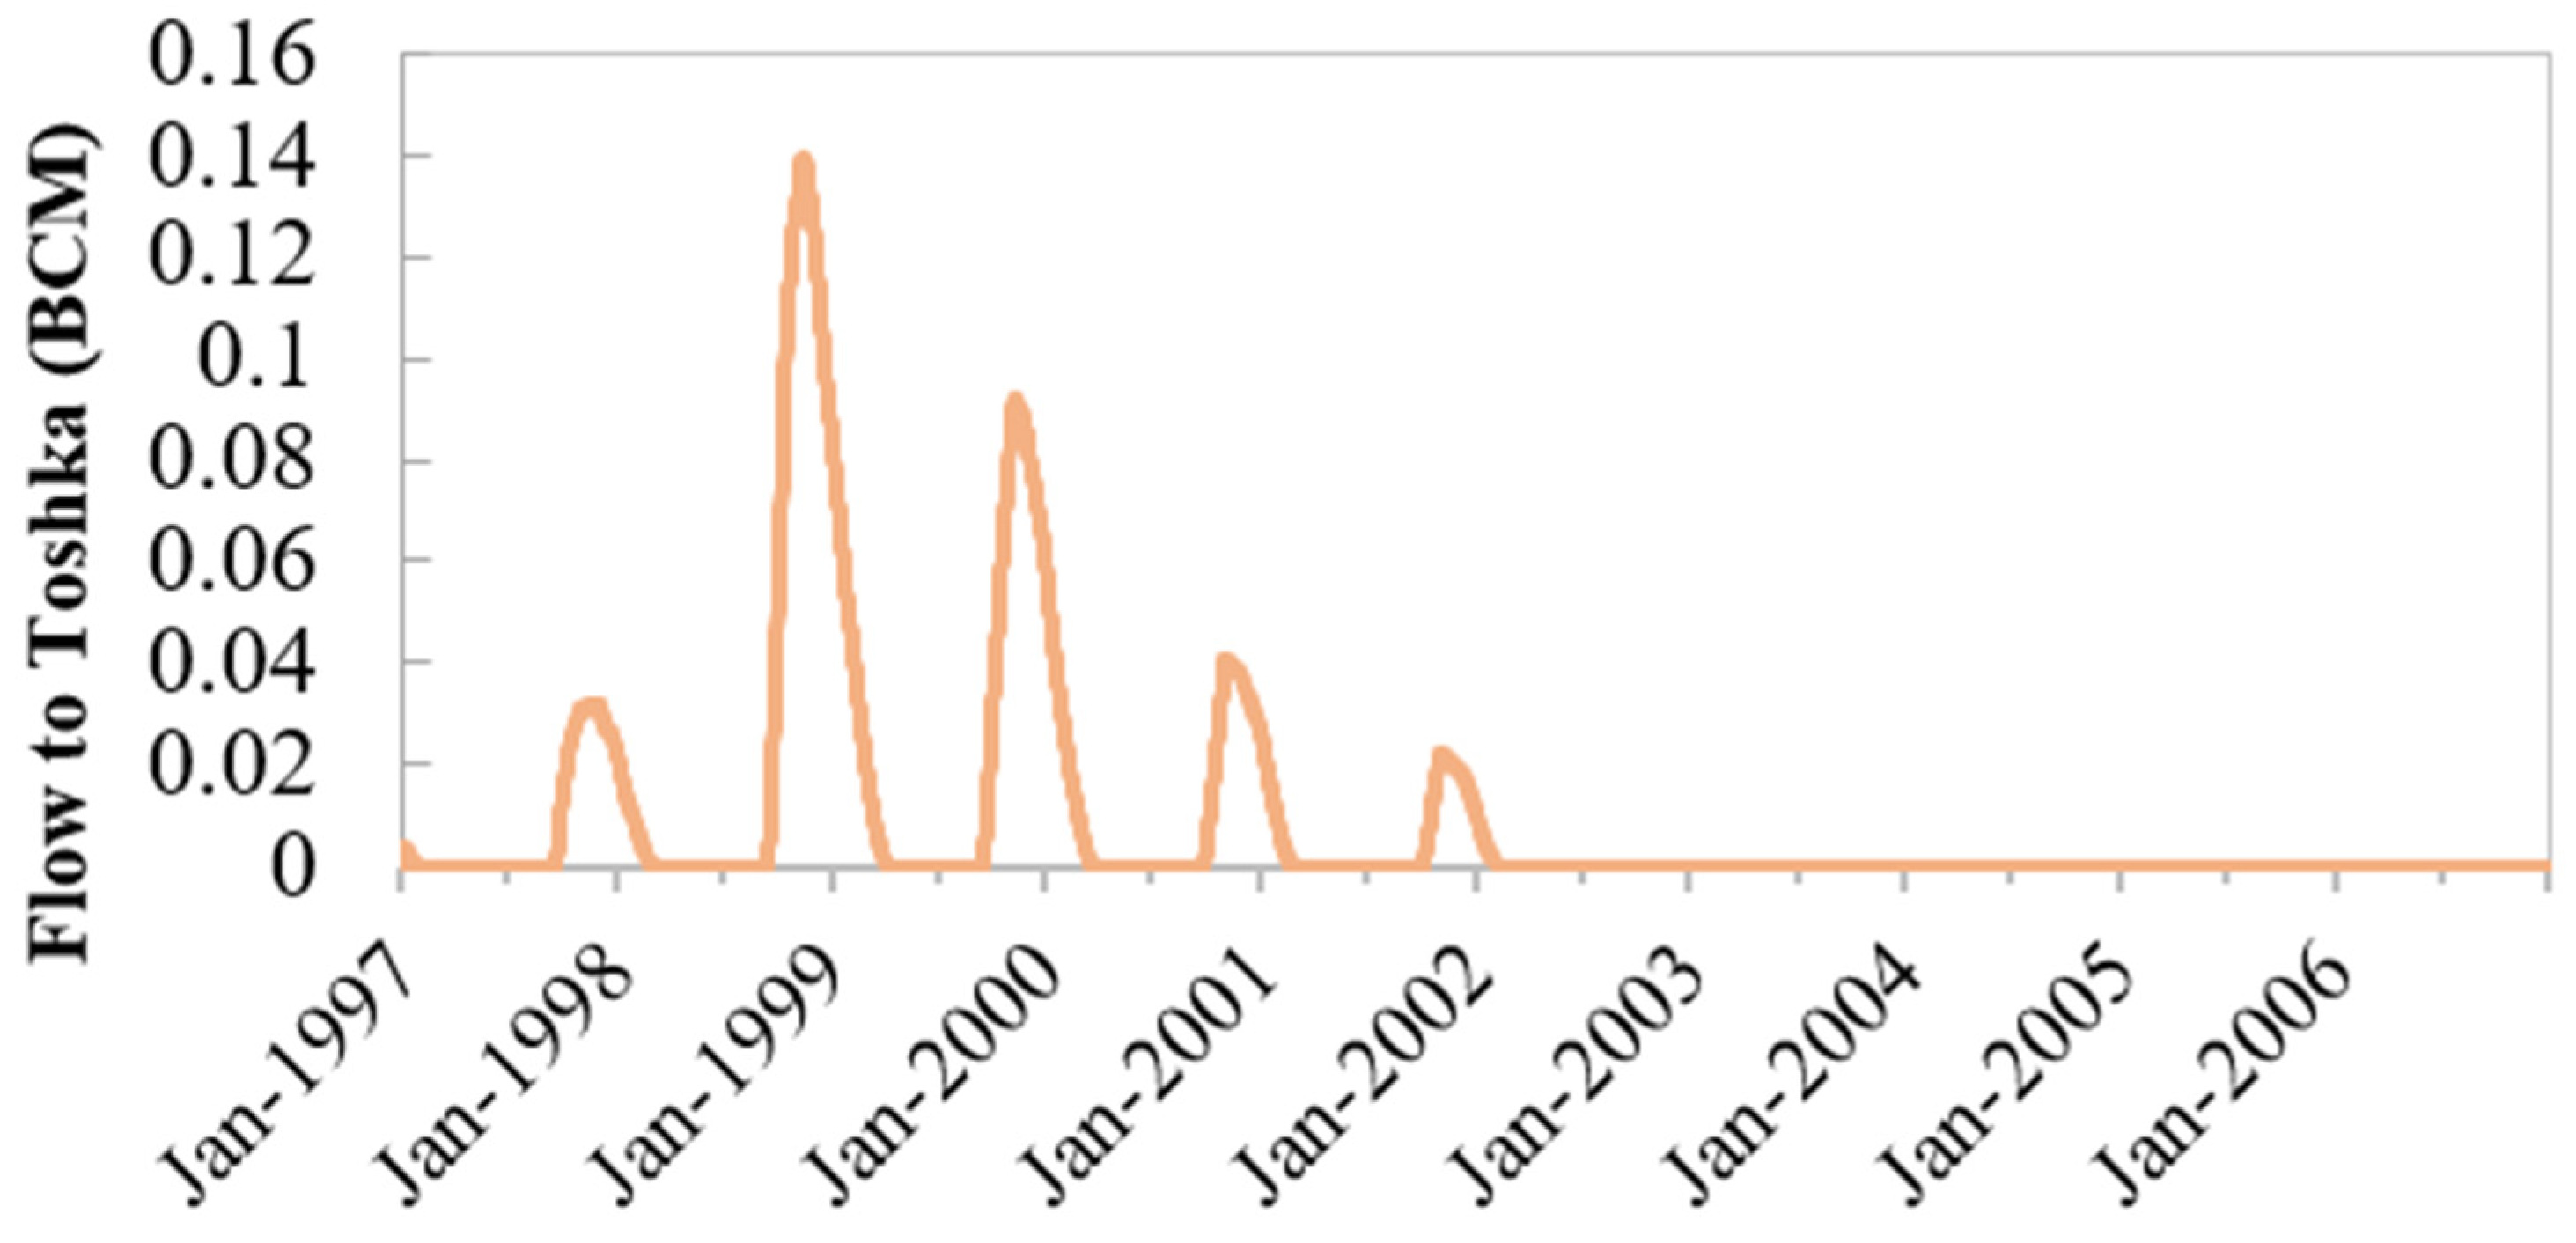
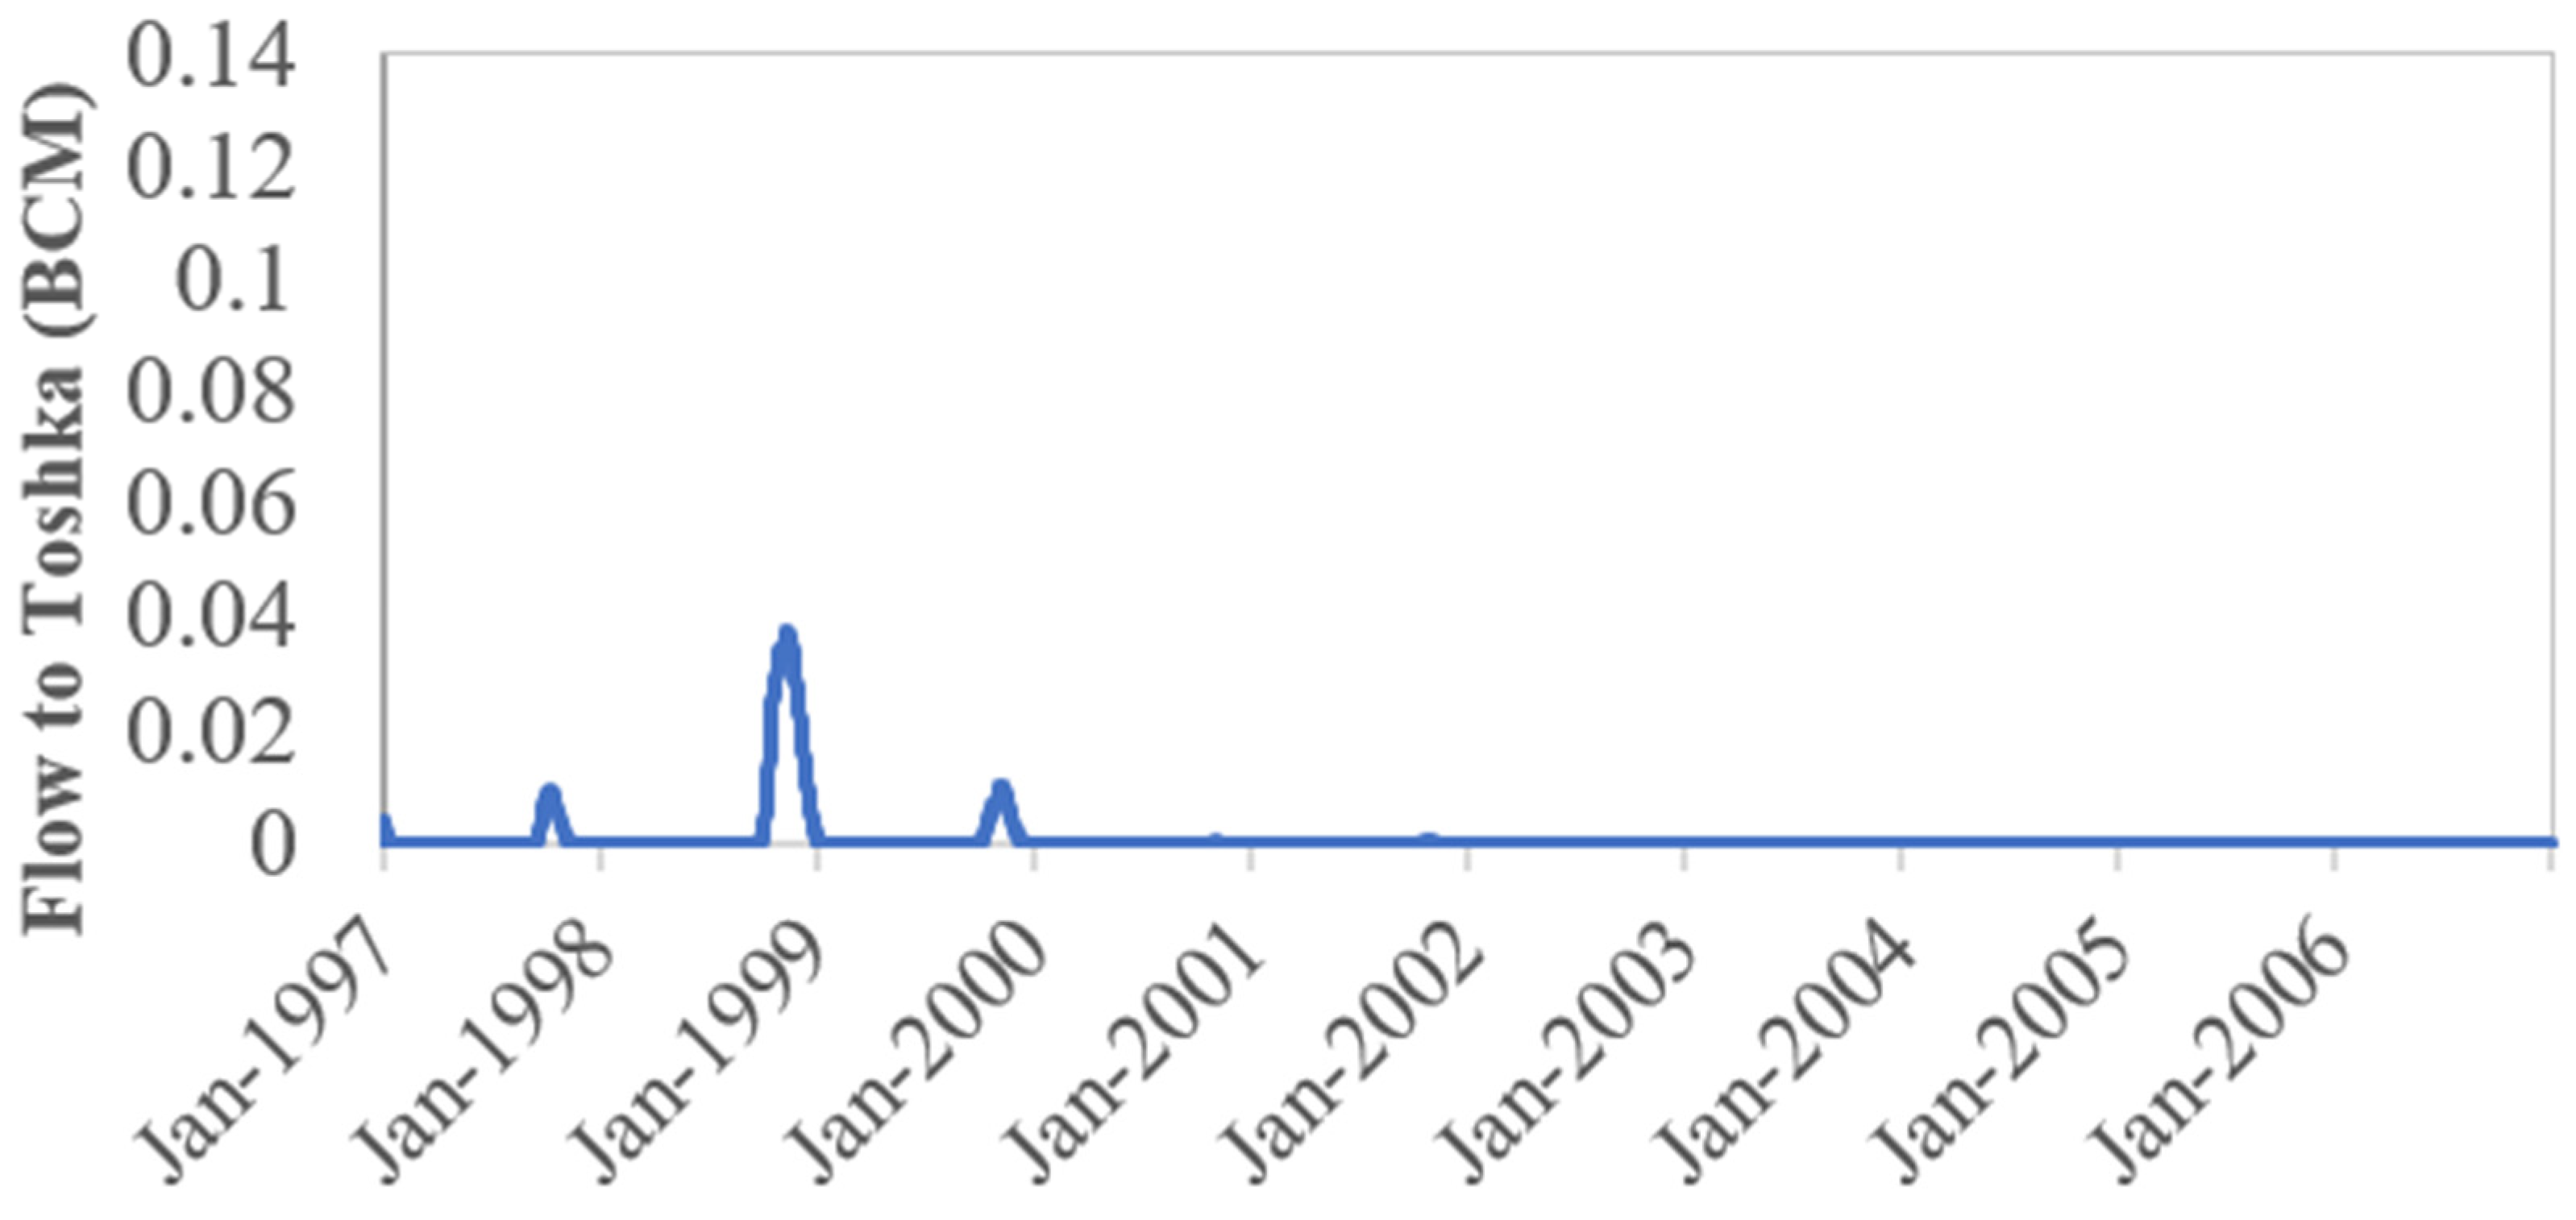
Toshka uncontrolled spillway was modeled using the formulation presented by ref. [71]. The modeled flow to Toshka through the uncontrolled spillway during the simulation period is illustrated in Figure 11. As can be seen in the Figure, during 1998–2002 the release through Toshka spillway is the highest, and as the water level goes down after 2002, the Toshka release reaches zero, since the water level never goes above the level of the Toshka spillway.
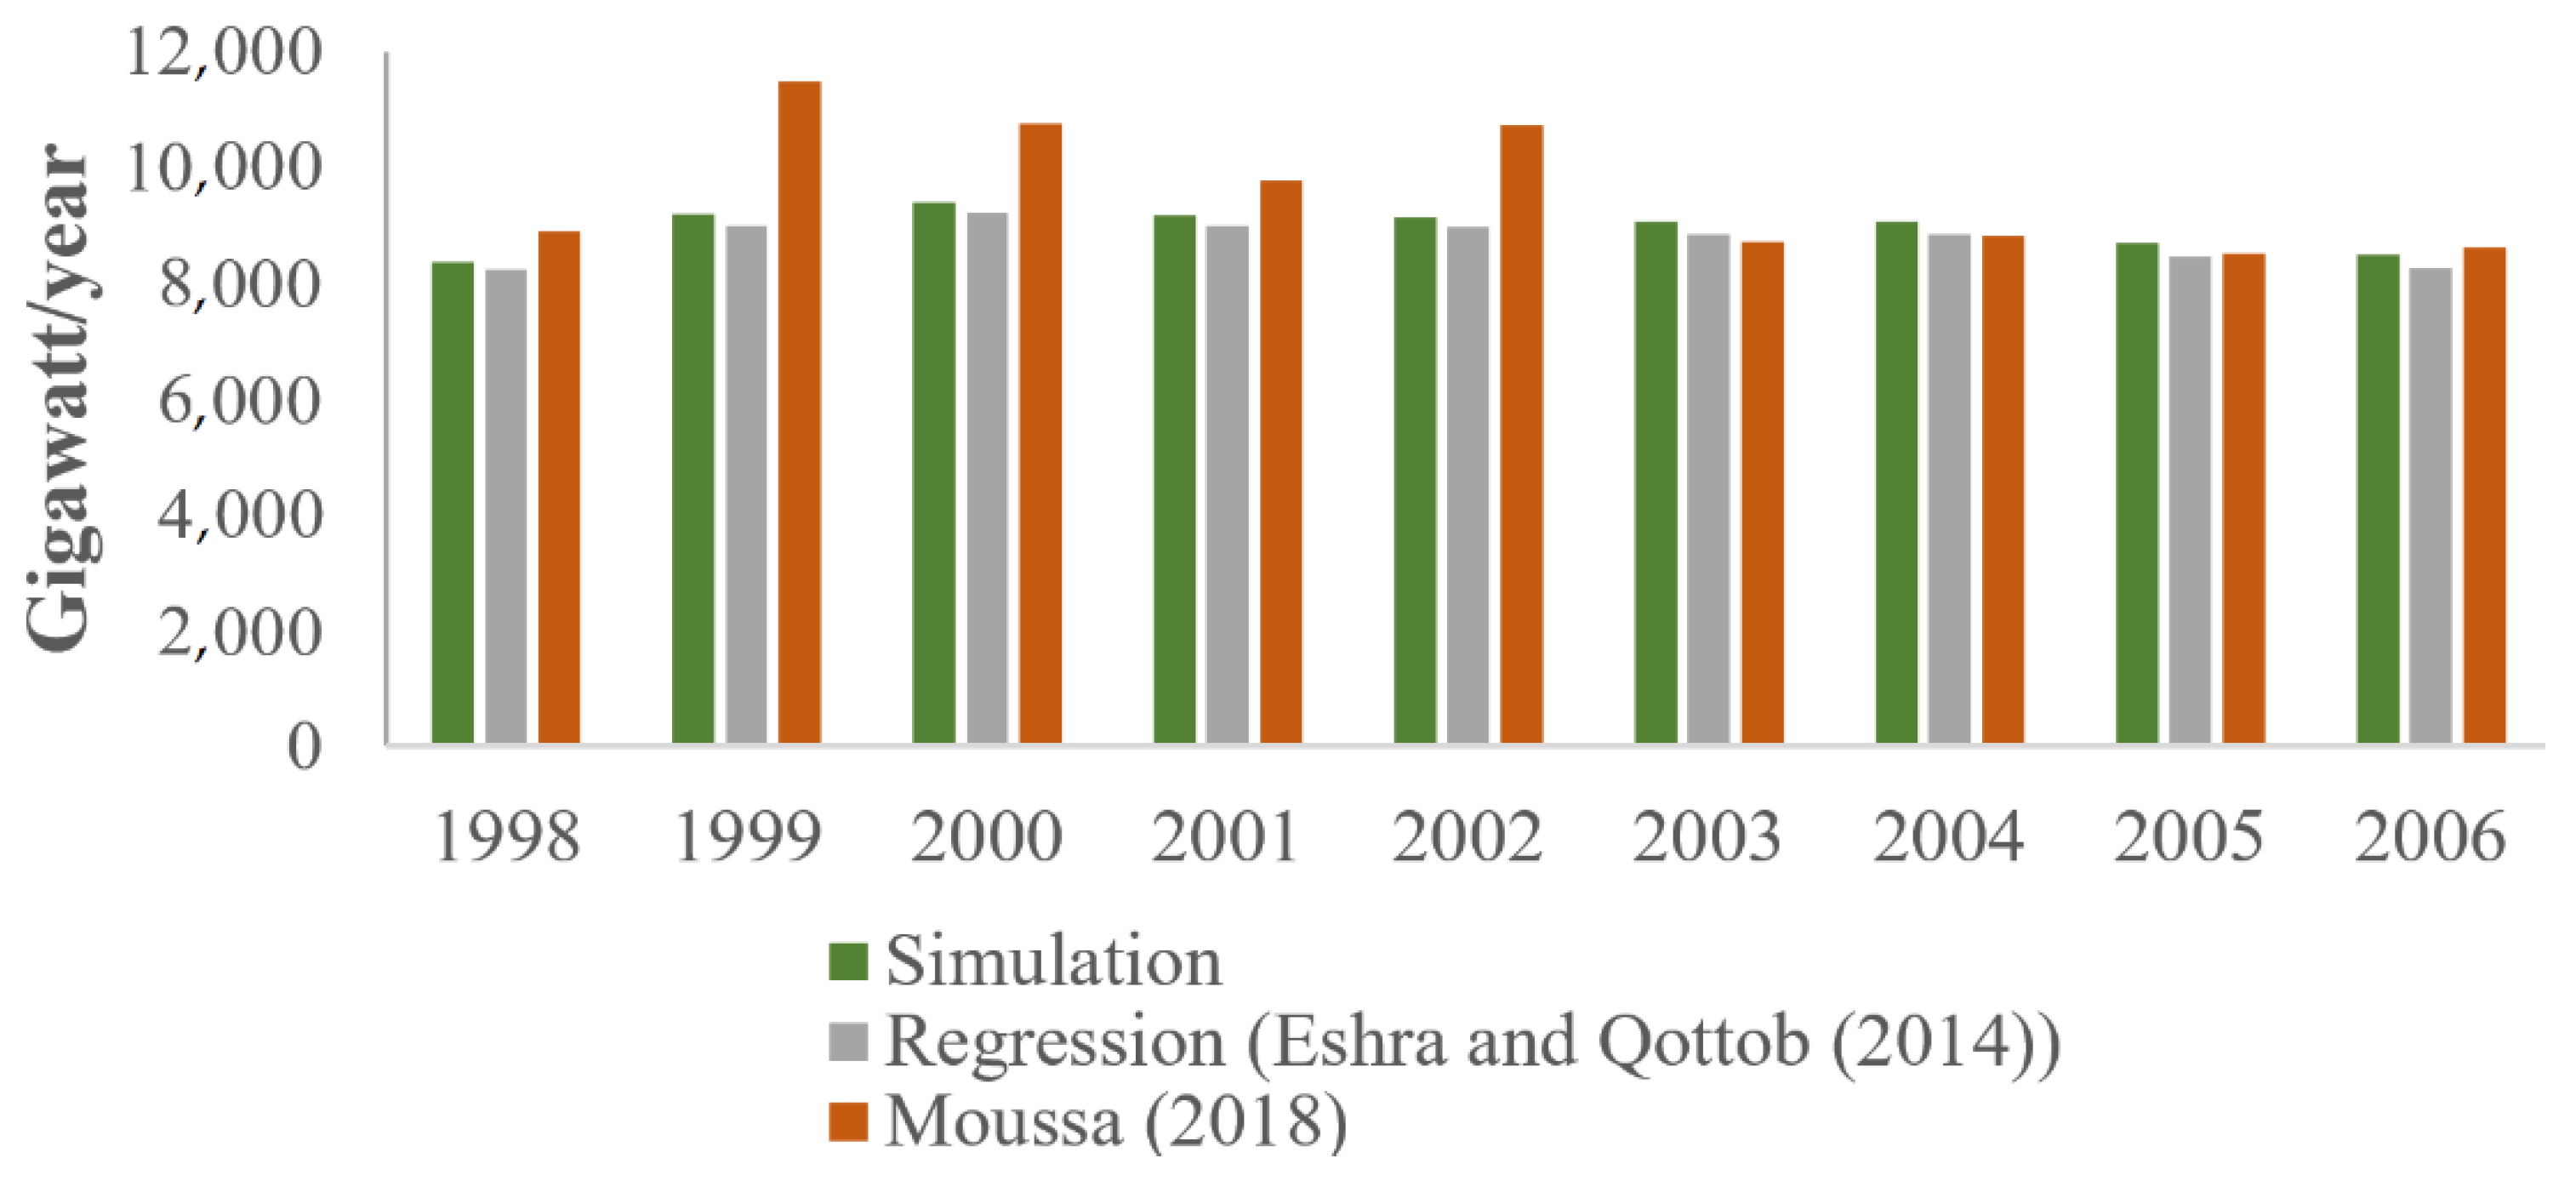
Total annual hydropower generation in the model was calculated and compared with the result from another study [82]. Furthermore, ref. [83] performed a regression analysis using hourly hydropower generation from 1988–2000 and developed a relation between hydropower generation, release from reservoir and head over the turbine. We also used their formula to estimate hydropower and compared with the simulated hydropower generation. Figure 12 shows the annual hydropower generation in our model, regression result and result from Moussa (2018). As the Figure shows, the calculated hydropower was in good agreement with previous studies.
According to the historical simulation tests, Yao and Georgakakos evaporation estimation yielded accurate results both in terms of reservoir storage and hydropower generation. Therefore, in the next stage, we used theses evaporation data.
4.2. Policy Tree Optimization Model
In this section, we present the results of the policy tree optimization model. As described in the method section, the objective function is to minimize flood damage and water shortage and maximize hydropower generation. The demand downstream of the reservoir was set to the historical release of the reservoir, which was around 55 BCM annually. The current monthly release of the reservoir is based on a simple rule curve that specifies the amount of release in each month, as shown in Figure 13 [84].
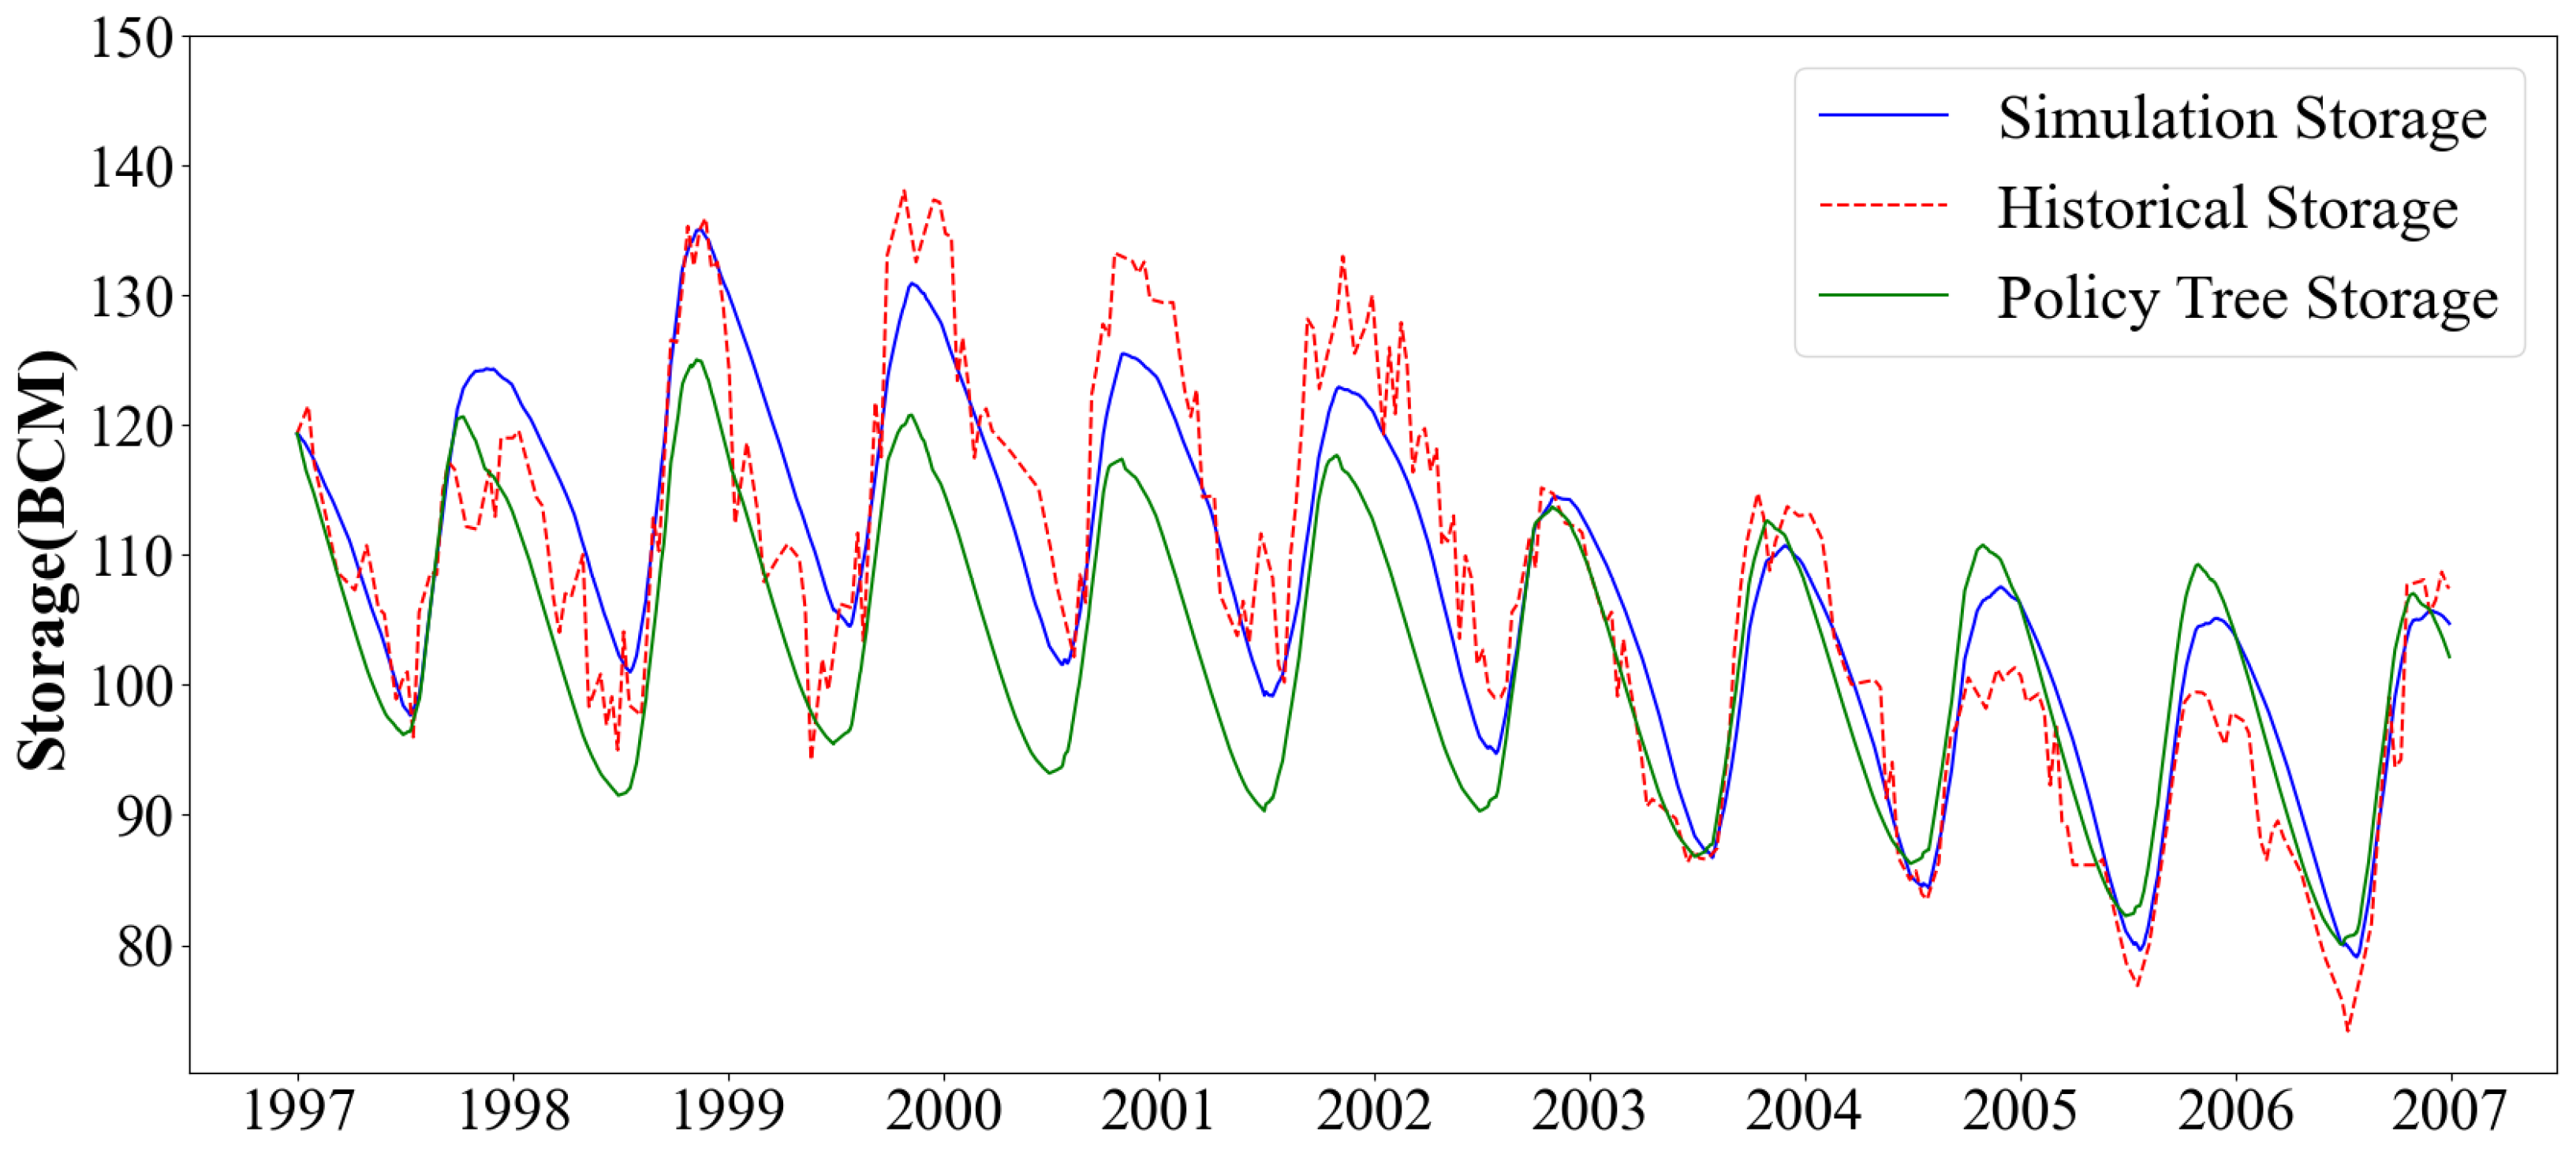
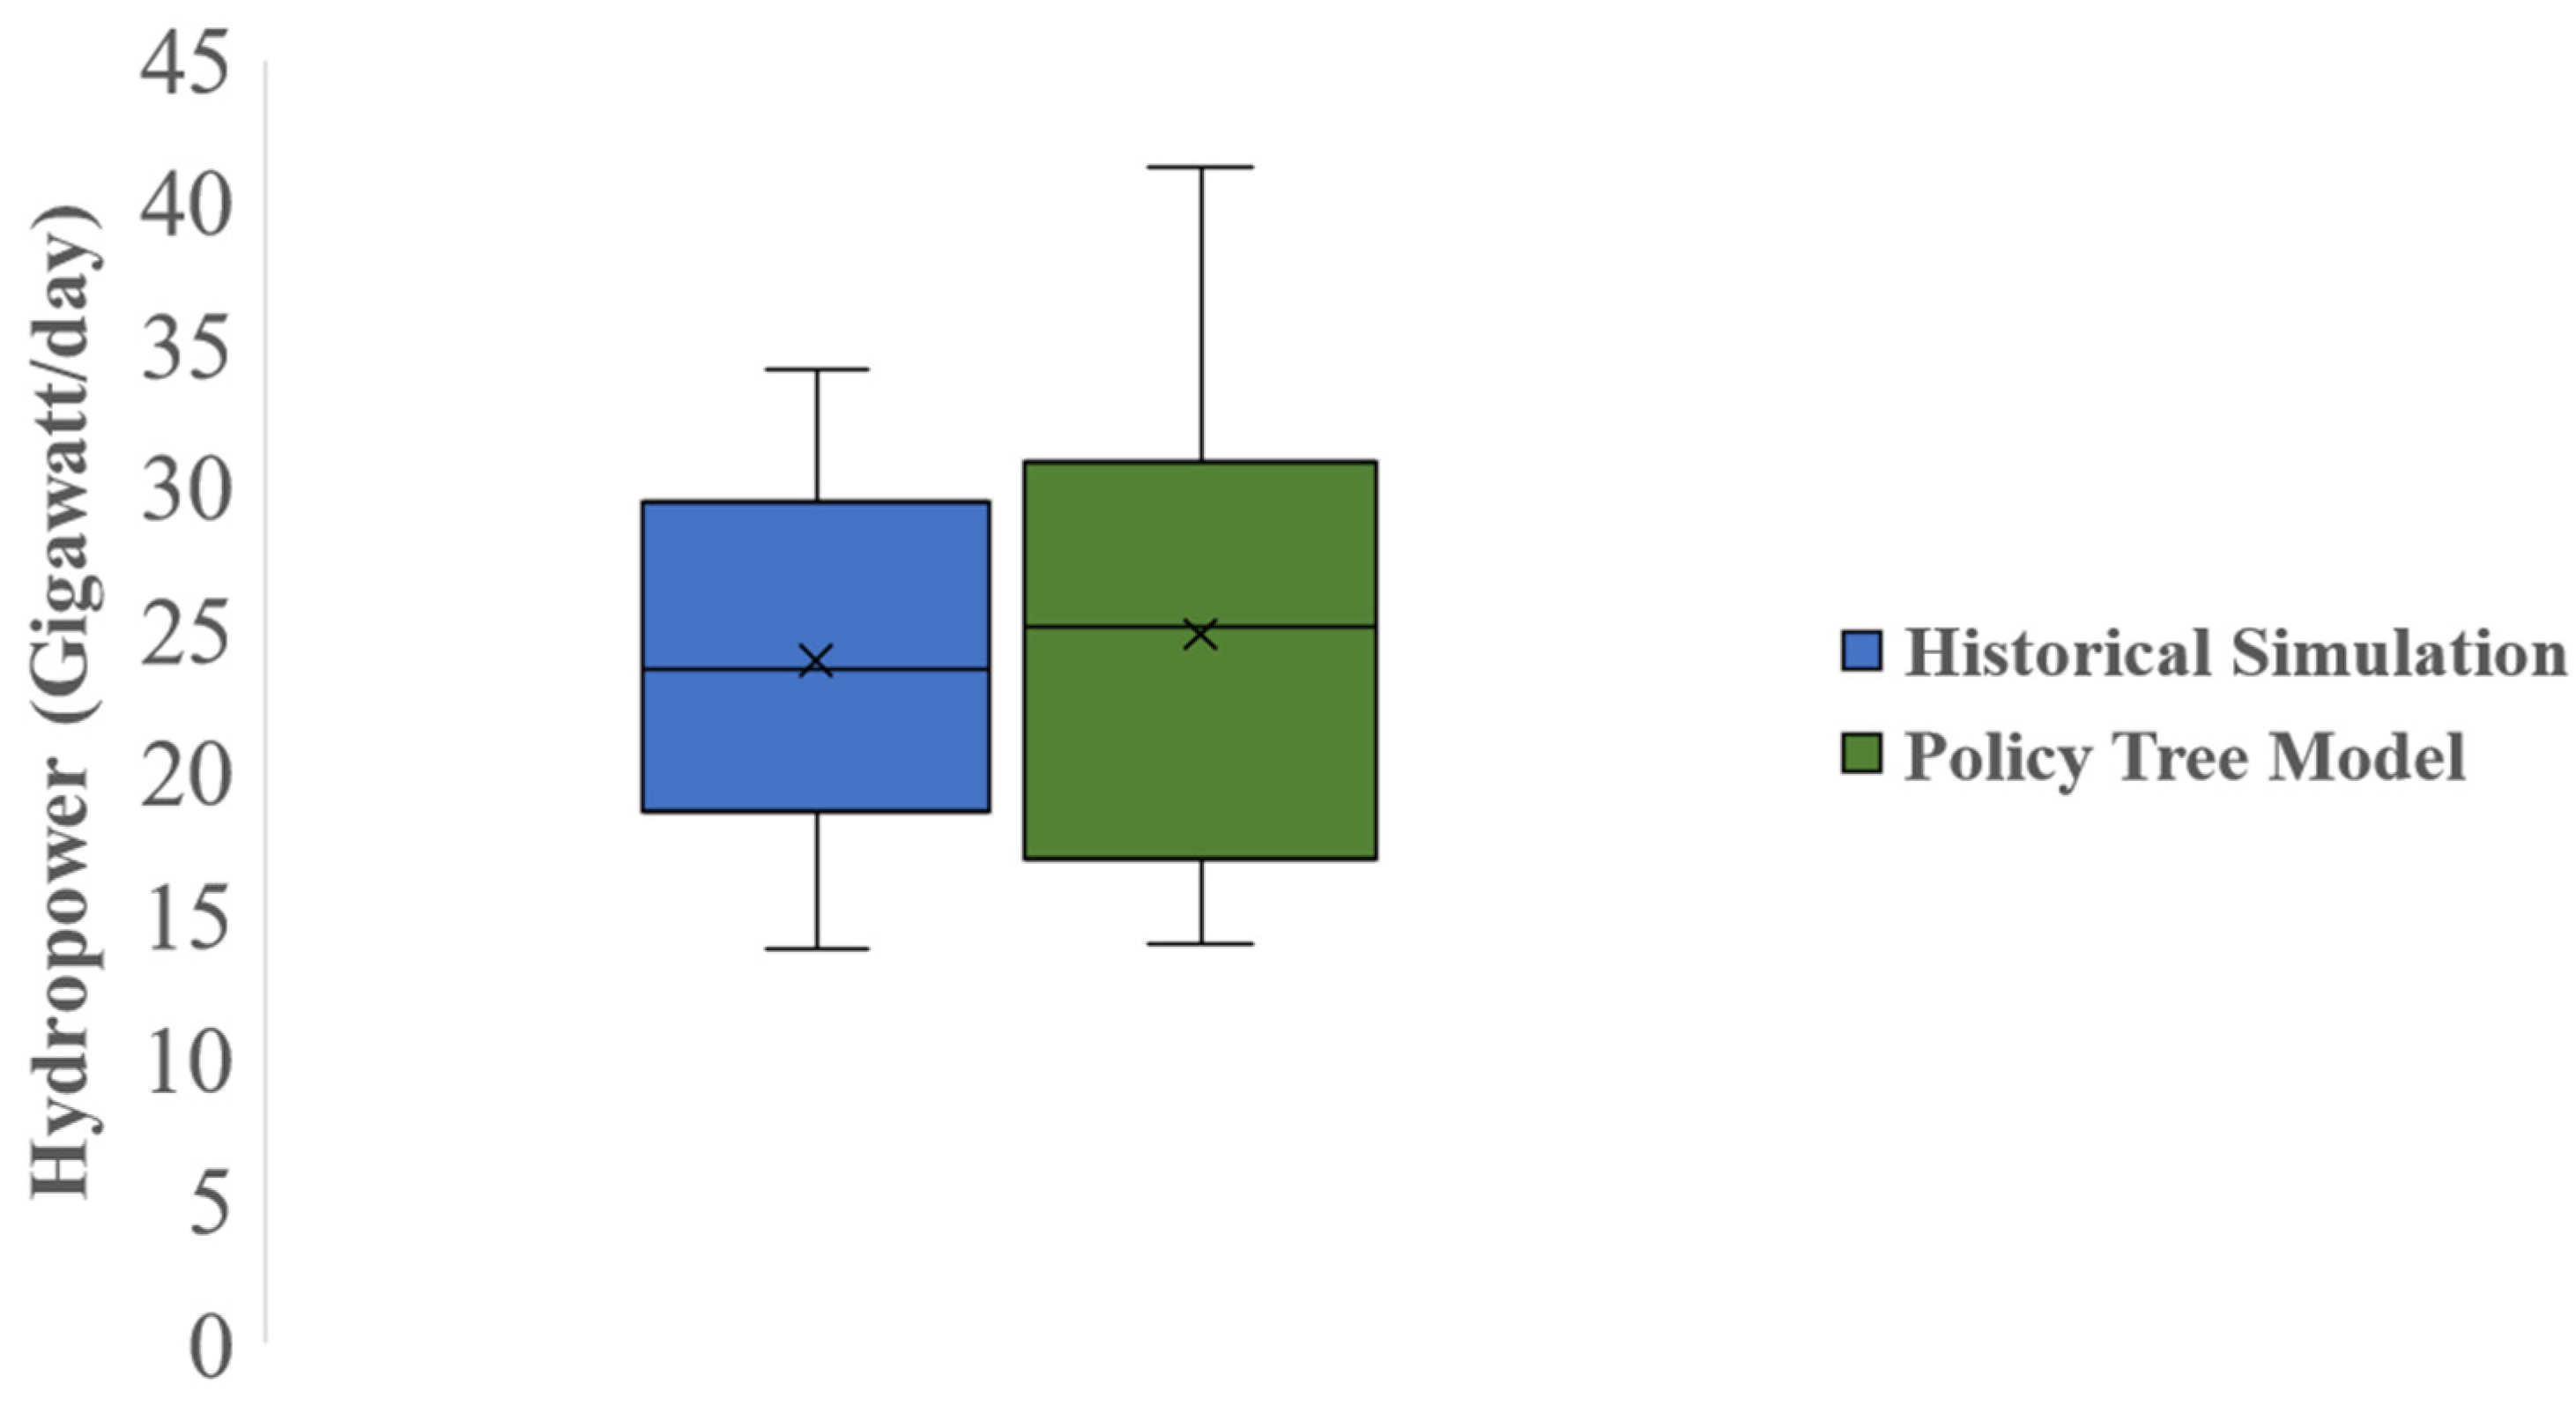
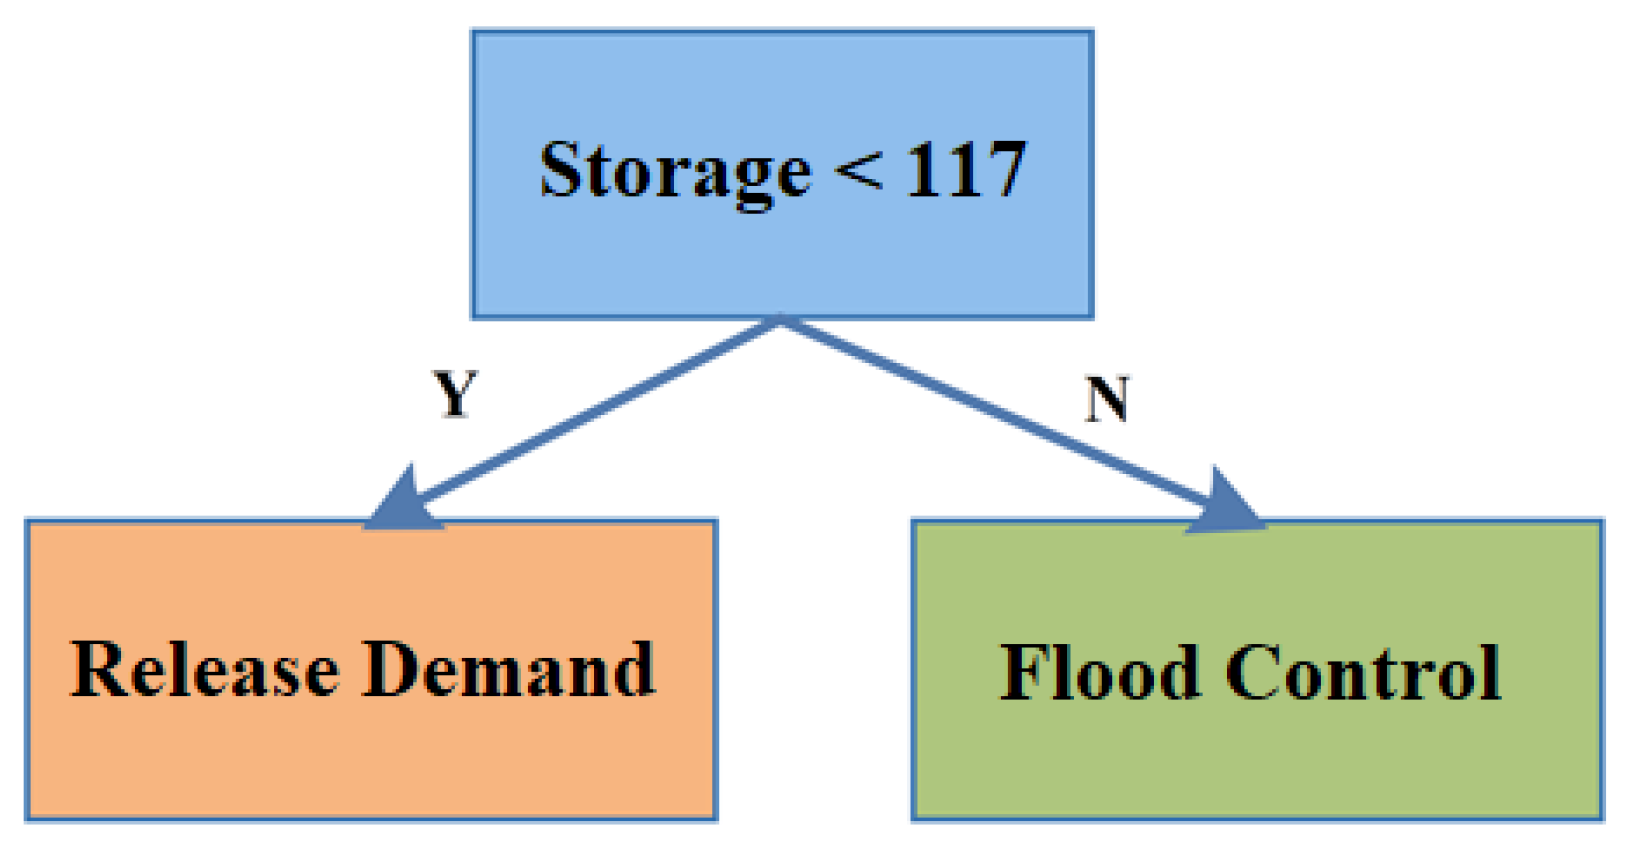
As Figure 14 shows, reservoir storage in the policy tree model is generally lower than historical storage, since the model is maximizing hydropower generation and sometimes releasing more water than the downstream demand. The modeled flow through the uncontrolled Toshka spillway is plotted in Figure 15. Compared to the simulation model, the Toshka flow decreased significantly, because the water level in the reservoir in the policy tree model is lower. Figure 16 shows the annual hydropower generation in the policy tree model compared with historical simulation. The Figure shows that in general, the policy tree model increased hydropower production. In fact, the model increased total hydropower generation in the modeling period by 3.8%. In the modeling period, there was almost always enough water to meet downstream demand, and water level never rose too high to risk flooding. As a result, the optimized structure of the policy tree model was based on a tradeoff between hydropower generation and keeping enough water in storage to meet future demand. The model releases water to increase hydropower production as much as possible without imposing any scarcity downstream. The structure of the optimized policy tree is shown in Figure 17.
As Figure 17 shows, the optimized policy tree is very simple. During the period, there is almost always enough water to supply the demand downstream, and the model increases hydropower production by releasing more water whenever possible. Therefore, the reservoir storage in the policy tree optimization model is generally lower. In order to evaluate the operation of the reservoir and the recommended polices, more studies are required, especially on evaluating different polices, future water demand and evaporation losses.
4.3. Current and Future Surface Air Temperature (T2m) over Aswan High Dam Reservoir
As mentioned before, current and future warming are being discussed as a basis to give a primary direction for the future management of Aswan High Dam Reservoir. It is clear from Figure 18 that maximum values of the annual/seasonal mean (from 1979 to 2018) T2m in Aswan High Dam Reservoir were concentrated in northern areas, and the minimum values were generally in the southern grids. The annual, winter, spring, summer, and autumn average T2m in Aswan High Dam Reservoir were 26.9, 19.5, 31.2, 33.4, and 23.5 °C, respectively, over the period 1979–2018. From Figure 18, we can conclude that there was a significant range in seasonal and annual mean in Aswan High Dam Reservoir. The annual mean in Aswan High Dam Reservoir reached its maximum value during 2010 (29 °C) and its minimum value during 1983 (25.2 °C) with a range of 3.8 °C. The seasonal mean T2m reached its minimum during 1983 (15.9 °C), 1986 (29.5 °C), 1984 (31.5 °C), and 1982 (21.4 °C) for winter, spring, summer, and autumn, respectively. Similarly, the seasonal mean T2m reached its maximum values during 2010 (22.8 °C), 2010 (32.6 °C), 2015 (35.2 °C), and 2010 (26.4 °C) for winter, spring, summer, and autumn respectively.
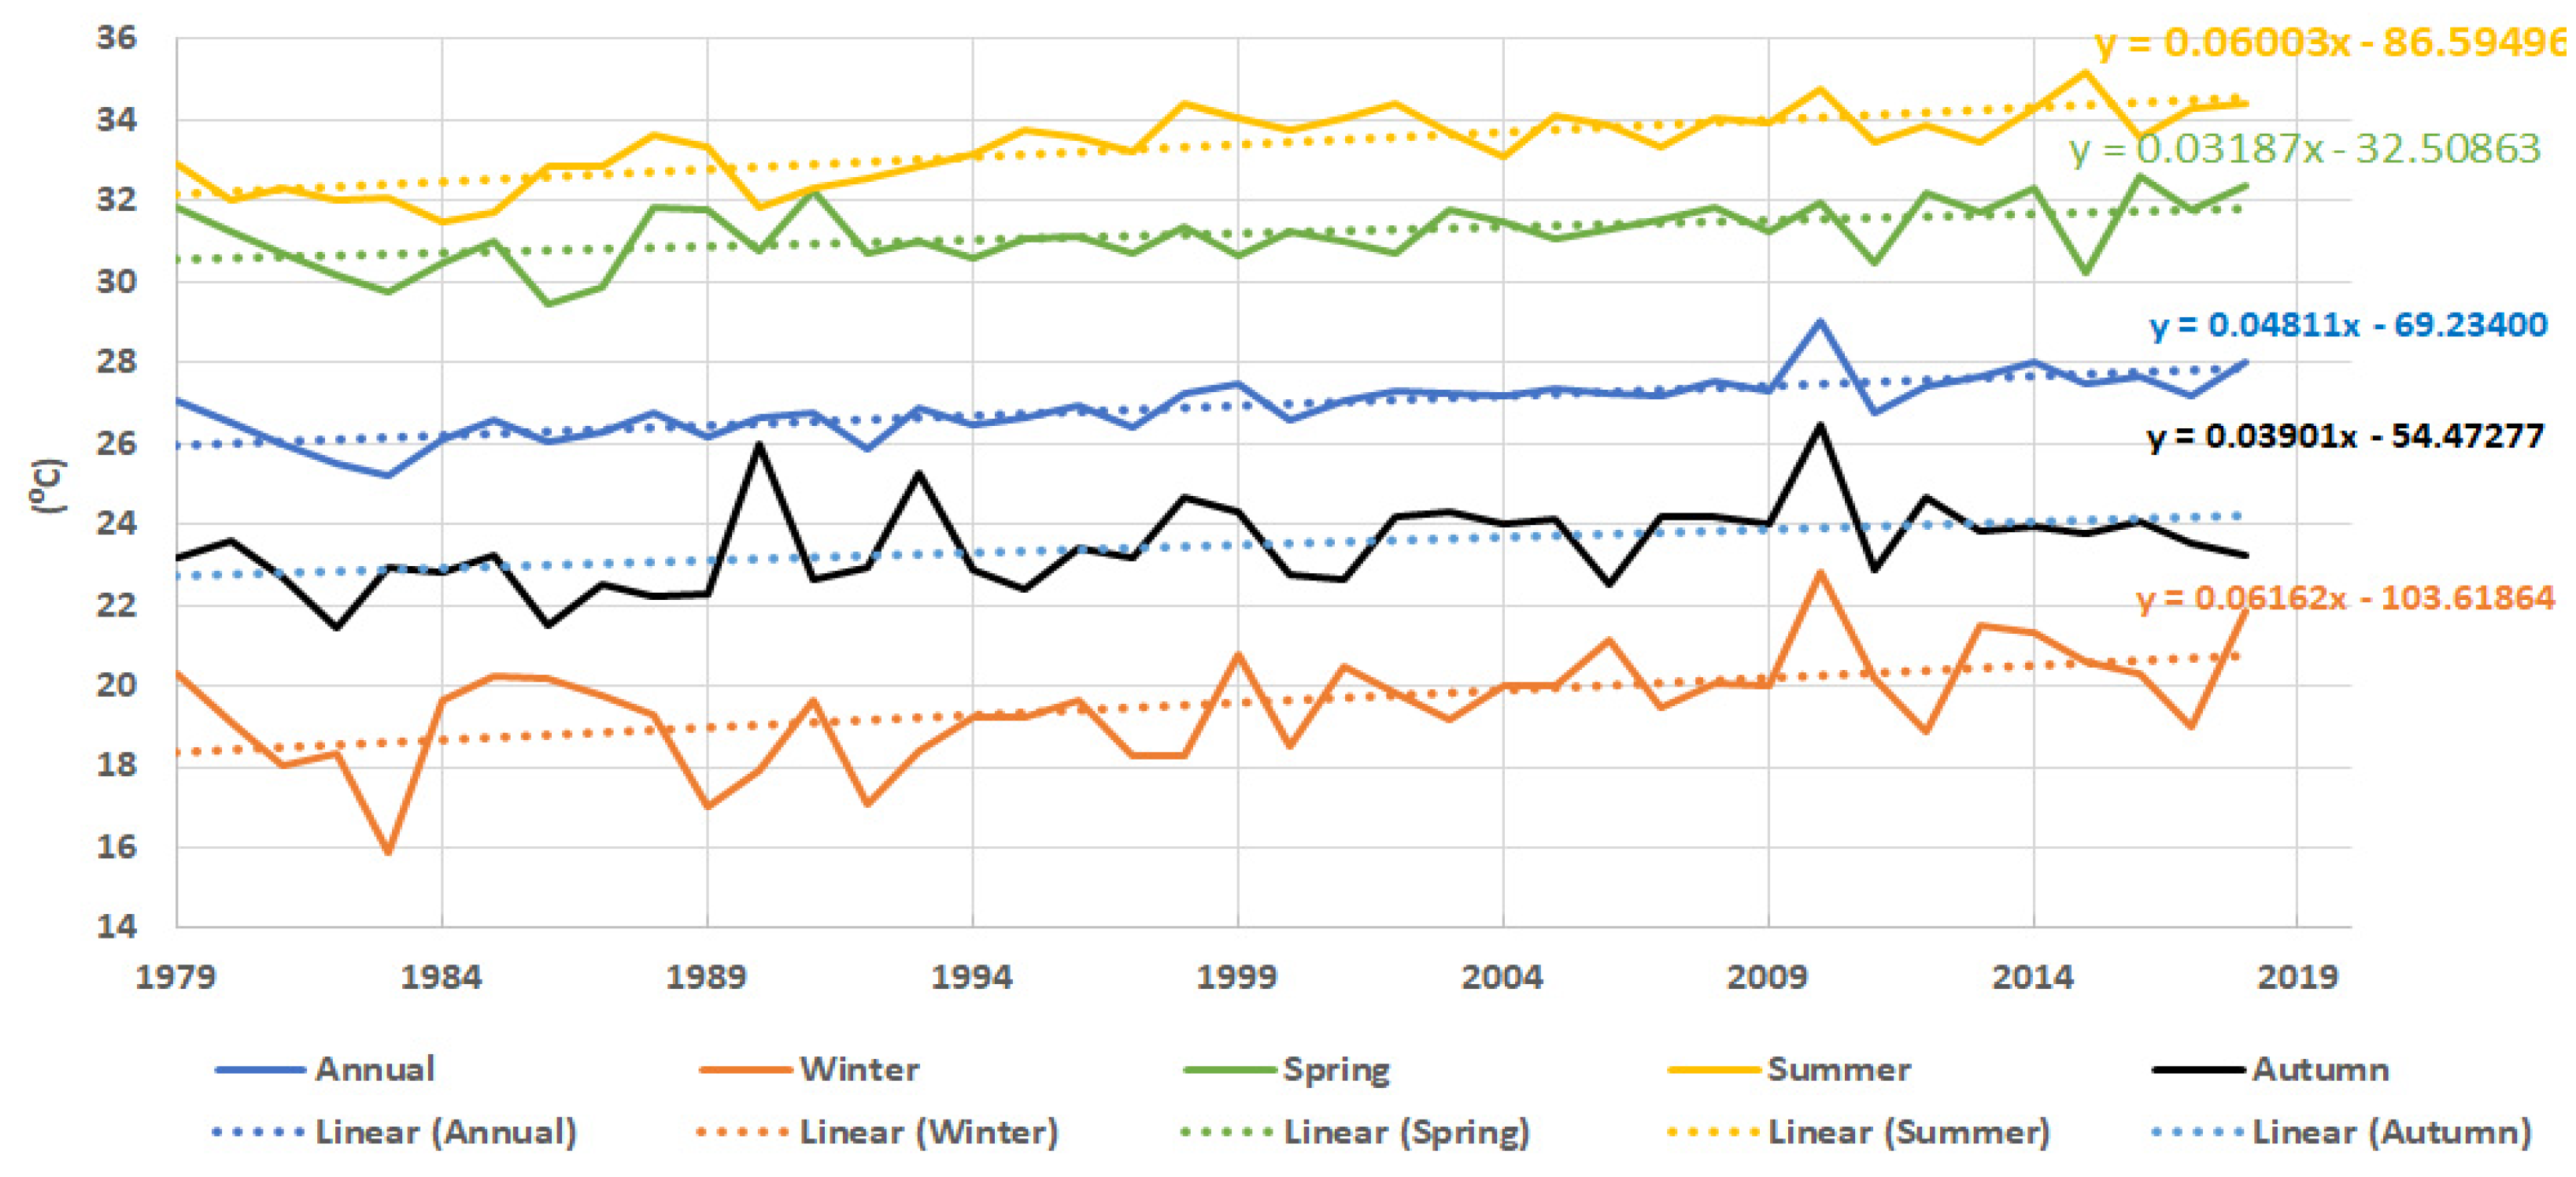
The annual T2m trends (from 1979 to 2018) in Aswan High Dam Reservoir (Figure 19) show a significant positive trend (based on the Mann–Kendall test), ranging from 0.31 °C decade−1 in spring to 0.61 °C decade−1 in winter, with an annual trend of 0.48 °C decade−1. During winter, the T2m exhibits a more intensive warming trend than in the other seasons.
The GFDL mini-ensemble simulation of projected Tas scenarios in the current century indicates significant warming during the 2006–2100 period in Aswan High Dam Reservoir, especially for the RCP8.5 scenario (Figure 20). The expected warming up to 2100, in correlation to the 2006–2035 period, ranges from 0.45 °C (RCP 2.6) to 3.8 °C (RCP 8.5). This significant warming trend for the current century gives an early awareness that the evaporation rate over Aswan High Dam Reservoir is expected to increase, which would increase the water scarcity for Egypt.
5. Limitations and Future Scope
The current study provides a framework for improving the future operation of the AHD. However, in order to better study the future operation of the reservoir, updated and accurate data as well as information about the operation of various projects affecting High Aswan Dam, such as GERD, potential changes in the Nile flow itself due to climate change and Toshka Valley Project, should be acquired and incorporated into the model. The policy tree optimization model has the potential to improve the operation of the reservoir using an easily interpretable policy tree, but the feasibility of the recommended polices needs to be thoroughly evaluated before application, and the effects of each policy on the river basin should be studied.
6. Conclusions
In the River Nile, there is a lack of reliable data in terms of streamflow measurements to model and manage the regional water resources, especially the operation of the Aswan High Dam, as the AHD operation will be connected to all other dams, and it is not optimized for energy as most of the upstream dams are. One way to address this issue is to use the abundance of remote sensing and model simulation data available through different sources. These data, however, can be strongly biased to a degree that using them without correcting the bias is rendered impossible. Various methods could be used to alleviate this problem. Here, random forest and MLP were identified as the best methods for bias correction of inflow and outflow data, respectively. Since AHD has a significant effect on regulating the flow, the inflow and outflow time series had different patterns, and as a result, the model that works best for inflow is different from the ML model, which is more effective for outflow.
To simulate the operation of Aswan High Dam, other data were required, such as direct precipitation over the lake, volume elevation relations, operational rules, evaporation rates, and historical lake level data. For precipitation and historical lake level, remote sensing datasets were the best source of available data, and hence, were used directly in modeling. Evaporation and precipitation data are particularly important for such a vast lake as Aswan High Dam Reservoir. However, since Aswan High Dam Reservoir is located in a very dry region, precipitation events rarely occur, and the amount of precipitation is insignificant. Evaporation, however, plays an important part in the reservoir’s mass balance. This was shown by our historical simulations. The historical simulations also showed the importance of accurate modeling of Toshka uncontrolled spillway. The Toshka flow relation by Mostafa (1998) was used in this study, as it resulted in accurate reservoir storage simulations compared with historical data. In 1997, the Egyptian government started a new project known as the New Valley Project or Toshka Project. As part of the project, the Mubarak Pumping Station was built on Aswan High Dam Reservoir to pump and divert the water through a canal to the Toshka Valley Project. In 2005, Mubarak Station started operation. Inclusion of the operation of the pumping station in the model was crucial and helped the model to simulate the decline in water levels during the period 2005–2007 more accurately.
Incorporating all the components of the reservoir and using remote sensing data and monthly evaporation rate estimates, we were able to create an accurate model that simulated the lake level with high accuracy (NS = 0.85). Using the developed simulation model, a policy tree optimization model was also developed to investigate potential improvements in the operation of the Aswan High Dam. A policy tree optimization model, unlike the common optimization model, optimizes the structure of a tree using a set of predefined indicators and actions instead of optimizing the decision variables. An advantage of the policy tree model is that it requires considerably less time to run. Moreover, the output of a policy tree optimization model is a decision tree that is easily interpretable and usable by decision-makers. The policy tree optimization model was tested in the same period as the simulation model (1996–2007). The optimized policy tree increased the hydropower generation and generally kept the reservoir storage in a lower level. However, the feasibility of the recommended polices needs to be thoroughly assessed before application. The results of this study show that in the absence of field measurements, remote sensing data, with some pre-processing, can be used to simulate and investigate improvements in the current operation rule of the Aswan High Dam. The modeling framework in this study can be used as a basis for further exploring the future of the reservoir system under climate change and operational changes.
Author Contributions
Conceptualization, E.G., M.S. and A.E.; methodology, All; formal analysis, All; writing—original draft preparation, M.E. and A.E.; writing—review and editing, All; visualization, M.E. and A.E.; supervision, E.G. All authors have read and agreed to the published version of the manuscript.
Funding
This research received no external funding.
Institutional Review Board Statement
Not applicable.
Informed Consent Statement
Not applicable.
Data Availability Statement
Not applicable.
Conflicts of Interest
The authors declare no conflict of interest.
References
- Labadie, J.W. Optimal operation of multireservoir systems: State-of-the-art review. J. Water Resour. Plan. Manag. 2004, 130, 93. [Google Scholar] [CrossRef]
- Yousef, S.F. Water Scarcity and Conflict Between Upstream and Downstream Riparian Countries. Water Econ. Policy 2021, 7, 2150012. [Google Scholar] [CrossRef]
- Teixeira, A.D.S.; Mariño, M.A. Coupled reservoir operation-irrigation scheduling by dynamic programming. J. Irrig. Drain. Eng. 2002, 128, 63. [Google Scholar] [CrossRef]
- Lund, J.R. Drought storage allocation rules for surface reservoir systems. J. Water Resour. Plan. Manag. 2006, 132, 395. [Google Scholar] [CrossRef]
- Yeh, W.W.-G. Reservoir Management and Operations Models: A State-of-the-Art Review. Water Resour. Res. 1985, 21, 1797–1818. [Google Scholar] [CrossRef]
- Wurbs, R.A. Reservoir-system simulation and optimization models. J. Water Resour. Plan. Manag. 1993, 119, 455. [Google Scholar] [CrossRef]
- Negm, A.M.; Abdel-Fattah, S.; Omran, E.-S.E. Update, Conclusions, and Recommendations for Grand Ethiopian Renaissance Dam Versus Aswan High Dam: A View from Egypt. In Grand Ethiopian Renaissance Dam Versus Aswan High Dam; Springer: Berlin/Heidelberg, Germany, 2018; pp. 561–586. [Google Scholar]
- Entz, B. Lake Nasser and Lake Nubia. In The Nile, Biology of an Ancient River; Springer: Berlin/Heidelberg, Germany, 1976; pp. 271–298. [Google Scholar]
- Mostafa, M.M.; Soussa, H.K. Monitoring of Lake Nasser Using Remote Sensing and Gis Techniques; ISPRS: Amsterdam, The Netherlands, 16–23 July 2000; pp. 2–6. [Google Scholar]
- Rashed, M.N. Monitoring of environmental heavy metals in fish from nasser lake. Environ. Int. 2001, 27, 27–33. [Google Scholar] [CrossRef]
- Sadek, M.F.; Shahin, M.M.; Stigter, C.J. Evaporation from the reservoir of the High Aswan Dam, Egypt: A new comparison of relevant methods with limited data. Theor. Appl. Climatol. 1997, 56, 57–66. [Google Scholar] [CrossRef]
- Muala, E.; Mohamed, Y.A.; Duan, Z.; der Zaag, P. Estimation of reservoir discharges from Lake Nasser and Roseires Reservoir in the Nile Basin using satellite altimetry and imagery data. Remote Sens. 2014, 6, 7522–7545. [Google Scholar] [CrossRef] [Green Version]
- Ellah, R.G.A. Water resources in Egypt and their challenges, Lake Nasser case study. Egypt. J. Aquat. Res. 2020, 46, 413–414. [Google Scholar]
- Nikiel, C.A.; Eltahir, E.A.B. Past and future trends of Egypt’s water consumption and its sources. Nat. Commun. 2021, 12, 1–11. [Google Scholar] [CrossRef] [PubMed]
- Wheeler, K.G.; Jeuland, M.; Hall, J.W.; Zagona, E.; Whittington, D. Understanding and managing new risks on the Nile with the Grand Ethiopian Renaissance Dam. Nat. Commun. 2020, 11, 1–9. [Google Scholar] [CrossRef] [PubMed]
- Basheer, M.; Nechifor, V.; Calzadilla, A.; Siddig, K.; Etichia, M.; Whittington, D.; Hulme, D.; Harou, J.J. Collaborative management of the Grand Ethiopian Renaissance Dam increases economic benefits and resilience. Nat. Commun. 2021, 12, 1–12. [Google Scholar] [CrossRef] [PubMed]
- Eldardiry, H.; Hossain, F. A blueprint for adapting high Aswan dam operation in Egypt to challenges of filling and operation of the Grand Ethiopian Renaissance dam. J. Hydrol. 2021, 598, 125708. [Google Scholar] [CrossRef]
- Siam, M.S.; Eltahir, E.A.B. Climate change enhances interannual variability of the Nile river flow. Nat. Clim. Chang. 2017, 7, 350–354. [Google Scholar] [CrossRef]
- Opperman, J.J.; Camargo, R.R.; Laporte-Bisquit, A.; Zarfl, C.; Morgan, A.J. Using the WWF Water Risk Filter to Screen Existing and Projected Hydropower Projects for Climate and Biodiversity Risks. Water 2022, 14, 721. [Google Scholar] [CrossRef]
- Mulligan, M.; Lehner, B.; Zarfl, C.; Thieme, M.; Beames, P.; van Soesbergen, A.; Higgins, J.; Januchowski-Hartley, S.R.; Brauman, K.A.; De Felice, L.; et al. Global Dam Watch: Curated data and tools for management and decision making. Environ. Res. Infrastruct. Sustain. 2021, 1, 33003. [Google Scholar] [CrossRef]
- Hasan, E.; Tarhule, A. Trend dynamics of GRACE terrestrial water storage in the Nile River Basin. Preprint. 2019, 13, 12. [Google Scholar]
- Teklesadik, A.D.; Alemayehu, T.; Van Griensven, A.; Kumar, R.; Liersch, S.; Eisner, S.; Tecklenburg, J.; Ewunte, S.; Wang, X. Inter-model comparison of hydrological impacts of climate change on the Upper Blue Nile basin using ensemble of hydrological models and global climate models. Clim. Change 2017, 141, 517–532. [Google Scholar] [CrossRef]
- Bhatti, H.A.; Rientjes, T.; Haile, A.T.; Habib, E.; Verhoef, W. Evaluation of bias correction method for satellite-based rainfall data. Sensors 2016, 16, 884. [Google Scholar] [CrossRef] [Green Version]
- Abera, W.; Brocca, L.; Rigon, R. Comparative evaluation of different satellite rainfall estimation products and bias correction in the Upper Blue Nile (UBN) basin. Atmos. Res 2016, 178, 471–483. [Google Scholar] [CrossRef]
- Worqlul, A.W.; Ayana, E.K.; Maathuis, B.H.P.; MacAlister, C.; Philpot, W.D.; Leyton, J.M.O.; Steenhuis, T.S. Performance of bias corrected MPEG rainfall estimate for rainfall-runoff simulation in the upper Blue Nile Basin, Ethiopia. J. Hydrol. 2018, 556, 1182–1191. [Google Scholar] [CrossRef]
- Eldardiry, H.; Hossain, F. Understanding reservoir operating rules in the transboundary nile river basin using macroscale hydrologic modeling with satellite measurements. J. Hydrometeorol. 2019, 20, 2253–2269. [Google Scholar] [CrossRef]
- Abdelmalik, K.W.; Abdelmohsen, K. GRACE and TRMM mission: The role of remote sensing techniques for monitoring spatio-temporal change in total water mass, Nile basin. J. Afr. Earth Sci. 2019, 160, 103596. [Google Scholar] [CrossRef]
- Hasan, E.; Tarhule, A. GRACE: Gravity Recovery and Climate Experiment long-term trend investigation over the Nile River Basin: Spatial variability drivers. J. Hydrol. 2020, 586, 124870. [Google Scholar] [CrossRef]
- Biswas, N.K.; Hossain, F. A Multidecadal Analysis of Reservoir Storage Change in Developing Regions. J. Hydrometeorol. 2022, 23, 71–85. [Google Scholar] [CrossRef]
- Goharian, E.; Burian, S.J.; Bardsley, T.; Strong, C. Incorporating potential severity into vulnerability assessment of water supply systems under climate change conditions. J. Water Resour. Plan. Manag. 2016, 142, 04015051. [Google Scholar] [CrossRef]
- Goharian, E.; Burian, S.J. Developing an integrated framework to build a decision support tool for urban water management. J. Hydroinform. 2018, 20, 708–727. [Google Scholar] [CrossRef] [Green Version]
- Goharian, E.; Burian, S.J.; Karamouz, M. Using joint probability distribution of reliability and vulnerability to develop a water system performance index. J. Water Resour. Plan. Manag. 2018, 144, 04017081. [Google Scholar] [CrossRef]
- Goharian, E.; Azizipour, M.; Sandoval-Soils, S.; Fogg, G.E. Surface reservoir reoperation for managed aquifer recharge: Folsom reservoir system. J. Water Resour. Plan. Manag. 2020, 146, 04020095. [Google Scholar] [CrossRef]
- El-Shafie, A.H.; El-Manadely, M.S. An integrated neural network stochastic dynamic programming model for optimizing the operation policy of Aswan high Dam. Hydrol. Res. 2011, 42, 50–67. [Google Scholar] [CrossRef]
- Hossain, M.S.; El-shafie, A. Performance analysis of artificial bee colony (ABC) algorithm in optimizing release policy of Aswan High Dam. Neural Comput. Appl. 2014, 24, 1199–1206. [Google Scholar] [CrossRef]
- Eldardiry, H.; Hossain, F. Re-Evaluating the Operating Rule of High Aswan Dam under the Combined Impacts of Transboundary dams and Cropping Patterns: A Satellite-based Approach. In Proceedings of the AGU Fall Meeting Abstracts, San Francisco, CA, USA, 9–13 December 2019. [Google Scholar]
- Goharian, E.; Azizipour, M.; Sandoval-Solis, S.; Fogg, G. Using Cellular Automata Approach to Optimize the Hydropower Reservoir Operation of Folsom Dam. Water 2021, 13, 1851. [Google Scholar] [CrossRef]
- Zarei, M.; Bozorg-Haddad, O.; Baghban, S.; Delpasand, M.; Goharian, E.; Loáiciga, H.A. Machine-learning algorithms for forecast-informed reservoir operation (FIRO) to reduce flood damages. Sci. Rep. 2021, 11, 1–21. [Google Scholar] [CrossRef]
- Bao, A.; Gildin, E.; Zalavadia, H. Development of proxy models for reservoir simulation by sparsity promoting methods and machine learning techniques. In Proceedings of the ECMOR XVI-16th European Conference on the Mathematics of Oil Recovery, Barcelona, Spain, 3–6 September 2018; pp. 1–14. [Google Scholar]
- Azizipour, M.; Sattari, A.; Afshar, M.H.; Goharian, E.; Solis, S.S. Optimal hydropower operation of multi-reservoir systems: Hybrid cellular automata-simulated annealing approach. J. Hydroinform. 2020, 22, 1236–1257. [Google Scholar] [CrossRef]
- Bernardes, J.; Santos, M.; Abreu, T.; Prado, L.; Miranda, D.; Julio, R.; Viana, P.; Fonseca, M.; Bortoni, E.; Bastos, G.S. Hydropower Operation Optimization Using Machine Learning: A Systematic Review. AI 2022, 3, 78–99. [Google Scholar] [CrossRef]
- Emami, M.; Nazif, S.; Mousavi, S.F.; Karami, H.; Daccache, A. A hybrid constrained coral reefs optimization algorithm with machine learning for optimizing multi-reservoir systems operation. J. Environ. Manag. 2021, 286, 112250. [Google Scholar] [CrossRef] [PubMed]
- Giuliani, M.; Lamontagne, J.R.; Reed, P.M.; Castelletti, A. A State-of-the-Art Review of Optimal Reservoir Control for Managing Conflicting Demands in a Changing World. Water Resour. Res. 2021, 57, e2021WR029927. [Google Scholar] [CrossRef]
- Ministry of water resources and Irrigation. Water for the Future, National Water Resources Plan 2017; Egyptian ministry of water resources and Irrigation: Cairo, Egypt, 2005. [Google Scholar]
- Abd-El Monsef, H.; Smith, S.E.; Darwish, K. Impacts of the Aswan High Dam After 50 Years. Water Resour. Manag. 2015, 29, 1873–1885. [Google Scholar] [CrossRef]
- Morton, F.I. Operational estimates of lake evaporation. J. Hydrol. 1983, 66, 77–100. [Google Scholar] [CrossRef]
- Ebaid, H.M.I.; Ismail, S.S. Lake Nasser evaporation reduction study. J. Adv. Res. 2010, 1, 315–322. [Google Scholar] [CrossRef] [Green Version]
- Elsawwaf, M.; Willems, P.; Pagano, A.; Berlamont, J. Evaporation estimates from Nasser Lake, Egypt, based on three floating station data and Bowen ratio energy budget. Theor. Appl. Climatol. 2010, 100, 439–465. [Google Scholar] [CrossRef] [Green Version]
- El-Magd, I.H.A.; Ali, E.M. Estimation of the evaporative losses from Lake Nasser, Egypt using optical satellite imagery. Int. J. Digit. Earth 2012, 5, 133–146. [Google Scholar] [CrossRef]
- Hassan, M. Evaporation estimation for Lake Nasser based on remote sensing technology. Ain Shams Eng. J. 2013, 4, 593–604. [Google Scholar] [CrossRef] [Green Version]
- El-Mahdy, M.E.-S.; Abbas, M.S.; Sobhy, H.M. Development of mass-transfer evaporation model for Lake Nasser, Egypt. J. Water Clim. Chang. 2021, 12, 223–237. [Google Scholar] [CrossRef]
- Elsawwaf, M.; Willems, P. Analysis of the climate variability on Lake Nasser evaporation based on the Bowen ratio energy budget method. J. Environ. Biol. 2012, 33, 475–485. [Google Scholar]
- Elsawwaf, M.; Willems, P.; Feyen, J. Assessment of the sensitivity and prediction uncertainty of evaporation models applied to Nasser Lake, Egypt. J. Hydrol. 2010, 395, 10–22. [Google Scholar] [CrossRef]
- Hamdan, A.M.; Zaki, M. Long term estimation of water losses through evaporation from water surfaces of Nasser Lake Reservoir, Egypt. Int. J. Civ. Env. Eng. 2016, 16, 5. [Google Scholar]
- Hassan, A.; Ismail, S.S.; Elmoustafa, A.; Khalaf, S. Evaluating evaporation rate from high Aswan Dam Reservoir using RS and GIS techniques. Egypt. J. Remote Sens. Sp. Sci. 2018, 21, 285–293. [Google Scholar] [CrossRef]
- Salih, S.Q.; Allawi, M.F.; Yousif, A.A.; Armanuos, A.M.; Saggi, M.K.; Ali, M.; Shahid, S.; Al-Ansari, N.; Yaseen, Z.M.; Chau, K.-W. Viability of the advanced adaptive neuro-fuzzy inference system model on reservoir evaporation process simulation: Case study of Nasser Lake in Egypt. Eng. Appl. Comput. Fluid Mech. 2019, 13, 878–891. [Google Scholar] [CrossRef] [Green Version]
- Allawi, M.F.; Ahmed, M.L.; Aidan, I.A.; Deo, R.C.; El-Shafie, A. Developing reservoir evaporation predictive model for successful dam management. Stoch. Environ. Res. Risk Assess. 2021, 35, 499–514. [Google Scholar] [CrossRef]
- El-Ashry, M.T.; Alford, D.L. Water Management Models in Practice: A Case Study of the Aswan High Dam. Eos Trans. Am. Geophys. Union 1984, 65, 756. [Google Scholar] [CrossRef]
- El Baradei, S.A.; Al Sadeq, M. Optimum coverage of irrigation canals to minimize evaporation and maximize dissolved oxygen concentration: Case study of Toshka, Egypt. Int. J. Environ. Sci. Technol. 2019, 16, 4223–4230. [Google Scholar] [CrossRef]
- El-Shabrawy, G.M.; Dumont, H.J. The Toshka Lakes. In The Nile; Springer: Berlin/Heidelberg, Germany, 2009; pp. 157–162. [Google Scholar]
- Bastawesy, M.A.; Khalaf, F.I.; Arafat, S.M. The use of remote sensing and GIS for the estimation of water loss from Tushka lakes, southwestern desert, Egypt. J. Afr. Earth Sci. 2008, 52, 73–80. [Google Scholar] [CrossRef]
- Woolway, R.I.; Kraemer, B.M.; Lenters, J.D.; Merchant, C.J.; O’Reilly, C.M.; Sharma, S. Global lake responses to climate change. Nat. Rev. Earth Environ. 2020, 1, 1–16. [Google Scholar] [CrossRef]
- Shaltout, M.A.M. Solar hydrogen from Lake Nasser for 21st century in Egypt. Int. J. Hydrogen Energy 1998, 23, 233–238. [Google Scholar] [CrossRef]
- Badawy, H.A. Effect of expected climate changes on evaporation losses from Aswan High Dam Reservoir (AHDR). In Proceedings of the Thirteenth International Water Technology Conference, Ismailia, Egypt, 12 September 2019. [Google Scholar]
- Biswas, A.K. Lake Nasser: Alleviating the impacts of climate fluctuations and change. In Increasing Resilience to Climate Variability and Change; Springer: Berlin/Heidelberg, Germany, 2016; pp. 233–250. [Google Scholar]
- Harrigan, S.; Zsoter, E.; Alfieri, L.; Prudhomme, C.; Salamon, P.; Wetterhall, F.; Barnard, C.; Cloke, H.; Pappenberger, F. GloFAS-ERA5 operational global river discharge reanalysis 1979-present. Earth Syst. Sci. Data 2020, 12, 2043–2060. [Google Scholar] [CrossRef]
- Janowiak, J.E.; Joyce, R.J.; Yarosh, Y. A real-time global half-hourly pixel-resolution infrared dataset and its applications. Bull. Am. Meteorol. Soc. 2001, 82, 205–217. [Google Scholar] [CrossRef] [Green Version]
- Huffman, G.J.; Adler, R.F.; Bolvin, D.T.; Nelkin, E.J. The TRMM multi-satellite precipitation analysis (TMPA). In Satellite Rainfall Applications for Surface Hydrology; Springer: Berlin/Heidelberg, Germany, 2010; pp. 3–22. [Google Scholar]
- Huffman, G.J.; Adler, R.F.; Bolvin, D.T.; Gu, G.; Nelkin, E.J.; Bowman, K.P.; Hong, Y.; Stocker, E.F.; Wolff, D.B. The TRMM Multisatellite Precipitation Analysis (TMPA): Quasi-global, multiyear, combined-sensor precipitation estimates at fine scales. J. Hydrometeorol. 2007, 8, 38–55. [Google Scholar] [CrossRef]
- Martens, B.; Miralles, D.G.; Lievens, H.; Van Der Schalie, R.; De Jeu, R.A.; Fernández-Prieto, D.; Beck, H.E.; Dorigo, W.A.; Verhoest, N.E. GLEAM v3: Satellite-based land evaporation and root-zone soil moisture. Geosci. Model Dev. 2017, 10, 1903–1925. [Google Scholar] [CrossRef] [Green Version]
- Mostafa, E.A. Flow in a Channel Connecting Two Reservoirs; Case Study: Toshka Channel Connecting Between Aswan Reservoir and Toshka Depression. In Proceedings of the Conference on Coping with Water Scarcity, Hurghada, Egypt, 26–28 August 1998. [Google Scholar]
- Shafik, N.M. Updating the Surface Area and Volume Equations of Lake Nasser using Multi Beam System. In Proceedings of the 19th International Water Technology Conference, Sharm El Sheikh, Egypt, 21–23 April 2016; pp. 21–23. [Google Scholar]
- Hersbach, H.; Bell, B.; Berrisford, P.; Hirahara, S.; Horányi, A.; Muñoz-Sabater, J.; Nicolas, J.; Peubey, C.; Radu, R.; Schepers, D.; et al. The ERA5 global reanalysis. Q. J. R. Meteorol. Soc. 2020, 146, 1999–2049. [Google Scholar] [CrossRef]
- Dunne, J.P.; John, J.G.; Adcroft, A.J.; Griffies, S.M.; Hallberg, R.W.; Shevliakova, E.; Stouffer, R.J.; Cooke, W.; Dunne, K.A.; Harrison, M.J.; et al. GFDL’s ESM2 global coupled climate-carbon earth system models. Part I: Physical formulation and baseline simulation characteristics. J. Clim. 2012, 25, 6646–6665. [Google Scholar] [CrossRef] [Green Version]
- Dunne, J.P.; John, J.G.; Shevliakova, S.; Stouffer, R.J.; Krasting, J.P.; Malyshev, S.L.; Milly, P.C.D.; Sentman, L.T.; Adcroft, A.J.; Cooke, W.; et al. GFDL’s ESM2 global coupled climate-carbon earth system models. Part II: Carbon system formulation and baseline simulation characteristics. J. Clim. 2013, 26, 2247–2267. [Google Scholar] [CrossRef] [Green Version]
- Griffies, S.M.; Winton, M.; Donner, L.J.; Horowitz, L.W.; Downes, S.M.; Farneti, R.; Gnanadesikan, A.; Hurlin, W.J.; Lee, H.C.; Liang, Z.; et al. The GFDL CM3 coupled climate model: Characteristics of the ocean and sea ice simulations. J. Clim. 2011, 24, 3520–3544. [Google Scholar] [CrossRef]
- Herman, J.D.; Giuliani, M. Policy tree optimization for threshold-based water resources management over multiple timescales. Environ. Model. Softw. 2018, 99, 39–51. [Google Scholar] [CrossRef]
- Yao, H.; Georgakakos, A.P. Nile Decision Support Tool River Simulation And Management; Georgia Water Resources Institute (GWRI): Atlanta, Georgia, 2003. [Google Scholar]
- Hassan, R.M.; Hekal, N.T.; Mansor, N.M. Evaporation reduction from Lake Naser using new environmentally safe techniques. In Proceedings of the Eleventh International Water Technology Conference, Sharm El Sheikh, Egypt, 15–18 March 2007; pp. 179–194. [Google Scholar]
- Whittington, D.; Guariso, G. Water Management Models in Practice: A Case Study of the Aswan High Dam; Elsevier Scientific Publishing Company: Amsterdam, The Netherlands, 1983; ISBN 0-444-42156-4. [Google Scholar]
- Omar, M.H.; El-Bakry, M.M. Estimation of evaporation from Lake Nasser. Meteorol. Res. Bull. 1970, 2, 1–27. [Google Scholar]
- Moussa, A.M.A. Dynamic operation rules of multi-purpose reservoir for better flood management. Alex. Eng. J. 2018, 57, 1665–1679. [Google Scholar] [CrossRef]
- Eshra, N.M.; Qottob, M.M. Impact of the hydroelectric peak load on water levels downstream of Aswan Old Dam and establishing new criteria for navigation. In Proceedings of the 2014 International Conference and Utility Exhibition on Green Energy for Sustainable Development (ICUE), Pattaya, Thailand, 19–21 March 2014. [Google Scholar]
- Mobasher, A.M.A. Adaptive Reservoir Operation Strategies under Changing Boundary Conditions? The Case of Aswan High Dam Reservoir. Doctoral Dissertation, Technische Universität, Darmstadt, Germany, 2010. [Google Scholar]
Figure 1.
Mosaic of Landsat satellite image of the study area created by Google Earth Engine and further processed by QGIS.3.
Figure 1.
Mosaic of Landsat satellite image of the study area created by Google Earth Engine and further processed by QGIS.3.

Figure 2.
Methodology flowchart.

Figure 3.
Average monthly evaporation rate used in the model.

Figure 4.
Bias correction process for inflow and outflow data.

Figure 5.
Comparison between field data and bias-corrected data using RF, SVR, and MLP methods at Dongola station.
Figure 5.
Comparison between field data and bias-corrected data using RF, SVR, and MLP methods at Dongola station.

Figure 6.
Comparison between field data and bias-corrected data using RF, SVR, and MLP methods at Aswan High Dam Downstream.
Figure 6.
Comparison between field data and bias-corrected data using RF, SVR, and MLP methods at Aswan High Dam Downstream.

Figure 7.
Structure of a policy tree.

Figure 8.
Flow chart of the policy tree optimization model.

Figure 9.
Simulated lake storage using different evaporation estimations.

Figure 10.
Simulated lake storage using the best evaporation estimation compared with historical data.
Figure 10.
Simulated lake storage using the best evaporation estimation compared with historical data.

Figure 11.
Toshka Spillway flow in simulation model.

Figure 12.
Annual hydropower generation.

Figure 13.
Aswan Reservoir monthly target release.

Figure 14.
Simulation and policy tree optimization lake storage results compared with historical data.
Figure 14.
Simulation and policy tree optimization lake storage results compared with historical data.

Figure 15.
Toshka Spillway flow in the base scenario.

Figure 16.
Daily hydropower generation in historical simulation and policy tree model.

Figure 17.
The optimized policy tree for the base scenario.

Figure 18.
Spatial distribution of the mean annual/seasonal Aswan High Dam Reservoir t2m over the period from 1979 to 2018.
Figure 18.
Spatial distribution of the mean annual/seasonal Aswan High Dam Reservoir t2m over the period from 1979 to 2018.

Figure 19.
Annual/seasonal surface air temperature time series for Aswan High Dam Reservoir.

Figure 20.
Thirty-year running annual means of projected surface air temperatures (Tas) under the four representative concentration pathway scenarios studied (RCP2.6, RCP4.5, RCP6.0, and RCP8.5) relative to the 2006–2035 period for the mini-Ensemble mean GFDL model simulation in Aswan High Dam Reservoir.


Table 1.
Nash–Sutcliffe model efficiency coefficients for the bias-corrected inflow and outflow data using different methods.
Table 1.
Nash–Sutcliffe model efficiency coefficients for the bias-corrected inflow and outflow data using different methods.
| Reservoir Inflow | ||||
|---|---|---|---|---|
| Linear Regression | Random Forest | SVR | MLP | |
| Inflow NS Validation | 0.594 | 0.649 | 0.635 | 0. 631 |
| Inflow R2 Validation | 0.628 | 0.637 | 0.652 | 0.665 |
| Inflow RMSE Validation | 4090 | 3832 | 3970 | 3848 |
| Inflow NS Calibration | 0.637 | 0.799 | 0.698 | 0.691 |
| Inflow R2 Calibration | 0.639 | 0.811 | 0.704 | 0.692 |
| Inflow RMSE Calibration | 3974 | 2953 | 3601 | 3644 |
| Downstream of Reservoir | ||||
| Outflow NS Validation | 0.598 | 0.434 | 0.558 | 0.649 |
| Outflow R2 Validation | 0.603 | 0.485 | 0.571 | 0.660 |
| Outflow RMSE Validation | 1063 | 1324 | 1096 | 992 |
| Outflow NS Calibration | 0.780 | 0.885 | 0.724 | 0.724 |
| Outflow R2 Calibration | 0.826 | 0.911 | 0.733 | 0.737 |
| Outflow RMSE Calibration | 698 | 514 | 806 | 798 |
Publisher’s Note: MDPI stays neutral with regard to jurisdictional claims in published maps and institutional affiliations. |
© 2022 by the authors. Licensee MDPI, Basel, Switzerland. This article is an open access article distributed under the terms and conditions of the Creative Commons Attribution (CC BY) license (https://creativecommons.org/licenses/by/4.0/).
Share and Cite
MDPI and ACS Style
Goharian, E.; Shaltout, M.; Erfani, M.; Eladawy, A. Developing an Optimized Policy Tree-Based Reservoir Operation Model for High Aswan Dam Reservoir, Nile River. Water 2022, 14, 1061. https://doi.org/10.3390/w14071061
AMA Style
Goharian E, Shaltout M, Erfani M, Eladawy A. Developing an Optimized Policy Tree-Based Reservoir Operation Model for High Aswan Dam Reservoir, Nile River. Water. 2022; 14(7):1061. https://doi.org/10.3390/w14071061
Chicago/Turabian StyleGoharian, Erfan, Mohamed Shaltout, Mahdi Erfani, and Ahmed Eladawy. 2022. "Developing an Optimized Policy Tree-Based Reservoir Operation Model for High Aswan Dam Reservoir, Nile River" Water 14, no. 7: 1061. https://doi.org/10.3390/w14071061
Note that from the first issue of 2016, this journal uses article numbers instead of page numbers. See further details here.