
Experimental and Numerical Study on Ice Blockage Performance of Propeller in Cavitation Flow


1
School of Naval Architecture and Ocean Engineering, Jiangsu University of Science and Technology, Zhenjiang 212100, China
2
China Ship Scientific Research Center, Wuxi 214000, China
*
Author to whom correspondence should be addressed.
Water 2022, 14(7), 1060; https://doi.org/10.3390/w14071060
Submission received: 27 February 2022
/
Revised: 17 March 2022
/
Accepted: 25 March 2022
/
Published: 28 March 2022
(This article belongs to the Special Issue Sea, River, Lake Ice Properties and Their Applications in Practices)
Abstract
:Cavitation greatly affects the ice blockage performance of propellers in polar areas, while the combined effect of cavitation and ice blockage on propellers has rarely been considered. In this work, the propeller model test in the cavitation tunnel and the viscous flow CFD numerical simulation based on RANS were conducted. In the cavitation tunnel test, the ice blockage model was simulated by a water-insoluble rectangular solid block, and the ice blockage was measured by the distance between the solid block and the propeller. The thrust and torque in tests and simulations were discussed under the uniform flow and ice blockage scenarios, as well as the variation of cavitation excitation force, pressure distribution of blades, cavitation characteristics and vortex intensity with advance coefficient when σn = 1.5, L/D = 0.15 in an ice blockage environment. The research shows that the numerical simulation results based on overlapping grids are in good agreement with the model test results, and the mean hydrodynamic errors are within 5%. In the uniform flow test, when the advance coefficient is small, the thrust and torque of the propeller will experience a sharp drop due to the influence of heavy cavitation. In the ice blockage test, the thrust and torque increase with the decrease of ice-propeller spacing, and the ice blockage becomes more serious as the cavitation grows. The propeller oscillates violently due to the cavitation excitation force, and the oscillation frequency increases with the increase of the advance coefficient. The cavitation is generated in the low-pressure area of the suction surface, and the cavitation shape captured in the present numerical simulation is consistent with the experimental phenomenon. Since the cavitation reduces the contact area between the water and the blade, the vortex strength will be reduced for the attachment of cavitation, and the vortex strength increases with the increase of the advance coefficient. This study will explore more hydrodynamic regularities with ice-class propellers in an ice blockage environment when cavitation occurrs, and provide technical support for the design of propellers of polar ships.
1. Introduction
With global warming and the accelerated melting of sea ice, polar oil and gas and waterway resources will gradually become valuable for development, and are becoming the focus of countries around the world [1]. As a key equipment of polar engineering, the polar ship has an important role in the exploration and exploitation of polar resources. When polar ships sail in an ice channel where ice and water are mixed, the ice may interact with the propeller, which will have a great impact on the safety of the structure and hydrodynamic performance of the propeller. The reason for the affected hydrodynamic performance is the ice blockage effect of the propeller; when the propeller rotates at high speed, the ice block will be sucked into the flow field before the propeller, making the propeller blocked by the sucked ice block, so the actual rotating speed of the propeller will be lower [2]. However the polar ship navigates in an ice field, the ice resistance is much greater than open-water resistance, so more power is needed to keep navigating speed. The power of the polar ship is obtained from the propeller, and the propeller needs to maintain a high rotating speed, which puts the propeller in a heavy load state [3]. When the propeller rotates at a high speed, the pressure of the field around the propeller will be decreased, which very easily causes the surface pressure of the blades to drop sharply. At the same time, cavitation will occur when the surface pressure of the blades is lower than the saturated vapor pressure. The appearance of cavitation will adversely affect the propeller propulsion performance, blade erosion, hull vibration and other aspects [4].
In order to study the hydrodynamic performance of the propeller at low cavitation numbers, scholars have performed relevant research on the cavitation tunnel test and numerical simulation of the propeller. As for experiments, Sampson et al. [5] conducted ice-propeller model tests with different cavitation numbers in the Emerson cavitation tunnel (ETC) and proved that the cavitation effect is an important factor affecting the hydrodynamic performance of the propeller, and the hydrodynamic performance of the propeller is also related to the propeller and ice shapes, working environment, motion, and so forth. Wu et al. [6,7,8] conducted a series of ice propeller cavitation performance tests in the cavitation water cylinder of the China Ship Scientific Research Center, and tested the blockage parameters and different cavitation numbers in the uniform flow and ice blocking environments.
With respect to numerical simulations, Rhee et al. [9] used the computational fluid dynamics (CFD) method combined with unstructured grids to study the cavitation performance of a marine propeller. Based on an incompressible Reynolds-averaged Navier–Stokes (RANS) equation, Liu et al. [10] utilized a single complete cavitation model to study the cavitation performance of an open-water propeller. Zhu et al. [11] adopted a RANS model based on unstructured grids to predict different cavitation phenomena of the propeller under the condition of uniform flow. Shin et al. [12] carried out numerical simulations on the cavitation performances for a conventional propeller and a skewed propeller located behind the ship. Ju [13] used a RANS solver to calculate the cavitation performances of an open-water propeller when located behind the ship, and the calculation results were good. Zheng [14] utilized Open FOAM to establish a numerical prediction method for the cavitation of a propeller behind the ship, and the numerical results were compared with the experimental values. Wu et al. [6] studied the influence of ice-propeller spacing on the thrust, torque and cavitation of a propeller by numerical calculations, and their numerical results were compared with the experimental data as well. However, the combined effect of cavitation and ice blockage on propellers has rarely been considered and its regularities (e.g., cavitation excitation force, pressure distribution of blades, cavitation characteristics and vortex intensity) are not investigated systematically in these works.
In this paper, the propeller tunnel test technique and CFD numerical simulation based on RANS were used to investigate the propeller cavitation, and the propeller model test data and numerical simulation results were compared and analyzed. The effect of cavitation on the open-water performance of the propeller in the uniform flow and ice blockage scenarios were studied, as well as the cavitation excitation force, the pressure distribution of the blades, the cavitation characteristics and the vortex strength. This study will explore more hydrodynamic regularities with the cavitation performance of the ice-class propeller in polar, provide technical support for the design of propellers, and accumulate experience for polar development and utilization.
2. Model Test
2.1. Test Model
Experiments for a propeller model under uniform flow and ice blockage conditions were carried out in a cavitation tunnel of the China Ship Research Center. The main parameters of the propeller model are shown in Table 1. The propeller material is aluminum alloy, and the rotation direction is right. According to the requirements of the marine industry standard for the roughness of the propeller model, the height of blade surface roughness is less than 1.6 μm [15].
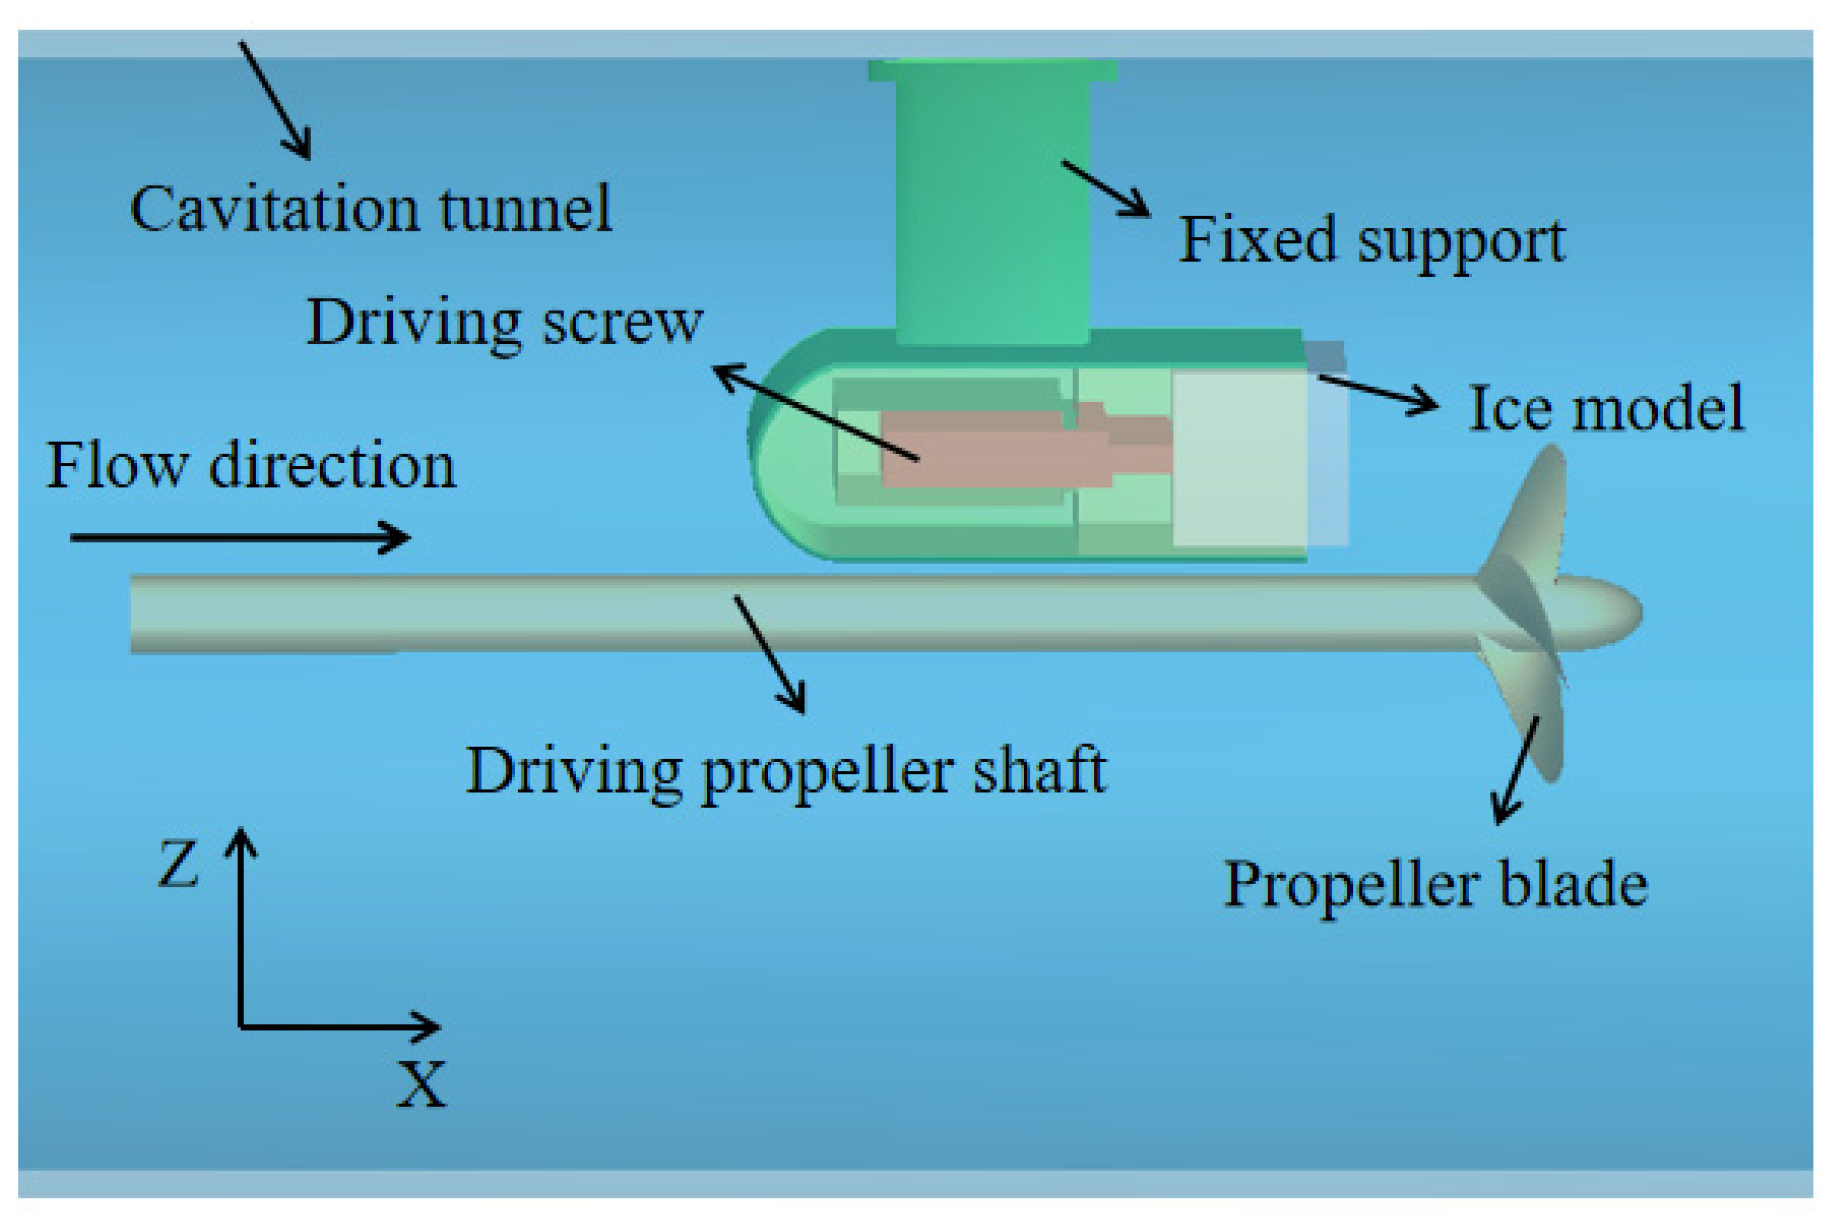
In order to simulate the ice blockage environment in the cavitation tunnel, an ice blockage model in front of the propeller model was designed and manufactured. The ice blockage was simulated by a water-insoluble rectangular solid block with a length of 430 mm, a width of 250 mm and a height of 125 mm. The axial relative position L between the ice blockage and the propeller disk was determined by the axial drive system. The installation diagram of the ice blockage and the propeller model in the cavitation tunnel is shown in Figure 1.
2.2. Test Device
The diameter and the length of the tunnel in the working section are 0.8 m and 3.2 m, respectively. The flow speed range is 3~20 m/s, the pressure adjustment range is 8~400 kPa, and the minimum cavitation number is 0.15. Measuring instruments adopted in the test and their measuring range are listed in Table 2.
2.3. Similarity Criteria
From the model test, the numerical simulation of the propeller must meet certain similarity criteria. In the test, the similarity relationships are considered in terms of the aspects of propeller geometry, motion, viscous force and cavitation.
- Geometric similarity
The propeller model made strictly according to the scale ratio of 1:28 ensures the geometric similarity between the model and the actual one.
- b.
- Motion similarity
The similarity of motion is ensured by the definitions of propeller advance coefficient J, thrust coefficient KT, torque coefficient KQ, and open-water efficiency η0, which are defined as follows:
where V is the flow speed, n is the rotating speed of the propeller, D is the diameter of the propeller, T is the thrust of the propeller, Q is the torque of the propeller, and ρ is the density of water.
- c.
- Viscous force similarity
To ensure that the Reynolds number Rn(0.75R) of the chord length of the blade section at 0.75 R of the propeller exceeds the critical Reynolds number [16], that is:
where L0.75R is the chord length of blade section at 0.75 R, and ν is the kinematic viscosity coefficient of water.
- d.
- Cavitation number similarity
The pressure similarity of the test is met by confirming the cavitation number. The cavitation number of flow σν and the cavitation number of rotation σn are defined as follows:
where P and Pν denote the pressure of the shaft center and the saturated vapor pressure, respectively.
2.4. Test Scheme
To study the hydrodynamic performance of the propeller at a low cavitation number, the experiments were carried out in a cavitation tunnel with two different environmental conditions, that is, the uniform flow condition and the simulated ice blockage condition.
For the uniform flow, the flow speed V was 4.0 m/s, the cavitation number of flow σν was 2.5, and five advance coefficients J were tested. The range of five advance coefficients was 0.4–0.8, and the ∆J is 0.1.
For the ice blockage, the ice blockage performance of the propeller was studied according to the cavitation number of rotation σn, the advance coefficient J and the ice-propeller spacing L/D. The method of constant rotating speed with variable flow speed was used to adjust the advance coefficient J. The rotating speed n was 35 rps, and the pressure of the cavitation tunnel was adjusted according to the cavitation number of rotation σn. Because the propeller is under heavy load due to ice blockage, this paper will study the hydrodynamic performance of the propeller under low cavitation numbers and low advance coefficients. The test operating conditions are shown in Table 3.
3. Test Results and Analyses
3.1. Uniform Flow Environment
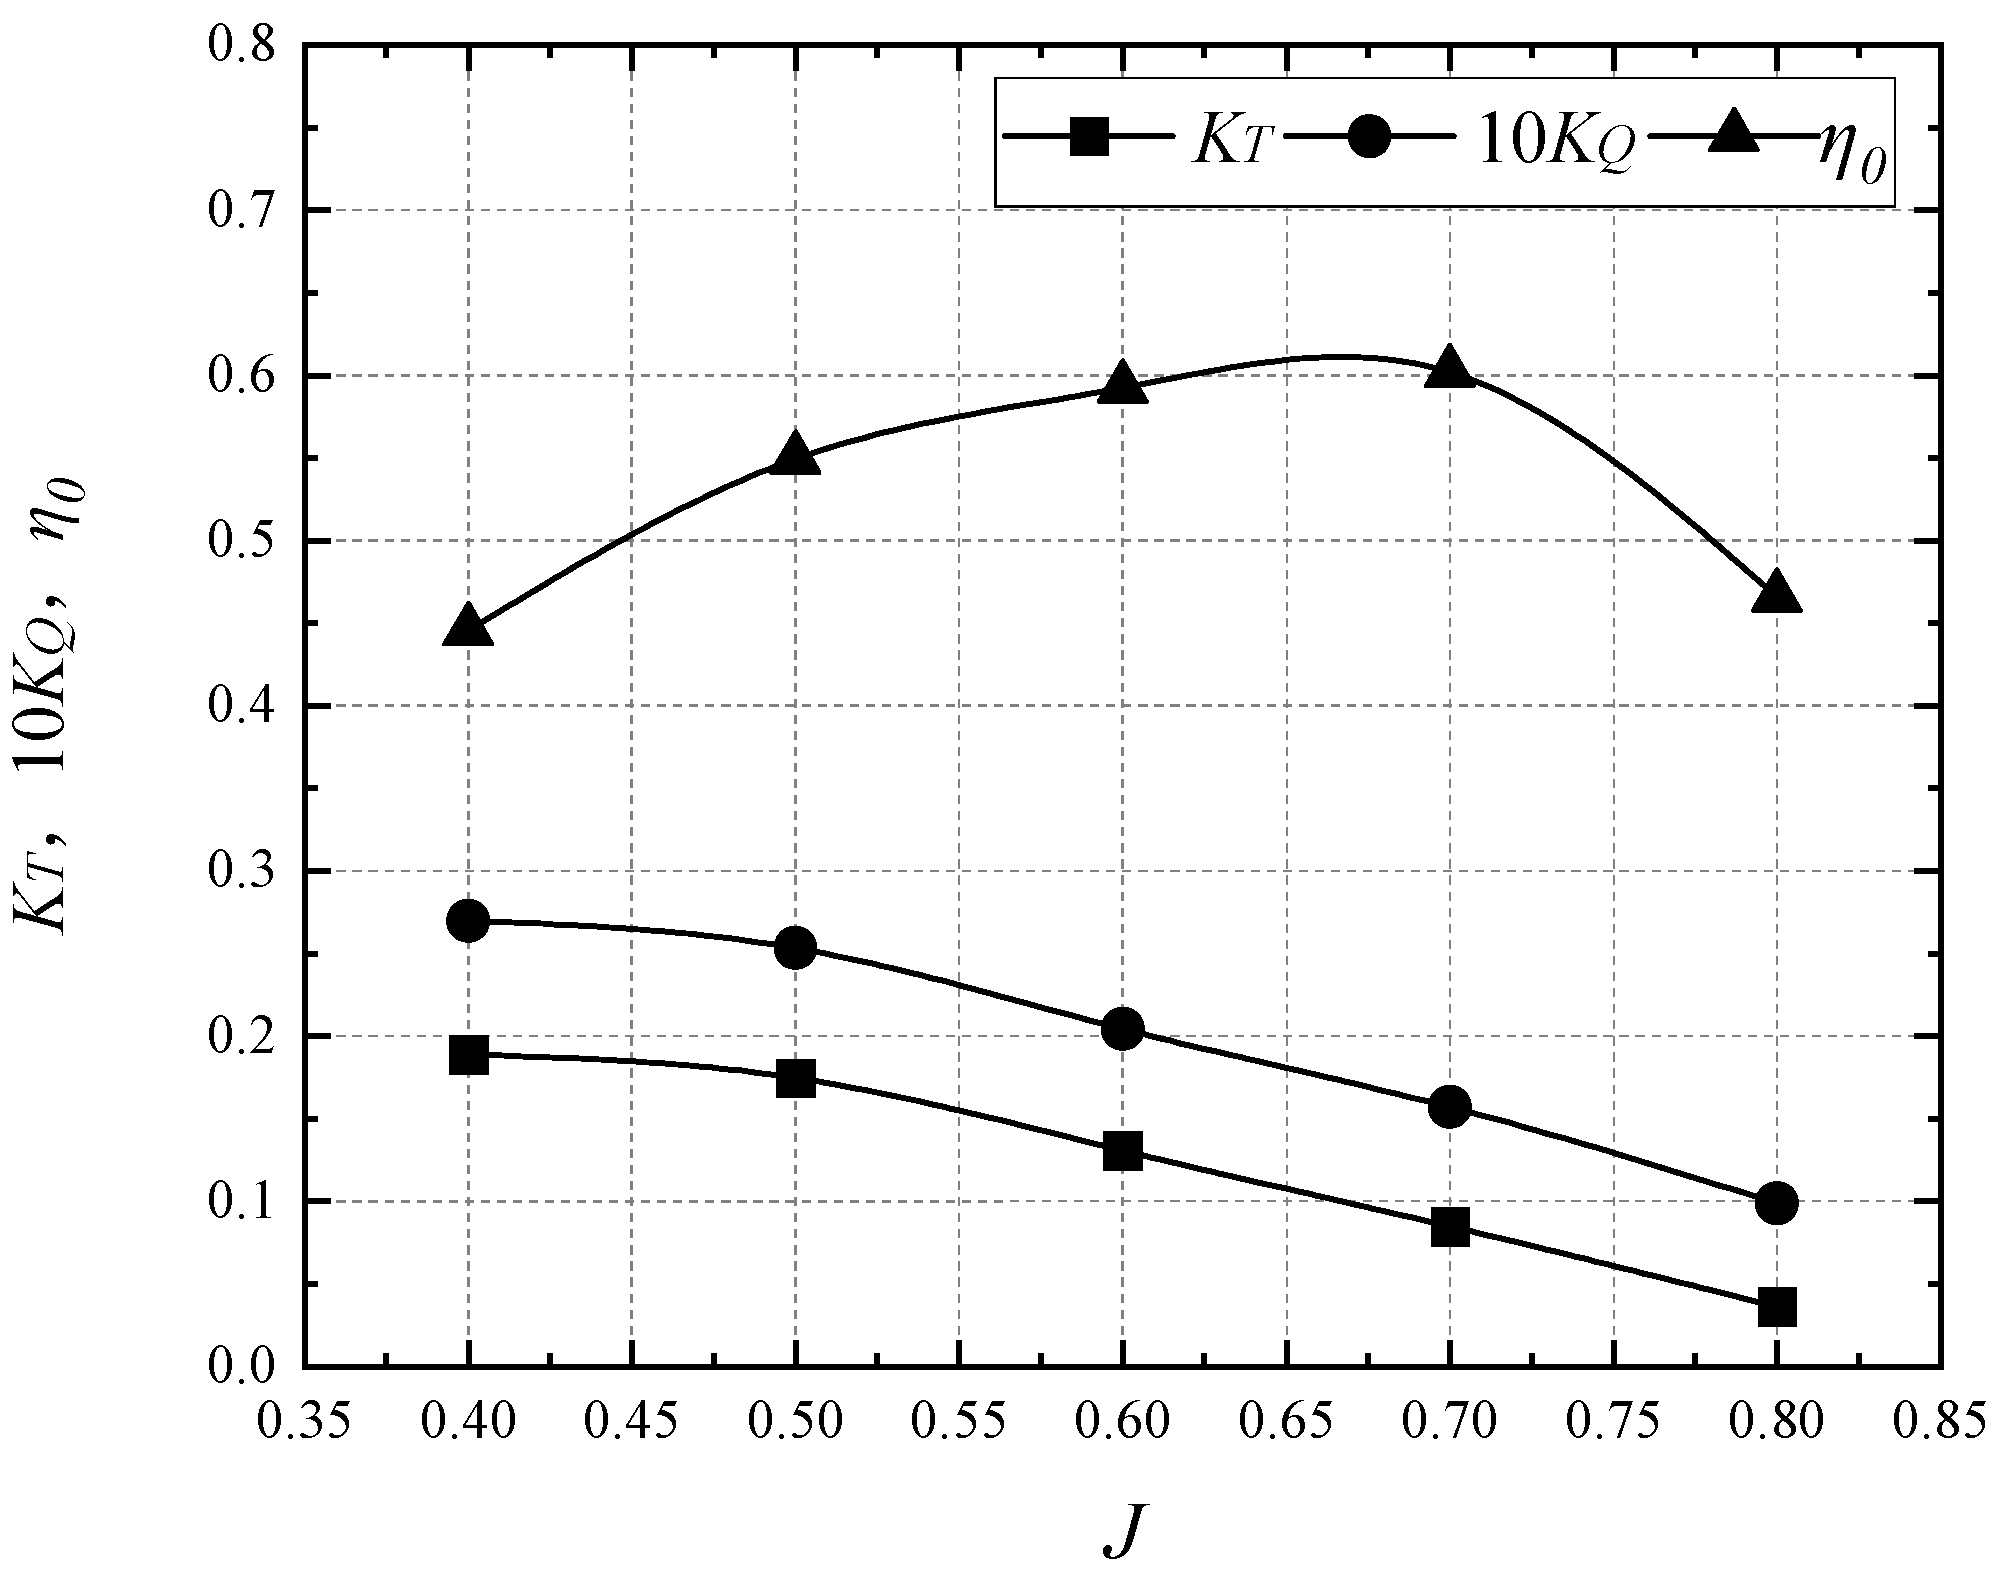
Figure 2 shows the variation curves of the thrust coefficient KT, the torque coefficient KQ and the open-water efficiency η0 of the propeller with advance coefficient under uniform flow conditions at σν = 2.5.
As shown in Figure 2, when the advance coefficient J increases from 0.4 to 0.8, the thrust coefficient KT decreases from 0.189 to 0.036. The torque coefficient 10 KQ also decreases with the increase of advance coefficient J, from 0.027 to 0.099, and the two curves of KT and KQ are almost parallel to each other. As the advance coefficient J increases from 0.4 to 0.7, the open-water efficiency η0 increases with the increase of the advance coefficient J, as J further increases to 0.8, η0 decreases rapidly. The decline rates of both the thrust coefficient and the torque coefficient are almost constant as the advance coefficient increases from 0.5 to 0.8, which are slightly larger than their corresponding decline rates as the advance coefficient increases J from 0.4 to 0.5; therefore, there is a sharp drop, and the same conclusion can be seen from Reference [17].
In the uniform flow environment, the flow speed is kept constant. When the advance coefficient increases, both the rotating speed and the flow speed decrease. They would cause a decrease in the pressure difference on the blade surface. Under low cavitation number conditions, as the rotating speed of the propeller increases and the pressure of flow field decreases, the pressure on the blade surface becomes lower than the saturated the vapor pressure, resulting in cavitation [18]. The cavitation coverage area increases with the decrease of the advance coefficient, and the most serious cavitation phenomenon occurs at J = 0.4, which makes both the thrust coefficient and the torque coefficient drop sharply.
3.2. Ice Blockage Environment
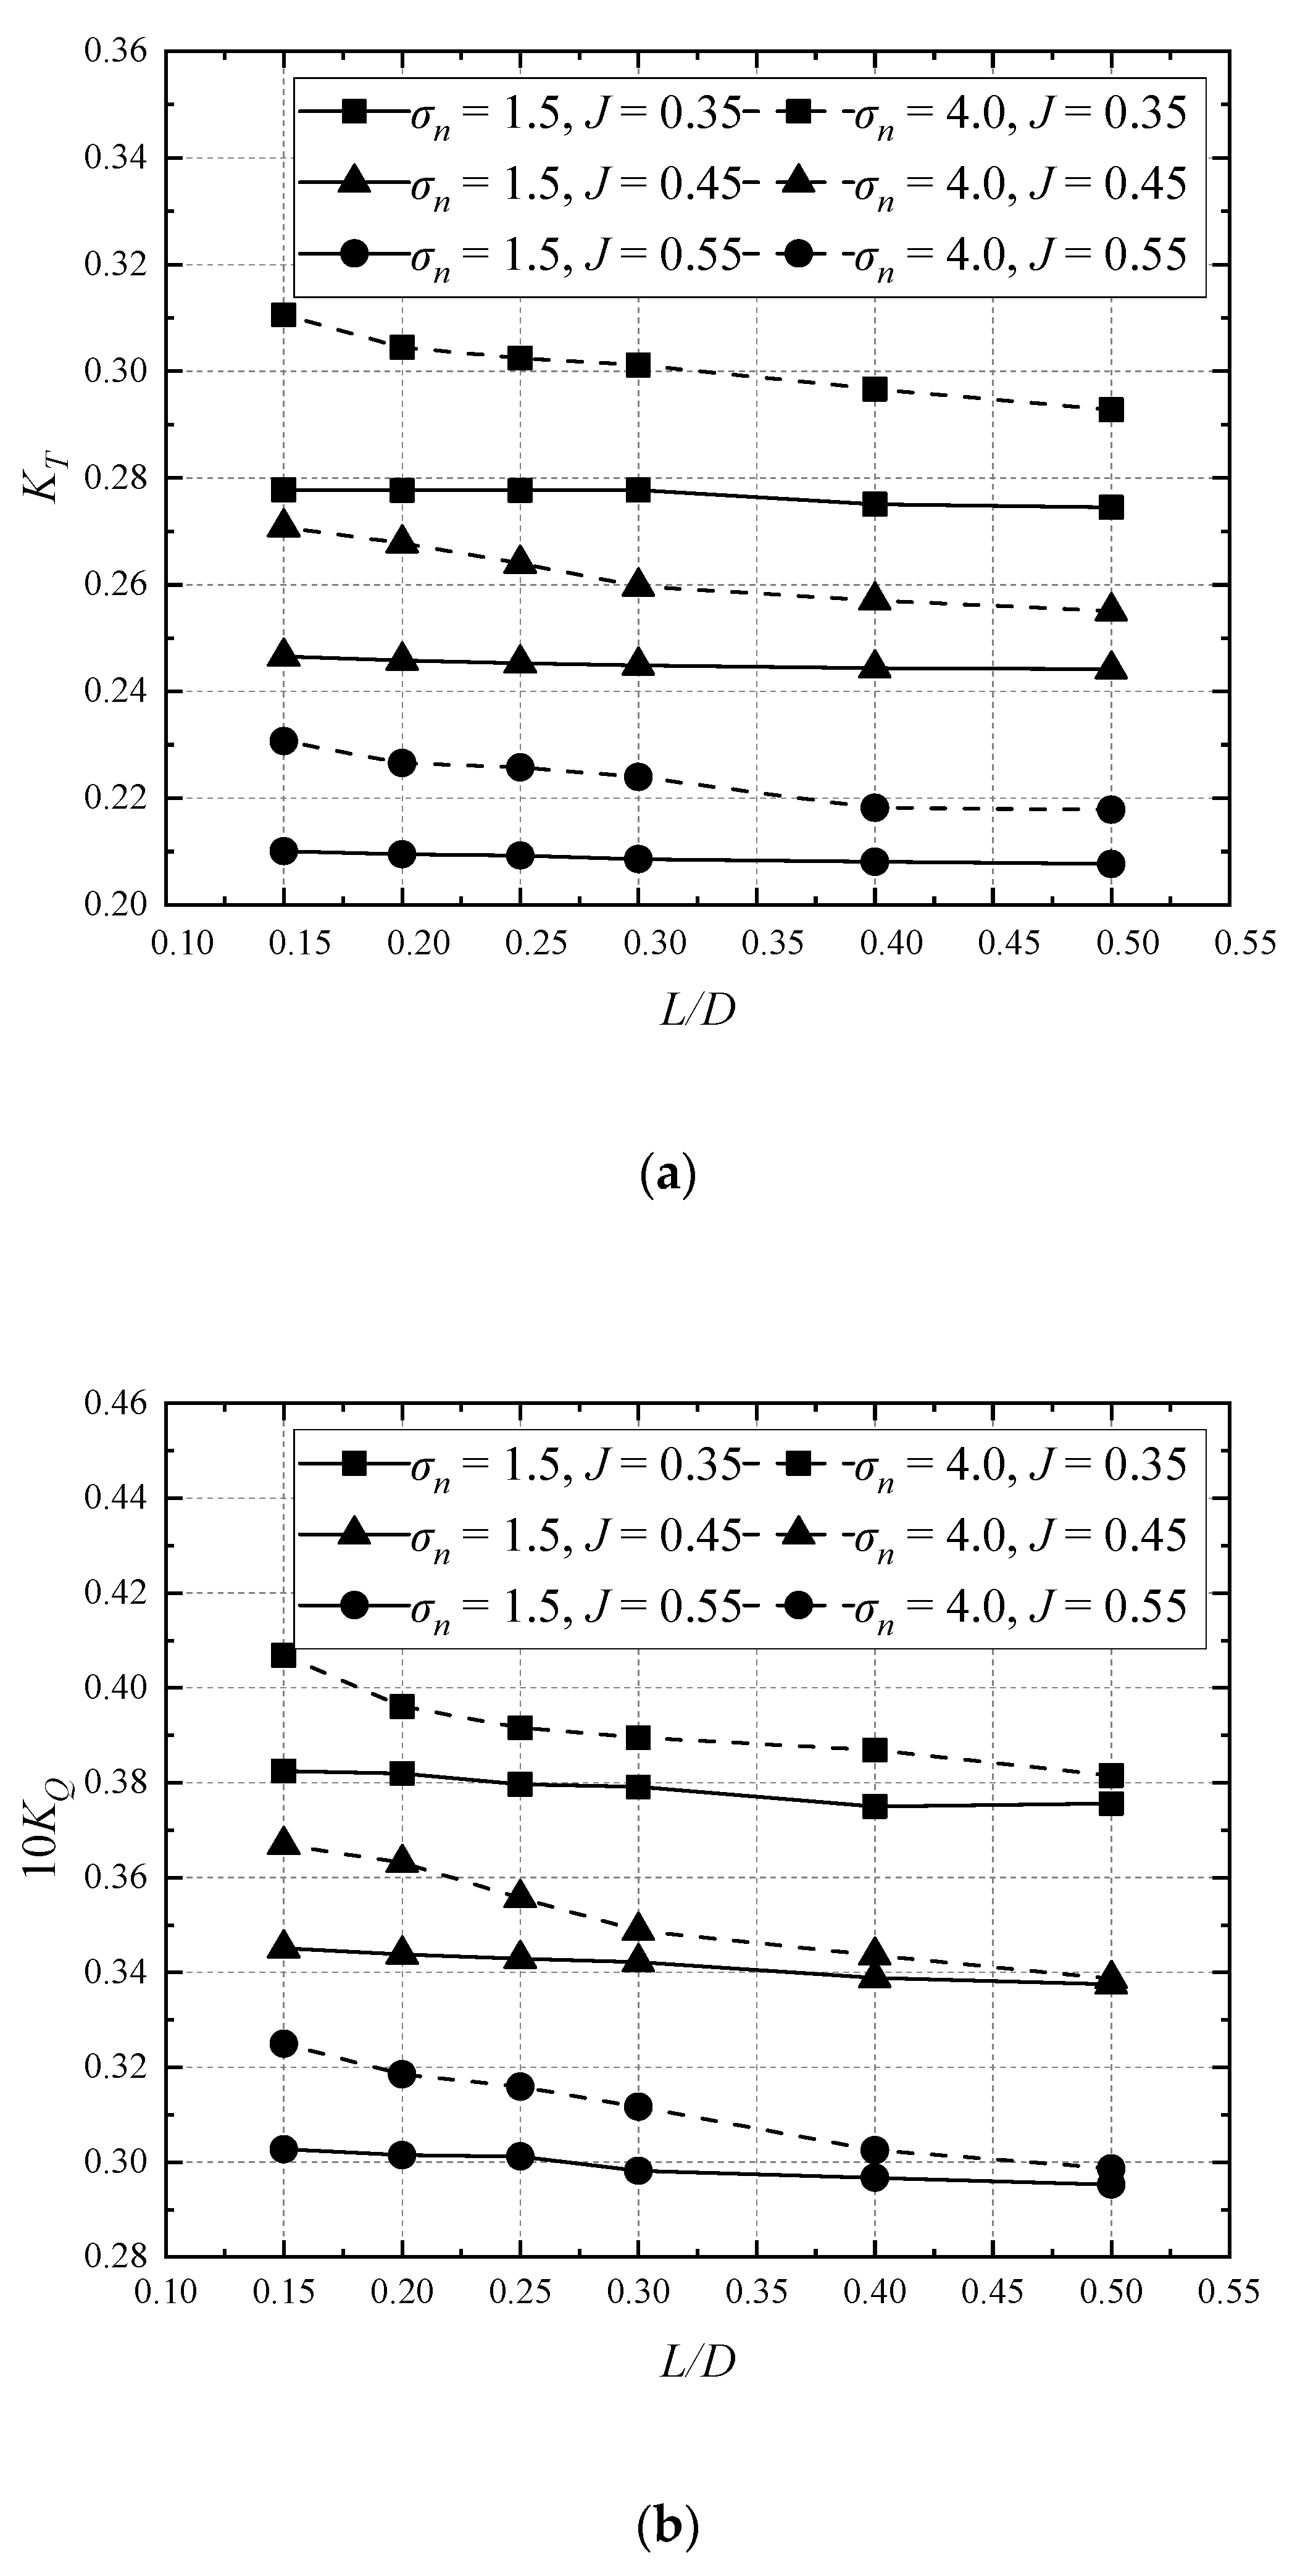
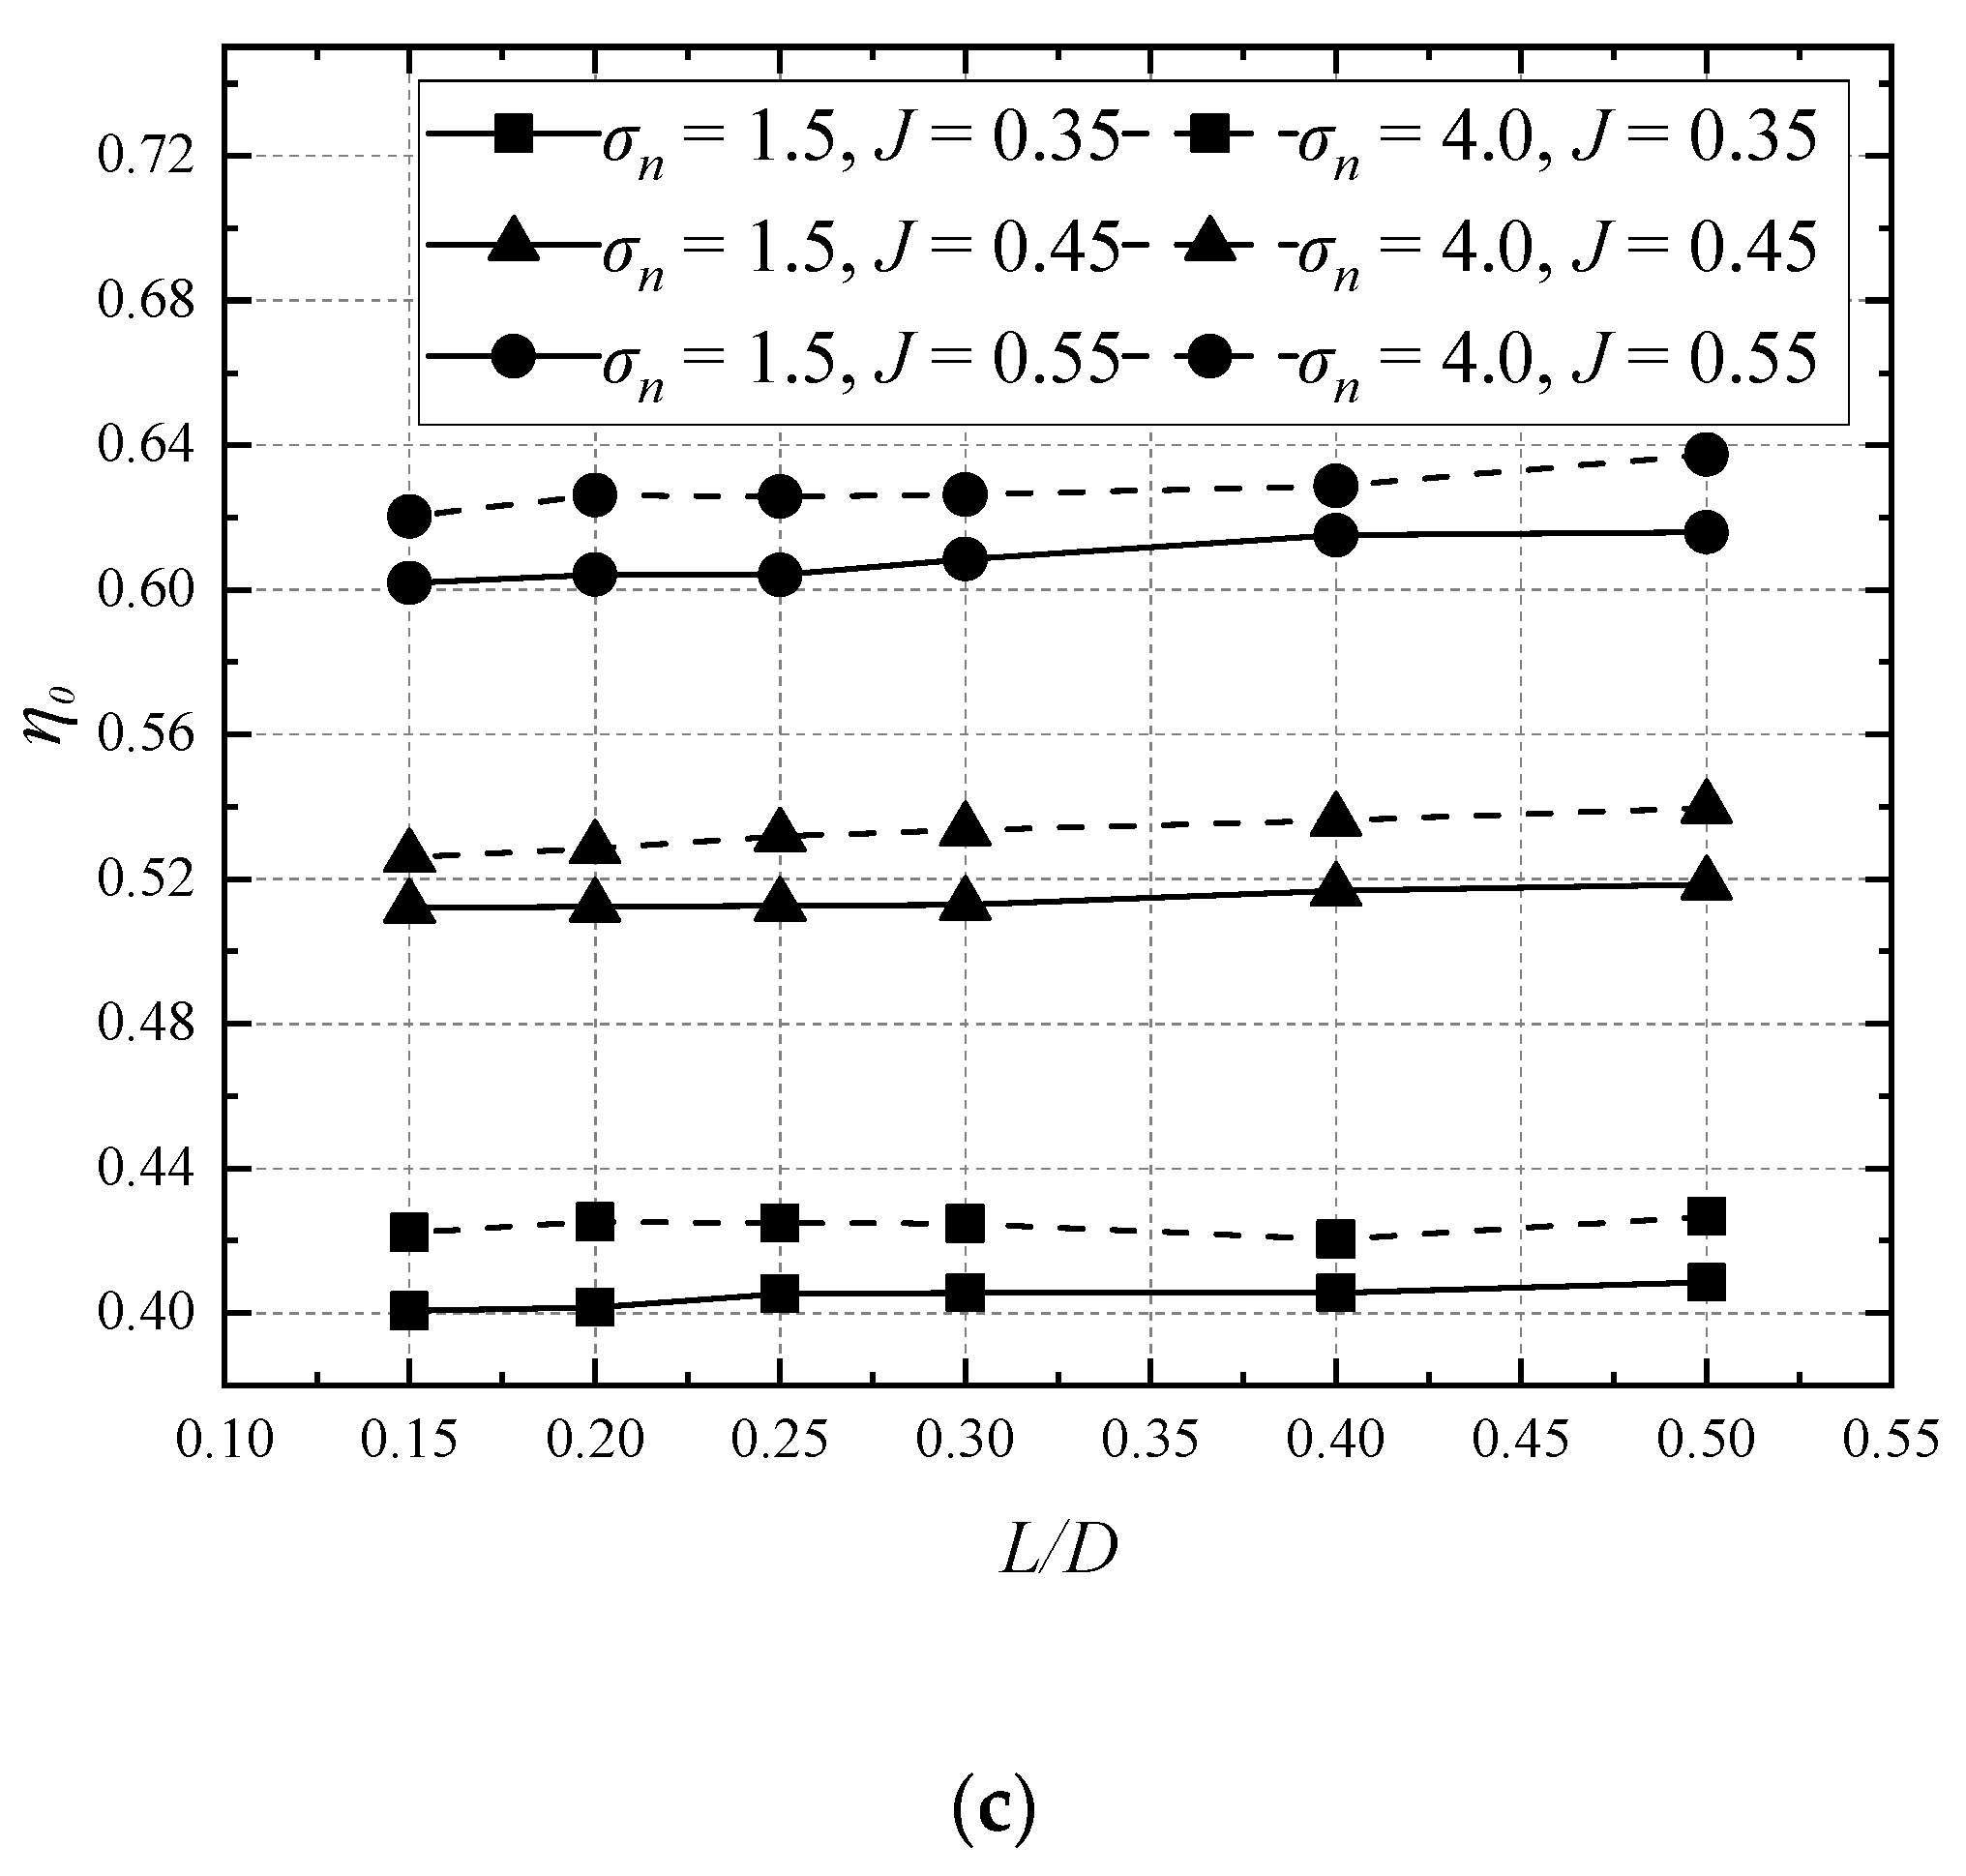
Figure 3 shows the variation of the thrust coefficient KT, the torque coefficient KQ and the open-water efficiency η0 with the ice-propeller spacing L/D at different rotating speeds and advance coefficients in the ice blockage environment.
As shown in Figure 3, when the cavitation number σn is 1.5 and 4.0, both the thrust and the torque coefficients are insensitive to the ice-propeller spacing. When σn = 1.5 and J = 0.35, the thrust coefficient KT fluctuates between 0.275 and 0.278, the torque coefficient 10KQ increases from 0.375 to 0.383, and the open-water efficiency η0 decreases from 0.409 to 0.401. Both the thrust and the torque coefficients show a downward trend with the increase of the ice-propeller spacing, while the open-water efficiency increases with the latter. Similarly, with the increase of the advance coefficient, both the thrust and the torque coefficients decrease, and the open-water efficiency increases [19]. All three parameters (i.e., the thrust coefficient, torque coefficient and open-water efficiency) are shown to increase with the rise of the cavitation number.
In the propeller test under the condition of ice blockage, the rotating speed of the propeller is constant. The inflow speed increases with the increase of the advance coefficient, and the pressure of the flow field increases with the increase of rotating speed and the cavitation number of rotation. When the cavitation number of rotation decreases, the pressure of the flow field decreases accordingly; the more serious the cavitation, the more it leads to lower values of the thrust coefficient, the torque coefficient and the open-water efficiency. When the advance coefficient increases, the inflow speed increases, causing the decrease of pressure in the flow field, and both the thrust and the torque of the propeller decrease.
The existence of ice blockage reduces the inflow speed and increases both the thrust and the torque of the propeller [20]. With the increase of ice-propeller spacing, the blockage effect decreases, resulting in the decrease of the thrust and torque, and the increase of open-water efficiency. When the cavitation number of rotation decreases, the pressure in the flow field also decreases, and the cavitation phenomenon on the blade surface becomes more serious. The cavitation reduces the influence of the ice blockage effect on both the thrust and the torque so that both the thrust and torque coefficients change slightly with the ice-propeller spacing.
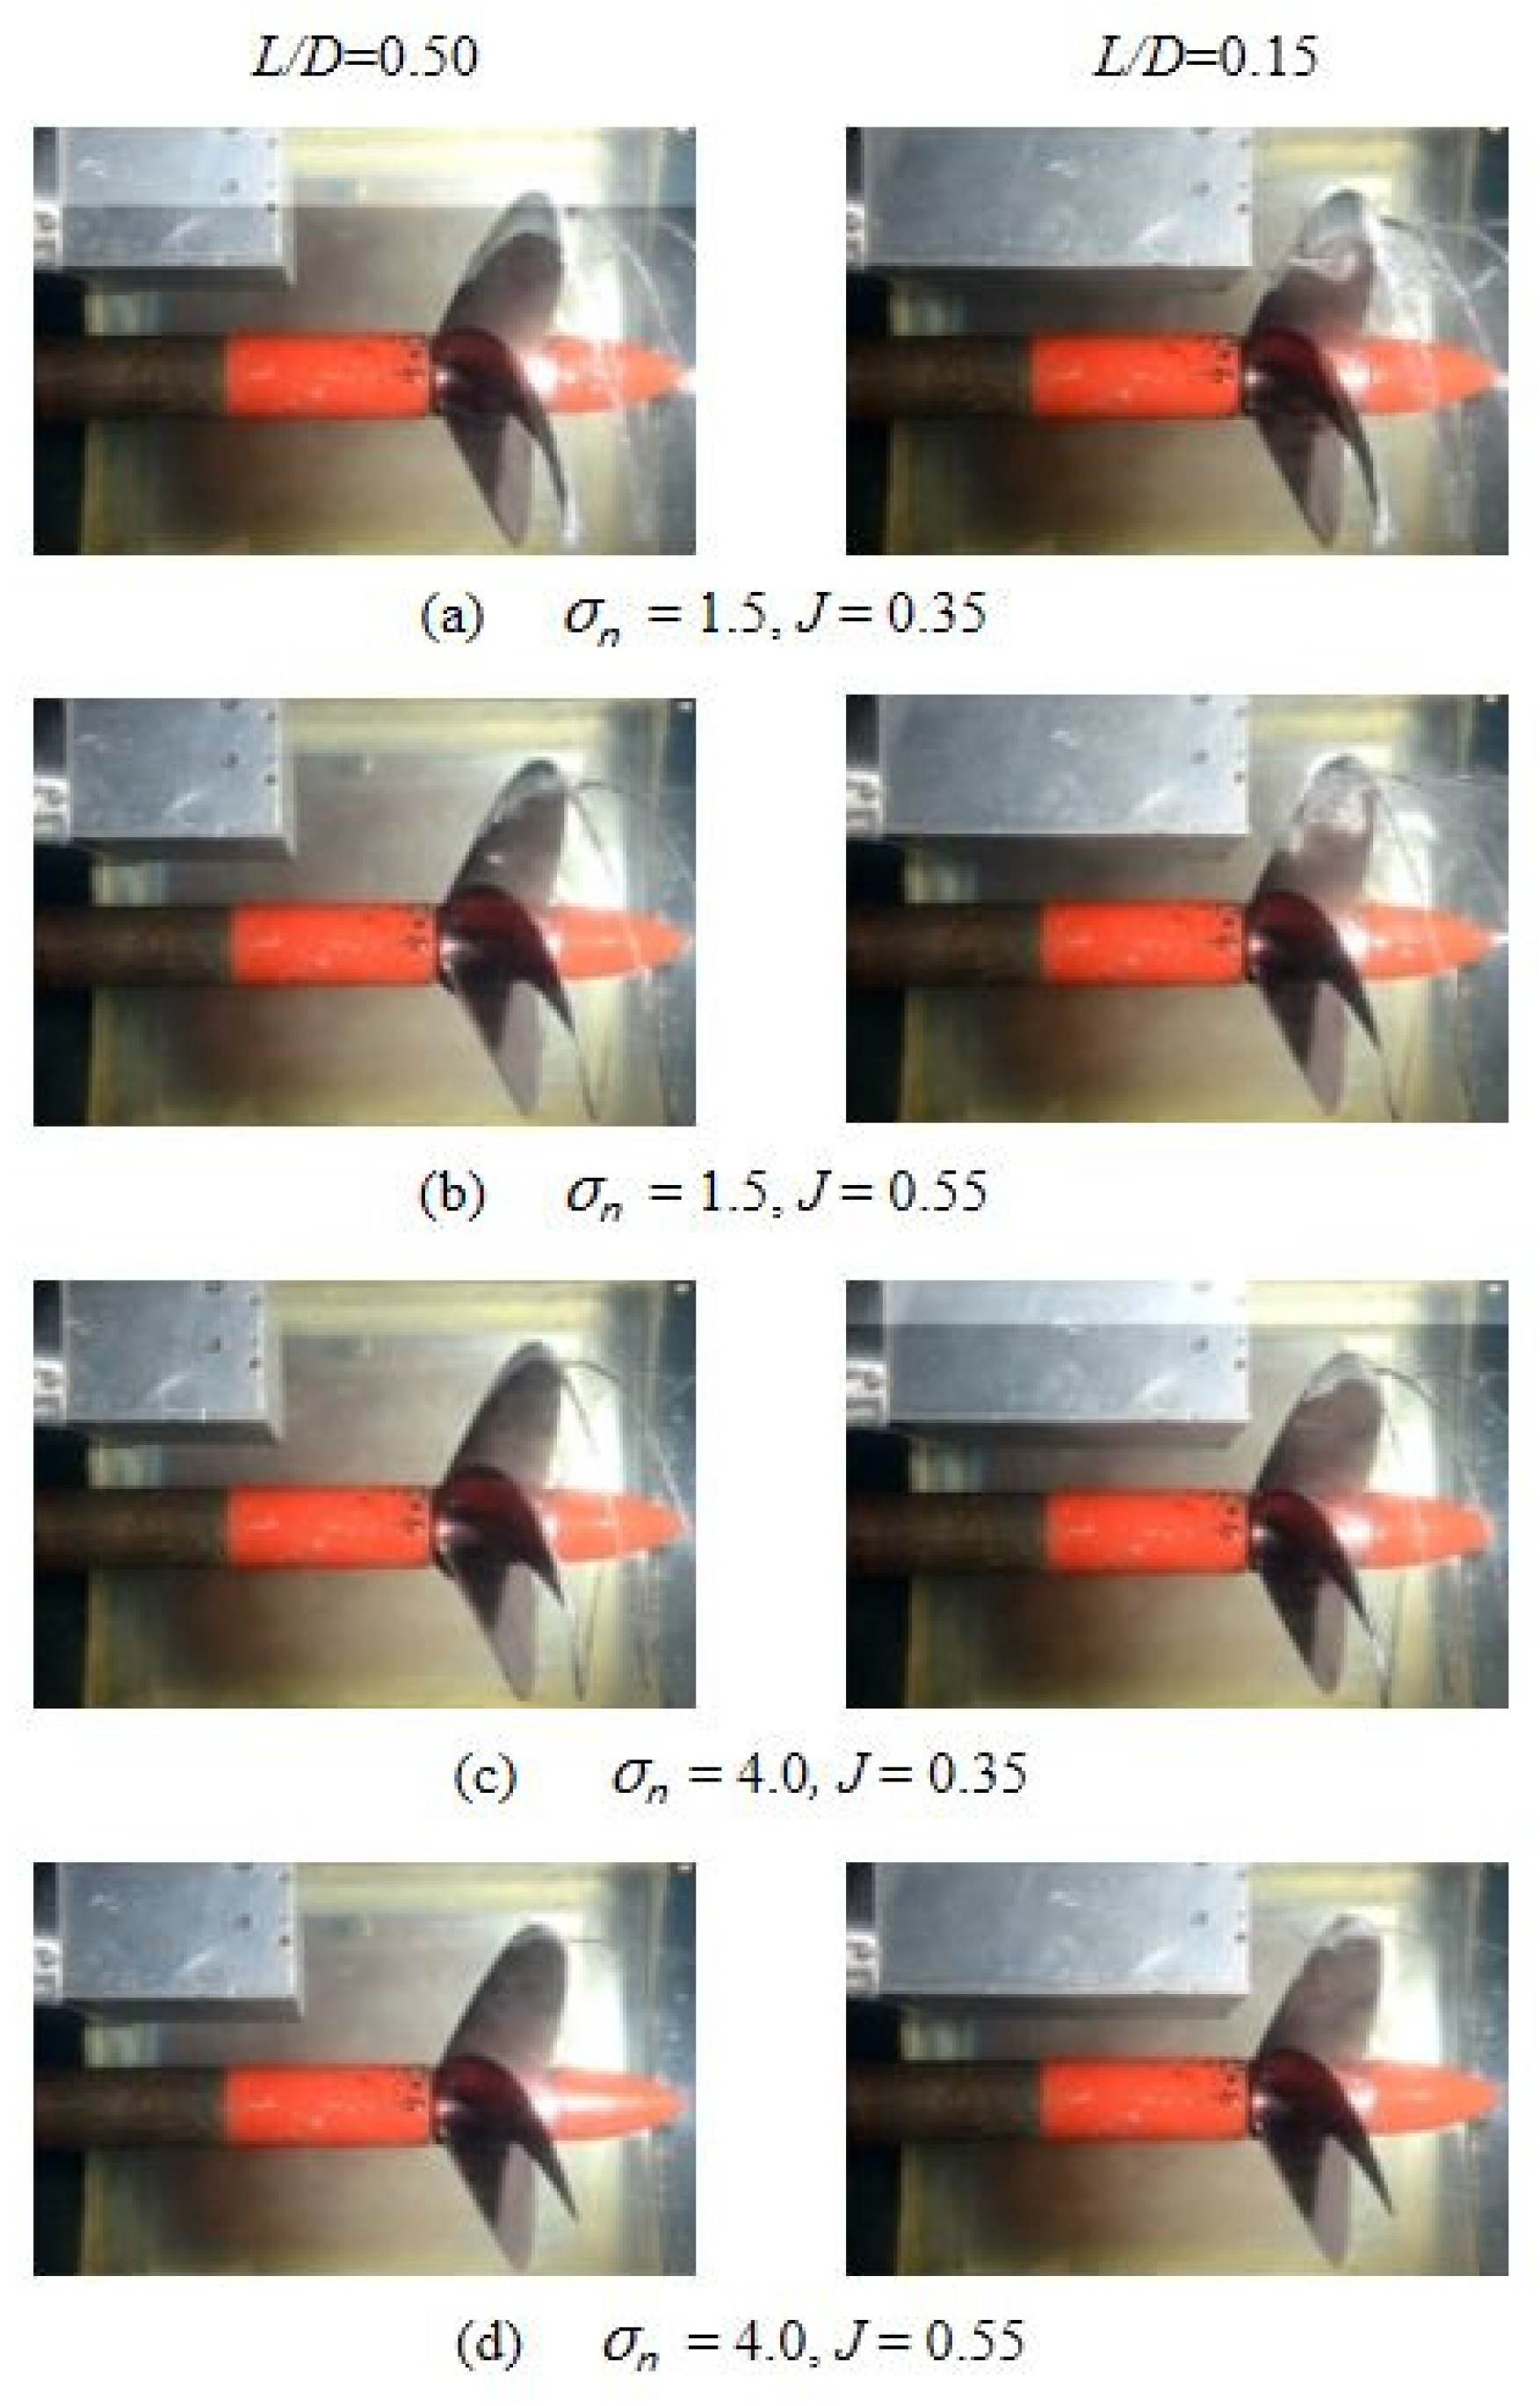
Figure 4 presents some field pictures for the propeller test in an ice blockage experiment. We find that the various degrees of the cavitation occur under different conditions and that the cavitation shape directly determines the changing trend of the hydrodynamic performance of the propeller. The cavitation phenomenon becomes more serious with the decrease of cavitation and ice-propeller spacing, and the increase of the advance coefficient [21]. In the left of Figure 4c, there is cavitation on the back of the blade, continuous tip vortex cavitation appears at the tip, and hub vortex cavitation appears in the center of the hub. With the increase of the advance coefficient, the inflow speed increases accordingly, the cavitation coverage area decreases and its shape becomes narrow and long. With the impact of the high-speed inflow, the sheet-like cavitation breaks into cloud-like cavitation, and the tip vortex cavitation increases significantly (see Figure 3c,d). Meanwhile, the hydrodynamic performance of the propeller decreases, accompanied by strong erosion and noise, and the exciting force of the propeller is obvious. With the decrease of the ice-propeller spacing, the cavitation develops more fully; both the cavitation coverage area and the tip vortex cavitation increase significantly (see Figure 3c). With the decrease of the cavitation number of rotation, the pressure of the flow field decreases, and the cavitation phenomenon becomes serious (see Figure 3a,c). For the same ice-propeller spacing and advance coefficient, the cavitation phenomenon at a lower cavitation number becomes more obvious, and both the number and the coverage area of the cavitation increase sharply.
4. Numerical Simulation Calculation
The CFD method based on RANS was also adopted to investigate the hydrodynamic performance of the propeller in uniform flow and ice blockage environments. The open-water performance, pressure distribution, cavitation characteristics and the vortex strength of the propeller were further discussed in typical conditions.
4.1. Numerical Model Configuration
4.1.1. Governing Equations
The governing equations of the cavitation flow are the continuity equation and the momentum equation, which are given as:
where U, ρ and μ respectively denote the velocity, the density and the viscosity coefficient of the vapor-liquid two-phase flow.
where the subscript v and l represent the gas phase and liquid phase respectively, and the subscript m represents the mixed medium; αl is the volume fraction of liquid phase.
4.1.2. Turbulence Model
μt within Equation (9) is the eddy viscosity coefficient caused by turbulence. In this work, the SST k-ω turbulence model was utilized to close the governing equations. The relationship between the eddy viscosity and the turbulent energy dissipation rate is expressed as:
The transport equations of turbulent kinetic energy k and the turbulent dissipation rate ω are formulated as:
where Uj is the average velocity component in the direction of the coordinate axis xj, τij is the Reynolds stress tensor, and β, β*, σ and σ* are four turbulence model constants.
4.1.3. Cavitation Model
The volume of fluid (VOF) method based on the Eulerian grids was used to trace the interface between the vapor and the liquid via the transport equation of the volume fraction γ, which is expressed as:
For γ = 1 refers to the liquid phase, 0 < γ < 1 refers to the vapor–liquid interface, and γ = 0 refers to the vapor phase. is the mass transport rate, and ρ1 is the density of water.
The Schnerr–Sauer model [22] is used to simulate the cavitation, and the mass transport rate of the phase transition process is expressed as:
where sign is the sign function, n0 is the density of vapor nuclei per unit volume and R is the radius of the vapor nuclei.
4.2. Numerical Scheme
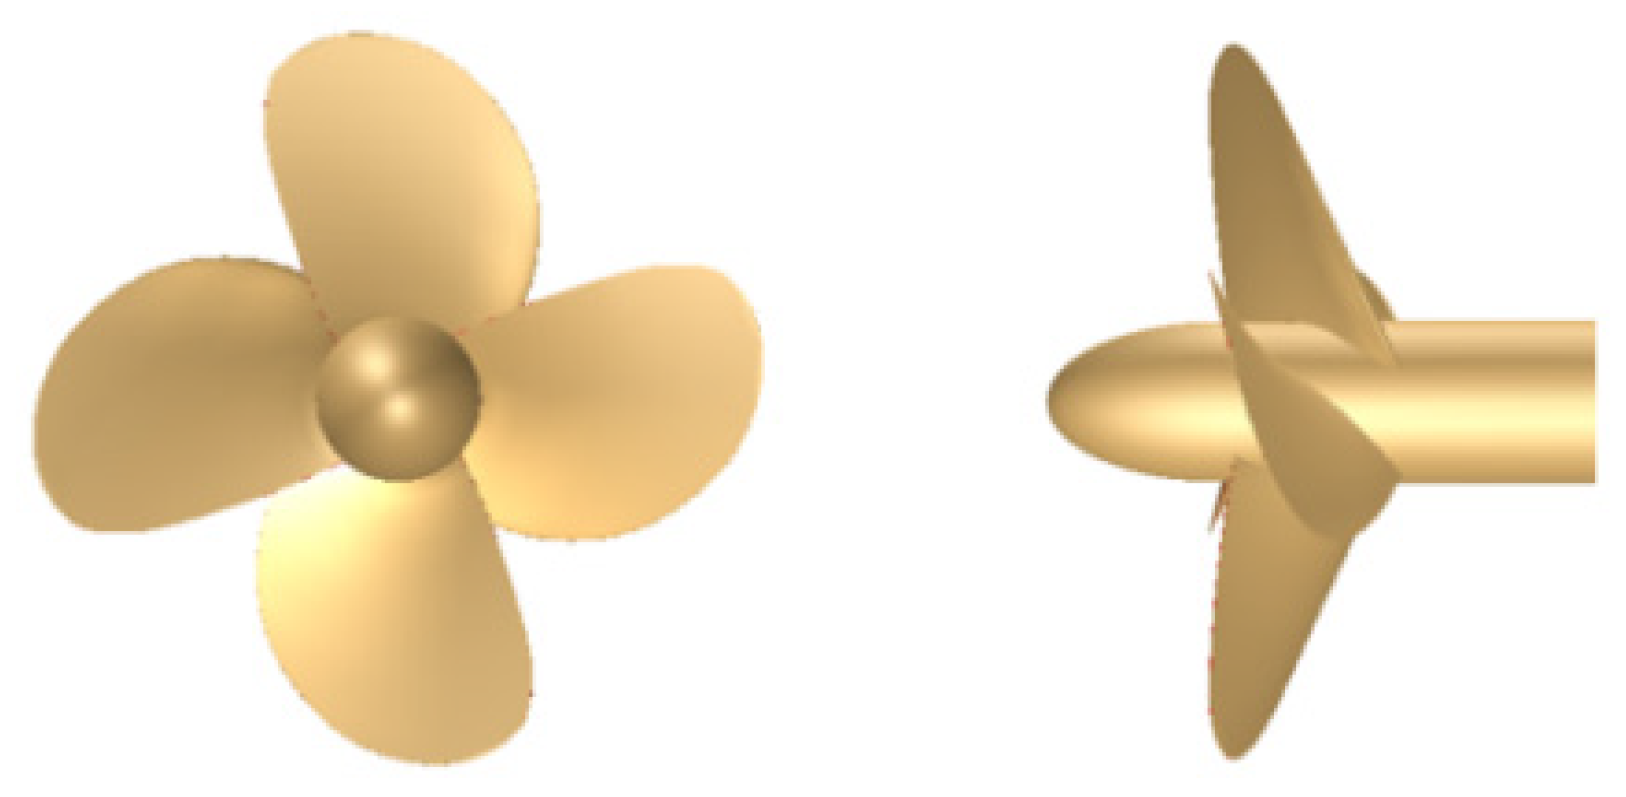
Consistent with the parameters used in the model test for the uniform flow and ice blockage field, the same scale calculation model was established. Figure 5 presents the geometric model of the propeller calculation. The size of the ice blockage and its relative position with the propeller are shown in Figure 6.
To accurately simulate the hydrodynamic performance of the propeller in the cavitation tunnel, the calculation domain was divided into the stationary domain in the far field and the rotation domain in the near field, as shown in Figure 7. The multi-reference frame (MRF) method was used to simulate the motion of the propeller.
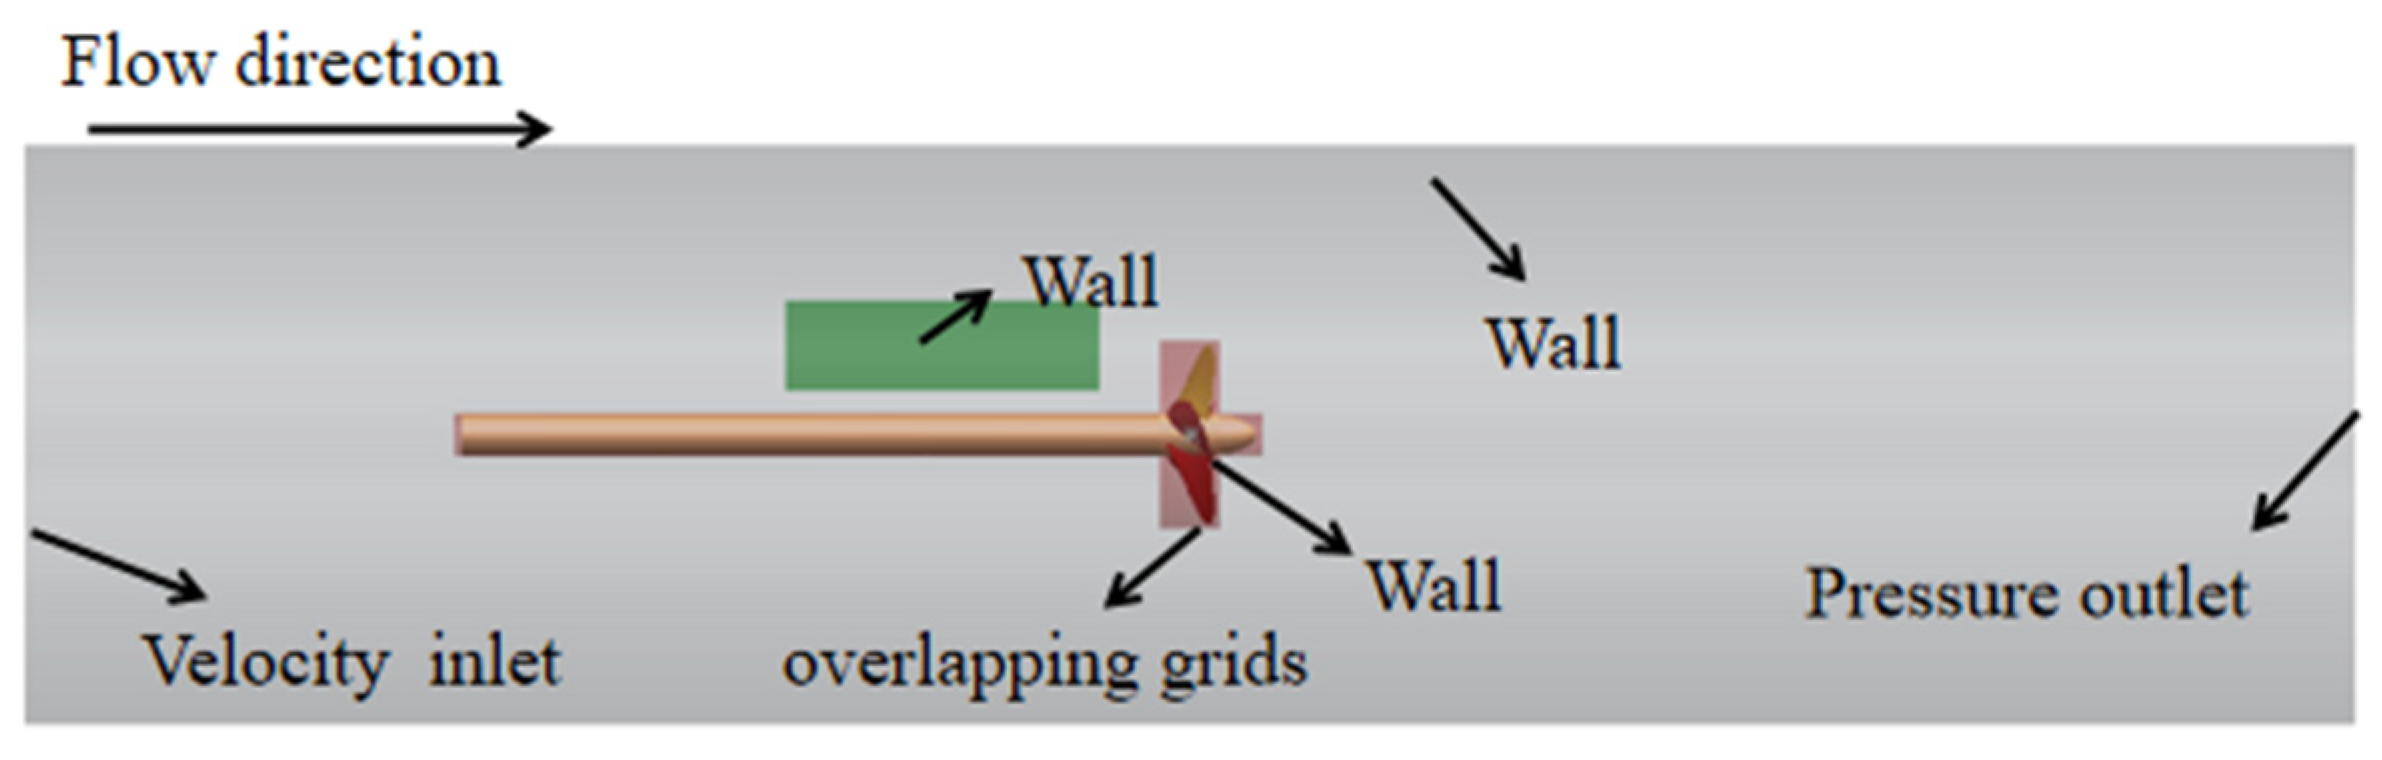
Figure 8 illustrates the schematic diagram of boundary conditions. A fixed velocity was used as the boundary of flow inlet, the outlet boundary of fluid used the pressure control, and the side boundary utilized the wall to simulate the real wall of the cavitation tunnel. The boundary conditions of the ice blockage and the propeller were set to the wall as well. The interface between the rotation domain and the stationary domain adopted the overlapping grids, and the data transmission was realized by linear interpolation.
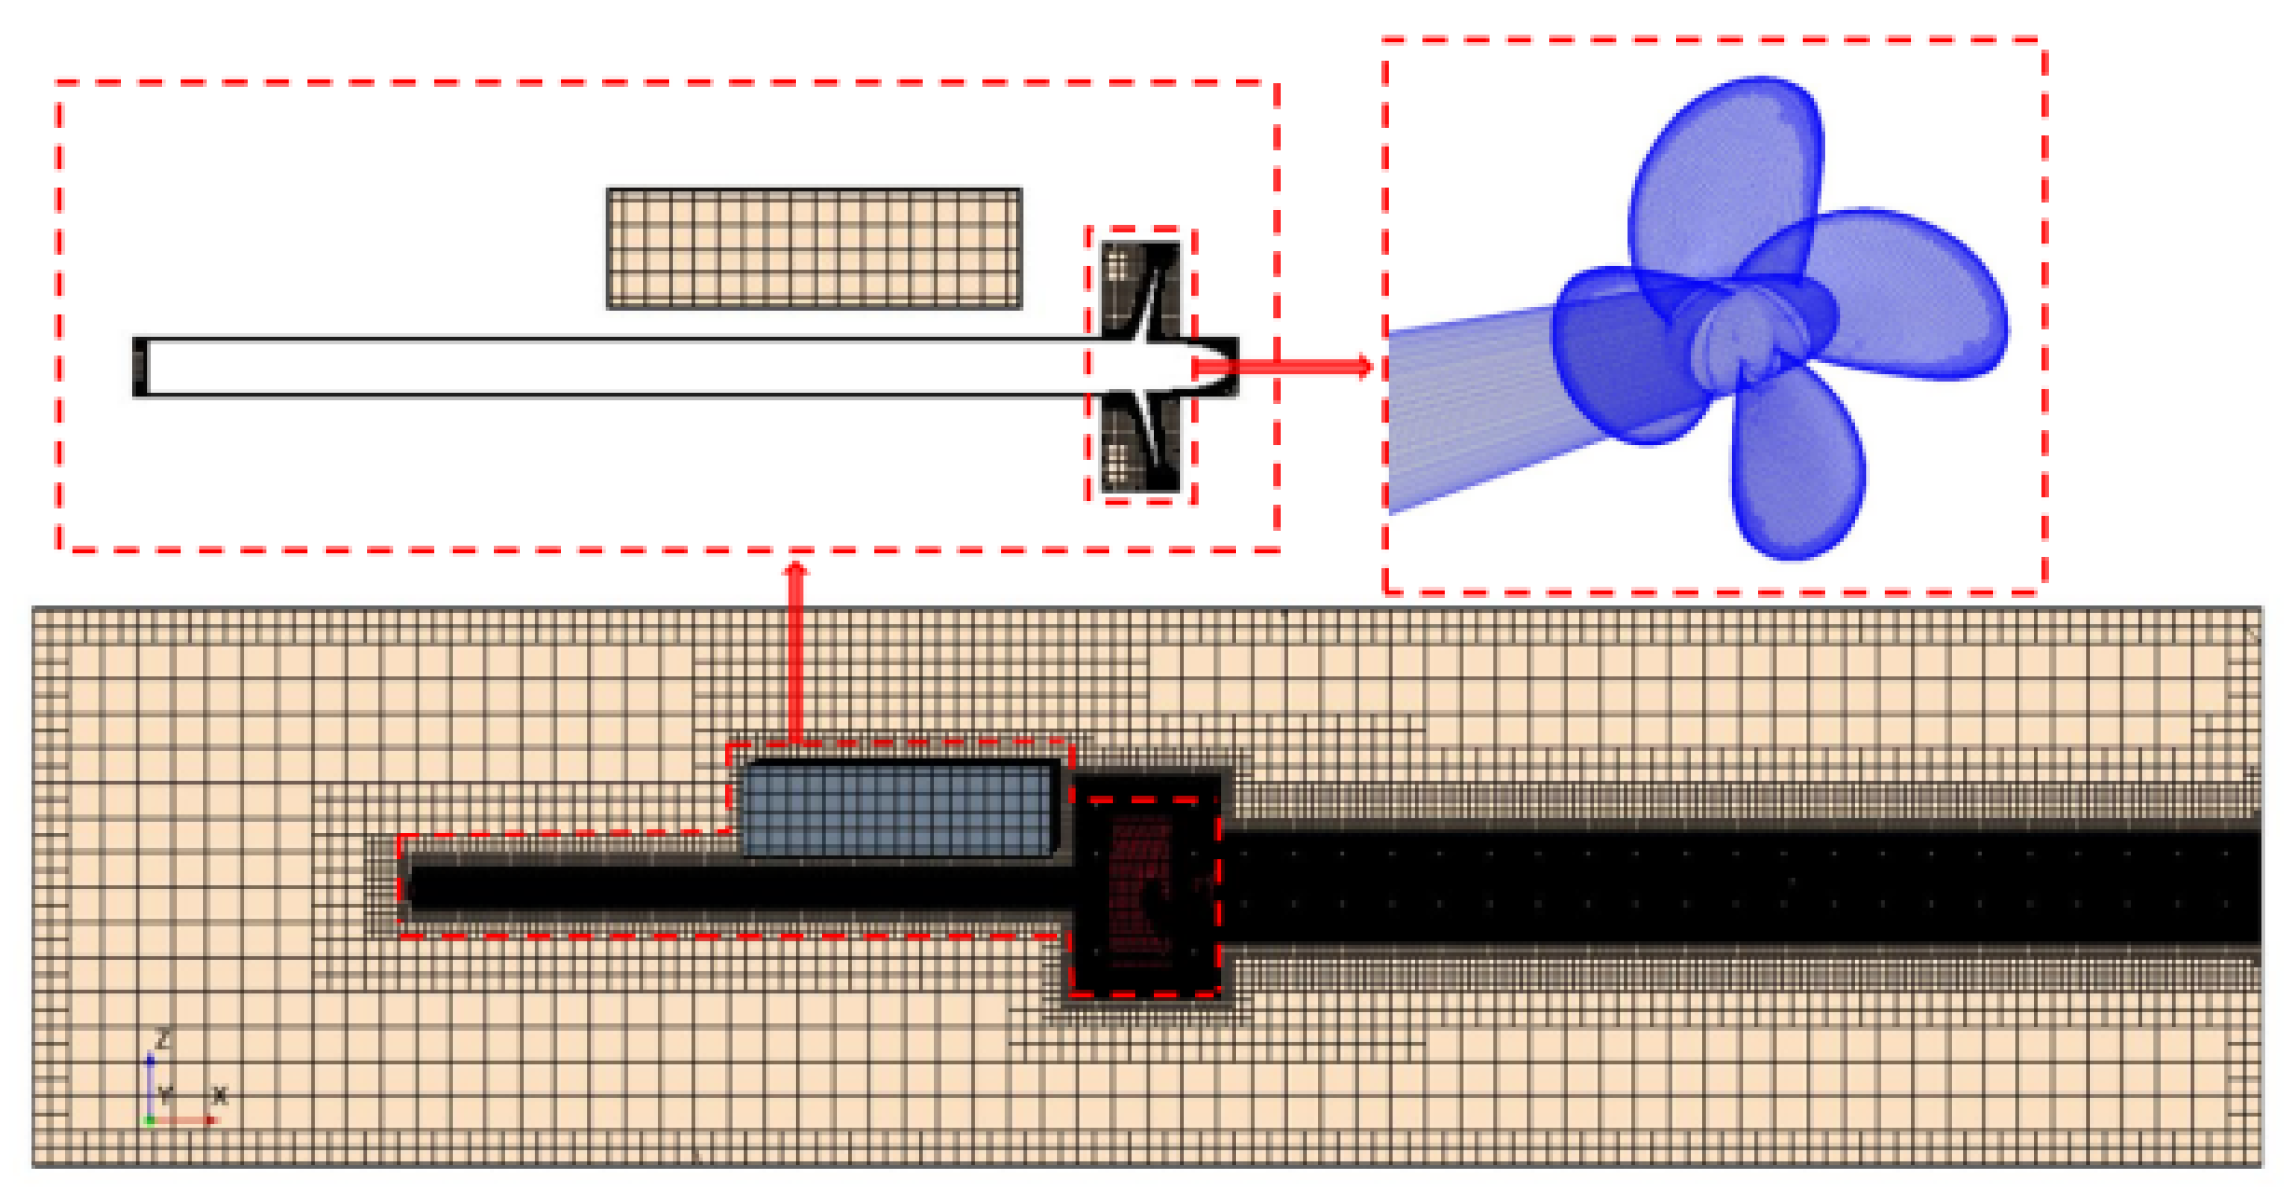
The trimmer volume grids generator was used to discretize the calculation domain. To ensure the calculation accuracy, the area around the propeller was refined. The sliding grids and overlapping grids were compared in this work. The total number of grids is 3.2 million, as shown in Figure 9.
The numerical simulations include the following parts. Firstly, the steady hydrodynamic calculation for the propeller was performed to obtain the approximately stable flow field. Secondly, the unsteady hydrodynamic force of the propeller was calculated, and a relatively stable flow field was obtained. Finally, the cavitation model was introduced to calculate the hydrodynamic performance in unsteady cavitation.
5. Simulation Results and Analyses
5.1. Open-Water Performance
To simulate the hydrodynamic performance of the propeller in the cavitation tunnel accurately, the mean thrust and torque in the uniform flow and the ice blockage environments were simulated, and the error from the experimental results was investigated in this subsection.
5.1.1. Uniform Flow Environment
Table 4 presents the numerical results based on the sliding grids and the overlapping grids, and their percentage errors with the experimental data in the uniform flow environment.
From Table 4, the numerical simulation results are in good agreement with the experimental data in the uniform flow. The deviation between the results of overlapping grids and the experimental data is small, and the errors are less than 3%. The results of overlapping grids are better than the sliding grids. The errors between the simulation results and the experimental results decrease with the decrease of advance coefficient, indicating that the numerical simulations based on overlapping grids can reproduce the experiments well at lower cavitation numbers and lower advance coefficients.
5.1.2. Ice Blockage Environment
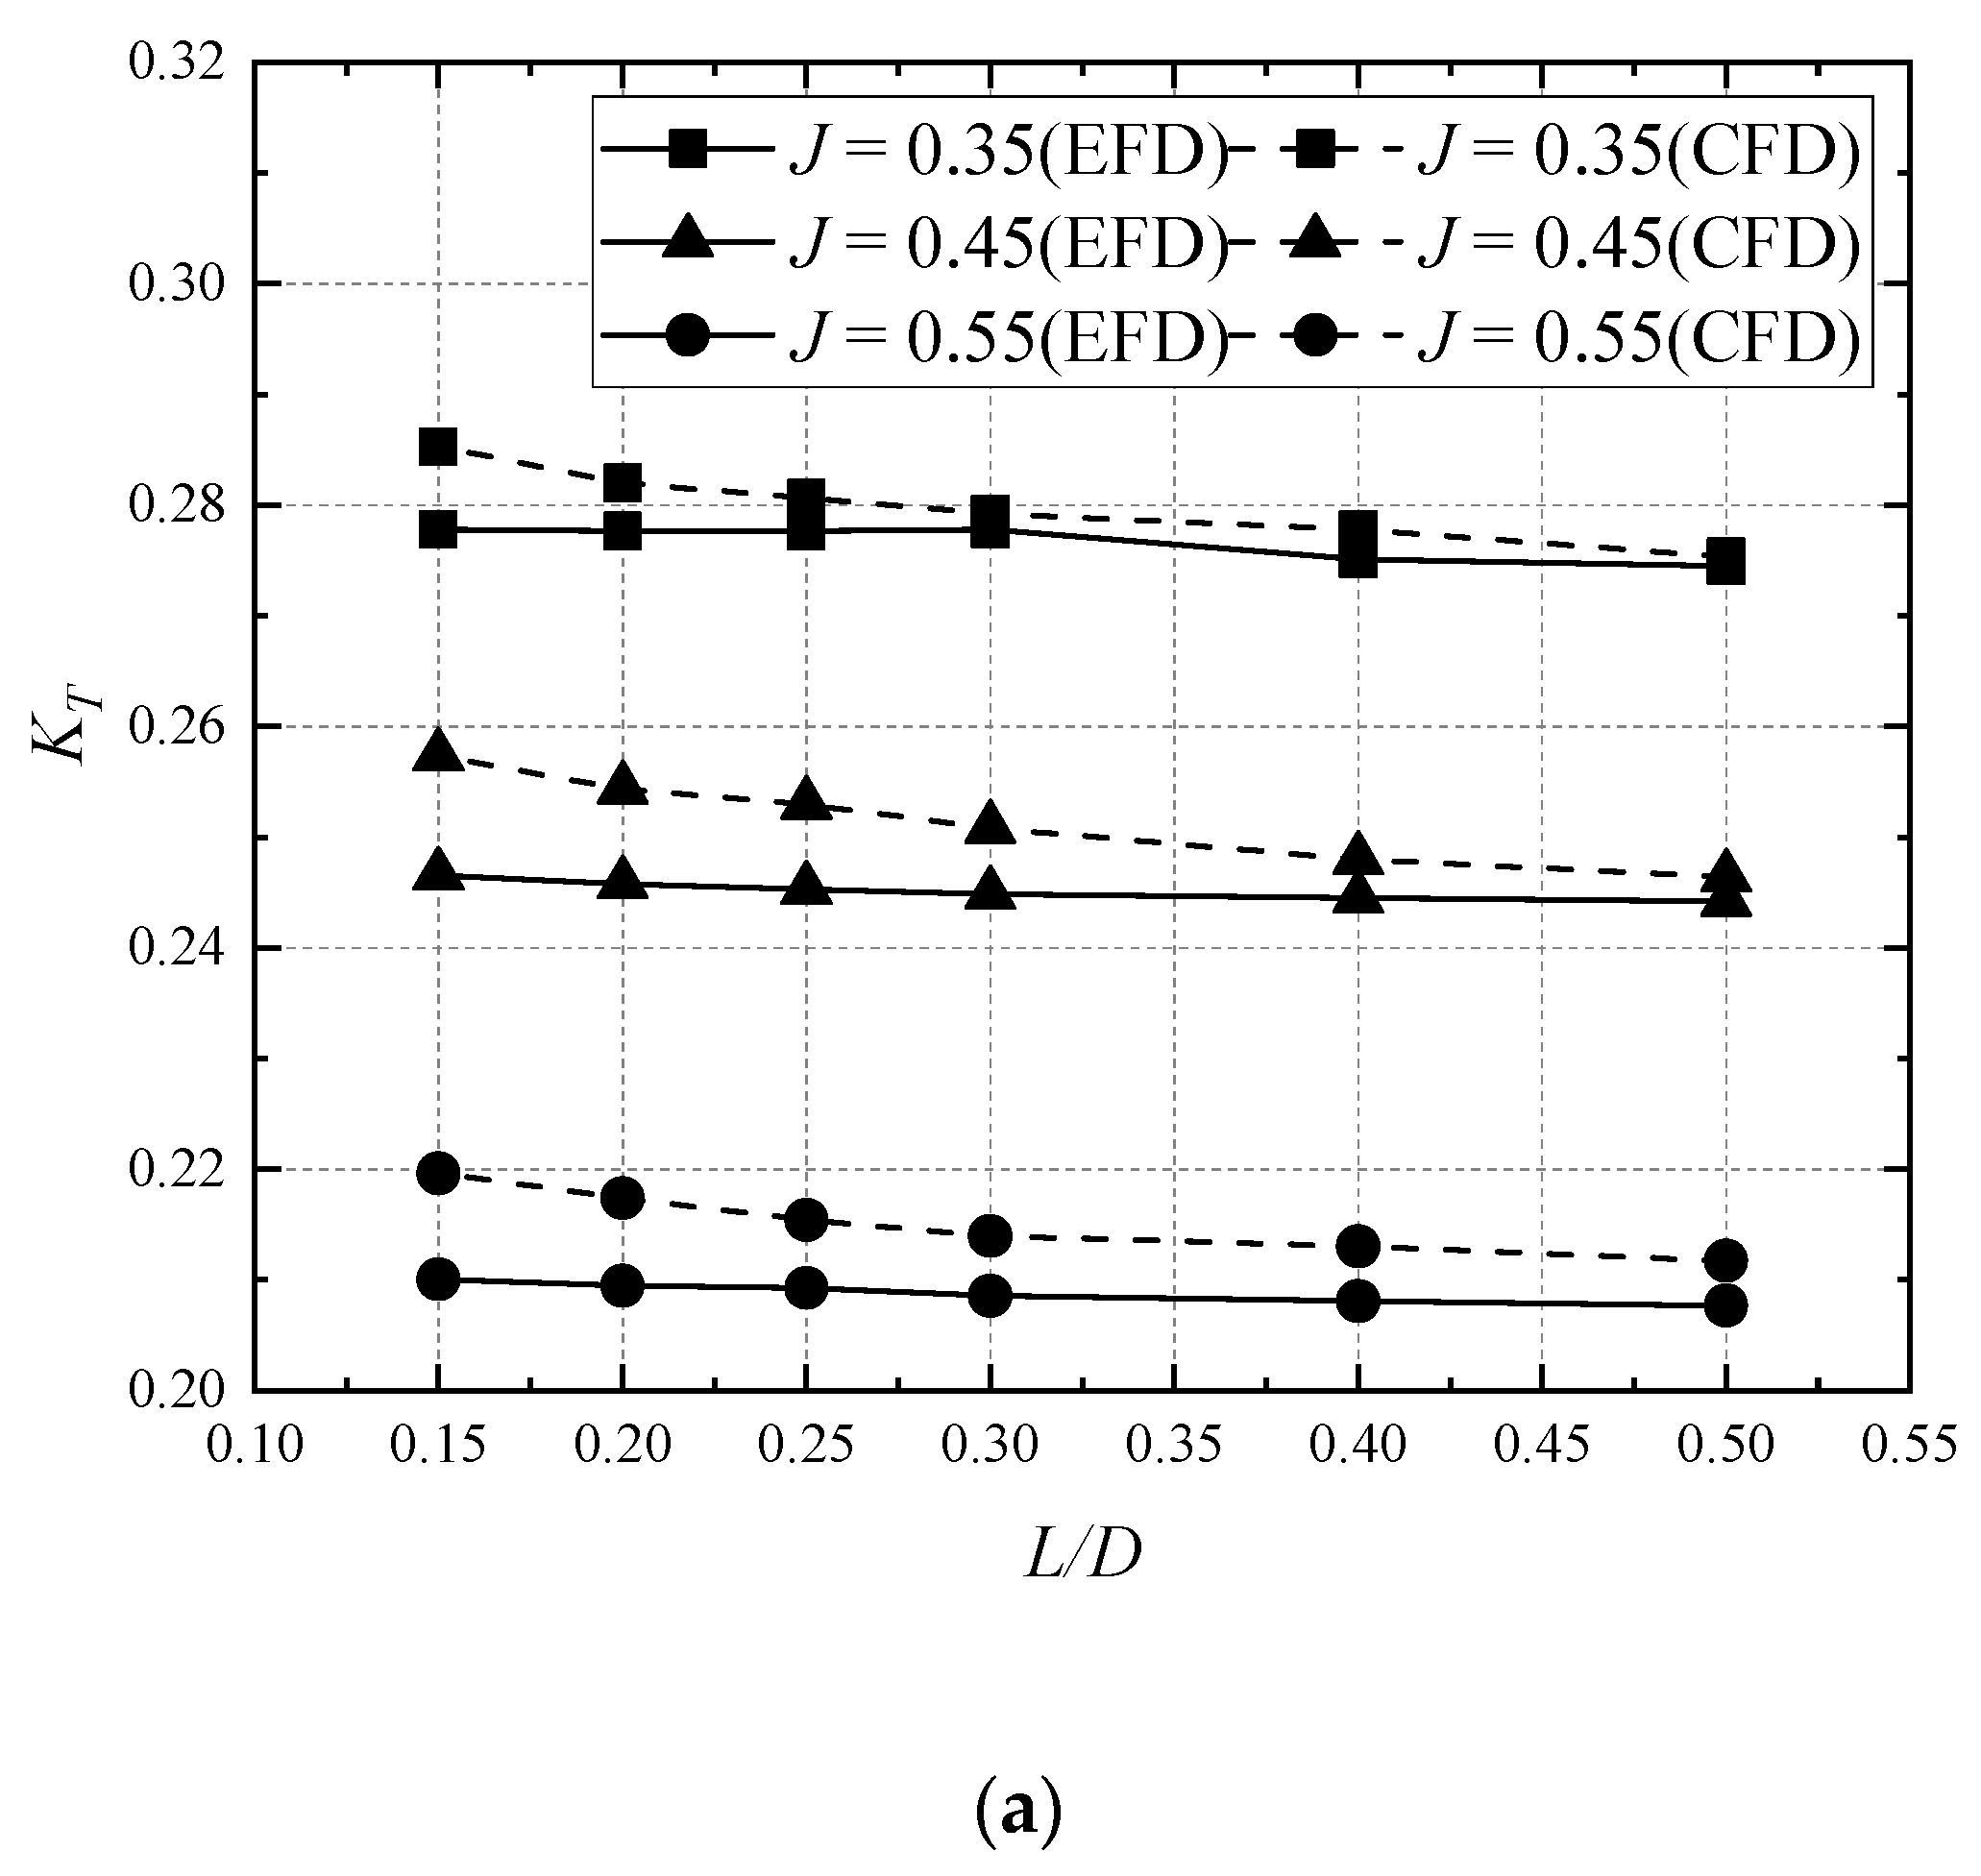
With the experimental results in the ice blockage simulation, both the cavitation number of rotation and advance coefficient have great influences on the open-water performance of the propeller. This subsection further discusses the hydrodynamic performance of the propeller in the ice blockage environment when σn = 1.5. Figure 10 shows the comparison between the simulation results and the experimental data for the mean thrust and torque coefficient when σn = 1.5, and J = 0.35, 0.45 and 0.55.
As shown in Figure 10, the numerical results for the mean hydrodynamic variation of the propeller are almost identical to the results obtained by experiment. The errors between the simulation results and the experimental data for the thrust coefficient and the torque coefficient are less than 5%.
5.2. Cavitation Excitation Force
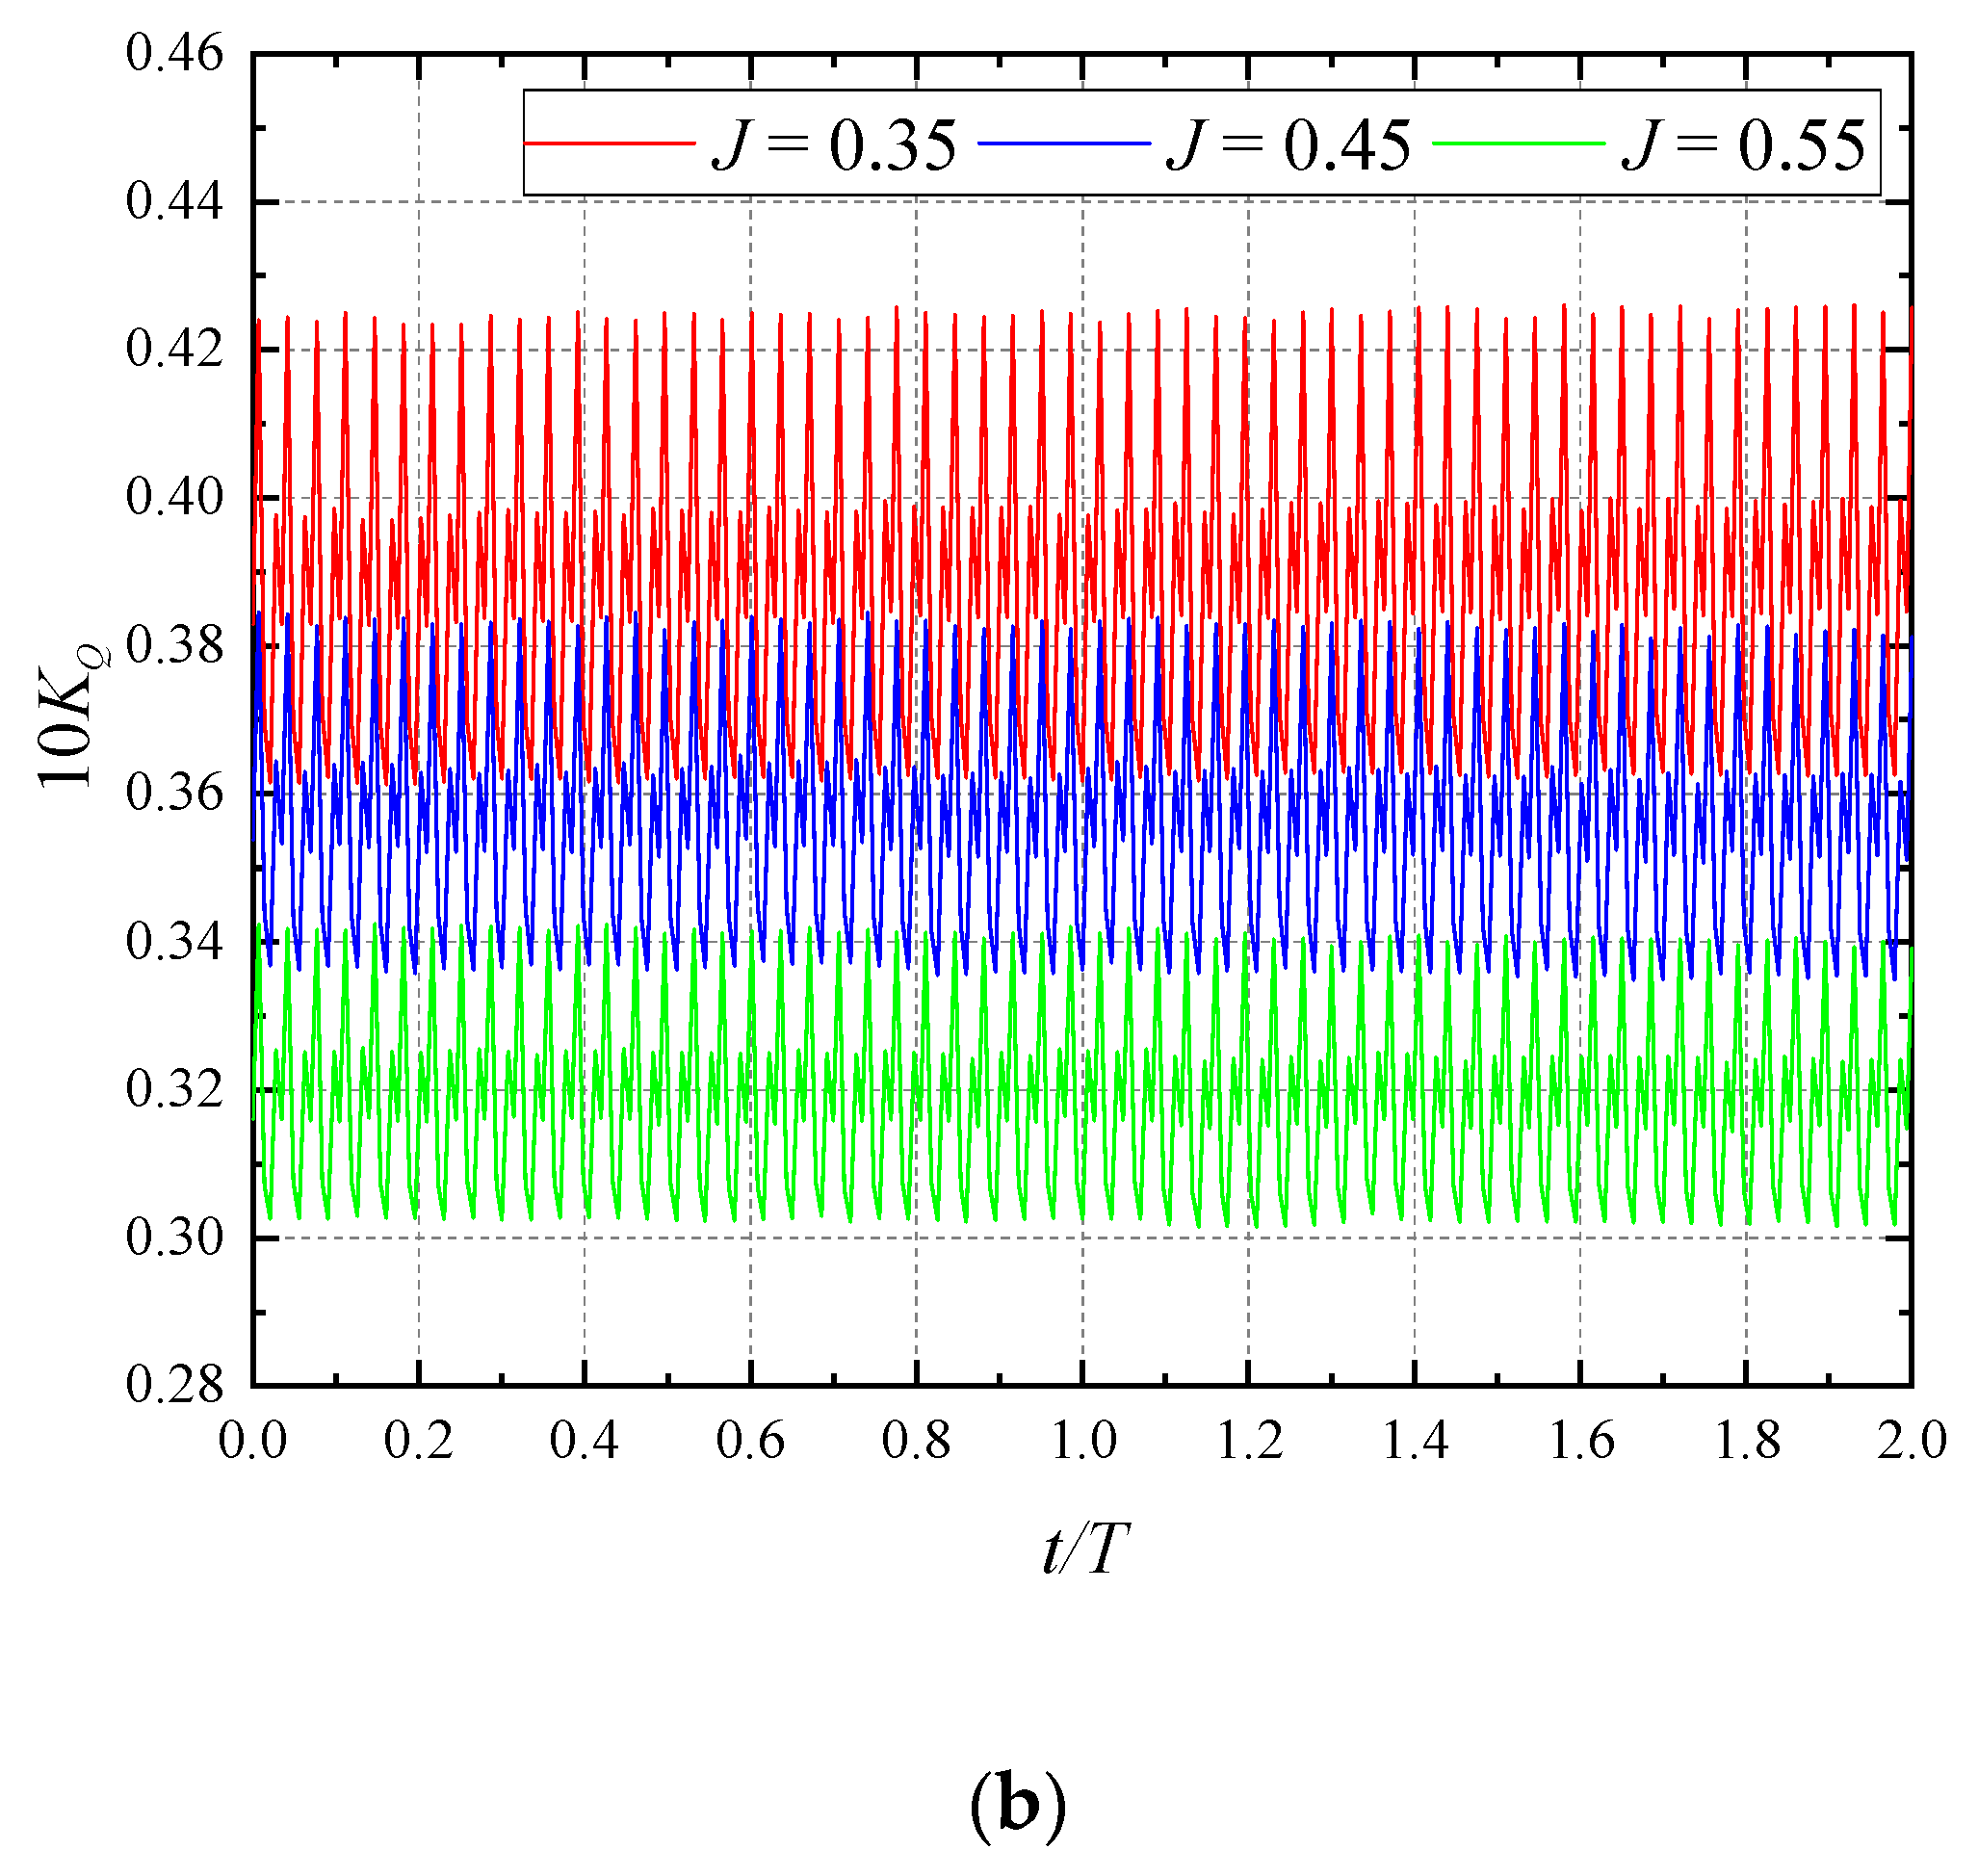
In the process of experiments and numerical simulations, it was found that with the decrease of the ice-propeller spacing, both the blockage effect and the oscillation of thrust and torque become more obvious. When σn = 1.5, L/D = 0.15, the hydrodynamic performance of the propeller is the worst. In this subsection, the oscillation law of thrust coefficient and torque coefficient with the excitation force of cavitation are studied when J = 0.35, 0.45 and 0.55.
As shown in Figure 11, when σn = 1.5 and L/D = 0.15, both the thrust coefficient and the torque coefficient oscillate violently within two cycles of propeller rotation, with 57 cycles at J = 0.35, 57 cycles at =0.45 and 59 cycles at J = 0.55. Both the mean values and the oscillation amplitudes for both coefficients decrease with the increase of the advance coefficient. When J = 0.35, the thrust coefficient oscillates in the range of 0.266~0.308, and the torque coefficient oscillates in the range of 0.036~0.043. With the increase of the advance coefficient, both the thrust coefficient and the torque coefficient decrease, and their amplitudes also decrease.
The interference among the four blades during the rotation of the propeller, the oscillation frequency of the propeller is much higher than that of the single blade. Due to the stability of the flow field, the hydrodynamic performance of the propeller in different oscillation periods is relatively stable. With the increase of the advance coefficient, the inlet velocity increases, and the pressure, the thrust coefficient and the torque coefficient decrease. With the flow velocity increasing, the cavitation tends to be dispersed by the inflow when it adheres to the blade, and the influence of cavitation on the hydrodynamic performance is reduced, but the oscillation frequency of the propeller increases.
5.3. Pressure Distribution
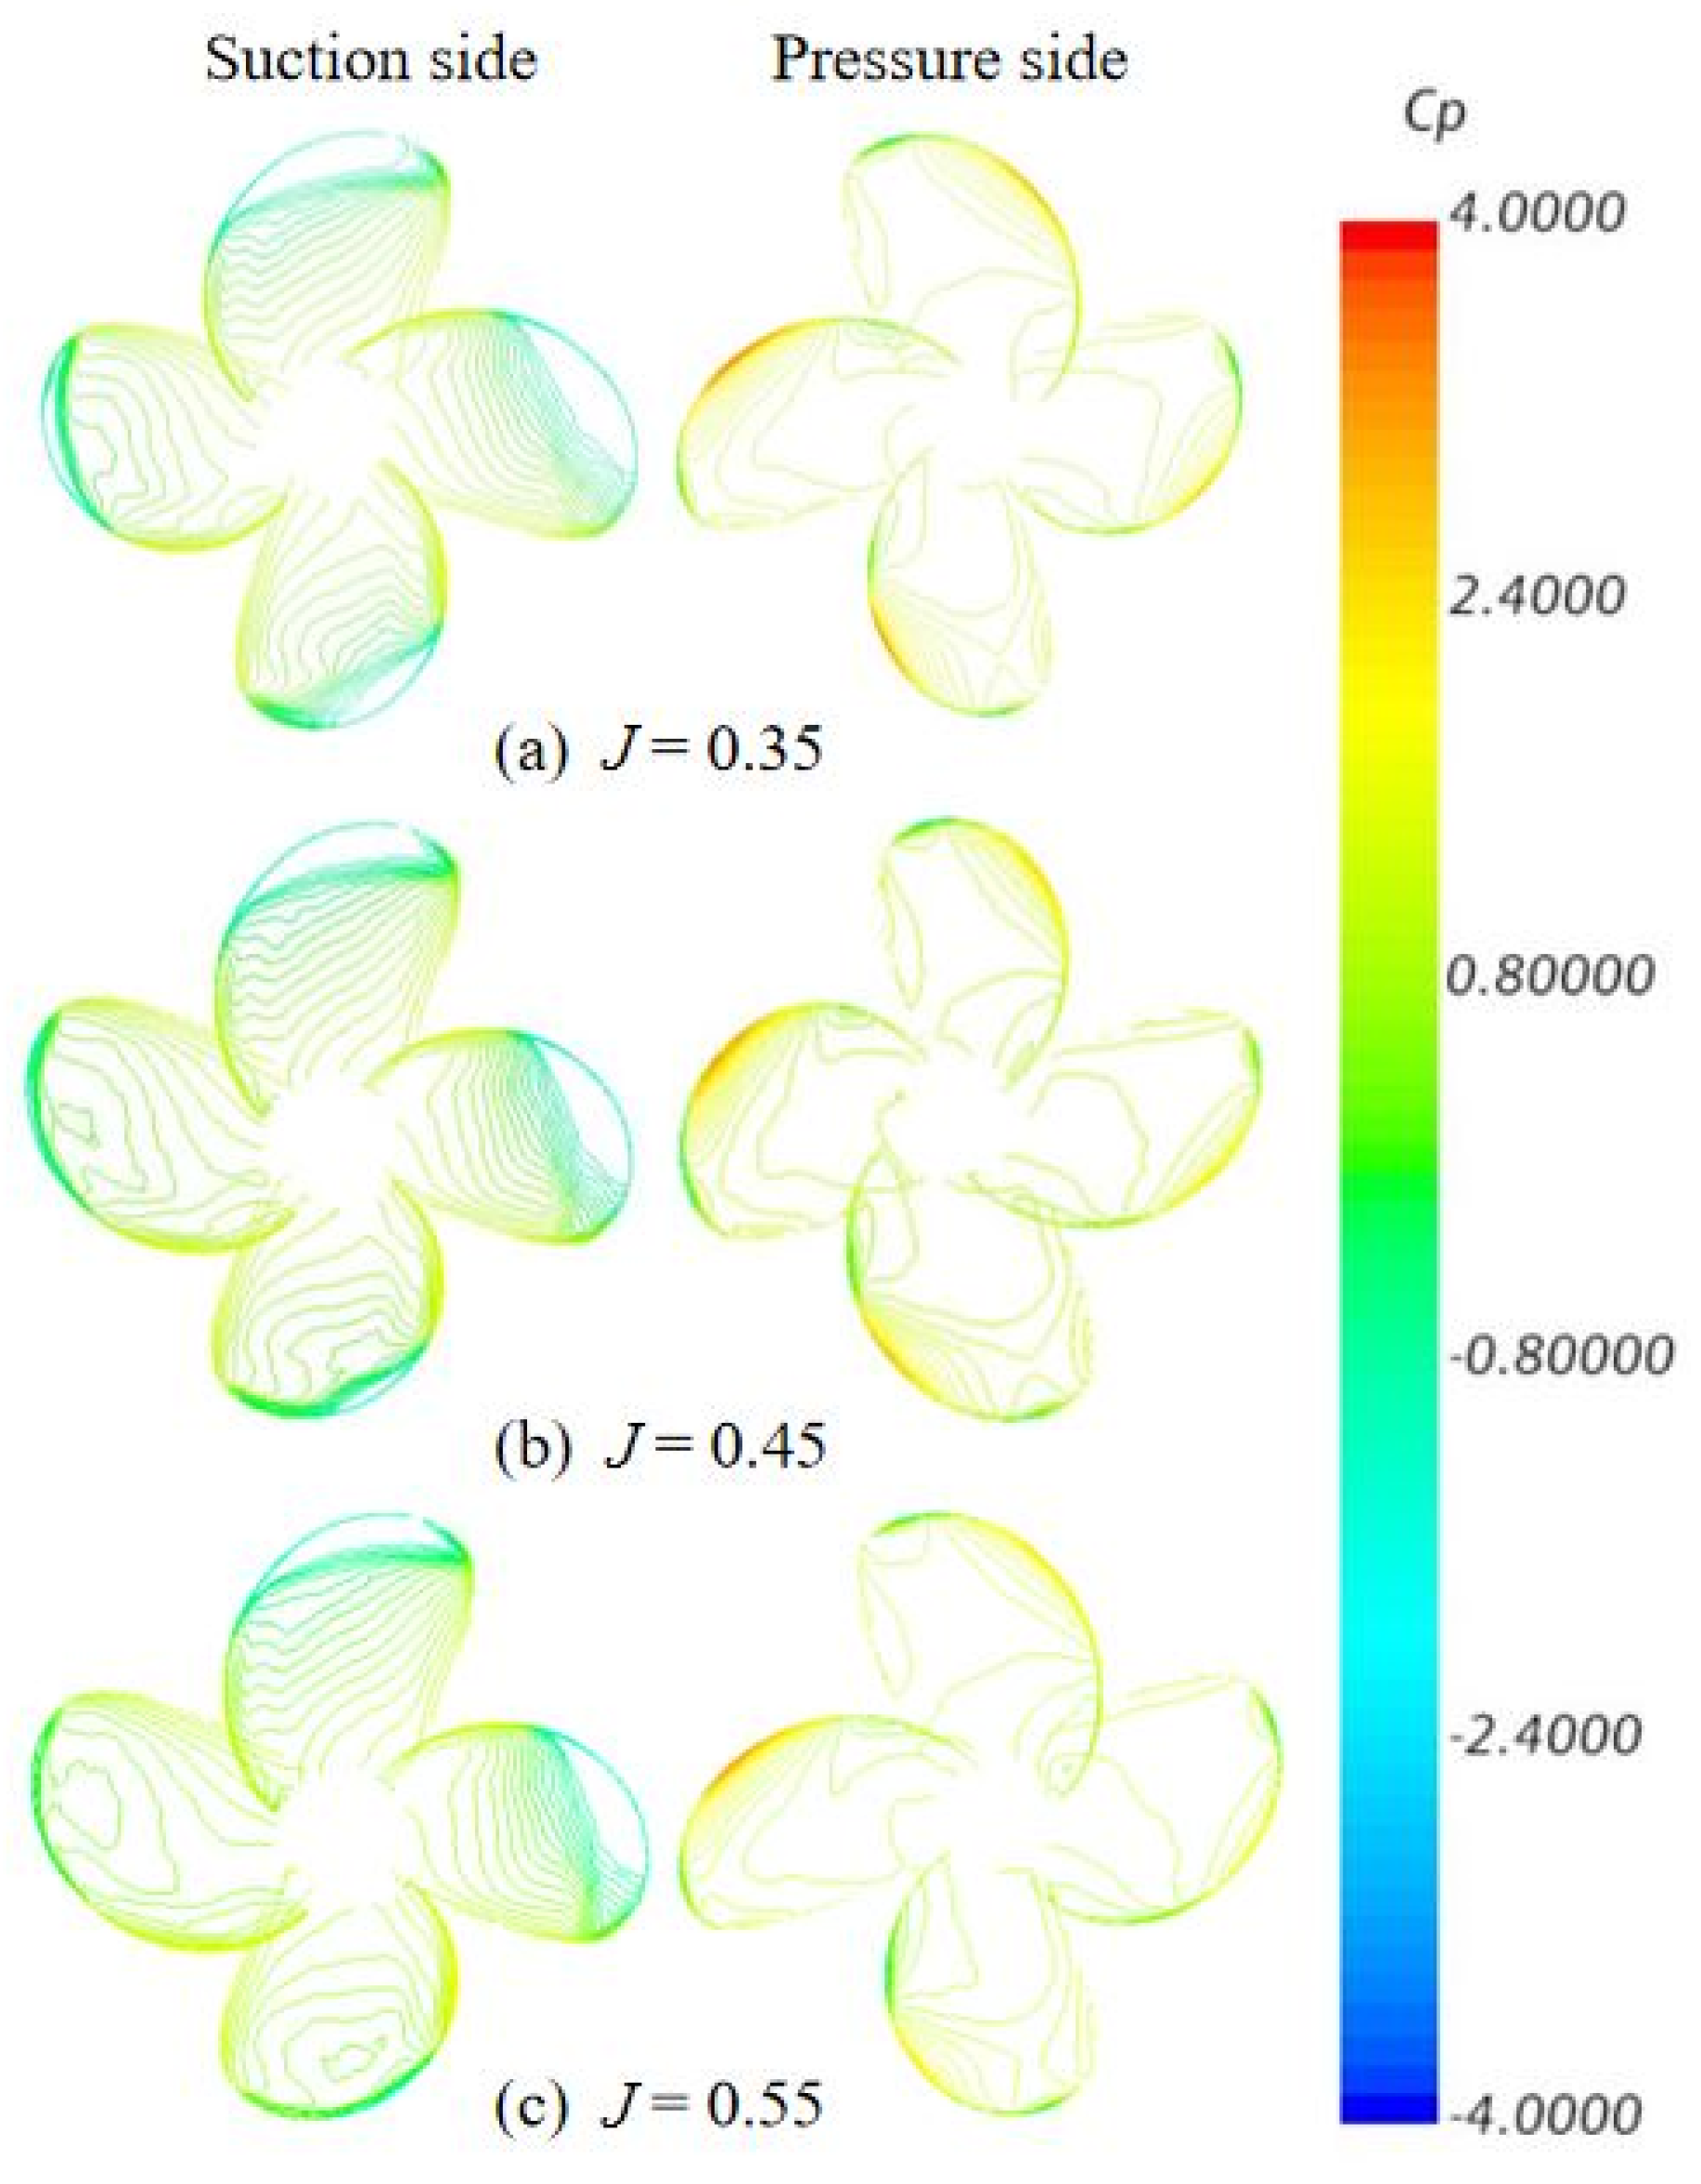
To further reveal the hydrodynamic performance of the propeller, the pressure distribution of the propeller blade at σn = 1.5, L/D = 1.5, and J = 0.35, 0.45 and 0.55 is studied, as shown in Figure 12, and the pressure coefficient CP is defined as follows:
where P is the pressure of the propeller, P0 is the pressure of domain.
As shown in Figure 12, the pressure on the blade surface changes slightly with the increase of the advance coefficient. The pressure coefficient on the leading edge of the blade surface (roughly between 0.6 R and 1.0 R) is the largest, and the pressure coefficient is about 3.5, while the pressure coefficient at the blade tip is negative. The pressure on the suction surface is the lowest on the leading edge of the surface, and the pressure coefficient over most of the area is about—2.0, which easily generates cavitation. With the increase of advance coefficient, the cavitation is difficult to adhere to the blade surface, and the low-pressure area decreases.
5.4. Cavitation Characteristics
To further explore the hydrodynamic performance of the propeller, the cavitation shape and thickness are studied when σn = 1.5, L/D = 1.5, and J = 0.35, 0.45 and 0.55, as shown in Figure 13.
Figure 13 shows that the cavitation shape on the surface of the key blade is consistent with that obtained by the physical experiments. The cavitation coverage area is the same as its low-pressure area, and the cavitation occurs about between 0.6 R and 1.0 R. With the increase of the advance coefficient, the shape of the cavitation region becomes narrow and long, and the coverage area also decreases, and the cavitation leaks into the wake soon. The most serious cavitation effect occurs at around 0.90 R.
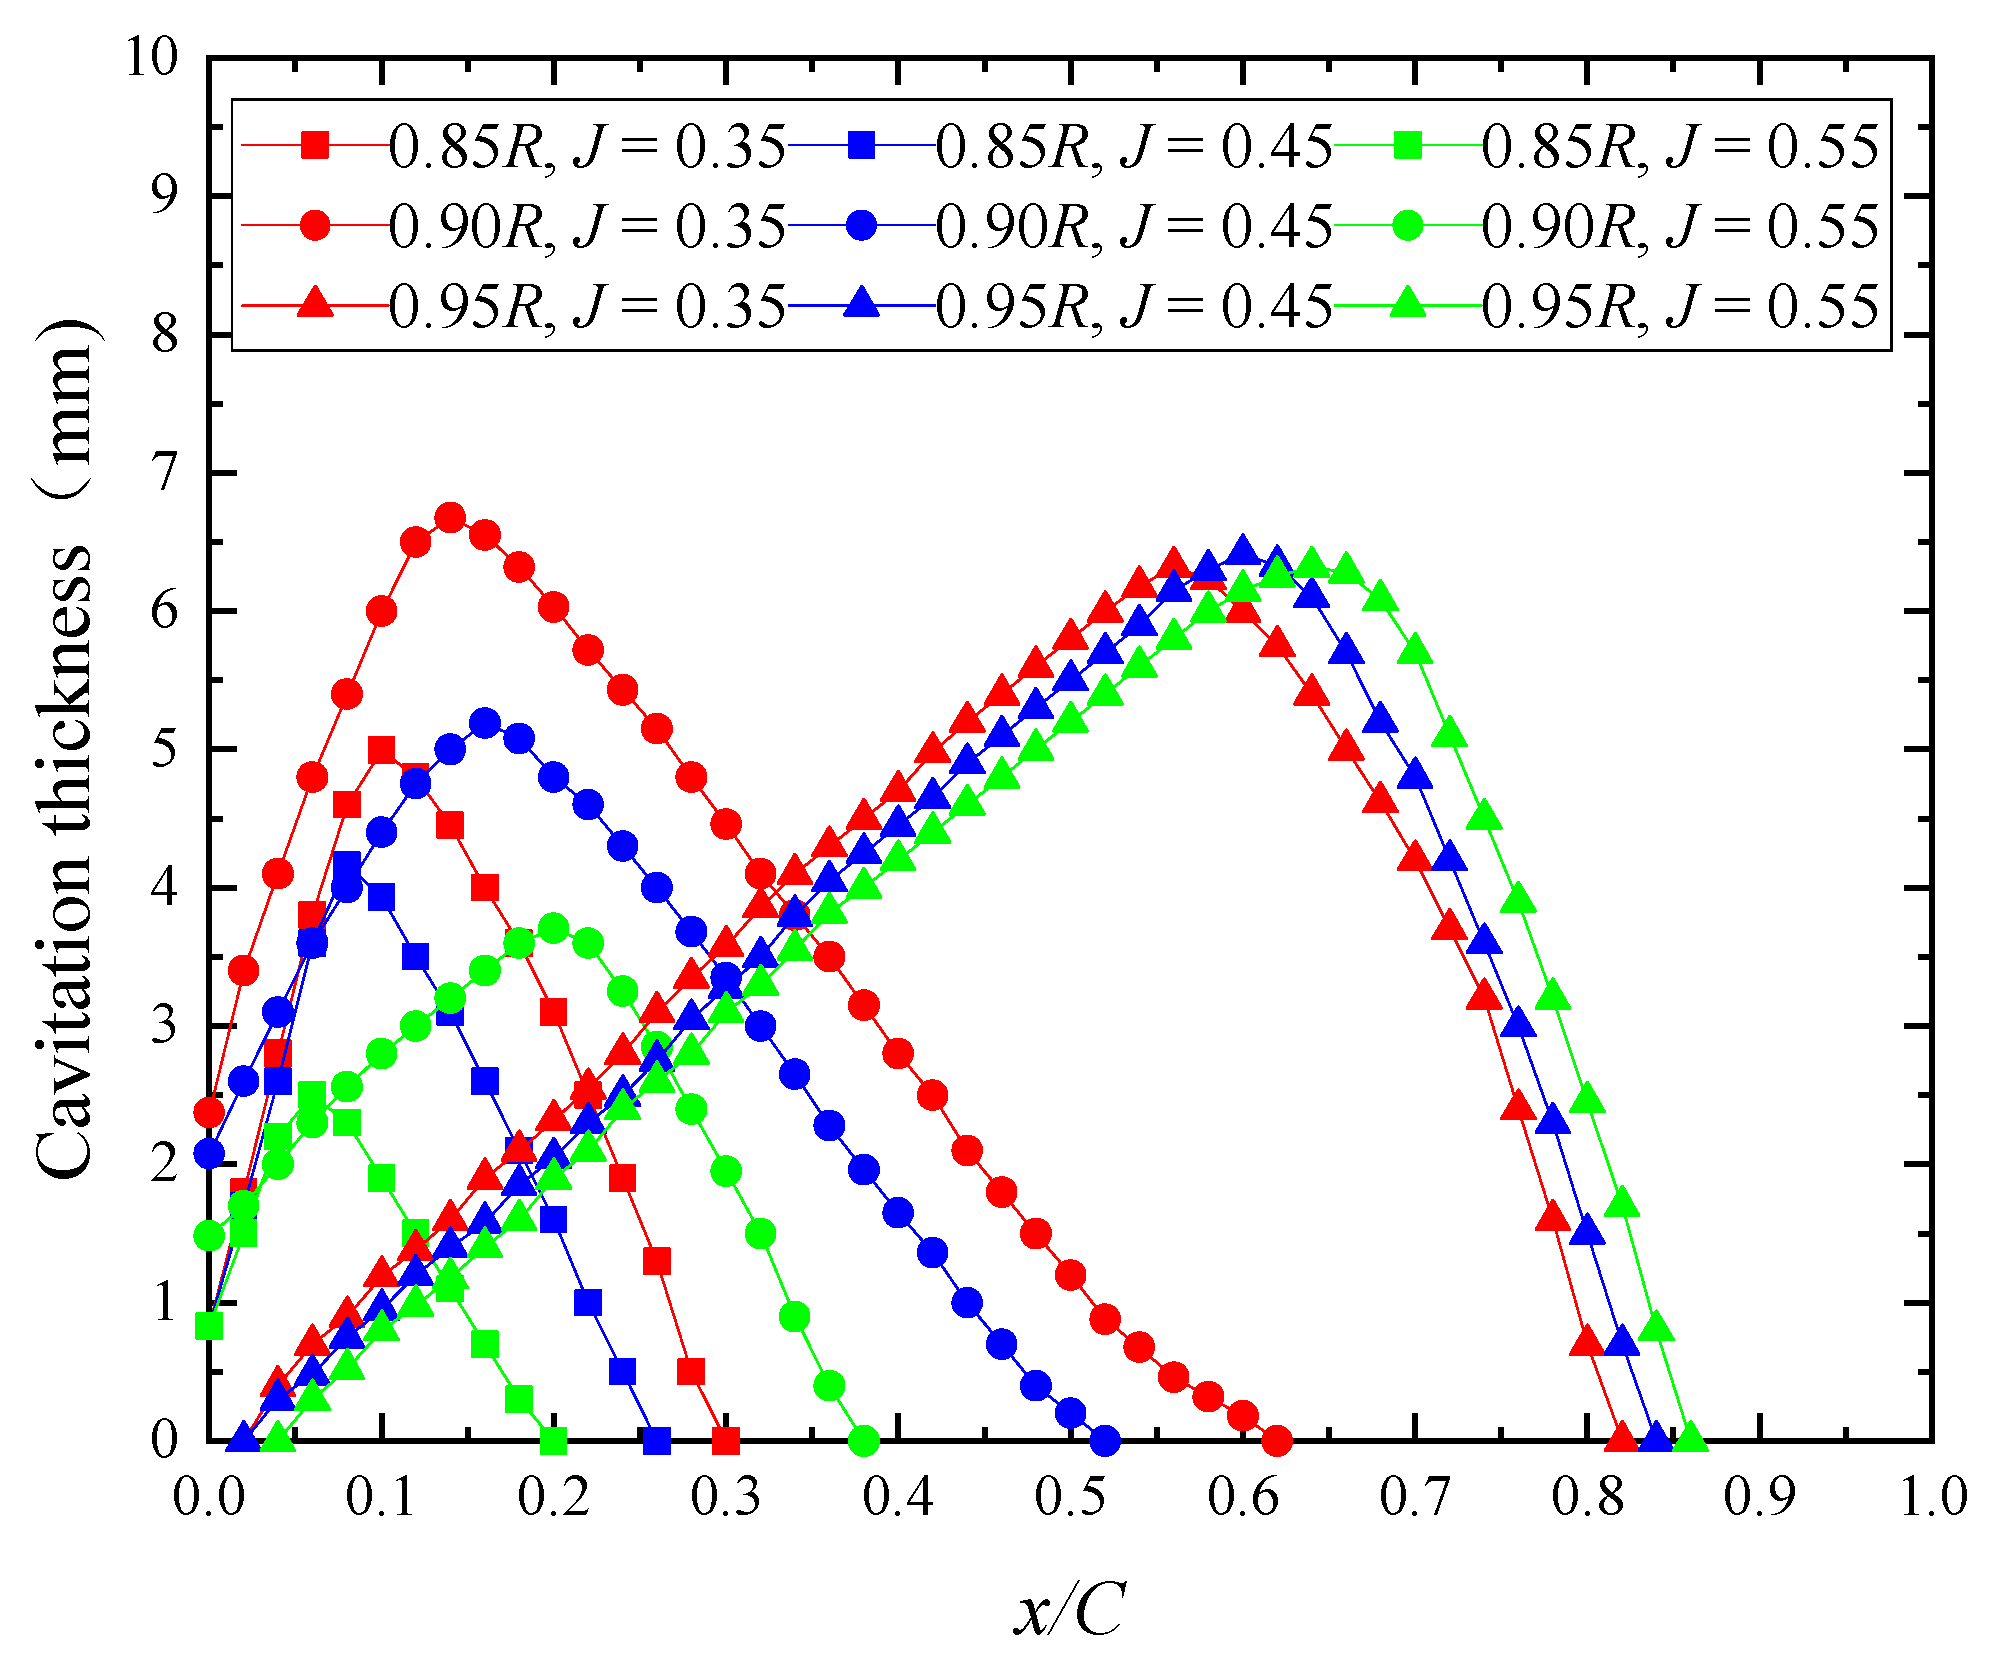
Figure 14 shows the distribution of the cavitation thickness along the chord length of the blade section at 0.85 R, 0.90 R and 0.95 R. It is observed that the thickness of the cavitation varies greatly at different radii. The thickness of the cavitation at 0.85 R is the smallest, and the coverage of the cavitation is also the smallest. With the increase of the advance coefficient, the thickness of the cavitation at the leading-edge decreases, and its peak value moves forward. When the blade section is 0.90 R, both the thickness and coverage area change the most with the increase of the advance coefficient. Specifically speaking, as the advance coefficient increases, the thickness of the cavitation decreases and the peak value moves back. When the blade section is 0.95 R, the cavitation almost covers the whole chord length. The maximum value of the cavitation thickness is about 6.4 mm, and the peak value of the cavitation thickness moves backwards with the increase of the advance coefficient. The cavitation thickness at the leading edge of 0.85 R and 0.90 R blade sections is greater than 0, and decreases with the advance coefficient. At 0.95 R, the thickness of the blade section is distributed behind the leading edge, and the cavitation is separated from the blade surface.
5.5. Vortex Intensity
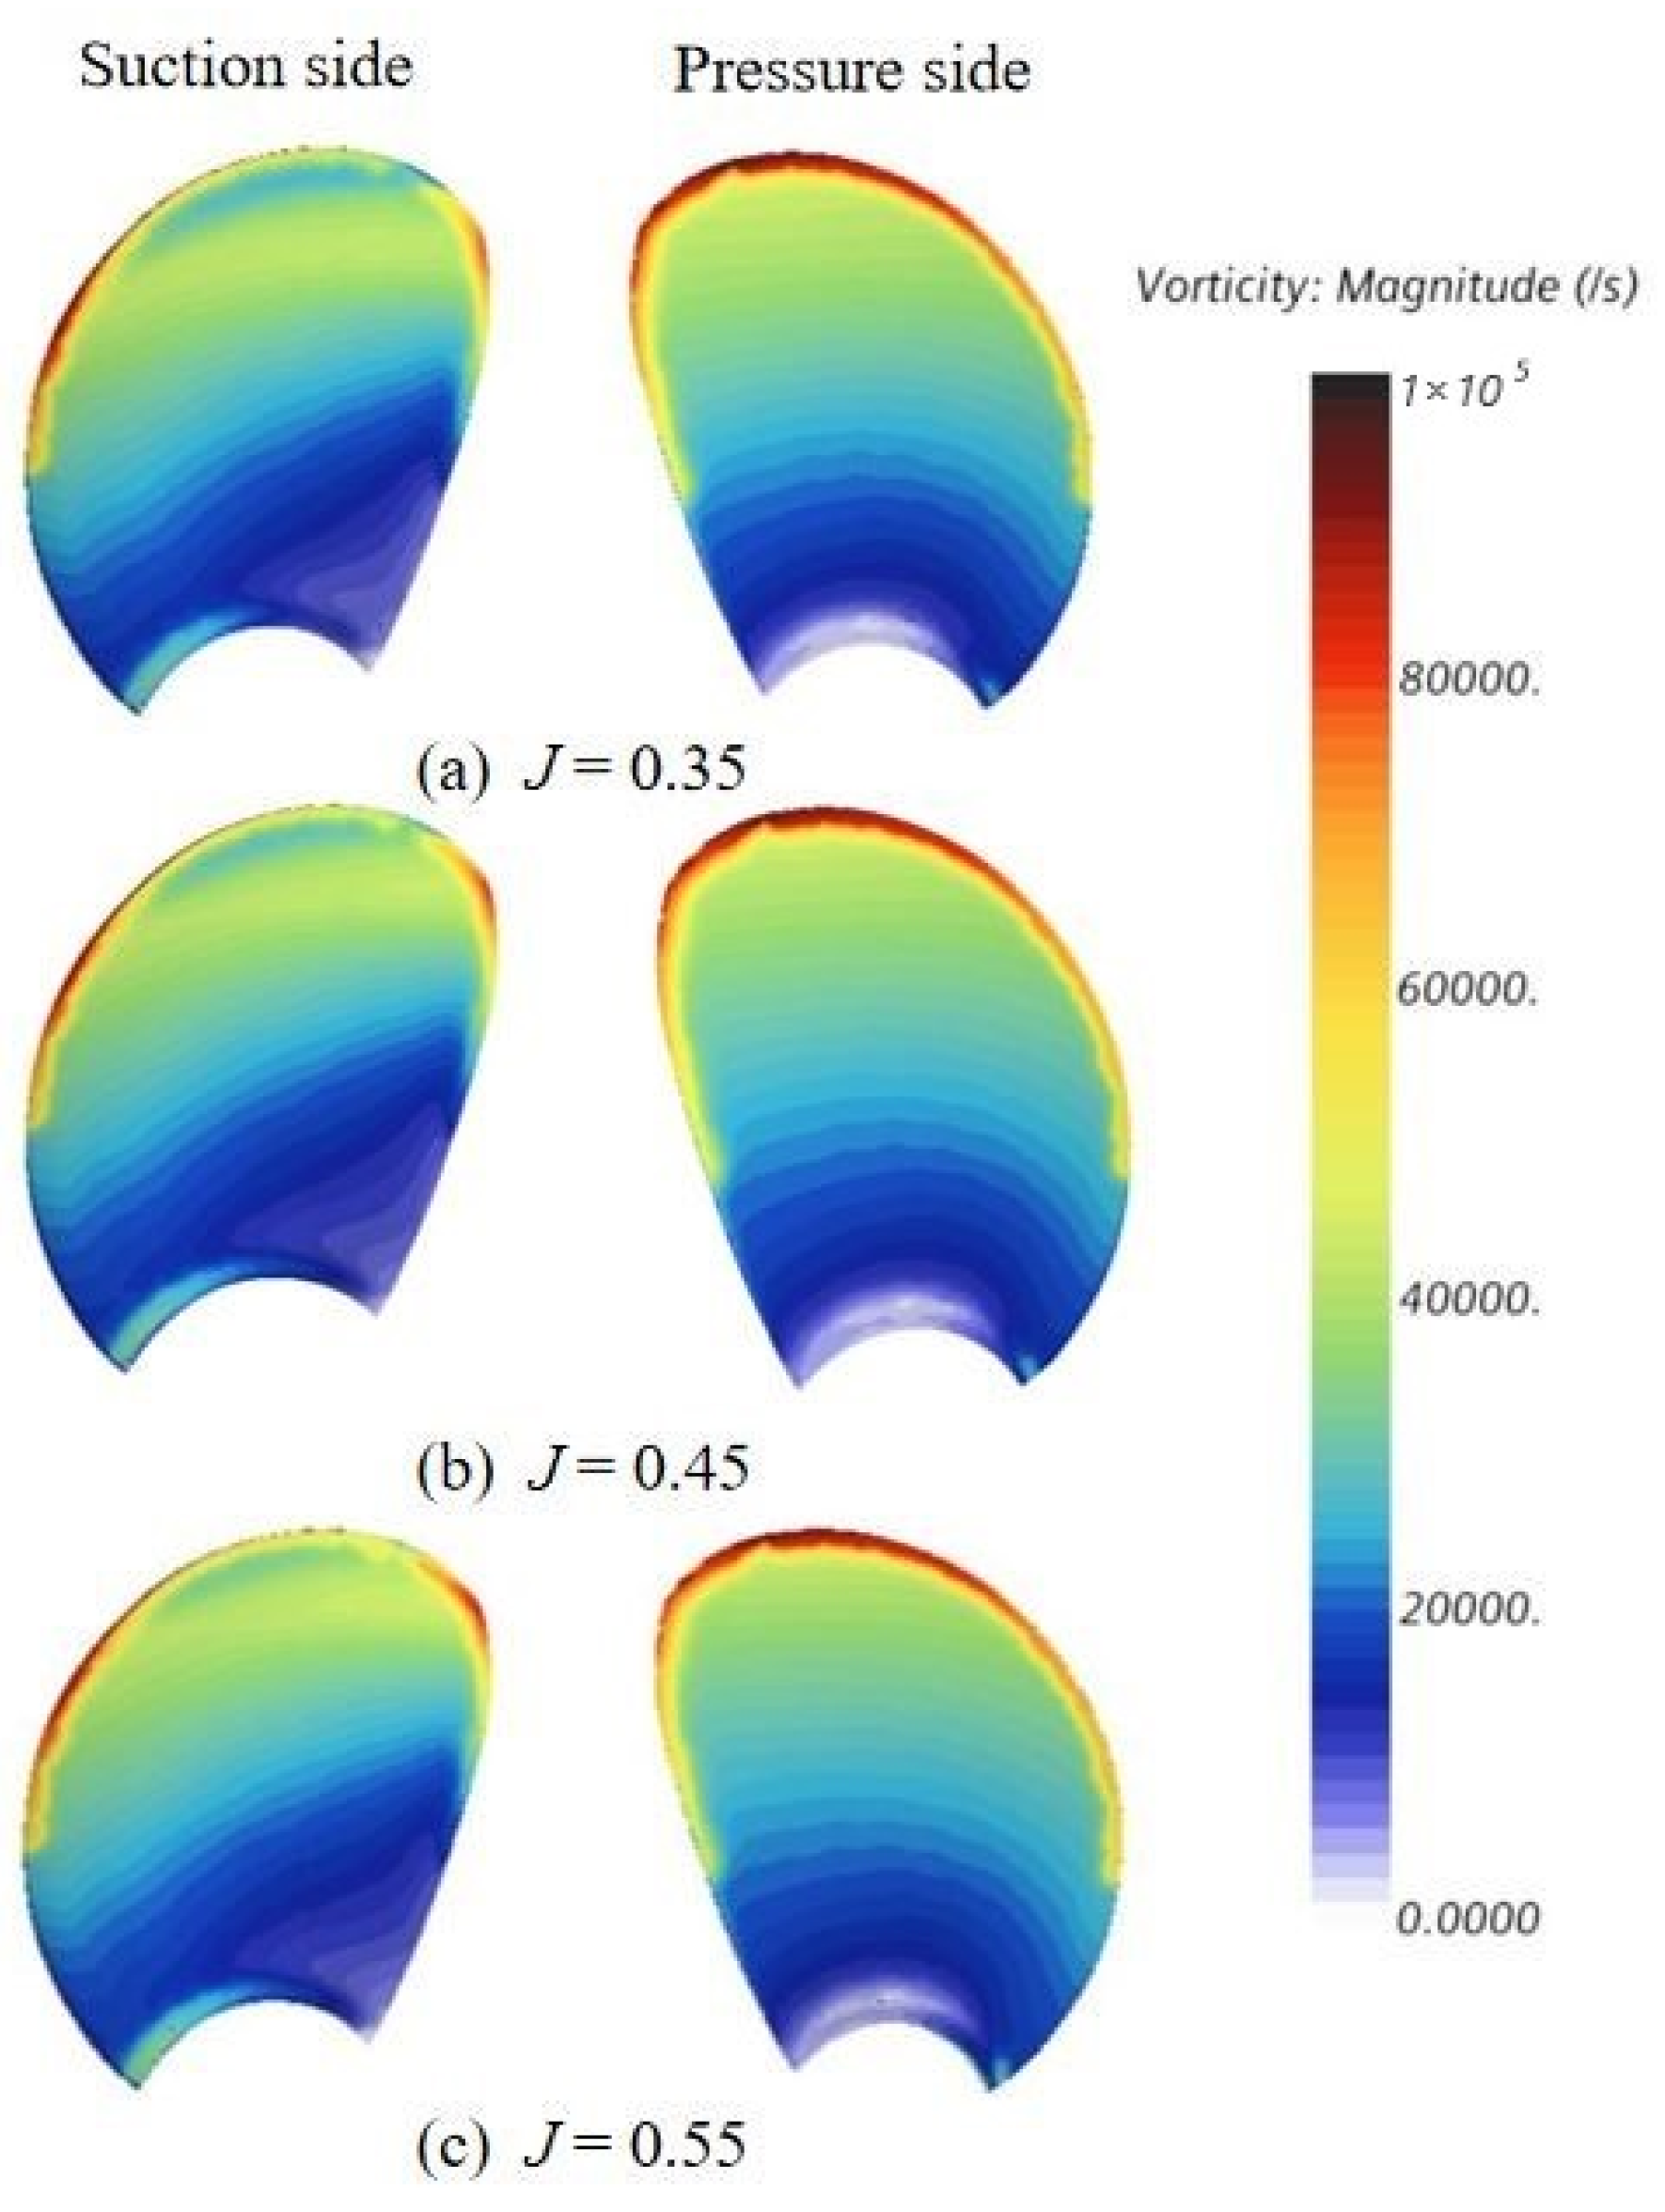
To investigate the influence of the cavitation on the vortex intensity on the surface of the key blade in the ice blockage effect, the vortex intensity distributions on the key blade when σn = 1.5, L/D = 0.15 and J = 0.35, 0.45 and 0.55 are compared in Figure 15. The vortex intensity distribution on the pressure surface is relatively uniform. The largest and the smallest vortex intensities occur at the blade edge and at the blade root, respectively. As the radial distance decreases, the vortex intensity gradually decreases as well. With the increase of the advance coefficient, the vortex intensity and its distribution on the pressure surface are almost unchanged. Compared with the pressure surface, the vortex intensity on the suction surface is disorderly distributed near the blade tip. Because the cavitation is attached to the blade tip, the contact area between the viscous water and the blade is reduced, and hence the vortex intensity is reduced. With the increase of the advance coefficient, the low-pressure area and the area covered by the cavitation become narrower and longer, and the vortex intensity also shows a similar trend.
6. Conclusions
In this work, the propeller model test and CFD numerical simulations based on RANS were performed to study the hydrodynamic performance of the propeller in the uniform flow and the ice blockage environments.
Based on both the experimental and the numerical results, the following main conclusions are drawn:
- (1)
- The numerical simulation results are in good agreement with the model test data, and the error is within 5%.
- (2)
- In the uniform environment, the smaller advance coefficient leads to the higher rotating speed of the propeller, and with the cavitation more heavy, the thrust and torque of the propeller will drop sharply due to the influence of the cavitation.
- (3)
- In the ice blockage environment, the thrust and torque increase with the decrease of the ice-propeller spacing. The cavitation becomes more obvious when the ice blockage is more serious. When σn = 1.5 and L/D = 0.15, the hydrodynamic performance of the propeller is the worst.
- (4)
- The propeller oscillates violently under the action of the cavitation excitation force, and the oscillation frequency of the propeller increases with the increase of the advance coefficient.
- (5)
- The cavitation is generated in the low-pressure area of the suction surface, the coverage area of the cavitation decreases with the increase of the advance coefficient, the sheet-like cavitation is broken into cloud-like cavitation, the tip vortex cavitation increases significantly, and the cavitation shapes of the numerical simulation are consistent with the experimental phenomenon.
- (6)
- Since the cavitation reduces the contact area between the water and the blade, the vortex strength at the attachment of the cavitation decreases, and the vortex strength increases with the increase of the advance coefficient.
Author Contributions
Experiment, L.Z. and F.D.; methodology, L.Z. and S.Z.; simulation, S.Z.; validation, S.D. and J.G.; analysis, L.Z. and S.Z.; investigation, S.Z.; resources, L.Z. and F.D.; data curation, S.Z.; writing—original draft preparation, S.Z.; writing—review and editing, J.G.; visualization, L.Z. and S.Z.; supervision, L.Z. and S.D.; project administration, L.Z. and S.D.; funding acquisition, L.Z. All authors have read and agreed to the published version of the manuscript.
Funding
This research was funded by the National key research and development program, grant number 2022YFE0107000 and National Natural Science Foundation of China, grant number 52171259, 51809124, 51911530156.
Data Availability Statement
All analyzed data in this study have been included in the manuscript.
Acknowledgments
The authors would like to thank the Jiangsu University of Science and Technology (JUST).
Conflicts of Interest
The authors declare no conflict of interest.
References
- Zhang, Z.; Huisingh, D.; Song, M. Exploitation of trans-Arctic maritime transportation. J. Clean. Prod. 2019, 212, 960–973. [Google Scholar] [CrossRef]
- Tsarau, A.; Lubbad, R.; Løset, S. A numerical model for simulating the effect of propeller flow in ice management. Cold Reg. Sci. Technol. 2017, 142, 139–152. [Google Scholar] [CrossRef]
- Ryan, C.; Huang, L.; Li, Z.; Ringsberg, J.W.; Thomas, G. An Arctic ship performance model for sea routes in ice-infested waters. Appl. Ocean Res. 2021, 117, 102950. [Google Scholar] [CrossRef]
- Aktas, B. A Systematic Experimental Approach to Cavitation Noise Prediction of Marine Propellers. Ph.D. Thesis, Newcastle University, Newcastle, UK, 2007. [Google Scholar]
- Sampson, R.; Atalr, M.; Sasaki, N. Cavitation analysis of a double acting podded drive during ice milling. In Proceedings of the 7th International Symposium on Cavitation, Ann Arbor, MI, USA, 16–20 August 2009. [Google Scholar]
- Wu, S.; Liu, Y.; Zeng, Z.B. Influence of ice block on hydrodynamic performance and cavitation of propeller. Shipbuild. China 2018, 59, 110–121. [Google Scholar]
- Wu, S.; Rui, W.; Zeng, Z.B. Investigation on the characteristics of cavitation excited force of propeller in ice block condition. Ship Sci. Technol. 2019, 41, 21–26. [Google Scholar]
- Wu, S.; Zeng, Z.B.; Zhang, G.P. Experimental research on the influence of ice block parameters on propeller hydrodynamic performance. J. Ship Mech. 2018, 22, 156–164. [Google Scholar]
- Rhee, S.H. A study of propeller cavitation using a RANS CFD method. In Proceedings of the 8th International Conference on Numerical Ship Hydrodynamics, Busan, Korea, 22–25 September 2003; pp. A292–A303. [Google Scholar]
- Liu, D.C.; Hong, F.; Zhao, F. The CFD analysis of propeller sheet cavitation. In Proceedings of the 8th International Conference on Hydrodynamics, Nantes, France, 30 September–3 October 2008; pp. 171–176. [Google Scholar]
- Zhu, Z.F.; Wang, X.Y.; Fang, S.L. Propeller cavitation research by an unstructured grid based RANS solver. Ocean. Eng. 2009, 27, 103–107. [Google Scholar]
- Shin, K.W.; Andersen, P.; Mikkelsen, R. Cavitation simulation on conventional and highly-skewed propellers in the behind-hull condition. In Proceedings of the Second International Symposium on Marine Propulsors, SMP 11, Hamburg, Germany, 15–17 June 2011. [Google Scholar]
- Ju, L. Unsteady Cavitation Numerical Simulation of Propeller behind Ship Hull. Master’s Thesis, Harbin Engineering University, Harbin, China, 2012. [Google Scholar]
- Zheng, C.S.; Zhang, Z.R. Prediction Method for Open-Water Performance of Propeller Based on OpenFOAM. Chin. J. Ship Res. 2012, 7, 30–35. [Google Scholar]
- CB/T 346–1997. Open Water Test Method of Propeller Model. S. Available online: http://std.samr.gov.cn/hb/search/stdHBDetailed?id=8B1827F17E3BBB19E05397BE0A0AB44A (accessed on 26 February 2022).
- Misra, S.C. Design Principles of Ships and Marine Structures; CRC Press: Boca Raton, FL, USA, 2015. [Google Scholar]
- Xu, P.; Wang, C.; Ye, L.; Guo, C.; Xiong, W.; Wu, S. Cavitation and Induced Excitation Force of Ice-Class Propeller Blocked by Ice. J. Mar. Sci. Eng. 2021, 9, 674. [Google Scholar] [CrossRef]
- Yusvika, M.; Prabowo, A.R.; Tjahjana, D.D.D.P.; Sohn, J.M. Cavitation Prediction of Ship Propeller Based on Temperature and Fluid Properties of Water. J. Mar. Sci. Eng. 2020, 8, 465. [Google Scholar] [CrossRef]
- Guo, C.Y.; Xu, P.; Wang, C.; Xiong, W.P. Experimental Investigation of the Effect of Ice Blockage on Propeller Hydrodynamic Performance. Math. Probl. Eng. 2019, 2019, 3712012. [Google Scholar] [CrossRef]
- Chao, W.; Sheng-Xia, S.; Xin, C.; Li-Yu, Y. Numerical simulation of hydrodynamic performance of ice class propeller in blocked flow–using overlapping grids method. Ocean Eng. 2017, 141, 418–426. [Google Scholar] [CrossRef]
- Gu, L.; Wang, C.; Hu, J. Application Study of Cartesian Grid in Numerical Prediction of a Marine Propeller. In Proceedings of the 35th International Conference on Offshore Mechanics and Arctic Engineering, American Society of Mechanical Engineers, Busan, Korea, 19–24 June 2016. [Google Scholar]
- Sauer, J.; Schnerr, G.H. Development of a New Cavitation Model based on Bubble Dynamics. ZAMM-J. Appl. Math. Mech./Z. Für Angew. Math. Und Mech. 2001, 81, 561–562. [Google Scholar] [CrossRef]
Figure 1.
Schematic installation of the ice and propeller models in the cavitation tunnel.

Figure 2.
Open-water performance curves of propeller in the uniform flow environment.

Figure 3.
Open-water performance curves of the propeller in ice blockage environment. (a) The influence of ice blockage on the thrust coefficient. (b) The influence of ice blockage on the torque coefficient. (c) The influence of ice blockage on the open-water efficiency.
Figure 3.
Open-water performance curves of the propeller in ice blockage environment. (a) The influence of ice blockage on the thrust coefficient. (b) The influence of ice blockage on the torque coefficient. (c) The influence of ice blockage on the open-water efficiency.


Figure 4.
Photos for the propeller test in ice blockage experiment.

Figure 5.
The geometric model of the propeller.

Figure 6.
The size of ice blockage and its relative position with the propeller.

Figure 7.
Schematic diagram of calculation domain.

Figure 8.
Schematic diagram of boundary conditions.

Figure 9.
Grids in the computational domain.

Figure 10.
Comparison of mean open-water performance between the numerical results (marked with CFD) and the experimental data (marked with EFD) in ice blockage environment. (a) The influence of ice blockage on the thrust coefficient. (b) The influence of ice blockage on the torque coefficient. (c) The influence of ice blockage on the open-water efficiency.


Figure 11.
Open-water performance of propeller with cavitation excitation force. (a) The influence of ice blockage on the thrust coefficient. (b) The influence of ice blockage on the torque coefficient.
Figure 11.
Open-water performance of propeller with cavitation excitation force. (a) The influence of ice blockage on the thrust coefficient. (b) The influence of ice blockage on the torque coefficient.


Figure 12.
Distribution of pressure coefficient on the blade surface.

Figure 13.
Cavitation shapes of suction surface for the key blade.

Figure 14.
Distribution of cavitation thickness along chord length of blade section.

Figure 15.
Distribution of blade vortex intensity.


Table 1.
Main parameters of the propeller.
| Parameters | Full Scale | Model Scale |
|---|---|---|
| Scale ratio λ | 1 | 28 |
| Diameter D (m) | 7.0 | 0.25 |
| Number of Blades Z | 4 | 4 |
| Pitch/Diameter Ratio (P/D)0.7R | 0.84 | 0.84 |
| Blade area ratio AE/A0 | 0.75 | 0.75 |
| Hub Diameter Ratio dh/D | 0.21 | 0.21 |
Table 2.
Measurement instruments and their range.
| Instruments | Model Number | Parameters | Range |
|---|---|---|---|
| Pressure transmitter | 3151 | Pressure measurement | 0–0.3 MPa |
| Velocity measurement | 3–20 m/s | ||
| Rotating speed measuring instrument | FC4-490F | Rotating speed measurement | 0–4500 rpm |
| Long Axis dynamo meter | 1415 | Thrust Force | 0–3000 N |
| Torque | 0–150 N·m | ||
| Rotating speed | 0–3000 rpm |
Table 3.
Test operating conditions of the propeller for ice blockage.
| Operating Conditions | σn | J | L/D |
|---|---|---|---|
| 1 | 1.5 | 0.35 | 0.15, 0.20, 0.25, 0.30, 0.40, 0.50 |
| 2 | 0.45 | ||
| 3 | 0.55 | ||
| 4 | 4.0 | 0.35 | |
| 5 | 0.45 | ||
| 6 | 0.55 |
Table 4.
Numerical results and the errors from experimental data.
| Grids | J | KT | 10KQ | Error (%) | |
|---|---|---|---|---|---|
| KT | 10KQ | ||||
| Sliding grids | 0.4 | 0.1854 | 0.2678 | −1.827 | −0.750 |
| 0.5 | 0.1701 | 0.2538 | −2.702 | 0.191 | |
| 0.6 | 0.1237 | 0.2070 | −1.667 | 1.209 | |
| 0.7 | 0.0833 | 0.1603 | −1.828 | 1.989 | |
| 0.8 | 0.0348 | 0.1030 | −3.875 | 3.993 | |
| overlapping grids | 0.4 | 0.1886 | 0.2721 | −0.125 | 0.851 |
| 0.5 | 0.1740 | 0.2572 | −0.464 | 1.531 | |
| 0.6 | 0.1246 | 0.2067 | −1.734 | 1.058 | |
| 0.7 | 0.0826 | 0.1592 | −2.725 | 1.289 | |
| 0.8 | 0.0354 | 0.1006 | −2.291 | 1.613 | |
Publisher’s Note: MDPI stays neutral with regard to jurisdictional claims in published maps and institutional affiliations. |
© 2022 by the authors. Licensee MDPI, Basel, Switzerland. This article is an open access article distributed under the terms and conditions of the Creative Commons Attribution (CC BY) license (https://creativecommons.org/licenses/by/4.0/).
Share and Cite
MDPI and ACS Style
Zhou, L.; Zheng, S.; Diao, F.; Ding, S.; Gao, J. Experimental and Numerical Study on Ice Blockage Performance of Propeller in Cavitation Flow. Water 2022, 14, 1060. https://doi.org/10.3390/w14071060
AMA Style
Zhou L, Zheng S, Diao F, Ding S, Gao J. Experimental and Numerical Study on Ice Blockage Performance of Propeller in Cavitation Flow. Water. 2022; 14(7):1060. https://doi.org/10.3390/w14071060
Chicago/Turabian StyleZhou, Li, Sijie Zheng, Feng Diao, Shifeng Ding, and Junliang Gao. 2022. "Experimental and Numerical Study on Ice Blockage Performance of Propeller in Cavitation Flow" Water 14, no. 7: 1060. https://doi.org/10.3390/w14071060
Note that from the first issue of 2016, this journal uses article numbers instead of page numbers. See further details here.