
Study on the Spatial and Temporal Distribution of Irrigation Water Requirements for Major Crops in Shandong Province

College of Water Conservancy and Civil Engineering, Shandong Agricultural University, Tai’an 271018, China
*
Authors to whom correspondence should be addressed.
†
These authors contributed equally to this work.
Water 2022, 14(7), 1051; https://doi.org/10.3390/w14071051
Submission received: 17 December 2021
/
Revised: 23 March 2022
/
Accepted: 24 March 2022
/
Published: 27 March 2022
(This article belongs to the Special Issue Water and Soil Resources Management in Agricultural Areas)
Abstract
:Understanding the spatial and temporal distribution of irrigation water requirements is significant to realize the rational allocation of water resources and also serves as the basis for analyzing agricultural water-saving potential. This study refers to the standard irrigation regions in southwestern, northern, central, southern, and eastern Shandong province. The irrigation water requirements at 20 weather stations in Shandong Province from 1968 to 2016 were calculated, and the spatial and temporal distribution characteristics were analyzed. The results indicated the following: (a) The trend of the annual irrigation water requirements for summer maize and winter wheat showed an insignificant increase in the eastern Shandong irrigation region, a significant decline in northern and southwestern Shandong irrigation regions, and an insignificant decrease in the other irrigation regions. (b) The multi-year average irrigation water requirement for summer maize generally presents a spatial distribution characteristic which is less in the southwest, more in the northeast, less in the south, and more in the north, while the spatial distribution characteristic for winter wheat is less in the southeast, more in the northwest, less in the south, and more in the north. (c) The main meteorological factors affecting the irrigation water requirements for summer maize are precipitation and sunshine duration, while relative humidity is the main factor affecting winter wheat in Shandong Province.
1. Introduction
With the continuous development of society and population growth, demand for food has been increasing. However, water shortages are becoming a crucial limiting factor in food production [1]. Globally, the gap between supply and demand for irrigation water is expected to become very large by the end of 2050, as the population continues to grow [2]. Meanwhile, water shortages are further exacerbated by the fact that large amounts of irrigation water are wasted or not effectively managed in fields [3].
China is the largest developing country in the world and also suffers from serious water shortages. Its agriculture has always played a pivotal role in the development of the national economy. China’s total agricultural water consumption is 368.2 billion m3, accounting for 61.2% of the total national water consumption (China Water Resources Bulletin, 2019), while 90% of the total agricultural water consumption is used for irrigation [4].
Shandong Province is a major agricultural province in China, and it is one of the provinces experiencing serious water shortages. The per capita water resources in Shandong Province are only one-seventh of the national per capita and 4.0% of the world’s per capita resources. In 2018, the total water consumption of the province was 21.266 billion m3, among which the agricultural water consumption was 13.346 billion m3, accounting for 62.8% of the total water consumption, while the agricultural irrigation water consumption was 11.468 billion m3, accounting for 85.9% of the agricultural water consumption [5]. In addition, Shandong Province has a warm temperate monsoon climate. The precipitation in Shandong Province is concentrated in summer, and the spatial-temporal distribution of water resources is very uneven. Therefore, it is particularly important to make efficient and reasonable use of water resources, especially the irrigation water needed for crop growth. As such, we need to fully understand the growth demand of different crops, the spatial-temporal variation of precipitation, and the spatial-temporal variation of irrigation water, which are of great significance for the rational allocation of water resources in different areas of Shandong Province.
The purpose of irrigation is to supplement natural rainfall. The difference between crop water requirements and effective rainfall is generally used to determine the irrigation water requirements of crops. The irrigation water requirements are crucial for optimizing agricultural water management and reallocation. To date, many studies have been conducted on the spatial-temporal variation of the irrigation water requirements of different crops using the water balance method at large regional scales [6,7].
Reference evapotranspiration (ET0) is the basis for calculating crop water requirements and irrigation water requirements, and the accuracy of its estimation directly affects the accuracy of the resulting irrigation water requirements. Through a combination of experimental and theoretical analyses, researchers have proposed many methods to calculate ET0, including the temperature method, radiation method, synthesis method, and evaporation pan method. The Penman–Monteith (P–M) formula has shown superiority in all climate regions, and it has been recommended by the Food and Agriculture Organization of the United Nations as the standard method for calculating ET0 [8,9,10,11,12,13].
Previous studies have mainly focused on large regional or watershed scales in China. In North China, the variation trend of water requirements for major crops has been analyzed from 1950 to 2000, and it was concluded that the irrigation water requirements for winter wheat in Beijing increased significantly, at a rate of 9.8 mm/10a, while the crop water requirements in other regions showed a decreasing trend [14]. The change of climate in recent years had a certain influence on the growth period, and the irrigation water requirements of winter wheat in the west of North China showed a decreasing trend [15]. The spatial distribution of irrigation water requirements has been studied based on the water balance method, and it was found that the irrigation water requirements in wheat-growing areas are higher [16]. In Hebei province, the variation in trends of crop water requirements and water shortages associated with winter wheat and summer maize have been studied from 1965 to 1999, and it was found that, although the water shortages of major crops in Hebei province tended to increase with time, the differences did not pass the significance test [17]. In Southwest China, the irrigation water requirements for rice have been calculated by applying the difference between crop water requirements and effective rainfall, and it was found that the tillering and heading stage was the key period of water requirements for rice growth and development [18]. In Guizhou province, the net irrigation water requirements and irrigation demand index over the past 60 years were calculated based on the long-term data and agricultural data at meteorological stations and their surrounding counties, and the spatial distribution was studied [19]. Cui et al. have calculated the reference evapotranspiration and explored the appropriate calculation methods in different climate regions based on the daily meteorological data of nine meteorological stations in typical regions with different climates in China in the long term [20]. However, much less research has focused on the irrigation water requirements of major crops in Shandong Province. In this study, the M–K mutation test, IDWI (inverse distance weighted interpolation), and Pearson correlation regression analysis were used to study the spatial-temporal distribution and main influencing factors of the irrigation water, considering the demands of summer maize and winter wheat in each irrigation region in Shandong Province. These results are expected to provide a scientific basis for optimizing water resource allocation, effectively utilizing agroclimatic resources, and facilitating regional sustainable development in Shandong Province.
2. Materials and Methods
2.1. Data Sources
The climate of Shandong is of the warm temperate monsoon climate type, with concentrated precipitation, rain, and heat in the same season, a short spring and autumn, and a long winter and summer. The annual average temperature in Shandong is 11–14 °C, increasing from the northeast coast to the southwest inland. The annual average temperature of Jiaodong Peninsula and the Yellow River Delta is below 12 °C, while that of southwestern Shandong is above 14 °C. The accumulated temperature is generally 3800–4600 °C, which can meet the heat requirements of crops twice a year. Sunshine hours are abundant; the average annual number of sunshine hours in Shandong province is 2290–2890 h, and the sunshine percentage is 52–65%. The annual average precipitation in Shandong province is generally between 550 and 950 mm, decreasing from southeast to northwest. The annual average precipitation in southern and eastern Shandong is generally above 800–900 mm, while the annual average precipitation in northwestern Shandong and the Yellow River delta is below 600 mm. Most of the precipitation is concentrated in summer and autumn, and the seasonal distribution is uneven. A total of 60–70% of the annual precipitation is concentrated in June, July, and August, making these months prone to flooding. The precipitation from September to November is generally 100 to 200 mm. The precipitation rom December to February is only 15 to 50 mm, and from March to May, it is below 100 mm. As such, winter and spring are prone to droughts.
For this study, we used 49 years of meteorological data from 20 meteorological stations in Shandong Province from 1968 to 2016, all of which were provided by the China Meteorological Science Data Sharing Service Network (http://cdc.Cma.Gov.cn/; accessed on 6 March 2018). The meteorological information collected includes the daily maximum temperature, daily minimum temperature, average temperature, average wind speed, duration of sunshine, average relative humidity, average air pressure, and daily precipitation. Among the meteorological data collected by meteorological stations, there were some unreasonable and missing data. The specific treatment carried out was as follows.
Data rationality analysis: All data should meet the following conditions, and those that do not meet the conditions should be deleted.
- (1)
- Temperature: −50 to 50 °C;
- (2)
- Precipitation: 0–200 mm;
- (3)
- Wind speed at 2 m: 0–20 m/s;
- (4)
- Relative humidity: 0–100%;
- (5)
- Duration of sunshine: 0–20 h.
Regarding wind speed, precipitation, and individual absence of sunshine hours, data interpolation, mean substitution, and average values taken from all other data were used to fill in the missing values.
If one of the three temperatures (daily minimum temperature, daily average temperature, daily maximum temperature) is missing, it can be converted using the other two temperatures. If two temperatures are missing, they can be converted according to the temperature difference. Meanwhile, if all three temperatures are missing and the number of days having missing data is less than five, the temperatures can be obtained by interpolation; that is, the missing data were interpolated and replaced by the average of the five days surrounding the date.
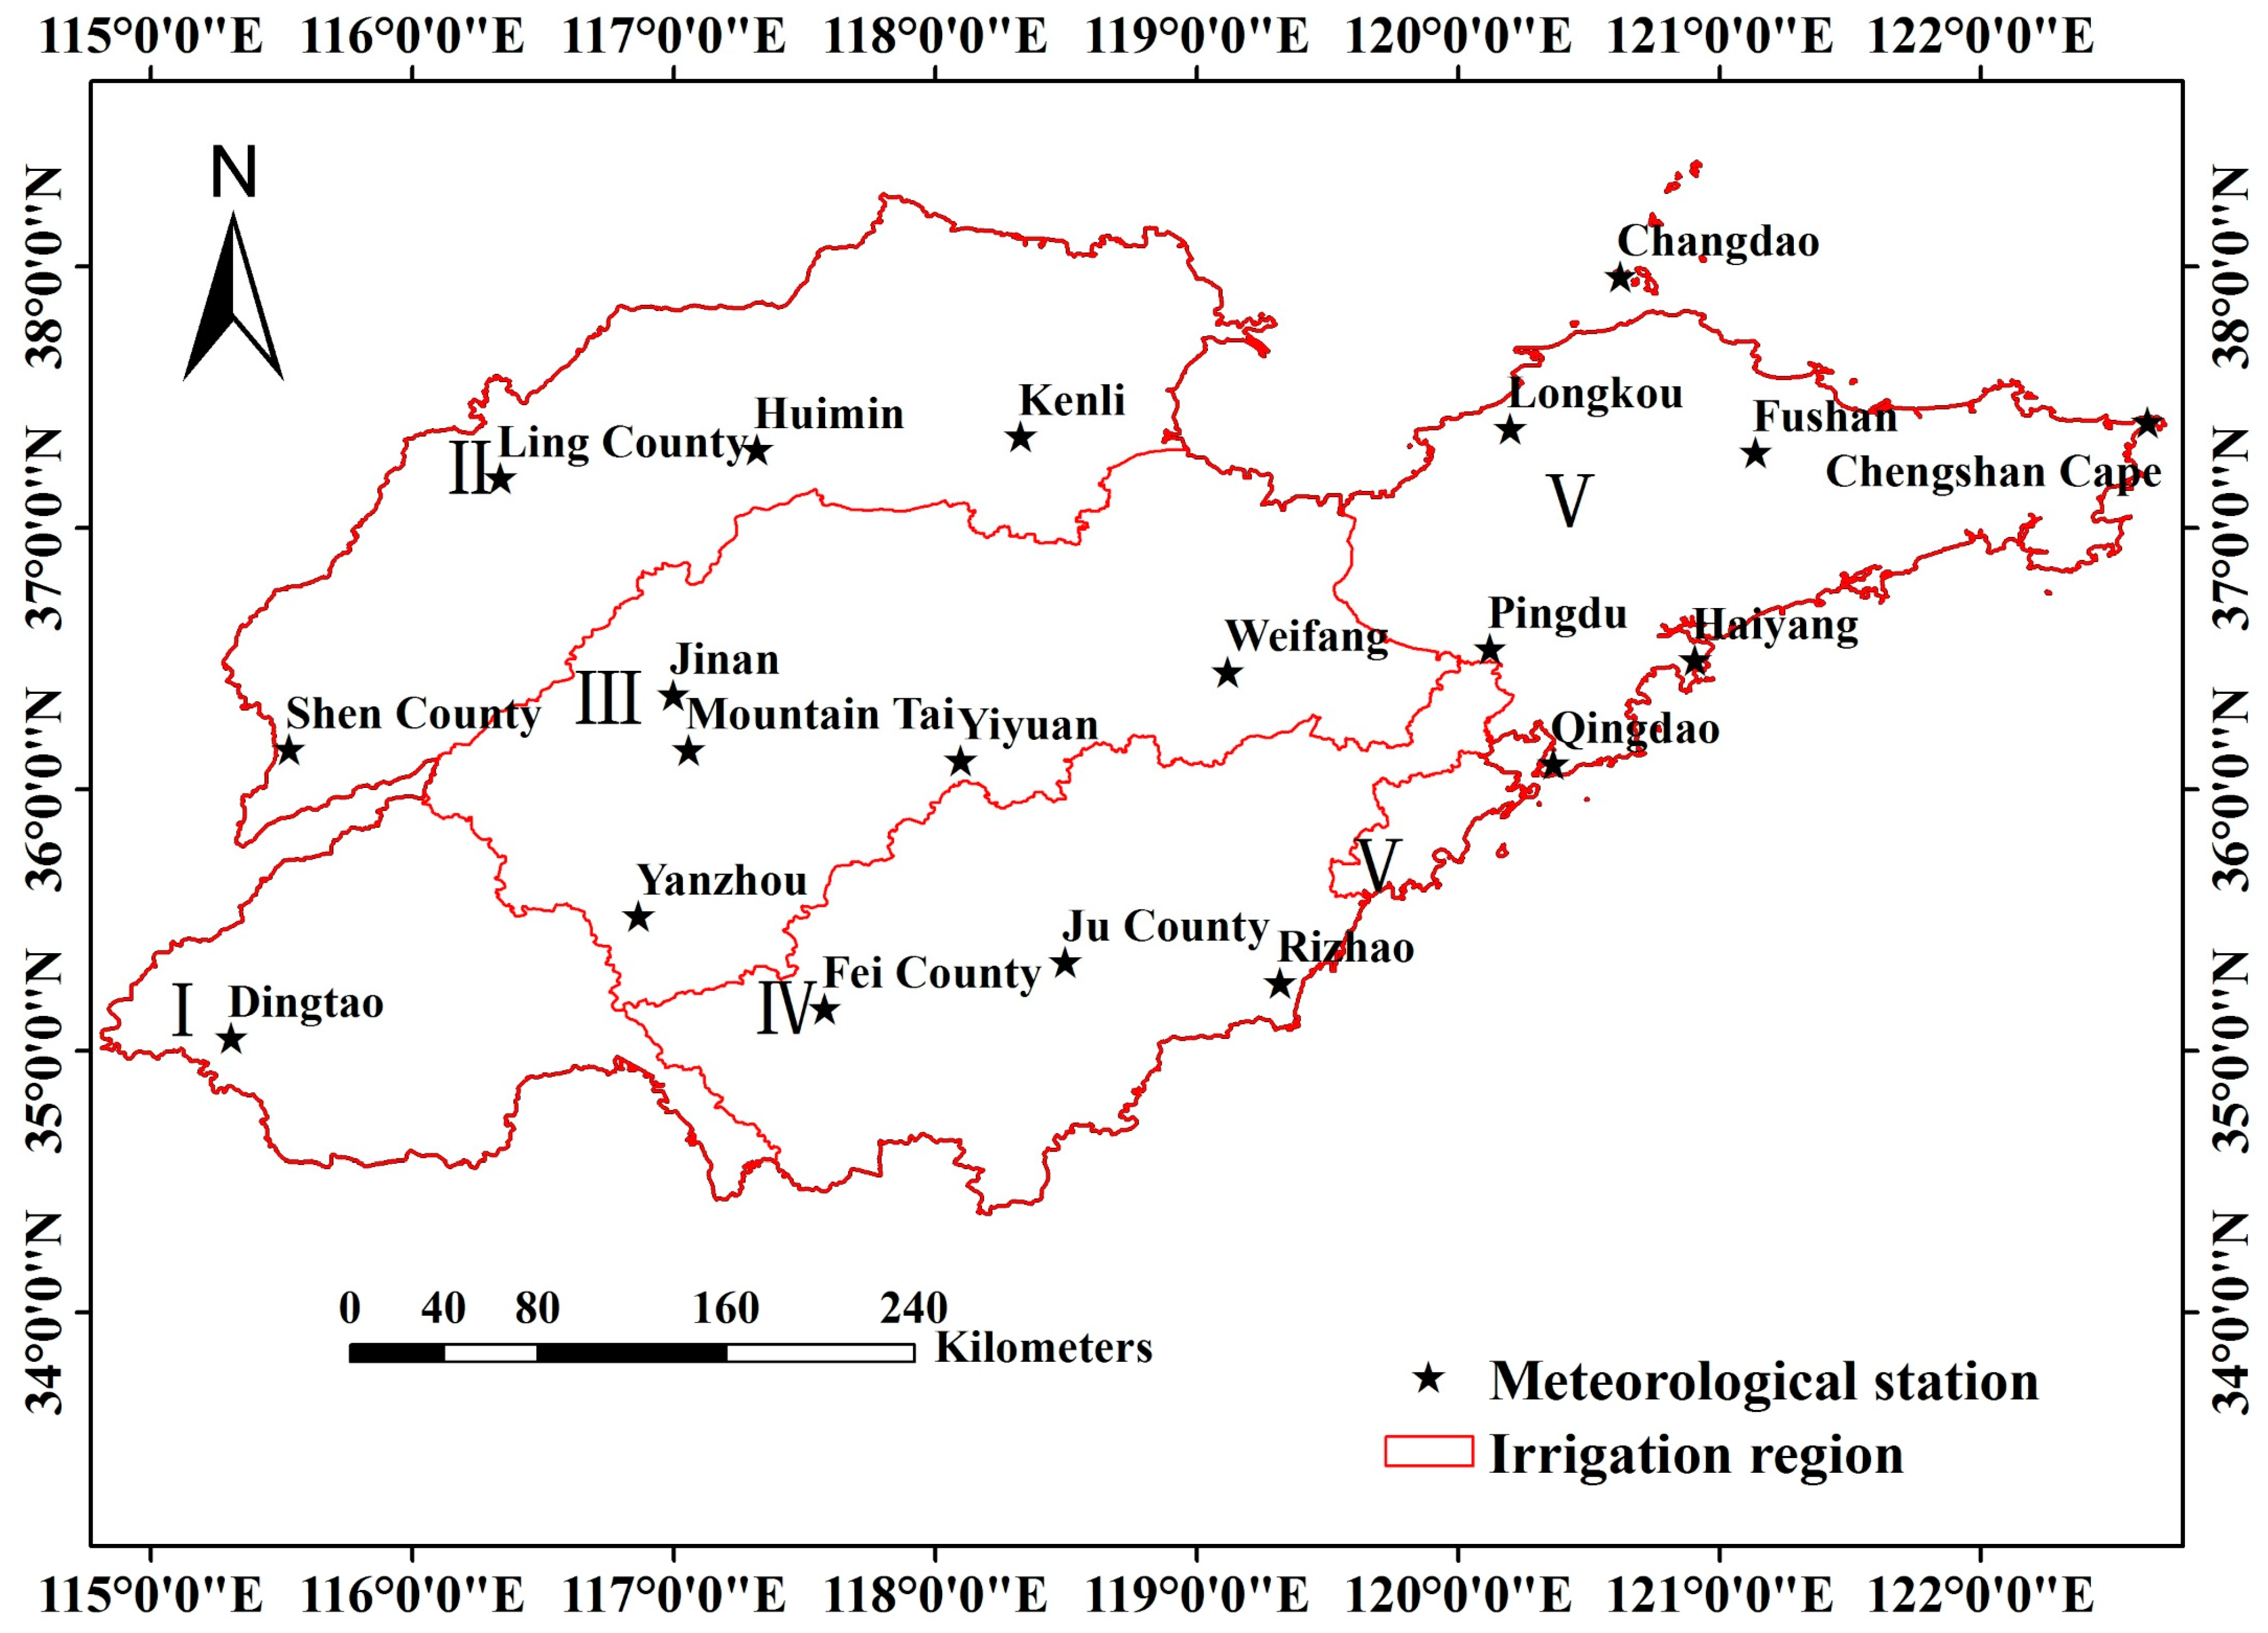
In this study, according to the local standards of Shandong Province, the 20 meteorological stations in Shandong Province were divided into 5 irrigation regions: southwest, north, middle, south, and east Shandong Province. According to the principles of the geographical location of the site and the closeness of the agricultural areas, the long time series of the meteorological data (more than 20 years), and the relatively complete data, the meteorological stations were divided into the irrigation regions. A map showing the distribution of the meteorological stations in each irrigation region is given in Figure 1.
2.2. Research Methods
2.2.1. Calculation of Irrigation Water Requirements
(1) The reference crop evapotranspiration
The daily reference crop evaporation was calculated by using the standard Penman–Monteith (P–M) method, as amended by the United Nations Food and Agriculture Organization (FAO) in 1998, with the influencing factors of daily temperature values, relative humidity, sunshine hours, and wind speed. The formula is as follows:
where ET0 is the reference crop evapotranspiration (mm/d); Rn is the net radiation on the surface of the canopy (MJ/(m2⋅d)); G is the soil heat flux, G = 0; γ is the psychrometric constant (kPa/°C); T is the average temperature (°C); U2 is the wind speed at 2.0 m above ground altitude (m/s); es is the air saturated vapor pressure (kPa); ea is the actual vapor pressure of air (kPa); and Δ is the slope of the saturated vapor pressure-temperature curve (kPa/°C)(2) Crop coefficient (Kc).
The crop coefficient (Kc) reflects the biological characteristics of crops themselves and is closely related to the crop type, variety, growth period, and population leaf area index. It is based on the water requirements measured in the field each month and the reference crop water requirements calculated using meteorological factors for the same time period.
Using the segmented single-value average method recommended by the FAO, the crop coefficient is close to the value measured at the irrigation test station, indicating that it is feasible for the crop coefficient determined by this method to be used for the prediction of water requirements in water resource planning [21].
The segmented single-value average crop coefficient allows us to generalize the change process of the crop coefficient during the whole growth period into several stages. According to the change law of leaf surface transpiration and soil surface evaporation at each stage, the average value of a period is used to represent the crop coefficient at this stage.
The segmented single-value average method mainly generalizes the crop reproductive period into three values (Kcini, Kcmid, Kcend) in four stages (initial growth, rapid development, mid-fertility, and maturation).
The basic crop coefficients of the main crops in this study were obtained from FAO-56 under standard conditions, and the Kcmid and Kcend values of crops were revised according to the following formula:
where Kctab is the crop coefficient in the corresponding growth stage; U2 is the daily average wind speed at 2 m height in the corresponding growth stage; RHmin is the average value of daily minimum relative humidity in the corresponding growth stage; and h is the average height of the crop in the corresponding growth stage. If there is no measured minimum relative humidity, RHmin can be calculated using the daily maximum temperature Tmax and minimum temperature Tmjn.
Using the segmented single-value crop coefficient method recommended by the FAO, combined with relevant data, the fertility stage of summer maize and winter wheat in Shandong Province was divided according to the relative main crop data, and the crop coefficients for each period were calculated. The basic crop coefficients for the main crops—summer maize and winter wheat—in Shandong Province are shown in Appendix A and Table A1 and Table A2. The annual Kc of crop production was calculated according to the basic crop coefficients of each growing stage, which was used to calculate the daily crop water requirements.
(1) Crop water requirements:
According to the scope of research and data collection in this study, the crop water requirement method recommended by the FAO, with good stability and generality, was used to calculate the crop water requirements [21]. The formula is as follows [22]:
where ETC denotes the crop water requirements (mm/d); ET0 is the reference crop evapotranspiration (mm/d); and Kc is the crop coefficient.
ETc = Kc × ET0
(2) Effective rainfall:
Effective rainfall refers to the portion of water that can be used by crops during the period of crop growth and development. At present, most of the empirical formulas for calculating the effective rainfall of different crops summarized in China require the calculation of corresponding parameters according to the local soil properties, crop characteristics, meteorological conditions, and other factors; as such, they are more complicated to apply. Liu Yu et al. have used the following simplified method to calculate the effective rainfall every ten days [21]. The calculation accuracy of this method was considered to meet the requirements of our research. The calculation formula is:
where Pci is the effective precipitation in a period of time (mm); P is the accumulated precipitation in a period of time (mm); Pc is the effective precipitation in the crop growth period (mm); and n is the number of growth period groups.
(3) Irrigation water requirements
Following FAO 46, the irrigation water requirement is the difference between the crop water requirement and effective rainfall [23]. This method is suitable for areas with a low groundwater table, which is the case in most areas of the North China Plain [24], where the water is stored in the soil at the beginning of each individual growing season, and the leaching requirements are ignored [23,25]. Shandong is located on the eastern edge of the North China Plain, so the simplified water balance formula was adopted to estimate the irrigation water requirements in Shandong province.
The calculation formula is:
where IR is the irrigation water requirements (mm) and Pc is the effective rainfall (mm).
The multi-year average irrigation water requirements were calculated using the arithmetic average method,
where is the multi-year average irrigation water requirements (mm); is the nth irrigation water requirements (mm); and n is the number of irrigation water requirements.
2.2.2. M–K Mutation Test
The Mann–Kendall (M–K) test is a non-parametric statistical test. Compared with parameter testing, the advantage of M–K trend testing is that its samples do not need to follow a certain distribution and are not affected by a few outliers. It is more suitable for application to type variables and sequence variables, and it has become a widely used trend analysis method in hydrology and meteorology research in recent years [26,27].
The calculation principle of the M–K test method is as follows: in the process of studying the problem, the actual measured value is synthesized into a time-series Xt = (x1, x2, …, xn). When performing trend analysis, we first determine all dual values for the time-series (xi, xj, j > i); the relationship is determined as:
when xi > xj, Ri = 1, and when xi ≤ xj, Ri = 0.
The statistics defined by the trend test are:
where UF1 = 0, and E(Sk) and Var(Sk) are the mean and variance of the cumulative count, SK, respectively.
When the M–K method is used for the mutation test, it is necessary to calculate UBk, the reverse sequence of time-series Xt, where UBk = −UFk (k = n, n − 1, n − 2, …, 1) and UB1 = 0. When the value of UFk or UBk is greater than 0, it indicates that the sequence presents an upward trend. When the value is less than 0, it indicates that the sequence presents a downward trend. If the value of UFk or UBk exceeds the critical value (−1.96, 1.96), it indicates that the trend of sequence change is relatively significant. When the UFk curve intersects the UBk curve, and the intersection point is between the critical boundary (−1.96, 1.96), the time corresponding to the intersection point is the beginning moment of mutation.
In this study, the M–K mutation test method was used to analyze the variation trend and mutation of irrigation water requirements of summer maize and winter wheat in Shandong Province over 49 years.
2.2.3. Spatial Interpolation
Inverse distance weighted (IDW) interpolation is an optimal interpolation method based on the similarity principle. It takes the distance between the interpolation point and the sample point as the weight for the weighted average. The closer the sample point is to the interpolation point, the greater the weight. This method is simple and easy to operate. We used the spatial analysis function of the ArcGIS software (Esri, RedLands, CA, USA) and the IDW method to create the spatial distribution map of the annual average crop water requirements, overall irrigation water requirements, and irrigation water requirements in the growing cycle.
2.2.4. Pearson Correlation Analysis
Pearson correlation analysis is a method to detect whether x and y are correlated and related properties. The size of the correlation coefficient, as well as its sign, represent different correlations. It is calculated as follows:
The value range of the correlation coefficient r is (−1, 1), and when its absolute value is within 0.8–1.0, 0.6–0.8, 0.4–0.6, 0.2–0.4, or 0.0–0.2, it represents a very strong correlation, strong correlation, moderate correlation, weak correlation, or no correlation, respectively.
3. Results
3.1. Calculation of Irrigation Water Requirements
3.1.1. Multi-Year Average Crop Water Requirements
According to Formula (3) for crop water requirements, the multi-year average crop water requirements of summer maize and winter wheat at the 20 meteorological stations in Shandong Province from 1968 to 2016 were calculated. The multi-year average crop water requirement of summer maize was 333.66 mm, and the water requirement of winter wheat was 420.66 mm. Due to the influence of seeding time, growing cycle, meteorological conditions, and crop growth, the summer maize and winter wheat had different water requirements. The multi-year average crop water requirements of summer maize and winter wheat are shown in Table 1 and Table 2.
Table 1 and Table 2 show the multi-year average crop water requirements for summer maize and winter wheat in Shandong Province, respectively. These results suggest that there were obvious differences in the multi-year average crop water requirements of summer maize and winter wheat among the irrigation regions. The order of the multi-year average crop water requirements for summer maize and winter wheat in the irrigation regions were Northern Shandong > Southwestern Shandong > Central Shandong > Eastern Shandong > Southern Shandong and Eastern Shandong > Northern Shandong > Central Shandong > Southern Shandong > Southwestern Shandong, respectively. Among the 20 meteorological stations, the multi-year average crop water requirement value was the highest at Jinan Station, about 12% higher than the average crop water requirement for summer maize and about 18% higher than the average crop water requirement for winter wheat in Shandong Province. Mount Tai station had the lowest multi-year average crop water requirement for summer maize, about 18% lower than the average crop water requirement in Shandong Province. Rizhao station had the lowest multi-year average crop water requirement for winter wheat, with a value about 14% lower than the average crop water requirement for winter wheat in Shandong Province.
3.1.2. Multi-Year Average Irrigation Water Requirements
According to the formulas for crop water requirements and effective rainfall, the multi-year average irrigation water requirements of summer maize and winter wheat at the 20 meteorological stations in Shandong Province during 1968–2016 were calculated. The multi-year average irrigation water requirement for summer maize was 127.99 mm, while the water requirement for winter wheat was 282.44 mm, showing a significant difference between the two crops. The main reason for this phenomenon is that the seeding time of summer maize is mostly concentrated in June, and its growth cycle is from June to September. However, the growth cycle of winter wheat is from October to June of the next year, during which there is less precipitation, which cannot meet the normal growth requirements of winter wheat, and a large amount of irrigation is needed to ensure the proper growth of crops. Therefore, the average irrigation water requirement for winter wheat is higher than summer maize. The multi-year average irrigation water requirements of summer maize and winter wheat irrigation region are shown in Table 3 and Table 4, respectively.
It can be seen, from Table 3 and Table 4, that the multi-year average irrigation water requirements for summer maize and winter wheat differed among the irrigation regions of Shandong Province. The multi-year average irrigation water requirements for summer maize and winter wheat in the irrigation regions were ranked as Northern Shandong> Eastern Shandong > Southwestern Shandong > Southern Shandong > Central Shandong and Northern Shandong > Eastern Shandong > Central Shandong > Southwestern Shandong > Southern Shandong, respectively. Among the 20 meteorological stations, Longkou Station had the highest multi-year average irrigation water requirements, and Mount Tai station had the lowest multi-year average irrigation water requirements for summer maize. Jinan Station had the highest multi-year average irrigation water requirements, and Rizhao station had the smallest multi-year average irrigation water requirements for winter wheat.
3.2. The Temporal Variation Law of Irrigation Water Requirements
3.2.1. Study on Inter-Annual Variation of Irrigation Water Requirements
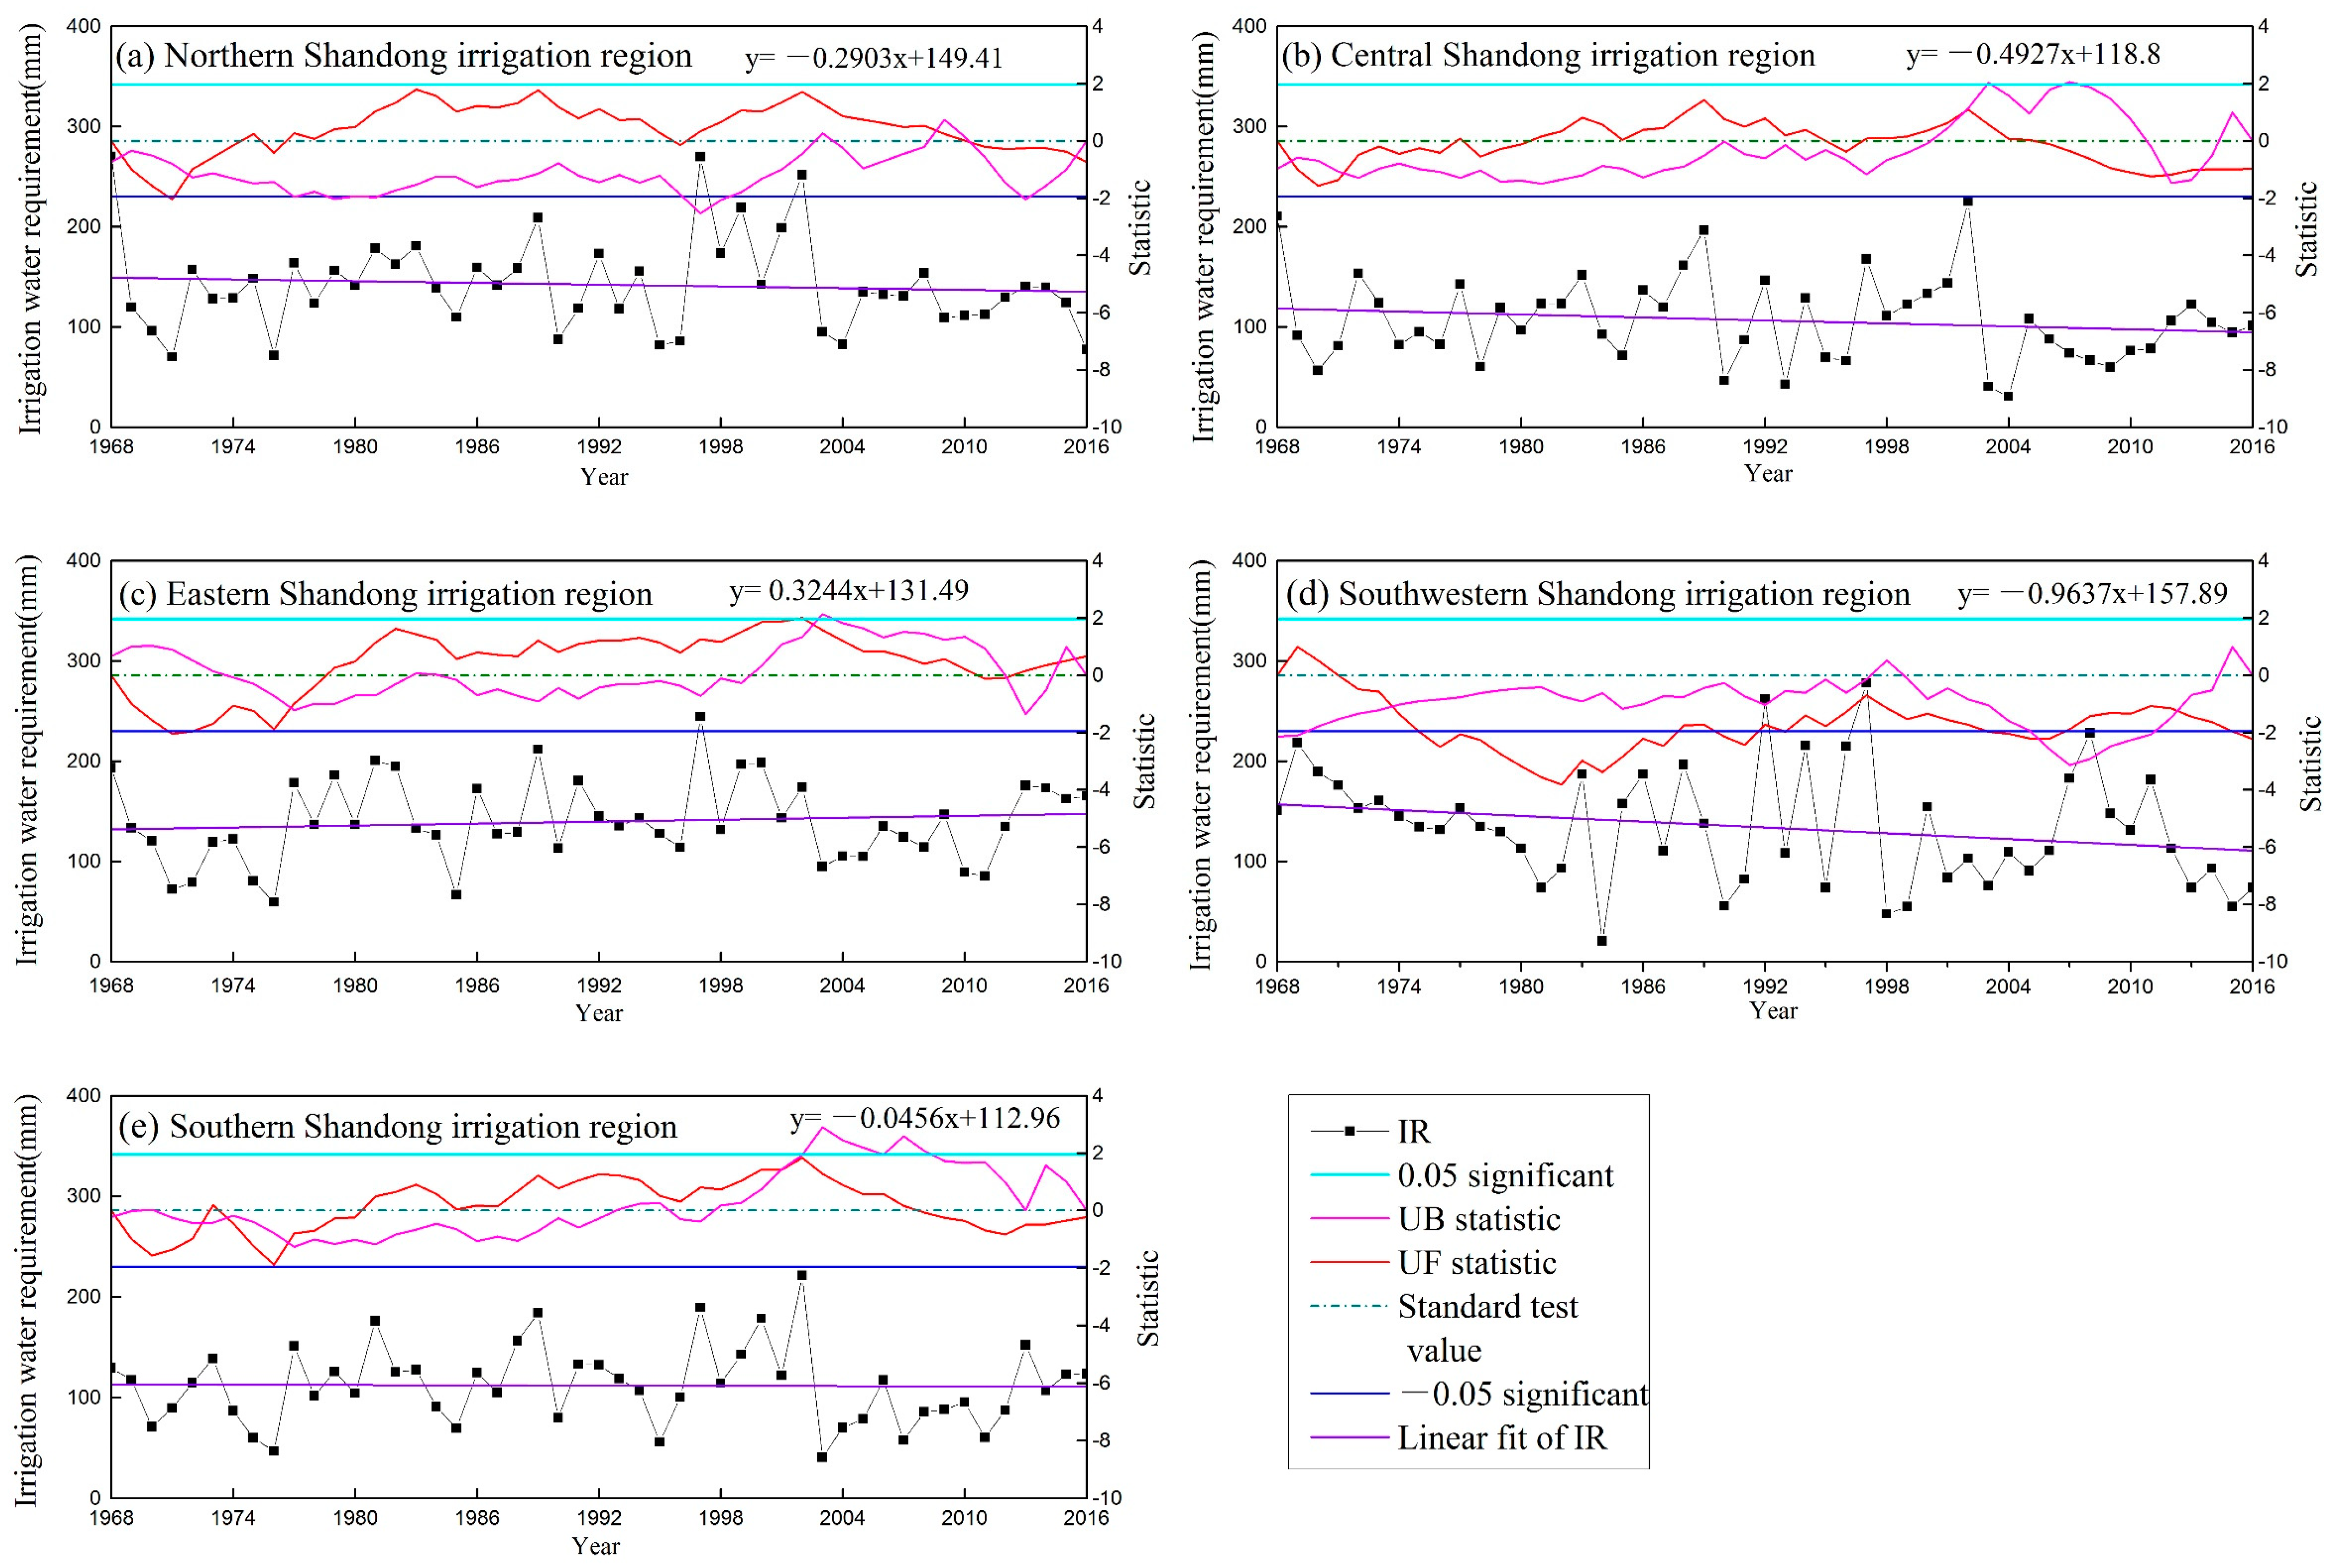
The M–K test method was used to analyze the variation trend and test the mutation of the irrigation water requirements at each meteorological station in each irrigation region. By analyzing the statistical sequences UF (sequential statistical curve), UB (reverse statistical curve), and the critical curve of confidence level 95% Y = 1.96 and Y = −1.96, the variation trends for the irrigation water requirements of summer maize and winter wheat in each irrigation region were further analyzed, and the times at which abrupt changes occurred were determined.
(1) Summer maize irrigation water requirements
The change in summer maize irrigation water requirements in Shandong Province from 1968 to 2016 is shown in Figure 2.
The irrigation water requirements of summer maize in the northern Shandong irrigation region, central Shandong irrigation region, southwestern Shandong irrigation region, and southern Shandong irrigation region fluctuated with time and showed downward trends, with a change tendency rate of −2.9 mm/10a, −4.93 mm/10a, −9.64 mm/10a, and −0.05 mm/10a, respectively. The change of irrigation water requirements for summer maize in the northern Shandong irrigation region after 2010, in the central Shandong irrigation region after 2004, in the central Shandong irrigation region after 2012, in the southwestern Shandong irrigation region after 1992, and in the southern Shandong irrigation region after 2007 did not reach a significant level (α = 0.05). The irrigation water requirement for summer maize in the eastern Shandong irrigation region fluctuated with time and showed an upward trend, with a change tendency rate of 3.24 mm/10a. After 1979, the irrigation water requirement of summer maize in the eastern Shandong irrigation region did not reach a significant level (α = 0.05).
(2) Winter wheat irrigation water requirements
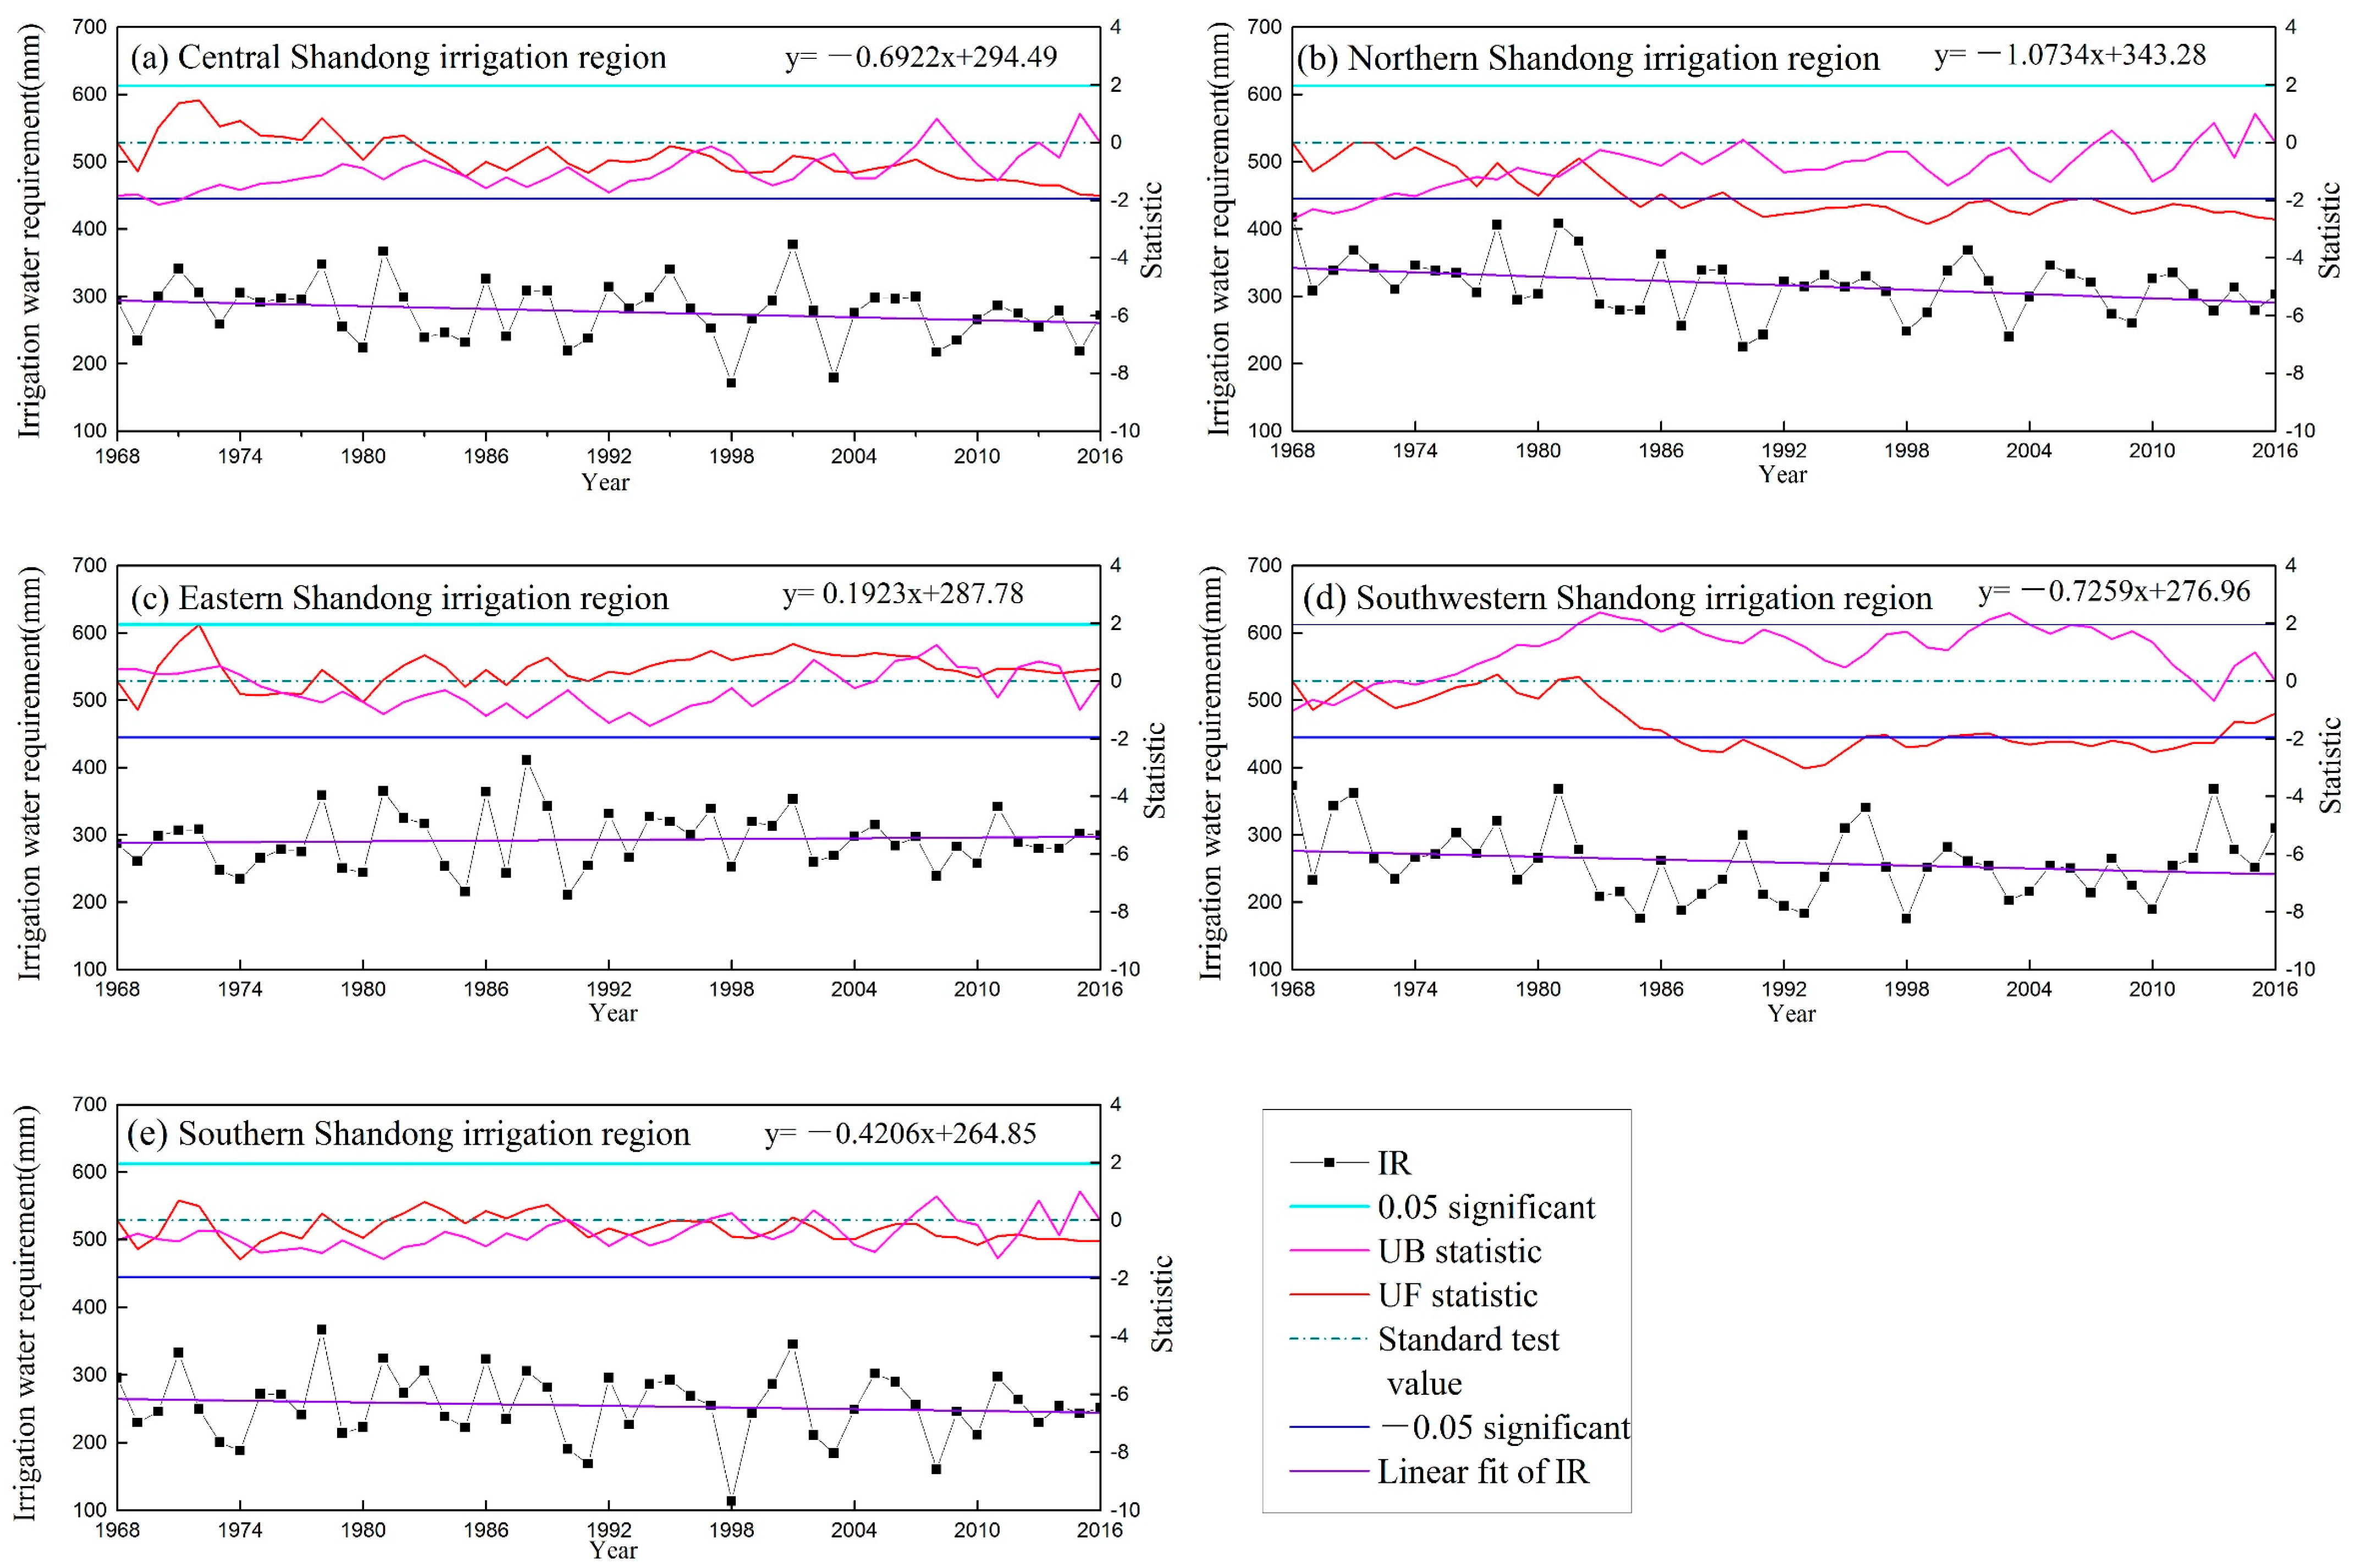
The variation trends of irrigation water requirements for winter wheat in different irrigation regions in Shandong Province from 1968 to 2016 are shown in Figure 3.
The irrigation water requirements for winter wheat in the central and southern Shandong irrigations region fluctuated with time and showed an insignificant downward trend, with change tendency rates of −6.92 mm/10a and −4.21 mm/10a, respectively. The irrigation water requirements for winter wheat in the central Shandong irrigation region after 1982 and in the southern Shandong irrigation region after 1990 did not reach a significant level (α = 0.05). The irrigation water requirements for winter wheat in the northern and southwestern Shandong irrigation regions fluctuated with time and showed an insignificant downward trend, with change tendency rates of −10.73 mm/10a and −7.26 mm/10a, respectively. The irrigation water requirement for winter wheat in the northern Shandong irrigation region showed a significant downward trend since 1982 and reached a significant level in 1989 (α = 0.05). The irrigation water requirement for winter wheat in the southwestern Shandong irrigation region showed a significant downward trend since 1982 and reached a significant level in 1989 (α = 0.05). The position where the UF curve intersects with the UB curve is called a mutation point. The mutation point for the northern Shandong irrigation region was 1982. The irrigation water requirement for winter wheat in the southwestern Shandong irrigation region showed a significant downward trend since 1972 and reached a significant level in 1986 (α = 0.05). The mutation point for the southwestern Shandong irrigation region was 1972. The irrigation water requirement of winter wheat in the eastern Shandong irrigation region showed an upward trend after 1980 but did not reach a significant level (α = 0.05).
3.2.2. Monthly Variation of Irrigation Water Requirements in Growing Season
In this paper, the monthly variations of irrigation water requirements of summer maize and winter wheat from 1968 to 2016 in the irrigation regions of Shandong Province were calculated, providing support for the rational allocation of water resources and sufficient irrigation of summer maize and winter wheat in the critical water requirement period.
(1) Irrigation water requirements of summer maize
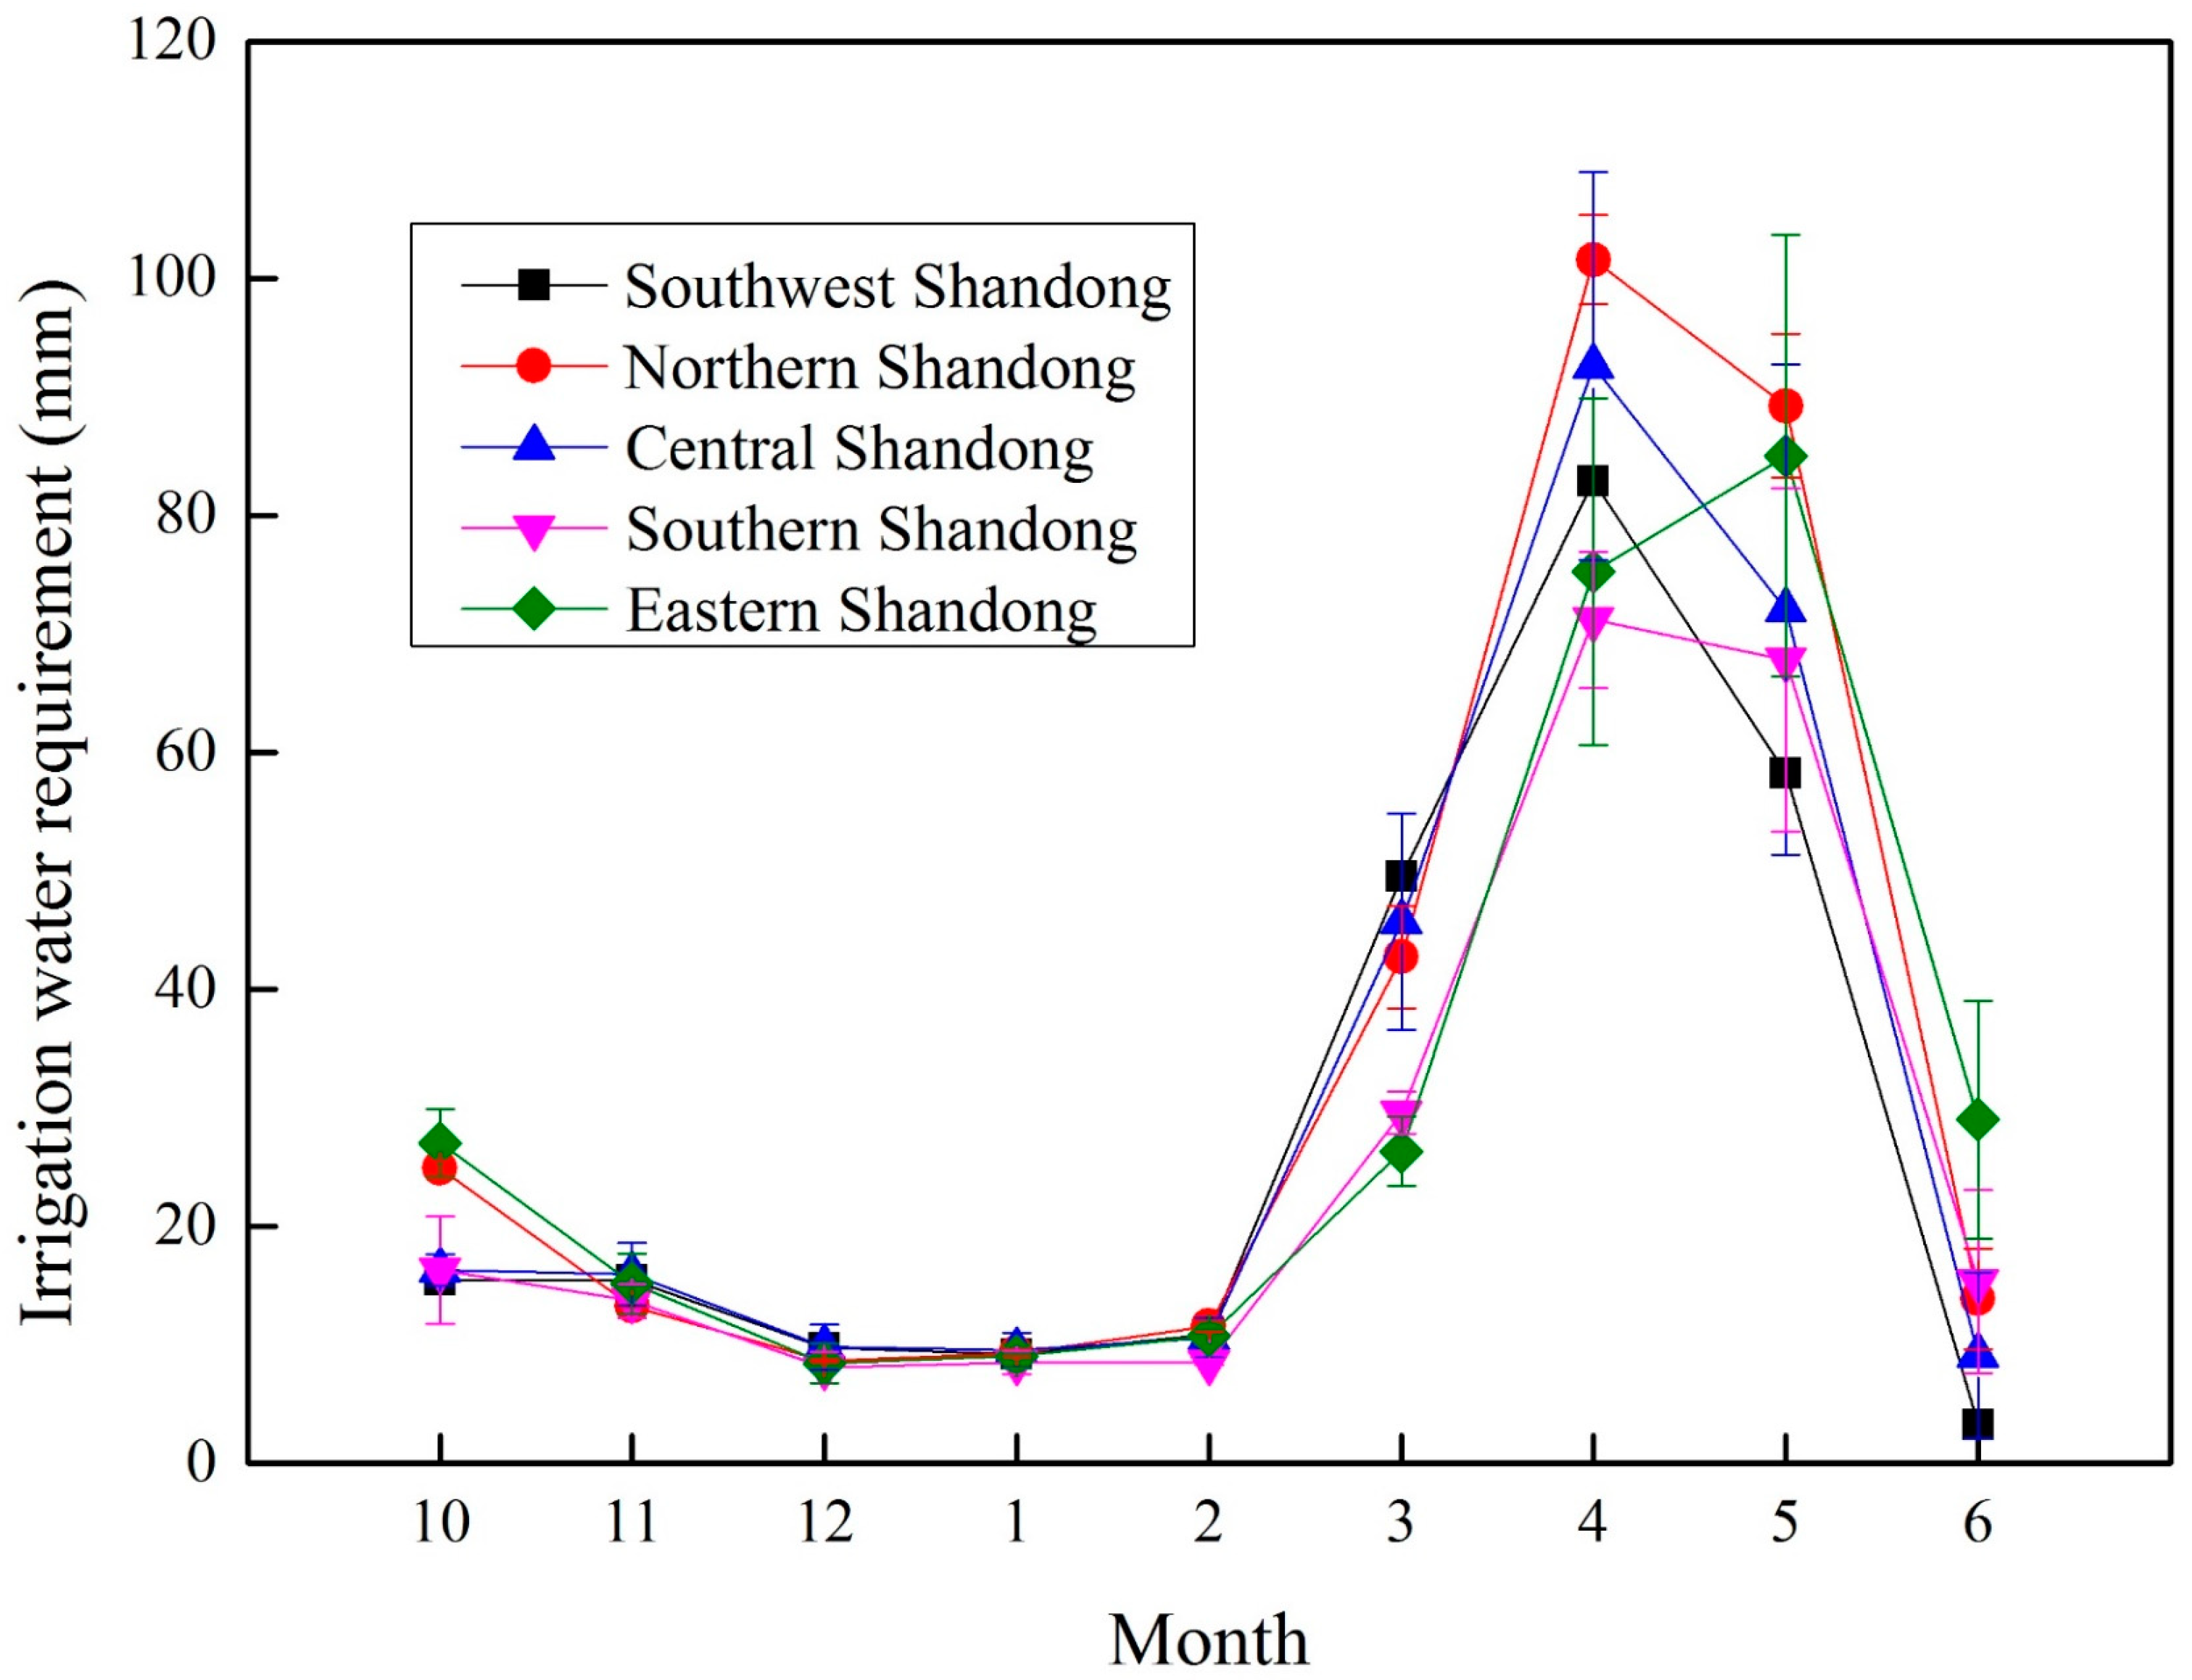
In Shandong Province, summer maize has a short growing season. It is generally sown in June and harvested at the end of September, and the long season is generally four months. The irrigation water requirement for each month in the summer maize growing season over 49 years in each irrigation region of Shandong Province is shown in Figure 4.
It can be seen, from Figure 4, that the monthly average irrigation water requirements in the summer maize growing season for all irrigation regions in Shandong Province show a trend of rising first and then falling, and the distribution is uneven throughout the growing season. The maximum value appears in August, and the minimum value appears in June. The irrigation water requirement for summer maize was the lowest in June in Shandong province, accounting for 14% of the irrigation water requirements over the whole growing cycle. In July, the irrigation water requirements increased to 23%. The irrigation water requirement in August was the maximum over the whole growth cycle, accounting for 39%. The irrigation water requirement of summer maize showed a decreasing trend in September, accounting for 24% of the growing season. This was because July and August are when the heading and filling stage occurs for summer maize in Shandong Province, and the associated crop water requirements are large, making this the key period of crop water requirements. In order to ensure the normal growth of summer maize, it is necessary to increase the irrigation intensity; as such, the irrigation water requirements in July and August account for more than 60% of the requirements for the summer maize growing season. However, June and September are the seedling and mature periods of summer maize, during which the crops need less water, so the irrigation water needs are lower in June and September.
(2) Irrigation water requirements of winter wheat
Winter wheat in Shandong province is usually sown in October and harvested in June, with a nine-month growing cycle. The irrigation water requirements for each month in the winter wheat growing season over 49 years for each irrigation region of Shandong Province are shown in Figure 5.
It can be seen, from Figure 5, that the monthly average irrigation water requirement during the growth cycle of winter wheat in Shandong Province was unevenly distributed, where the overall trend was first decreasing, then increasing and decreasing again. The maximum irrigation water requirement appeared in April of the next year, while the minimum irrigation water requirement appeared in January of the next year. The irrigation water requirement for winter wheat was low in October, accounting for 8% of the whole growing cycle. In November, the irrigation water requirement showed a downward trend, accounting for 5%, and this continued to decline in December, accounting for 3%. January and February of the next year were basically the same as December, maintaining at 3–4%. From December to February, the irrigation water requirements for the whole growth cycle were minimal as, during this period of time, the winter wheat is in the over-wintering stage. Therefore, the winter wheat stops growing, the crop water requirements decrease, and the irrigation water requirements decrease sharply. In March, the temperature in Shandong rises, the wheat resumes normal growth, and the irrigation water requirement shows a rising trend, accounting for 12%. The winter wheat irrigation water requirements in April and May continue to rise to about 29%, being the highest water requirement months over the whole growth period. As April and May are the months in which the booting and earing period occurs, winter wheat growth requires a lot of water. In Shandong, in April and May, temperatures continue to rise, and transpiration and evapotranspiration are significant, such that the irrigation water requirements are increased in these months. The irrigation water requirement of winter wheat in June showed a downward trend, accounting for 8% of the growing period. This is because June was the mature stage of winter wheat, and so, its water requirement was significantly lower than in April and May.
3.3. Spatial Distribution of Irrigation Water Requirements
Due to the different natural conditions, such as rainfall, topography, and meteorology, as well as the different growth characteristics and growth cycles of summer maize and winter wheat, there were some differences in the spatial distribution of irrigation water requirements for summer maize and winter wheat in each irrigation region of Shandong Province.
3.3.1. Spatial Distribution of Multi-Year Average Irrigation Water Requirements of Summer Maize
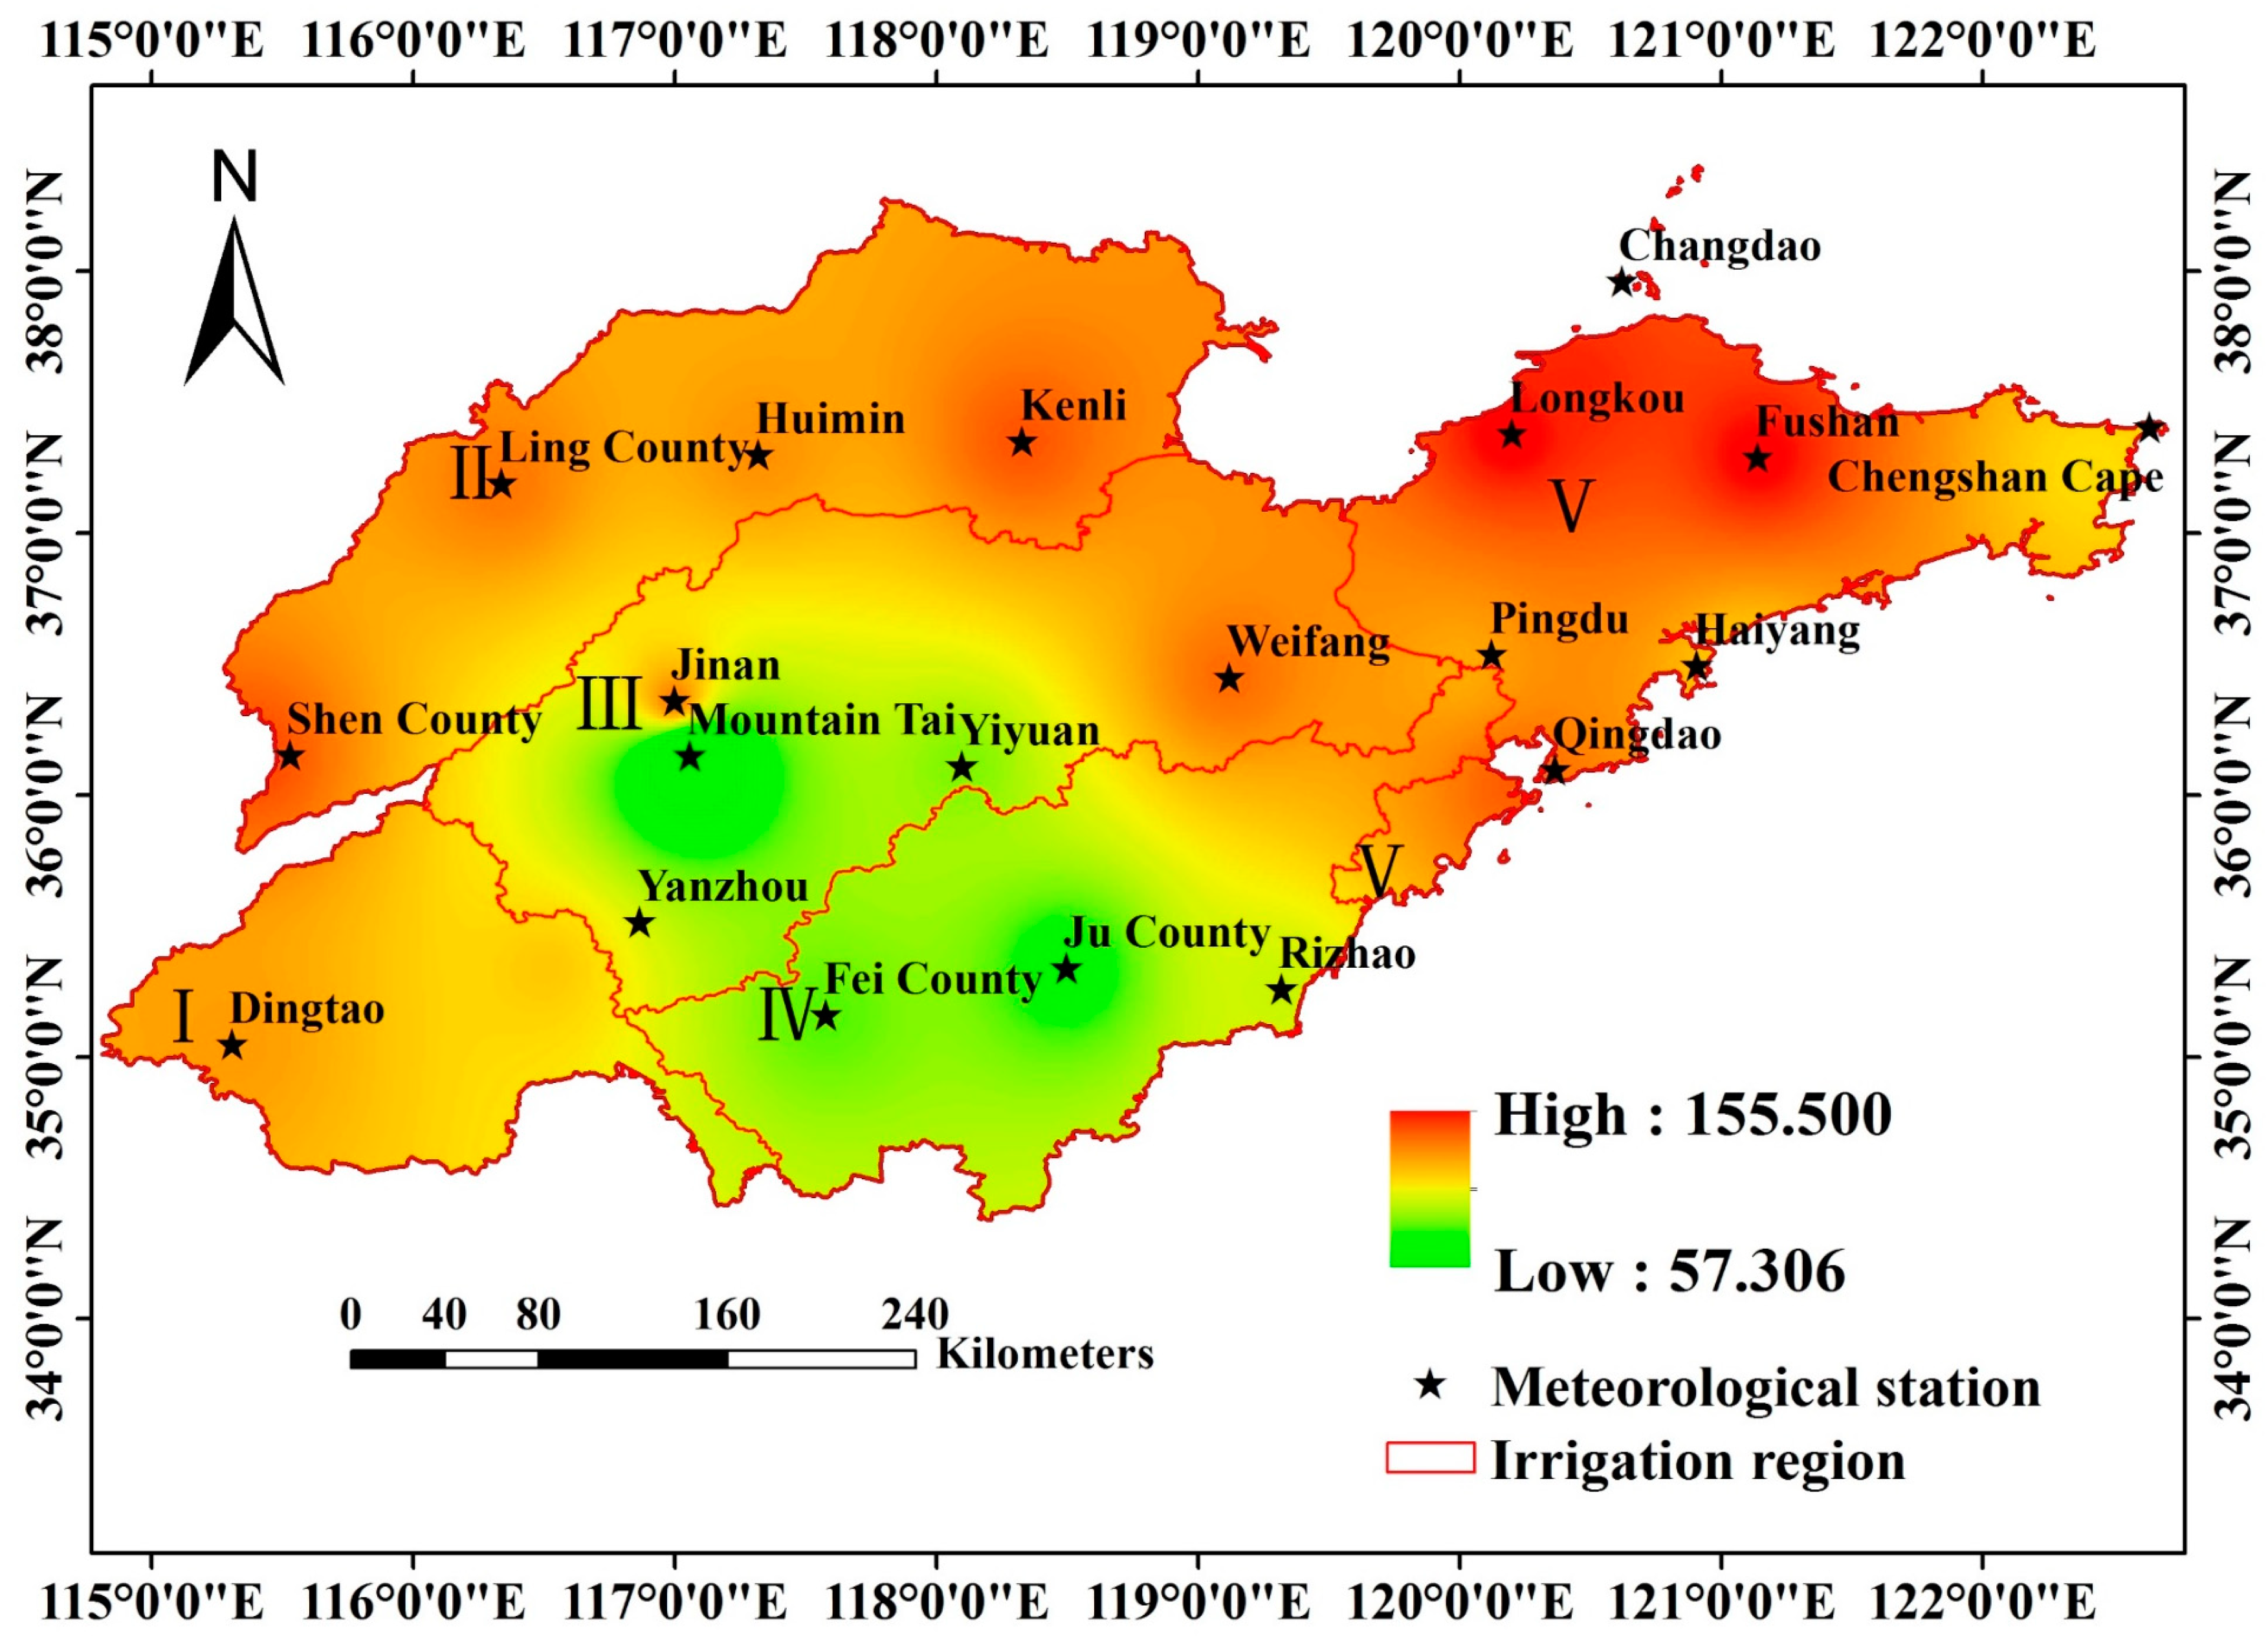
The spatial distribution of the multi-year average irrigation water requirements of summer maize in Shandong Province from 1968 to 2016 is shown in Figure 6 (the spatial resolution of the data is 1695 m × 1695 m). The irrigation water requirements of summer maize in Shandong Province were distributed in a strip pattern, showing a spatial distribution characteristic of less in the southwest (ranging from 92.48–133.79 mm), more in the northeast (ranging from 122.66–155.51 mm), less in the south, and more in the north.
The overall distribution of irrigation water requirements in the northern Shandong irrigation region (II), eastern Shandong irrigation region (V), and southwestern Shandong irrigation region (I) was relatively even. The irrigation water requirements in the southern Shandong irrigation region (IV) and the central Shandong irrigation region (III) showed a trend of gradual increase from west to east. Among the five irrigation districts, the areas with the highest irrigation water requirements were mainly distributed in the eastern Shandong irrigation region (V), while the areas with the lowest irrigation water requirements were mainly distributed in the central Shandong irrigation region (III). The meteorological station with the highest irrigation water requirement was Longkou Station, with a value of 155.51 mm, while the station with the lowest requirement was Mount Tai Station, with a value of 57.18 mm.
3.3.2. Spatial Distribution of Multi-Year Average Irrigation Water Requirements of Winter Wheat
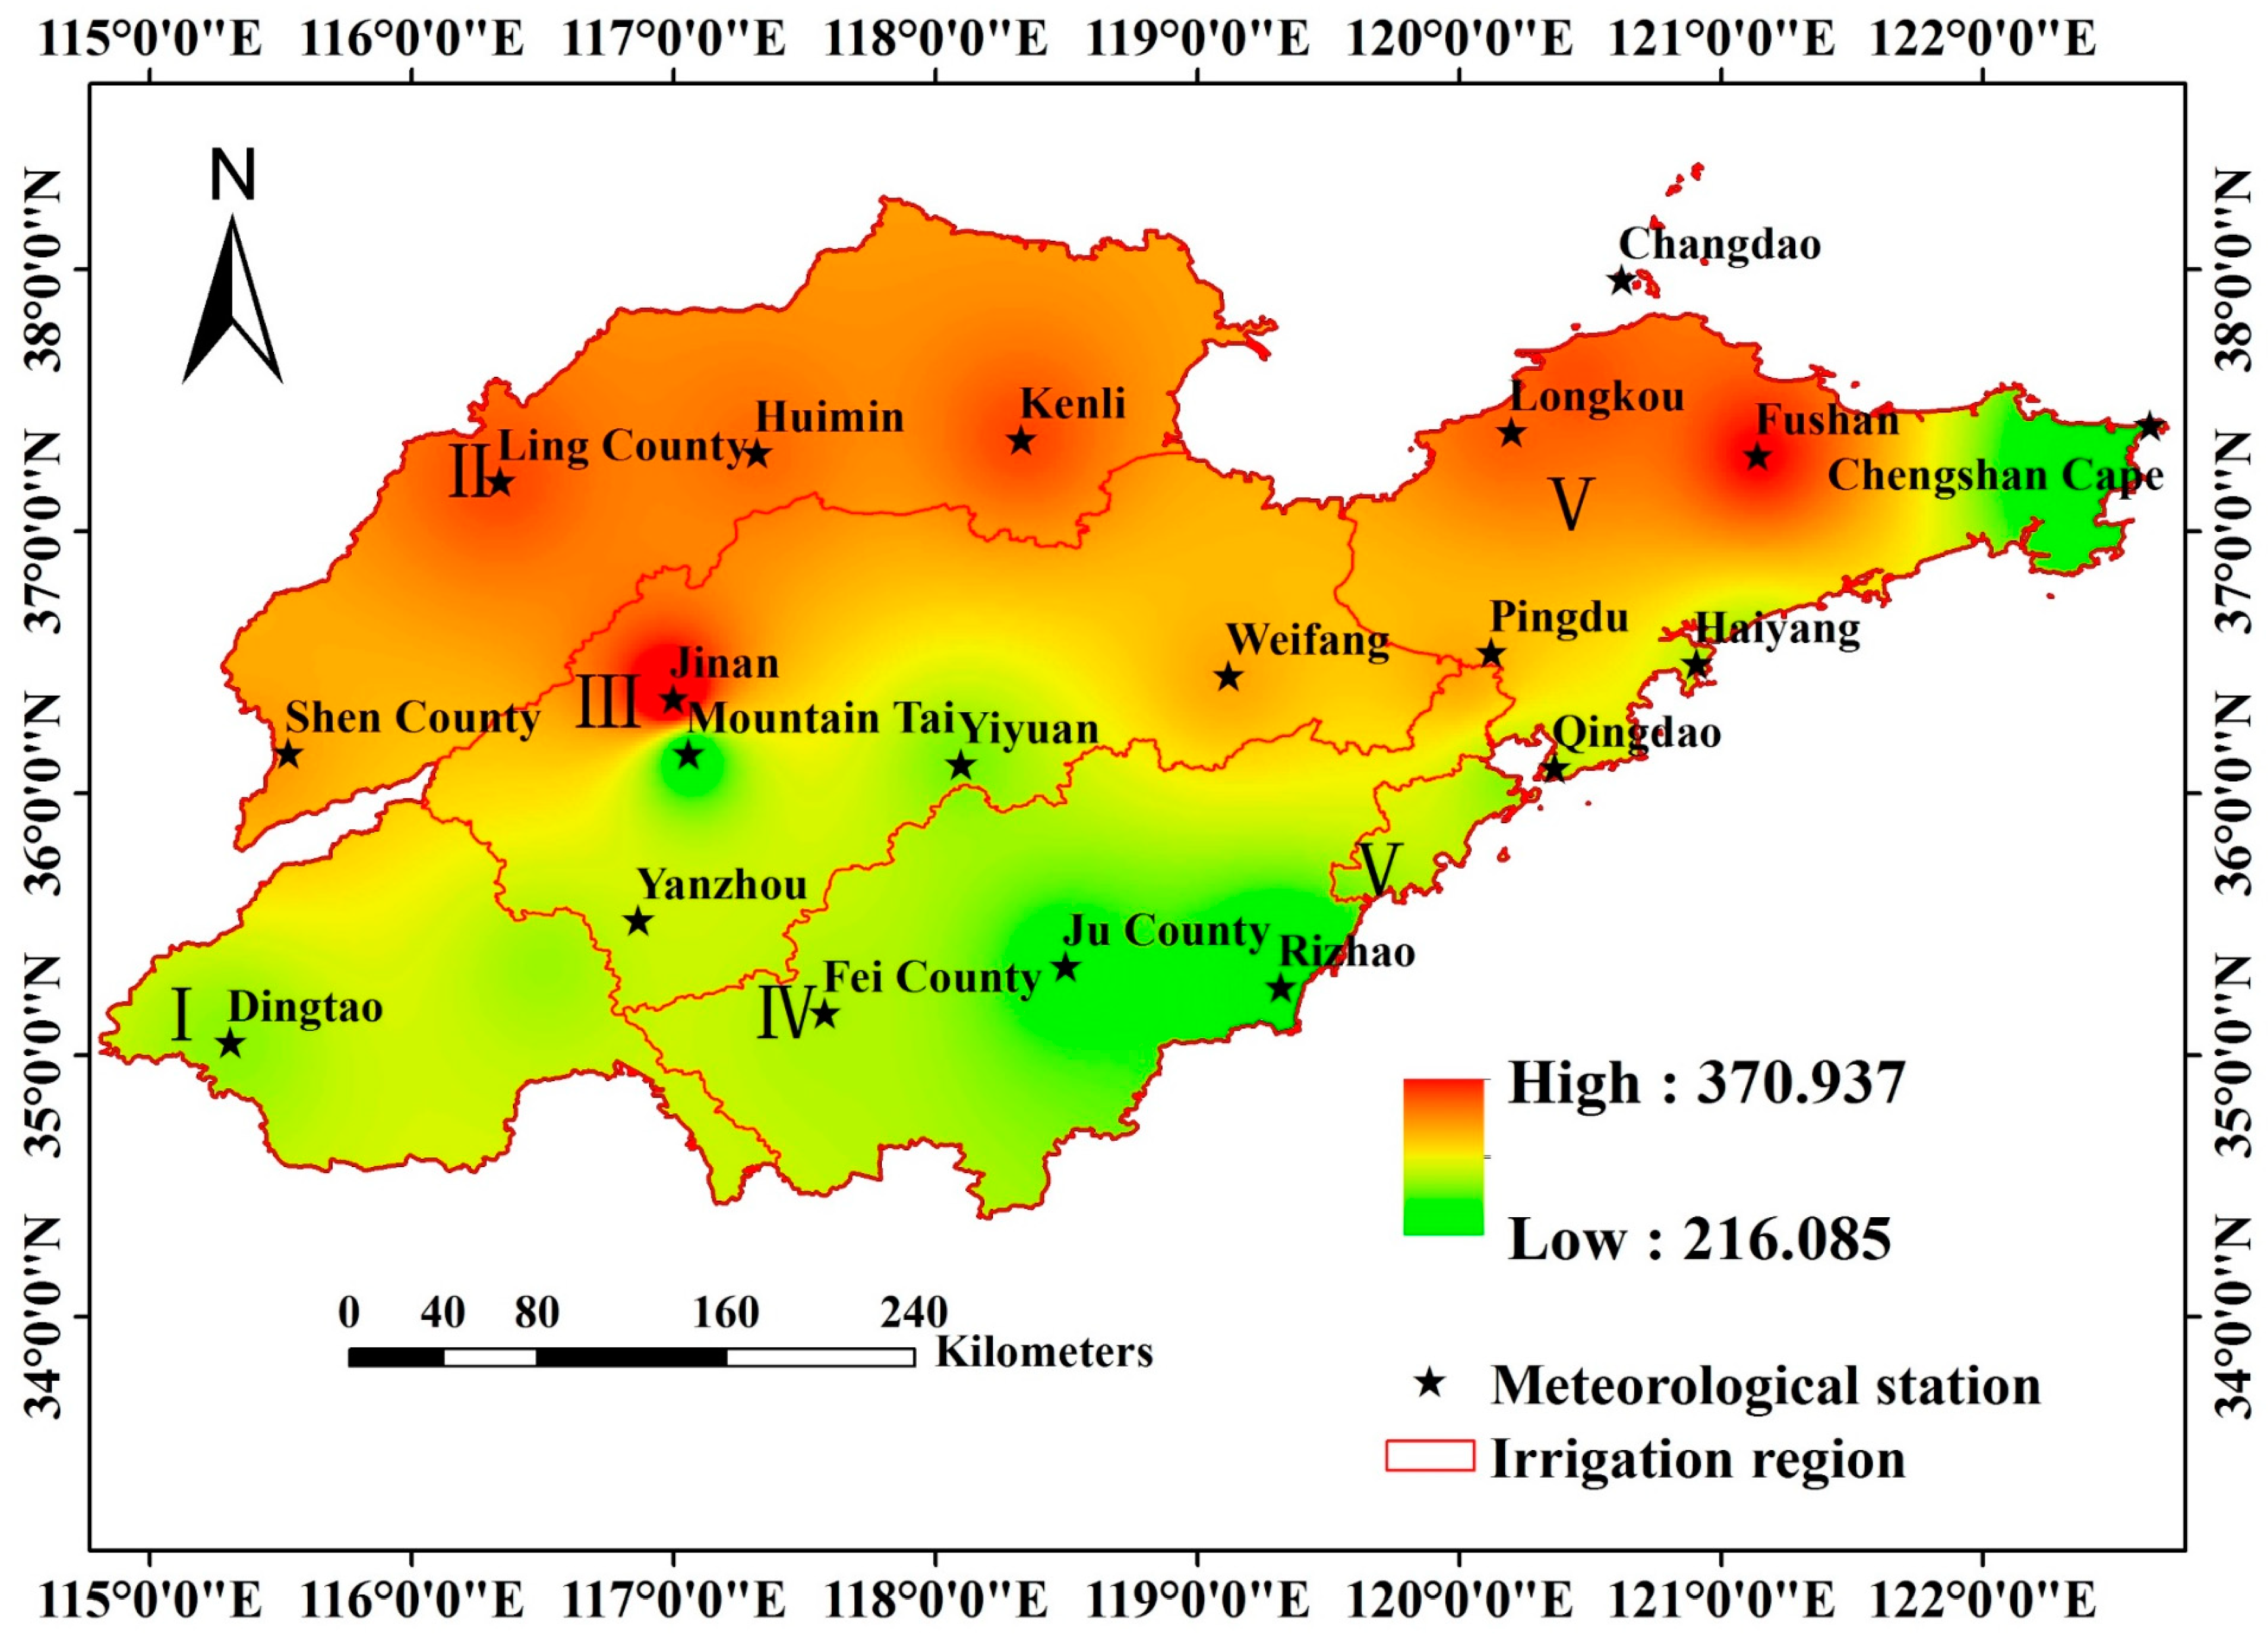
The spatial distribution of the multi-year average irrigation water requirements for winter wheat in Shandong Province from 1968 to 2016 is shown in Figure 7 (the spatial resolution of the data is 1695 m × 1695 m). The irrigation water requirements of winter wheat in Shandong Province showed a zonal distribution, with the spatial distribution characteristics being low in the southeast (ranging from 216.07–299.96 mm), more in the northwest (ranging from 220.41–371.16 mm), less in the south, and more in the north. The overall distribution of irrigation water requirements in the southwestern Shandong irrigation region (I), northern Shandong irrigation region (II), and southern Shandong irrigation region (IV) was relatively even. The irrigation water requirements in the central Shandong irrigation region (III) showed a gradually increasing trend from south to north, while the irrigation water requirements in the eastern Shandong irrigation region (V) showed a trend of gradually decreasing from west to east. Among the five irrigation regions, the area with the largest irrigation water requirements was mainly distributed in the northern Shandong irrigation region (II), and those with the lowest irrigation water requirements were mainly distributed in the central Shandong irrigation region (III). The meteorological station with the highest irrigation water requirement was Jinan Station, with a value of 371.16 mm, while the station with the lowest requirement was Rizhao Station, with a value of 216.07 mm.
3.4. Analysis of Influencing Factors of Irrigation Water Requirements
The irrigation water requirements of summer maize and winter wheat in Shandong province are comprehensively affected by meteorological factors, such as air pressure, temperature, sunshine duration, relative humidity, wind speed, and precipitation. As the factors affecting irrigation water requirements are relatively complex, we adopted Pearson correlation analysis on the basis of previous studies. The correlations between the irrigation water requirements of summer maize and winter wheat and meteorological factors in Shandong province were analyzed in order to clarify the main influencing factors of the irrigation water requirements of summer maize and winter wheat in Shandong Province. The correlation coefficients and significance relative to the relationships between the irrigation water requirements of summer maize and winter wheat, respectively, and meteorological factors are given in Table 5 and Table 6.
3.4.1. Correlation Analysis between Summer Maize Irrigation Water Requirements and Climate Factors
It can be seen, from Table 5, that the main meteorological factors affecting the irrigation water requirements of summer maize in Shandong province were precipitation and sunshine duration. Precipitation was significantly negatively correlated with irrigation water requirements: the greater the precipitation, the smaller the irrigation water requirement. Meanwhile, there was a significant positive correlation between sunshine duration and irrigation water requirements. Average temperature, maximum temperature, and wind speed were positively correlated, while average pressure, minimum temperature, and relative humidity were negatively correlated.
There were also some differences in meteorological factors affecting the irrigation water requirements of summer maize in Shandong Province among the different irrigation regions. The first meteorological factor affecting the irrigation water requirements of summer maize was precipitation, and the second meteorological factor affecting the irrigation water requirements of summer maize was sunshine duration in the eastern Shandong irrigation region, southern Shandong irrigation region, central Shandong irrigation region, and northern Shandong irrigation region. Sunshine duration was the first factor, and precipitation was the second factor affecting the irrigation water requirements of summer maize in the southwestern Shandong irrigation region. The third factor affecting the irrigation water requirements of summer maize was relative humidity in the eastern Shandong irrigation region, central Shandong irrigation region, and southwestern Shandong irrigation region, while the third factor affecting the irrigation water requirements of summer maize was the maximum temperature in the southern Shandong irrigation region and northern Shandong irrigation region. The fourth to eighth factors affecting the irrigation water requirements of summer maize in different irrigation regions had no obvious regularity.
3.4.2. Correlation Analysis between Winter Wheat Irrigation Water Requirements and Climate Factors
It can be seen, from Table 6, that the main meteorological factors affecting the irrigation water requirements of winter wheat in Shandong province were relative humidity and sunshine duration. The relative humidity was negatively correlated with irrigation water requirements: the higher the humidity, the lower the irrigation water requirements. There was a significant positive correlation between sunshine duration and irrigation water requirements. Mean air temperature, maximum air temperature, and wind speed were positively correlated, while average air pressure, minimum air temperature, and precipitation were negatively correlated.
There were also some differences in meteorological factors affecting the irrigation water requirements of winter wheat in Shandong Province among the different irrigation regions. The first meteorological factor affecting the irrigation water requirements of winter wheat was relative humidity, and the second meteorological factor affecting the irrigation water requirements of summer maize was sunshine duration in the southern Shandong irrigation region, central Shandong irrigation region, northern Shandong irrigation region, and southwestern Shandong irrigation region. Sunshine duration is the first factor and relative humidity is the second factor affecting the irrigation water requirements of winter wheat in the southwestern Shandong irrigation region. The third to eighth factors affecting the irrigation water requirements of winter wheat in different irrigation regions showed no obvious regularity.
4. Discussion
In this paper, the crop coefficient method recommended by the FAO was used to calculate the crop water requirements, and the difference between the crop water requirements and effective rainfall was used to calculate the crop irrigation water requirements. The results for the irrigation water requirements of summer maize in Shandong province obtained in this paper were consistent with the spatial distribution characteristics for the irrigation water requirements of major crops in China described by Liu Yu et al. [21]. The irrigation water requirements for winter wheat in Shandong province obtained in this paper were also consistent with the spatial distribution characteristics of irrigation water requirements of main crops in China by Liu Yu et al., and the range and distribution law of irrigation water requirements for winter wheat in Shandong province were consistent with the results of Shuang Sun et al. [21,28].
Compared to the existing research, the values estimated for the middle and late sea-sons of winter wheat were reasonable, and the differences were derived from the length of the initial stages, as winter wheat has an over-wintering period [29]. The multi-year average irrigation water requirement values in this study were 282.44 mm and 127.99 mm for winter wheat and summer maize, respectively. Areas with a large amount of IR are mainly located in northern Shandong [30]. The average annual precipitation in Shandong province generally ranges between 550 and 950 mm, decreasing from the southeast to the northwest. The crop water requirements are high, and lower rainfall leads to large irrigation water requirements in northern Shandong. The irrigation water requirements of summer maize and winter wheat in Shandong province were studied over a large time scale, and we concluded that the annual change in the irrigation water requirements of summer maize and winter wheat in Shandong Province showed no significant downward trend, except for in the eastern Shandong irrigation region. This is consistent with the trend of summer maize and winter wheat irrigation water requirements in the recent 50 years determined based on data from North China by Xiaoying Liu et al. [14]. Meanwhile, the irrigation water requirements of summer maize and winter wheat in the eastern Shandong irrigation region showed an insignificant upward trend; this is because eastern Shandong is more developed than other areas in Shandong province. In recent years, irrigation water requirements have shown an increasing trend, and the increase in irrigation water requirements may be related to the urban heat island effect. Urban high temperatures are caused by a large amount of artificial heat, high heat storage (due to, e.g., buildings and roads), and the reduction of green spaces. The weather stations in the eastern Shandong irrigation region are national standard weather stations. With the accelerating urbanization process, the locations of these weather stations have become urban areas. Therefore, the irrigation water requirements may have been affected by the urban heat island effect.
The agriculture industry is vulnerable to the effects of climate change [31,32]. Irrigation water requirements are affected by complex factors [33]. In this study, we considered the meteorological factors influencing irrigation water requirements throughout the growth cycle of summer maize. Effective precipitation was observed to be the most important indicator affecting irrigation water requirements during the growth period. Precipitation is the main influencing factor determining regional humidity and is also an important source of farmland water, thus affecting crop irrigation water requirements by changing soil dry and wet conditions. Throughout the whole province, there was a negative correlation between the summer maize irrigation water requirements and precipitation—that is, there was a decreasing trend with the increase of precipitation—and the differences between regions were small, with the correlation coefficient ranging from −0.528 to −0.691. Precipitation showed a very significant negative correlation with irrigation water requirements and was the main meteorological factor affecting the irrigation water requirements of summer maize in all irrigation regions (except for southwest Shandong province), the second being sunshine duration.
The results indicated that relative humidity was the main meteorological factor affecting the irrigation water requirements of winter wheat in Shandong province, with the second being sunshine hours. The correlations of relative humidity and sunshine time with winter wheat irrigation requirements were extremely significant, and the average correlation coefficients were 0.546 and 0.427, respectively. Relative humidity and the irrigation water requirements were negatively correlated, while sunshine time and irrigation water were positively correlated. These trends were evident in the Penman–Monteith analysis. Estimating the irrigation water requirements during the growth period of wheat is conducive to the adoption of targeted measures to effectively respond to climate change and increase wheat production. Thus, water could be supplemented in a timely manner during the critical water requirement period, improving water use efficiency and crop yield [33].
5. Conclusions
Based on daily meteorological data of 20 meteorological stations in Shandong Province from 1968 to 2016, we analyzed the trends in the multi-year average irrigation water requirements for summer maize and winter wheat over time and the associated spatial distribution pattern. The following conclusions were obtained:
- (1)
- There were obvious differences in the change trends of the annual irrigation water requirements for both summer maize and winter wheat in the various irrigation regions of Shandong Province. The annual irrigation water requirements of summer maize and winter wheat in the eastern Shandong irrigation regions showed overall insignificant upward trends, the annual irrigation water requirements of winter wheat in northern Shandong and southwestern Shandong irrigation regions showed significant downward trends, while the annual irrigation water requirements of summer maize and winter wheat in other irrigation regions showed overall insignificant downward trends;
- (2)
- The multi-year average irrigation water requirements of summer maize in the irrigation regions of Shandong Province increased first and then decreased, with the maximum value appearing in August. The multi-year average irrigation water requirements of winter wheat first decreased, then increased and decreased again. The maximum value appeared in April of the following year. This characteristic may lead to a higher risk of water scarcity in August for summer maize and in April of the following year for winter wheat in Shandong Province;
- (3)
- The multi-year average irrigation water requirements of summer maize and winter wheat in Shandong Province both presented zonal distributions. The spatial distribution of multi-year average irrigation water requirements for summer maize was less in the southwest, more in the northeast, less in the south, and more in the north. The multi-year average irrigation water requirements for winter wheat presented the spatial distribution characteristics of being less in the southeast, more in the northwest, less in the south, and more in the north;
- (4)
- Precipitation and sunshine duration were the two most important meteorological factors affecting the irrigation water requirements of summer maize in Shandong province, while the main meteorological factors affecting the irrigation water requirements of winter wheat were relative humidity and sunshine duration. Rational utilization of groundwater resources and South-to-North water transfer is recommended in order to deal with extreme weather and to achieve the rational allocation of water resources in Shandong province.
Author Contributions
Conceptualization, Q.Z. and F.L.; methodology, P.Z. and W.M.; software, L.H.; investigation, P.Z. and Q.Z.; data curation, P.Z. and W.M.; writing—original draft preparation, P.Z., Q.Z. and F.L.; writing—review and editing, P.Z. and Q.Z.; funding acquisition, L.H. and W.M. All authors have read and agreed to the published version of the manuscript.
Funding
This research was funded by the Major Science and Technology Innovation Major Project of Shandong Province (2019JZZY010727; 2019JZZY010710); National Natural Science Foundation of China (51909151), and Water Conservancy Scientific Research and Technology Promotion Project of Shandong Province (SDSLKY201708).
Institutional Review Board Statement
Not applicable.
Data Availability Statement
The data presented in this study are available on request from the corresponding author.
Conflicts of Interest
The authors declare no conflict of interest.
Appendix A

Table A1.
Crop coefficients of summer maize as day of the year.
| Irrigation Regions | Weather Station | Plant Date | The End Date of the First Trimester of Childbearing | Starting Date of Critical Childbearing Period | End Date of Critical Childbearing Period | Harvest Date | Initial KC | Medium Term KC | Telophase KC |
|---|---|---|---|---|---|---|---|---|---|
| Southwestern Shandong | Dingtao | 162 | 181 | 202 | 241 | 261 | 0.55 | 1.13 | 0.56 |
| Northern Shandong | Huimin | 163 | 182 | 203 | 242 | 263 | 0.56 | 1.14 | 0.57 |
| Ling County | 165 | 185 | 206 | 244 | 266 | 0.53 | 1.12 | 0.55 | |
| Kenli | 164 | 183 | 204 | 243 | 265 | 0.55 | 1.14 | 0.56 | |
| Shen County | 165 | 185 | 205 | 245 | 266 | 0.54 | 1.13 | 0.55 | |
| Central Shandong | Yanzhou | 162 | 181 | 202 | 241 | 261 | 0.55 | 1.13 | 0.56 |
| Jinan | 164 | 184 | 204 | 244 | 263 | 0.56 | 1.14 | 0.57 | |
| Mount Tai | 165 | 184 | 205 | 244 | 264 | 0.5 | 1.2 | 0.65 | |
| Yiyuan | 163 | 184 | 203 | 245 | 263 | 0.55 | 1.13 | 0.56 | |
| Weifang | 172 | 189 | 209 | 248 | 266 | 0.66 | 1.15 | 0.59 | |
| Southern Shandong | Rizhao | 171 | 190 | 209 | 249 | 265 | 0.65 | 1.16 | 0.58 |
| Ju County | 172 | 192 | 211 | 247 | 265 | 0.67 | 1.15 | 0.59 | |
| Fei County | 170 | 190 | 210 | 248 | 262 | 0.66 | 1.17 | 0.57 | |
| Eastern Shandong | Chengshan Cape | 172 | 193 | 212 | 249 | 268 | 0.68 | 1.16 | 0.56 |
| Haiyang | 174 | 195 | 215 | 251 | 270 | 0.67 | 1.15 | 0.58 | |
| Longkou | 173 | 194 | 214 | 250 | 269 | 0.69 | 1.17 | 0.59 | |
| Fushan | 172 | 193 | 212 | 249 | 270 | 0.66 | 1.15 | 0.55 | |
| Pingdu | 174 | 195 | 215 | 250 | 268 | 0.67 | 1.16 | 0.56 | |
| Qingdao | 173 | 193 | 213 | 249 | 269 | 0.68 | 1.16 | 0.57 | |
| Changdao | 172 | 194 | 212 | 248 | 268 | 0.69 | 1.17 | 0.58 |
Table A2.
Crop coefficients of winter wheat as day of year.
| Irrigation Regions | Weather Station | Beginning Date of Initial Growth Period | End Date of Initial Growth Period | Beginning Date of Overwintering | End Date of Overwintering Period | Beginning Date of Mid-Term Fertility | Mid-Term Termination Date | Harvest Date | Initial KC | Overwintering KC | Medium Term KC | Telophase KC |
|---|---|---|---|---|---|---|---|---|---|---|---|---|
| Southwestern Shandong | Dingtao | 282 | 314 | 355 | 421 | 452 | 480 | 521 | 0.6 | 0.4 | 1.15 | 0.4 |
| Northern Shandong | Huimin | 269 | 294 | 333 | 427 | 460 | 486 | 523 | 0.6 | 0.4 | 1.15 | 0.4 |
| Ling County | 271 | 295 | 335 | 429 | 463 | 488 | 526 | 0.6 | 0.4 | 1.16 | 0.4 | |
| Kenli | 274 | 297 | 338 | 432 | 464 | 490 | 528 | 0.6 | 0.4 | 1.16 | 0.4 | |
| Shen County | 273 | 295 | 337 | 432 | 465 | 491 | 529 | 0.6 | 0.4 | 1.17 | 0.4 | |
| Central Shandong | Yanzhou | 282 | 314 | 355 | 421 | 452 | 480 | 521 | 0.6 | 0.4 | 1.18 | 0.4 |
| Jinan | 286 | 305 | 350 | 423 | 467 | 489 | 526 | 0.6 | 0.4 | 1.17 | 0.4 | |
| Mount Tai | 283 | 301 | 347 | 425 | 463 | 486 | 524 | 0.6 | 0.4 | 1.16 | 0.4 | |
| Yiyuan | 281 | 312 | 354 | 419 | 450 | 477 | 520 | 0.6 | 0.4 | 1.15 | 0.4 | |
| Weifang | 283 | 302 | 347 | 429 | 470 | 490 | 531 | 0.6 | 0.4 | 1.16 | 0.4 | |
| Southern Shandong | Rizhao | 288 | 307 | 350 | 432 | 474 | 494 | 535 | 0.6 | 0.4 | 1.18 | 0.4 |
| Ju County | 285 | 305 | 349 | 431 | 472 | 493 | 534 | 0.6 | 0.4 | 1.18 | 0.4 | |
| Fei County | 284 | 305 | 349 | 433 | 475 | 492 | 536 | 0.6 | 0.4 | 1.18 | 0.4 | |
| Eastern Shandong | Chengshan Cape | 270 | 293 | 344 | 435 | 472 | 494 | 536 | 0.6 | 0.4 | 1.17 | 0.4 |
| Haiyang | 268 | 291 | 341 | 432 | 469 | 492 | 532 | 0.6 | 0.4 | 1.18 | 0.4 | |
| Longkou | 271 | 294 | 345 | 435 | 472 | 496 | 537 | 0.6 | 0.4 | 1.19 | 0.4 | |
| Fushan | 274 | 296 | 348 | 439 | 475 | 500 | 540 | 0.6 | 0.4 | 1.19 | 0.4 | |
| Pingdu | 276 | 298 | 351 | 439 | 476 | 501 | 542 | 0.6 | 0.4 | 1.19 | 0.4 | |
| Qingdao | 273 | 295 | 349 | 436 | 472 | 497 | 538 | 0.6 | 0.4 | 1.18 | 0.4 | |
| Changdao | 276 | 297 | 350 | 437 | 474 | 500 | 541 | 0.6 | 0.4 | 1.19 | 0.4 |
References
- Kang, S.; Hao, X.; Du, T.; Tong, L.; Su, X.; Lu, H.; Li, X.; Huo, Z.; Li, S.; Ding, R. Improving agricultural water productivity to ensure food security in China under changing environment: From research to practice. Agric. Water Manag. 2017, 179, 5–17. [Google Scholar] [CrossRef]
- De Fraiture, C.; Wichelns, D. Satisfying future water demands for agriculture. Agric. Water Manag. 2010, 97, 502–511. [Google Scholar] [CrossRef]
- Pereira, L.S.; Cordery, I.; Iacovides, I. Improved indicators of water use performance and productivity for sustainable water conservation and saving. Agric. Water Manag. 2012, 108, 39–51. [Google Scholar] [CrossRef]
- Juan, X. Responses of Agriculture Water Resources Supply and Demand Balance to Environment Change in Shiyang River Basin. Master’s Thesis, Northwest A&F University, Yangling, China, 2017. [Google Scholar]
- Bingzhong, L.; Congqi, Z.; Xiaona, G. Analysis on monitoring and statistics of agricultural irrigation water consumption in Shandong Province. Shandong Prov. Water Conserv. 2019, 11, 8–9. [Google Scholar]
- Zhu, X.F.; Zhao, A.Z.; Li, Y.Z.; Liu, X.F. Agricultural irrigation requirements under future climate scenarios in China. J. Arid Land 2019, 7, 224–237. [Google Scholar] [CrossRef] [Green Version]
- Ding, Y.; Wang, W.; Song, R.; Shao, Q.; Jiao, X.; Xing, W. Modeling spatial and temporal variability of the impact of climate change on rice irrigation water requirements in the middle and lower reaches of the Yangtze River, China. Agric. Water Manag. 2007, 193, 89–101. [Google Scholar] [CrossRef]
- Allen, R.G.; Pereira, L.S.; Raes, D.; Smith, M. Crop Evapotranspiration. Guideline for Computing Crops Water Requirements; FAO Irrigation and Drainage: Rome, Italy, 1998; p. 56. [Google Scholar]
- Berengena, J.; Gavilán, P. Reference evapotranspiration estimation in a highly advective semiarid environment. J. Irrig. Drain. Eng. 2005, 131, 147–163. [Google Scholar] [CrossRef]
- Cai, J.B.; Liu, Y.; Lei, T.; Pereira, L.S. Estimating reference evapotranspiration with the FAO Penman-Monteith equation using daily weather forecast messages. Agric. For. Meteorol. 2007, 145, 22–35. [Google Scholar] [CrossRef]
- Gavilán, P.; Lorite, I.J.; Tornero, S.; Berengena, J. Regional calibration of Hargreaves equation for estimating reference ET in a semiarid environment. Agric. Water Manag. 2006, 81, 257–281. [Google Scholar] [CrossRef]
- Jabloun, M.; Sahli, A. Evaluation of FAO-56 methodology for estimating reference evapotranspiration using limited climatic data application to Tunisia. Agric. Water Manag. 2008, 95, 707–715. [Google Scholar] [CrossRef]
- Jingsheng, S. Study on Water-Saving Mechanism and Calculating Methods of Crop Water Requirement in Controlled Alternative Furrow Irrigation. Ph.D. Thesis, Northwest A&F University, Shanxi, China, 2002. [Google Scholar]
- Xiaoying, L.; Yuzhong, L.; Weiping, H. Trend and causes of water requirement of main crops in North China in recent 50 years. Trans. CSAE 2005, 21, 155–159. [Google Scholar]
- Hu, W.; Yan, C.R.; Li, Y.C.; Liu, Q. Impacts of climate change on winter wheat growing period and irrigation water requirements in the north china plain. Acta Ecol. Sin. 2014, 34, 2367–2377. [Google Scholar]
- Ma, L.; Yang, Y.M.; Yang, Y.H.; Xiao, D.P.; Bi, S.J. The distribution and driving factors of irrigation water requirements in the North China Plain. J. Remote Sens. 2011, 15, 324–339. [Google Scholar]
- Chunqiang, L.; Baoguo, L.; Keqin, H. Trend of crop water requirement in recent 35 years in Hebei Province. Chin. J. Eco-Agric. 2009, 17, 359–363. [Google Scholar]
- Fu, N.; Liu, X.G.; Zhang, Y.; Yang, Q.L. Variation pattern of rice irrigation water requirement in Southwest of China. Chin. J. Ecol. 2014, 33, 1895–1901. [Google Scholar]
- Hongjun, L.; Shanshan, Q.; Hongwei, P.; Chongju, S. Temporal and spatial distribution of agricultural irrigation water requirement and irrigation requirement index in Guizhou Province. Trans. CSAE 2016, 32, 115–121. [Google Scholar]
- Wei-min, C.; Ni, S.; Xiao-jun, S.; Yue-ping, L.; Zhong-dong, H.; Hui-feng, N.; Xin-guo, C. Comparative Analysis of Different Reference Evapotranspiration Methods for Different Climatic Zones of China. Water Sav. Irrig. 2018, 8, 75–80. [Google Scholar]
- Liu, Y.; Wang, L.; Ni, G.; Cong, Z. Spatial distribution characteristics of irrigation water requirement for main crops in China. Trans. CSAE 2009, 25, 6–12. [Google Scholar]
- Allen, R.G.; Smith, M.; Perrier, A.; Pereira, L.S. An update for the definition of reference evapotranspiration. ICID Bull. 1994, 43, 1–34. [Google Scholar]
- Smith, M. CROPWAT: A Computer Program for Irrigation Planning and Management; FAO Irrigation and Drainage Paper No. 46; FAO: Rome, Italy, 1992. [Google Scholar]
- Shi, J.; Wang, Z.; Zhang, Z.; Fei, Y.; Li, Y.; Zhang, F.; Chen, J.; Qian, Y. Assessment of deep groundwater over-exploitation in the North China Plain. Geosci. Front. 2011, 2, 593–598. [Google Scholar] [CrossRef]
- Liu, Y.; Teixeira, J.L.; Zhang, H.J.; Pereira, L.S. Model validation and crop coefficients for irrigation scheduling in the North China Plain. Agric. Water Manag. 1998, 36, 233–246. [Google Scholar] [CrossRef]
- Ying, Z.; Shan, Y.; Jing, H.; Bin, X. Analysis of precipitation in Yibin city based on M-K test and R/S method. J. Sichuan Norm. Univ. 2017, 40, 392–397. [Google Scholar]
- Yi, L.; Mudan, Z. Variation trends in water requirement of cotton and sugar beet in Xinjiang under climate change scenarios. Trans. CSAE 2015, 31, 121–128. [Google Scholar]
- Sun, S.; Yang, X.; Li, K.N.; Zhao, J.; Ye, Q.; Xie, W.; Chaoyang, D.; Liu, H. Analysis of spatial and temporal characteristics of water requirement of winter wheat in China. Trans. CSAE 2013, 29, 72–82. [Google Scholar]
- Liu, C.; Zhang, X.; Zhang, Y. Determination of daily evaporation and evapotranspiration of winter wheat and maize by large-scale weighing lysimeter and microlysimeter. Agric. For. Meteorol. 2002, 111, 109–120. [Google Scholar] [CrossRef]
- Wu, D.; Fang, S.B.; Li, X.; He, D.; Zhu, Y.C.; Yang, Z.Q.; Xu, J.X.; Wu, Y.J. Spatial-temporal variation in irrigation water requirement for the winter wheat-summer maize rotation system since the 1980s on the North China Plain. Agric. Water Manag. 2019, 214, 78–86. [Google Scholar] [CrossRef]
- Sun, S.; Wu, P.; Wang, Y.; Zhao, X.; Liu, J.; Zhang, X. The impacts of interannual climate variability and agricultural inputs on water footprint of crop production in an irrigation district of China. Total Environ. 2013, 444, 498–507. [Google Scholar] [CrossRef]
- Liu, J.; Folberth, C.; Yang, H.; Rockstrom, J.; Abbaspour, K.; Zehnder, A.J.B. A global and spatially explicit assessment of climate change impacts on crop production and consumptive water use. PLoS ONE 2013, 8, 1–13. [Google Scholar] [CrossRef] [Green Version]
- Xu, C.; Lu, C.; Sun, Q. Impact of climate change on irrigation water requirement of wheat growth—A case study of the Beijing-Tianjin-Hebei region in China. Urban Clim. 2021, 39, 100971. [Google Scholar] [CrossRef]
Figure 1.
The distribution of meteorological stations in the irrigation regions of Shandong Province.
Figure 1.
The distribution of meteorological stations in the irrigation regions of Shandong Province.

Figure 2.
Variation trends of summer maize irrigation water requirements in different irrigation regions over the past 49 years. Note: (a–e) show the variation trends of summer maize irrigation water requirements in the northern Shandong irrigation region, central Shandong irrigation region, eastern Shandong irrigation region, southwestern Shandong irrigation region, and southern Shandong irrigation region, respectively.

Figure 3.
Variation trends of irrigation water requirements for winter wheat in different irrigation regions over the past 49 years. Note: (a–e) show the variation trends of winter wheat irrigation water requirements in the central Shandong irrigation region, northern Shandong irrigation region, eastern Shandong irrigation region, southwestern Shandong irrigation region, and southern Shandong irrigation region, respectively.

Figure 4.
Irrigation water requirements in the summer maize growth period. Note: The error bars are standard deviations, and the values are monthly averages.
Figure 4.
Irrigation water requirements in the summer maize growth period. Note: The error bars are standard deviations, and the values are monthly averages.

Figure 5.
Irrigation water requirements for winter wheat over its growth period. Note: The error bars are standard deviations, and the values are monthly averages.
Figure 5.
Irrigation water requirements for winter wheat over its growth period. Note: The error bars are standard deviations, and the values are monthly averages.

Figure 6.
Spatial distribution of annual average irrigation water requirements of summer maize.

Figure 7.
Spatial distribution of annual average irrigation water requirements of winter wheat.

Table 1.
The multi-year average of water requirements for summer maize crops from 1968 to 2016.
| Number | Irrigation Regions | Weather Station | Crop Water Requirements (mm) | Average Value of Irrigation Regions (mm) |
|---|---|---|---|---|
| I | Southwestern Shandong | Dingtao | 340.79 | 340.79 |
| II | Northern Shandong | Huimin | 338.25 | 348.2 |
| Ling County | 347.88 | |||
| Kenli | 369.67 | |||
| Shen County | 336.99 | |||
| III | Central Shandong | Yanzhou | 346.78 | 334.84 |
| Jinan | 374.66 | |||
| Mount Tai | 273.22 | |||
| Yiyuan | 331.67 | |||
| Weifang | 344.68 | |||
| IV | Southern Shandong | Rizhao | 322.92 | 316.32 |
| Ju County | 301.07 | |||
| Fei County | 324.98 | |||
| V | Eastern Shandong | Chengshan Cape | 278.75 | 331.36 |
| Haiyang | 321.19 | |||
| Longkou | 359.61 | |||
| Fushan | 355.41 | |||
| Pingdu | 332.66 | |||
| Qingdao | 328.79 | |||
| Changdao | 343.14 |
Table 2.
The multi-year average water requirements of winter wheat crops from 1968 to 2016.
| Number | Irrigation Regions | Weather Station | Crop Water Requirements (mm) | Average Value of Irrigation Regions (mm) |
|---|---|---|---|---|
| I | Southwestern Shandong | Dingtao | 372.24 | 372.24 |
| II | Northern Shandong | Huimin | 426.31 | 430.24 |
| Ling County | 431.77 | |||
| Kenli | 439.58 | |||
| Shen County | 423.28 | |||
| III | Central Shandong | Yanzhou | 380.9 | 409.47 |
| Jinan | 497.61 | |||
| Mount Tai | 369.42 | |||
| Yiyuan | 368.99 | |||
| Weifang | 430.44 | |||
| IV | Southern Shandong | Rizhao | 359.7 | 387.95 |
| Ju County | 381.91 | |||
| Fei County | 422.25 | |||
| V | Eastern Shandong | Chengshan Cape | 383.22 | 444.1 |
| Haiyang | 401.56 | |||
| Longkou | 471.77 | |||
| Fushan | 497.25 | |||
| Pingdu | 452.03 | |||
| Qingdao | 419.92 | |||
| Changdao | 482.95 |
Table 3.
The multi-year average irrigation water requirements of summer maize from 1968 to 2016.
| Number | Irrigation Regions | Weather Station | Irrigation Water Requirements (mm) | Average Value of Irrigation Regions (mm) |
|---|---|---|---|---|
| I | Southwestern Shandong | Dingtao | 133.79 | 133.79 |
| II | Northern Shandong | Huimin | 135.55 | 142.18 |
| Ling County | 140.15 | |||
| Kenli | 145.62 | |||
| Shen County | 147.39 | |||
| III | Central Shandong | Yanzhou | 125.77 | 113.59 |
| Jinan | 138.65 | |||
| Mount Tai | 57.18 | |||
| Yiyuan | 104.33 | |||
| Weifang | 142.01 | |||
| IV | Southern Shandong | Rizhao | 112.12 | 101.76 |
| Ju County | 92.48 | |||
| Fei County | 100.67 | |||
| V | Eastern Shandong | Chengshan Cape | 122.66 | 140.6 |
| Haiyang | 123.68 | |||
| Longkou | 155.51 | |||
| Fushan | 154.88 | |||
| Pingdu | 131.46 | |||
| Qingdao | 144.33 | |||
| Changdao | 151.66 |
Table 4.
The multi-year average irrigation water requirements of winter wheat from 1968 to 2016.
| Number | Irrigation Regions | Weather Station | Irrigation Water Requirements (mm) | Average Value of Irrigation Regions (mm) |
|---|---|---|---|---|
| I | Southwestern Shandong | Dingtao | 258.81 | 258.81 |
| II | Northern Shandong | Huimin | 316.32 | 321.82 |
| Ling County | 324.25 | |||
| Kenli | 324.88 | |||
| Shen County | 303.78 | |||
| III | Central Shandong | Yanzhou | 261.12 | 281.74 |
| Jinan | 371.16 | |||
| Mount Tai | 220.41 | |||
| Yiyuan | 256.06 | |||
| Weifang | 299.96 | |||
| IV | Southern Shandong | Rizhao | 216.07 | 239.13 |
| Ju County | 237.71 | |||
| Fei County | 263.61 | |||
| V | Eastern Shandong | Chengshan Cape | 222.55 | 288.00 |
| Haiyang | 256.23 | |||
| Longkou | 319.05 | |||
| Fushan | 336.17 | |||
| Pingdu | 300.05 | |||
| Qingdao | 258.74 | |||
| Changdao | 323.19 |
Table 5.
Correlation coefficients and significance between irrigation water requirements of summer maize and meteorological factors.
Table 5.
Correlation coefficients and significance between irrigation water requirements of summer maize and meteorological factors.
| Irrigation Regions | Mean Pressure | Mean Temperature | Maximum Temperature | Minimum Temperature | Relative Humidity | Sunshine Hours | Precipitation | Wind Speed |
|---|---|---|---|---|---|---|---|---|
| Eastern Shandong | −0.254 * | 0.118 | 0.219 | −0.044 | −0.404 ** | 0.523 ** | −0.587 ** | 0.178 |
| Southern Shandong | −0.195 | 0.058 | 0.261 | −0.049 | −0.200 | 0.286 | −0.691 ** | 0.044 |
| Central Shandong | −0.288 * | 0.091 | 0.142 | −0.111 | −0.357 * | 0.389 * | −0.632 ** | 0.206 |
| Northern Shandong | −0.023 | 0.035 | 0.244 | −0.172 | −0.094 | 0.250 | −0.528 ** | 0.196 |
| Southwestern Shandong | −0.134 | 0.044 | 0.161 | −0.287 * | −0.302 * | 0.636 ** | −0.546 ** | 0.154 |
Note: *, significant correlation at 0.05 level (bilateral); **, significant correlation was found at the level of 0.01 (bilateral).
Table 6.
Correlation coefficients and significance between irrigation water requirements of winter wheat and meteorological factors.
Table 6.
Correlation coefficients and significance between irrigation water requirements of winter wheat and meteorological factors.
| Irrigation Regions | Mean Pressure | Mean Temperature | Maximum Temperature | Minimum Temperature | Relative Humidity | Sunshine Hours | Precipitation | Wind Speed |
|---|---|---|---|---|---|---|---|---|
| Eastern Shandong | −0.108 | 0.052 | 0.140 | −0.028 | −0.434 ** | 0.440 ** | −0.265 | 0.001 |
| Southern Shandong | −0.292 * | 0.098 | 0.126 | −0.159 | −0.610 ** | 0.428 ** | −0.291 * | 0.015 |
| Central Shandong | −0.0086 | 0.020 | 0.027 | −0.084 | −0.598 ** | 0.429 ** | −0.27 | 0.215 |
| Northern Shandong | −0.037 | 0.302 * | 0.072 | −0.147 | −0.411 ** | 0.375 | −0.12 | 0.254 |
| Southwestern Shandong | −0.079 | 0.070 | 0.175 | −0.127 | −0.677 ** | 0.465 ** | −0.082 | 0.279 |
Note: *, significant correlation at the 0.05 level (bilateral); **, significant correlation was found at the level of 0.01 (bilateral).
Publisher’s Note: MDPI stays neutral with regard to jurisdictional claims in published maps and institutional affiliations. |
© 2022 by the authors. Licensee MDPI, Basel, Switzerland. This article is an open access article distributed under the terms and conditions of the Creative Commons Attribution (CC BY) license (https://creativecommons.org/licenses/by/4.0/).
Share and Cite
MDPI and ACS Style
Zhang, P.; Ma, W.; Hou, L.; Liu, F.; Zhang, Q. Study on the Spatial and Temporal Distribution of Irrigation Water Requirements for Major Crops in Shandong Province. Water 2022, 14, 1051. https://doi.org/10.3390/w14071051
AMA Style
Zhang P, Ma W, Hou L, Liu F, Zhang Q. Study on the Spatial and Temporal Distribution of Irrigation Water Requirements for Major Crops in Shandong Province. Water. 2022; 14(7):1051. https://doi.org/10.3390/w14071051
Chicago/Turabian StyleZhang, Peng, Wandi Ma, Lei Hou, Fusheng Liu, and Qian Zhang. 2022. "Study on the Spatial and Temporal Distribution of Irrigation Water Requirements for Major Crops in Shandong Province" Water 14, no. 7: 1051. https://doi.org/10.3390/w14071051
Note that from the first issue of 2016, this journal uses article numbers instead of page numbers. See further details here.