
Assessment of Water Resources in Sana’a Region, Yemen Republic (Case Study)


1
College of Hydraulic Science and Engineering, Yangzhou University, Yangzhou 225009, China
2
Civil Engineering Department, College of Engineering, Thamar University, Dhamar 504408, Yemen
*
Author to whom correspondence should be addressed.
Water 2022, 14(7), 1039; https://doi.org/10.3390/w14071039
Submission received: 17 January 2022
/
Revised: 19 March 2022
/
Accepted: 23 March 2022
/
Published: 25 March 2022
(This article belongs to the Special Issue Water Resources and Environmental Management)
Abstract
:Yemen is a water-scarce country with inadequate freshwater, considerable groundwater depletion, and a lack of adequate surface water. This study aims to assess water resources and identify the current water situation in Sana’a region, which includes the governorate of Sana’a and the country’s capital, Sana’a city. A variety of data from different sources was collected and analyzed. Remote sensing (RS) and GIS techniques in combination with the Arc Hydro model were utilized. Water demand and supply for domestic and agricultural purposes were estimated. The results show that there is insufficient water to meet the needs of the region’s yearly population growth rates of 3.2 and 4.5% in Sana’a governorate and Sana’a city, respectively. The amount of observed rainfall varies spatially and temporally, ranging between 160 and 367 mm per year. There are 233 water structures, 168 dams, and 65 reservoirs, with a storage capacity of 64.65 and 0.24 Mm3 (million cubic meters), respectively. In Sana’a basin, groundwater abstraction increased significantly from about 25 Mm3 in 1970 to around 330 Mm3 in 2020, while groundwater recharge was about 80 Mm3 in 2020. The estimated water demand for domestic use was in the range of approximately 106–128 and 199–241 Mm3 in Sana’a governorate, whereas in Sana’a city, it was in the range of about 249–302 and 607–737 Mm3 for 2020 and 2040, respectively. The estimated agriculture water demand was between 1.14 and 1.53 Bm3 (billion cubic meters) in 2007, and declined to 801 Mm3 and 1.16 Bm3 in 2018 due to the reduction in the cultivated area by about 33% from 2007 to 2018, which was attributed to a lack of water. The estimated water deficit ranges between 500 and 723 Mm3 during 2007 and 2018. This study concluded that the estimated water supply and demand for the past 12 years from 2007 to 2018 resulted in a supply that was less than the demand in each year, indicating that the available water resources were insufficient to fulfill demand. The significant gap between water supply and demand means withdrawal from the stored groundwater. Thus, groundwater is at high risk. Constructing more water harvesting structures, adopting water conservation, water resource management, and making groundwater artificial recharge are recommended to meet the water demand and conserve non-renewable resources in the coming decades. The results obtained from this study would help decision makers to make appropriate plans to achieve the SDGs in Sana’a region.
1. Introduction
Water is the basis of life, an essential input for social and economic development, and an essential element of environmental sustainability. Agriculture for food production is considered one of the most significant pressures on freshwater resources. Where considered, agriculture is responsible for over 80% of worldwide freshwater withdrawals (up to 90% in some fast-growing economies) [1,2]. Food demand is expected to rise by 70% by 2050 owing to the projected global population expansion of 2–3 billion people within the next 40 years [3]. On the other hand, natural disasters caused damage of 2–15% of various developing nations’ annual gross domestic between 1990 and 2000 [3]. Continuous population growth, particularly in metropolitan areas, necessitates fundamental needs such as water and sanitation, putting a strain on available water resources and services. In addition, water pollution is one of the causes of water pressure, and water quality issues are adding to the pressure on clean water resources. Millions of poor people are affected by supply shortages in numerous less-developed countries worldwide. Climate change involves intricate connections between ecological, political, economic, and social systems worldwide. Its repercussions will be felt globally; climate change has a significant impact on the water sector. Various studies with different approaches at the field basin level have determined the effect of climate change on water resource systems.
For the above reasons, it is necessary to develop plans and studies to ensure water sustainability in the future. In contrast, countries strive to guarantee that everyone has enough water, which is one of the most important parts of sustainable development [4]. As a result, in September 2015, the heads of government and state of 193 nations agreed on the 2030 Agenda for Sustainable Development at the UN’s 70th General Assembly. It is a plan of action for the planet, people, and prosperity to eliminate poverty and hunger worldwide. The plan included 17 goals called Sustainable Development Goals (SDGs). The availability and long-term management of water and sanitation for all is the sixth goal of sustainable development (2030 Agenda). This goal seeks to ensure access to water and sanitation services for all by reducing water pollution, increasing water use efficiency, ensuring sustainable withdrawal and recharge, and protecting the water-related ecosystem, including forests, rivers, lakes, etc. In addition, international cooperation for developing countries—considering Yemen as one of these countries—includes a capacity for building and implementation of activities and programmes related to water and sanitation, as well as supporting local communities in water management [5].
Yemen is located in arid and semi-arid regions. That is evident in the lack of rainfall and its irregularity in quantity and distribution. It is considered one of the ten countries that suffer from water scarcity [6]. At the same time, the country is one of the most water-depleted countries in the Middle East due to the lack of a future strategic plan [7]. Food and water security are major concerns in the country [8], particularly since it lacks permanent rivers [9]. Yemen has a problem with irrational usage of available water resources, which leads to rapid groundwater depletion [10]. Agricultural production consumes about 93% of the total available water resources [11]. There is no country where the rate of depletion of aquifers is occurring as fast as Yemen [12]. As a result of the conflict in the country, millions of Yemenis suffer from a loss of access to clean drinking water. Most farmers have lost their agricultural activities. Reports indicate that more than 45% of public structures are in a state of collapse [13] due to the targeting of some vital facilities or a lack of resources to meet their needs [14]. Urban areas depend on groundwater to meet the water demand, while rural areas rely on wells and traditional water harvesting methods such as small dams and ponds [15]. The renewable groundwater in Yemen amounts to 1.5 billion cubic meters (Bm3), the surface water amounts to 1.0 Bm3, and the water demand amounts to 3.4 Bm3 [16]. In comparison, renewable water amounted to 2.5 Bm3, which means a deficit of 0.9 Bm3 that is to be compensated by groundwater. Recently, this deficit has increased to about 1.4 Bm3 [17] due to the current water demand reaching 3.9 Bm3 (2020) and will increase to 4.4 Bm3 by 2025. Ward et al. [12] indicated that the renewable water resources in Yemen decreased from 246 to 130 m3/capita/year from 1980 to 1997, respectively. In 2018, the renewable water resources were 73.69 m3/capita/year [18]; on the other hand, the ministry of water and environment has shown that renewable water resources were 85 m3/capita/year in 2019 [17]; this will reach 66 m3/capita/year by 2025 and 2026 [17,19]. No accurate statistic represents the per capita of water annually, but it is in about the range of 70–85 m3/capita/year. This decrease is considerable, and shows that the per capita share in Yemen does not exceed 10% compared to other countries [12]. Water is sometimes brought by women from far away, which may put them at risk in a socially diverse society.
Sana’a region, which is the study area of this research, is considered one of the most water scarce regions in Yemen. It is affected by what affects the country, negatively or positively. So, researchers anticipate a drought in the coming years due to the current water situation. With the increase in the population and the lack of solutions to recharge the groundwater, the groundwater level has continued to decline since the excavation depth reached more than 100 m in 2000 [20], while in 2020, the depth reached more than 1000 m, in some areas within study area. [17]. Water availability in Sana’a region depends on a family’s location and income proportion [20].
Recent rapid population growth has increased water consumption for the agriculture sector (especially Qat plant cultivation), and a lack of rainfall has led to the overuse of groundwater. Agriculture crops in the study area are confined due to the region’s climate, where temperature plays an important role in influencing the accelerated rate of crop life length and also affects yield production [21]. The amount of groundwater extracted from Sana’a basin is about 400% of the amount of recharge [8], so most of the groundwater wells in the study area dry up due to the drop in the groundwater level, which is estimated at 6–8 m annually [22,23]. The increase in the population with water scarcity poses significant challenges to the state economically, socially, and politically and threatens the stability of the environment [24]. Despite the water shortage in Sana’a region, it also suffers from rainwater drainage, especially in the capital. The valleys in the vicinity flow into the middle of Sana’a city (Alsailah channel) due to population congestion and urban expansion. In addition, the internal migration to Sana’a region ranks first among Yemeni cities, where the proportion of the urban population has reached 7.52% of the city’s total population [25]. Yemen’s water crisis, especially in Sana’a region, is a significant issue that is becoming worse with time. The government has no satisfactory solutions, especially with the recent events that the country has witnessed. These problems require achieving a comprehensive assessment study that is up to date for water resources.
The water situation in the study area is very critical. Research and programmes that will relieve the crisis and pursue water-sustainable development in the future must be prioritized. Thus, this study aims to assess water resources in Sana’a region, including surface water and groundwater, with their quantities and distribution, water supply, and demand for all purposes.
The importance of this study comes as a significant comprehensive study that will assess and highlight the current situation of water resources in the region, encouraging the decision makers to achieve the SDGs in the region. Based on that, a plan can be adopted to achieve the sixth sustainable development goal in Sana’a region in particular, and Yemen in general, so that the government seeks to achieve the goal of equitable access for all to safe and affordable drinking water by 2030 and to achieve the rest of the goals, such as increasing the efficiency of water use in all sectors, implementing integrated management of water resources at all levels, and others similar to the countries of the world.
2. Materials and Methods
2.1. Study Area
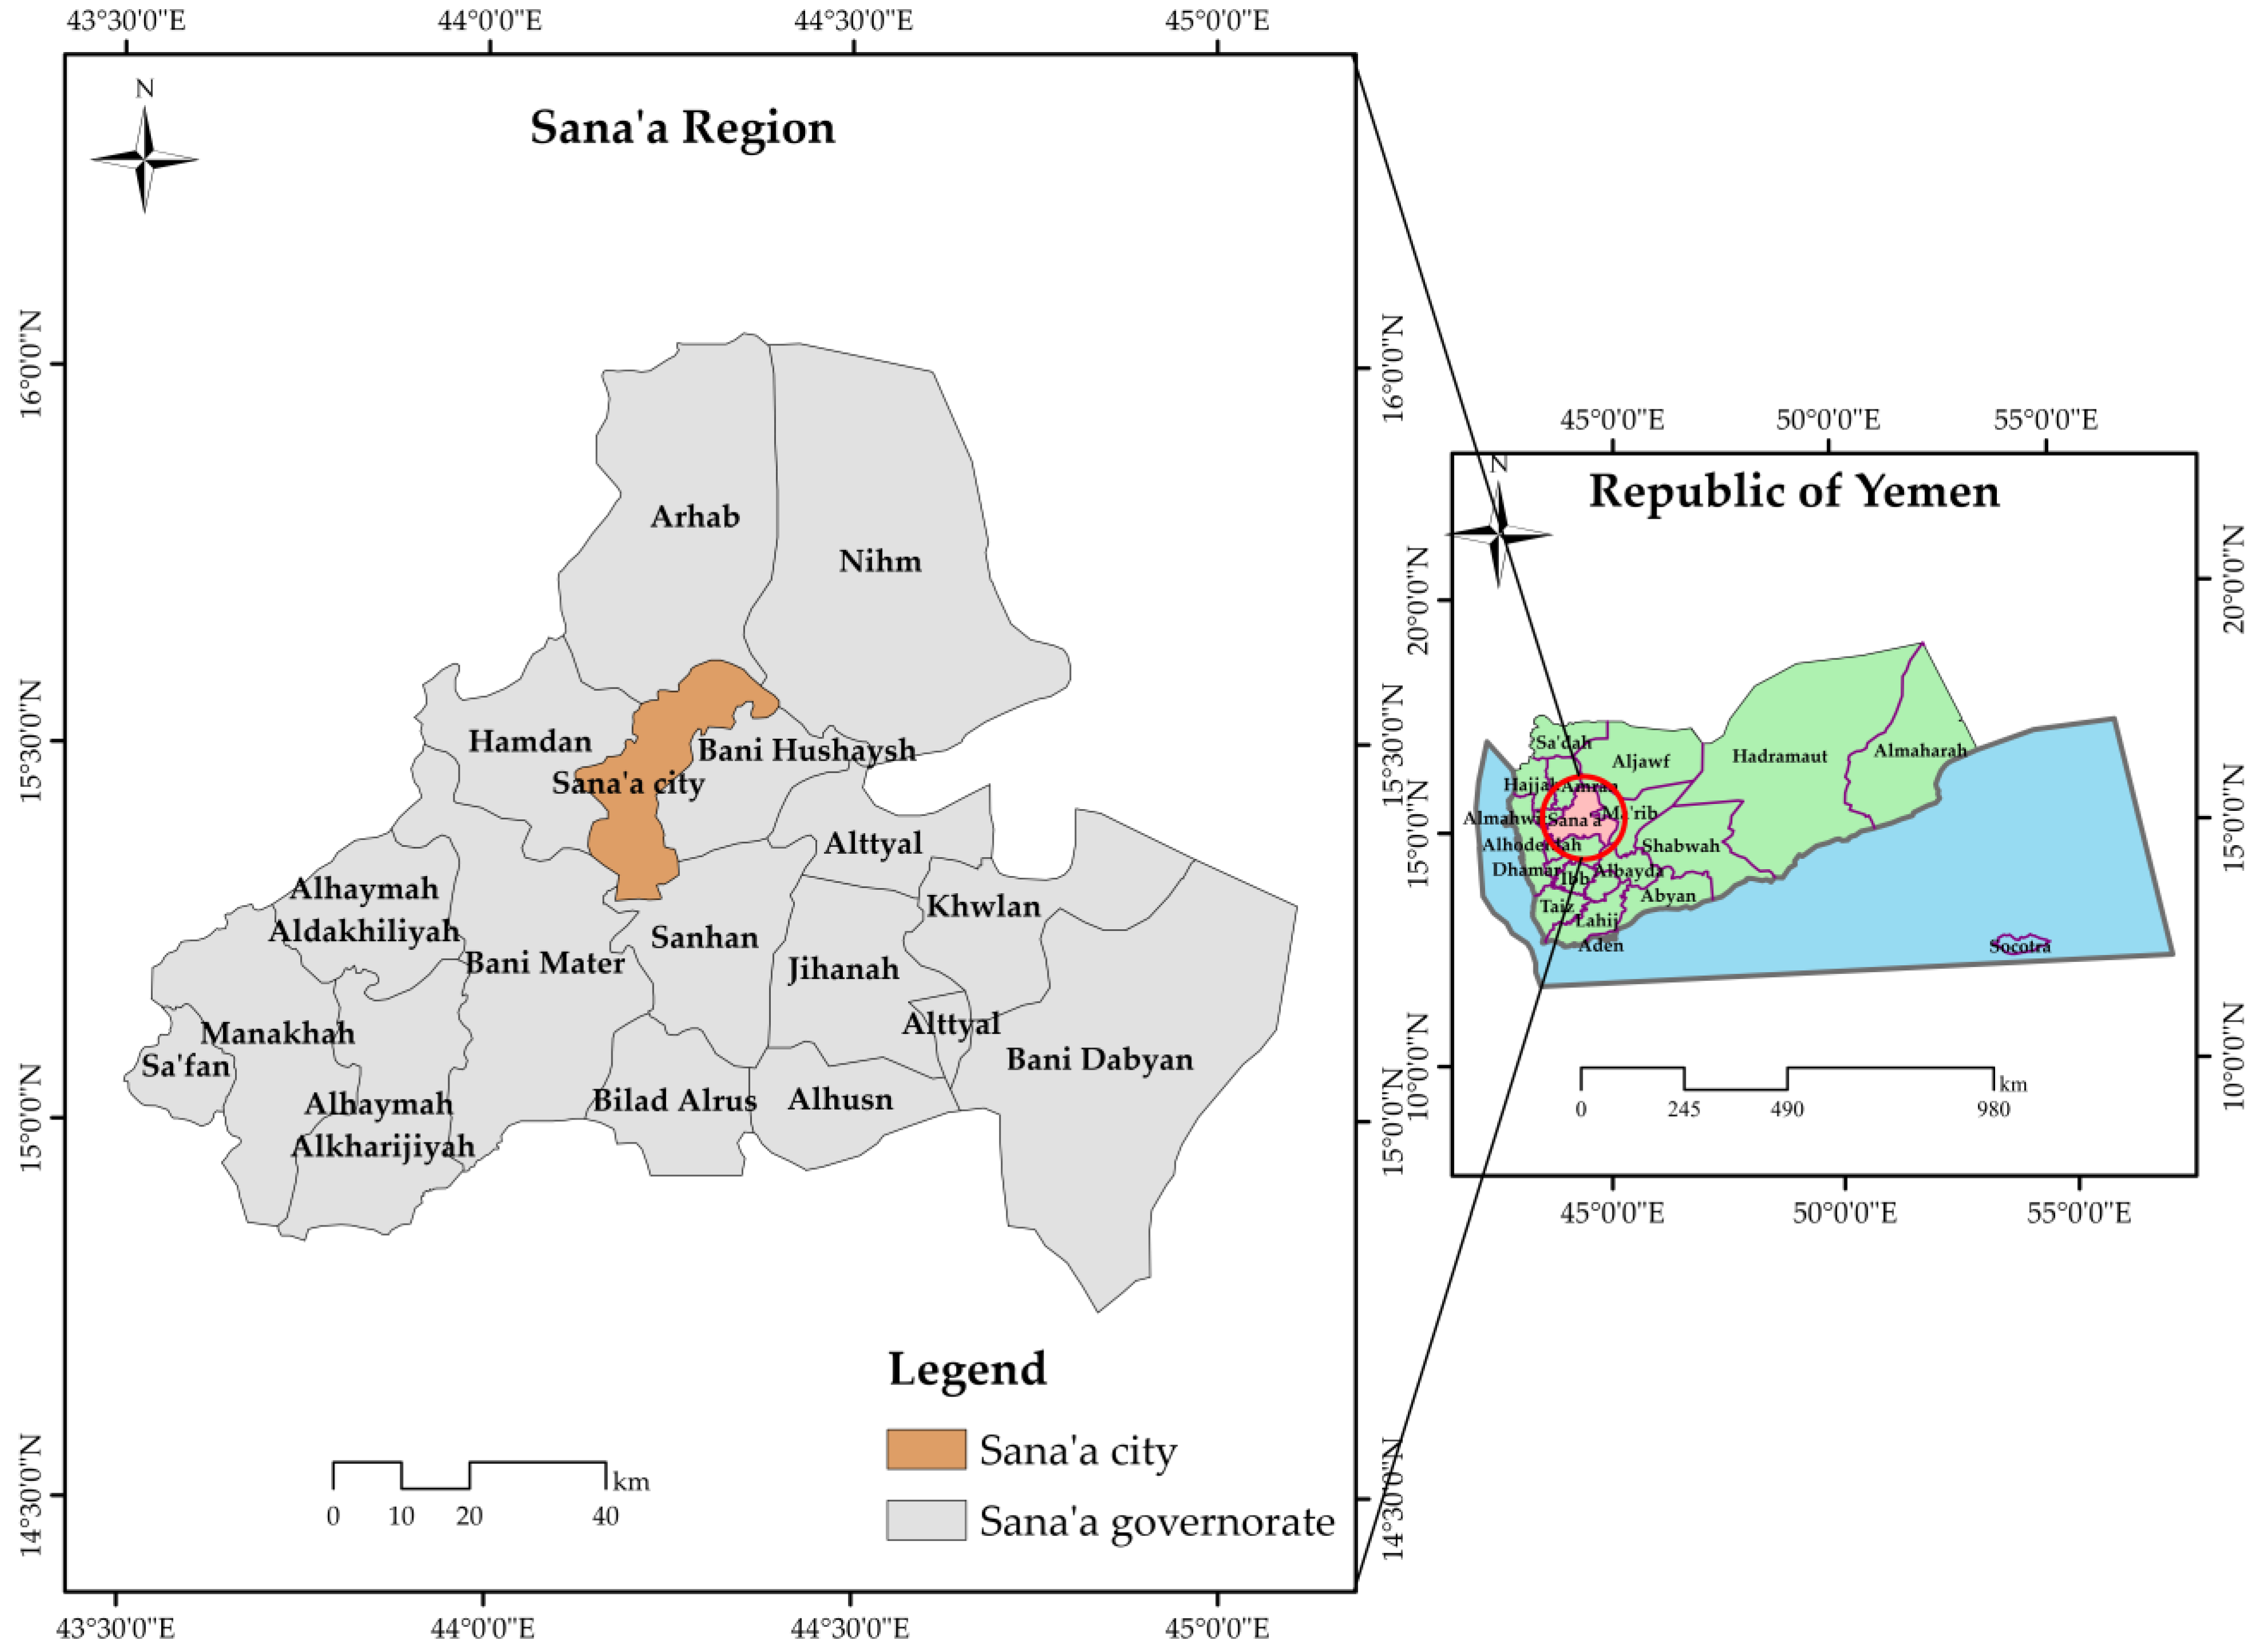
Sana’a region is located in the northern-central part of Yemen at an altitude of 2300 m above sea level, at 14°45′–16°5′ latitudes, and 43°30′–45°5′ longitudes (Figure 1). It consists of two main districts, namely, Sana’a governorate and Sana’a city. Sana’a governorate surrounds Sana’a city from all sides. Sana’a city is also called Amanat Alasimah, and it is Yemen’s political and historical capital.
The total area of the region is 12,259 km2, of which Sana’a governorate occupies 11,869 km2 and Sana’a city 390 km2. According to OCHA [26], the populations of Sana’a governorate and Sana’a city are about 1,469,960 and 3,406,643, with a growth rate of 3.2% and 4.5%, respectively, based on the last official population census in 2004, which showed 918,727 and 1,747,834 in Sana’a governorate and Sana’a city. Sana’a governorate consists of 16 districts (Sanhan, Khawlan, Bani Hushaysh, Alttayal, Bani Dabyan, Alhusn, Jihanah, Bilad Alrus, Hamdan, Bani Matar, Arhab, Nihm, Alhaymah Aldakhiliyah, Alhaymah Alkharijiyah, Manakhah, and Sa’fan) (Figure 1). Sana’a city is divided into ten districts (Bani Alharith, Alssafia, Alsabain, Old City, Ma’ain, Azal, Altahrir, Alwahdah, Shu’ub and Althaorah)
The study area’s topography consists of highlands and wadis, which contain many plains (Qa’s), mountains, high peaks, and plateaus. The plains or Qa’s are concentrated in the central highlands. The high mountains are concentrated in the western, northern, eastern, and southeastern highlands. The height of the mountains in these highlands ranges between 1817 and 3666 m. Sana’a region is famous for its several valleys (wadis) that are formed in the middle of those mountains and highlands. The highlands determine the orientations of the valleys. The majority of these valleys serve as essential tributaries to several well-known valleys, such as wadi Surdud and wadi Siham in the west and wadi Seba and wadi Al-Jawf in the east.
The geology of Sana’a region consists of several layers, which can be divided into several groups. These are Jurassic, Cretaceous and Tertiary, Tertiary Cretaceous volcanic, Quaternary volcanic, Quaternary, fluvial, and Precambrian undifferentiated.
Sana’a region is considered a dry area according to the UNESCO classification in 1979. The evapotranspiration exceeds the amount of rainfall, where the annual average for evapotranspiration is between 2000 and 2500 mm [27,28]. Climate phenomena (floods, droughts) and their relationships with weather phenomena, including rainfall, relative humidity, wind speed, and temperature, are essential to understanding the causes of current climate change and future expectations.
The average temperature is in the range of 12–25 °C [13,17,29,30,31]. In contrast, the average maximum annual temperature ranges between 23 and 30 °C, with an average of 26 °C, by analyzing all the data obtained during the period 1972–2015 [31]. The average yearly minimum temperature ranges between zero and 17 °C, with an average of 9 °C. It decreases on some winter nights to below zero in December and January, causing frost in the highlands of Sana’a region. The frost phenomenon is classified as a dangerous factor that threatens some crops and destroys them. In January 1986, the lowest temperature ever recorded in the region reached −9 °C [31]. The temperature is considered very low and close to the high mountainous areas south of Sana’a region, which recorded, in the same period, −12 °C in Dhamar governorate [32]. In general, the mountainous heights in Sana’a region are considered one of the coldest regions in Yemen during the winter and the most moderate during the summer. The average monthly relative humidity is in the range of 38–58%, the wind speed is 2–3.1 m/s, and the sun shines 7–11 h/day (statistics from 1972 to 2014) [31].
2.2. Data and Method
A variety of data sets collected from various sources are used in this study. The climate and rainfall observation data were obtained from multiple sources such as the Civil Aviation and Meteorology Authority (CAMA) [33], the National Water Resources Authority (NWRA) [31], the Ministry of Agriculture and Irrigation (MAI) [34], and the Ministry of Water and Environment (MWE) [17]. These data were used to analyze the variability of rainfall in the study area over the last decades. It also highlighted the past and current of meteorological and rain gauge stations with their types, distributions, and locations. The data of the rainwater harvesting structures such as dams and reservoirs and their types, distributions, and storage capacity of water were collected from MAI and MWE.
This study used a Digital Elevation Model (DEM) and a Geographic Information System (GIS) in conjunction with Arc Hydro to create a standardized stream network. The drainage network was created using data collected from a Digital Elevation Model (DEM) such as flow direction, flow accumulation, and stream networks. The ASTER L1A creates the ASTER Global Digital Elevation Model V002 (ASTER GDEM). The NASA Land Processes Distributed Active Archive Center (LP DAAC), USGS/Earth Resources Observation and Science (EROS) Center (DAAC, 2015) provided the Digital Elevation Model V002 (ASTER GDEM) data product, which was retrieved from the online Data Pool. The National Aeronautics and Space Administration (NASA) and Japan’s Ministry of Economy, Trade, and Industry (METI) collaborated on it, and it has a resolution of 30 m (DAAC 2015).
Water demand was calculated for a variety of purposes, including domestic, industrial, agricultural, and tourism. The water supply was also calculated, including surface water and groundwater (rainfall, streams, wells, and treatment plants), and eventually, the water deficit was calculated as the difference between water supply and demand.
3. Results
3.1. Surface Water
3.1.1. Rainfall
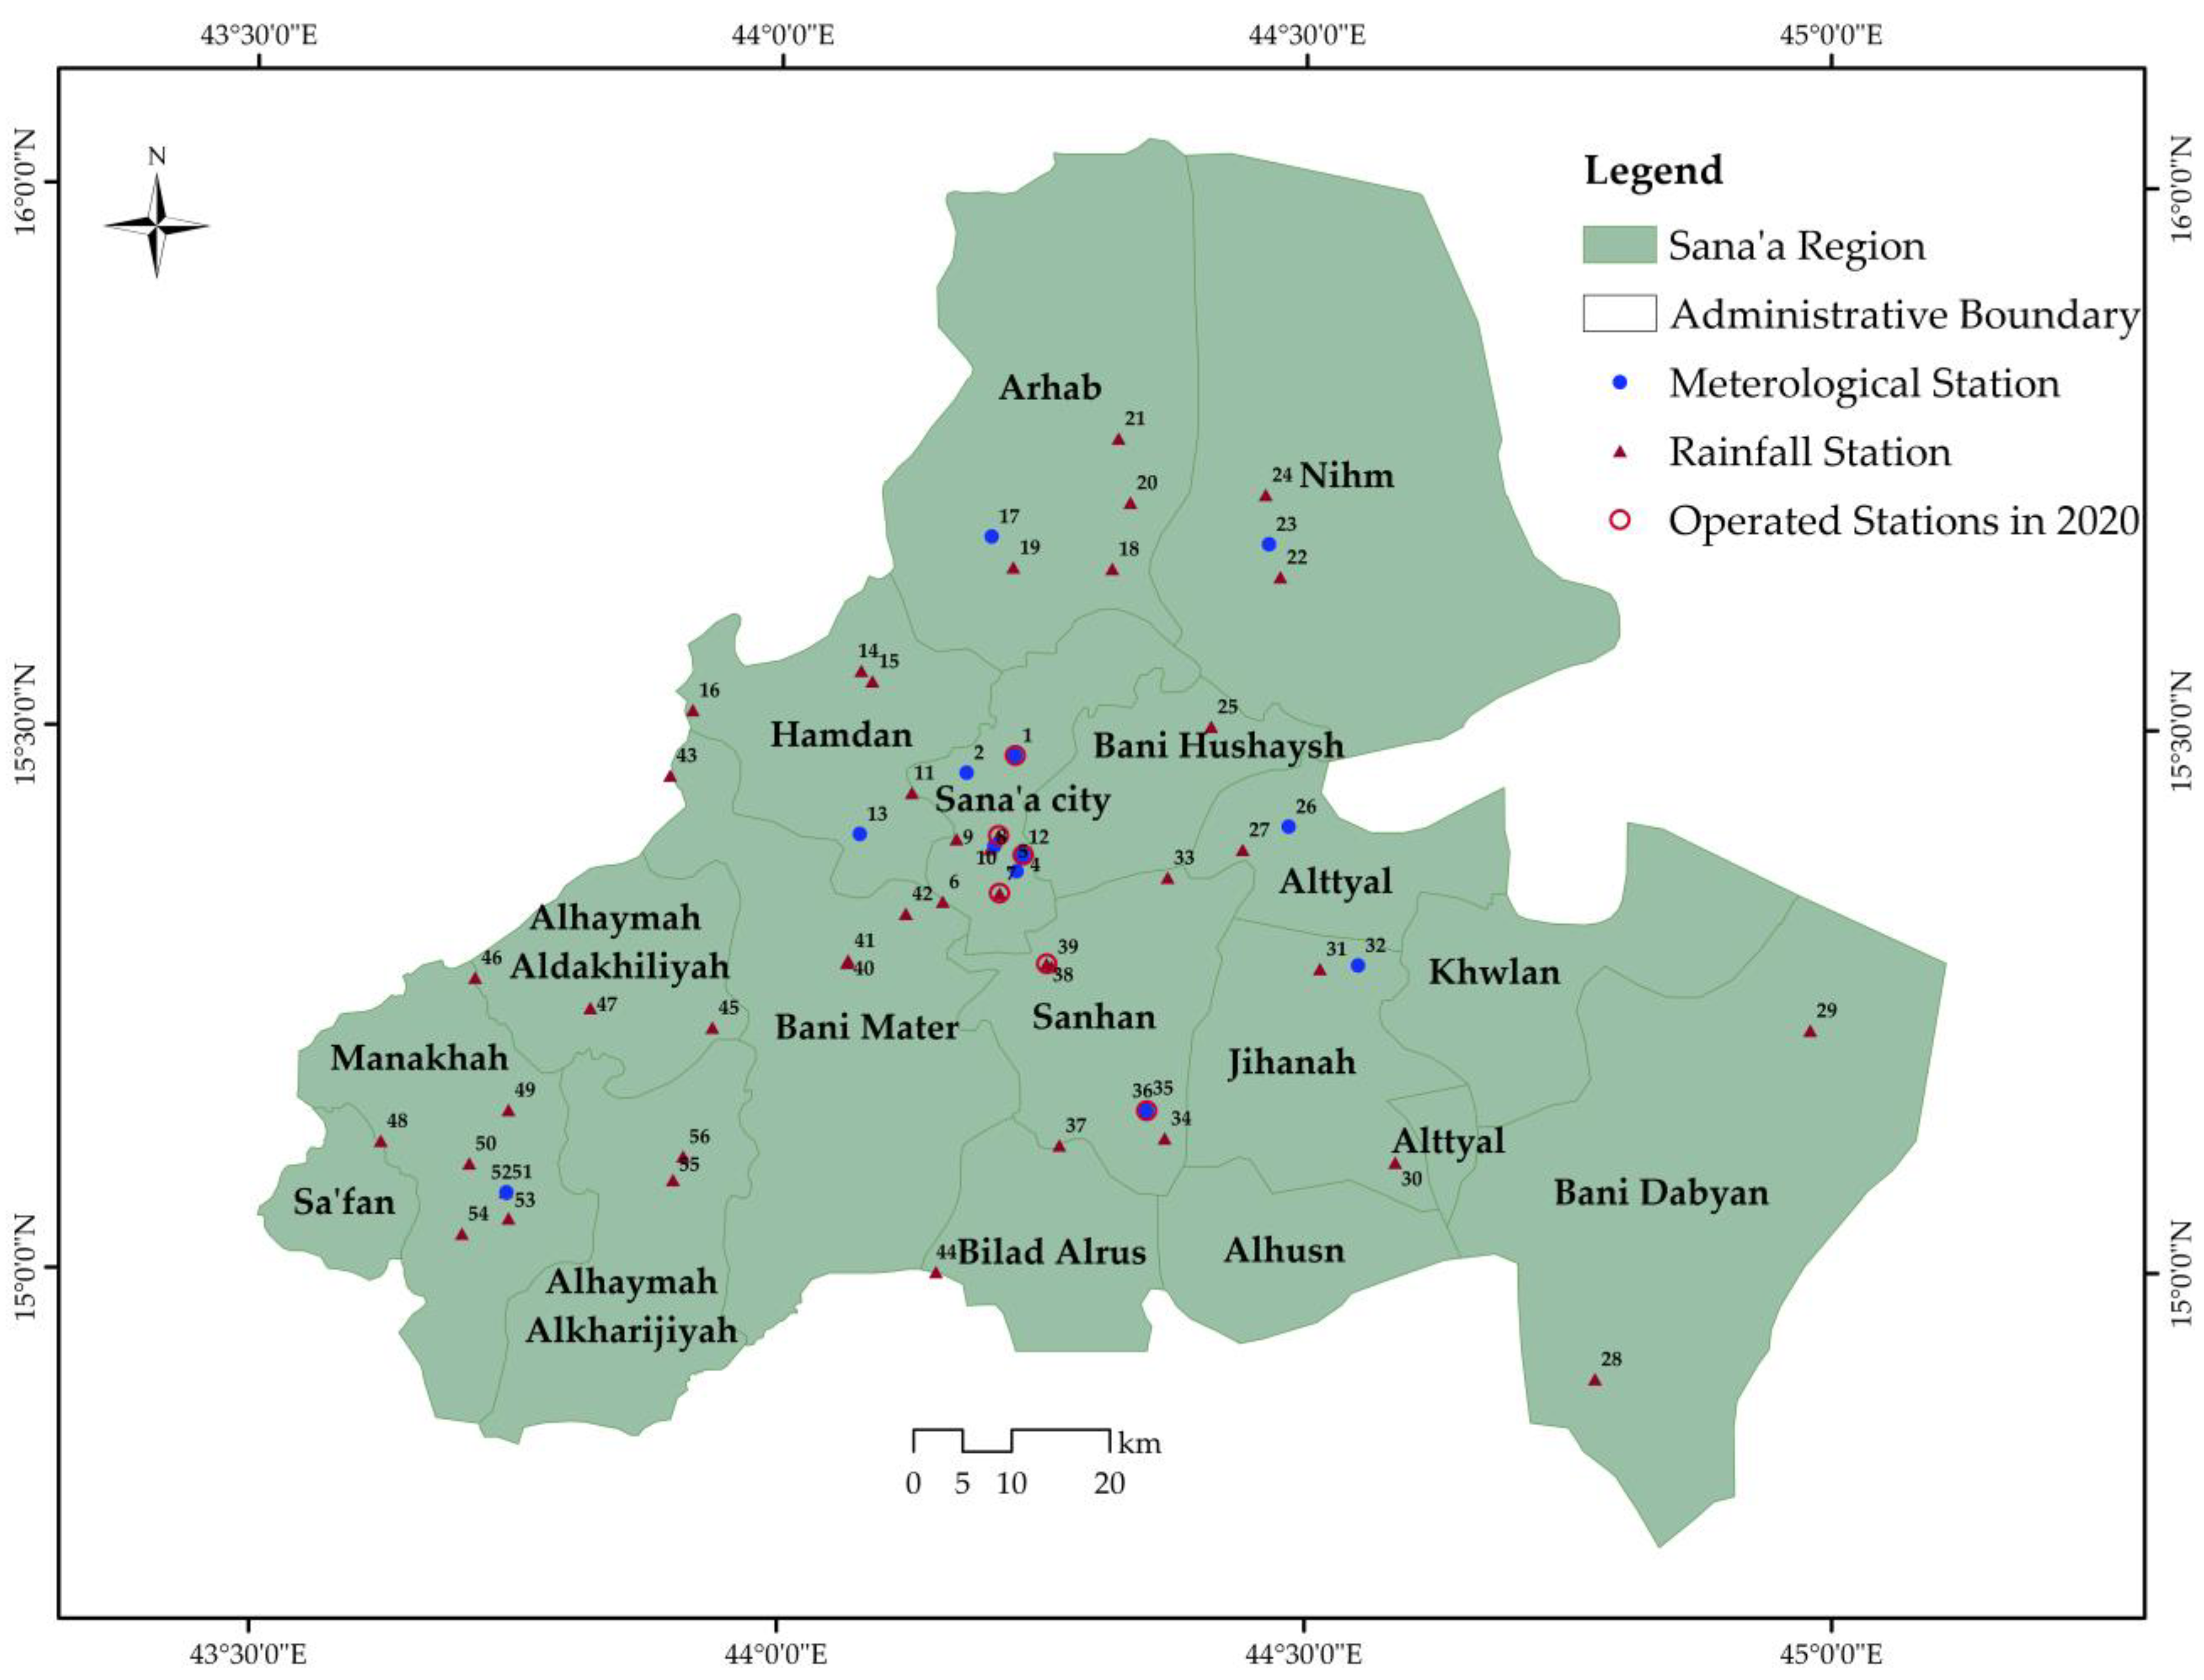
The results of the rainfall data analysis in the study area using several rain gauges and meteorological stations show that the recording of rainfall data began in the 1970s to achieve different projects in Sana’a basin, wadi Siham, and other locations [31]. As shown in Figure 2, fifty-six rain gauges and meteorological stations have been established throughout the study area in different places, twelve of them are considered metrological stations, while the others are rain gauges. Various authorities are responsible for measuring and collecting the data from these stations, such as CAMA, MAI, and NWRA. Currently, most of these stations have discontinued work because they were established to achieve private projects. Thus, rainfall data has been missing in these stations for many years.
In 1975, there were eight stations; then the number increased to seventeen and eighteen stations in 1984 and 1996, respectively. As shown in Figure 3, in both 2006 and 2020, the number of rain gauge stations decreased again to eleven and six stations, respectively. According to the available and recorded data, it is found that there were six operating stations in 2020—1, 4, 7, 10, 36, and 38, namely Sana’a Airport, Shu’ub, CAMA, Jiraf, Maqwalh-A, and Dar Salm-A, respectively. These stations are located in only two of the main districts of Sana’a city and Sanhan, whereas there are no operating stations in the other districts of Sana’a region. Stations 1, 4, and 36 are metrological stations, while stations 7, 10, and 38 are rain gauge stations. CAMA manages stations 1 and 7, while NWRA manages station No. 4, and MAI manages stations 10, 36, and 38. According to the available recording data obtained from the sources, CAMA rain gauge station 7 is the only rain gauge station that has complete monthly rainfall observation data from 1977 to 2021. It is located in Sana’a city, while there is no complete recording data for the other fifty-five rain gauge stations for the same period. Rainfall data from the remaining rain gauge stations has been intermittent for several years and months, indicating that there is a big challenge in doing hydrological studies and designing hydraulic structures. It is essential to reestablish the other rain gauges and metrological stations in their previous locations, as presented in Figure 2. It is also essential to estimate the missing rainfall data in these stations.
The results of rainfall analysis in Sana’a region using some rain gauge stations for some selected years are presented below.
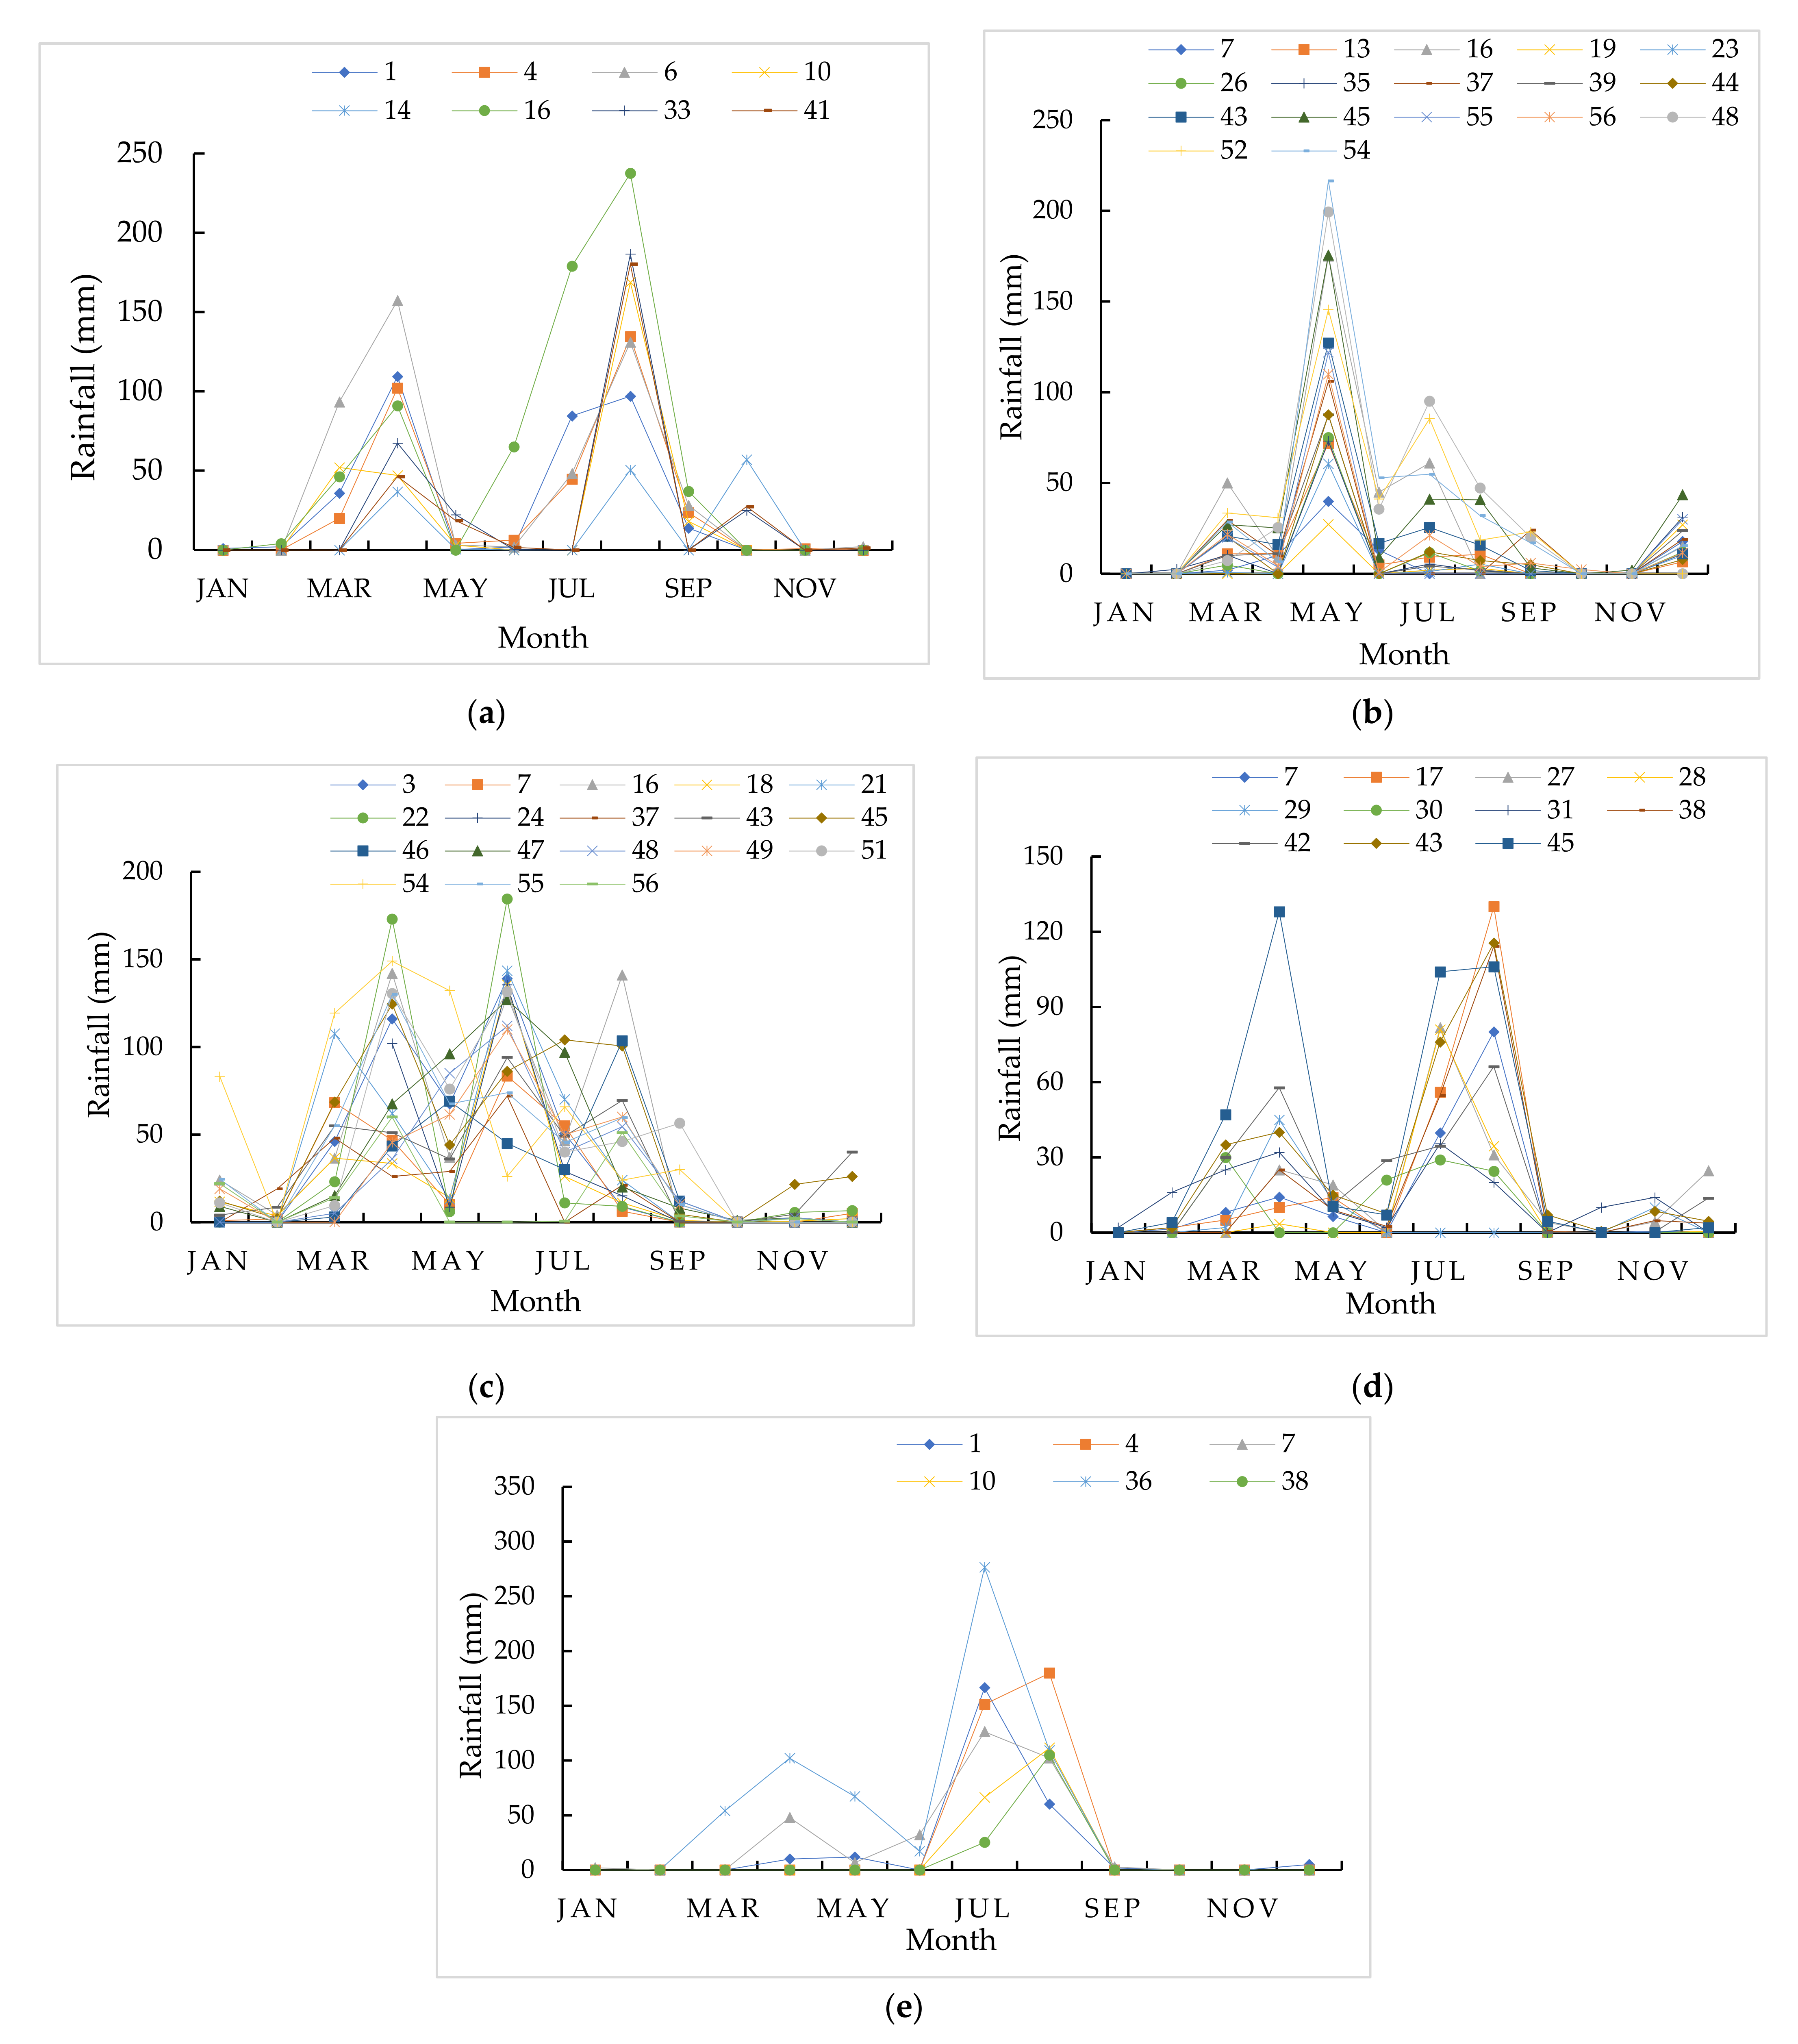
As demonstrated in Figure 3a, in 1975, the behavior of monthly rainfall recorded in eight operating rain gauge stations was almost the same in all stations, but the amount was different. The numbers and locations of these rain gauge stations are presented in Figure 3a and mapped in Figure 2. The rainfall occurred in March, April, July, August, September, and October, while no rainfall was recorded in the other months during the year 1975. The maximum monthly rainfall amount was recorded in August with about 237.5 mm in Hamdan district at rain gauge station 16, followed by approximately 180.2 and 179 mm in September and July, Figure 3a. The maximum amount of annual rainfall was recorded at rain gauge station 16, followed by 6, 1, and 4 with about 659.6, 465.4, 345.5, and 316.2 mm, respectively. The lowest annual rainfall was about 144.8 mm, which was observed at rain gauge station 14. The total monthly and annual rainfall varied from one rain gauge station to another during the year 1975. In general, the average rainfall amount was approximately 349.6 mm in Sana’a region in 1975, as observed at these rain gauge stations.
As shown in Figure 3b, the monthly rainfall behavior in 1984 was different when compared to the rainfall behavior in 1975. Figure 3b demonstrates the monthly rainfall amount recorded at seventeen rain gauge stations in 1984. It is clear from the figure that the maximum monthly rainfall amounts were observed in May, with about 216.5 mm, followed by 199.3, 175.6, and 175 mm at the rain gauge stations of 54, 48, 45, and 16, respectively. The maximum annual rainfall amount was recorded at the rain gauge station 48, followed by 54, 45, and 16 with about 429.8, 423.6, 367.5, and 355 mm, respectively. The lowest annual rainfall amount was about 59.2 mm at the rain gauge station 19. The average rainfall amount was about 211 mm in Sana’a region in 1984 as observed at these rain gauge stations.
Figure 3c demonstrates the monthly rainfall amount in 1996, which was observed at eighteen rain gauge stations distributed over Sana’a region, as shown in Figure 2. The monthly rainfall behavior varied and reached a maximum value of 184.5 mm in June, which was recorded by the rain gauge station 22. The rainfall period starts from March to August. Station 54 recorded a maximum annual rainfall amount of 629.3 mm, while rain gauge station 56 recorded a minimum annual rainfall amount of 153 mm. The average rainfall amount was approximately 399.2 mm in Sana’a region in 1996 as observed at these rain gauge stations.
In 2006, the behavior of the monthly rainfall recorded at eleven operating rain gauge stations was almost the same (Figure 3d); the maximum rainfall amount was recorded in June, and amounted to 130 mm in August at the rain gauge 17. The monthly rainfall amount for others rain gauge stations is presented in Figure 3d. The maximum annual rainfall amount was about 413 mm at the rain gauge station 45, while the minimum annual rainfall amount was approximately 69.5 mm at the rain gauge station 29. The average rainfall amount was about 200 mm in Sana’a region in 2006 as observed at these rain gauge stations.
For 2020, as shown in Figure 3e, there are only six operating rain gauge stations. The rainfall occurred in March to August. The maximum monthly rainfall amount was recorded at rain gauge station 36, and amounted to 276.5 mm in July. The maximum annual rainfall amounted to 625.7 mm at the same rain gauge station, and the minimum annual rainfall amount reached 130 mm at rain gauge station 38. The average rainfall was about 306 mm in Sana’a region in 2020 as observed at these rain gauge stations.
In general, through the available data for several rain gauge stations from 1972 to 2020, the results of rainfall analysis in the study area can be divided into five areas:
- The eastern and southern highlands include the districts of Sanhan, Bani Hushaysh, Khwlan, Al-ttyal, Bani Dabyan, Al-Husn, and Bilad Al-Rus. The annual rainfall ranges between 130 and 320 mm, with a maximum of 827 mm in 1981 at rain gauge station 44 and a minimum of 47 mm in 2008 at rain gauge station 31.
- The southern highlands include the districts of Bani Matar and Hamdan. The annual rainfall was in the range of 160–450 mm, with a maximum of 685 mm in 1998 at rain gauge station 16 and a minimum of 62 mm in 2003 at rain gauge station 43.
- The southwestern highlands, which include the districts of AlHaymah Al Dakhiliyah, AlHaymah AlKharijiyah, Manakhah, and Sa’fan. The annual rainfall ranges between 250 and 520 mm, with a maximum of 887 mm in 1997 at rain gauge station 54 and a minimum of 142 mm in 1992 at rain gauge station 48.
- In the northern highlands, which include the districts of Nihm and Arhab. The range of annual rainfall varies between 150 and 235 mm, with a maximum of 419 mm in 1996 at rain gauge station 22 and a minimum of 59 mm in 2004 at rain gauge station 19.
- The central region, which includes Sana’a city, has an annual rainfall in the range of 130–350 mm, with a maximum of 655 mm in 1979 at rain gauge station 6 and a minimum of 83 mm in 2002 at rain gauge station 7.
The data acquired through the research revealed that rainfall in the studied area fluctuated both temporally and geographically. Rainfall periods can be divided into two seasons, the first season from March to May and the second season from July to August. Because of the geographical location and its influence, there is convergence between the red sea and the tropics [15]. Consequently, the annual rainfall in Sana’s region varies between 160 and 367 mm, with an average of 264 mm/year.
The current study’s findings mostly agree with the rainfall amounts reported in some previous studies. The average annual rainfall ranged from 130 mm in the eastern coastal areas to more than 600 mm in the southwestern highlands [31]. According to a study conducted by Stephen et al. [35], the average rainfall amounted to 200 mm annually in Sana’a basin, representing 30% of the total study area, while other studies reported that the annual rainfall ranged between 100 and 350 mm [8,13,22,23,24,27,28,29,36,37]. Noaman et al. [25] indicated that the average rainfall ranged between 250 and 300 mm annually in Sana’a city.
3.1.2. Streamflow
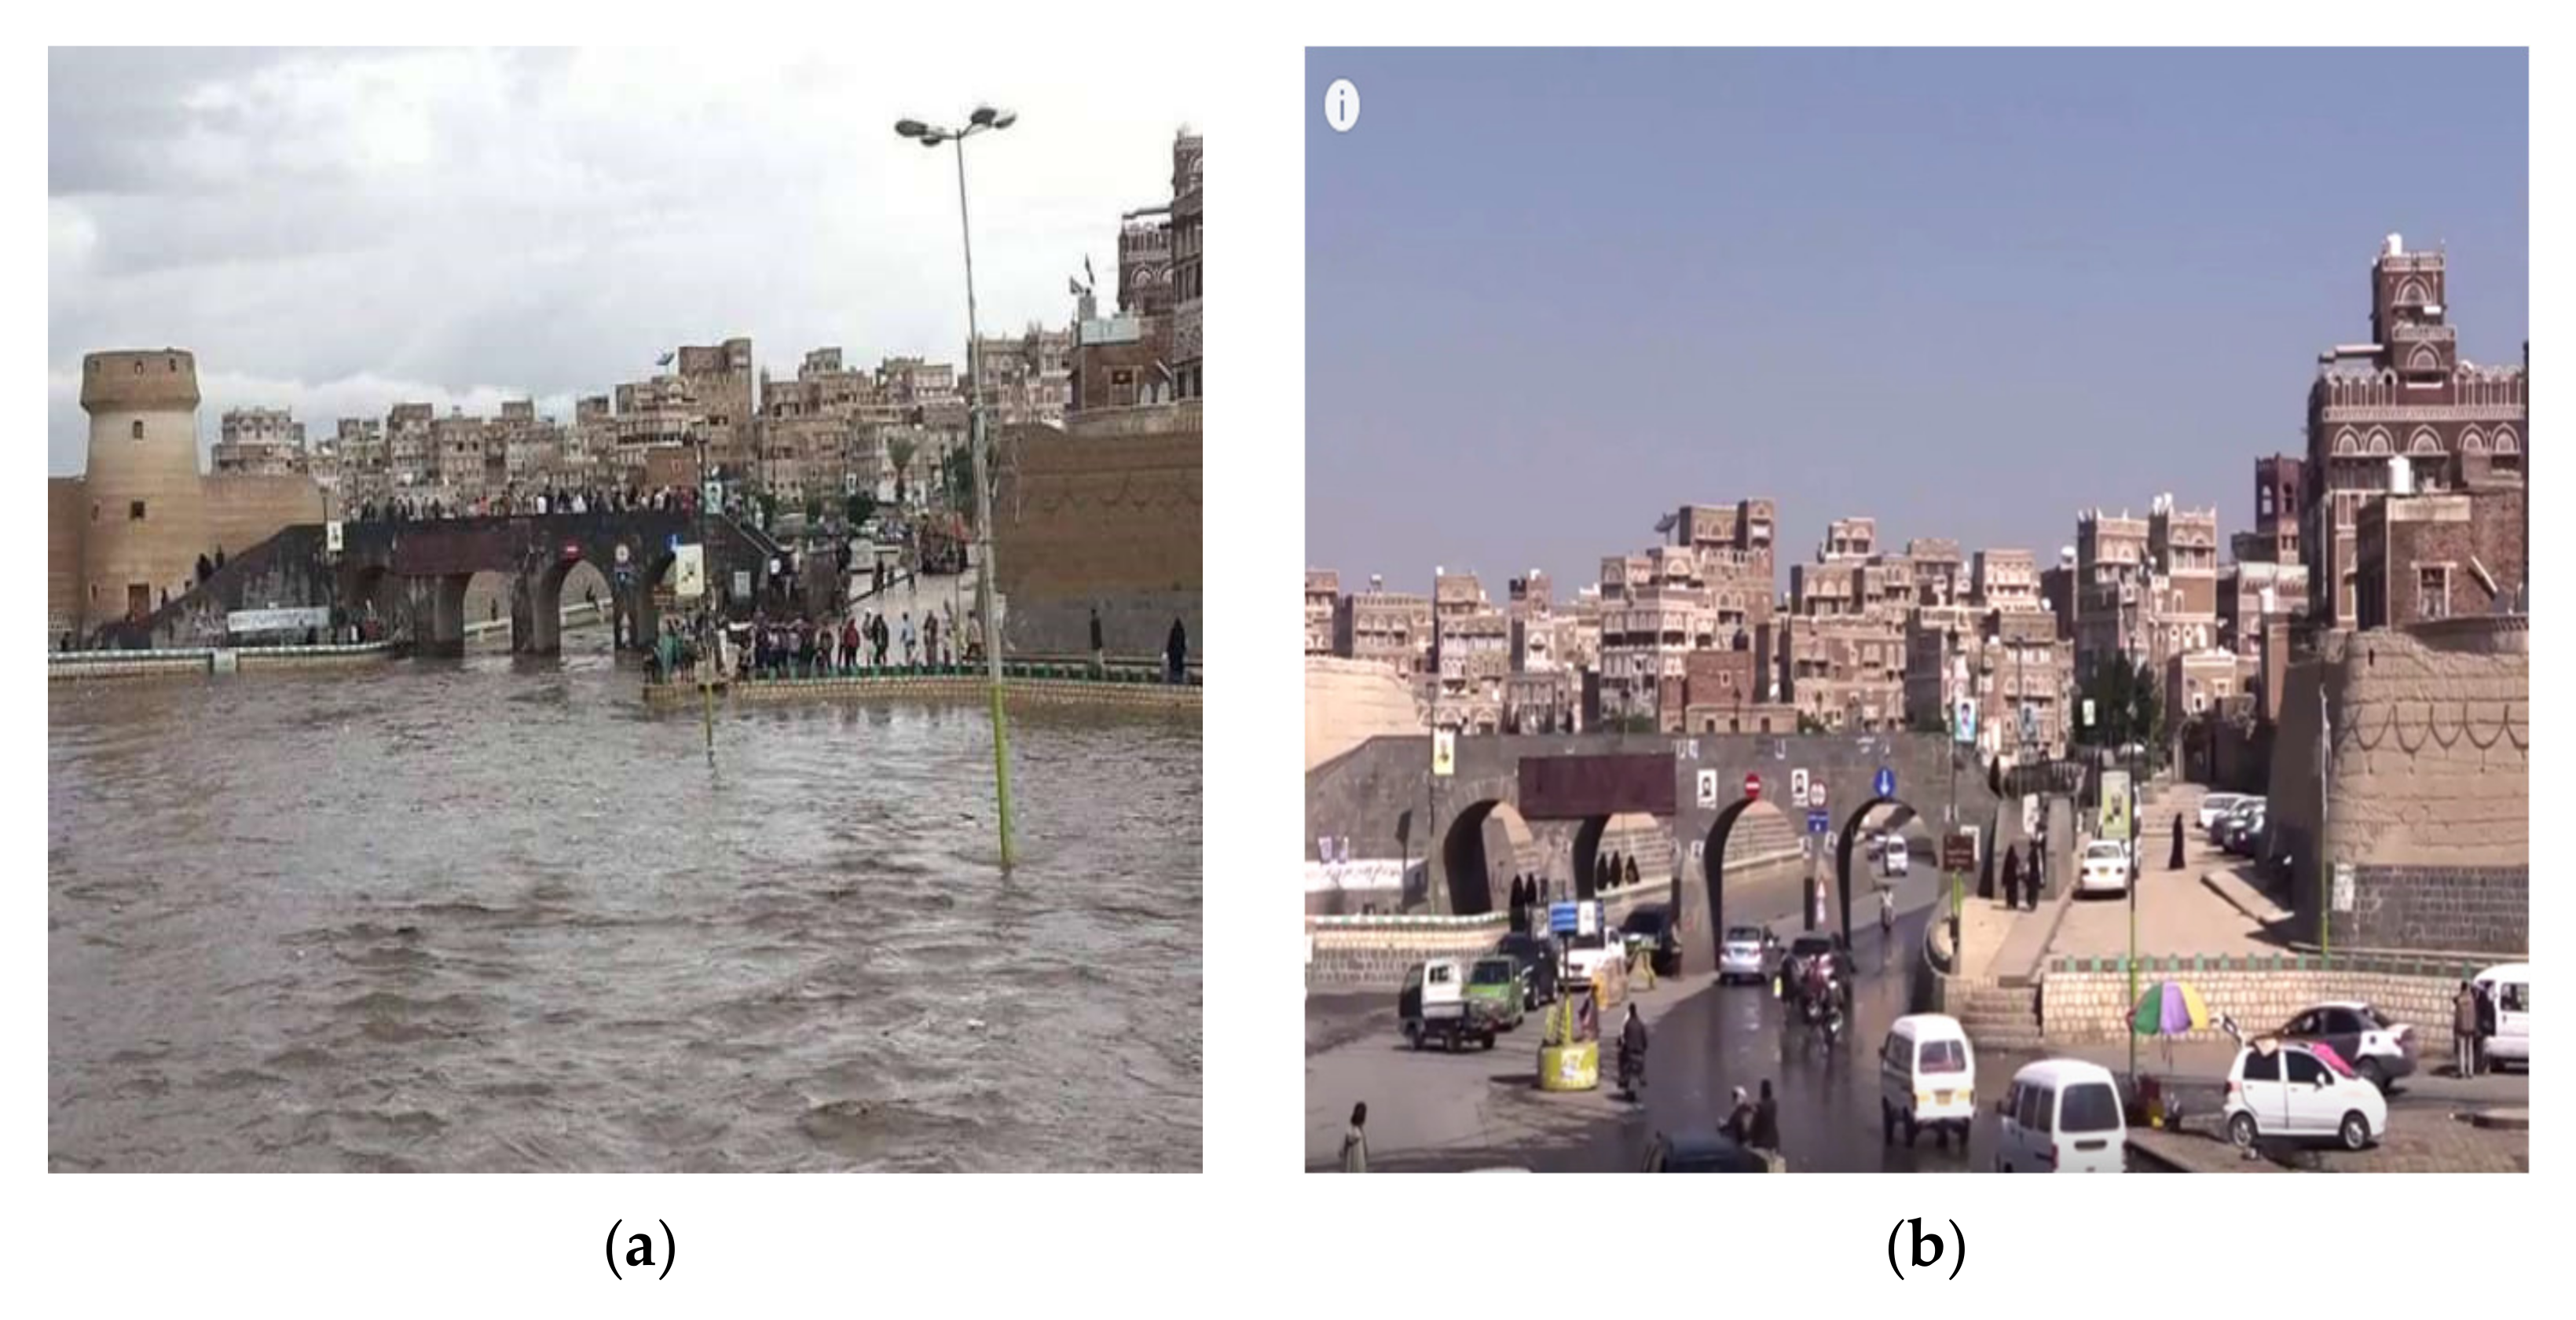
It is found that there is no permanent surface runoff except the streamflow (runoff) due to seasonal rainfall. In addition, some floods occur due to heavy storm rainfall in some years. The site’s topography makes most of the valleys pass from Sana’a’s center, causing floods. Flood damage increases with time due to urban expansion. Sana’a city is considered one of the cities in Yemen most affected by floods, as rainwater collects from highlands and then flows into the valleys and sewers to form a flow [15]. Sana’a city is affected by the runoff flow that comes from the catchment area and then flows through the Alsailah channel (Figure 4). Alsailah channel is the city’s only outlet that carries the accumulated stream flows and flood drainage during the rainy seasons; it is 30 km long, 15 to 16 m width, and its depth ranges between 1.4 and 3.6 m. On the other hand, Alsailah channel is a major corridor for vehicles, so there is a high risk for people and vehicles during rainy seasons and heavy rainstorm events.
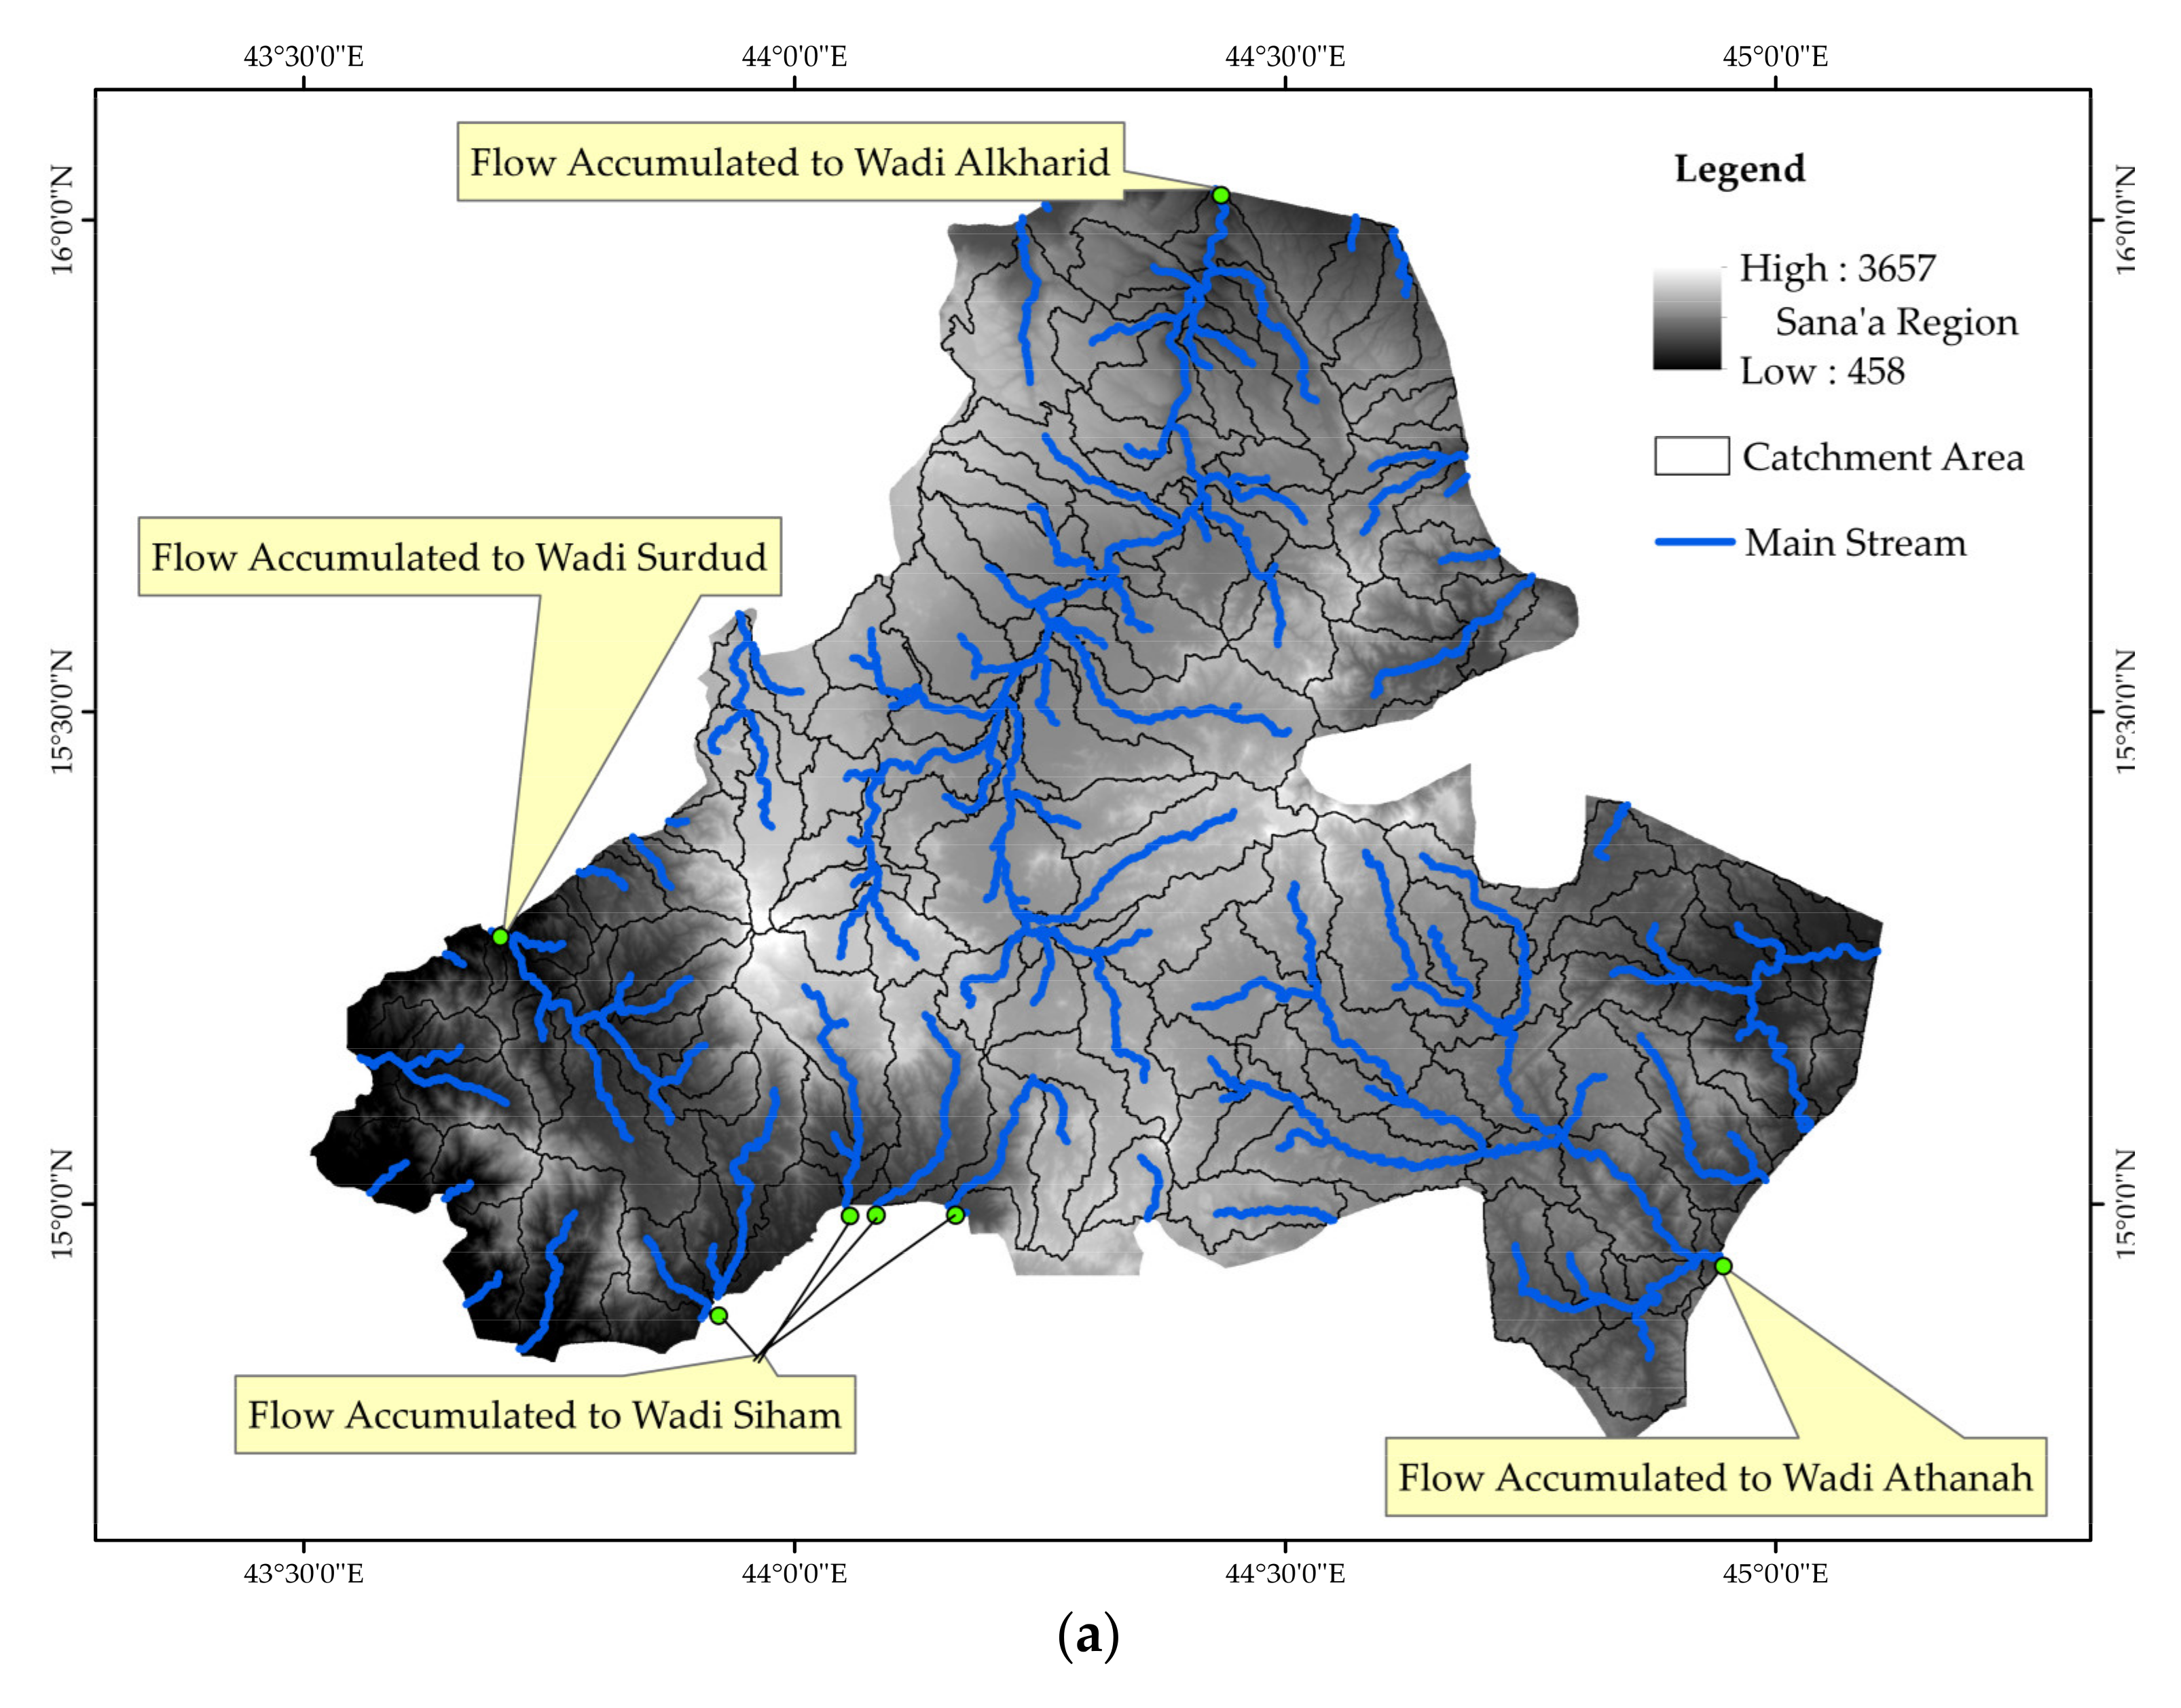
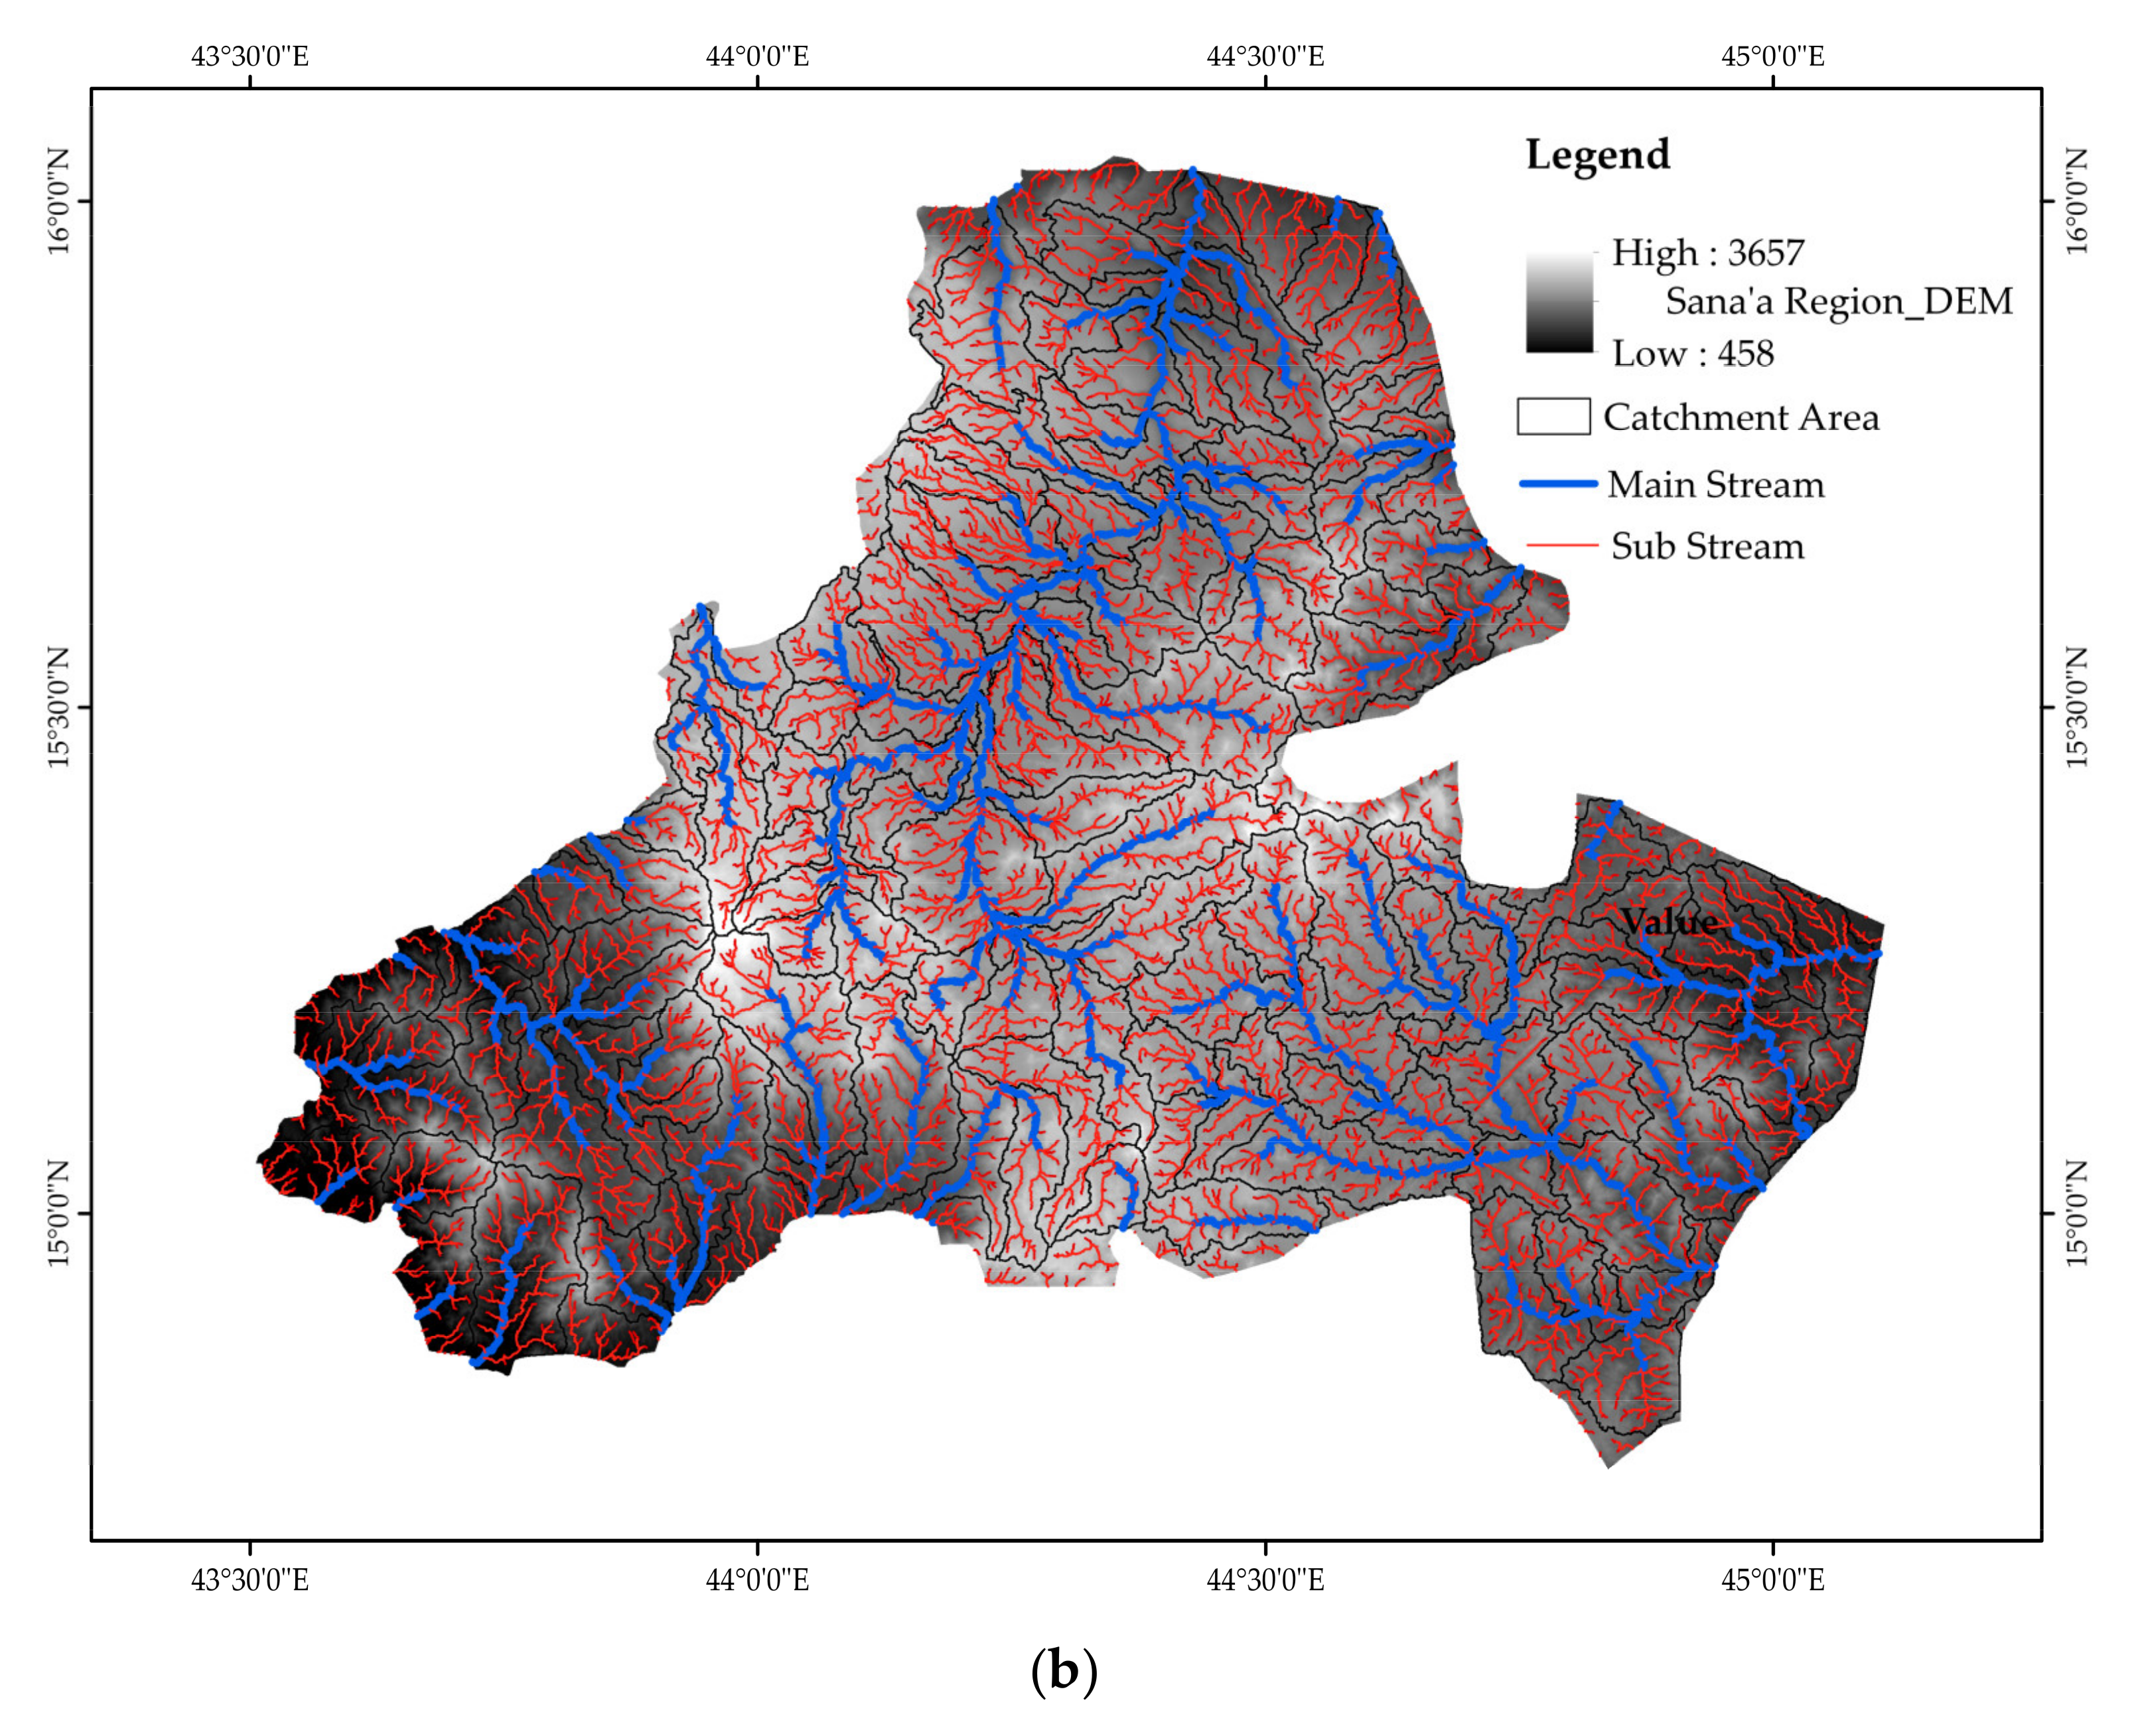
The results of the watershed delineation maps created using GIS 10.3 with Arc Hydro model demonstrate the main and sub-stream flow directions with catchment area in Sana’a region (Figure 5a,b). Figure 5a shows that there are four main wadies outlets, which represent the extensive four watersheds in Sana’a region. These are wadi Al-kharid, wadi Surdud, wadi Siham, and wadi Athanah. Some previous studies have reported an estimation of water flow (e.g., permanent springs or runoff) through these wadies and Sana’a basins. A description of these estimations with the findings of the current study is presented below to display the watersheds and streamflow runoff.
It is clear from Figure 5a that the catchment area of wadi Al-kharid starts from the east of Sana’a city and ends in Aljawf. The water collects in Alsailah channel and then moves to the northeast of Sana’a region to wadi Al-kharid in Aljawf governorate. Wadi Al-kharid is considered a significant watershed in Sana’a. Some springs feed the area, estimated at 0.2 m3/s [38]. Other springs within the region have an estimated flow of about 17.2 million cubic meters (Mm3) annually [39].
In Sana’a basin, the outflow is approximately 27 Mm3 annually [39], while inside Sana’a basin, the total annual flow is estimated to be about 40 Mm3 [13,29,39]. The valleys of the southwestern study area flow towards wadi Siham and wadi Surdud towards Al Hudaydah governorate. Al Ward and Ismail [40] indicated that the average surface runoff in wadi Siham is 82.92 Mm3 annually. Similarly, HWC [41] reported that the runoffs in wadi Siham and Surdud are 73 and 82 Mm3/year, respectively, with rainfall between 80–597 and 50–400 mm for wadi Siham and Surdud, respectively [41,42]. Atroosh [19] indicated that the surface runoff in the wadis of Al-kharid, Siham, and Surdud was 35, 89, and 69 Mm3/year, respectively. In contrast, the valleys of the southeastern Sana’a region flow out of the area towards wadi Athanah, in which the area is 11,500 km2 in Ma’rib governorate, the rainfall ranges between 100 and 400 mm annually, and the runoff is estimated at 5.9 Mm3/year [42].
Because the floods have resulted in significant human and economic damage, a set of projects were established to construct small dams and water barriers to alleviate floods and recharge groundwater that supports agriculture. These were by the government represented by MAI, and some external donors to Yemen, such as the Social Fund Development (SFD), Agriculture and Fisheries Production Promotion Fund (AFPPF), the European Union, and the United States Agency for International Development [43]. The idea of dams and barriers dates back to thousands of years ago when man invented the method of harvesting water by collecting it with barriers and dams. Over the past few years, new technologies and unique innovations have appeared in dam construction [44].
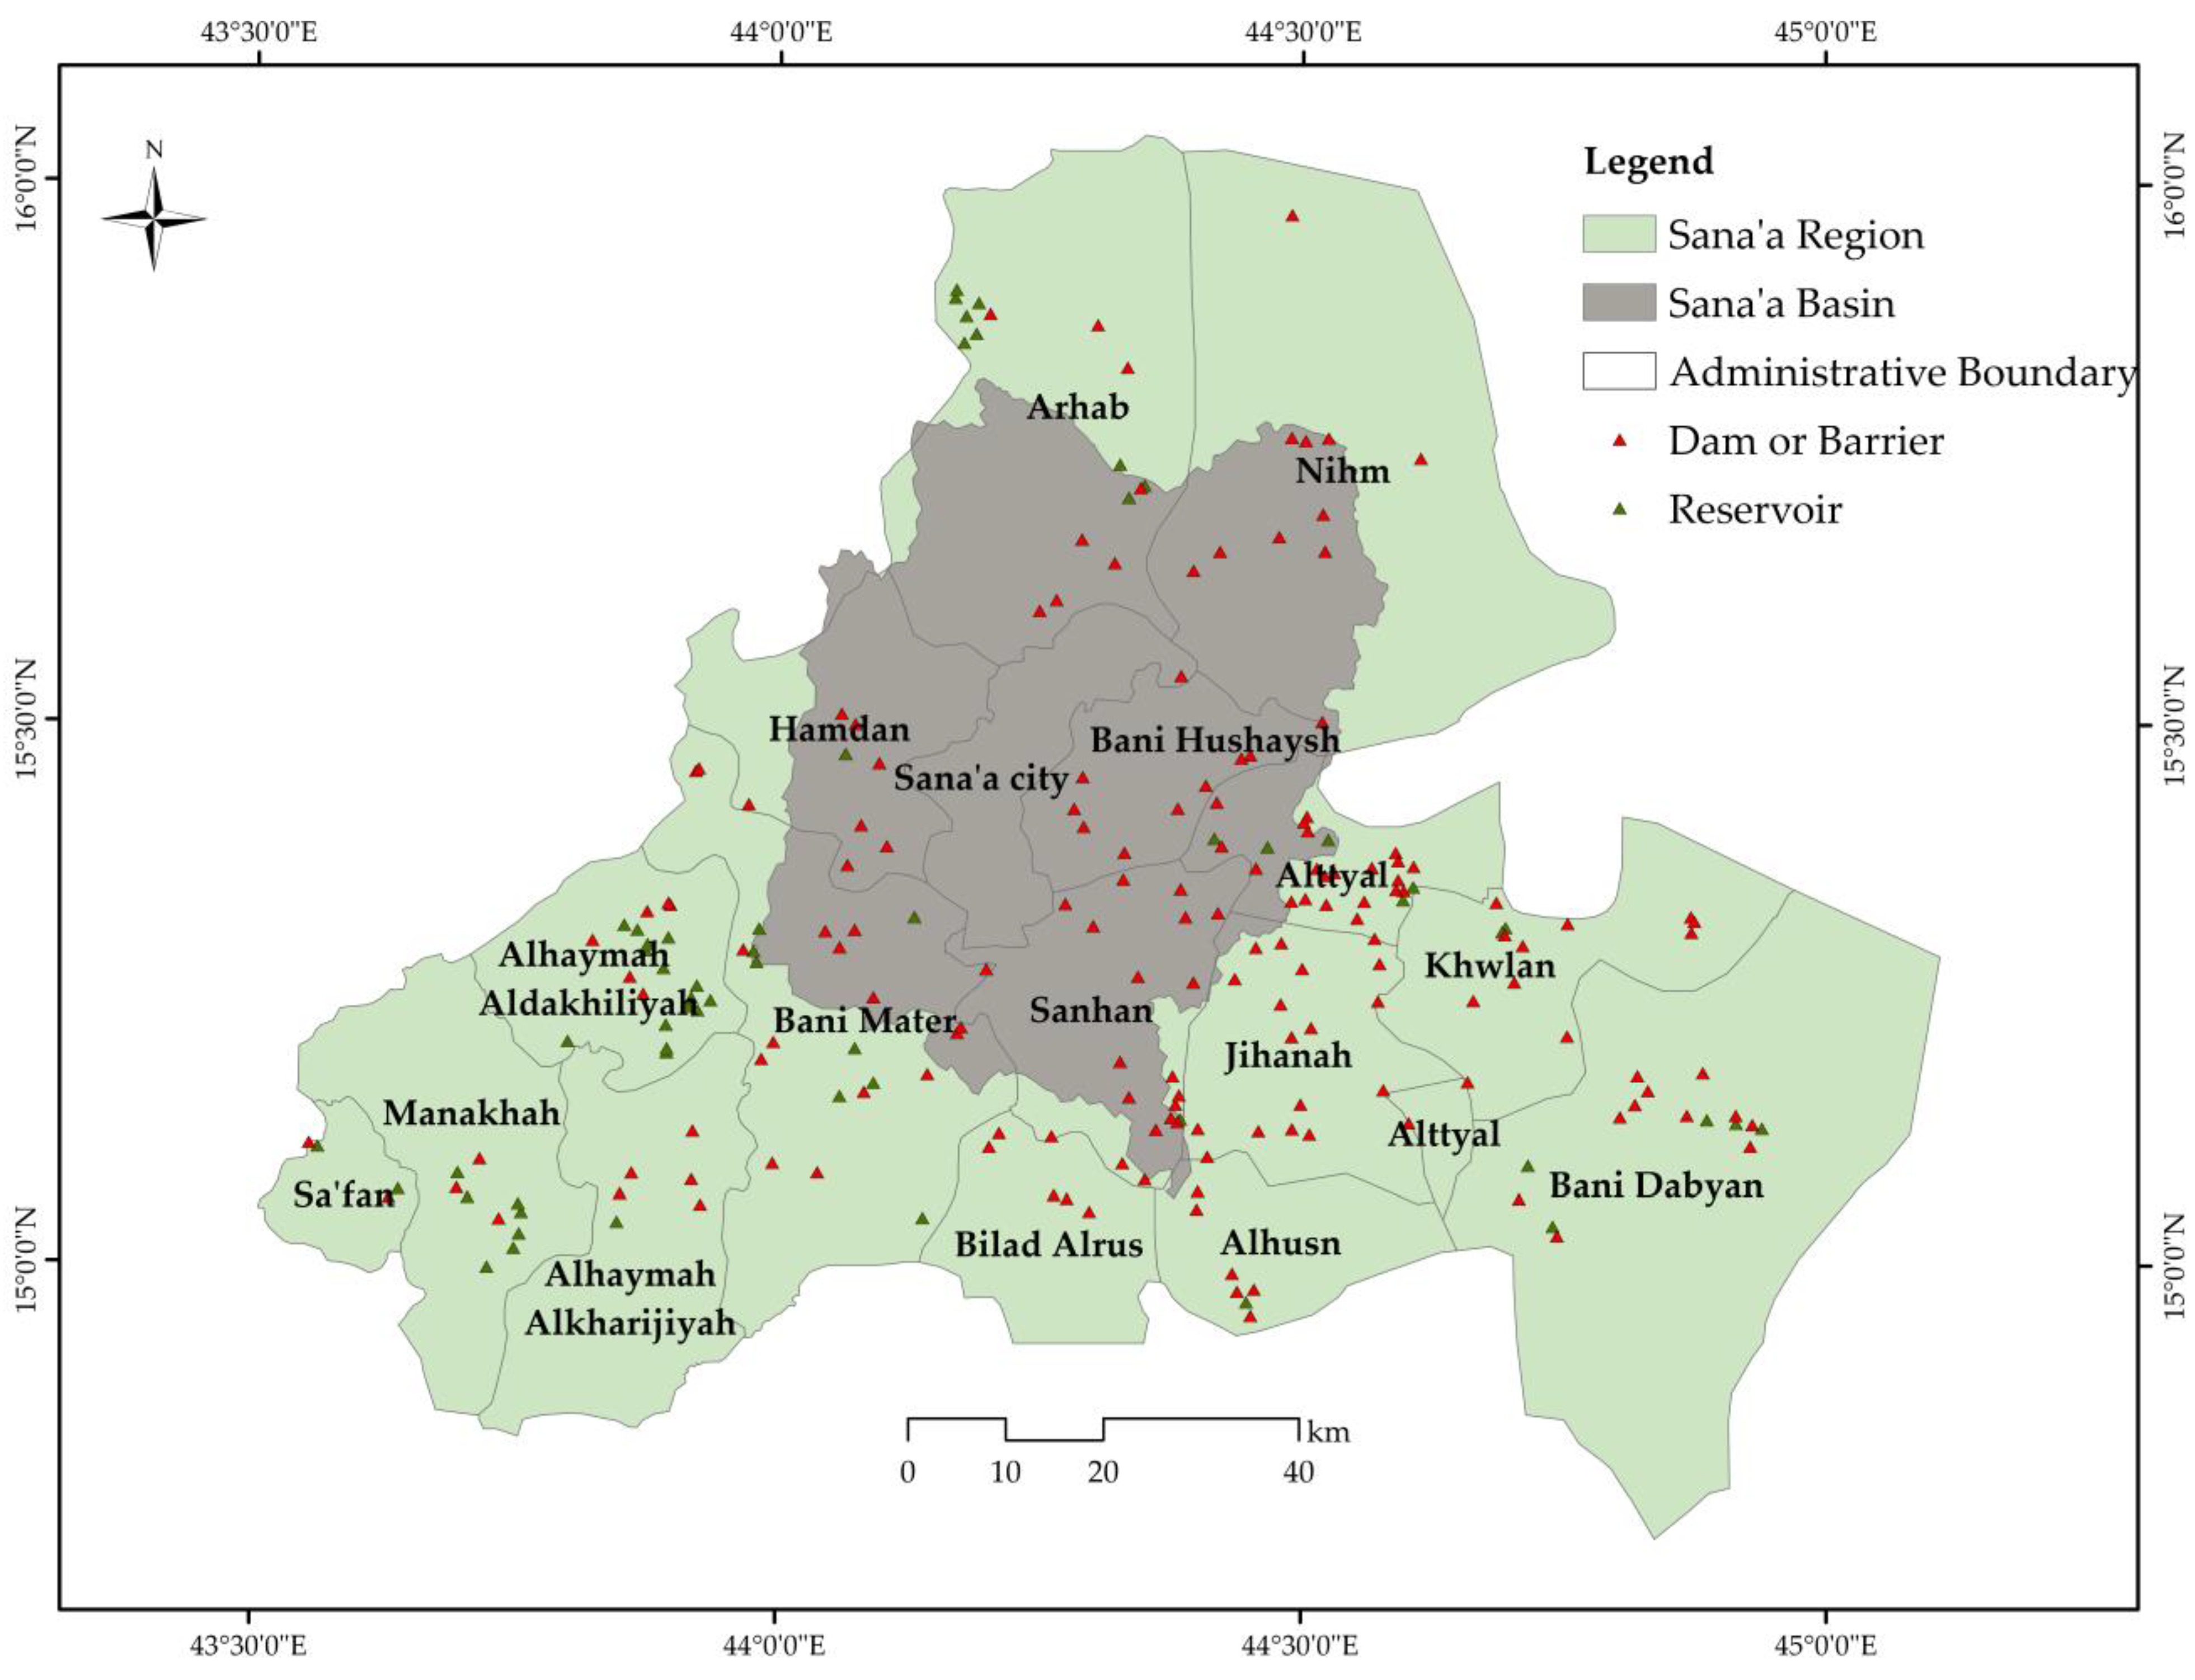
The results of data analysis demonstrate that 168 dams and 65 reservoirs have been constructed, as shown in Figure 6, with a storage capacity of 64.65 Mm3 and 0.24 Mm3, respectively. About 32% of them are located within Sana’a basin. Most dams and reservoirs are used for irrigation and domestic purposes as one of the water sources. However, about 80% of the total dams serve the purpose of their establishment, whereas 20% do not fulfill the purpose of their establishment for various reasons, such as the remoteness of the site from the beneficiaries and the lack of water transfer techniques or high leakage rates. Thus, the water does not stay for a long time, or the accumulated sediment rises in some dams. In rainy seasons, filled dams are about 74% of total dams, while the remaining are partially filled by 26%, which means that the number of dams is insufficient to harvest water and meet water demand.
3.2. Groundwater
It is found that people currently depend mainly on groundwater for irrigation and domestic uses in the study area. In some rural areas, rainwater is collected by traditional methods such as basins, ponds, and small dams [17,45]. The analysis shows that there are 198 wells that operate in Sana’a city for water supply for domestic uses. However, in 2019, many wells stopped working due to the low water level. The number of wells operating is about 70 out of 198 wells, and their depths range from 200 m to more than 1000 m, with an average production of approximately 11.5–14 Mm3. Sana’a city currently has more than 3 million people. People are suffering from the lack of freshwater. The amount of water does not meet the demand, so people depend on buying water from private sources with high costs. However, some people cannot access water, which leads to a decrease in the per capita per day for people in the city [20].
The number of wells in Sana’a governorate is unknown. No previous studies have reported the wells’ exact number and production. This could be attributed to the government’s inability to impose laws and reduce random drilling that threatens to deplete water. In addition, people believe that whoever owns the land has the right to dispose of it, which justifies the landowners in their right to dig wells [8]. It has been reported in some studies that the number of wells in Sana’a region is estimated at more than 20,000; most of these wells are concentrated in Sana’a basin, with about 13,000 wells [35,37,46], representing about 30% of the total area of Sana’a region. People cannot meet the drilling requirements; therefore, the daily consumption per capita decreases.
Sana’a Basin
The data and the analysis show that the area of Sana’a basin is about 3240 km2 [13,29]. Most of the population of Sana’a region is concentrated in Sana’a basin, which is estimated at 80% of the total population of Sana’a region due to the presence of water and urban areas compared to the rest of the areas that are considered mountainous heights. Figure 6 shows the location of Sana’a basin. Most previous studies indicate that the water table declined due to the lack of other water resources in Sana’a basin. Sana’a basin is the upper part of wadi Alkharid, which is considered one of the catchments of wadi Al-Jawf north of Sana’a. The average annual rainfall ranges between 100 and 350 mm [8,29,36]. The basin is fed by 22 sub-basins [15,39]. These sub-basins have an estimated surface runoff due to seasonal rains of 40 Mm3 [13,29].
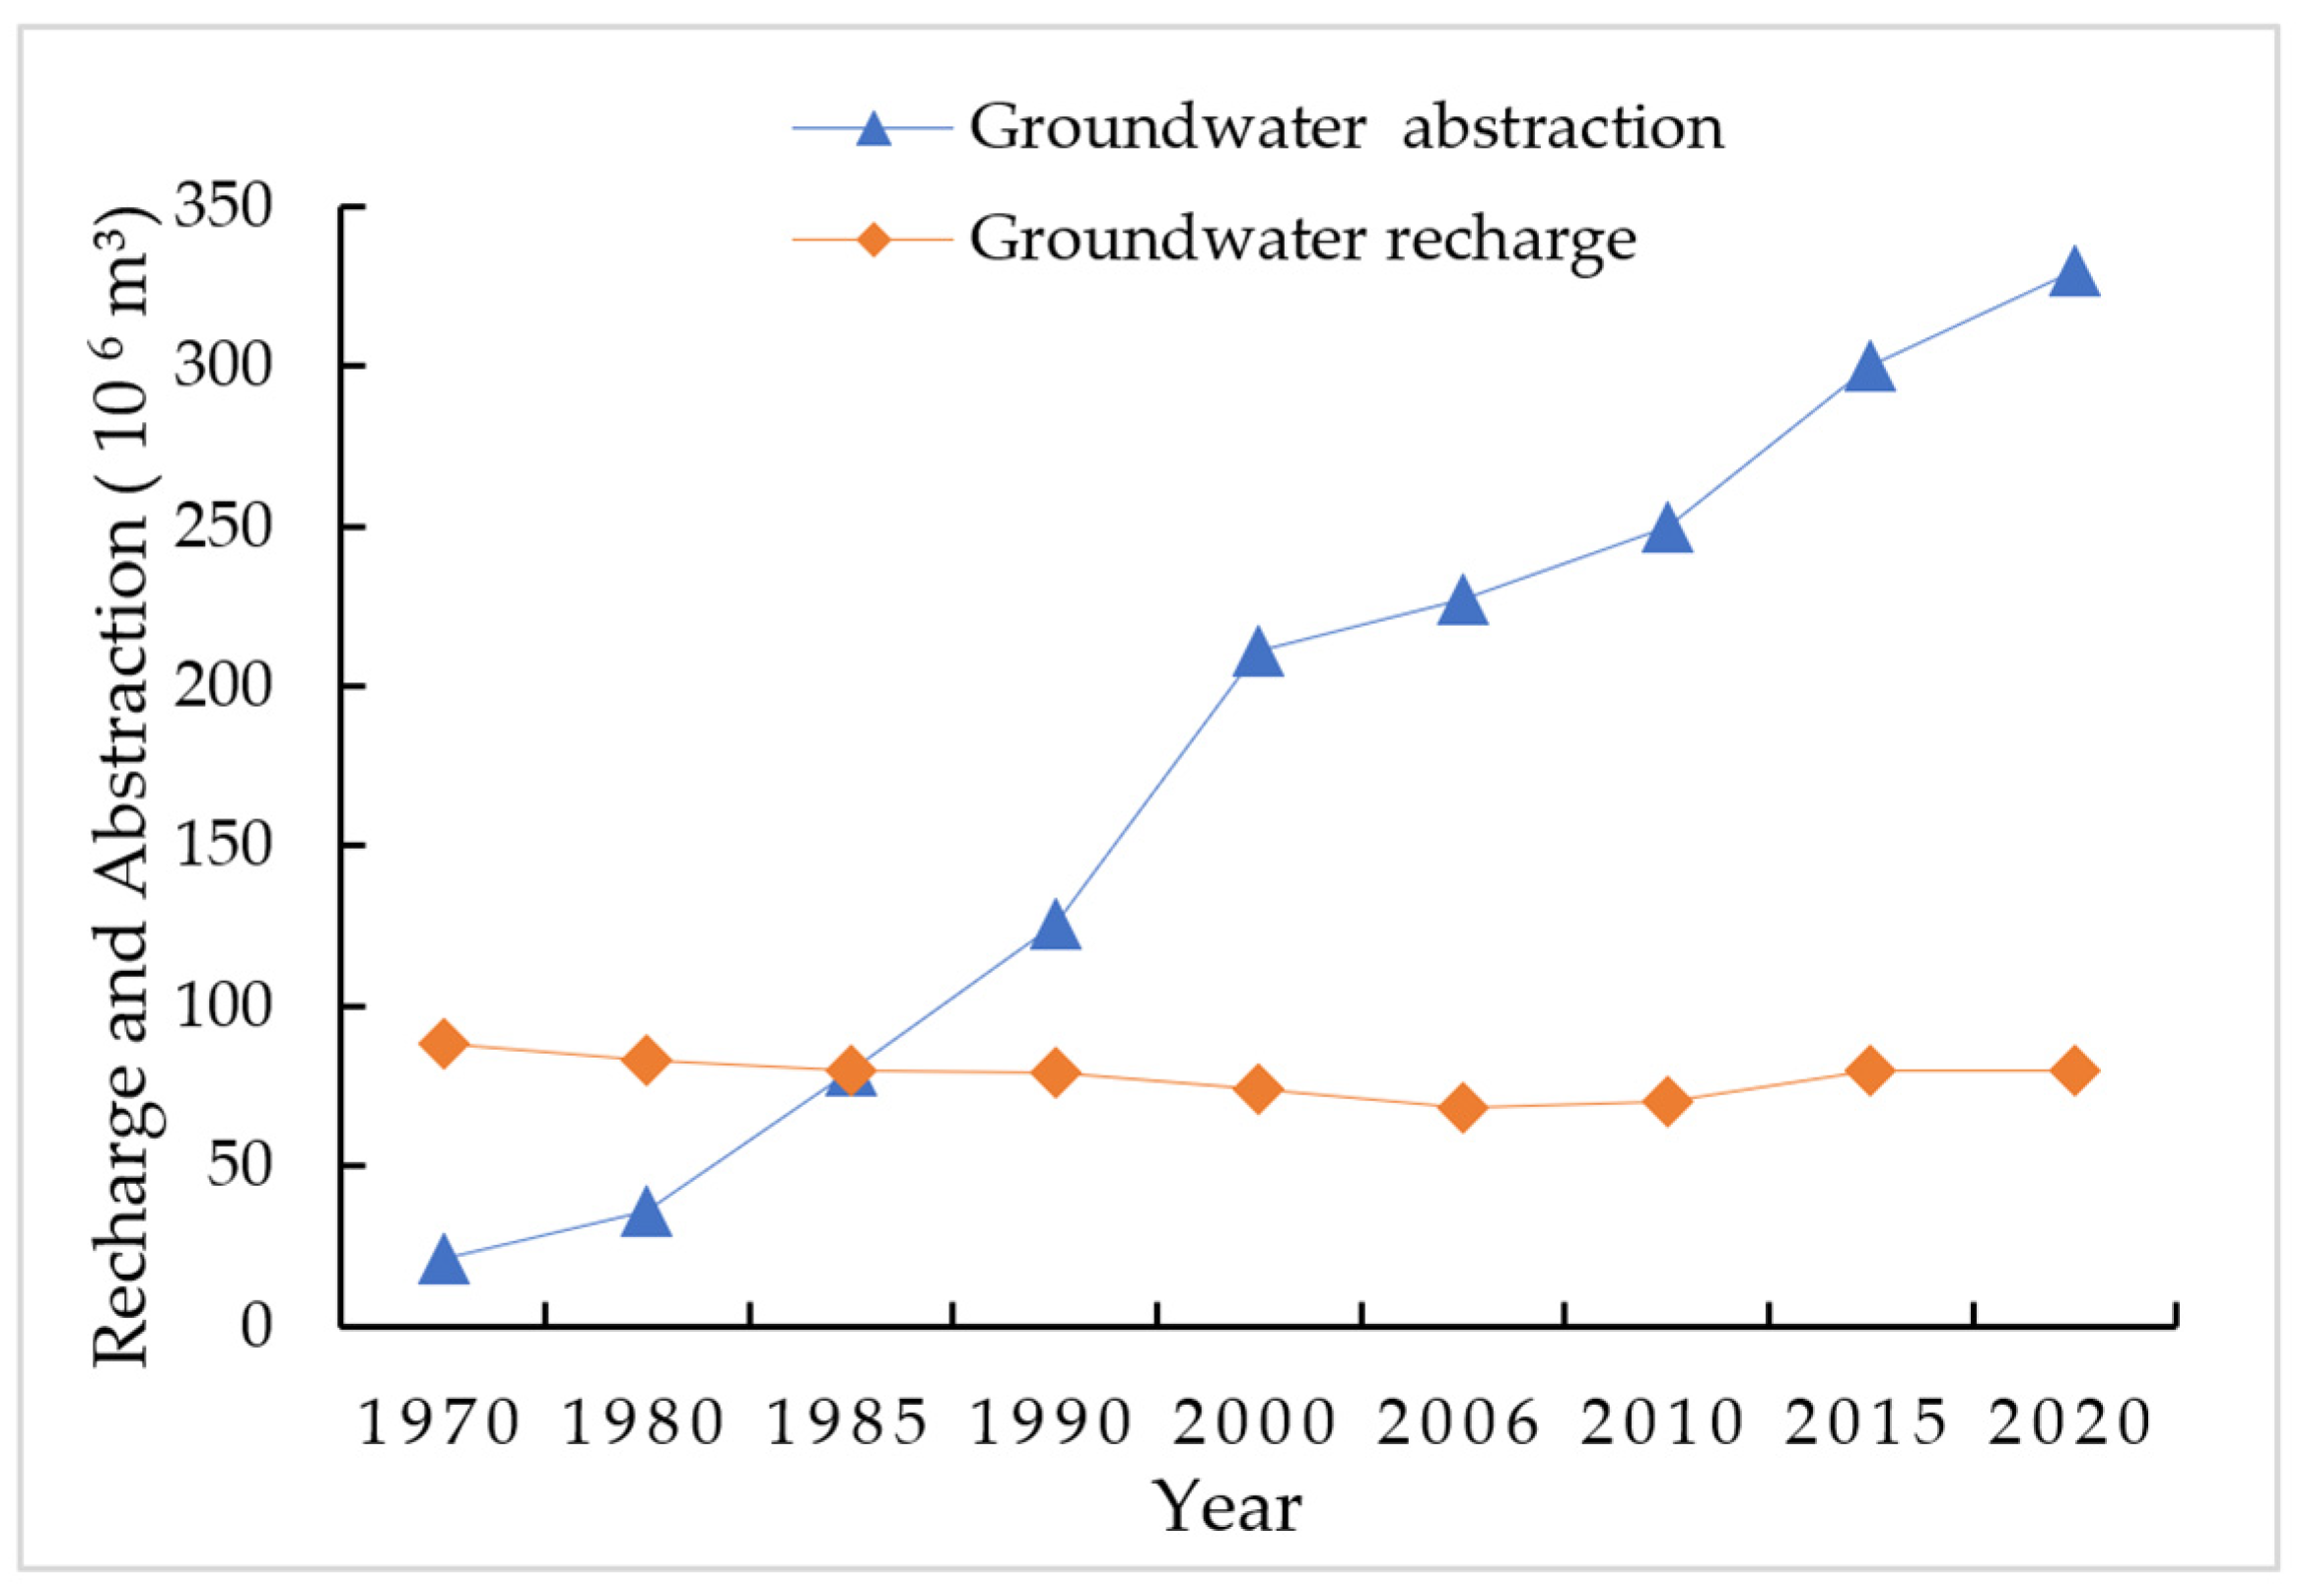
Figure 7 demonstrates the groundwater abstraction and recharge in Sana’a basin. Groundwater abstraction does not correspond to groundwater recharge during the past period of 1970–2020 except in 1985 [46]. There was a considerable increase in groundwater abstraction from approximately 25 Mm3 in 1970 to about 330 Mm3 in 2020. However, the groundwater recharge amounted to more than the abstraction from 1970 to 1984, then it was equal in 1985, and after that, there was a slight decrease until 2010, followed by a small increase to 2020, as shown in Figure 7. The groundwater abstraction was about 330 Mm3, whereas the groundwater recharge was approximately 80 Mm3 in 2020, with a gap of about 250 Mm3 [17,37]. The comparison between the past situations shows that the groundwater abstraction was much less than the recharge in 1970, while it was much more than the recharge in 2020 (Figure 7). This means that there is an enormous abstraction of groundwater in Sana’a basin. The increased drilling of wells in the basin leads to large amounts of groundwater withdrawal. There is no strong governorate management, which means it is considered a traditional local system, increasing the pressure on the government [8,47,48]. Consequently, groundwater is still at risk in Sana’a basin.
3.3. Water Demand
3.3.1. Domestic Water
Water demand for domestic purposes was estimated in the study area of Sana’a region. As explained earlier, the current and future estimation usage was based on the assumption of 70–85 m3/capita/year usage. The results show that the estimated water demand was in the range of approximately 106–128, 124–151, 145–176, 170–206, 199–241 Mm3 in Sana’a governorate (Figure 8a), whereas in Sana’a city, the estimated water demand was in the ranges of about 249–302, 312–378, 389–472, 486–590, 607–737 Mm3 for 2020, 2025, 2030, 2035, and 2040, respectively (Figure 8a). When comparing these findings with the available data on water supply in Sana’a city, the result demonstrates a significant deficit between current supply and estimated demand. The deficit is gradually increased by predicting the water amounts required for domestic use. In 2019–2020, the public water network produced about 11.5–14 Mm3 in Sana’a city, indicating a significant difference from the estimated amount in 2020, which was in the range of 249–302 Mm3. This quantity is considered minor and insufficient to meet the people’s water needs, so people buy water from private sources. Currently, the public network does not cover the needs of 10% of the population of Sana’a city, which increases the demand for water from private sources and puts the government in a difficult situation. In 2015, the percentage of families benefiting from the public network in Sana’a city was 44%. It decreased to 28% in 2017 because of the conflict in the country (“study conducted for a sample of families”) [49]. In 2020, the public water network served only 10% of the population [13].
Unfortunately, there is no available data to compare the estimated demand with the actual water supply in Sana’a governorate. At any rate, there is a crisis of freshwater in urban and rural areas. Sana’a governorate relies on other solutions such as rainwater harvesting and digging wells—either personal or participatory wells. On the other hand, some people use cars and donkeys to collect free water from places far from their locations [50]. These solutions would meet some amount of water demand but are still unsatisfactory and insufficient. This means that the region withdraws large amounts of groundwater through private wells. The deficit is significant and requires great efforts to achieve water balance by constructing dams and reservoirs for rainwater harvesting and improving water consumption.
The water demand for the industrial sector ranges between 4.8 and 16 Mm3 (2004–2020), while the estimated touristic water demand was 0.36 Mm3 in 2005 and 7.12 Mm3 in 2020 [39].
3.3.2. Agriculture Water Demand (AWD)
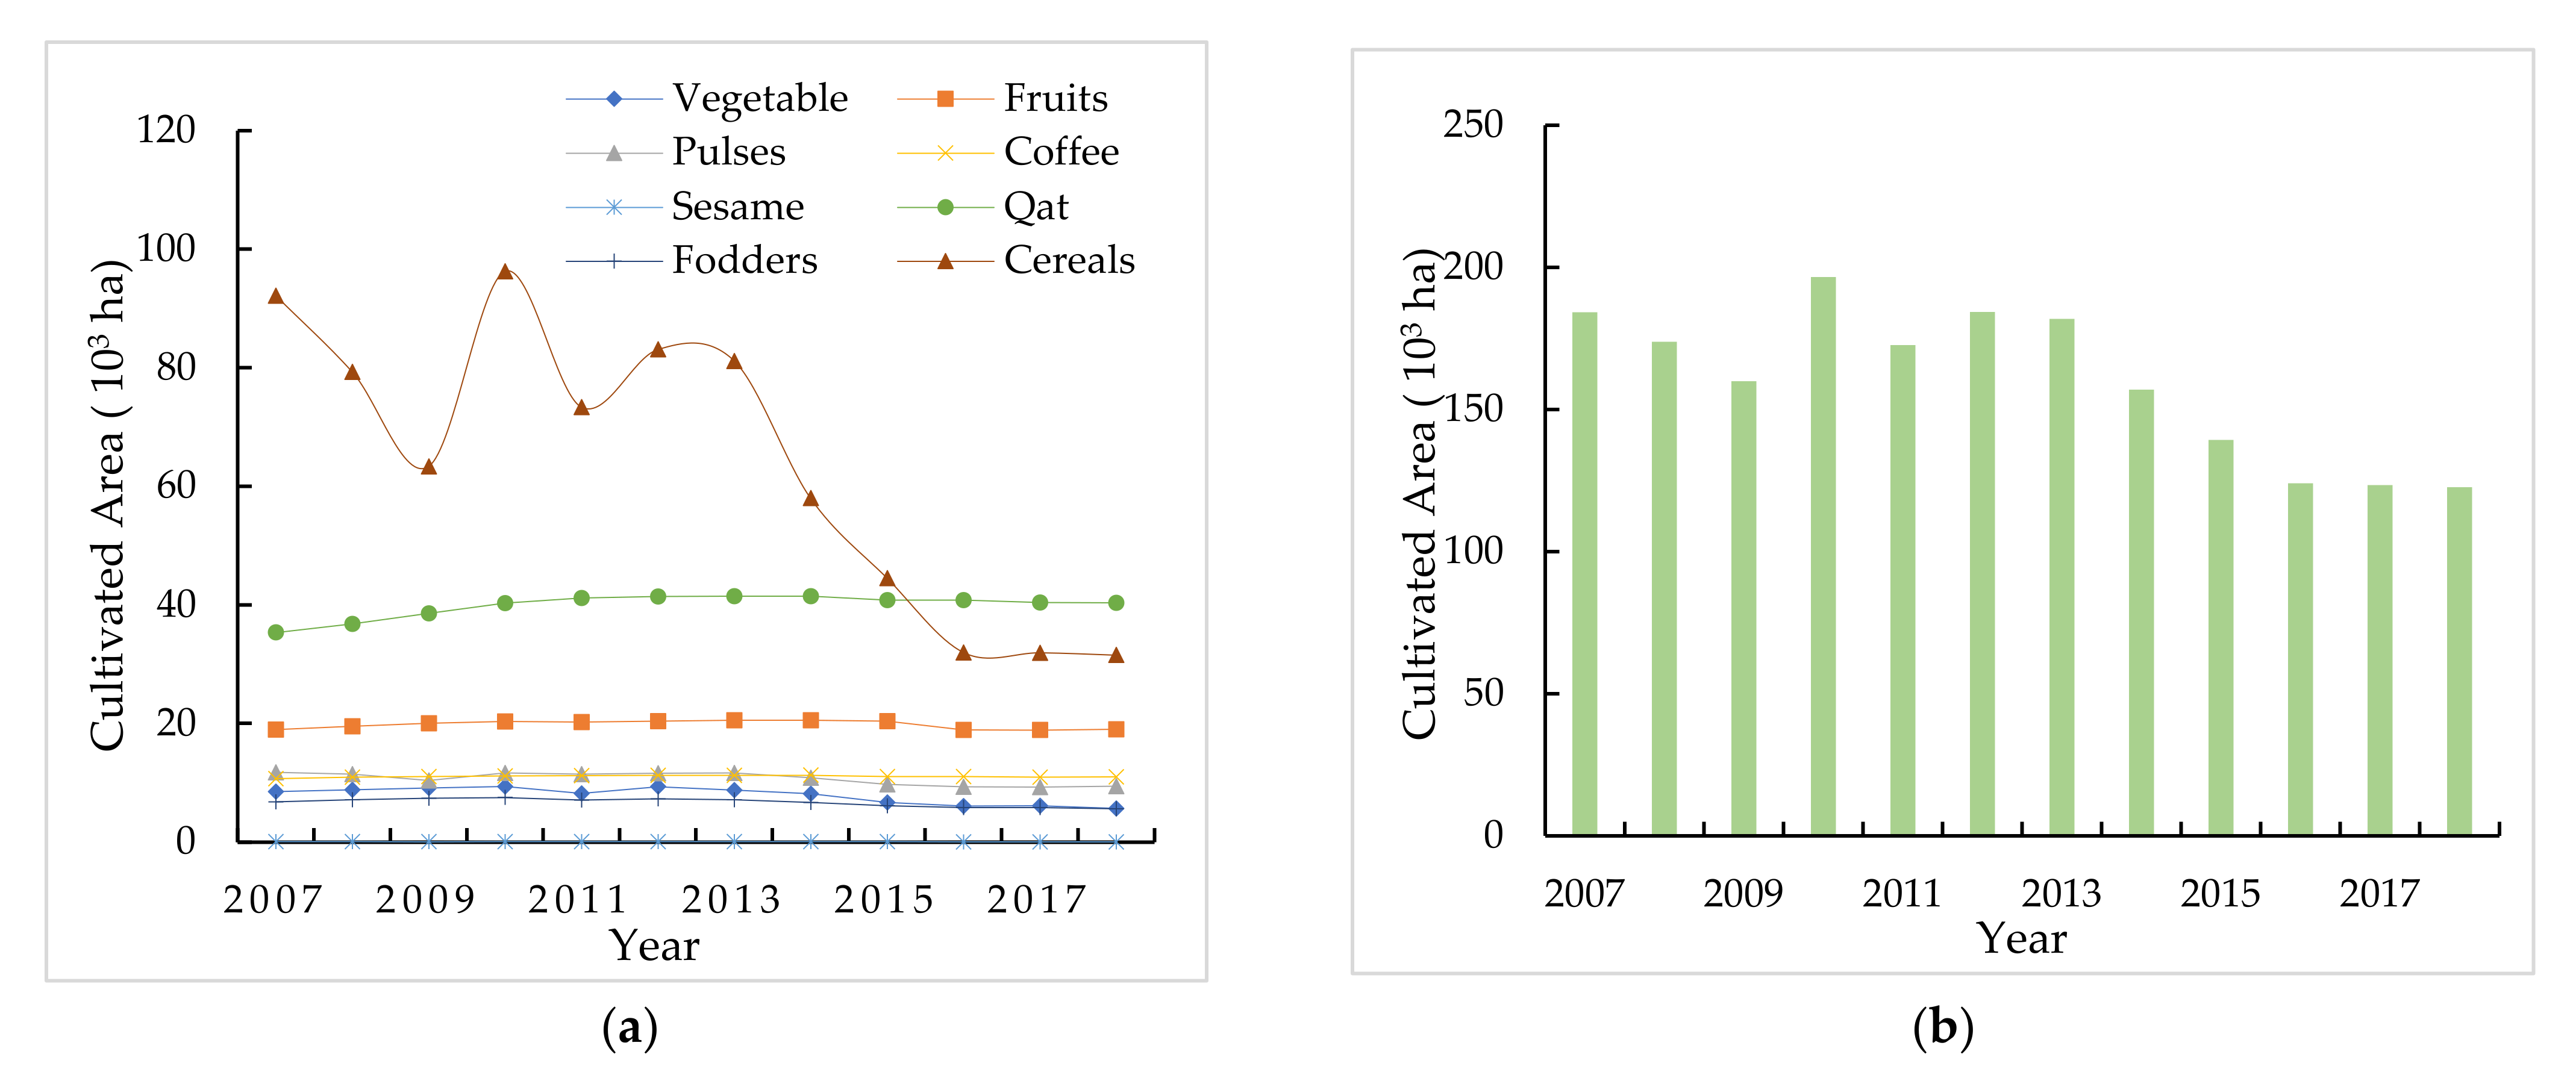
The agriculture water demand (AWD) was estimated for Sana’a region’s cultivated areas for each crop type from 2007 to 2018 (Figure 9a,b). The estimation was based on the values of Crop Water Requirement (CWR) reported in some previous studies. The CWR for vegetables, cereals, fruits, legumes, and sesame is in the range of about 464–841, 380–761, 892–956, 360–420, and 401–502 mm, respectively, while coffee needs approximately 1111 mm of CWR [51]. The CWR for fodder is about 1300–1440 mm [15]. The Qat plant needs about 6028–12,500 m3/ha of CWR annually [52,53,54]. The average evapotranspiration of Qat plantation ranges between 786.7 and 602.8 mm for the irrigated method and 412.8–506.2 mm for the rainfed method [54].
The results of the calculation show that the annual AWD for cereals, vegetables, fruits, sesame, legumes, fodder, and Qat plant is about 162–607, 33–58, 119–186, 0.18–0.2, 37–59, 73–108, 178–518 Mm3, respectively.
The total annual AWD for all types of crops and Qat plants was calculated and is summarized in Table 1. The amount of water consumed for various crops decreased annually, except there was a slight increase in 2010 and 2012. In 2007, it was between 1.14 and 1.53 Bm3, while in 2018, it declined to 801 Mm3 and 1.16 Bm3. This decrease is attributed to people’s lack of interest in agriculture due to the lack of water sources and the lack of alternative solutions to find water. People’s situations have become difficult, and they cannot supply private water for agriculture, forcing farmers to leave farming and stabilize in the city to search for work. Therefore, CWR is enormous compared to the total amount of water in the area. The Qat plant increased from 19% of the total cultivated areas in 2007 to 33% in 2018.
Sana’a region is considered one of Yemen’s largest regions in agriculture crop areas, representing 11–13% of the total agriculture crops areas in Yemen in 2011–2018. The cultivated area in Sana’a region is about 145,321 hectares (ha), representing 11.9% of the total area. The AWD for the agricultural sector is significant for future planning and sustainable water management. Significantly, since recent years have seen a decrease in the cultivated area due to water depletion and scarcity, the cultivated area has decreased from 184,217 ha to 122,583 ha (Figure 9b). Most crops have decreased in cultivated area, while some have maintained the same cultivated area. The only plant that increases in area annually is the Qat plant, as shown in (Figure 9a). Qat is the only plant whose area is increasing with time. In 2007, the area of Qat represented 19.4% of the total cultivated area, while in 2018, it reached 33% of the total area. This increase was reflected in the increase in AWD.
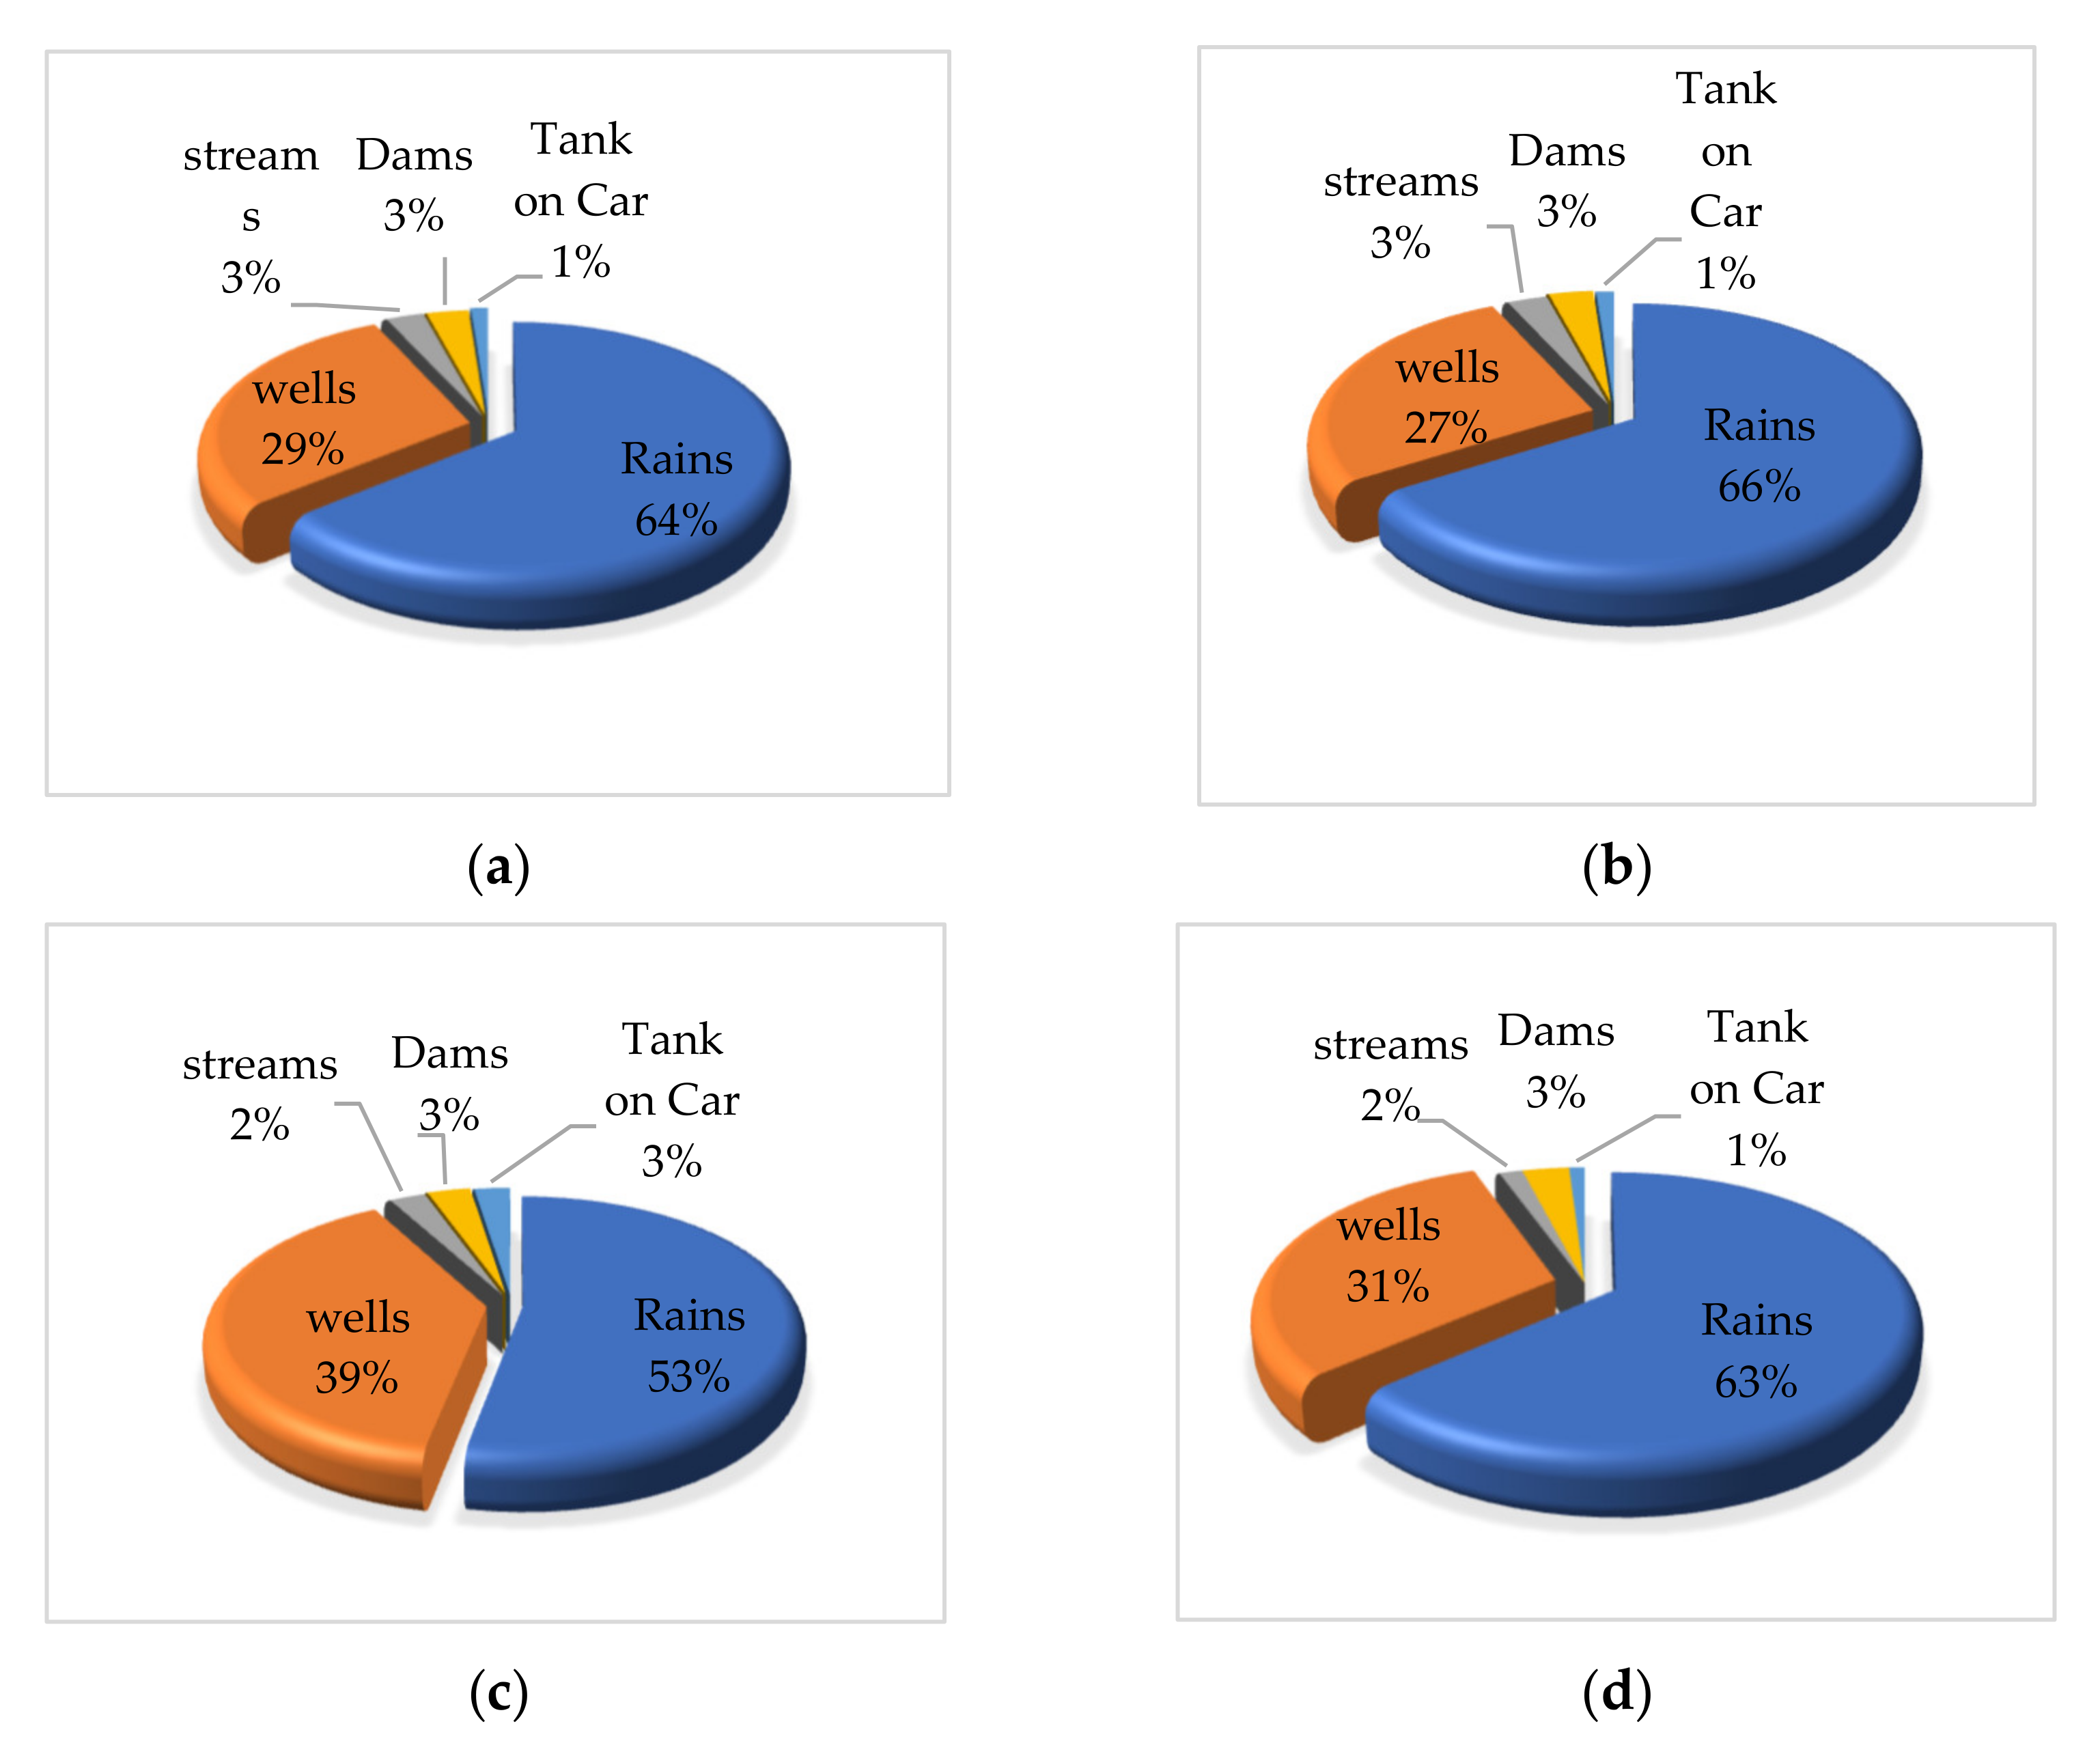
The results demonstrate that there are different irrigation sources, whether surface water such as rainfall and spate irrigation or groundwater such as wells and others. Figure 10 shows the various irrigation sources for the cultivated areas. The cultivated areas that depend on rainwater represent 64, 66, 53, and 63% for 2011, 2013, 2015, and 2018, respectively, while the areas that depend on wells are 29, 27, 39, and 31%, respectively (Figure 10a–d). In 2015, the percentage of dependence on wells increased to 39% due to increased drilling of wells and a lack of other sources (Figure 10c). In 2018, it decreased to 31% due to groundwater depletion and the inability to provide fuel pumps (Figure 10d). The Qat plant is the most consumed and often depends on groundwater, while most of the other crops mainly depend on rainwater.
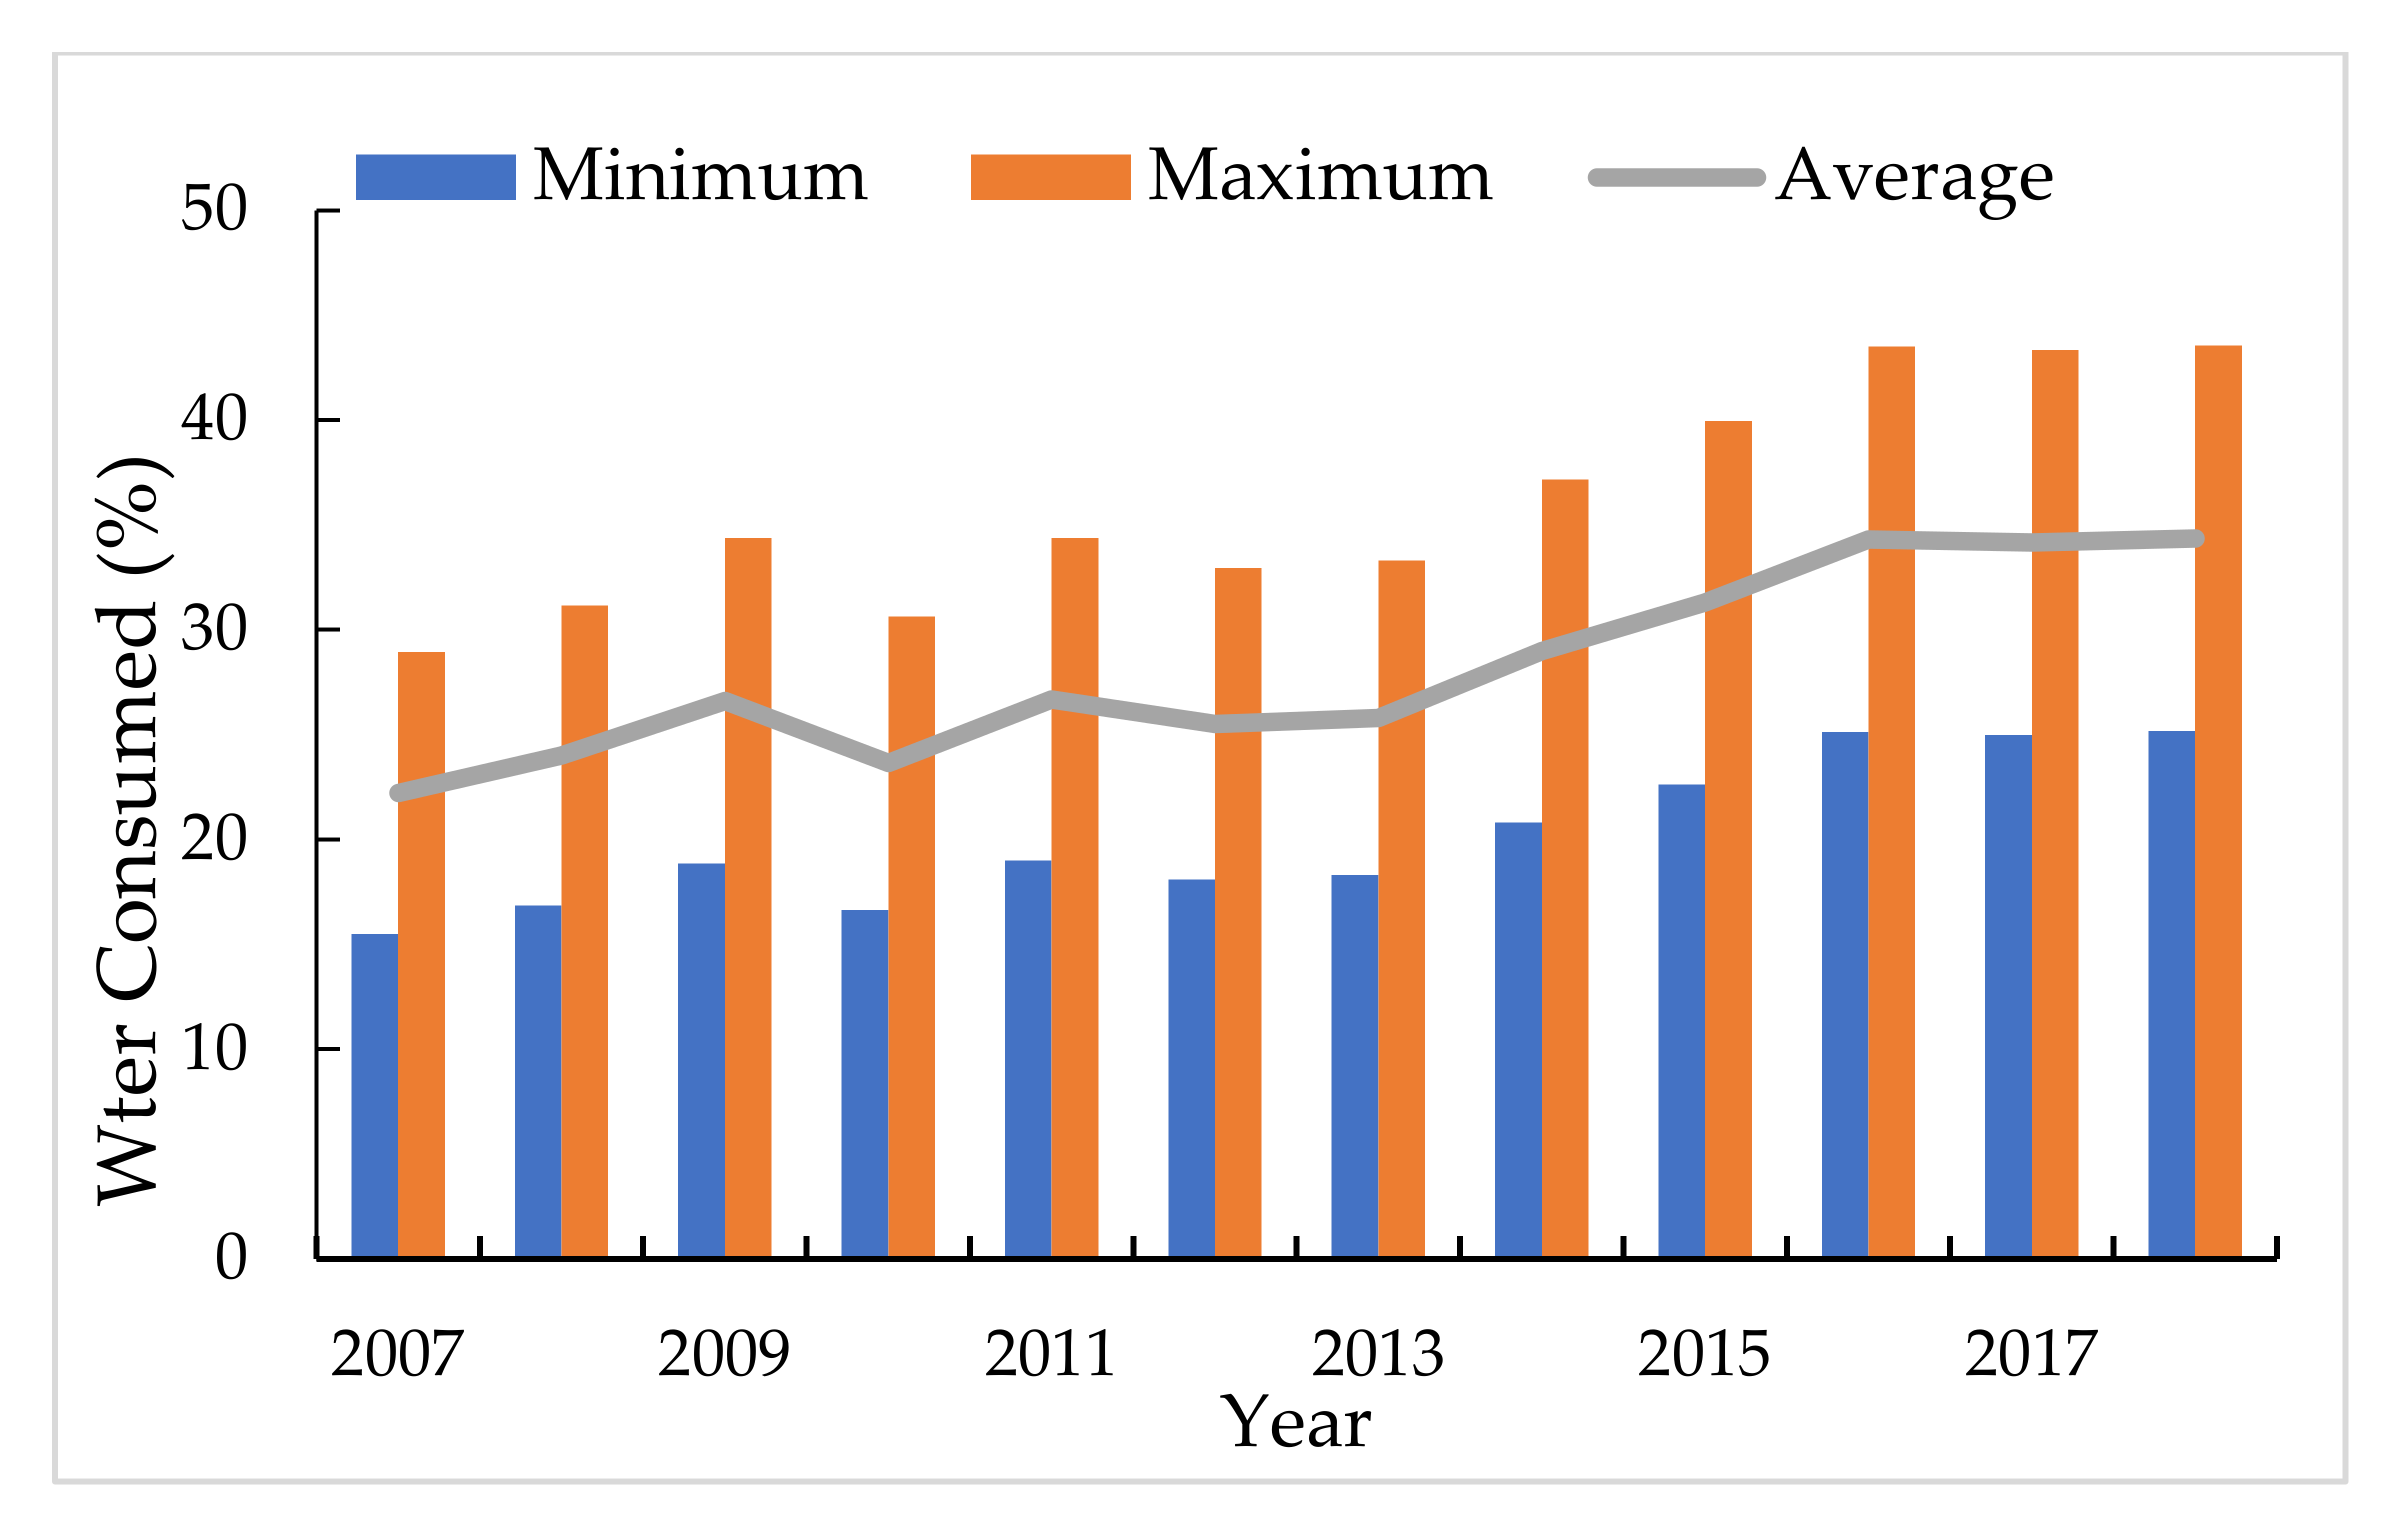
The decrease in the agricultural area for crops and the increase in the Qat plant mean that most people have replaced crops with Qat, which is the primary source of income for most people. It is found in the current study that Qat consumes large amounts of water. As shown in Figure 11, Qat consumed about 15 to 29% of the total water used for agriculture in 2007, which increased every year until it reached about 25–43% of the total water used for agriculture in 2018.
3.4. Wastewater Reuse
A wastewater treatment plant was built in Sana’a region in 2000 and is located in the north of Sana’a city and was designed to serve 450,000 people [55]. The station aims to use the resulting water for irrigation, reduce groundwater withdrawal, and protect surface and groundwater sources from deteriorating quality [56]. Since its establishment, it has faced major technical and operational problems. This station was designed to treat 50,000 m3/day. After five years of construction and operation of the plant, the plant reached its capacity; it was expected to reach its maximum capacity after 15–20 years of the design age of the plant. In 2000, the plant started treating 19,000 m3/day. In 2011 and 2014, its productivity increased to 50,000 and 55,000 m3/day, respectively, which means that in 2011 it was operating above its design capacity. This is considered one of the plant’s problems, and the outflow water quality is poor. The treatment efficiency does not exceed 70% compared to neighboring countries such as Oman and Tunisia, whose efficiency reaches more than 90% using the same treatment method, “activated sludge” [57]. Due to the low efficiency of the treatment, it was proposed to establish a new plant in Sana’a area, where the Canadian companies Tecsult and Hydrosult conducted a feasibility study for the plant. Still, the project faltered due to the difficulty of acquiring the land area [55]. In 2015, the plant stopped working altogether due to electricity and essential services interruption. After that, other funding sources were searched for, such as UNICEF and the Red Cross, to operate the plant, which remains working with 50% of the operational departments. Despite these measures to alleviate the station’s problems, there are still many administrative and technical problems that exist. The importance of treatment plants is no less paramount than water projects, as water treatment is a new science that contributes to the irrigation of agriculture crops in large proportions and maintains the quality of surface water and groundwater [58]. The water treated by the wastewater plant is used to irrigate about 95% of the surrounding farmlands [59]. It is used to irrigate a variety of agriculture crops, including cereals and Qat [59]. There are no accurate data or reports about the irrigated area and types of crops covered by Sana’a wastewater treatment plant.
Based on the results of the previous sections’ analysis and estimations of water supply and demand for Sana’a region, the final results are tabled in Table 2. Table 2 shows the estimated results for the amounts of water supply and water demand using the available data from 2007 to 2018. Available data for agriculture were found until 2018. There are no available data after this year. The water supply includes the amount of water from rain, storage in dams with barriers, treated water, water springs, and the public water network from wells. The water demand includes the estimated amount of water used for domestic use, industrial, agriculture, and tourist water demand. The water supply and demand vary from year to year. It is clear from Table 2 that the maximum and minimum water supply were about 1044.25 and 711.25 Mm3 in 2010 and 2015, respectively, while the maximum and minimum water demand were about 1707.2 and 1352.4 Mm3 in 2010 and 2016, respectively. The water deficit is in the range of 502.8–723.2 Mm3 between 2007 and 2018.
In general, the estimated water supply and demand for the past 12 years from 2007 to 2018 shows a water supply less than the demand in each year, which means that the available water resources were not sufficient to meet the demand during the past period. If this scenario continues at this rate, it may put more pressure on the non-renewable water resources in Sana’a region. Constructing more water harvesting structures, making groundwater artificial recharge, and adopting water management are the best solutions to meet the demand in the coming decades.
4. Discussion
The study area is classified as an arid area, and the rainfall is low with some heavy rainstorms, with temporal and spatial variability, as shown in Figure 3. The average annual rainfall was found to be in the range of 160–367 mm. The temporal change of rainfall in the study area falls during two periods: The first period from March to May and the second period from July to September. Some rainfall also occurs in the other months of October–December. It is possible to benefit from the rainy season by harvesting water and storing it for the drought months, either through the rooftops of houses or the construction of small dams, reservoirs, and ponds. Due to the suspension of work of most weather monitoring stations, the actual climatic observation data of most areas in Sana’a region is unknown. There were fifty-six rainfall and meteorological stations, but only six were operational in 2021. Lack of observation data and lack of their availability are major obstacles facing researchers, causing a big challenge for them and engineers when doing hydrological studies and designing hydraulic structures. Heavy rainstorm events cause flooding in Sana’a city (Figure 4), in addition to not benefiting from the rainfall due to the topography of the area and the lack of water facilities for harvesting water, such as dams, barriers, and reservoirs. There were 168 dams and 65 reservoirs in the study area, with a storage capacity of 64.65 Mm3 and 0.24 Mm3, respectively. During the rainy seasons, 75% of water facilities are completely filled. The number of water facilities is few, and the storage capacity is low compared to the region’s area.
The annual growth of the population increases the demand for water in many aspects, such as domestic, agricultural, industrial, and tourism needs. At the same time, the government lacks a plan to meet these challenges and problems that are increasing annually, as the water deficit is increasing with time, causing a decrease in the per capita use of water. Cultivated areas are decreasing annually, and people seek water from private sources to meet their needs. According to this data, the amount of groundwater that is abstracted by private sources is more than four times what is recharged. These private sources are responsible for the groundwater being drained because they do not obtain permission from the government. There is only one wastewater treatment plant in the region with low efficiency. It treats 18.25 Mm3 annually with less than 70% efficiency, so most people rely on excavation to get rid of sewage, which negatively affects groundwater. This causes increased groundwater pressure as water is withdrawn in large amounts to meet water demand. The groundwater abstraction from Sana’a basin is very high, while the recharge is very low, and the withdrawal increases annually, as the abstraction reached 330 Mm3 in 2020, while the recharge did not exceed 100 Mm3, and this is one of the study area’s most serious water problems. Public water network pumps produce between about 9 and 18.5 Mm3/year, whereas private well pumps produce between about 500 and 723 Mm3/year during the period 2007–2018. The cultivated area declined from 184,217 ha to 122,583 ha (33% decrease). In contrast, the Qat plant increased from 19 to 33% of total cultivated areas, with yearly water needs of approximately 15–29% and 25–43% of total water utilized for agriculture. This means that the agriculture crop areas are in decline except for the Qat plant, which is the only plant whose cultivation area is increasing because it is a cash plant and represents a source of income for most people. On the other hand, the Qat plant is one of the reasons for the economy’s collapse.
5. Conclusions
In this study, the water resources in Sana’a region were evaluated. The annual rainfall amount was found to be in the range of 160–367 mm annually. There were fifty-six rain gauge and meteorological stations in the study area, but only six stations were found operating in 2020. In addition, there were 233 projects, 168 dams, and 65 reservoirs, with a storage capacity of 64.65 Mm3 and 0.24 Mm3, respectively. The public water network pumps produced about 9–18.5 Mm3/year, while the private wells produced about 500–723 Mm3/year during 2007–2018. There has been a considerable increase in groundwater abstraction in Sana’a city from approximately 25 Mm3 in 1970 to about 330 Mm3 in 2020. The comparison between the past situations shows that the groundwater abstraction was much less than the recharge in 1970, while it was much more than the recharge in 2020. This means that there is an enormous abstraction of groundwater in Sana’a basin. The cultivated area decreased from 184,217 ha to 122,583 ha (33% decrease). The Qat plant increased from 19% in 2007 to 33% in 2018 of the total cultivated areas, with an annual water need of about 15–29% and 25–43% of the total water used for agriculture in 2007 and 2018, respectively. The wastewater treatment plant treats approximately 18.25 Mm3 annually, with less than 70% efficiency. The water deficit ranges between 500 and 723 Mm3 during the period from 2007 to 2018, and it is an abstraction from the non-renewable sources (deep aquifers). The results obtained in this study would help decision makers to take appropriate measures to achieve the SDGs in Sana’a region.
Here are some suggestions and recommendations for better water conservation and water resource management, reducing future groundwater abstractions in the future.
- Providing data to researchers and academics by authorized authorities to encourage research and enable decision makers to make judgments that would solve problems.
- Reoperating the weather stations that have stopped working and establishing new ones in areas where they do not have them.
- Constructing more harvesting water systems such as dams and reservoirs to collect and harvest water during the rainy seasons.
- Adopting the groundwater artificial recharge.
- Establishing more wastewater treatment plants will help sustain agriculture and protect groundwater from pollution caused by sewage waste dumped in excavations and seeping into aquifers.
- Rationalizing water consumption and stopping the cultivation of the Qat plant, which consumes a significant amount of water and affects the other crops.
Author Contributions
Conceptualization, A.A.A. (Alhasan Ahmed Aljawzi); methodology, A.A.A. (Alhasan Ahmed Aljawzi) and A.A.A. (Abdullah A. Abbas); software, A.A.A. (Alhasan Ahmed Aljawzi), A.A.A. (Abdullah A. Abbas) and E.Y.K.; formal analysis, A.A.A. (Alhasan Ahmed Aljawzi) and A.A.A. (Abdullah A. Abbas); investigation, A.A.A. (Alhasan Ahmed Aljawzi) and A.A.A. (Abdullah A. Abbas); resources, A.A.A. (Alhasan Ahmed Aljawzi); data curation, A.A.A. (Abdullah A. Abbas); writing—original draft preparation, A.A.A. (Alhasan Ahmed Aljawzi); writing—review and editing, H.F., A.A.A. (Abdullah A. Abbas) and E.Y.K.; visualization, A.A.A. (Alhasan Ahmed Aljawzi); supervision, H.F.; project administration, H.F. All authors have read and agreed to the published version of the manuscript.
Funding
This research received no external funding.
Data Availability Statement
All data necessary to carry out the work in this paper are included in the figures, tables or are available in the cited references.
Acknowledgments
Priority Academic Program Development of Jiangsu Higher Education Institutions (PAPD).
Conflicts of Interest
The authors declare that they have no known competing financial interest or personal relationships that could have appeared to influence the work reported in this paper.
References
- Aznar-Sánchez, J.A.; Belmonte-Ureña, L.J.; Velasco-Muñoz, J.F.; Valera, D.L. Farmers’ profiles and behaviours toward desalinated seawater for irrigation: Insights from South-east Spain. J. Clean. Prod. 2021, 296, 126568. [Google Scholar] [CrossRef]
- Keesstra, S.D.; Bouma, J.; Wallinga, J.; Tittonell, P.; Smith, P.; Cerdà, A.; Montanarella, L.; Quinton, J.N.; Pachepsky, Y.; Van der Putten, W.H.; et al. The significance of soils and soil science towards realization of the United Nations Sustainable Development Goals. Soil 2016, 2, 111–128. [Google Scholar] [CrossRef] [Green Version]
- Kumar, T.V.; Rao, A.R.; Viswanatham, K. Water Resources Management—An Approach for Coping with Water Scarcity in ‘Yemen’. J. Chem. Chem. Sci. 2015, 5, 275–284. [Google Scholar]
- Pahl-Wostl, C. Governance of the water-energy-food security nexus: A multi-level coordination challenge. Environ. Sci. Policy 2019, 92, 356–367. [Google Scholar] [CrossRef]
- United Nations. Transforming Our World: The 2030 Agenda for Sustainable Development, Adopted by the General Assembly on 25 September. United Nations N. Y. USA 2015. Available online: https://sdgs.un.org/2030agenda (accessed on 16 January 2022).
- Lichtenthaeler, G. Water conflict and cooperation in Yemen. Middle East Rep. 2010, 254, 30–36. [Google Scholar]
- Glass, N. The water crisis in Yemen: Causes, consequences and solutions. Glob. Major. E-J. 2010, 1, 17–30. [Google Scholar]
- Taher, T.M. Groundwater abstraction management in Sana’a Basin, Yemen: A local community approach. Hydrogeol. J. 2016, 24, 1593–1605. [Google Scholar] [CrossRef]
- Aklan, M.M.; Helen, L. Solar-Powered Irrigation in Yemen: Opportunities, Challenges and Policies, The Sana’a Center for Strategic Studies, DeepRoot Consulting. Cent. Appl. Res. Partnersh. Orient 2021. Available online: https://sanaacenter.org/publications (accessed on 10 October 2021).
- The World Bank. Implementation Completion and Results Report to the Republic of Yemen for a Sana’a Basin Water Management Project, Sustainable Development Department Middle East and North Africa Region, Report No: ICR00001482. 2010. Available online: https://openknowledge.worldbank.org (accessed on 17 May 2021).
- Al-Ward, M.A.A. Assessment of Water Resources in Wadi Sham Basin, Yemen. Ph.D. Thesis, University of Sains, Penang, Malaysia, 2013. [Google Scholar]
- Ward, C.; Ueda, S.; McPhail, A. Water resources management in Yemen. Contrib. CDR Yemen 2000. Available online: https://www.yemenwater.org (accessed on 20 December 2020).
- Aklan, M.M.; De Fraiture, C.; Hayde, L.G. Which Water Sources Do People Revert to in Times of War? Evidence from the Sana’a Basin, Yemen. Int. J. Environ. Res. 2019, 13, 623–638. [Google Scholar] [CrossRef]
- Sowers, J.L.; Weinthal, E.; Zawahri, N. Targeting environmental infrastructures, international law, and civilians in the new Middle Eastern wars. Secur. Dialogue 2017, 48, 410–430. [Google Scholar] [CrossRef]
- Abbas, A.A.; Mohamed, H.I.; Ali, N.A. Assessment of water resources in Dhamar governorate, Yemen republic. In Proceedings of the 9th International Conference for Development and the Environment in the Arab World, Assiut University, Assiut, Egypt, 15–17 April 2018. [Google Scholar]
- Al-Asbahi, Q.Y.A. Water resources information in Yemen. In Proceedings of the International Work Session on Water Statistics, Vienna, Austria, 20–22 June 2005. [Google Scholar]
- MWE. Water Sector in Yemen Resources and Services, View Summary, Ministry of Water and Environment. Available online: https://mwe-ye.org (accessed on 7 December 2020).
- FAO. Food and Agriculture Organization of the United Nations. AQUASTAT-FAO’s Global Information System on Water and Agriculture. Available online: http://www.fao.org/nr/water/aquastat/data/query/index.html?lang=en (accessed on 2 March 2021).
- Atroosh, K.B. Irrigation Technology Transfer in Support of Food Security in Yemen. In Proceedings of the UNIDO 3rd Water Middle East Expert Group Meeting, Manama, Bahrain, 23–24 January 2007. [Google Scholar]
- Al-Hamdi, M.I.; Alaerts, G.J. Alaerts, Structure and Cost of the Water Supply Market in Sana’a City, Yemen. In ASCE, Conference Information Joint Conference on Water Resource Engineering and Water Resources Planning and Management; American Society of Civil Engineers: Minneapolis, MN, USA, 2000; pp. 1–10. [Google Scholar]
- Sultana, H.; Ali, N.; Iqbal, M.M.; Khan, A.M. Vulnerability and adaptability of wheat production in different climatic zones of Pakistan under climate change scenarios. Clim. Chang. 2009, 94, 123–142. [Google Scholar] [CrossRef]
- Taher, T.; Ward, C.; Fadl, N.; Saleh, A.; Sultan, M. Planning for integrated water resources management: Case study Sana’a Basin Yemen. Int. Water Technol. J. 2013, 3, 232–248. [Google Scholar]
- Taher, T.M. Quantity and quality considerations of rooftop rainwater harvesting as a substantial resource to face water supply shortages. Int. J. Water Resour. Arid Environ. 2014, 3, 1–10. [Google Scholar]
- Moore, S. Parchedness, politics, and power: The state hydraulic in Yemen. J. Political Ecol. 2011, 18, 38–50. [Google Scholar] [CrossRef] [Green Version]
- Noaman, A. Urgent Capacity Development for Managing Natural Disaster Risks of Flash Floods in Egypt, Jordan, Sudan and Yemen, UNESCO Japanese Fund-In-Trust (JFIT). 2014. Available online: https://www.yemenwater.org/ (accessed on 9 January 2021).
- OCHA. UN Office for the Coordination of Humanitarian Affairs Country Office in Yemen. Population Estimates in Yemen for 2019. Available online: https://data.humdata.org/dataset/population-estimates-in-yemen-for-2019 (accessed on 15 September 2021).
- Papakos, T.H.; Root, K. Hydraulic Modeling of Flash Floods in Sana’a. In Proceedings of the World Environmental and Water Resources Congress 2010, Providence, RI, USA, 16–20 May 2010. [Google Scholar]
- Al-Adimi, A.A. GIS and Remote Sensing applications in Sana’a basin study on satellite image analysis of cropping and irrigation water use. In Proceedings of the Thirteenth International Water Technology Conference, Hurghada, Egypt, 5–8 August 2019. [Google Scholar]
- Al-Ameri, A.; Schneider, M.; Abo-Lohom, N.; Janetz, S. Characteristics of Stable Isotopes of Oxygen-18 and Deuterium of Groundwater in the Sana’a Basin Aquifer Systems, Yemen. Arab. J. Sci. Eng. 2014, 39, 5625–5636. [Google Scholar] [CrossRef]
- Alderwish, A.M. Integrated water management for small catchments in arid mountainous region-Yemen. Int. J. Energy Environ. Econ. 2011, 19, 699–715. [Google Scholar]
- NWRA. Water Resources Database, (Rainfall Data Records for Rainfall Stations). National Water Resources Authority in Yemen, Information Department. Available online: http://www.nwrayemen.org/arabic/index.asp (accessed on 14 October 2020).
- Hadden, R. The Geology of Yemen: An Annotated Bibliography of Yemen’s Geology, Geography and Earth Science; Corps of Engineers Alexandria, Virginia US Army Corps of Engineers, Army Geospatial Center: Manassas, VA, USA, 2012; p. 385. [Google Scholar]
- CAMA. Climate Data and Rainfall Records, Climate Administration, Civil Aviation and Meteorology Authority in Yemen. Available online: https://cama.gov.ye/ar/ (accessed on 20 November 2020).
- MAI. Agricultural Statistics Year Books, Ministry of Agriculture and Irrigation. Available online: http://www.agricultureyemen.com/?lng=english& (accessed on 22 July 2020).
- Stephen, F. Yemen: Rationalizing groundwater resource utilization in the Sana’a basin. World Bank GW MATE 2003, 2. Available online: www.worldbank.org/gwmate (accessed on 16 January 2022).
- Foppen, J.W.A.; Naaman, M.; Schijven, J.F. Managing urban water under stress: The case of Sana’a, Yemen. WIT Trans. Ecol. Environ. 2005, 80, 101–110. [Google Scholar]
- Yahya Mubarak, Z.A.; Qarhash, M.; Al Saloul, M.; Al Dubby, S.; Saif, A. Using Groundwater Flow Model (MODFLOW) As a Management Tool for Targeted Sub-Basins in Sana’a Basin. Hadhramout Univ. J. Nat. Appl. Sci. 2021, 14, 41–57. [Google Scholar]
- Mosgiprovodkhoz. Sana’a Basin Water Resources Scheme Summary Report; Ministry of Agriculture and Water Resources: Sana’a, Yemen, 1986.
- JICA. The Study for the Water Resources Management and Rural Water Supply Improvement in the Republic of Yemen, Water Resources Management Action Plan for Sana’a Basin; Japan International Cooperation Agency: Tokyo, Japan, 2007.
- Al Ward, M.A.; Ismail, W.R. Precipitation analysis and water resource of Wadi Siham Basin, Yemen. Geografi 2019, 7, 36–63. [Google Scholar]
- HWC. Water Resources Management in the Thiama, the Technical Secretariat of the High Water Council Undp/Desd Project Yemn 88/oo1 P.O. Box 551, Sana’a, Republic of Yemen, the Government of the Republic of Yemen High Water Council, Final Report 823-ye-13214. 1992. Available online: http://www.ircwash.org (accessed on 29 March 2021).
- UiL, H.; Dufour, F.C. In Co-Operation with the Staff of the General Department of Water Resources Studies, Water Resources Assessment (Wadi Athanah and Marib Area), Main Report-15, Yemen Arab Republic, 1990. Available online: https://www.yemenwater.org/o-water-resources (accessed on 16 February 2021).
- Vermillion, D.L.; Al-Shaybani, S. Small Dams and Social Capital in Yemen: How Assistance Strategies Affect Local Investment and Institutions; International Water Management Institute: Colombo, Sri Lanka, 2004. [Google Scholar]
- Adamo, N.; Al-Ansari, N.; Sissakian, V. Dam Safety: General Considerations. J. Earth Sci. Geotech. Eng. 2020, 10, 1–21. [Google Scholar]
- Al-kholid, A.G.; Sun, Y.; Al-Jabali, A.M.O.; Sun, Z. Approach to quantification drawdown of groundwater wells: A case study from Sana’a City, Yemen. Glob. Geol. 2010, 13, 155–158. [Google Scholar]
- Alwathaf, Y.; El Mansouri, B. Hydrodynamic modeling for groundwater assessment in Sana’a Basin, Yemen. Appl. Hydrogeol. 2012, 20, 1375–1392. [Google Scholar] [CrossRef]
- Lichtenthäler, G. Power, politics and patronage: Adaptation of water rights among Yemen’s northern highland tribes. Études Rural. 2000, 155–156, 143–166. Available online: https://www.jstor.org (accessed on 14 April 2021). [CrossRef]
- Ward, C. The Water Crisis in Yemen: Managing Extreme Water Scarcity in the Middle East, 1st ed.; University of Pennsylvania: London, UK, 2015; pp. 171–175. [Google Scholar]
- Mohammed, N.; Yasuo, K.; Yogita, M.; Bilkis, Z.; Scott Michael, M. Water Supply in a War Zone, A Preliminary Analysis of Two Urban (Sana’a and Aden), Water Tanker Supply Systems in the Republic of Yemen. Water Glob. Pract. Discuss. Pap. World Bank Group 2018. Available online: https://openknowledge.worldbank.org (accessed on 3 September 2021).
- Zaken, B. Support to Rural Water Supply and Sanitation in Dhamar and Hodeidah Governorates, Republic of Yemen, IOB Impact Evaluation | no. 315, 1st ed.; Ministry of Foreign Affairs: Hague, The Netherlands, 2018; p. 188.
- Yaya, A.; Weshali, A. Yemen Optimum Agricultural Map to Water Conservation. In Proceedings of the 2nd International Conferance on Water Resources & Arid Environment, Muscat, Oman, 16–19 March 2020; King Saud University: Riyadh, Saudi Arabia, 2020. [Google Scholar]
- Hellegers, P.; Perry, J.N.; Al-Aulaqi, N.; Al-Eryani, A.R.; Al-Hebshi, M. Incentives to Reduce Groundwater Extraction in Yemen, Report 2008-058, Carried Out in Close Collaboration with Water and Environment Center; Wageningen University: Hague, The Netherlands, 2008. [Google Scholar]
- Ward, C.; Gatter, P. Qat in Yemen—Towards a Policy and Action Plan. Document of the World Bank, Country Department III Sustainable Development Department Middle East and North Africa Region 2000. Available online: https://www.yemenwater.org (accessed on 25 July 2021).
- Atroosh, K.B.; Al-Moayad, M.A. Water Requirements of Qat (Catha edulis) Cultivation in the Central Highlands of Yemen. J. Sci. Res. 2011, 4, 77. [Google Scholar] [CrossRef] [Green Version]
- Muharam, R.A.; Al-Nozaily, F.A.; Al Munaifi, A.A.; Salah, A.I.; Al-Qadasi, F.A. Evaluation of Sana’a Wastewater Treatment plant–Problem Analysis and Suggested Results. Hadhramout Univ. J. Nat. Appl. Sci. 2019, 16, 225–249. [Google Scholar]
- Metcalf, L.; Eddy, H.P.; Tchobanoglous, G. Wastewater Engineering: Treatment, Disposal, and Reuse, 4th ed.; McGraw-Hill: New York, NY, USA, 2004; Volume 4. [Google Scholar]
- Abu-Madi, M.O.R. Incentive Systems for Wastewater Treatment and Reuse in Irrigated Agriculture in the MENA Region: Evidence from Jordan and Tunisia. Ph.D. Thesis, UNESCO-IHE Institute for Water Education, Delft University of Technology, Delft, The Netherlands, 2004. [Google Scholar]
- Al Aizari, H.; Lebkiri, A.; Fadli, M.; Albaseer, S.S. Quality Assessment of Ground Water in Dhamar City, Yemen. Int. J. Environ. 2018, 6, 56–71. [Google Scholar] [CrossRef] [Green Version]
- Merghem, K.; Gharibi, E.; El Halouani, H.; Taupin, J.D.; Ghalit, M.; Alnedhary, A.A.; Zarrouk, A. Quality study of wastewater treated by Waste Water Treatment Plant (WWTP) in the city of Sana’a (Yemen) used for agriculture. Moroc. J. Chem. 2016, 4, 814–829. [Google Scholar]
Figure 1.
Sana’a region location map.

Figure 2.
Meteorological and rainfall station distribution map in Sana’a region.

Figure 3.
Rainfall records for the stations in some selected years: (a) 1975; (b) 1984; (c) 1996; (d) 2006; (e) 2020 (numbers in the legend refer to rainfall recorded station numbers).
Figure 3.
Rainfall records for the stations in some selected years: (a) 1975; (b) 1984; (c) 1996; (d) 2006; (e) 2020 (numbers in the legend refer to rainfall recorded station numbers).

Figure 4.
Flood effect on Sana’a city in Alsailah channel: (a) Sana’a city with flood; (b) Sana’a city without rain.
Figure 4.
Flood effect on Sana’a city in Alsailah channel: (a) Sana’a city with flood; (b) Sana’a city without rain.

Figure 5.
Main and sub-stream flow directions in Sana’a region: (a) Main stream with a catchment area; (b) Main and sub-stream with a catchment area.
Figure 5.
Main and sub-stream flow directions in Sana’a region: (a) Main stream with a catchment area; (b) Main and sub-stream with a catchment area.


Figure 6.
Dams and reservoirs distribution in the study area with Sana’a basin boundaries.

Figure 7.
Groundwater abstraction and recharge in Sana’a basin.

Figure 8.
Domestic water demand estimation for Sana’a region: (a) Sana’a governorate, with a 3.2% population growth rate; (b) Sana’a city, with a 4.5% population growth rate.
Figure 8.
Domestic water demand estimation for Sana’a region: (a) Sana’a governorate, with a 3.2% population growth rate; (b) Sana’a city, with a 4.5% population growth rate.

Figure 9.
The cultivated area for all crops in Sana’a region (2007–2018): (a) Crops area; (b) total cultivated area.
Figure 9.
The cultivated area for all crops in Sana’a region (2007–2018): (a) Crops area; (b) total cultivated area.

Figure 10.
Sources irrigation for a cropped area in Sana’a region: (a) 2011; (b) 2013; (c) 2015; (d) 2018.
Figure 10.
Sources irrigation for a cropped area in Sana’a region: (a) 2011; (b) 2013; (c) 2015; (d) 2018.

Figure 11.
Water consumed for Qat plantation of the total water used in agriculture (in percentage).
Figure 11.
Water consumed for Qat plantation of the total water used in agriculture (in percentage).


Table 1.
Total expected agriculture water demand for crops.
| 2007 | 2008 | 2009 | 2010 | 2011 | 2012 | 2013 | 2014 | 2015 | 2016 | 2017 | 2018 | |
|---|---|---|---|---|---|---|---|---|---|---|---|---|
| Min (106 m3) | 1140 | 1091 | 1023 | 1211 | 1083 | 1145 | 1132 | 996 | 902 | 812 | 808 | 801 |
| Max (106 m3) | 1526 | 1475 | 1403 | 1644 | 1496 | 1572 | 1556 | 1395 | 1276 | 1172 | 1165 | 1158 |
Table 2.
Water supply and demand estimated for Sana’a region. Units: Mm3.
| 2007 | 2008 | 2009 | 2010 | 2011 | 2012 | 2013 | 2014 | 2015 | 2016 | 2017 | 2018 | ||
|---|---|---|---|---|---|---|---|---|---|---|---|---|---|
| Supply | Use for agriculture | 1020.3 | 942.2 | 959.1 | 1027.4 | 949.5 | 1021.6 | 1011.1 | 802.2 | 701.3 | 759.4 | 749.2 | 741.1 |
| Public water network | 18.5 | 19 | 19 | 17 | 15 | 14 | 15 | 12 | 10 | 9 | 12 | 11 | |
| Total | 1038.8 | 961.2 | 978.1 | 1044.4 | 964.5 | 1035.6 | 1026.1 | 814.2 | 711.3 | 768.4 | 761.2 | 752.1 | |
| Demand | Municipal water | 246.6 | 257.1 | 268.1 | 279.7 | 291.8 | 303.3 | 317.3 | 331.2 | 345.3 | 360.4 | 376.9 | 393.4 |
| Agriculture water (average) | 1333 | 1283 | 1213 | 1427.5 | 1289.5 | 1358.5 | 1344 | 1195.5 | 1089 | 992 | 986.5 | 979.5 | |
| Total | 1579.6 | 1540.1 | 1481.1 | 1707.2 | 1581.3 | 1661.8 | 1661.3 | 1526.7 | 1434.3 | 1352.4 | 1363.4 | 1372.9 | |
| Water deficit | 540.8 | 578.9 | 503 | 662.8 | 616.8 | 626.2 | 635.2 | 712.5 | 723 | 584 | 602.2 | 620.8 |
Publisher’s Note: MDPI stays neutral with regard to jurisdictional claims in published maps and institutional affiliations. |
© 2022 by the authors. Licensee MDPI, Basel, Switzerland. This article is an open access article distributed under the terms and conditions of the Creative Commons Attribution (CC BY) license (https://creativecommons.org/licenses/by/4.0/).
Share and Cite
MDPI and ACS Style
Aljawzi, A.A.; Fang, H.; Abbas, A.A.; Khailah, E.Y. Assessment of Water Resources in Sana’a Region, Yemen Republic (Case Study). Water 2022, 14, 1039. https://doi.org/10.3390/w14071039
AMA Style
Aljawzi AA, Fang H, Abbas AA, Khailah EY. Assessment of Water Resources in Sana’a Region, Yemen Republic (Case Study). Water. 2022; 14(7):1039. https://doi.org/10.3390/w14071039
Chicago/Turabian StyleAljawzi, Alhasan Ahmed, Hongyuan Fang, Abdullah A. Abbas, and Ebrahim Yahya Khailah. 2022. "Assessment of Water Resources in Sana’a Region, Yemen Republic (Case Study)" Water 14, no. 7: 1039. https://doi.org/10.3390/w14071039
Note that from the first issue of 2016, this journal uses article numbers instead of page numbers. See further details here.