
Predicting Change in Adaptation Strategies of Households to Geological Hazards in the Longmenshan Area, China Using Machine Learning and GIS

 , and
, and
Abstract
:1. Introduction
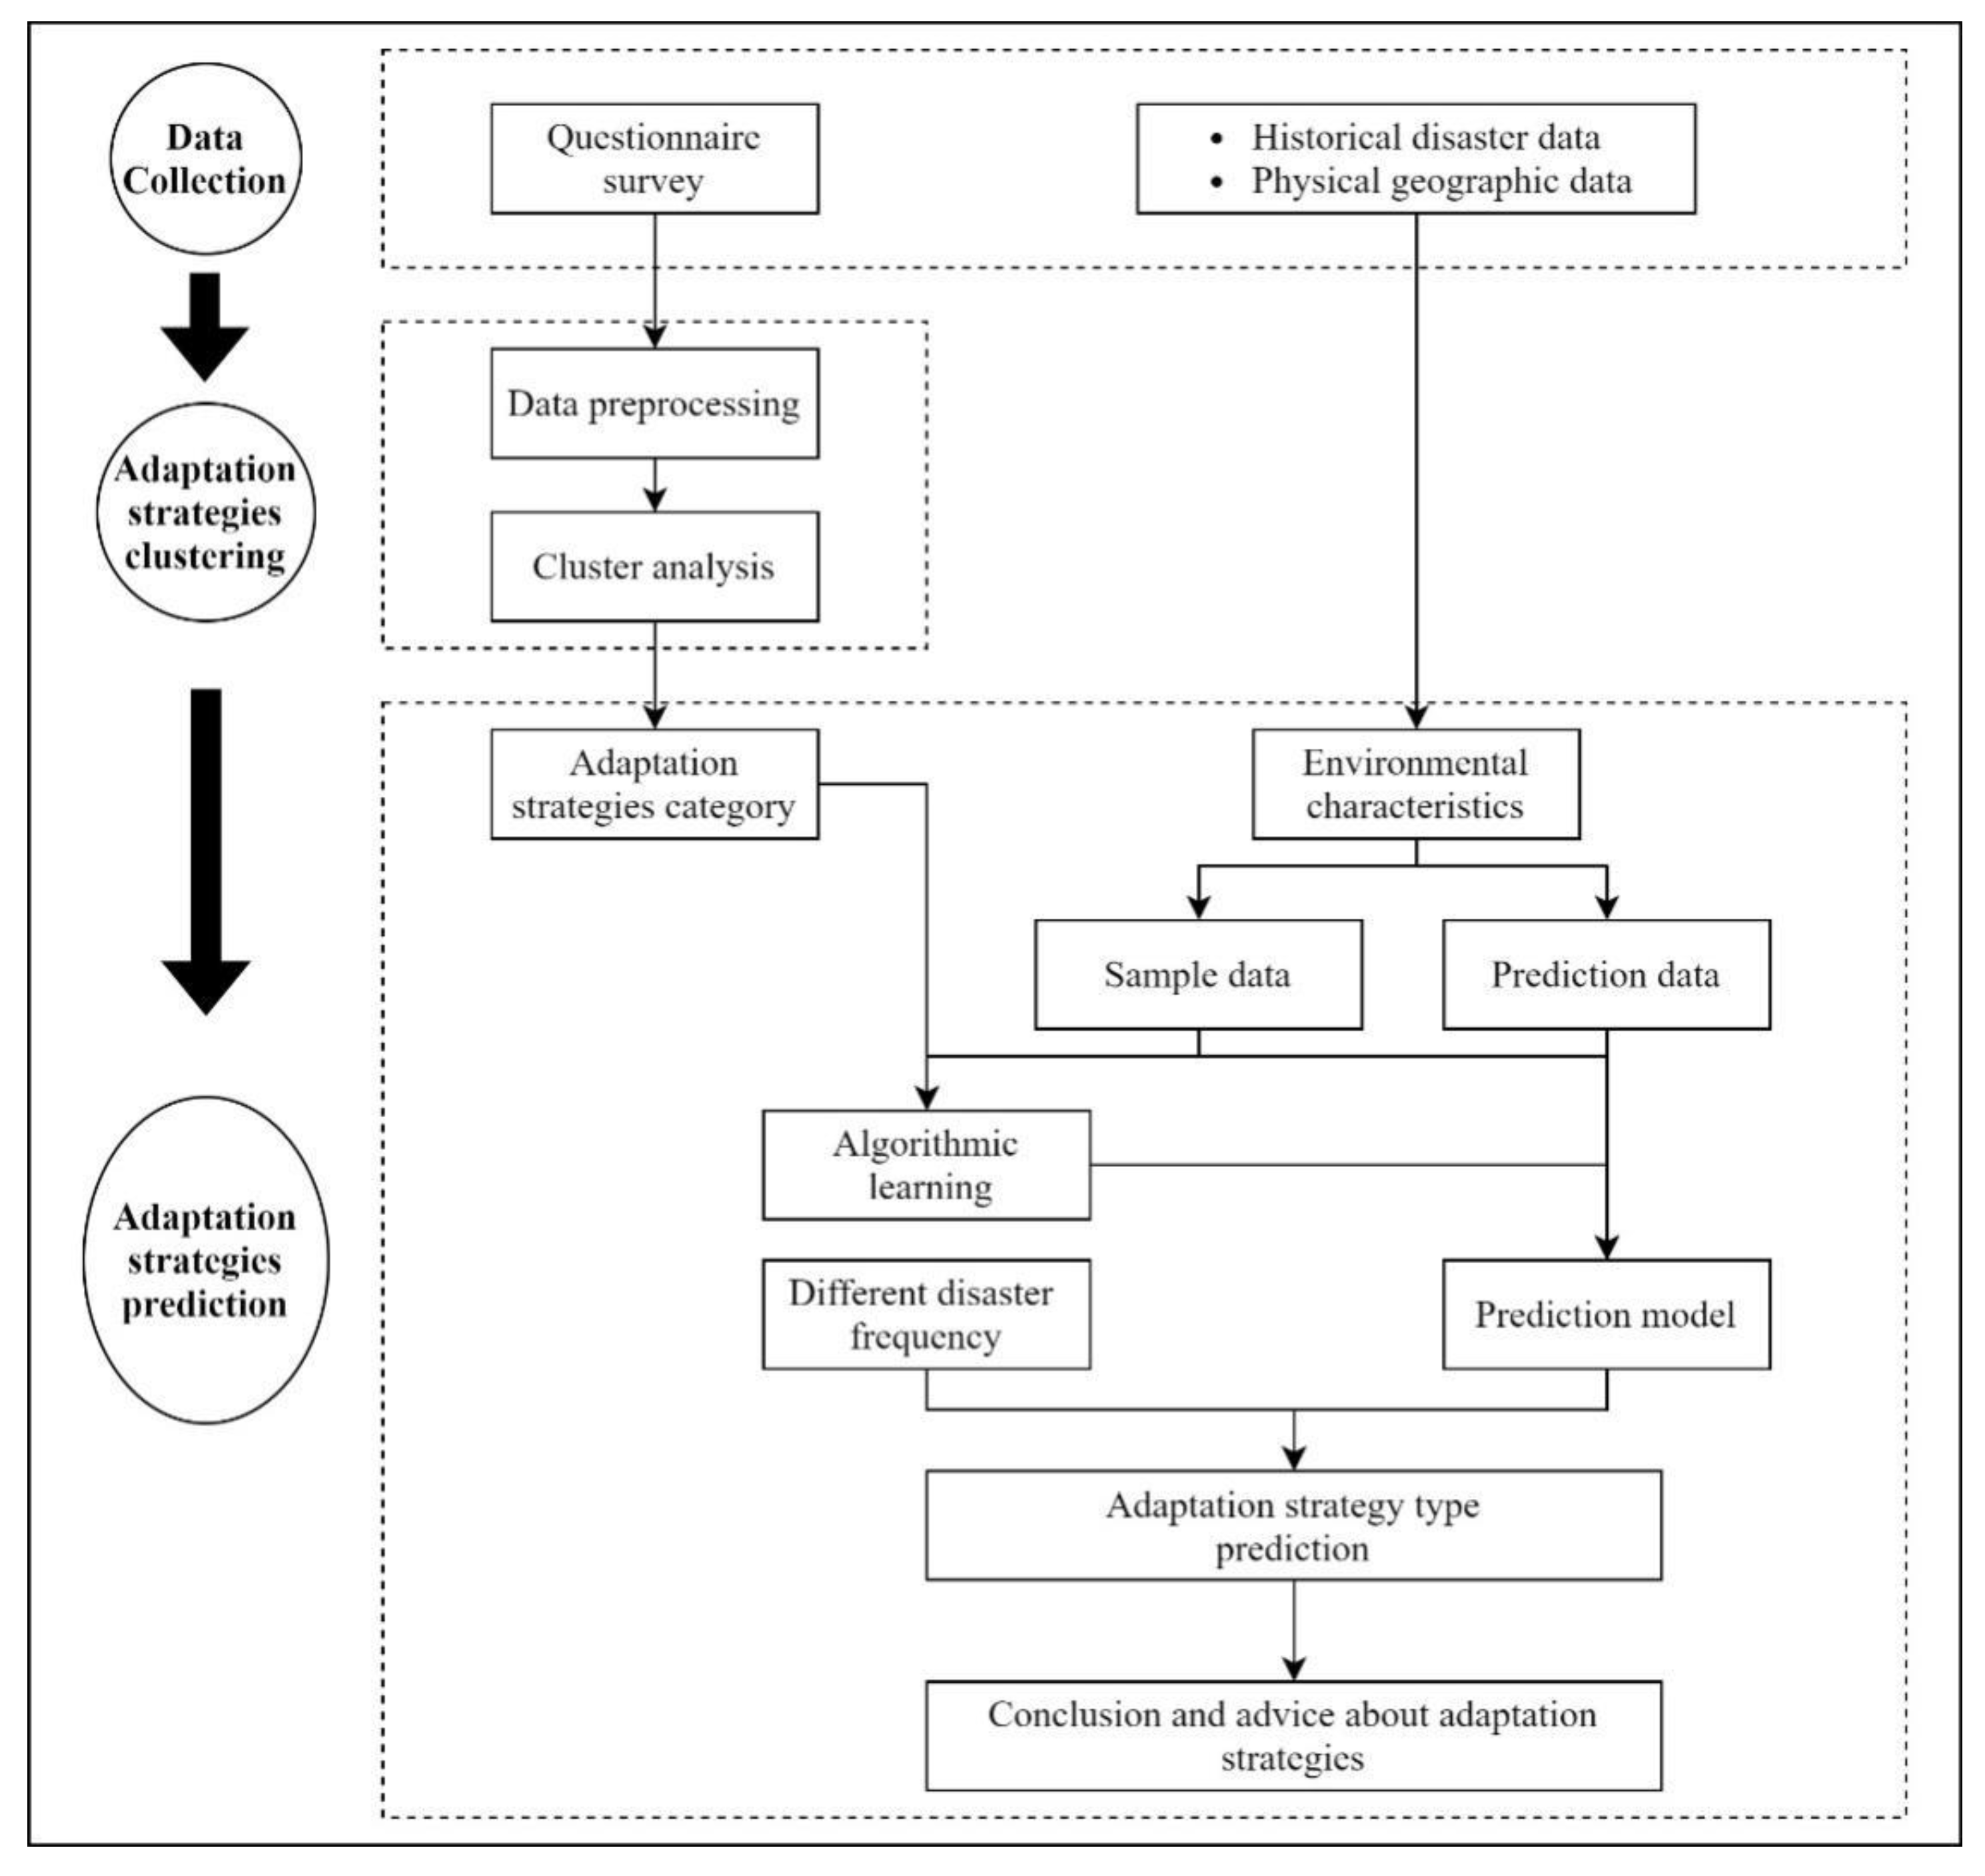
2. Methodology
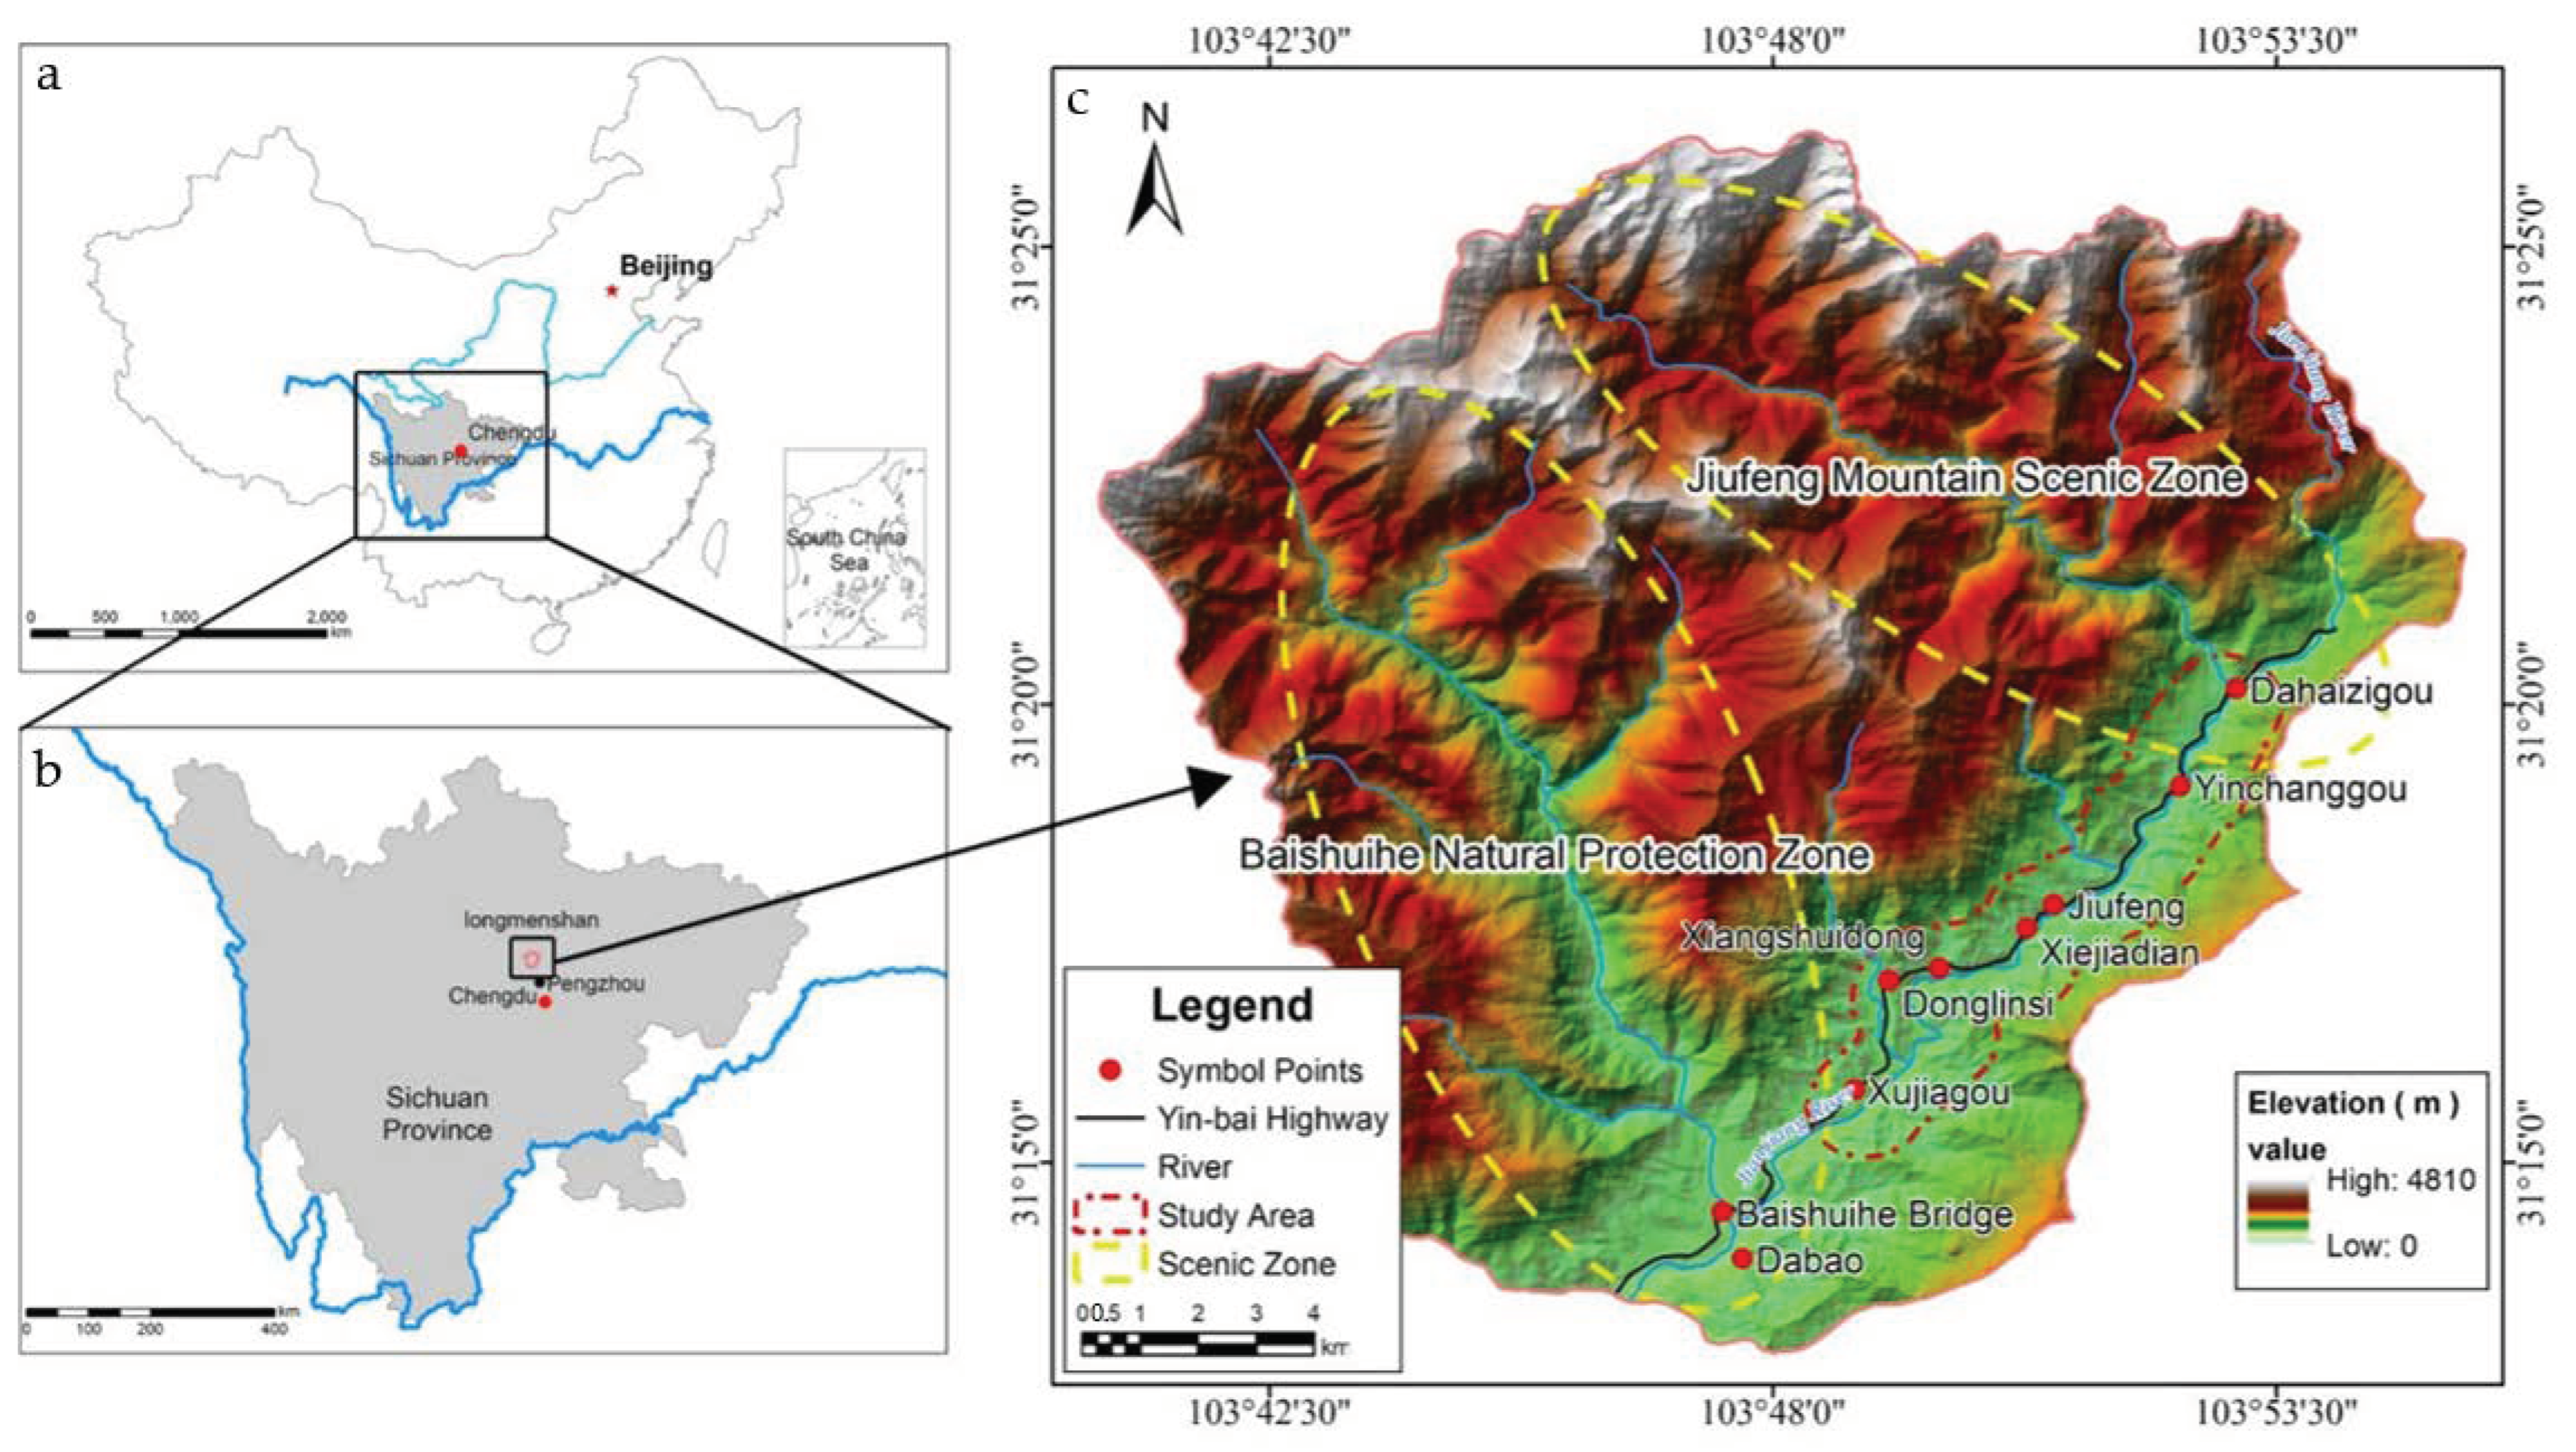
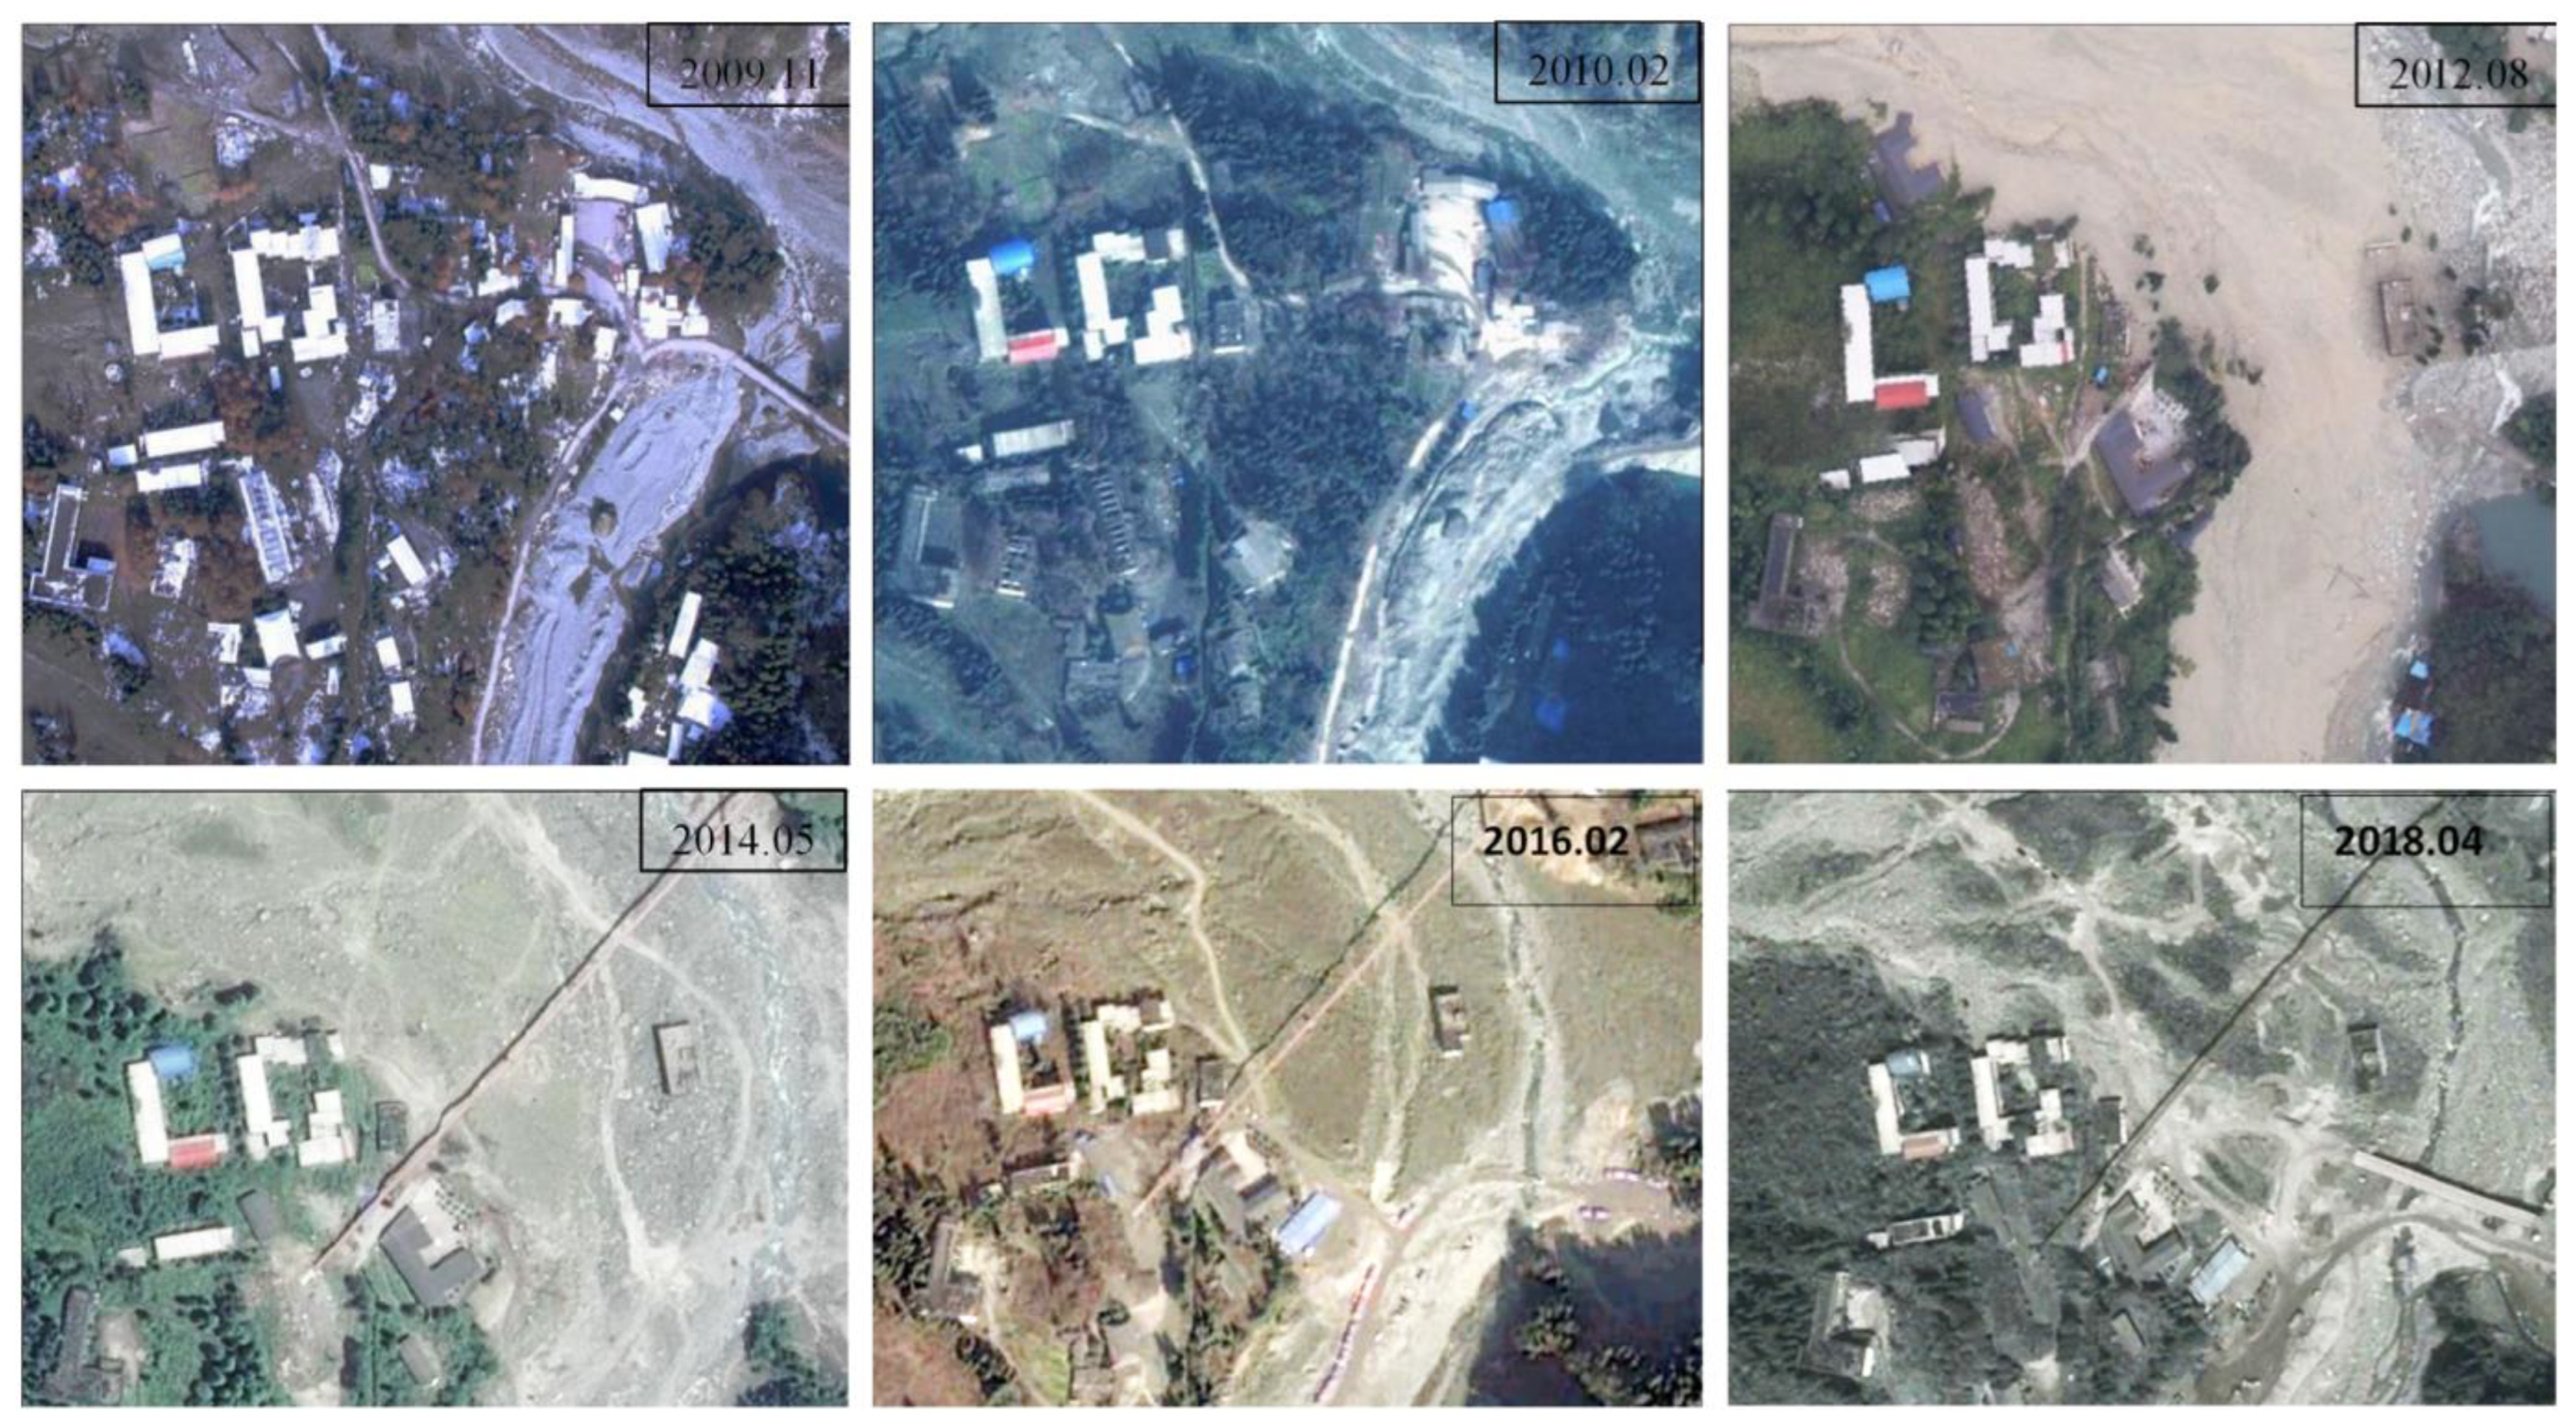
2.1. Study Area
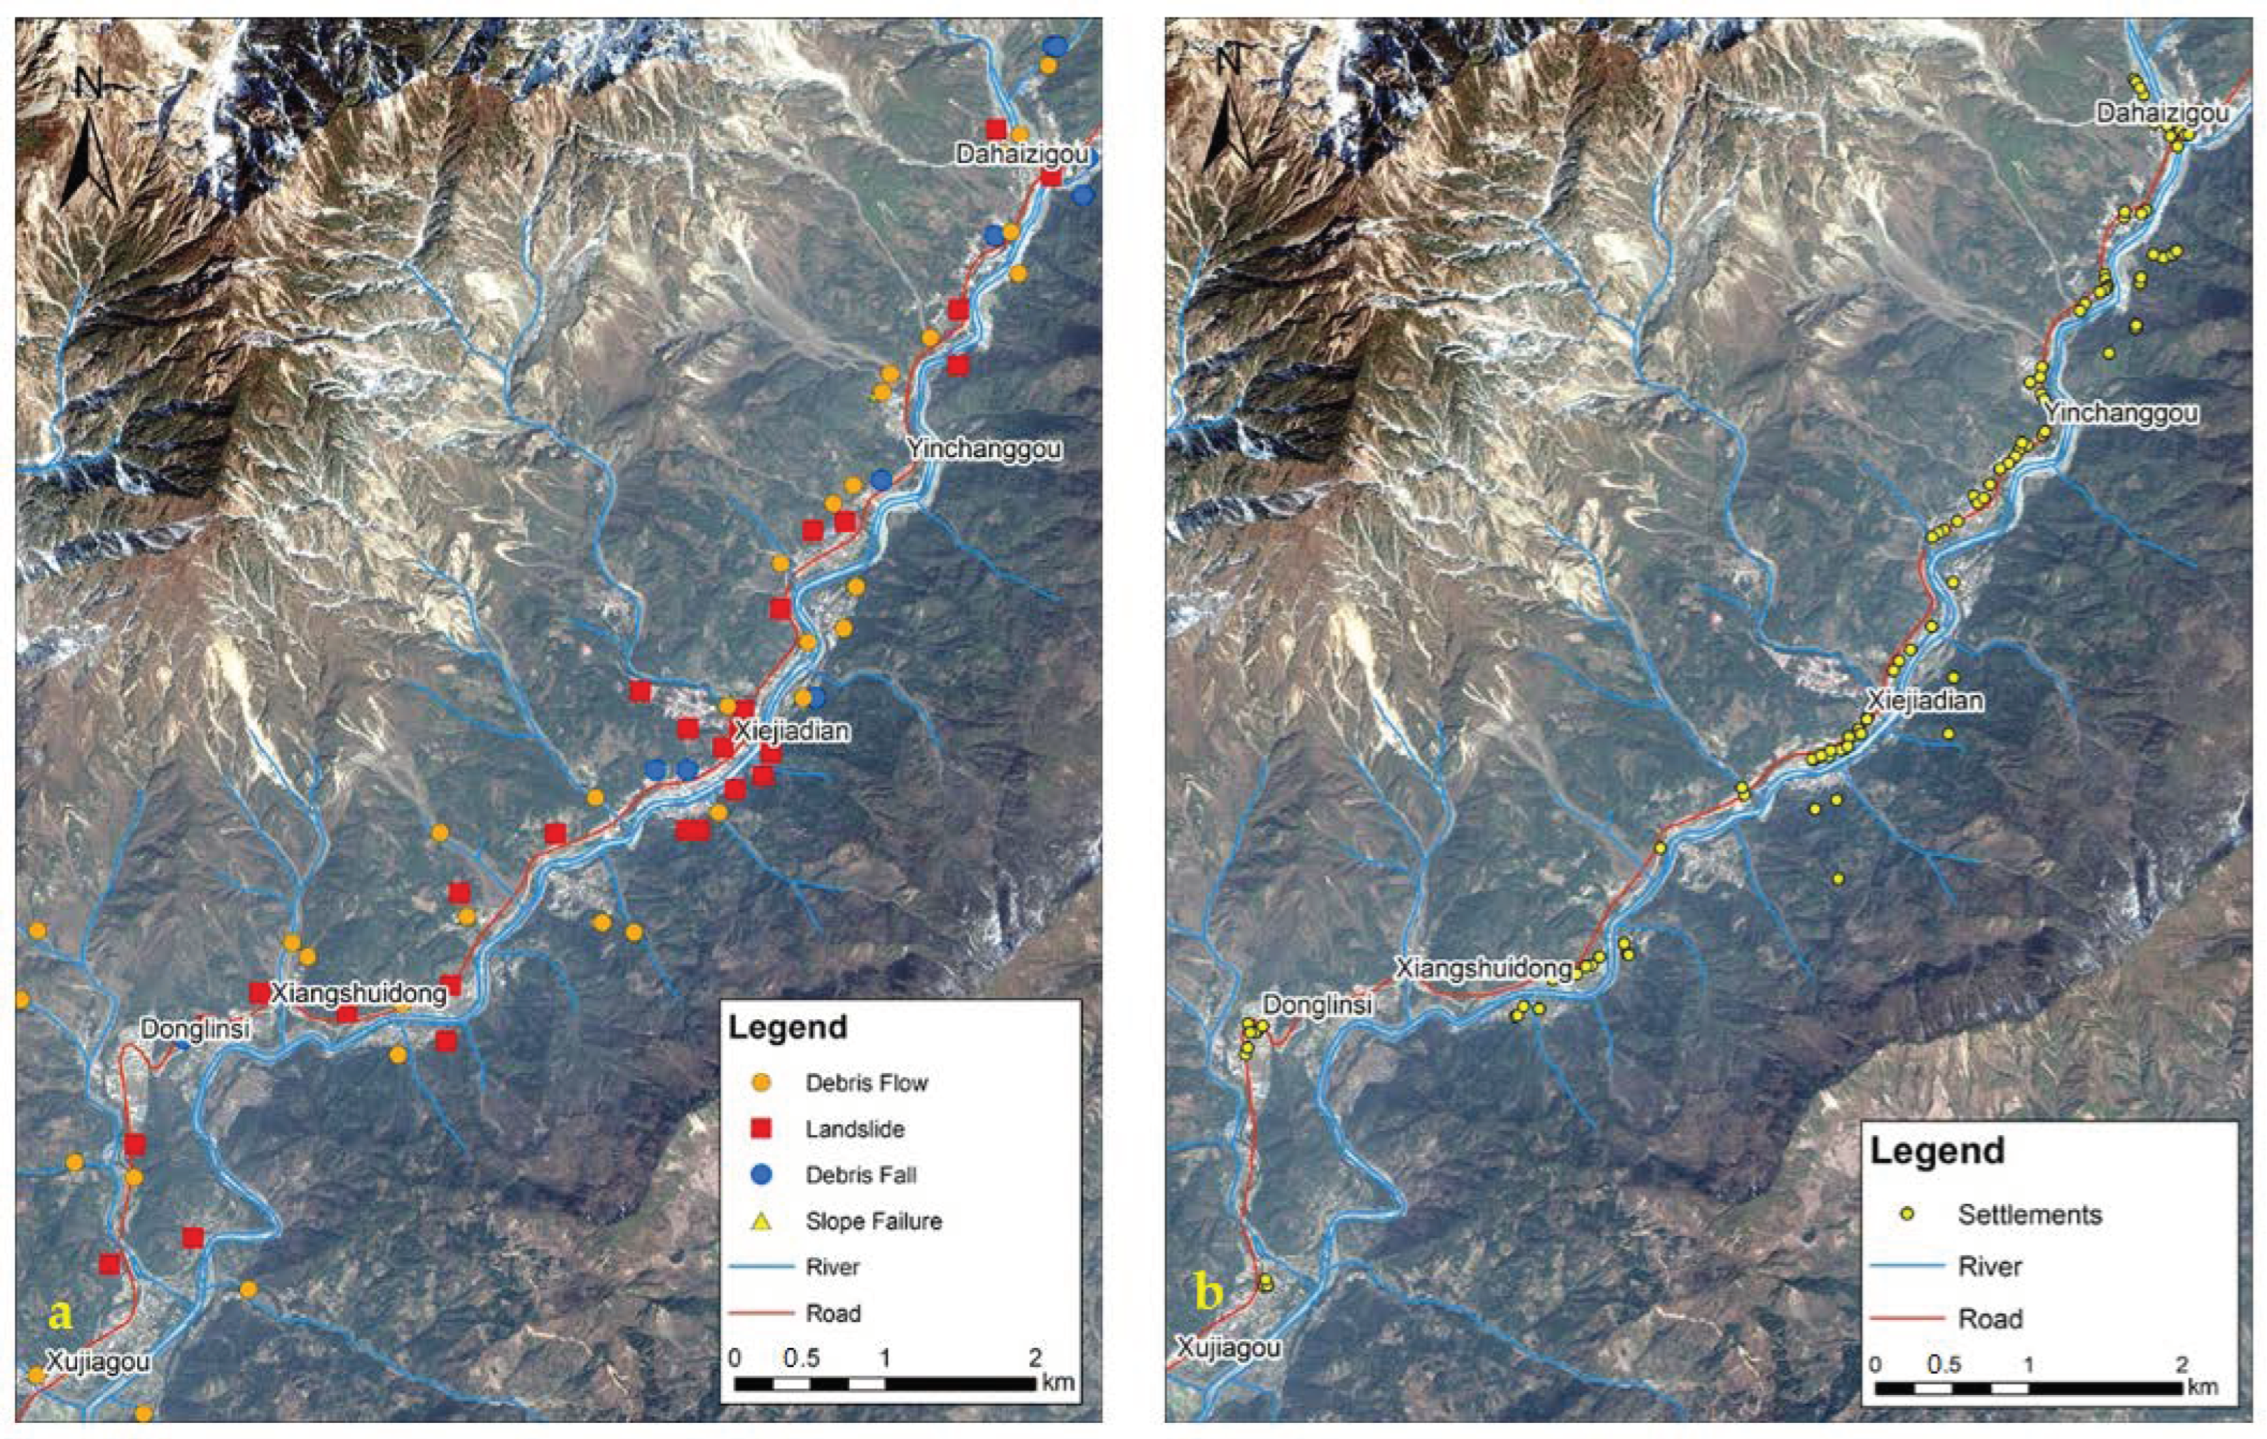
2.2. Data Collection
2.2.1. Landslide Adaptation Strategies
2.2.2. Model Parameter Data
2.3. Clustering Method of Landslide Adaptation Strategies
- (1)
- Randomly initializing K-cluster centroids based on the data ranges of N data objects;
- (2)
- Assigning each object to the group that had the closest centroid;
- (3)
- Updating the locations of each centroid by calculating the mean value of the objects assigned to it;
- (4)
- Repeating Steps 2 and 3 until the maximum number of iterations was reached or until the centroids no longer moved;
- (5)
- Finding the best clustering effect of the model based on the value of s(k);
- (6)
- Conducting computations using scikit-learn and NumPy Python packages.
2.4. Prediction Method of Change in Adaptation Strategies
- (1)
- Model features selection;
- (2)
- Data preprocessing;
- (3)
- Model construction and parameter optimization.
- (4)
- Model prediction
3. Results and Discussion
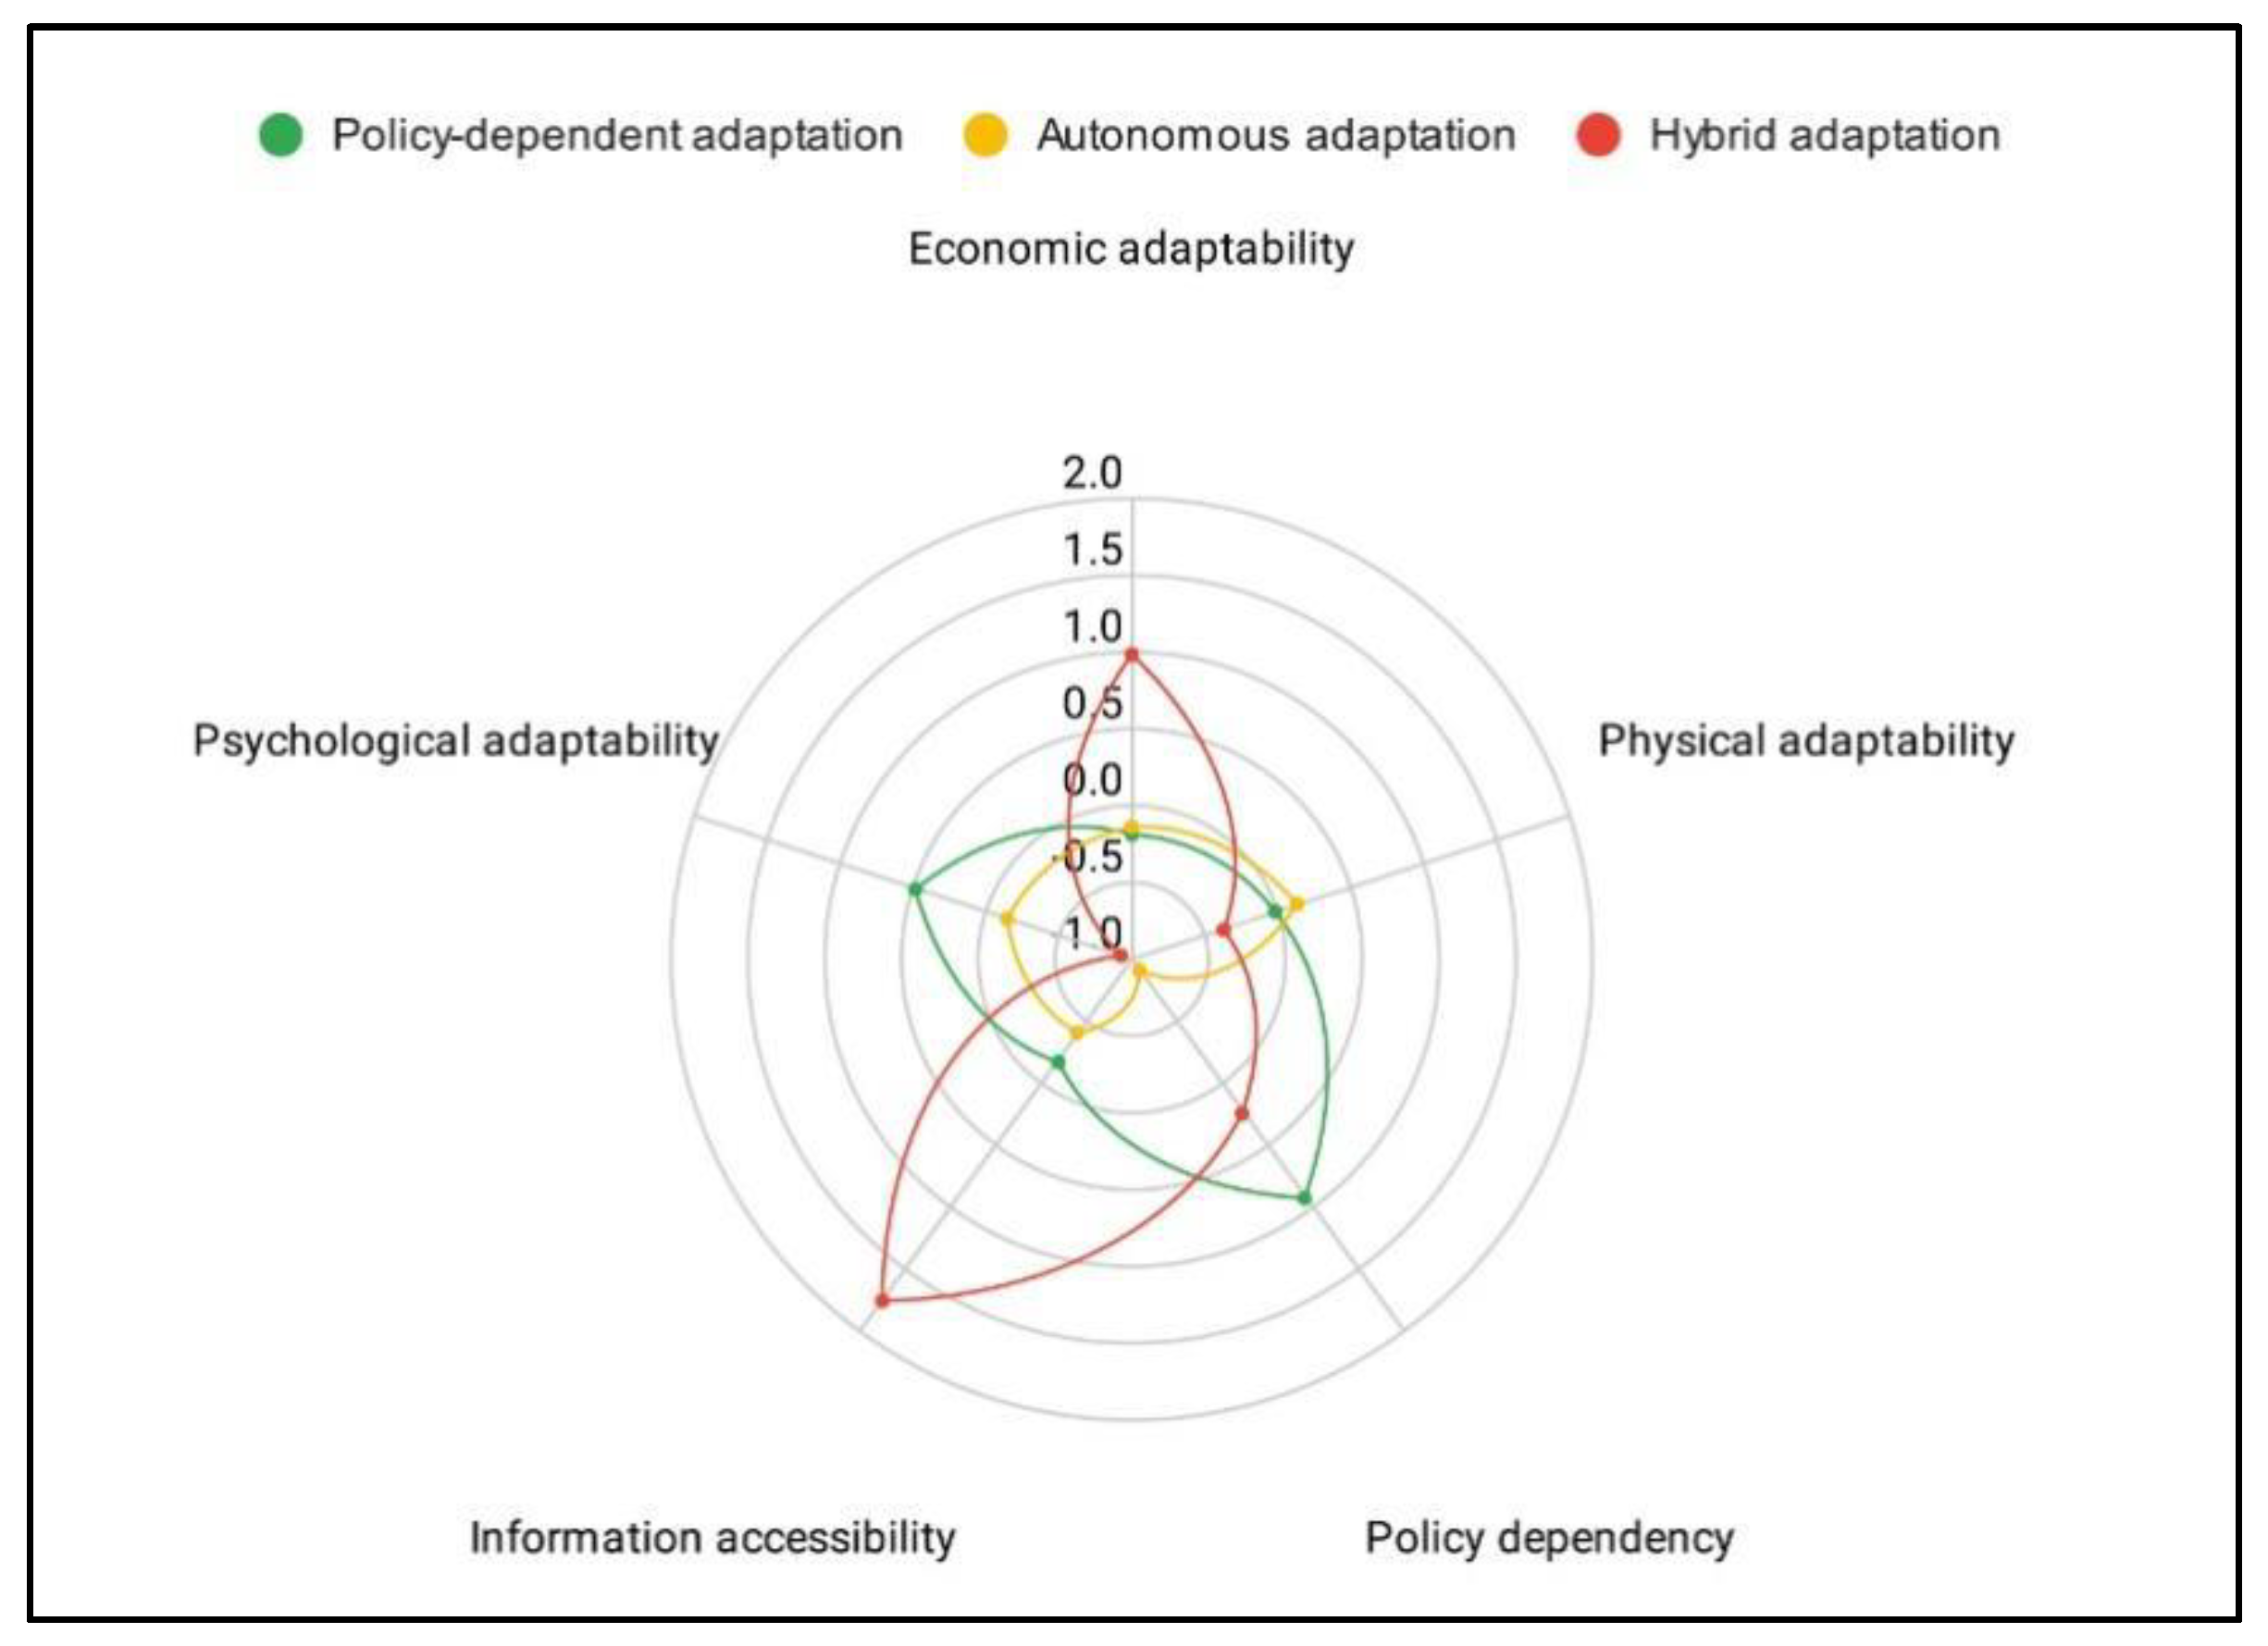
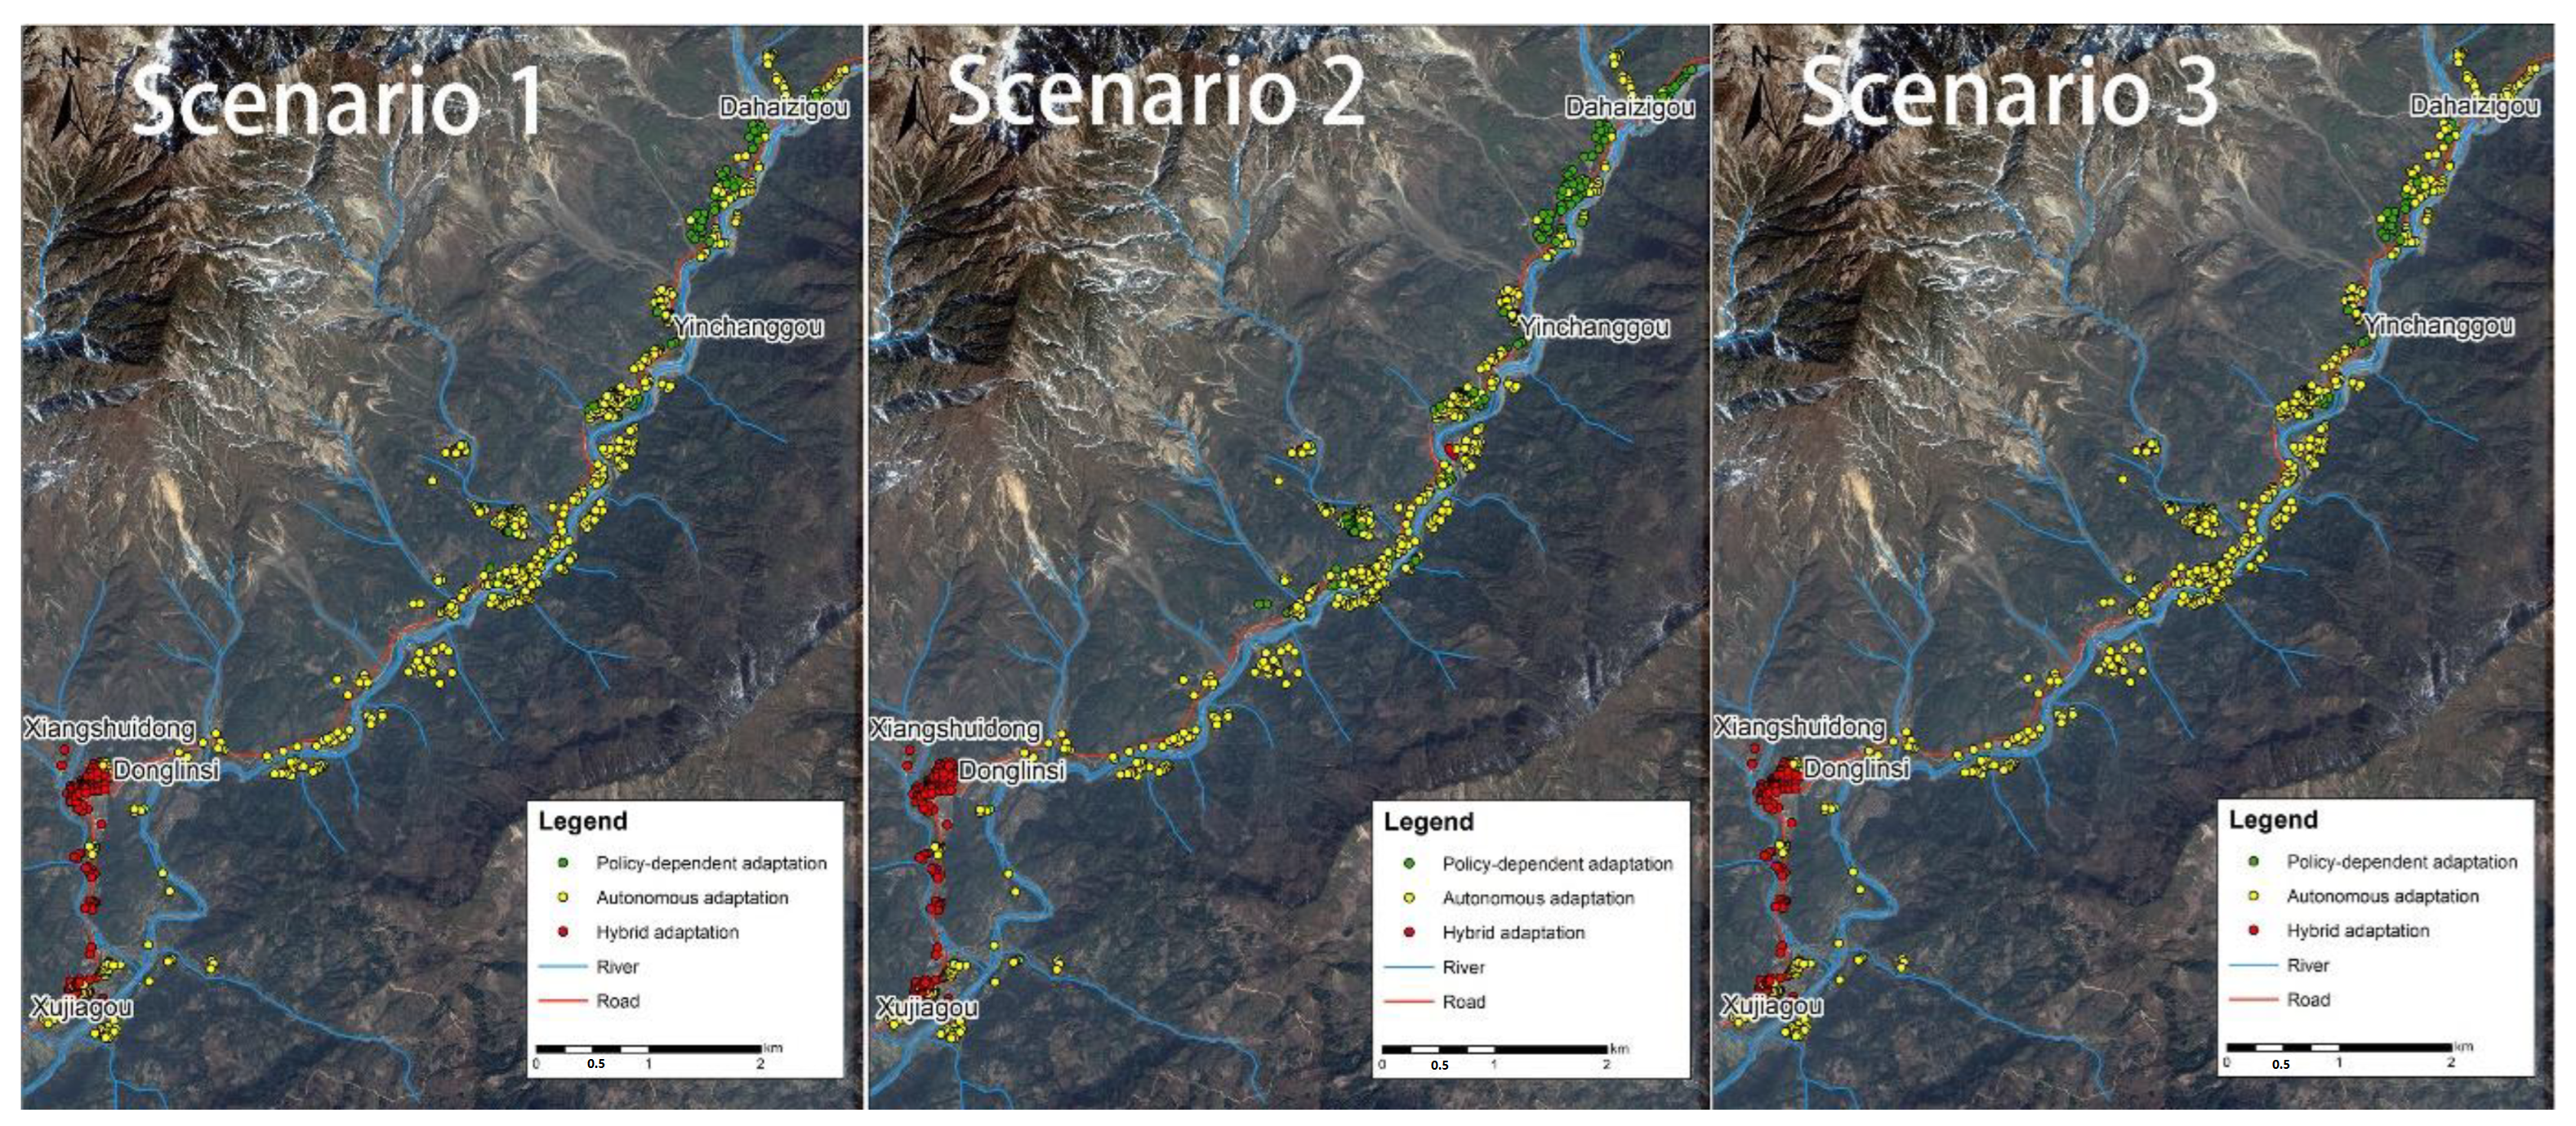
3.1. Clustering of Landslide Adaptation Strategies
- Type 1:
- Government-policy-dependent adaptation strategy (39 green points in Figure 4c, 34.8% of the 112 survey responses);
- Type 2:
- Autonomous household-initiated adaptation strategy (52 yellow points in Figure 4c, 46.4% of the 112 survey responses);
- Type 3:
- Hybrid adaptation strategy, which is a mix of Types 1 and 2 (18.8%).
3.2. Prediction of Change in Landslide Adaptation Strategies
3.2.1. Scenario 1: No Change in Landslide Frequency
3.2.2. Scenario 2: Increase in Landslide Frequency
3.2.3. Scenario 3: Decrease in Landslide Frequency
3.3. Analysis of Prediction Results
3.4. Limitations
4. Conclusions
Author Contributions
Funding
Acknowledgments
Conflicts of Interest
References
- Liang, G.; Zhang, X.; Ling, X.; Zhou, H.; Lin, W. Analysis of Temporal-spatial Characteristics of Geological Disasters in China from 2009 to 2019. J. Disaster Prev. Reduct. 2021, 37, 58–64. (In Chinese) [Google Scholar] [CrossRef]
- Wang, Q.F.; Wu, J.J.; Lei, T.J.; He, B.; Wu, Z.T.; Liu, M.; Mo, X.Y.; Geng, G.P.; Li, X.H.; Zhou, H.K.; et al. Temporal-spatial characteristics of severe drought events and their impact on agriculture on a global scale. Quatern. Int. 2014, 349, 10–21. [Google Scholar] [CrossRef]
- Xu, C.; Xu, X.; Gorum, T.; Westen, C.J.V.; Fan, X. Did the 2008 Wenchuan Earthquake Lead to a Net Volume Loss? In Proceedings of the World Landslide Forum, Beijing, China, 3 May 2014; pp. 191–196. [Google Scholar]
- Zhang, S.; Zhang, L.M. Impact of the 2008 Wenchuan earthquake in China on subsequent long-term debris flow activities in the epicentral area. Geomorphology 2017, 276, 86–103. [Google Scholar] [CrossRef]
- Tang, C.; Zhu, J.; Qi, X.; Ding, J. Landslides induced by the Wenchuan earthquake and the subsequent strong rainfall event: A case study in the Beichuan area of China. Eng. Geol. 2011, 122, 22–33. [Google Scholar] [CrossRef]
- Chigira, M.; Wu, X.; Inokuchi, T.; Wang, G. Landslides induced by the 2008 Wenchuan earthquake, Sichuan, China. Geomorphology 2010, 118, 225–238. [Google Scholar] [CrossRef]
- Gorum, T.; Fan, X.; van Westen, C.J.; Huang, R.Q.; Xu, Q.; Tang, C.; Wang, G. Distribution pattern of earthquake-induced landslides triggered by the 12 May 2008 Wenchuan earthquake. Geomorphology 2011, 133, 152–167. [Google Scholar] [CrossRef]
- Xu, G.B.; Liu, X.H.; Trouet, V.; Treydte, K.; Wu, G.J.; Chen, T.; Sun, W.Z.; An, W.L.; Wang, W.Z.; Zeng, X.M.; et al. Regional drought shifts (1710–2010) in East Central Asia and linkages with atmospheric circulation recorded in tree-ring O-18. Clim. Dynam. 2019, 52, 713–727. [Google Scholar] [CrossRef] [Green Version]
- Chen, X.; Cui, P.; You, Y.; Chen, J.; Li, D. Engineering measures for debris flow hazard mitigation in the Wenchuan earthquake area. Eng. Geol. 2015, 194, 73–85. [Google Scholar] [CrossRef]
- Huang, R.; Li, W. Post-earthquake landsliding and long-term impacts in the Wenchuan earthquake area, China. Eng. Geol. 2014, 182, 111–120. [Google Scholar] [CrossRef]
- Li, C.; Wang, M.; Liu, K. A decadal evolution of landslides and debris flows after the Wenchuan earthquake. Geomorphology 2018, 323, 1–12. [Google Scholar] [CrossRef]
- Song, Y.; Li, C.; Olshansky, R.; Zhang, Y.; Xiao, Y. Are we planning for sustainable disaster recovery? Evaluating recovery plans after the Wenchuan earthquake. J. Environ. Plan. Manag. 2017, 60, 2192–2216. [Google Scholar] [CrossRef]
- Chen, N.; Li, J.; Liu, L.; Yang, C.; Liu, M. Post-earthquake denudation and its impacts on ancient civilizations in the Chengdu Longmenshan region, China. Geomorphology 2018, 309, 51–59. [Google Scholar] [CrossRef]
- Anderson, M.G.; Holcombe, E.; Blake, J.R.; Ghesquire, F.; Holm-Nielsen, N.; Fisseha, T. Reducing landslide risk in communities: Evidence from the Eastern Caribbean. Appl. Geogr. 2011, 31, 590–599. [Google Scholar] [CrossRef]
- Han, Y.; Fu, Y.; Hu, K.; Li, L.; Han, J.; Wang, X. Hazard insurance of secondary mountain hazards in afflicted areas by Wenchuan earthquake. Integr. Disaster Risk Manag. (IDRiM) J. 2013, 3, 196–218. [Google Scholar] [CrossRef] [Green Version]
- Han, Z. From Vulnerability to Resilience: Long-Term Livelihood Recovery in Rural China after the 2008 Wenchuan Earthquake; University of Delaware: Newark, DE, USA, 2014. [Google Scholar]
- Jin, L.; Chen, K.; Yu, B.; Filipski, M. Farmers’ coping strategies against an aggregate shock: Evidence from the 2008 Sichuan Earthquake. In Proceedings of the conference of International Association of Agricultural Economists, Milan, Italy, 9–14 August 2015. [Google Scholar]
- Feng, S.; Lu, J.; Nolen, P.; Wang, L. The effect of Wenchuan earthquake and government aid on rural households. In Earthquake lessons from China Coping and Rebuilding Strategies; Kevin Chen, Q.Z., Hsu, C., Eds.; International Food Policy Research Institute: Washington, DC, USA, 2016; pp. 11–34. [Google Scholar]
- Peng, Y.; Zhu, X.; Zhang, F.; Huang, L.; Xue, J.; Xu, Y. Farmers’ risk perception of concentrated rural settlement development after the 5.12 Sichuan Earthquake. Habitat Int. 2018, 71, 169–176. [Google Scholar] [CrossRef]
- Andersson-Skold, Y.; Bergman, R.; Johansson, M.; Persson, E.; Nyberg, L. Landslide risk management-A brief overview and example from Sweden of current situation and climate change. Int. J. Disaster Risk Reduct. 2013, 3, 44–61. [Google Scholar] [CrossRef]
- Korup, O.; Stolle, A. Landslide prediction from machine learning. Geol. Today 2014, 30, 26–33. [Google Scholar] [CrossRef]
- Chen, J.L.; Huang, G.R.; Chen, W.J. Towards better flood risk management: Assessing flood risk and investigating the potential mechanism based on machine learning models. J. Env. Manag. 2021, 293, 112810. [Google Scholar] [CrossRef]
- Zhang, Z.D.; Jung, C. GBDT-MO: Gradient-Boosted Decision Trees for Multiple Outputs. IEEE Trans. Neur. Net. Lear. 2021, 32, 3156–3167. [Google Scholar] [CrossRef]
- Liang, W.Z.; Sari, A.; Zhao, G.Y.; McKinnon, S.D.; Wu, H. Short-term rockburst risk prediction using ensemble learning methods. Nat. Hazards 2020, 104, 1923–1946. [Google Scholar] [CrossRef]
- Yang, L.C.; Liang, Y.; Zhu, Q.; Chu, X.L. Machine learning for inference: Using gradient boosting decision tree to assess non-linear effects of bus rapid transit on house prices. Ann. GIS 2021, 27, 273–284. [Google Scholar] [CrossRef]
- Pourghasemi, H.R.; Rahmati, O. Prediction of the landslide susceptibility: Which algorithm, which precision? Catena 2018, 162, 177–192. [Google Scholar] [CrossRef]
- Shirzadi, A.; Shahabi, H.; Chapi, K.; Dieu Tien, B.; Binh Thai, P.; Shahedi, K.; Bin Ahmad, B. A comparative study between popular statistical and machine learning methods for simulating volume of landslides. Catena 2017, 157, 213–226. [Google Scholar] [CrossRef]
- Zhou, C.; Yin, K.; Cao, Y.; Ahmed, B.; Li, Y.; Catani, F.; Pourghasemi, H.R. Landslide susceptibility modeling applying machine learning methods: A case study from Longju in the Three Gorges Reservoir area, China. Comput. Geosci. 2018, 112, 23–37. [Google Scholar] [CrossRef] [Green Version]
- He, Q.; Jiang, Z.; Wang, M.; Liu, K. Landslide and Wildfire Susceptibility Assessment in Southeast Asia Using Ensemble Machine Learning Methods. Remote Sens. 2021, 13, 1572. [Google Scholar] [CrossRef]
- Rong, G.; Alu, S.; Li, K.; Su, Y.; Zhang, J.; Zhang, Y.; Li, T. Rainfall Induced Landslide Susceptibility Mapping Based on Bayesian Optimized Random Forest and Gradient Boosting Decision Tree Models-A Case Study of Shuicheng County, China. Water 2020, 12, 3066. [Google Scholar] [CrossRef]
- Ge, Y.G.; Song, G.H.; Guo, C.X.; Kong, Y.D. Characteristics and Causes of 8·18 Debris Flow Hazards at the Longmenshan Town, Pengzhou, Sichuan. Shuili Xuebao 2012, 43, 147–154. (In Chinese) [Google Scholar]
- Statistical Bureau of Pengzhou. Pengzhou Statistical Yearbook 2021; Statistical Bureau of Pengzhou: Pengzhou, China, 2021. [Google Scholar]
- Abu Abbas, O. Comparisons between data clustering algorithms. Int. Arab J. Inf. Technol. 2008, 5, 320–325. [Google Scholar]
- Friedman, J.H. Greedy function approximation: A gradient boosting machine. Ann. Stat. 2001, 29, 1189–1232. [Google Scholar] [CrossRef]
- Di, B.; Zhang, H.; Liu, Y.; Li, J.; Chen, N.; Stamatopoulos, C.A.; Luo, Y.; Zhan, Y. Assessing Susceptibility of Debris Flow in Southwest China Using Gradient Boosting Machine. Sci. Rep. 2019, 9, 12532. [Google Scholar] [CrossRef] [Green Version]
- Ichikawa, D.; Saito, T.; Ujita, W.; Oyama, H. How can machine-learning methods assist in virtual screening for hyperuricemia? A healthcare machine-learning approach. J. Biomed. Inform. 2016, 64, 20–24. [Google Scholar] [CrossRef]
- Zhang, C.; Liu, C.; Zhang, X.; Almpanidis, G. An up-to-date comparison of state-of-the-art classification algorithms. Expert Syst. Appl. 2017, 82, 128–150. [Google Scholar] [CrossRef]
- Natekin, A.; Knoll, A. Gradient boosting machines, a tutorial. Front. Neurorobot. 2013, 7, 21. [Google Scholar] [CrossRef] [Green Version]
- Van der Maaten, L.; Hinton, G. Visualizing high-dimensional data using t-SNE. J. Mach. Learn. Res. 2008, 9, 2579–2605. [Google Scholar]
- Huang, R.; Li, W. Formation, distribution and risk control of landslides in China. J. Rock Mech. Geotech. Eng. 2011, 3, 97–116. [Google Scholar] [CrossRef] [Green Version]
- Johnson, C.; Lizarralde, G. Post-disaster housing and reconstruction. In International Encyclopedia of Housing and Home; Smith, S., Ed.; Elsevier: San Diego, CA, USA, 2012; pp. 340–346. [Google Scholar]
- Park, A.; Wang, S. Benefiting From Disaster? Public and Private Responses to the Wenchuan Earthquake. World Dev. 2017, 94, 38–50. [Google Scholar] [CrossRef]
- Dunford, M.; Li, L. Earthquake reconstruction in Wenchuan: Assessing the state overall plan and addressing the ‘forgotten phase’. Appl. Geogr. 2011, 31, 998–1009. [Google Scholar] [CrossRef]
- Gariano, S.L.; Guzzetti, F. Landslides in a changing climate. Earth Sci. Rev. 2016, 162, 227–252. [Google Scholar] [CrossRef] [Green Version]
- Massazza, A.; Brewin, C.; Joffe, H. The nature of ‘natural disasters’: Survivors’ explanations of earthquake damage. Int. J. Disaster Risk Sci. 2019, 10, 293–305. [Google Scholar] [CrossRef] [Green Version]
- Liu, H.; Zhang, D.; Wei, Q.; Guo, Z. Comparison study on two post-earthquake rehabilitation and reconstruction modes in China. Int. J. Disaster Risk Reduct. 2017, 23, 109–118. [Google Scholar] [CrossRef]
- Alexander, D. Vulnerability to landslides. In Landslide Hazard and Risk; Glade, T., Anderson, M., Crozier, M.J., Eds.; Wiley: Chichester, UK, 2005; pp. 175–198. [Google Scholar]
- Fang, Y.-P.; Zhu, F.-B.; Qiu, X.-P.; Zhao, S. Effects of natural disasters on livelihood resilience of rural residents in Sichuan. Habitat Int. 2018, 76, 19–28. [Google Scholar] [CrossRef]
- Zhai, G.; Suzuki, T. Risk perception in Northeast Asia. Environ. Monit. Assess. 2009, 157, 151–167. [Google Scholar] [CrossRef]
- Di, B.F.; Li, J.R.; Dandoulaki, M.; Cruz, A.M.; Zhang, R.X.; Niu, Z.P. Household recovery strategies in Longmen Mountain area, Sichuan, China, following the 2008 Wenchuan earthquake disaster. Nat. Hazards 2020, 104, 123–137. [Google Scholar] [CrossRef]


| Category | Levels | Total | |||
|---|---|---|---|---|---|
| Small | Medium | Large | Extra-Large | ||
| Debris flow | 20 | 18 | 11 | 2 | 51 |
| Landslide | 60 | 6 | 0 | 0 | 66 |
| Debris fall | 26 | 10 | 4 | 0 | 40 |
| Slope failure | 1 | 1 | 0 | 0 | 2 |
| Total | 107 | 35 | 15 | 2 | 159 |
| Dimensions | Indicators | Values |
|---|---|---|
| Economic adaptability | Living condition | Worse = −1; No change = 0; Better = 1 |
| Type of job | No change = 0; Changed = 1 | |
| Number of jobs | Decreased = −1; No change = 0; Increased = 1 | |
| Number of household members with job | Decreased = −1; No change = 0; Increased = 1 | |
| Place of work | Contracted = −1; No change = 0; Expanded = 1 | |
| Physical adaptability | House floor area | Decreased = −1; No change = 0; Increased = 1 |
| House construction material | No change = 0; Changed = 1 | |
| Relocated | Yes = 1; No = 0 | |
| Dependence on government policies | Government assistance | Yes = 1; No = 0 |
| Communal facilities | Yes = 1; No = 0 | |
| Information accessibility | Information access | Yes = 1; No = 0 |
| Understanding degree | High = 1; Low = 0 | |
| Educational level | High = 1; Low = 0 | |
| Psychological adaptability | Adaptation perception | Bad = −1; No change = 0; Good = 1 |
| Elements | Description | Data Source |
|---|---|---|
| Historical disaster data | The distribution of collapses, landslides, debris flows, and unstable slopes in the study area | Investigations and zoning reports of geological disasters, Sichuan Geological Engineering Investigation Institute |
| Terrain data | Digital elevation model, 30 m resolution; basic topographic map of Sichuan, scale 1:50,000 | Sichuan Bureau of Surveying, Mapping, and Geoinformation |
| Vegetation data | NDVI data of the study area in September and October of 2011, 2013, and 2015 obtained from LANDSAT images | LANDSAT satellite digital products from the USGS (https://earthexplorer.usgs.gov/, accessed at 19 November 2016) |
| Landform data | The landform data in the study area | Atlas of Mountain Hazards and Soil Erosion in the Upper Yangtze (http://ir.imde.ac.cn/handle/131551/18263, accessed at 20 September 2016) |
| River | Vector data of the river in the study area (distance from river in meters) | Remote sensing image interpretation |
| Road | Vector data of the road in the study area (distance from road in meters) | Remote sensing image interpretation |
| Residential area points | Vector data of residential points in the study area | Remote sensing image interpretation |
| Questionnaire survey data | Survey of landslide adaptation strategies of households in the study area | Questionnaire survey |
| Remote sensing image | QuickBird high resolution picture, 2.4 m resolution; UAV photographs, 0.6 m resolution | Google Earth images, unmanned aerial vehicle photography |
| Adaptation Types | Scenario 1 No Change | Scenario 2 Frequency Increases | Scenario 3 Frequency Decreases |
|---|---|---|---|
| Type 1: Policy-dependent adaptation | 72 (10%) | 121 (17%) | 40 (5%) |
| Type 2: Autonomous adaptation | 551 (76%) | 490 (68%) | 583 (81%) |
| Type 3: Hybrid adaptation | 98 (14%) | 110 (15%) | 98 (14%) |
| Total | 721 (100%) | 721 (100%) | 721 (100%) |
Publisher’s Note: MDPI stays neutral with regard to jurisdictional claims in published maps and institutional affiliations. |
© 2022 by the authors. Licensee MDPI, Basel, Switzerland. This article is an open access article distributed under the terms and conditions of the Creative Commons Attribution (CC BY) license (https://creativecommons.org/licenses/by/4.0/).
Share and Cite
Su, H.; Fernandez, G.; Hu, X.; Wu, S.; Di, B.; Tan, C. Predicting Change in Adaptation Strategies of Households to Geological Hazards in the Longmenshan Area, China Using Machine Learning and GIS. Water 2022, 14, 1023. https://doi.org/10.3390/w14071023
Su H, Fernandez G, Hu X, Wu S, Di B, Tan C. Predicting Change in Adaptation Strategies of Households to Geological Hazards in the Longmenshan Area, China Using Machine Learning and GIS. Water. 2022; 14(7):1023. https://doi.org/10.3390/w14071023
Chicago/Turabian StyleSu, Haichuan, Glenn Fernandez, Xiaoxi Hu, Shaolin Wu, Baofeng Di, and Chunping Tan. 2022. "Predicting Change in Adaptation Strategies of Households to Geological Hazards in the Longmenshan Area, China Using Machine Learning and GIS" Water 14, no. 7: 1023. https://doi.org/10.3390/w14071023