
Lotic Environment Affects Morphological Characteristics and Energy Metabolism of Juvenile Grass Carp Ctenopharyngodon idella


1
Hubei Provincial Engineering Laboratory for Pond Aquaculture, Hubei Hongshan Laboratory, Engineering Research Center of Green Development for Conventional Aquatic Biological Industry in the Yangtze River Economic Belt, Ministry of Education, College of Fisheries, Huazhong Agricultural University, Wuhan 430070, China
2
College of Animal Science and Technology, Tarim University, Alar 843300, China
*
Author to whom correspondence should be addressed.
Water 2022, 14(7), 1019; https://doi.org/10.3390/w14071019
Submission received: 15 February 2022
/
Revised: 12 March 2022
/
Accepted: 19 March 2022
/
Published: 23 March 2022
(This article belongs to the Special Issue Effect of Aquatic Environment on Fish Ecology)
Abstract
:This study investigated the effect of a lotic environment on morphological characteristics and energy metabolism in juvenile grass carp Ctenopharyngodon idella. The fish were stocked in the lotic environment and forced to swim for 12 h per day for 4 weeks at three water current velocities of 0.5, 2, and 4 body length s−1 (Bl s−1). The control fish were stocked in the lentic environment with water current velocities of 0 Bl s−1. The results showed that lotic environment significantly increased body weight, body length, and condition factor of grass carp. The first principal component (PC1) characterized by measured overall body size suggested that fish in a lotic environment had body stoutness and wider tail stalk. Standard metabolic rate (SMR), maximum metabolic rate (MMR), and aerobic swimming performance (Ucrit) were elevated with the increased water flow and positively correlated with PC1. The 4 Bl s−1 group showed significantly decreased contents of serum glucose and muscular glycogen, and a significantly increased level of serum lactic acid. The mRNA expression levels of AMP-activated protein kinase-phosphorylate PPAR γ coactivator 1 α-nuclear respiratory factor 1 (AMPK-PGC1α-NRF1) pathway-related genes were significantly upregulated in red muscle of grass carp in the lotic environment. Water flow environment at 4 Bl s−1 significantly increased ratios of metabolic enzymes (lactate dehydrogenase/citrate synthase) and cytochrome c oxidase/citrate synthase) in the muscle. The relationship between morphological characteristics and metabolic capacity suggested that the body size of grass carp in a lotic environment was shaped to promote energy metabolism. The study identified the evidence of the mechanism and relationship of the trade-off between energy and morphology in grass carp.
1. Introduction
As an important factor in the hydrological environment, water flow has complex impacts on fish [1]. Previous research has proved that moderate water velocities have a range of positive effects on fish, including the enhancement of growth rate and disease resistance, while high water velocities tend to damage the fish’s health and growth performance [2,3,4]. Fish are extremely susceptible to water velocity and swimming against the current because of their habits. The changes in the water environment can significantly affect fish ecology [5].
Swimming performance is an important indicator of whether fish can adapt to the environment, and is closely related to fish reproduction, escape ability, predation, migration, and environmental preferences [6,7]. Swimming performance has been often used as a measure of ecological adaptability in fish. Different fish morphologies affect swimming performance [8,9]. In addition to swimming performance, energy metabolism also plays a vital role in the adaption of fish survival in the environment [10,11]. The physiological and morphological changes of fish after swimming exercise are important manifestations of their adaptability [12,13]. In fact, the shape of fish is inseparable from their surroundings [14]. Environmental factors affect adaptive trade-offs in fish physiology, energy, behavior, and morphology [15,16]. Fish blood parameters have been considered as an indication of metabolism and health. Glycogen is the main storage form of glucose and the most important energy substrate during fish exercise [17]. However, there is limited acknowledgment on the trade-off mechanism between morphology and energy metabolism of fish in a lotic environment.
The AMP-activated protein kinase (AMPK) is a complex heterotrimer that is highly conserved in vertebrates, consisting of an α catalytic subunit and two β and γ regulatory subunits [18]. Previous research has established that sustained swimming significantly increased AMPK expression level, thus facilitating downstream target gene expression in skeletal muscle in rainbow trout (Oncorhynchus mykiss) and promoting mitochondrial biogenesis and oxidative phosphorylation [19,20]. AMPK activation by hypoxic and low temperature in skeletal muscle also has several metabolic pathways, such as lipid oxidation and glucose glycolysis [21,22,23]. In the AMPK signaling pathway, peroxisome proliferator-activated receptor-γ coactivator (PGC-1α) regulates the expression and function of the respiratory chain through nuclear respiratory factor-1 (NRF-1). Therefore, NRF-1 is an important downstream target of this pathway.
Grass carp (Ctenopharyngodon idella) possesses an important position in the aquaculture industry around the world. Prior studies that have noted the benefits of water velocity in swimming performance and growth of fish, but the mechanism of the effect of running water on the alteration of morphological characteristics and energy metabolism remains unclear in fish. This study aimed to investigate the role of the AMPK signaling pathway in grass carp stocked in the lotic environment, and to explore the relationship between morphological characteristics and swimming training. An integrated analysis of the metabolic capacity related to morphological characteristics of grass carp in the lotic environment was conducted to explore the relationship between metabolic and morphological characteristics. This research will provide data support for the physiological energetic and metabolic requirements of the adaptive responses to swimming in fish.
2. Materials and Methods
2.1. Fish and Experimental Conditions
Juvenile grass carp were acquired from a local fish farm (Wuqi Fishery in Wuhan, Hubei, China). Experimental fish were kept in the recirculating aquaculture system tanks (height 78 cm, diameter 1 m) for 2-week acclimation. The grass carp were fed with Tongwei commercial feed (crude protein ≥ 31.0%, crude fat ≥ 4.0%, crude fiber ≥ 4%, total phosphorus ≥ 1%, calcium ≥ 0.5–2.0%, sodium chloride ≥ 0.3–1.2%, moisture ≥ 12.5%, lysine ≥ 1.4%) three times a day until apparent satiety. Water temperature and dissolved oxygen were 27–30 °C and > 7 mg/L, respectively.
2.2. Experimental Protocol
After 2-week acclimation, 180 healthy grass carp (weight 16.83 ± 3.96 g, body length 9.43 ± 0.86 cm) were raised in 12 tanks. They were randomly assigned into one control group and three swimming training groups with water velocities of 0.5, 2, and 4 Bl/s, respectively. The water velocity of the control group was 0 Bl/s. The triplicates were used for each group. During the experimental period, the grass carp were forced to swim for 12 h (9:00–13:00, 14:00–22:00) per day in the custom-designed tanks. Each custom-designed tank was equipped with a cylindrical tube in the central area and a submersible pump at the bottom of the tank, as previously described by Zhang [24].
2.3. Sampling
At the end of the experiment, the final body weight and length of all fish from the tanks were measured to the nearest 0.1 g or 0.1 cm. Four fish of each tank were randomly selected to measure their morphometrics, metabolic rates, and aerobic swimming ability. Then, nine fish were randomly chosen per tank and anesthetized with 200 mg/L MS-222. Blood from the tail artery of each fish were clotted at room temperature for 30 min and then centrifuged at 3000 r/min for 30 min to get serum. Red and white muscles were isolated along the lateral line of each fish and snap-frozen in liquid nitrogen, then stored at −80 °C for mRNA and protein expression analysis.
2.4. Analytical Procedures
2.4.1. Measurement of Morphology
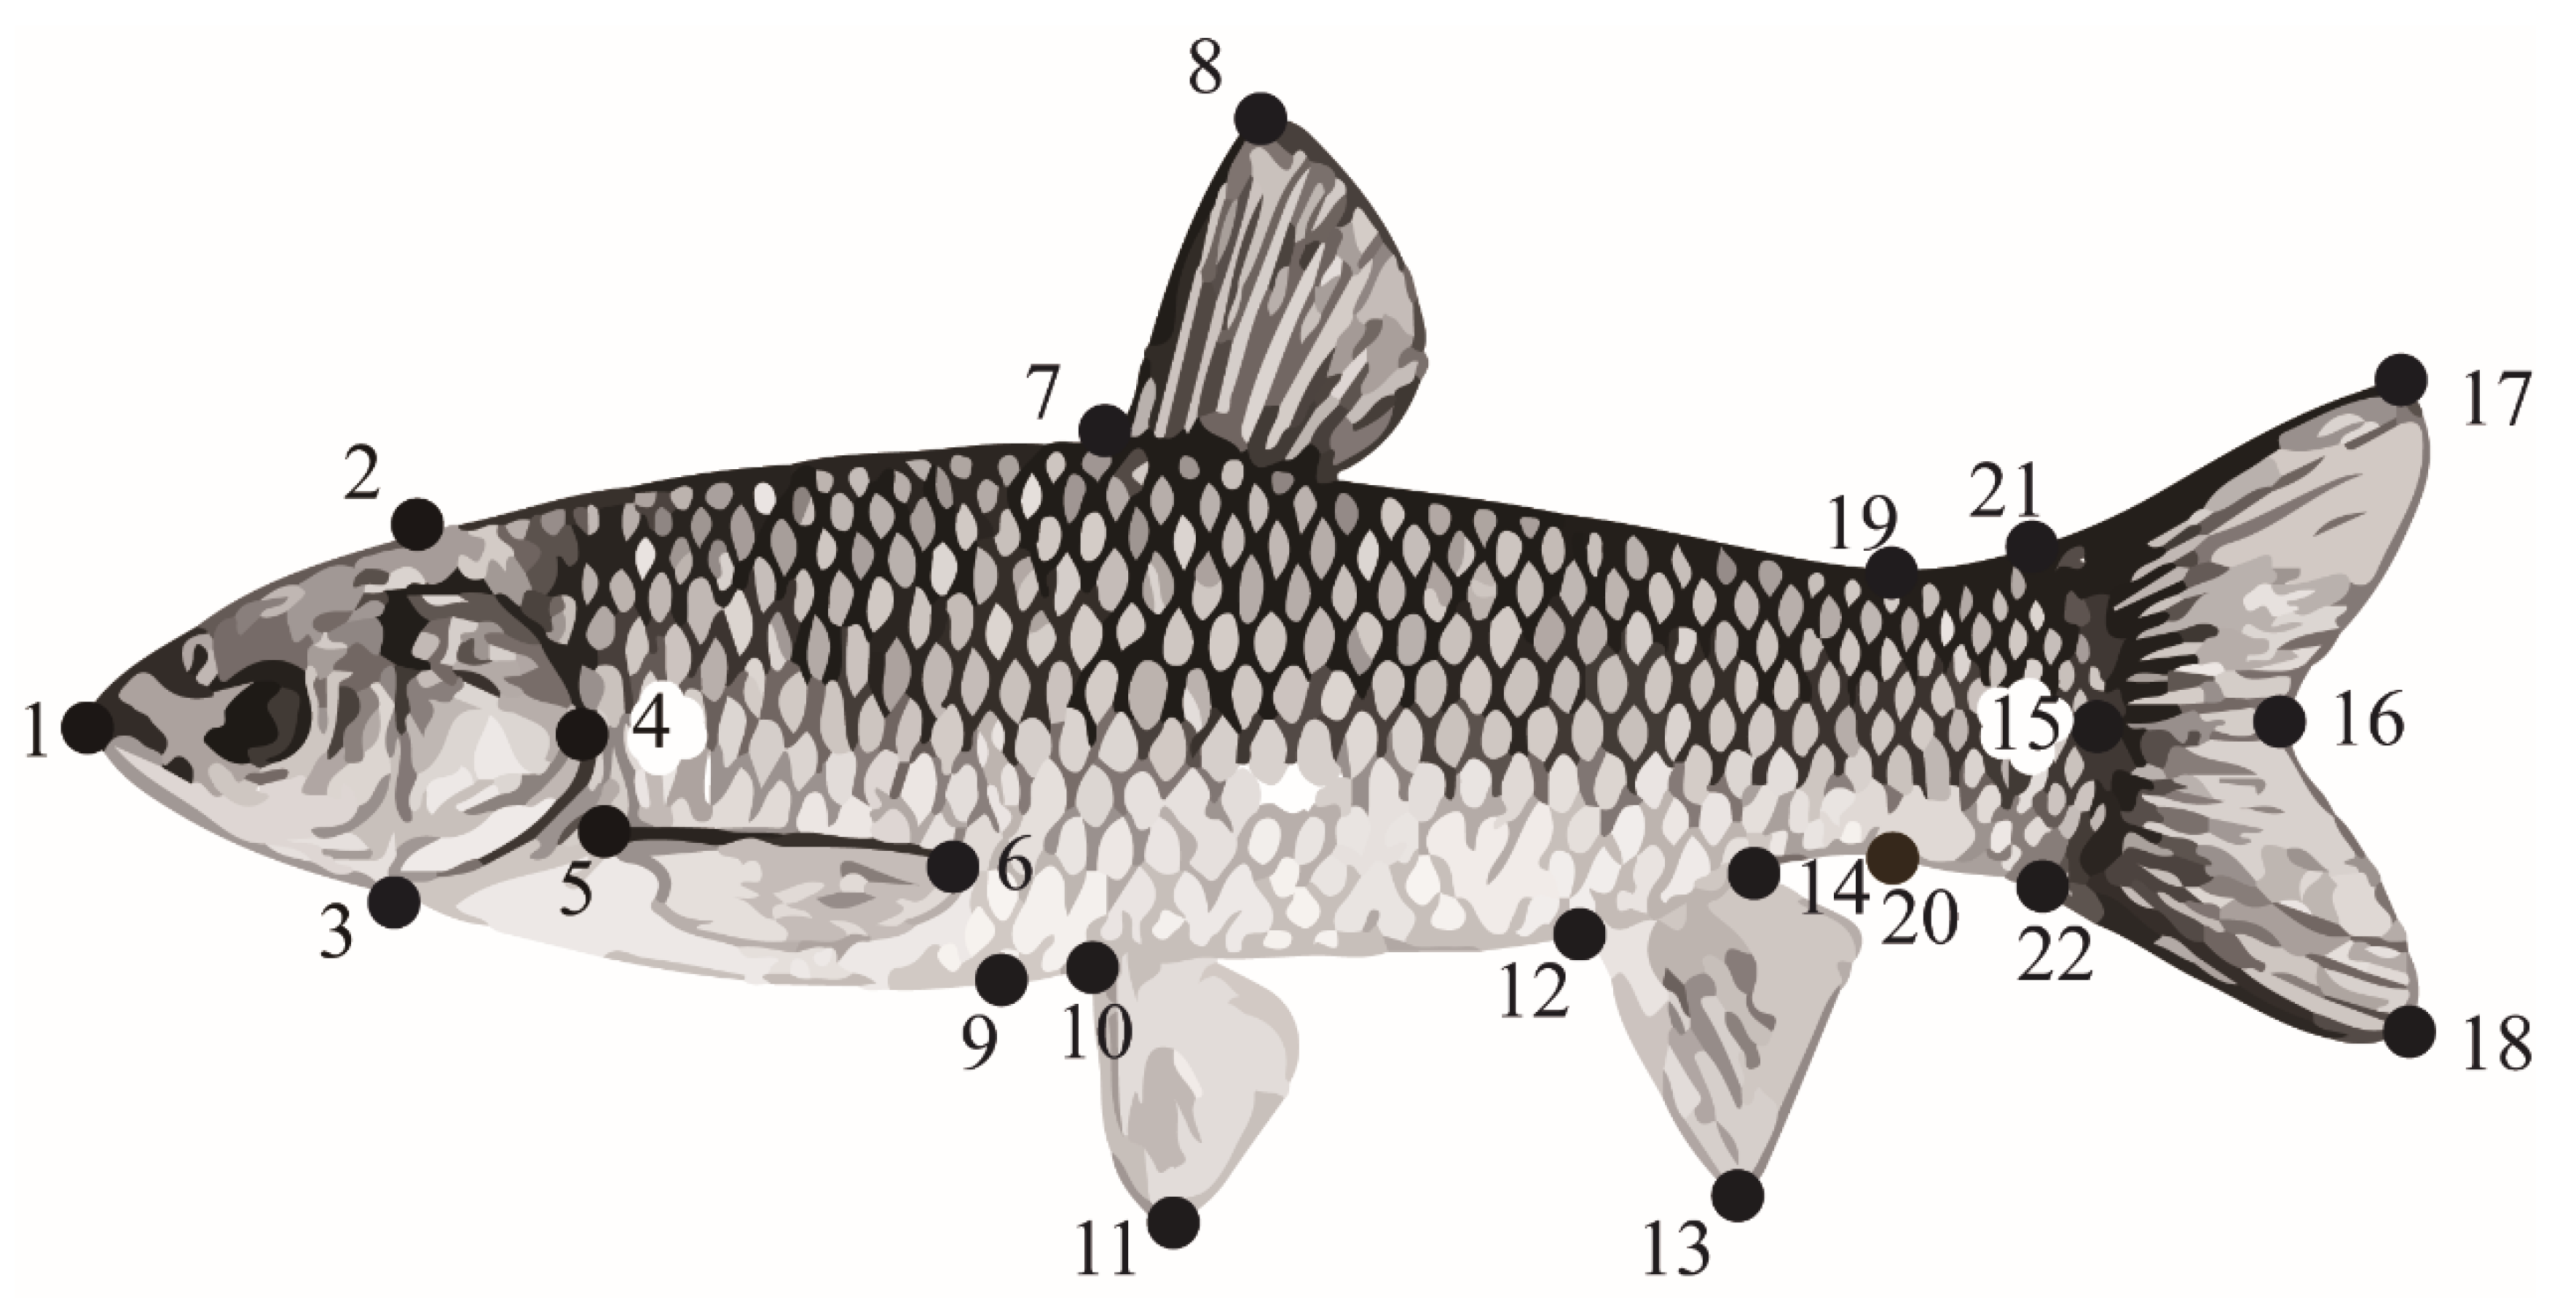
Positions of the 22 points used for measurement of morphology are shown in Figure 1. Twenty morphological parameters (1–15, body length; 1–16, fork length; 1–17/18; total length; 1–2/3/4, head length; 2–3, head height; 2–7, back length; 7–9, body height; 7–8, dorsal fin length; 5–6, pectoral fin length; 10–11, pelvic fin length; 12–13, anal fin length; 17–18, caudal fin height;17–21/18–22, caudal fin length; 19–20, caudal peduncle height; 14–22/19–21, caudal peduncle length) were measured by ImageJ. In order to eliminate the influence of individual size differences of grass carp on morphometric parameters, the standardized traits were obtained by dividing each morphological index by body length. On sampling day, the condition factor (CF) for each fish was calculated using the following formula: K = 100·body weight/(body length)3.
2.4.2. Measurement of Aerobic Swimming Ability
The grass carp were transferred into a custom-designed flow-through respirometer [26] and allowed to adapt for 1 h. During the test, the water velocity was then increased in 1 Bl s−1 increments from the initial value of 1 Bl s−1 every 20 min until the fish became fatigued. Water velocity and time were recorded.
Ucrit was calculated using Brett’s equation: Ucrit = V + (T/ΔT), where V is the maximum swimming speed (Bl s−1) of the fish in the whole cycle, ΔT is the prescribed time (20 min) for each acceleration, and T is the time for the fish to swim to ultimate exhaustion (minutes).
2.4.3. Measurements of Oxygen Consumption Rate
The oxygen consumption rate of the grass carp was also determined using a custom-designed flow-through respirometer. The oxygen content at the water outlets from each group was determined by a water quality analyzer (Hach 40H). At the end of the Ucrit measurements, the fatigued grass carp was exposed to the air for 1 min [27] and then transferred into the flow-through respirometer to measure its maximum metabolic rate (MMR). The standard metabolic rate (SMR) of grass carp was quantified after 24 h. The metabolic rate was calculated using the following formula:
where ΔO2 is the difference between the dissolved oxygen (mgO2·L−1) in the breathing experimental chamber and the blank breathing chamber (without fish), V is the water velocity rate in the breathing chamber (L·h−1), m is the weight of the fish (kg), and MO2 was adjusted to a standard body weight of 1 kg using a mass exponent of 0.75 [28]. The SMR was calculated by taking the average of the lowest three values of oxygen consumption rate during the 10-h measurement period.
MO2 = (ΔO2 × V)/m0.75
2.4.4. Determination of Contents of Lactic Acid and Glucose in Serum
Content of lactic acid in serum was measured with a colorimetric determination kit (JianCheng Bioengineering Institute, Nanjing, China). Glucose (GLU) content in serum was assayed by a Selectra-xl automatic biochemical analyzer (VITALAB, Dieren, Netherlands).
2.4.5. Determination of Glycogen and Enzyme Activity of Muscle
Glycogen concentrations in muscle were detected by the sulfuric acid-anthrone colorimetric method according to the manufacturer’s instructions (Nanjing Jiancheng) [29]. The lactate dehydrogenase (LDH) in muscle was quantified by LDH assay kit (Nanjing Jiancheng) [30]. Citrate synthase (CS) and cytochrome c oxidase (COX) Elisa kits were purchased from Jingmei, Shanghai, China.
2.4.6. Gene Expression Level of AMPK Pathway in Red and White Muscle
The red and white muscle RNA were extracted with total RNA extraction reagent (Takara, Kyoto, Japan). Reverse transcription was performed using Hifair®III 1st Strand cDNA Synthesis Super Mix for qPCR (gDNA digester plus) (YEASEN, Shanghai, China). QPCR was performed with Hieff™ qPCR SYBR® Green Master Mix (Low Rox Plus) (YEASEN) following the manufacturer’s protocols in a Quant Studio ® 6 Flex Real-Time PCR System (Life Technologies, Beijing, China) [31]. The relative expression of the target gene was determined by using the 2-ΔΔCt method for analysis and normalized using 18s RNA and β-actin. The gene-specific primer sequence reference is presented in Table 1.
2.5. Statistics
All analyses were carried out using SPSS 26.0 software (Chicago, IL, USA) and presented with mean ± SEM. Normality tests were performed by using the Kolmogorov–Smirnov tests and all data were normally distributed. The morphology parameters were converted to percentage values of body length, and then data were converted with principal components analysis (PCA) and KMO and Bartlett’s sphericity test were performed, indicating that our data were adequate for factor analysis. Optimal factors were kept and rotated with an eigenvalue greater than 1, and used to analyze the relevant morphology, swimming performance and oxygen consumption rate by least squares linear regression. All data were analyzed by one-way ANOVA post-hoc Duncan test (p < 0.05).
3. Results
3.1. Growth Performance
The fish growth was changed by the lotic environment for 4 weeks. The body weight, body length, and condition factor of the grass carp all increased significantly with the increase of water velocity at 0.5, 2, and 4 Bl s−1 (p < 0.05) (Table 2). The highest levels of body weight, body length, and condition factor occurred in the 4 Bl s−1 group (p < 0.05) (Table 2).
3.2. Morphological Characteristics, Aerobic Swimming Performance, and Oxygen Consumption Rate
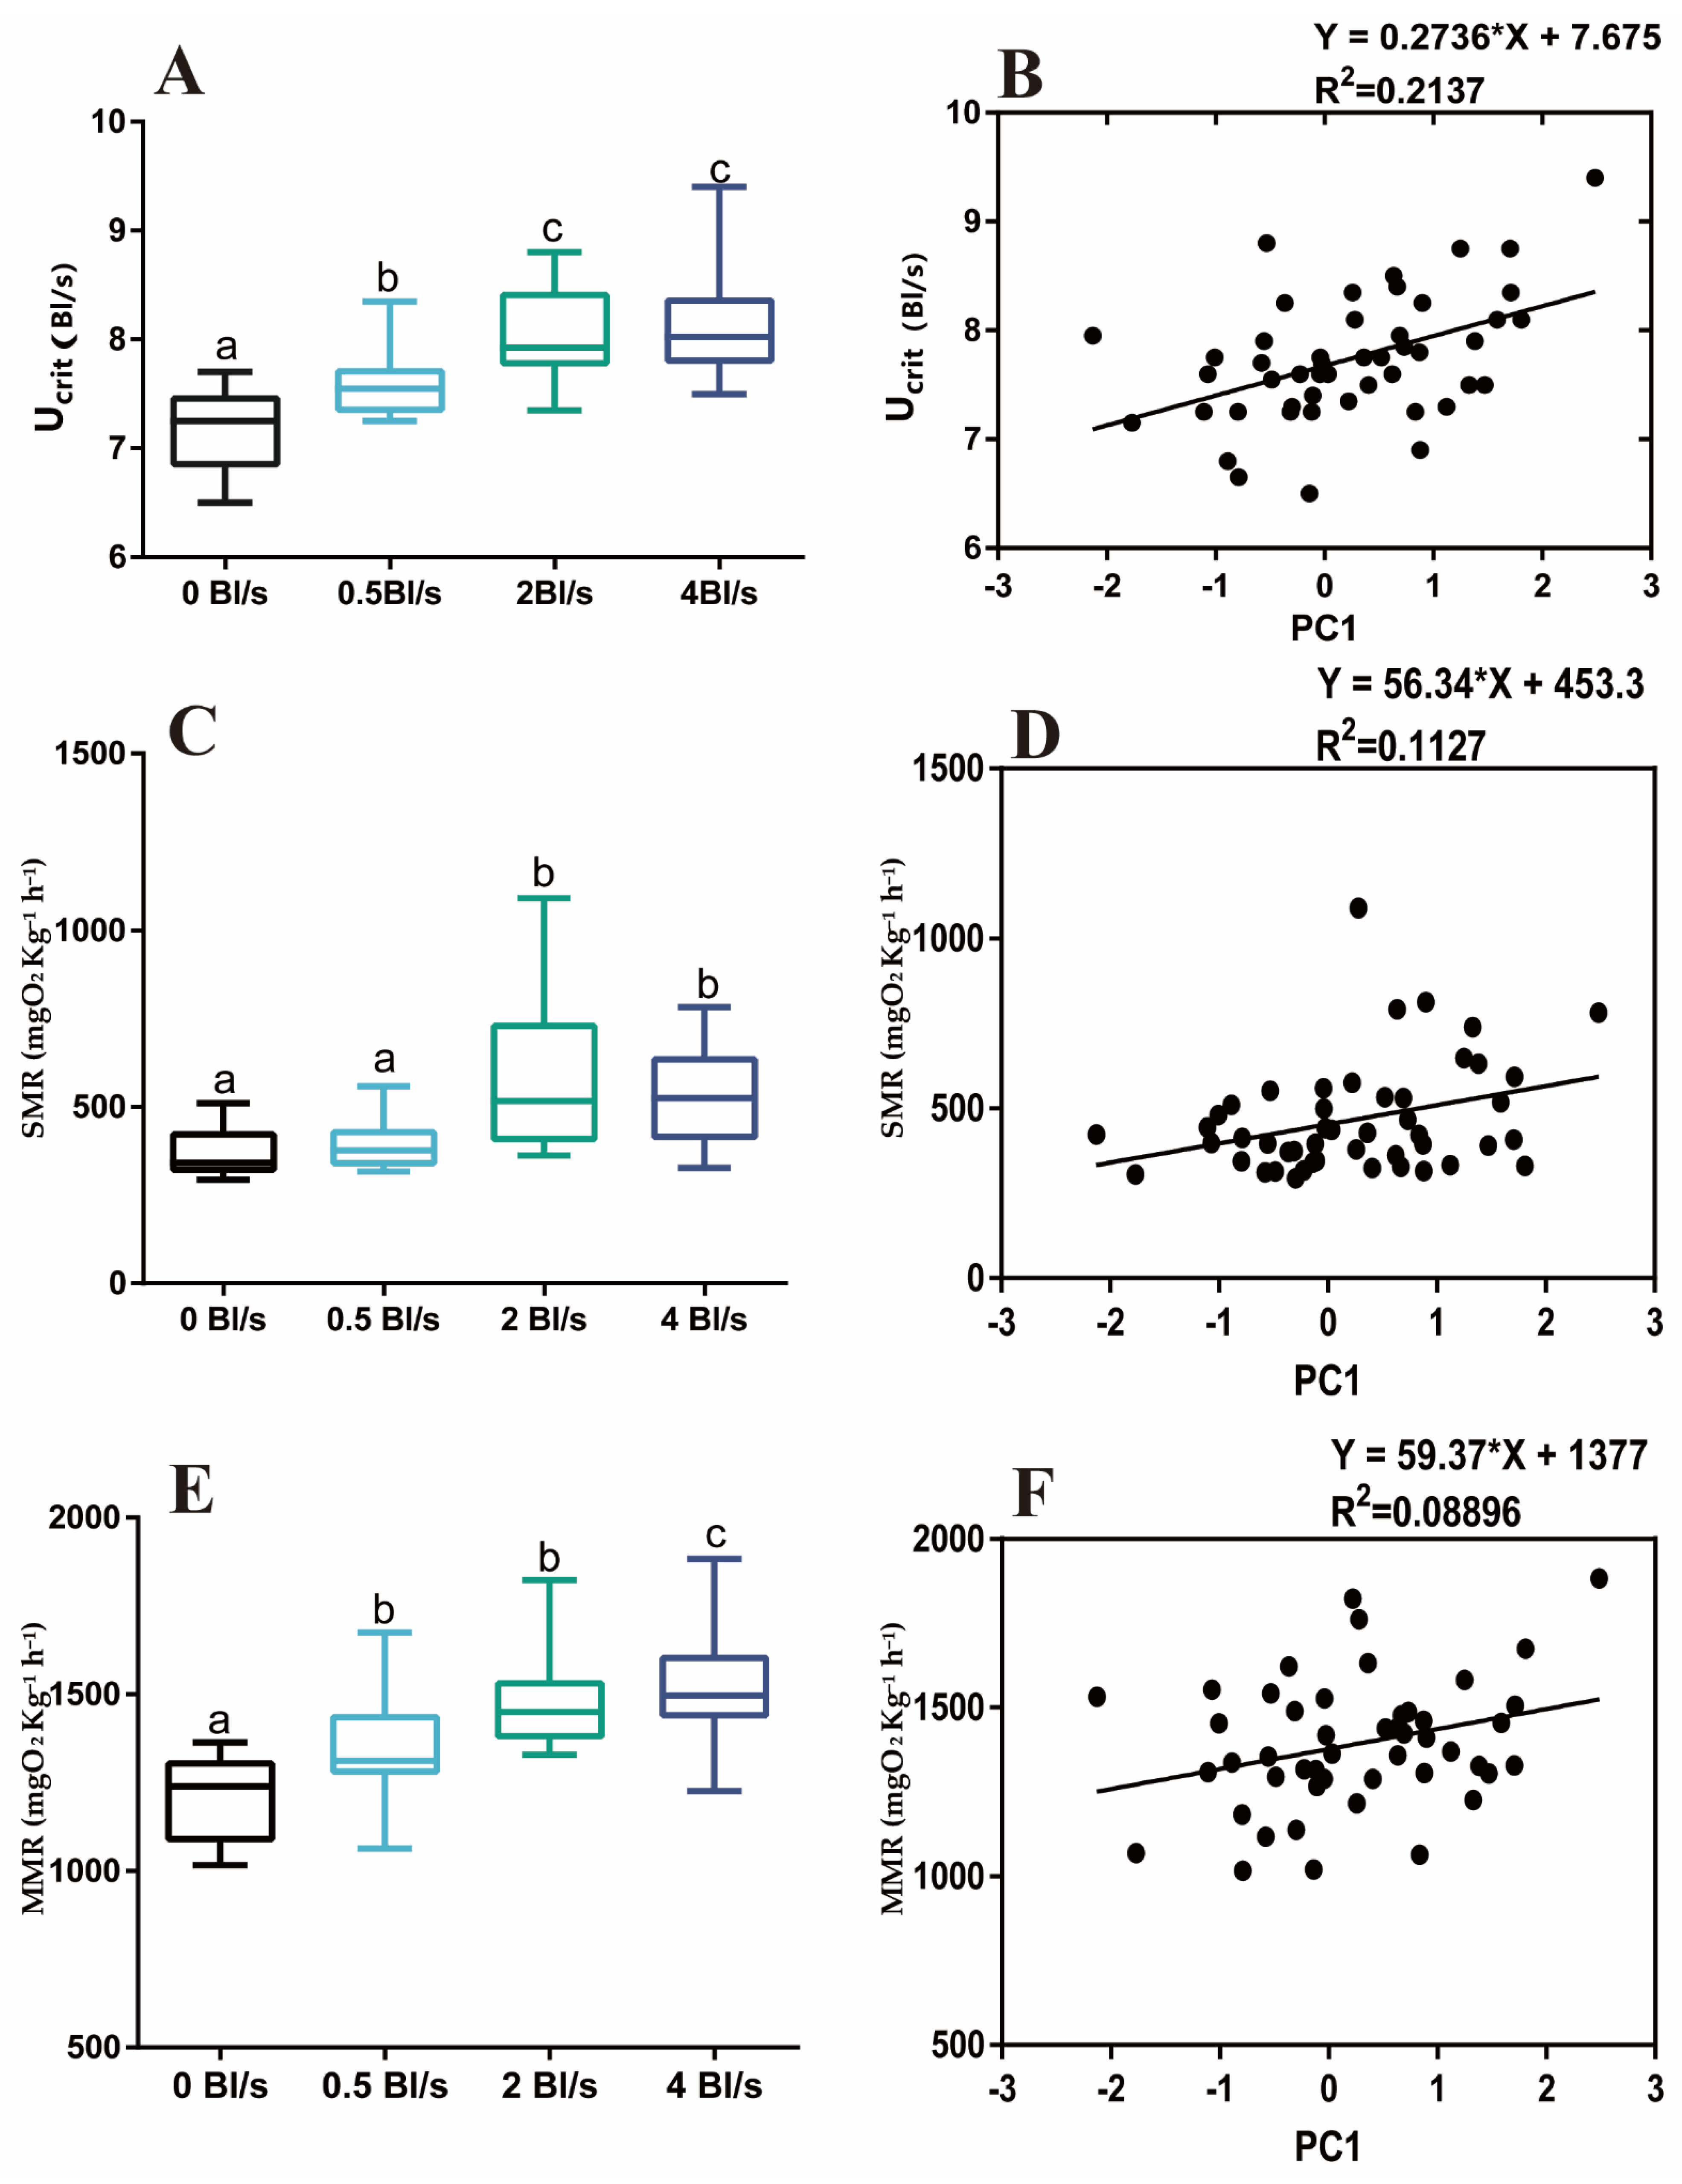
The water velocity significantly impacted the aerobic exercise capacity of grass carp. The Ucrit of fish stocked in the lotic environment significantly increased compared with the control group (p < 0.05) (Figure 2A). The diameters of the morphological characteristics fins, tail stalk and overall body stoutness were significantly increased after swimming (Table A1) (p < 0.05). PCA showed that 19 morphological variables in this study produced six factors with eigenvalues greater than 1 describing 68.31% of the total variance. KMO and Bartlett of 19 morphological variables were KMO = 0.579 > 0.5, and p = 0.000 < 0.05, indicating that the 19 morphological characteristics used in this study were suitable for principal component analysis. Subsequently, PCA was used with varimax normalized rotation to maximize the variances of the factor loadings across variables for each factor. Length of pectoral fin, head height, body height and caudal peduncle depth had high factor loadings for PC1. PC2 summarized the total length and caudal fin length and total length. PC3 showed head length. PC4 summarized the fork length and caudal fin height. PC5 was characterized by pelvic fin length and anal fin length. PC6 was characterized back length and dorsal fin length (Table A2). PC1 was positively correlated with Ucrit (R2 = 0.2137, F1,46, p = 0.0009) (Figure 2B). Among the six principal components, Ucrit correlations were not significant for PC2, PC3, PC4, PC5, and PC6 (Table A3). The SMR of grass carp in the 2 and 4 Bl s−1 groups were significantly higher than the control group (p < 0.05) (Figure 2C). The MMR of 0.5, 2, and 4 Bl s−1 groups were significantly higher than that of the control group (p < 0.05) (Figure 2E). PC1 and metabolic rate were positively correlated (SMR, R2 = 0.1127, F1,46, p = 0.0197. MMR, R2 = 0.08896, F1,46, p = 0.0395).
3.3. Serum Biochemical Parameters and Muscle Glycogen Content
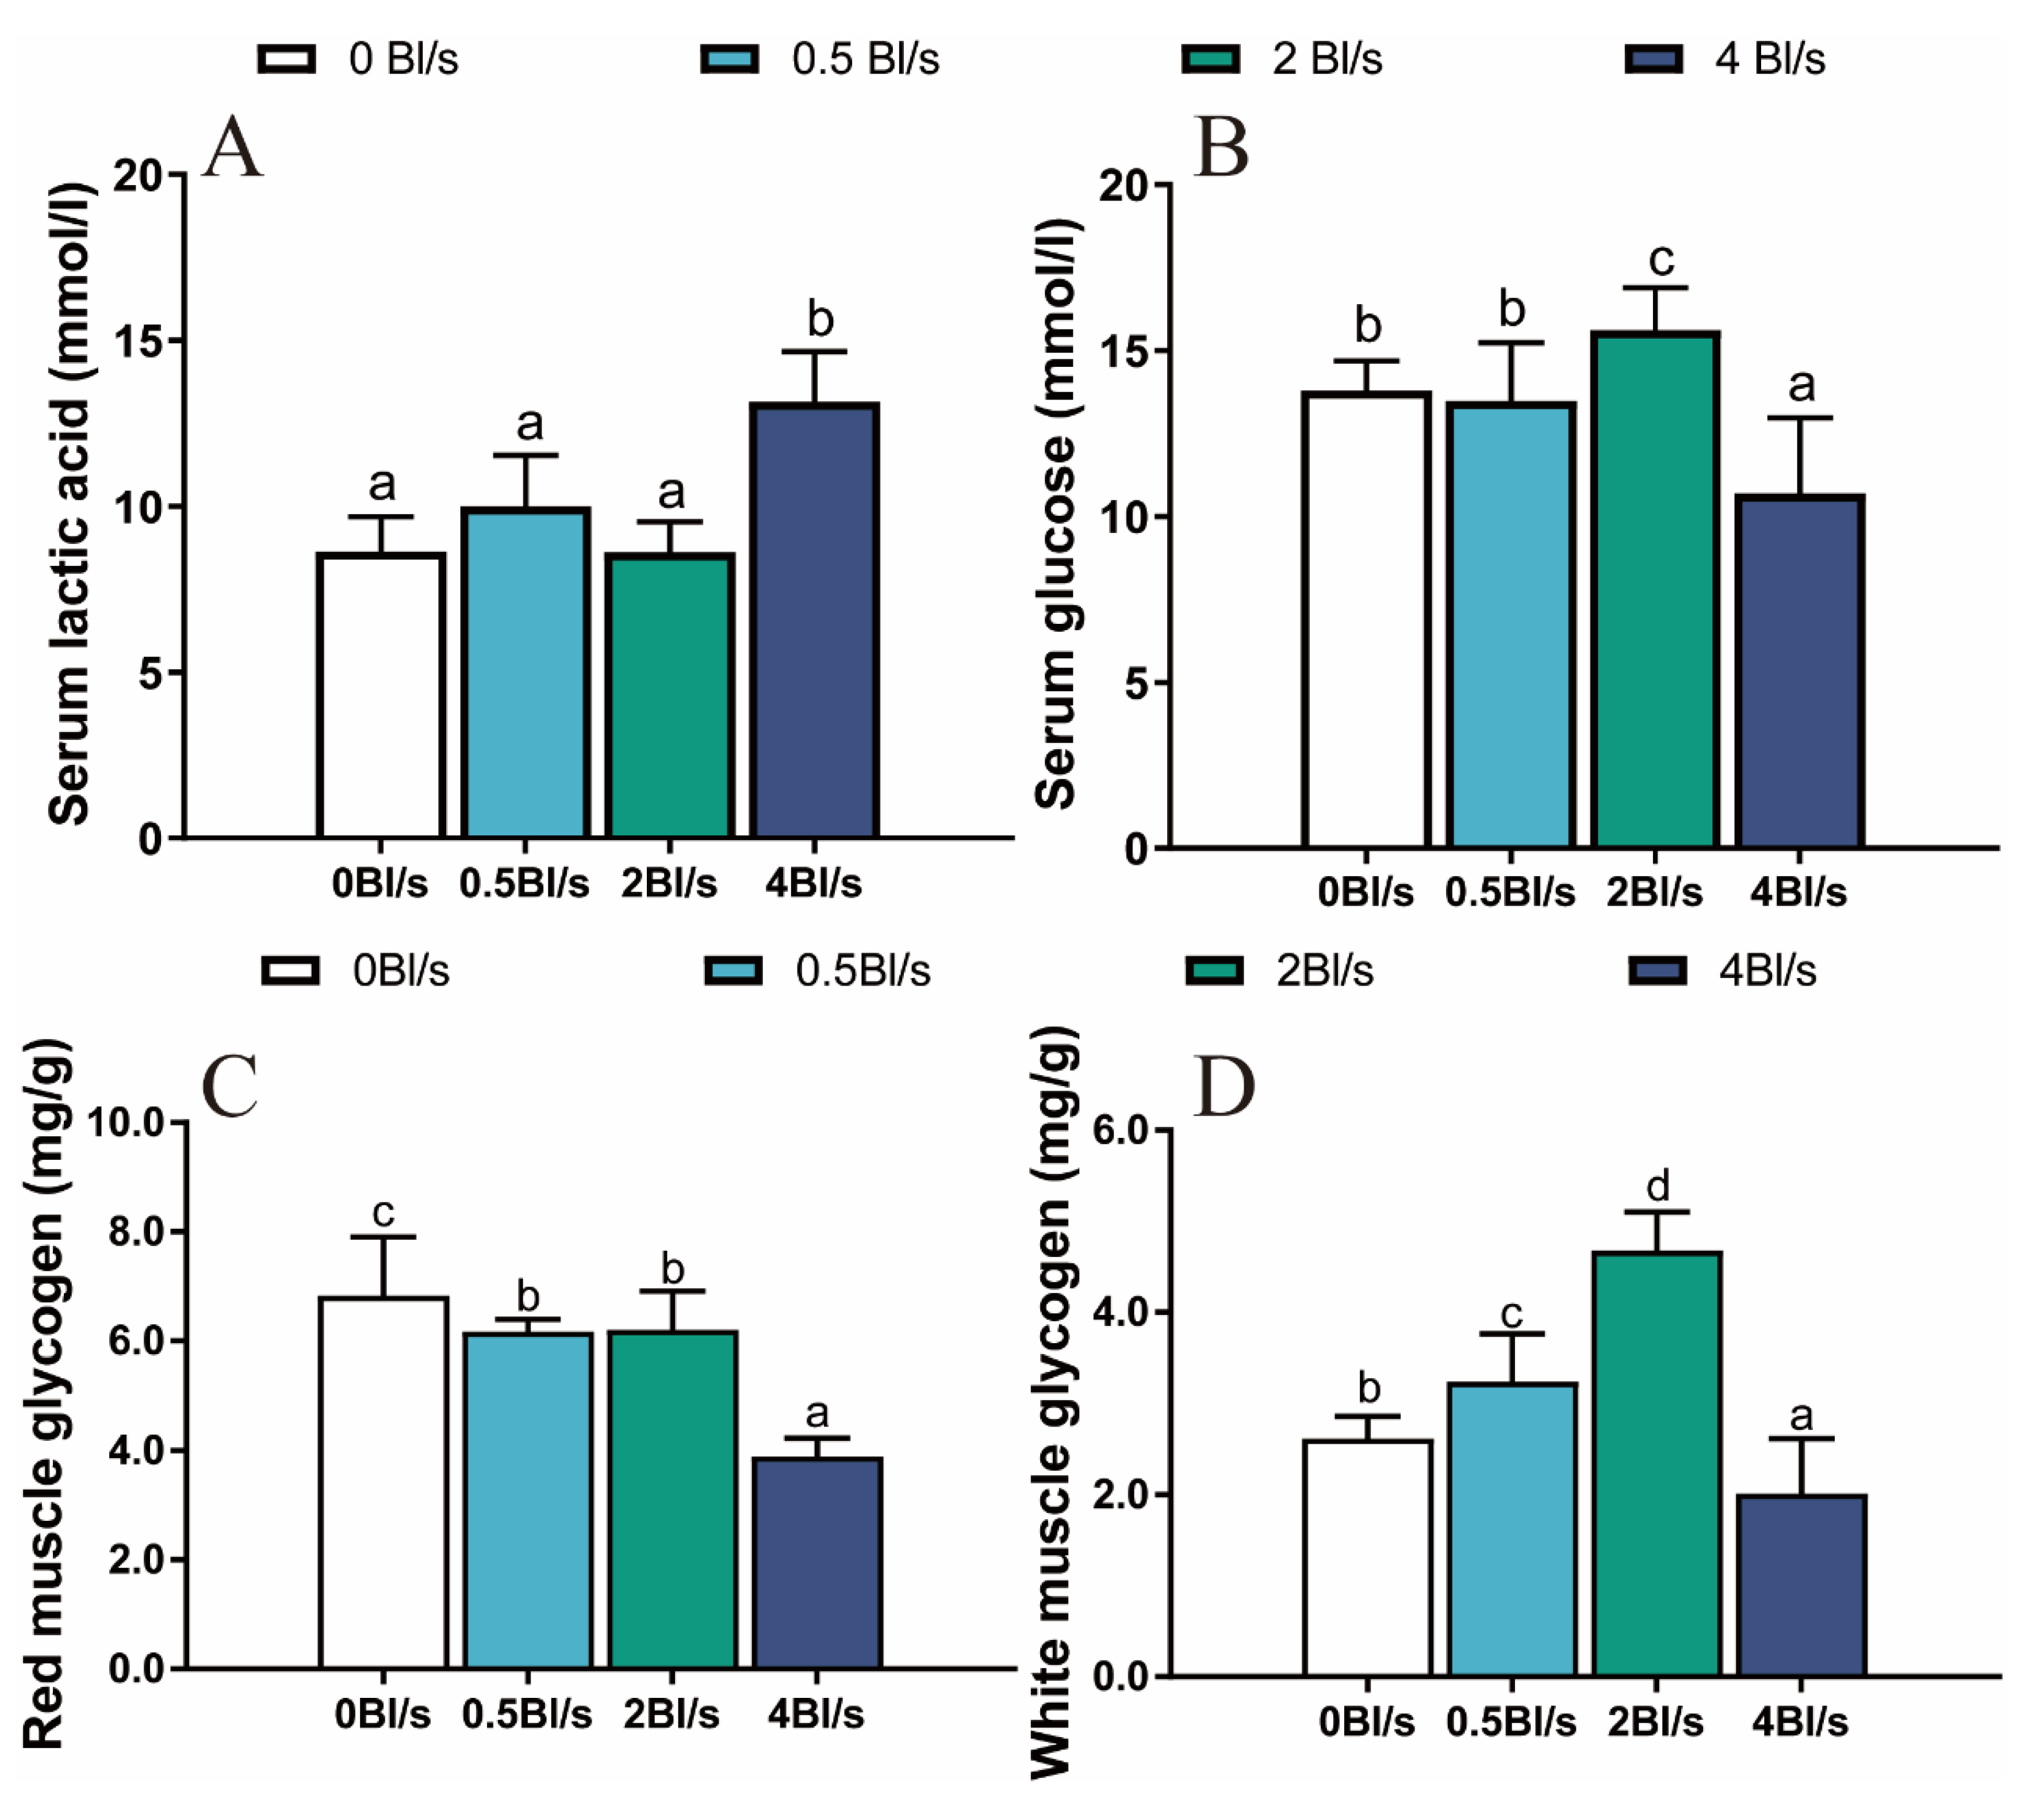
The content of LD did not significantly alter in either the 0.5 or 2 Bl s−1 group compared with the control group, while it increased in the 4 Bl s−1 group (p < 0.05) (Figure 3A). Serum GLU content increased significantly in the 2 Bl/s group, but significantly decreased in the 4 Bl/s group compared with the control group (p < 0.05) (Figure 3B). The glycogen content in red muscle was higher than that in white muscle in the same group. Compared with the control group, the contents of red muscle glycogen decreased significantly in the training groups (p < 0.05) (Figure 3C). White muscle glycogen content increased significantly at 0.5 and 2 Bl s−1 but was significantly decreased at 4 Bl s−1 (p < 0.05) (Figure 3D).
3.4. Muscle Enzyme Activity
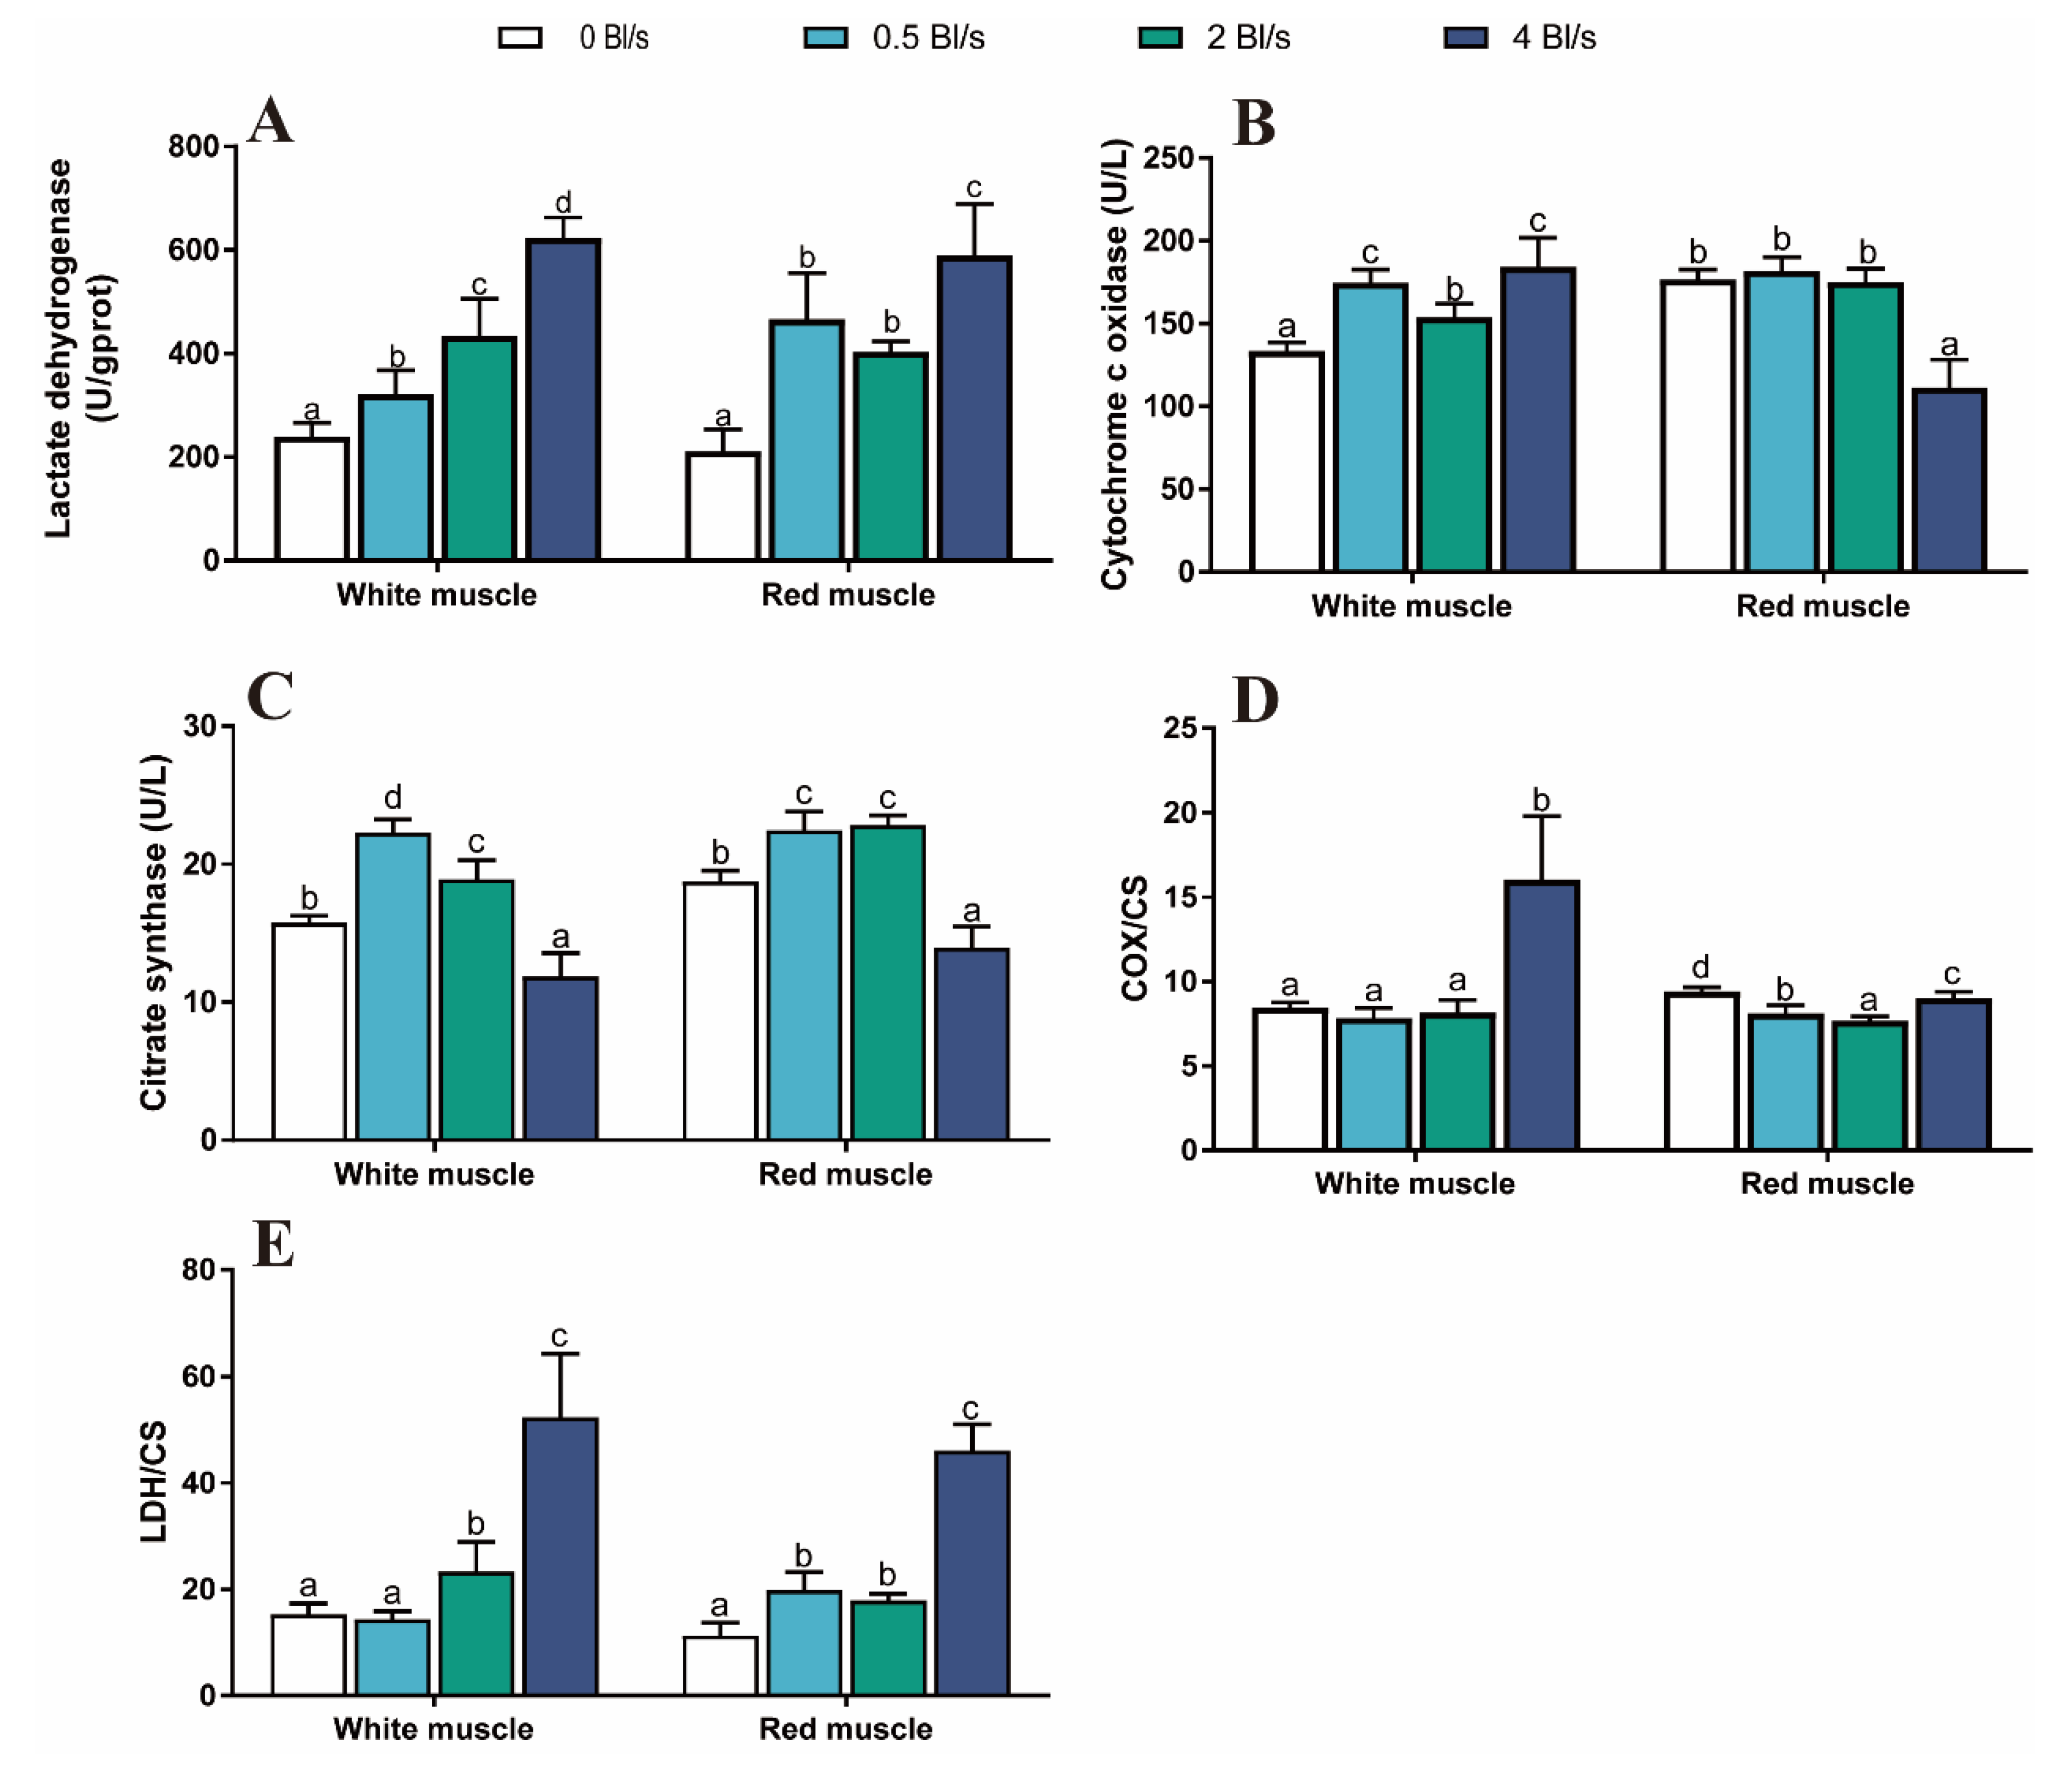
The level of LDH activity was significantly increased in the lotic environment (p < 0.05) (Figure 4A). The highest level of LDH was observed in the 4 Bl s−1 group (p < 0.05) (Figure 4A). The COX activity in white muscle increased significantly with the increasing water velocity (p < 0.05) (Figure 4B). However, the COX activity in red muscle reduced significantly in the 4 Bl s−1 group (p < 0.05) (Figure 4B). Compared to the control group, the highest level of CS activity occurred in the 0.5 Bl s−1 group, and the lowest level was found in the 4 Bl s−1 group (p < 0.05) (Figure 4C). This trend was also found in red muscle (Figure 4C). The ratios of COX/CS and LDH/CS in the white muscle of the 4 Bl s−1 group were significantly higher than those of the control group (p < 0.05) (Figure 4D,E). In the red muscle, the COX/CS ratio significantly decreased in the 4 Bl s−1 group (p < 0.05) (Figure 4D).
3.5. AMPK-PGC-1α Signaling Pathway Gene Expression
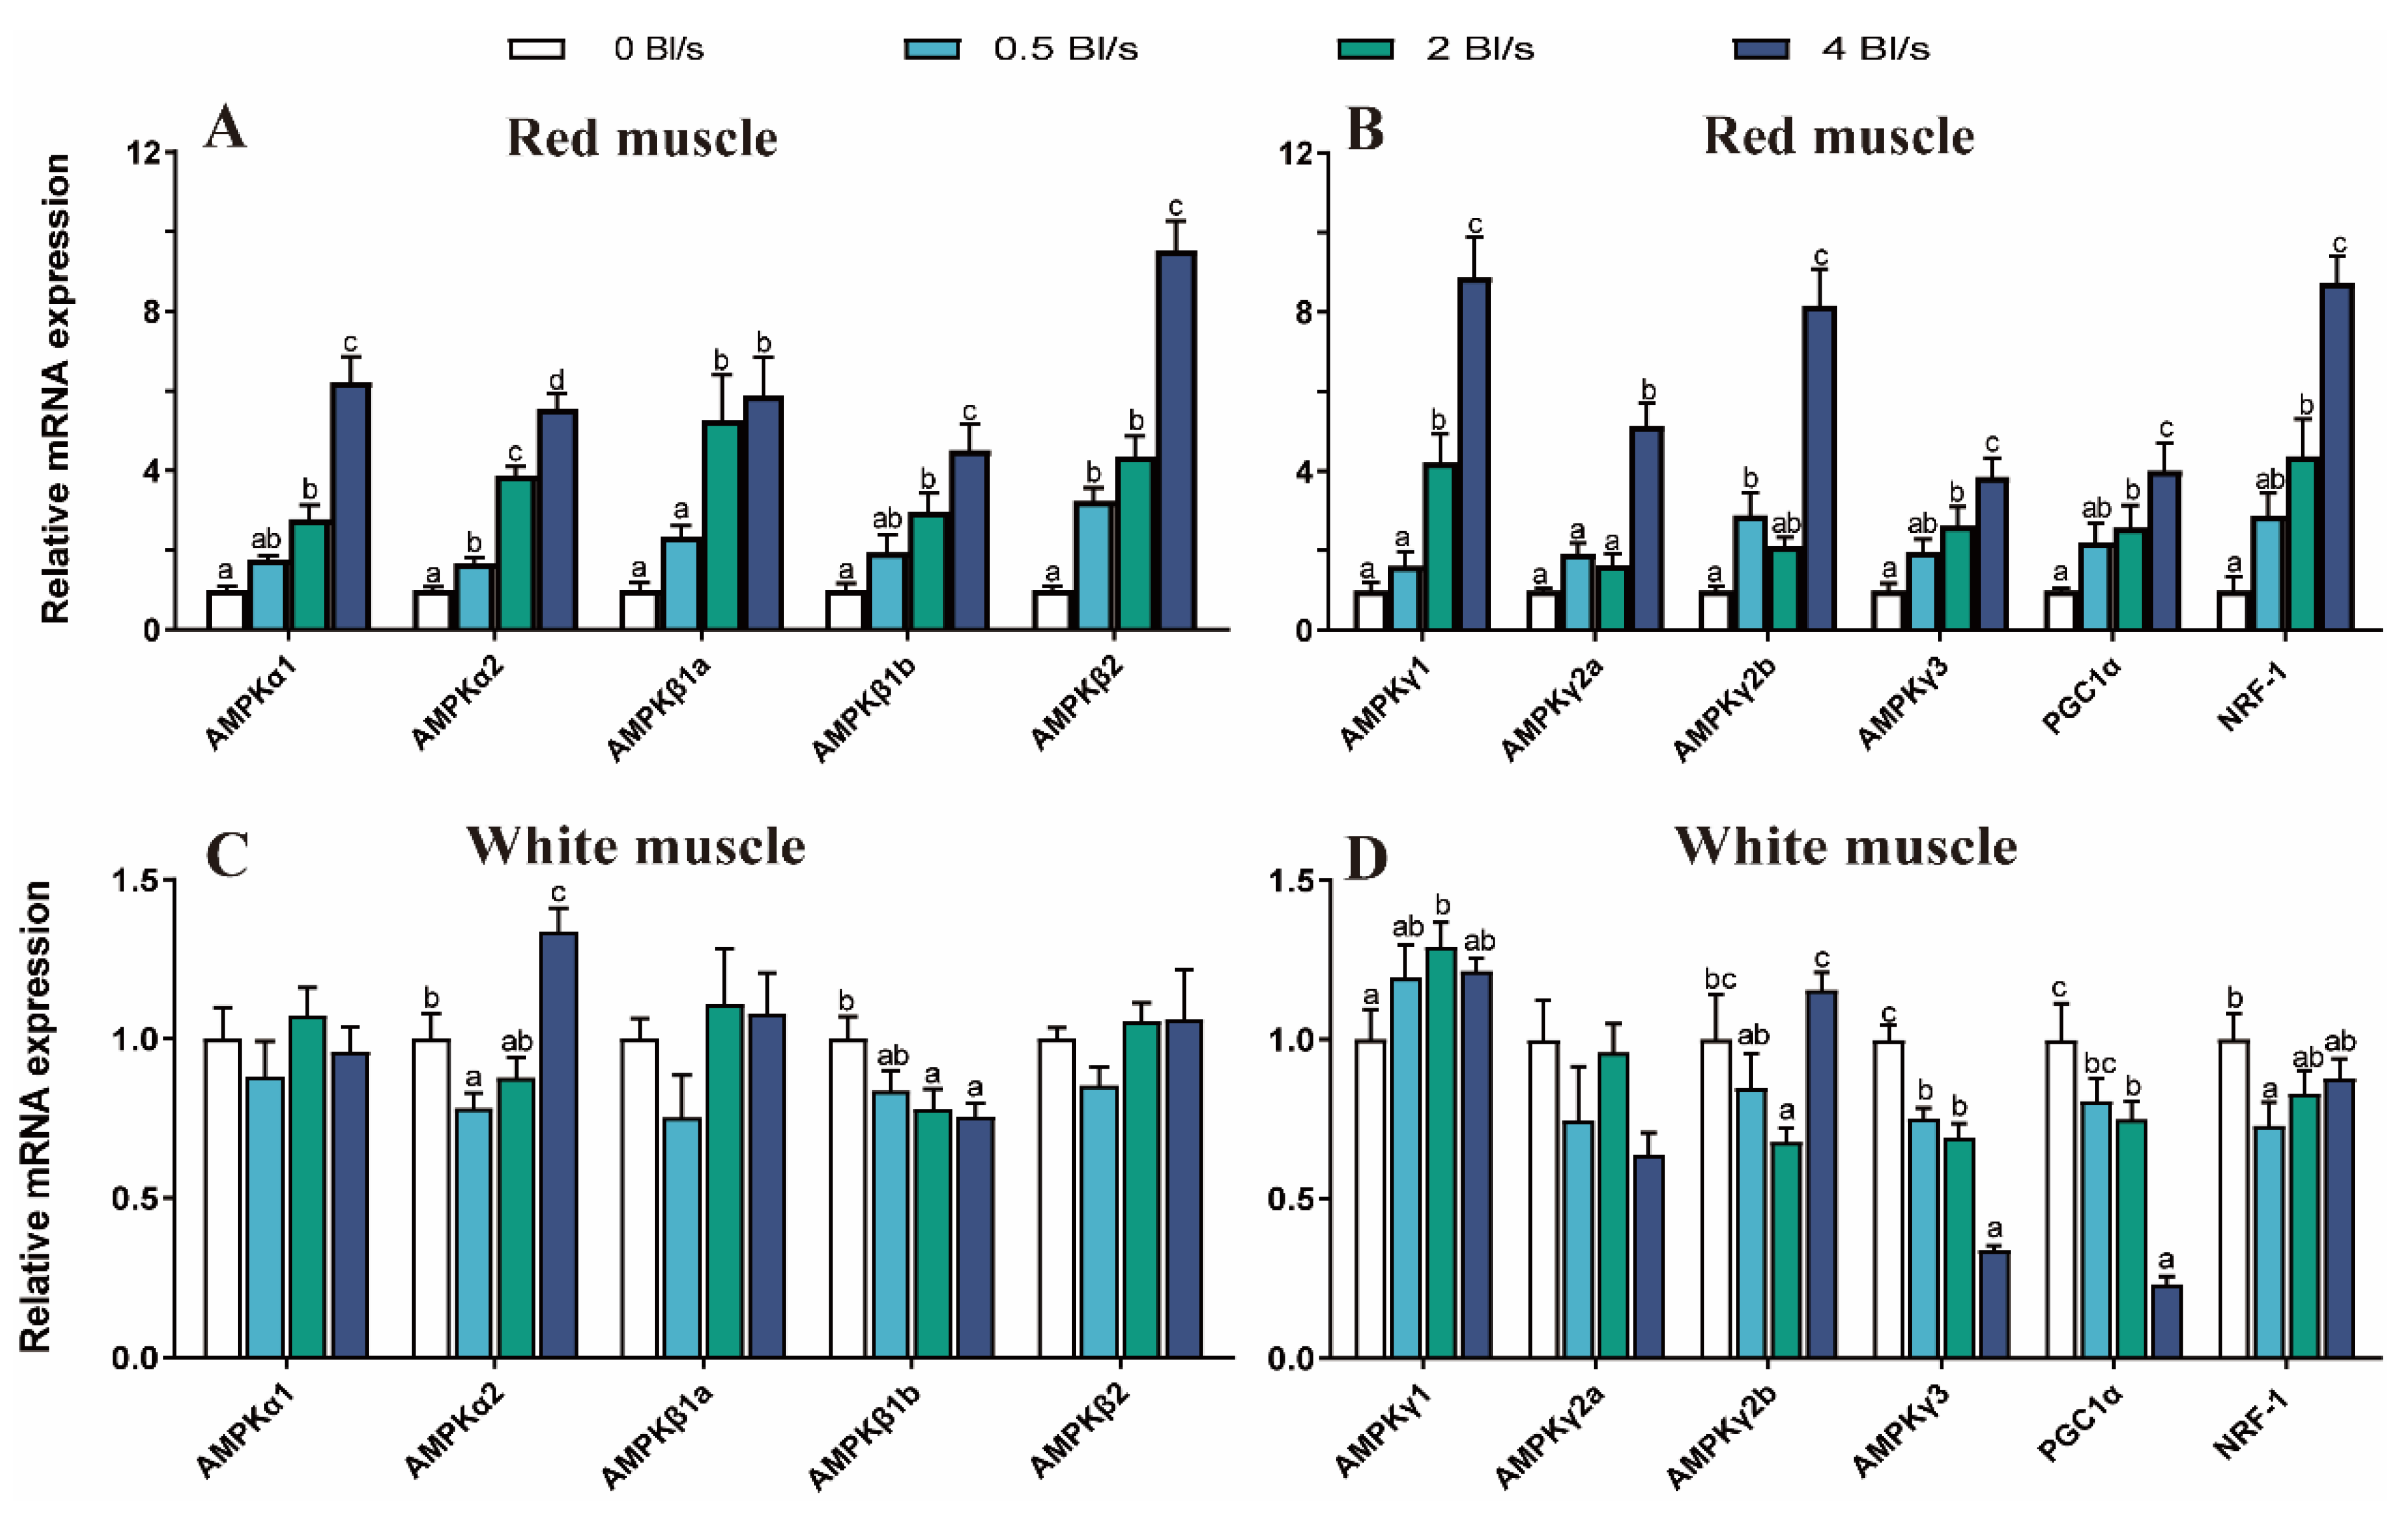
The gene expressions of AMPK family, PGC-1α, and NRF-1 were significantly upregulated in the exercise training groups compared with the control (p < 0.05) (Figure 5A,B). In the white muscle, gene expression of AMPKα2 was significantly upregulated in the 4 Bl s−1 group compared with the control (p < 0.05) (Figure 5C). In the swimming training groups, AMPKβ1b, PGC-1α, and NRF-1 mRNA levels significantly decreased with exercise training compared to the control group (p < 0.05) (Figure 5C,D). The mRNA expression level of AMPKγ1 was increased in the lotic environment, and the expression in the 2 Bl s−1 group was significantly upregulated (p < 0.05) (Figure 5C). The AMPKγ2b mRNA expression level of the 2 Bl s−1 group was significantly lower than the control group (p < 0.05) (Figure 5C). There was no significant difference in AMPKα1, AMPKβ1a, AMPKβ2, and AMPKγ2a mRNA expression levels among groups (p > 0.05) (Figure 5C,D).
4. Discussion
The water current in the lotic environment forced grass carp to swim at the speed of the water velocity. Fish growth performance, metabolic rate, morphological and biochemical characteristics were changed by the lotic environment. Phenotypic plasticity of skeletal muscle is an indispensable part of the fish physiological response to swimming exercise [22]. In this study, the alterations in body weight, body length, and conditional factor appeared to be water velocity dependent. It is inferred that appropriate water velocity could stimulate the growth of grass carp. Body size is the main determinant of life history of animals, such as competitiveness, reproduction, and survival rate [32]. The principal component analysis showed that PC1 was mainly related to head height, fin length, and caudal peduncle depth, which were positively correlated with Ucrit of grass carp. A previous study reported that deeper body shape increased hydrodynamic drag in fish during swimming [33,34]. This study found that the overall height was significantly increased, and the Ucrit was also significantly increased in the lotic environment of grass carp. Other studies concluded that the deeper body shape of fish did not lead to decreases in locomotor performance [35]. When environmental conditions change, organisms are inclined to produce corresponding changes to maintain homeostasis [36]. Sustained water velocity seems to cause a trade-off in the morphology and metabolism of grass carp. “Trade-off” is understood as the balance between performance and adaptation when the organism is faced with two competing demands that cannot be simultaneously satisfied [37]. Exercise training reduced SMR, which reduced energy expenditure and expanded aerobic scope. By contrast, other studies have found that swimming training significantly increased the metabolic capacity of fish [38,39,40]. These studies showed that different species of fish have different energy metabolic varieties. In this study, water velocity significantly increased SMR and MMR of grass carp, indicating that metabolic rate plasticity of grass carp includes an increase in oxygen consumption rate and metabolic capacity to adapt to the lotic environment [41,42]. An analysis of body shape and metabolism showed that PC1 had a significantly positive correlation with the metabolic capacity of grass carp. These findings suggested that water velocity significantly affected fish morphological characteristics and yielded a trade-off between body size and energy metabolism. Thus, the fish muscle would possess higher energy metabolism ability to overcome the increasing hydrodynamical drag.
The content of glucose and glycogen were significantly decreased in the 4 Bl s−1 group, indicating consumption of carbohydrate reserves. In addition, the lactic acid content was also increased significantly in the 4 Bl s−1 group, suggesting that 4 Bl s−1 water speed increased the anaerobic exercise of grass carp. It is implied that higher intensity water speed caused more energy costs. This finding is in line with previous studies [43]. Glycogen is considered a storage form of energy and is related to swimming in fish [44]. The level of glycogen content in red muscle was higher than that in the white muscle of grass carp in the same water velocity training group. Consequently, red muscle provided much more energy in exercised grass carp. On this basis, we concluded that grass carp was involved in anaerobic metabolism at a water velocity of 4 Bl s−1.
AMPK has a direct role in regulating mitochondrial biosynthesis, muscle fiber formation, and endurance adaptability during long-term training [45,46]. In the present study, mRNA expression of AMPK-PGC-1α-NRF-1 signaling pathway genes were significantly upregulated in red muscle. Furthermore, the expression of the AMPK family genes (AMPKα1, β1a, β2, γ2a) in white muscle were not significantly altered. The results showed that the responses of the AMPK pathway were fiber and training-intensity dependent, and in line with those of previous studies [47,48]. Moreover, lotic environment significantly upregulated AMPKα2 mRNA in the 4 Bl s−1 group. Fish AMPKα2 isoform is involved in appetite regulation and is highly expressed in muscles [49,50]. As mentioned earlier, the 4 Bl s−1 intensity water velocity increased the energy expenditure of grass carp. Previous studies found that exercise training produced higher appetite and food intake in fish [51]. PGC-1α is the main one stimulating the energy metabolism in fish and plays an important role in various energy metabolism processes [22,52]. Exercise training improves mitochondrial biogenesis in muscles through PGC-1α. In the present study, mRNA expression of PGC-1α was significantly decreased in white muscle at 2 and 4 Bl s−1 training groups, but significantly increased in red muscle at training groups. Studies suggested that the AMPK pathway was significantly increased at low temperature in Olive flounder (Para ichthys olivaceous), revealing its involvement in energy regulation [23]. Based on these finding, we speculated that the mRNAs of genes involved in mitochondrial functioning were more regulated in the red muscle than in the white muscle, and exercise training promoted energy metabolism in grass carp by increasing the AMPK pathway gene expression.
Mitochondria produce ATP through the process of aerobic respiration, involving the citric acid cycle, which can be adjusted in response to physiological stress [53,54]. In that respect, the CS enzyme involved in the citric acid cycle, is considered as a mitochondrial biogenesis marker. For energy metabolism, lactate dehydrogenase (LDH) and cytochrome c oxidase (COX) are important enzymes of anaerobic and aerobic metabolism, respectively. The levels of CS and COX were significantly increased after 0.5 and 2 Bl s−1 water velocities, indicating that higher aerobic metabolism was induced in grass carp. This finding was also reported by McClelland [55]. The CS content was observed to be decreased in muscle of exercise-trained salmonids (1.5 Bl s−1 for 4 weeks) [22], which indicated a complex and contradictory mechanism. Moreover, the COX activity was significantly increased in brown trout (Salmo trutta) treated with 1 Bl s−1 water velocity but was significantly decreased in 2 Bl s−1 water velocity exercised brown trout [56]. In the present study, high intensity water velocity (4 Bl s−1) significantly decreased the levels of CS and COX in red muscle, in agreement with the report by Blasco [57]. Moreover, in the present study, high intensity water velocity significantly increased the COX/CS ratio in white muscle. This indicated that the metabolic signatures of grass carp change under a lotic environment. In that regard, the LDH/CS ratio was significantly increased in the 4 Bl s−1 training group, which indicates that 4 Bl s−1 water velocity treatment resulted in significantly enhanced anaerobic phenotype in grass carp to adapt to a high-intensity lotic environment. This observation may indicate that the mitochondria respiratory chain and tricarboxylic acid cycle (TCA) adapted the muscle metabolic flux towards to anaerobic metabolism from aerobic metabolism with the energy demand of the fish [58]. The findings of this study suggest that 4 Bl s−1 intensity water velocity performed more anaerobic metabolism than that at 0, 0.5, 2 Bl s−1 water speeds, and mitochondria of grass carp at 4 Bl s−1 water velocity functionally adapted their energy consumption for swimming.
5. Conclusions
This study was designed to determine the mechanism of adaptability of a lotic environment on morphological and energy metabolism of grass carp. There was a trade-off between morphological characteristics and metabolic rate of grass carp in the lotic environment. The grass carp was involved in anaerobic metabolism at 4 Bl s−1 and stimulated the transcriptional response of the AMPK pathway more in the red muscle. Water velocity of different intensities engendered different alterations in energy metabolism of grass carp. The juvenile grass carp could adapt to the lotic environment and enhance growth through energy metabolism and morphological changes. Based on the results, a water velocity of no more than 2 Bl s−1 is recommended to apply to grass carp culture for better growth performance.
Author Contributions
Conceptualization, D.L. and P.Z.; methodology, P.Z.; software, J.L.; validation, P.Z. and Y.W.; formal analysis, P.Z.; investigation, P.Z. and J.L.; resources, D.L.; data curation, P.Z.; writing—original draft preparation, P.Z.; writing—review and editing, D.L; visualization, Y.W.; supervision, D.L.; project administration, D.L.; funding acquisition, D.L. All authors have read and agreed to the published version of the manuscript.
Funding
This research was funded by the National Key Research and Development Program of China (2019YFD0900303), China Agriculture Research System of MOF and MARA (CARS-45-24), and the National Natural Science Foundation of China (31502140).
Institutional Review Board Statement
The animal study protocol was approved by Animal Experimental Ethical Inspection of Laboratory Animal Centre, Huazhong Agriculture University (ID number: HZAUFI-2020-0013).
Informed Consent Statement
Not applicable.
Data Availability Statement
Data is contained within the article.
Conflicts of Interest
The authors declare no conflict of interest.
Appendix A
Appendix A.1. Differences in Morphological Characteristics

Table A1.
Comparison of various indicators of grass carp in the lotic environment.
| Character | Water Velocity | |||
|---|---|---|---|---|
| 0 Bl/s | 0.5 Bl/s | 2 Bl/s | 4 Bl/s | |
| 1–2/body length | 23.82 ± 1.50 | 23.69 ± 1.11 | 23.38 ± 1.13 | 23.90 ± 1.16 |
| 1–3/body length | 20.58 ± 0.97 | 19.95 ± 1.48 | 20.36 ± 1.21 | 19.90 ± 1.14 |
| 1–4/body length | 25.47 ± 1.40 | 24.90 ± 1.09 | 25.07 ± 0.99 | 25.13 ± 1.12 |
| 1–16/body length | 109.35 ± 1.09 b | 108.53 ± 0.88 ab | 108.46 ± 1.43 a | 107.75 ± 1.57 a |
| 1–17/body length | 117.89 ± 1.59 | 117.49 ± 1.50 | 116.91 ± 1.76 | 117.15 ± 2.42 |
| 1–18/body length | 120.01 ± 1.79 b | 119.77 ± 1.54 b | 118.91 ± 1.22 ab | 117.90 ± 2.30 a |
| 2–3/body length | 18.94 ± 0.68 a | 19.33 ± 1.02 a | 19.10 ± 0.93 a | 20.06 ± 0.90 b |
| 2–7/body length | 32.62 ± 2.49 | 32.60 ± 1.38 | 32.75 ± 1.85 | 32.31 ± 1.92 |
| 5–6/body length | 15.32 ± 1.84 a | 16.21 ± 1.08 ab | 16.98 ± 1.49 b c | 17.81 ± 1.00 c |
| 7–8/body length | 20.93 ± 1.94 ab | 19.53 ± 2.24 a | 20.62 ± 2.18 ab | 21.54 ± 1.89 b |
| 7–9/body length | 23.22 ± 0.87 a | 24.45 ± 1.52 b | 24.72 ± 1.44 b | 26.52 ± 2.16 c |
| 10–11/body length | 10.92 ± 1.15 a | 11.09 ± 1.37 a | 11.72 ± 1.29 ab | 12.44 ± 1.28 b |
| 12–13/body length | 15.94 ± 2.40 b | 14.21 ± 1.60 a | 14.75 ± 1.73 ab | 15.18 ± 1.65 ab |
| 14–22/body length | 12.48 ± 1.59 | 11.36 ± 2.01 | 12.03 ± 1.54 | 12.12 ± 1.48 |
| 17–18/body length | 17.30 ± 4.22 a | 20.48 ± 3.48 b | 18.56 ± 5.36 ab | 19.73 ± 3.81 ab |
| 17–21/body length | 21.49 ± 1.64 | 22.15 ± 1.37 | 22.07 ± 1.39 | 22.13 ± 1.98 |
| 18–22/body length | 23.25 ± 1.42 ab | 23.47 ± 1.23 b | 22.93 ± 1.30 ab | 22.48 ± 1.48 a |
| 19–20/body length | 10.25 ± 0.55 a | 11.20 ± 0.81 b | 11.00 ± 0.64 b | 11.40 ± 0.96 b |
| 19–21/body length | 32.87 ± 2.40 a | 33.56 ± 2.19 a | 32.28 ± 2.65 a | 35.34 ± 1.75 b |
Different superscripts show statistical significance between groups (p < 0.05).
Appendix A.2. Principal Component Analysis
Table A2.
Principal component analysis of grass carp in the lotic environment.
| Morphometric Characteristics | Principal Component 1 | Principal Component 2 | Principal Component 3 | Principal Component 4 | Principal Component 5 | Principal Component 6 |
|---|---|---|---|---|---|---|
| 1–2/body length % | 0.126 | −0.066 | 0.835 | −0.023 | 0.196 | −0.077 |
| 1–3/body length % | −0.229 | −0.077 | 0.714 | 0.011 | −0.197 | −0.042 |
| 1–4/body length % | −0.035 | −0.130 | 0.904 | 0.101 | 0.067 | 0.093 |
| 1–16/body length % | −0.178 | 0.270 | 0.007 | 0.724 | −0.091 | −0.004 |
| 1–17/body length % | −0.055 | 0.220 | 0.035 | 0.755 | 0.024 | −0.046 |
| 1–18/body length % | −0.179 | 0.774 | 0.017 | 0.367 | −0.007 | −0.144 |
| 2–3/body length % | 0.616 | −0.070 | 0.323 | −0.364 | 0.022 | 0.045 |
| 2–7/body length % | 0.035 | −0.032 | −0.088 | 0.424 | −0.003 | −0.778 |
| 5–6/body length % | 0.832 | −0.026 | −0.051 | 0.177 | −0.043 | 0.018 |
| 7–8/body length % | 0.108 | 0.075 | −0.091 | 0.279 | 0.182 | 0.757 |
| 7–9/body length % | 0.843 | −0.119 | −0.054 | −0.214 | 0.095 | −0.007 |
| 10–11/body length % | 0.334 | 0.002 | −0.057 | 0.236 | 0.587 | 0.070 |
| 12–13/body length % | −0.425 | 0.244 | 0.111 | −0.147 | 0.580 | −0.117 |
| 14–22/body length % | −0.323 | −0.013 | −0.068 | 0.026 | 0.543 | 0.310 |
| 17–18/body length % | 0.252 | 0.456 | −0.247 | −0.508 | 0.028 | −0.257 |
| 17–21/body length % | 0.014 | 0.821 | −0.146 | 0.058 | 0.153 | 0.104 |
| 18–22/body length % | −0.065 | 0.851 | −0.123 | 0.162 | −0.155 | 0.139 |
| 19–20/body length % | 0.747 | 0.058 | −0.196 | −0.334 | 0.088 | −0.006 |
| 19–21/body length % | 0.164 | −0.078 | 0.093 | −0.151 | 0.651 | 0.040 |
| Characteristic value | 2.981 | 2.449 | 2.318 | 2.208 | 1.591 | 1.433 |
| Contribution rate | 15.687545 | 12.88992 | 12.19804 | 11.61951 | 8.373102 | 7.541147 |
| Cumulative Contribution rate | 15.687545 | 28.57747 | 40.7755 | 52.39501 | 60.76812 | 68.30926 |
Appendix A.3. Aerobic Swimming Performance and Morphological Characteristics
Table A3.
Linear regressions of PC by measurements of aerobic swimming performance of grass carp in the lotic environment.
Table A3.
Linear regressions of PC by measurements of aerobic swimming performance of grass carp in the lotic environment.
| Parameter | Principal Component | R2 | p | Df | F |
|---|---|---|---|---|---|
| Ucrit | PC1 | 0.2137 | 0.0009 | 1.000, 46.00 | 12.5 |
| PC2 | 0.002314 | 0.7454 | 1.000, 46.00 | 0.1067 | |
| PC3 | 0.00704 | 0.5707 | 1.000, 46.00 | 0.3261 | |
| PC4 | 0.05543 | 0.1072 | 1.000, 46.00 | 2.7 | |
| PC5 | 0.06287 | 0.0856 | 1.000, 46.00 | 3.086 | |
| PC6 | 0.02617 | 0.2720 | 1.000, 46.0 | 1.236 |
References
- Li, X.; Zhang, Y.; Li, X.; Zheng, H.; Peng, J.; Fu, S. Sustained Exercise-Trained Juvenile Black Carp (Mylopharyngodon piceus) at a Moderate Water Velocity Exhibit Improved Aerobic Swimming Performance and Increased Postprandial Metabolic Responses. Biol. Open 2018, 7, bio032425. [Google Scholar] [CrossRef] [PubMed] [Green Version]
- Yogata, H.; Oku, H. The Effects of Swimming Exercise on Growth and Whole-Body Protein and Fat Contents of Fed and Unfed Fingerling Yellowtail. Fish. Sci. 2000, 66, 1100–1105. [Google Scholar] [CrossRef] [Green Version]
- Gallaugher, P.E.; Thorarensen, H.; Kiessling, A.; Farrell, A.P. Effects of High Intensity Exercise Training on Cardiovascular Function, Oxygen Uptake, Internal Oxygen Transport and Osmotic Balance in Chinook Salmon (Oncorhynchus tshawytscha) during Critical Speed Swimming. J. Exp. Biol. 2001, 204, 2861–2872. [Google Scholar] [CrossRef] [PubMed]
- Martin, C.I.; Johnston, I.A. The Role of Myostatin and the Calcineurin-Signalling Pathway in Regulating Muscle Mass in Response to Exercise Training in the Rainbow Trout Oncorhynchus mykiss Walbaum. J. Exp. Biol. 2005, 208, 2083–2090. [Google Scholar] [CrossRef] [Green Version]
- Davison, W. The Effects of Exercise Training on Teleost Fish, a Review of Recent Literature. Comp. Biochem. Physiol. Part A Physiol. 1997, 117, 67–75. [Google Scholar] [CrossRef]
- Plaut, I. Critical Swimming Speed: Its Ecological Relevance. Comp. Biochem. Physiol. Part A Mol. Integr. Physiol. 2001, 131, 41–50. [Google Scholar] [CrossRef]
- Ohlberger, J.; Staaks, G.; Hölker, F. Swimming Efficiency and the Influence of Morphology on Swimming Costs in Fishes. J. Comp. Physiol. B Biochem. Syst. Environ. Physiol. 2006, 176, 17–25. [Google Scholar] [CrossRef]
- Binning, S.A.; Roche, D.G.; Fulton, C.J. Localised Intraspecific Variation in the Swimming Phenotype of a Coral Reef Fish across Different Wave Exposures. Oecologia 2014, 174, 623–630. [Google Scholar] [CrossRef]
- Nelson, J.A.; Atzori, F.; Gastrich, K.R. Repeatability and Phenotypic Plasticity of Fish Swimming Performance across a Gradient of Urbanization. Environ. Biol. Fishes 2015, 98, 1431–1447. [Google Scholar] [CrossRef]
- Killen, S.S.; Atkinson, D.; Glazier, D.S. The Intraspecific Scaling of Metabolic Rate with Body Mass in Fishes Depends on Lifestyle and Temperature. Ecol. Lett. 2010, 13, 184–193. [Google Scholar] [CrossRef]
- Auer, S.K.; Salin, K.; Rudolf, A.M.; Anderson, G.J.; Metcalfe, N.B. The Optimal Combination of Standard Metabolic Rate and Aerobic Scope for Somatic Growth Depends on Food Availability. Funct. Ecol. 2015, 29, 479–486. [Google Scholar] [CrossRef]
- Castro, V.; Grisdale-Helland, B.; Jørgensen, S.M.; Helgerud, J.; Claireaux, G.; Farrell, A.P.; Krasnov, A.; Helland, S.J.; Takle, H. Disease Resistance Is Related to Inherent Swimming Performance in Atlantic Salmon. BMC Physiol. 2013, 13, 1–12. [Google Scholar] [CrossRef] [PubMed] [Green Version]
- Khan, J.R.; Trembath, C.; Pether, S.; Bruce, M.; Walker, S.P.; Herbert, N.A. Accommodating the Cost of Growth and Swim Ming in Fish—The Applicability of Exercise-Induced Growth to Juvenile Hapuku (Polyprion oxygeneios). Front. Physiol. 2014, 5, 448. [Google Scholar] [CrossRef] [PubMed] [Green Version]
- Matsuzaki, S.S.; Mabuchi, K.; Takamura, N.; Nishida, M.; Washitani, I. Behavioural and Morphological Differences between Feral and Domesticated Strains of Common Carp Cyprinus carpio. J. Fish Biol. 2009, 75, 1206–1220. [Google Scholar] [CrossRef]
- Killen, S.S.; Marras, S.; Metcalfe, N.B.; McKenzie, D.J.; Domenici, P. Environmental Stressors Alter Relationships between Physiology and Behaviour. Trends Ecol. Evol. 2013, 28, 651–658. [Google Scholar] [CrossRef]
- Rosenfeld, J.; Richards, J.; Allen, D.; Van Leeuwen, T.; Monnet, G. Adaptive Trade-Offs in Fish Energetics and Physiology: Insights from Adaptive Differentiation among Juvenile Salmonids. Can. J. Fish. Aquat. Sci. 2020, 77, 1243–1255. [Google Scholar] [CrossRef]
- Weber, J.M.; Choi, K.; Gonzalez, A.; Omlin, T. Metabolic Fuel Kinetics in Fish: Swimming, Hypoxia and Muscle Membranes. J. Exp. Biol. 2016, 219, 250–258. [Google Scholar] [CrossRef] [Green Version]
- Ross, F.A.; MacKintosh, C.; Hardie, D.G. AMP-Activated Protein Kinase: A Cellular Energy Sensor That Comes in 12 Flavours. FEBS J. 2016, 283, 2987–3001. [Google Scholar] [CrossRef]
- Magnoni, L.J.; Vraskou, Y.; Palstra, A.P.; Planas, J.V. AMP-Activated Protein Kinase Plays an Important Evolutionary Conserved Role in the Regulation of Glucose Metabolism in Fish Skeletal Muscle Cells. PLoS ONE 2012, 7, e31219. [Google Scholar] [CrossRef] [Green Version]
- McClelland, G.B. Muscle Remodeling and the Exercise Physiology of Fish. Exerc. Sport Sci. Rev. 2012, 40, 165–173. [Google Scholar] [CrossRef]
- Jibb, L.A.; Richards, J.G. AMP-Activated Protein Kinase Activity during Metabolic Rate Depression in the Hypoxic Goldfish, Carassius Auratus. J. Exp. Biol. 2008, 211, 3111–3122. [Google Scholar] [CrossRef] [PubMed] [Green Version]
- Morash, A.J.; Vanderveken, M.; McClelland, G.B. Muscle Metabolic Remodeling in Response to Endurance Exercise in Salmonids. Front. Physiol. 2014, 5, 452. [Google Scholar] [CrossRef] [PubMed] [Green Version]
- Lu, Y.; Nie, M.; Wang, L.; Xiong, Y.; Wang, F.; Wang, L.; Xiao, P.; Wu, Z.; Liu, Y.; You, F. Energy Response and Modulation of AMPK Pathway of the Olive Flounder Paralichthys Olivaceus in Low-Temperature Challenged. Aquaculture 2018, 484, 205–213. [Google Scholar] [CrossRef]
- Zhang, L.; Xu, N.; Liu, X.; Onxayvieng, K.; Liu, L.; Tang, R.; Li, D. Exercise Training Accelerates UPS- and MTOR-Mediated Protein Turnover of Grass Carp Ctenopharyngodon idella. Aquaculture 2021, 545, 737252. [Google Scholar] [CrossRef]
- Lu, Y.; Wu, H.; Deng, L.-J.; Li, T.-C.; Yang, K.; Fu, S.-J.; Song, Z.-B. Improved Aerobic and Anaerobic Swimming Performance after Exercise Training and Detraining in Schizothorax Wangchiachii: Implications for Fisheries Releases. Comp. Biochem. Physiol. Part A Mol. Integr. Physiol. 2020, 245, 110698. [Google Scholar] [CrossRef] [PubMed]
- Pang, X.; Shao, F.; Ding, S.H.; Fu, S.J.; Zhang, Y.G. Interspecific Differences and Ecological Correlations of Energy Metabolism Traits in Freshwater Fishes. Funct. Ecol. 2020, 34, 616–630. [Google Scholar] [CrossRef]
- Roche, D.G.; Binning, S.A.; Bosiger, Y.; Johansen, J.L.; Rummer, J.L. Finding the Best Estimates of Metabolic Rates in a Coral Reef Fish. J. Exp. Biol. 2013, 216, 2103–2110. [Google Scholar] [CrossRef] [Green Version]
- Fu, S.J.; Cao, Z.D.; Peng, J.L. Effect of Feeding and Fasting on Excess Post-Exercise Oxygen Consumption in Juvenile Southern Catfish (Silurus meridionalis Chen). Comp. Biochem. Physiol. Part A Mol. Integr. Physiol. 2007, 146, 435–439. [Google Scholar] [CrossRef]
- Qin, N.; Li, D.; Hong, H.; Zhang, Y.; Zhu, B.; Luo, Y. Effects of Different Stunning Methods on the Flesh Quality of Grass Carp (Ctenopharyngodon idellus) Fillets Stored at 4 °C. Food Chem. 2016, 201, 131–138. [Google Scholar] [CrossRef]
- Zeng, K.W.; Liao, L.X.; Zhao, M.B.; Song, F.J.; Yu, Q.; Jiang, Y.; Tu, P.F. Protosappanin B Protects PC12 Cells against Oxygen-Glucose Deprivation-Induced Neuronal Death by Maintaining Mitochondrial Homeostasis via Induction of Ubiquitin-Dependent P53 Protein Degradation. Eur. J. Pharmacol. 2015, 751, 13–23. [Google Scholar] [CrossRef]
- Liang, X.; Fang, T.; Yan, F.; Xu, W.; Onxayvieng, K.; Tang, R.; Li, L.; Zhang, X.; Chi, W.; Li, D. Glutamate and Glutamine Transporter Genes in Grass Carp (Ctenopharyngodon idellus): Molecular Cloning, Characterization and Expression in Response to Different Stocking Densities. Aquac. Res. 2020, 51, 4122–4134. [Google Scholar] [CrossRef]
- Peoples, B.K.; Midway, S.R. Fishing Pressure and Species Traits Affect Stream Fish Invasions both Directly and Indirectly. Divers. Distrib. 2018, 24, 1158–1168. [Google Scholar] [CrossRef] [Green Version]
- Domenici, P.; Turesson, H.; Brodersen, J.; Brönmark, C. Predator-Induced Morphology Enhances Escape Locomotion in Crucian Carp. Proc. R. Soc. B Biol. Sci. 2008, 275, 195–201. [Google Scholar] [CrossRef] [Green Version]
- Walker, J.A. Dynamics of Pectoral Fin Rowing in a Fish with an Extreme Rowing Stroke: The Threespine Stickleback (Gasterosteus aculeatus). J. Exp. Biol. 2004, 207, 1925–1939. [Google Scholar] [CrossRef] [PubMed] [Green Version]
- Seebacher, F.; Webster, M.M.; James, R.S.; Tallis, J.; Ward, A.J.W. Morphological Differences between Habitats Are Associated with Physiological and Behavioural Trade-Offs in Stickleback (Gasterosteus aculeatus). R. Soc. Open Sci. 2016, 3, 160316. [Google Scholar] [CrossRef] [Green Version]
- Calazans, A.M.; Martinez, P.A.; Jacobina, U.P. Lentic and Lotic Environments Affect Morphological Diversity in Characiformes Fishes in the Neotropical São Francisco River Basin, Brazil. Environ. Biol. Fishes 2021, 104, 977–987. [Google Scholar] [CrossRef]
- Roff, D.A.; Fairbairn, D.J. The Evolution of Trade-Offs: Where Are We? J. Evol. Biol. 2007, 20, 433–447. [Google Scholar] [CrossRef]
- Pettersson, L.B.; Hedenström, A. Energetics, Cost Reduction and Functional Consequences of Fish Morphology. Proc. R. Soc. B Biol. Sci. 2000, 267, 759–764. [Google Scholar] [CrossRef] [Green Version]
- Li, X.M.; Yu, L.J.; Wang, C.; Zeng, L.Q.; Cao, Z.D.; Fu, S.J.; Zhang, Y.G. The Effect of Aerobic Exercise Training on Growth Performance, Digestive Enzyme Activities and Postprandial Metabolic Response in Juvenile Qingbo (Spinibarbus sinensis). Comp. Biochem. Physiol. Part A Mol. Integr. Physiol. 2013, 166, 8–16. [Google Scholar] [CrossRef]
- Shrivastava, J.; Rašković, B.; Blust, R.; De Boeck, G. Exercise Improves Growth, Alters Physiological Performance and Gene Expression in Common Carp (Cyprinus carpio). Comp. Biochem. Physiol. Part A Mol. Integr. Physiol. 2018, 226, 38–48. [Google Scholar] [CrossRef]
- Li, X.M.; Liu, L.; Yuan, J.M.; Xiao, Y.Y.; Fu, S.J.; Zhang, Y.G. The Effect of Aerobic Exercise and Starvation on Growth Performance and Postprandial Metabolic Response in Juvenile Southern Catfish (Silurus meridionalis). Comp. Biochem. Physiol. Part A Mol. Integr. Physiol. 2016, 193, 36–44. [Google Scholar] [CrossRef] [PubMed]
- Guderley, H.; Pörtner, H.O. Metabolic Power Budgeting and Adaptive Strategies in Zoology: Examples from Scallops and Fish. Can. J. Zool. 2010, 88, 753–763. [Google Scholar] [CrossRef]
- Changes, B.; Marqueze, A.; Fagundes, M.; Rossini, M.; Variani, C.; Balbinoti, F.; Tietbo, H.; Rosemberg, D.B.; Jose, L.; Barcellos, G. Just Keep Swimming: Neuroendocrine, Metabolic, and Behavioral Changes After a Forced Swimming Test in Zebrafish. Zebrafish 2017, 14, 51–59. [Google Scholar] [CrossRef]
- Moves, C.D.; West, T.G. Exercise Metabolism of Fish. Biochem. Mol. Biol. Fishes 1995, 4, 367–392. [Google Scholar] [CrossRef]
- Parsons, S.A.; Wilkins, B.J.; Bueno, O.F.; Molkentin, J.D. Altered Skeletal Muscle Phenotypes in Calcineurin Aα and Aβ Gene-Targeted Mice. Mol. Cell. Biol. 2003, 23, 4331–4343. [Google Scholar] [CrossRef] [Green Version]
- Hardie, D.G.; Ross, F.A.; Hawley, S.A. AMPK: A Nutrient and Energy Sensor That Maintains Energy Homeostasis. Nat. Rev. Mol. Cell Biol. 2012, 13, 251–262. [Google Scholar] [CrossRef] [Green Version]
- Pengam, M.; Amérand, A.; Simon, B.; Guernec, A.; Inizan, M.; Moisan, C. How Do Exercise Training Variables Stimulate Processes Related to Mitochondrial Biogenesis in Slow and Fast Trout Muscle Fibres? Exp. Physiol. 2021, 106, 938–957. [Google Scholar] [CrossRef]
- Pengam, M.; Moisan, C.; Simon, B.; Guernec, A.; Inizan, M.; Amérand, A. Training Protocols Differently Affect AMPK–PGC-1α Signaling Pathway and Redox State in Trout Muscle. Comp. Biochem. Physiol. Part A Mol. Integr. Physiol. 2020, 243, 110673. [Google Scholar] [CrossRef]
- Craig, P.M.; Moyes, C.D.; LeMoine, C.M.R. Sensing and Responding to Energetic Stress: Evolution of the AMPK Network. Comp. Biochem. Physiol. Part B Biochem. Mol. Biol. 2018, 224, 156–169. [Google Scholar] [CrossRef]
- Conde-Sieira, M.; Capelli, V.; Álvarez-Otero, R.; Comesaña, S.; Liñares-Pose, L.; Velasco, C.; López, M.; Soengas, J.L. Differential Role of Hypothalamic AMPKα Isoforms in Fish: An Evolutive Perspective. Mol. Neurobiol. 2019, 56, 5051–5066. [Google Scholar] [CrossRef]
- Liu, G.; Wu, Y.; Qin, X.; Shi, X.; Wang, X. The Effect of Aerobic Exercise Training on Growth Performance, Innate Immune Response and Disease Resistance in Juvenile Schizothorax Prenanti. Aquaculture 2018, 486, 18–25. [Google Scholar] [CrossRef]
- Magnoni, L.J.; Crespo, D.; Ibarz, A.; Blasco, J.; Fernández-Borràs, J.; Planas, J.V. Effects of Sustained Swimming on the Red and White Muscle Transcriptome of Rainbow Trout (Oncorhynchus mykiss) Fed a Carbohydrate-Rich Diet. Comp. Biochem. Physiol. Part A Mol. Integr. Physiol. 2013, 166, 510–521. [Google Scholar] [CrossRef] [PubMed]
- Hood, D.A.; Irrcher, I.; Ljubicic, V.; Joseph, A.M. Coordination of Metabolic Plasticity in Skeletal Muscle. J. Exp. Biol. 2006, 209, 2265–2275. [Google Scholar] [CrossRef] [PubMed] [Green Version]
- Lyons, C.N.; Mathieu-Costello, O.; Moyes, C.D. Regulation of Skeletal Muscle Mitochondrial Content during Aging. J. Gerontol. Ser. A Biol. Sci. Med. Sci. 2006, 61, 3–13. [Google Scholar] [CrossRef] [PubMed] [Green Version]
- McClelland, G.B.; Craig, P.M.; Dhekney, K.; Dipardo, S. Temperature- and Exercise-Induced Gene Expression and Metabolic Enzyme Changes in Skeletal Muscle of Adult Zebrafish (Danio rerio). J. Physiol. 2006, 577, 739–751. [Google Scholar] [CrossRef] [PubMed]
- Anttila, K.; Jäntti, M.; Mänttäri, S. Effects of Training on Lipid Metabolism in Swimming Muscles of Sea Trout (Salmo trutta). J. Comp. Physiol. B Biochem. Syst. Environ. Physiol. 2010, 180, 707–714. [Google Scholar] [CrossRef] [PubMed]
- Blasco, J.; Moya, A.; Millán-Cubillo, A.; Vélez, E.J.; Capilla, E.; Pérez-Sánchez, J.; Gutiérrez, J.; Fernández- Borrás, J. Growth-Promoting Effects of Sustained Swimming in Fingerlings of Gilthead Sea Bream (Sparus aurata L.). J. Comp. Physiol. B Biochem. Syst. Environ. Physiol. 2015, 185, 859–868. [Google Scholar] [CrossRef] [Green Version]
- Martin-Perez, M.; Fernandez-Borras, J.; Ibarz, A.; Millan-Cubillo, A.; Felip, O.; De Oliveira, E.; Blasco, J. New Insights into Fish Swimming: A Proteomic and Isotopic Approach in Gilthead Sea Bream. J. Proteome Res. 2012, 11, 3533–3547. [Google Scholar] [CrossRef]
Figure 1.
Data collection site diagram of physical characteristics in grass carp. Twenty-two points were set as the overall shape indicator in juvenile grass carp, as previously described in Lu [25].
Figure 1.
Data collection site diagram of physical characteristics in grass carp. Twenty-two points were set as the overall shape indicator in juvenile grass carp, as previously described in Lu [25].

Figure 2.
Linear regressions of PC1 by measurements of aerobic swimming ability and oxygen consumption metabolism in the lotic environment. (A) Aerobic swimming performance, (B) linear regressions of PC1 of aerobic swimming performance, (C) standard metabolic rate, (D) linear regressions of PC1 of standard metabolic rate, (E) maximum metabolic rate (F) linear regressions of PC1 of maximum metabolic rate. Different letters indicate significant differences between treatments (p < 0.05).

Figure 3.
Effect of water velocity on lactic acid (A), glucose (B), glycogen of red muscle (C), glycogen of white muscle (D) in grass carp. Data are means ± SEM (n = 9 fish per treatment). Different letters indicate significant differences between treatments (p < 0.05).
Figure 3.
Effect of water velocity on lactic acid (A), glucose (B), glycogen of red muscle (C), glycogen of white muscle (D) in grass carp. Data are means ± SEM (n = 9 fish per treatment). Different letters indicate significant differences between treatments (p < 0.05).

Figure 4.
Effect of water velocity on muscle enzyme activities of grass carp. (A) LDH activity in muscle. (B) COX activity in muscle. (C) CS activity in muscle. (D) COX/CS ratio in muscle. (E) LDH/CS ratio in muscle. Data are means ± SEM (n = 9 fish per treatment). Different letters indicate significant differences between treatments (p < 0.05).

Figure 5.
Effect of water velocity AMPK signaling pathway of grass carp in muscle. (A) AMPKα and β families mRNA expression levels in red muscle. (B) AMPKγ family, PGC-1α and NRF-1 mRNA expression levels in red muscle. (C) AMPKα and β families mRNA expression levels in white muscle. (D) AMPKγ family, PGC-1α and NRF-1 mRNA expression levels in white muscle. Data are means ± SEM (n = 9 fish per treatment). Different letters indicate significant differences between treatments (p < 0.05).

Table 1.
Primer sequences used for PCR analysis.
| Gene | Forward (5′–3′) | Reverse (5′–3′) |
|---|---|---|
| AMPKα1 | TAGTGGCCGAGACTCAACCG | TCTGGCTACGGATTCCCAGG |
| AMPKα2 | AGTTCTACCTGGCCTCCAGT | GAGAGCATCCAGAGGGCATC |
| AMPKβ1a | TGGACAGCCCAGAAGATGC | TGGGTCGATCTAAAGTGAGGA |
| AMPKβ1b | TGGAGCTCGACCCAAAATCC | AACACAGTGGGCCTTTCCTC |
| AMPKβ2 | GAGCCCGGCAAAATGATGG | AGCCTGAGGACTCGTCTTT |
| AMPKγ1 | AACACACTCTACATCCTGACAC | CCAGCGTTTTAGACAGAAAAGCA |
| AMPKγ2a | TTCAAGTCCAGCTGTTTGGT | GACGTCTCCAGCCAATAGCA |
| AMPKγ2b | CACGAGACCCTGGAGACCAT | TGCCCATTCTGCATCTACCTG |
| AMPKγ3 | CCCTCACGAAACCCTCGAAA | CAGAGAGCGAGACGATTCCC |
| PGC-1α | TCGGCCCCAGTCTCATTCTA | ATACACCACTCGCCTCTCCT |
| NRF-1 | GTAGTGCAGACGATCAGTAATCC | GTCACTGTGGAGTAATTCACCTGG |
| β-actin | TGAAATTGCCGCACTGGTTG | CTGAGCCTCGTCACCAACAT |
| 18sRNA | GGCGCGCAAATTACCCATTT | TCCCGAGATCCAACTACAAGC |
Table 2.
Growth parameters of juvenile grass carp in the lotic environment.
| Parameters | Water Velocity | |||
|---|---|---|---|---|
| 0 Bl s−1 | 0.5 Bl s−1 | 2 Bl s−1 | 4 Bl s−1 | |
| Body weight (g) | 23.08 ± 5.53 a | 31.89 ± 13.78 b | 31.72 ± 14.67 b | 41.24 ± 18.91 c |
| Body length (cm) | 10.38 ± 0.68 a | 11.45 ± 1.38 b | 11.78 ± 1.42 b | 12.77 ± 1.36 c |
| Condition factor (CF) | 1.95 ± 0.11 a | 2.07 ± 0.18 b | 2.08 ± 0.15 b | 2.21 ± 0.21 c |
Different superscripts indicated statistical significance for different training groups (p < 0.05).
Publisher’s Note: MDPI stays neutral with regard to jurisdictional claims in published maps and institutional affiliations. |
© 2022 by the authors. Licensee MDPI, Basel, Switzerland. This article is an open access article distributed under the terms and conditions of the Creative Commons Attribution (CC BY) license (https://creativecommons.org/licenses/by/4.0/).
Share and Cite
MDPI and ACS Style
Zhu, P.; Liu, J.; Wang, Y.; Li, D. Lotic Environment Affects Morphological Characteristics and Energy Metabolism of Juvenile Grass Carp Ctenopharyngodon idella. Water 2022, 14, 1019. https://doi.org/10.3390/w14071019
AMA Style
Zhu P, Liu J, Wang Y, Li D. Lotic Environment Affects Morphological Characteristics and Energy Metabolism of Juvenile Grass Carp Ctenopharyngodon idella. Water. 2022; 14(7):1019. https://doi.org/10.3390/w14071019
Chicago/Turabian StyleZhu, Pengjin, Jieya Liu, Yin Wang, and Dapeng Li. 2022. "Lotic Environment Affects Morphological Characteristics and Energy Metabolism of Juvenile Grass Carp Ctenopharyngodon idella" Water 14, no. 7: 1019. https://doi.org/10.3390/w14071019
Note that from the first issue of 2016, this journal uses article numbers instead of page numbers. See further details here.