
Response of Maize Hybrids in Drought-Stress Using Drought Tolerance Indices
by
 , , and
Ali Khatibi
1, 
Saeed Omrani
2,
Ali Omrani
3,
Seyed Habib Shojaei
1,
Seyed Mohammad Nasir Mousavi
4,* ,
,
Árpád Illés
4,*,
Csaba Bojtor
4 and
and
János Nagy
4 1
Department of Agricultural Science, Technical and Vocational University (TVU), Tehran 1435761137, Iran
2
Department of Agronomy and Plant Breeding, College of Agriculture, Isfahan University of Technology, Isfahan 84156-83111, Iran
3
Crop and Horticultural Science Research Department, Ardabil Agricultural and Natural Resources Research and Education Center, AREEO, Moghan 193951113, Iran
4
Institute of Land Use, Engineering and Precision Farming Technology, University of Debrecen, 138 Böszörményi St., 4032 Debrecen, Hungary
*
Authors to whom correspondence should be addressed.
Water 2022, 14(7), 1012; https://doi.org/10.3390/w14071012
Submission received: 1 February 2022
/
Revised: 16 March 2022
/
Accepted: 18 March 2022
/
Published: 22 March 2022
(This article belongs to the Special Issue Measures on Irrigation and Agronomy to Improve Crop Water Use Efficiency)
Abstract
:This study was conducted to investigate the response of maize hybrids to drought stress and to select the most drought-tolerant cultivar compared to other hybrids. The experiment was performed on six maize hybrids in a randomized complete block design (RCBD) with three replications under regular irrigation and limited irrigation in the vegetative and reproductive stages in Iran. Drought tolerance indices (TOL, MP, GMP, STI, SSI, and HAR) for the grain yield of genotypes were calculated, and principal component analysis was based on them. The results obtained from estimating the indices showed that the SC647 and KSC704 hybrids, while having good performance in both conditions, also have drought tolerance. Examining the correlation between drought tolerance indices and yield in both conditions, among the indices used to detect drought tolerance, STI, MP, and GMP indices can be considered suitable for selecting high-yielding hybrids in these conditions. The principal components analysis on the stress-tolerance index showed that MP and GMP indices could be used as the best indices with high coefficients to select stress-tolerance hybrids. SC647 and KSC704 hybrids were identified and selected as hybrids with high tolerance to moisture stress. The results of drought tolerance indices in the emergence stage of the crest showed that the KSC260 hybrid has the lowest level of stress sensitivity. SC647 hybrids showed the lowest susceptibility to drought stress in the ear emergence stage.
1. Introduction
Maize (Zea mays L.) is one of the essential cereals globally, and the third-most commonly grown crop after wheat and rice. In terms of yield, it has the highest amount of production among cereals [1]. This plant provides 15–20% of the calories needed by people in more than 20 developing countries [2]. According to the FAO, in 2014, the area under maize cultivation was 22.2 × 10⁸ hectares, and the yield was 1.25 × 10⁹ tons, worldwide. Forecasts show that demand for maize will double by 2050 [3]. Limitations on the production of this plant can be called living and non-living stresses, but drought stress is considered the main limitation for maize production, worldwide [4,5]. The increasing severity and duration of drought due to climate change is reducing the water available for absorption by plants, and the yield of maize is significantly affected by this phenomenon [6]. Therefore, some research has been conducted to improve the yield of maize in drought conditions. One of the essential breeding goals to maintain maize production is producing greater yields with less water consumption [7,8]. Due to drought pressure, decreased maize grain yield varies between 1 and 76%, depending on the plant’s intensity, timing, and growth-stage [9,10,11]. The results of many studies have shown that some plant growth periods are more sensitive to water stress. For example, water stress during inoculation of maize results in the injection of a small number of ovum, or none of them is inoculated, resulting in seedless maize ears [12,13]. In a report, Fernandez [14] stated that the best measure for selecting genotypes under water-stress conditions is to select genotypes with optimal performance in both stress and non-stress conditions from other groups. Several selection criteria have been proposed to select genotypes based on their performance in stress and non-stress conditions [15,16]. Measuring drought tolerance indices is necessary for evaluating drought-tolerant hybrids [17]. Various indicators, including the stress tolerance index (TOL), the mean productivity index (MP), and the stress sensitivity index (SSI), have been proposed to evaluate the tolerance of genotypes to drought stress.
Drought tolerance is a complex trait controlled by many genes; progression to maize breeding for drought tolerance is very slow. Therefore, breeders use selection indices to select superior genotypes under drought stress conditions to breed maize [18]. The simplest way to determine the relationship between two variables is to calculate the correlation coefficient, which shows the average relationship between the two variables. The significance of the correlation between the two variables indicates that both are influenced by common factors [19]. Simple correlation coefficients have been widely used to know the linear relationship between performance and components or the percentage of pair relationships of performance components [20]. Based on Ranjbar and Rousta study on wheat genotypes, the STI index was introduced as an effective indicator in genotype selection [21].
Fernandez [14] introduced the STI index as a valuable tool for determining the stress-tolerance potential among genotypes. When the yield production (YP) is very different from the performance under stress conditions (YS), the mean productivity index (MP) will not be independent of the performance under normal conditions and will be skewed towards it. However, the Geometric Means Productivity Index (GMP) will not be skewed. Fernandez proposed the stress tolerance index (STI) based on the geometric mean productivity index, identifying tolerant genotypes in stress and non-stress conditions. Modifiers use the Geometric Means Productivity Index (GMP) to increase relative performance because drought stress can vary over the years in different conditions. Another study stated that the stress tolerance index (STI) is close to yield in normal irrigation and drought stress conditions. In other words, the plant is drought tolerant [22]. Fernandez [14] divided the genotypes into four groups based on yield under stress and non-stress conditions: (A) high yield in both conditions), group (B) good yield only under stress conditions), group (C) good yield only under stress conditions) and group (D) poor performance in both conditions). This study evaluated the selection criteria for identifying water stress-tolerant hybrids in some maize hybrids. Suitable hybrids are recommended for cultivation in drought-prone areas of Iran and similar areas.
2. Materials and Methods
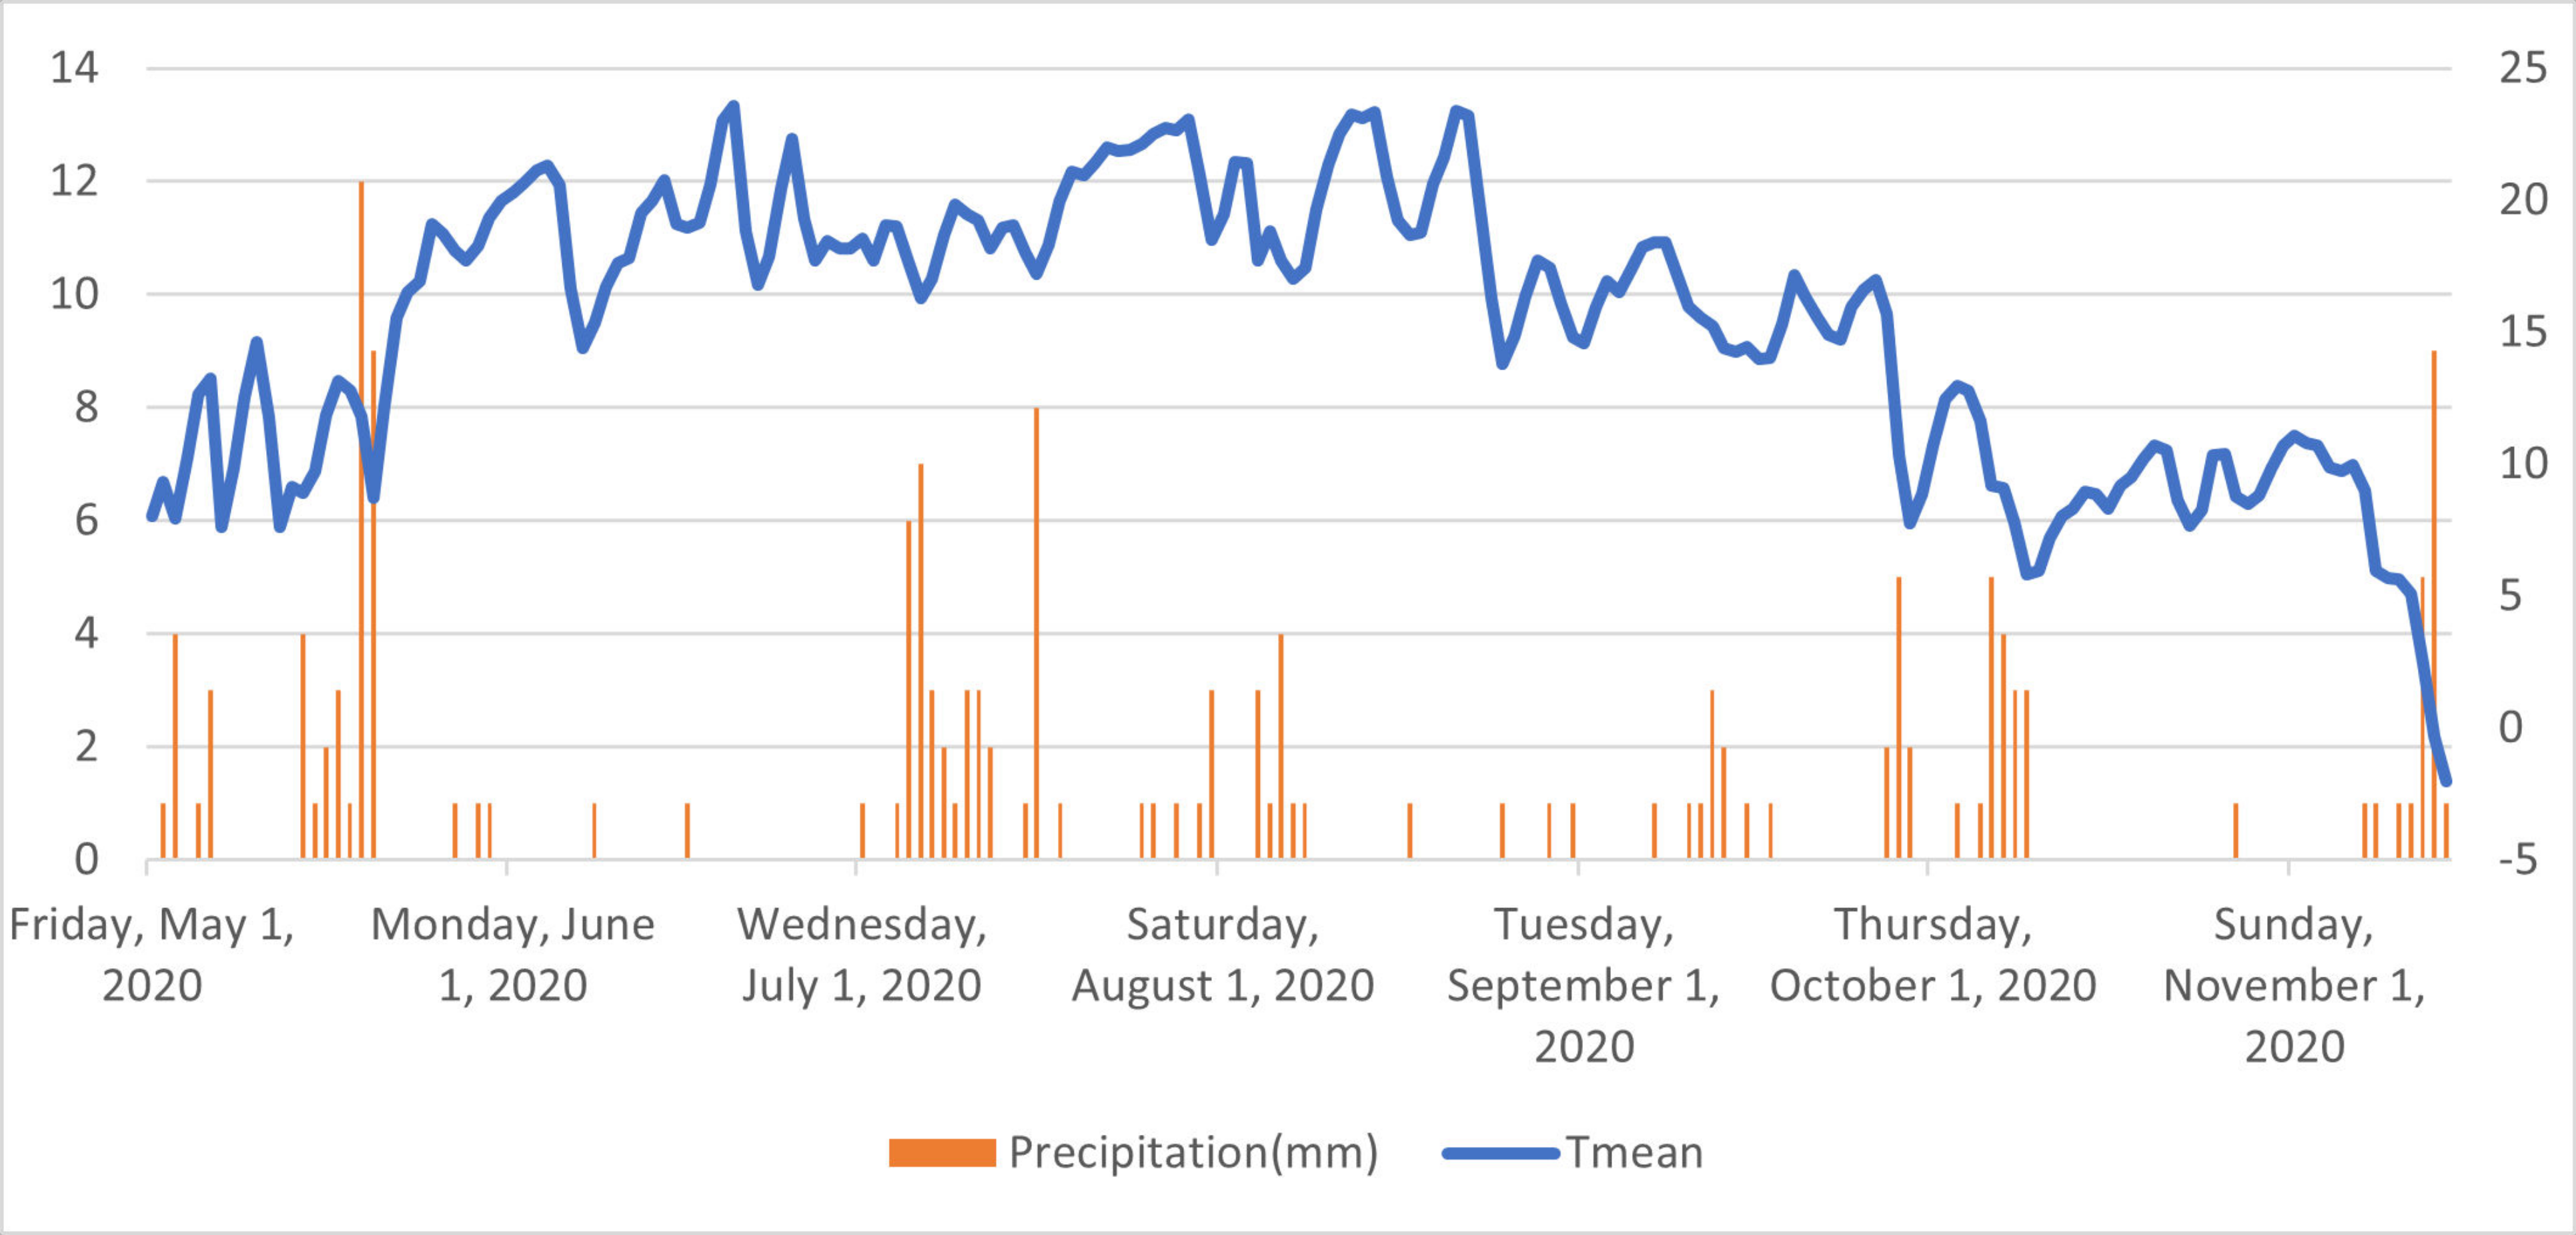
This study was carried out at the Faculty of Agriculture Damavand Farm at an altitude of about 1900 m above sea level. It is located at 52°18’ N, 35°65’ E in Damavand, Iran. Damavand has a cold climate, with an average annual temperature of 11 °C, and the total annual rainfall is 350 mm (Figure 1). Before experimenting, soil samples were prepared from an average depth of 0–50 cm and were analyzed to determine nutrients in the soil laboratory. The results are presented in Table 1.
The experiment was performed under field conditions as a split block with a randomized complete block design. Irrigation is the main factor in three levels, including full irrigation, stress in the emergence stage of flowering, and stress in the emergence stage of cob emergence. Hybrids were taken as a secondary factor in six levels, including KSC704 (FAO 700), KSC707 (FAO 700), SC640 (FAO 640), SC647 (FAO 640), BC504 (FAO 500), and KSC260 (FAO 300). The field experiment had 18 treatment combinations (6 × 3) in 3 replications with 54 experimental units. Cultivation was performed (2 seeds planted at a depth of 5 to 8 cm), and then irrigation was performed. Each plot had 6 rows of planting, with a length of 3 m, row-spacing of 75 cm, and a space between plots of 50 cm. A distance of one meter between repetitions prevents water transfer during irrigation treatments. The distance between the plants in the row was considered to be 20 cm. The first level of irrigation stress was applied during the emergence stage of the first flowering after irrigation, which began after 15 days. In the stage of cob emergence, the second level of irrigation stress was applied, to eliminate marginal effects from sampling in the two side rows of each plot and 0.5 m at the beginning and end of each row. The plant density per hectare was 79,000. Principal component analysis (PCA) is a multivariate technique, the main purpose of which is to reduce the number of variables in a multivariate data set as much as possible to explain the changes of the primary variables in the data set. This goal is achieved by converting the primary variables into a new set of uncorrelated variables called principal components, which are linear combinations of the original (primary) variables, and which are arranged so that the first few components compute the greatest variability in the principal variables. It can identify key components and help us analyze a set of features that are more valuable than just examining them all. PCA extracts those features that give us the most value. The following indices were used as indicators:
where TOL = tolerance index, MP = mean productivity, GMP = geometric mean productivity, STI = stress tolerance index, SSI = drought (stress) sensitivity index, HAR = harmonic mean, Ys = yield hybrid under stress conditions, YP = Performance under optimal conditions, XS = average yield hybrids under stress conditions, and XP = the average yield of hybrids under stress-free conditions.
TOL = Yp − Ys, MP = Yp + Ys/2, GMP = √(Ys)(Yp), STI = (Yp)(Ys)/(Ȳp)2
SSI = 1 − [Ys/Yp]/SI
SI = 1 − [Xs/Xp]
HAR = 2(Ys.Yp)/Ys + Yp
3. Results and Discussion
Indicators have advantages and disadvantages. The closer Ys (yield under stress conditions) is to Yp, the lower the sensitivity of the cultivar to water stress and, consequently, the smaller the SSI. The tolerance or susceptibility of hybrids determines drought-stress by comparing their SSI values [23]. To evaluate drought-tolerance, some maize hybrids were estimated according to the quantitative indicators of drought-tolerance, including mean productivity (MP), geometric mean productivity (GMP), harmonic mean (HAR), Stress Tolerance Index (STI), Stress Sensitivity Index (SSI), and Tolerance Index (TOL) for mean stress levels (Table 2). The weakness of this index is its inability to recognizing group A from group C (genotypes that have higher relative yields only in stressful conditions). According to (Table 2), KSC260 and SC647 were the hybrids with the lowest SSI and had the lowest stress sensitivity. Also, the KSC707 and SC640 genotypes were identified as sensitive genotypes due to higher SSI than stress. The high value of the TOL index indicates the high sensitivity of the cultivar to stress, and its low value is favorable for breeders. Based on this index, KSC260 and SC647 showed the lowest sensitivity to drought stress. The highest susceptibility was related to the KSC704 genotype. The selection of hybrids based on TOL and SSI is more desirable in areas with a high yield in stress conditions and a low or medium yield in non-stress conditions. Another studied index is the average productivity index, which is obtained from the mean productivity of yield under favorable conditions and stress [24]. A large amount of MP is a good criterion for selecting hybrids tolerant to drought stress.
According to Table 2, SC640, KSC704, and SC647 hybrids had the highest index values and were the most tolerant hybrids. Also, the KSC707 was selected as the most sensitive hybrid based on these factors. The GMP, or geometric mean productivity, will be less skewed due to its lower sensitivity to differences between Yp and Ys. In terms of this index, SC647, SC640, and KSC704 hybrids were the most tolerant. The STI, or stress tolerance index, includes yield potential in non-stress conditions, yield in stress conditions, and intensity. According to this index, the SC647, SC640, and KSC704 hybrids were the most tolerant to drought stress, and the KSC707 hybrid was the least tolerant. The KSC707 genotype was more sensitive than other cultivars in terms of this index. According to the study of tolerance indices, SC647 and SC640 can be identified as tolerant genotypes, and KSC707 as a susceptible genotype. The results are based on the harmonic average productivity index (HAR), indicating high-stress-tolerance and high-performance potential [25]. The highest values of water-stress-tolerance were related to SC647 and SC640 hybrids.
3.1. Indices of Water-Stress-Tolerance and Yield under Stress Conditions in The Development Stage of Flowering
The tolerance indices results showed that the KSC260 hybrid, with the lowest SSI, had the lowest sensitivity to stress at this stage (Table 3). Regarding the TOL index, the KSC260 and KSC707 hybrids showed the lowest sensitivity to drought-stress. The KSC704 and SC640 hybrids had the highest MP index and most tolerant hybrids. The GMP index, or geometric mean productivity, introduced the KSC704 and SC640 hybrids as the most tolerant ones for stress. In terms of the STI index, the KSC704, SC640, and SC647 hybrids are the most tolerant, and BC540 had the least tolerance to stress. The results based on the harmonic mean (HAR) efficiency index show the highest stress-tolerance in the KSC704 and SC640 hybrids compared to the other hybrids. Under stress conditions, the MP, GMP, HAR, and STI indices had high values indicating stress-tolerance. The OSGT14, KSC710GT, and KSC-mog84-062 hybrids had high yields to tolerate tension. The TOL and SSI indices had low values, which indicate stress-tolerance. Hybrids 700 and 720 were introduced as stress-tolerant hybrids with the highest yields [26].
3.2. Drought Tolerance Indices and Yield under Stress Conditions in the Stage of Ear Emergence
The SC647 hybrid had the lowest SSI with the lowest sensitivity to stress in the ear emergence stage (Table 4). The SC647 and KSC260 hybrids had the lowest sensitivity to drought stress in the TOL index. In terms of MP values, the SC647 and SC640 hybrids had the highest index, and they were recognized as the most tolerant hybrids at this stage. In terms of the GMP index, the SC647 and SC640 hybrid were the most tolerant. In terms of STI index, the SC647 and SC640 hybrids were the most tolerant, and the KSC707 hybrid was the least tolerant. Based on the harmonic average productivity index (HAR), the highest stress-tolerance was observed in the SC647, SC640 and KSC704 hybrids compared to other hybrids. The correlation coefficients between the estimated indices and yield under stress (Ys) and non-stress (Yp) were calculated to select the drought tolerance indices. Indices that correlate with performance in both stress and non-stress conditions are known as the best indicators [27].
The correlation analysis of indices showed that yield under water-stress or (Ys) had the highest correlation with the STI, GMP, and HAR indices in grain yield under stress and expected conditions (Table 5). Therefore, these indicators are the most appropriate for selecting drought-tolerant lines in maize under optimal irrigation conditions and high yield stress. The correlation between grain yield was positive and significant with STI (r = 0.86 *), MP (r = 0.84 *), and GMP (r = 0.85 *) at 0.05 level in normal irrigation conditions. Also, correlation of grain yield showed that, under stress with STI (r = 0.84 *), GMP (r = 0.85 *), HAR (r = 0.91 **) under positive and significant stress conditions. There is a positive and significant correlation of grain yield with the STI (r = 0.84), GMP (r = 0.85), and HAR (r = 0.91 **).
Some researchers have found a significant correlation at the probability level of 0.01. The correlation between drought tolerance and yield indices under mild stress conditions showed that yield under normal conditions correlated with the mean productivity index (r = 0.98 **), geometric mean (r = 0.98 **), and stress tolerance index (r = 0.97 **). The results of our study were consistent with their results [28].
None of the above indices were significant under stress conditions or without stress in the flowering stage (Table 6). The MP tolerance index had a positive and significant correlation with the GMP (r = 0.98 **). The STI index was significantly correlated with the MP and GMP (r = 0.99 **). The TOL (tolerance index) had a positive and significant correlation with the SSI (r = 0.91 **).
The MP tolerance index had a positive and significant correlation (r = 0.83) in conditions without Yp stress in the ear emergence stage with grain yield, and MP (r = 0.82), GMP (r = 0.89), STI (* R = 0.90), and HAR (r = 0.94 **) had a positive and significant correlation in the ear-stress stage under Ys stress conditions with grain yield (Table 7). The HAR had a positive and significant correlation with STI (r = 0.99 **), MP (r = 0.96 **), and GMP (r = 0.99 **). The GMP index showed a high correlation with STI (r = 0.99 **) and MP (r = 0.99 **), and the MP index had a positive and high correlation with the STI (r = 0.98 **). A positive and significant correlation was observed for TOL with SSI (r = 0.93 **). Since MP-based selection increases average yield in stress and non-stress conditions, this index is not suitable for detecting group D genotypes (genotypes that do not perform well in stress and non-stress conditions). GMP is more suitable for isolating group D genotypes from other groups due to its lower sensitivity to differences between Yp and Ys. Among the studied indicators of STI, which is estimated based on GMP, it is of primary importance to selecting genotypes with high yields and greater tolerance to stress. The HAR has a significant correlation with Yp and Ys and can be a suitable index for selecting high-yield genotypes in both conditions, along with STI and GMP.
The SC647 and KSC704 hybrids had more tolerance to stress and good yield potential in stressful and non-stressful conditions than did other hybrids (Table 7). In terms of average stress levels, the MP, HAR, and STI, which correlated with grain yield and stress conditions, were good criteria for selecting tolerance hybrids. GMP can be a suitable selection criterion in the case of ear stage under stress conditions. It concluded that the BC504 hybrid in the flowering stage and the KSC707 hybrid are the most sensitive hybrids to stress conditions in the ear stage. The KSC704 hybrid is the most tolerant hybrid in the flowering stage in stress conditions, and SC640 is the most tolerant hybrid in the ear stage in stress conditions. HAR was introduced as the best index for determining drought-tolerant hybrids due to its high correlation with grain yields. Choukan et al. [28] showed that performance has a positive and significant correlation with mean productivity, geometric mean, and harmonic mean in severe stress conditions. A high correlation was observed with grain yield at different stress levels for the indices of mean productivity, geometric mean, and harmonic mean in normal conditions. These indices were determined as the superior index for introducing drought-tolerant hybrid [29]. Fathi reported a significant correlation between STI and GMP and MP under normal conditions and drought stress [30]. Mostafavi et al. reported that the reduction in maize yield under water-stress conditions at the corolla emergence and pollination stage reaches about 90%. The leaf area of maize decreased due to drought stress depending on the intensity and length of the stress period, but the final number of leaves was less affected by stress [31]. Haji Babaei and Azizi investigated the effect of drought stress on the yield of maize hybrids. They reported that in normal and mild stress conditions, the most-used indices are GMP, MP and STI, and in normal and severe stress conditions, the most-used are the SSI and TOL [32].
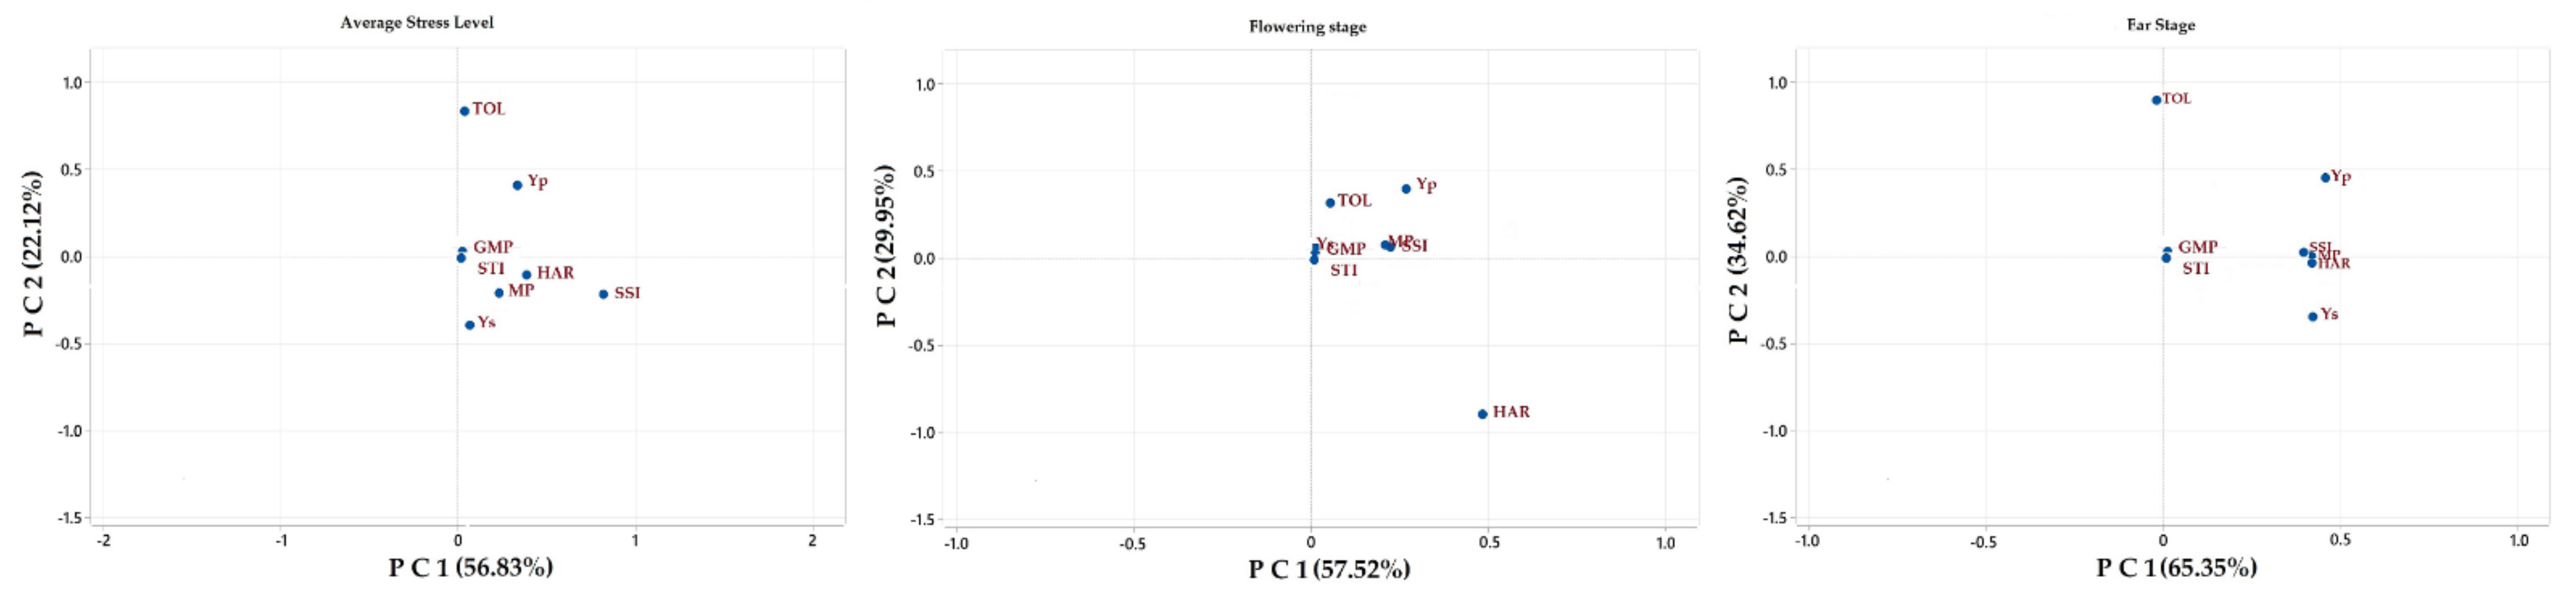
The results showed that most of the differences in the data are justified by the first and second principal components (78.95). The first principal component showed positive and high MP, SSI, and Yp coefficients. Also, the second principal component has negative coefficients for all indices except TOL and Yp. It has high coefficients for the TOL index, Ys, and by increasing these components, genotypes selected are less sensitive to stress. Therefore, selection based on the first component causes the selection of hybrids with a high yield in normal conditions. The first principal component can be called the performance potential component, and the second principal component can be called the stress sensitivity component. Therefore, the first principal component can be considered a performance component and the second principal component as a sensitivity component (Table 8 and Figure 2). Choukan et al. [28] reported that principal component analysis of the first and second principal components interpreted 96.3% of the changes in drought tolerance indices for stress conditions. The first component showed a high correlation with yields in normal conditions, and MP, GMP, HAR, and STI indices with yield potential. These were able to isolate high yield hybrids in stress conditions. Many researchers have reported a significant positive correlation between Yp and Ys, suggesting that high-yielding genotypes under normal conditions can perform well under stress conditions [33,34,35,36]. Refiq et al. [37] reported a significant positive correlation between 1000-grain weight and net grain yield in the plot. The results showed that most of the differences in the data are justified by the first and second principal components in the drought stress component in the ear stage (99.98) (Table 8 and Figure 2). The first principal component had positive and high coefficients in GMP, HAR, Ys, and SSI. Hybrids are selected by increasing these indices to yield in high-stress conditions. The second principal component has negative coefficients on STI, HAR, and Ys, and positive and high coefficients on TOL, Yp, and Ys. Genotypes are selected by increasing those that are less sensitive to stress. The results showed that most of the differences in the data were justified by the first and second principal components in the drought-stress component in the ear stage (99.98) (Table 8 and Figure 2). The first principal component had positive and high coefficients in GMP, HAR, Ys, and SSI. Hybrids are selected by increasing these indices to yield high-stress conditions. The second principal component has negative coefficients on STI, HAR, and Ys, and positive and high coefficients on TOL, Yp, and Ys. Genotypes are selected by increasing those that are less sensitive to stress.
4. Conclusions
Since drought tolerance is a complex trait and various factors are involved, judging hybrids in terms of a trait is complex and sometimes contradictory. The KSC260 and SC647 hybrids had the lowest sensitivity to stress. The SC640 and KSC704 hybrids had the highest indexes and the most tolerant hybrids. In addition, KSC704 had more tolerance than other genotypes under stress conditions on flowering, and SC640 had more tolerance than other genotypes under cob-stress conditions. Yield (Ys) correlated with STI, GMP, and HAR. Correlation of grain yield under stress was: STI (r = 0.84), GMP (r = 0.85), and HAR (r = 0.91 **). These indices can be selected as the most appropriate indicators for identifying and selecting drought-tolerant genotypes in maize under high-yield drought conditions. The first principal component has positive and high Yp and HAR coefficients. The second principal component has high HAR coefficients.
Author Contributions
Conceptualization, A.K.; data curation, S.O.; formal analysis, A.O. and S.H.S.; methodology, S.M.N.M. and J.N.; writing—review and editing, S.M.N.M., Á.I., and J.N.; writing—original draft, C.B.; supervision, J.N. All authors have read and agreed to the published version of the manuscript.
Funding
TKP2021-NKTA-32 has been implemented with support provided from the National Research, Development and Innovation Fund of Hungary, financed under the TKP2021-NKTA funding scheme and supported by the EFOP-3.6.3-VEKOP.
Institutional Review Board Statement
Not applicable.
Informed Consent Statement
Not applicable.
Data Availability Statement
All data supporting the conclusions of this article are included in this article.
Acknowledgments
TKP2021-NKTA-32 has been implemented with support provided from the National Research, Development and Innovation Fund of Hungary, financed under the TKP2021-NKTA funding scheme, and supported by the EFOP-3.6.3-VEKOP.
Conflicts of Interest
The authors declare no conflict of interest.
Abbreviations
| TOL | tolerance index |
| MP | mean productivity |
| GMP | geometric mean productivity |
| STI | stress tolerance index |
| SSI | drought (stress) sensitivity index |
| HAR | harmonic |
References
- Nagy, J. Maize Production; Akadémiai Kiadó: Budapest, Hungary, 2006. [Google Scholar]
- Széles, A.; Huzsvai, L. Modelling the effect of sowing date on the emergence, silking and yield of maize (Zea mays L.) in a moderately warm and dry production area. Agron. Res. 2020, 18, 579–594. [Google Scholar]
- FAO. Faostat. 2015. Available online: http://faostat.fao.org/site/567/default (accessed on 15 December 2021).
- Bodnár, K.B.; Mousavi, S.M.N.; Nagy, J. Evaluation of dry matter accumulation of maize (Zea mays L.) hybrids. Acta Agrar. Debr. 2018, 74, 35–41. [Google Scholar] [CrossRef] [PubMed]
- Hunter, M.C.; Kemanian, A.R.; Mortensen, D.A. Cover crop effects on maize drought stress and yield. Agric. Ecosyst. Environ. 2021, 311, 107294. [Google Scholar] [CrossRef]
- Song, Y.; Birch, C.; Qu, S.; Doherty, A.; Hanan, J. Analysis and modelling of the effects of water stress on maize growth and yield in dryland conditions. Plant Prod. Sci. 2010, 13, 199–208. [Google Scholar] [CrossRef]
- Zarabi, M.; Alahdadi, I.; Akbari, G.A.; Akbari, G.A. A study on the effects of different biofertilizer combinations on yield, its components and growth indices of corn (Zea mays L.) under drought stress condition. Afr. J. Agric. Res. 2011, 6, 681–685. [Google Scholar]
- Cai, F.; Zhang, Y.; Mi, N.; Ming, H.; Zhang, S.; Zhang, H.; Zhao, X. Maize (Zea mays L.) physiological responses to drought and rewatering, and the associations with water stress degree. Agric. Water Manag. 2020, 241, 106379. [Google Scholar] [CrossRef]
- Mousavi, S.M.N.; Bojtor, C.; Illés, Á.; Nagy, J. Genotype by Trait Interaction (GT) in Maize Hybrids on Complete Fertilizer. Plants 2021, 10, 2388. [Google Scholar] [CrossRef]
- Žalud, Z.; Hlavinka, P.; Prokeš, K.; Semerádová, D.; Jan, B.; Trnka, M. Impacts of water availability and drought on maize yield–A comparison of 16 indicators. Agric. Water Manag. 2017, 188, 126–135. [Google Scholar] [CrossRef]
- Hejazi, P.; Mousavi, S.M.N.; Mostafavi, K.; Ghomshei, M.S.; Hejazi, S.; Mousavi, S.M.N. Study on hybrids maize response for drought tolerance index. Adv. Environ. Biol. 2013, 7, 333–338. [Google Scholar]
- Mostafavi, K.; Firoozi, M.; Mousavi, S.M.N. Effect of drought stress on yield and yield components of maize hybrids. Sci. Res. Essays 2013, 8, 1145–1149. [Google Scholar]
- Ul-Allah, S.; Ijaz, M.; Nawaz, A.; Sattar, A.; Sher, A.; Naeem, M.; Mahmood, K. Potassium application improves grain yield and alleviates drought susceptibility in diverse maize hybrids. Plants 2020, 9, 75. [Google Scholar] [CrossRef] [Green Version]
- Fernandez, G.C.J. Effective selection criteria for assessing plant stress tolerance. In Proceedings of the International Symposium on Adaptation of Vegetables and other Food Crops in Temperature and Water Stress, Taipei, Taiwan, 13–16 August 1992; pp. 257–270. [Google Scholar]
- Naghavi, M.R.; Aboughadareh, A.P.; Khalili, M. Evaluation of drought tolerance indices for screening some of corn (Zea mays L.) cultivars under environmental conditions. Not. Sci. Biol. 2013, 5, 388. [Google Scholar] [CrossRef] [Green Version]
- Afolabi, M.S.; Murtadha, M.A.; Lamidi, W.A.; Waheed, J.A.; Salami, A.E.; Bello, O.B. Evaluation of yield and yield components of low n maize (Zea mays l.) varieties under low and high nitrogen conditions. Afr. J. Agric. Res. 2020, 15, 66–72. [Google Scholar]
- Hussain, H.A.; Men, S.; Hussain, S.; Chen, Y.; Ali, S.; Zhang, S.; Wang, L. Interactive effects of drought and heat stresses on morpho-physiological attributes, yield, nutrient uptake and oxidative status in maize hybrids. Sci. Rep. 2019, 9, 1–12. [Google Scholar] [CrossRef] [Green Version]
- Mhike, X.; Okori, P.; Magorokosho, C.; Ndlela, T. Validation of the use of secondary traits and selection indices for drought tolerance in tropical maize (Zea mays L.). Afr. J. Plant Sci. 2012, 6, 96–102. [Google Scholar]
- Lawson, C.; Montgomery, D.C. Logistic regression analysis of customer satisfaction data. Qual. Reliab. Eng. Int. 2006, 22, 971–984. [Google Scholar] [CrossRef]
- Karami, E.; Ghannadha, M.R.; Naghavi, M.R.; Mardi, M. An evaluation of drought resistance in barley. Iran. J. Agric. Sci. 2005, 36, 547–560. [Google Scholar]
- Ranjbar, G.H.; Rousta, M.J. Effective Stability Index for Selecting Wheat Genotypes under Saline Conditions. Iran. J. Soil Res. (Former. Soil Water Sci.) 2011, 24, 283–290. [Google Scholar]
- Campos, H.; Cooper, M.; Habben, J.E.; Edmeades, G.O.; Schussler, J.R. Improving drought tolerance in maize: A view from industry. Field Crops Res. 2004, 90, 19–34. [Google Scholar] [CrossRef]
- Bonea, D. Grain yield and drought tolerance indices of maize hybrids. Not. Sci. Biol. 2020, 12, 376–386. [Google Scholar] [CrossRef]
- Zeng, W.; Peng, Y.; Zhao, X.; Wu, B.; Chen, F.; Ren, B.; Ding, Y. Comparative proteomics analysis of the seedling root response of drought-sensitive and drought-tolerant maize varieties to drought stress. Int. J. Mol. Sci. 2019, 20, 2793. [Google Scholar] [CrossRef] [PubMed] [Green Version]
- Parajuli, S.; Ojha, B.R.; Ferrara, G.O. Quantification of secondary traits for drought and low nitrogen stress tolerance in inbreds and hybrids of maize (Zea mays L.). J. Plant Genet. Breed 2018, 2, 106. [Google Scholar]
- El-Sabagh, A.; Barutcular, C.; Hossain, A.; Islam, M.S. Response of maize hybrids to drought tolerance in relation to grain weight. Fresenius Environ. Bull. 2018, 27, 2476–2482. [Google Scholar]
- Horváth, É.; Gombos, B.; Széles, A. Evaluation phenology, yield and quality of maize genotypes in drought stress and non-stress environments. Agron. Res. 2021, 19, 408–422. [Google Scholar]
- Choukan, R.; Heydari, A.; Mohammadi, A.E.; Hadadi, M.H. Evaluation of drought tolerance in grain maize hybrids using drought tolerance indices. Seed Plant 2008, 24, 543–562. [Google Scholar]
- Zhao, J.; Xue, Q.; Jessup, K.E.; Hao, B.; Hou, X.; Marek, T.H.; Brauer, D.K. Yield and water use of drought-tolerant maize hybrids in a semiarid environment. Field Crops Res. 2018, 216, 1–9. [Google Scholar] [CrossRef]
- Fath Baheri, S.; Javanshir, A.; Kazemi, H.; Ahari Zad, S. Evaluation of indicators of drought tolerance in spring barley genotypes. J. Agric. Sci. 2003, 13, 95–105. [Google Scholar]
- Mostafavi, K.; Shoahosseini, M.; Geive, H.S. Multivariate analysis of variation among traits of corn hybrids traits under drought stress. Int. J. Agri. Sci. 2011, 1, 416–422. [Google Scholar]
- Hajibabaei, M.; Azizi, F. Evaluation of drought tolerance indices in some new hybrids of corn. Electron. J. Crop Prod. 2011, 3, 139–155. [Google Scholar]
- Sedri, M.H.; Amini, A.; Golchin, A. Evaluation of nitrogen effects on yield and drought tolerance of rainfed wheat using drought stress indices. J. Crop Sci. Biotechnol. 2019, 22, 235–242. [Google Scholar] [CrossRef]
- Hamid, A.E.; Aglan, M.A.; Hussein, E. Modified method for the analysis of genotype by trait (Gt) biplot as a selection criterion in wheat under water stress conditions. Egypt. J. Agron. 2019, 41, 293–312. [Google Scholar]
- Mhike, X.; Okori, P.; Magorokosho, C.; Gibson, P. Genetic analysis of tropical maize inbreds and hybrids for grain yield and traits associated with drought tolerance. In Proceedings of the Third Biennial Conference, Entebbe, Uganda, 24–28 September 2012. [Google Scholar]
- Pirasteh-Anosheh, H.; Emam, Y.; Pessarakli, M. Changes in endogenous hormonal status in corn (Zea mays) hybrids under drought stress. J. Plant Nutr. 2013, 36, 1695–1707. [Google Scholar] [CrossRef]
- Rafiq, M.; Rafique, M.; Hussain, A.; Altaf, M. Studies on the heritability, correlation and path analysis in maize (Zea mays L.). J. Agric. Res. 2010, 48, 35–38. [Google Scholar]
Figure 1.
Precipitation and temperature during the growing season.

Figure 2.
Principal component biplot on yield indices.


Table 1.
Physical and chemical properties of experiment soil from a depth of 0–50 cm.
| Salinity (%) | Acidity | Saturation Percentage | Clay (%) | Silt (%) | Sand (%) | Organic Carbon (%) | N | P (ppm) | K (ppm) |
|---|---|---|---|---|---|---|---|---|---|
| 0.7 | 7.5 | 47 | 42 | 42 | 16 | 1.2 | 12 | 12 | 425 |
Table 2.
Drought tolerance index values for maize hybrids under moderate water-stress conditions.
| Hybrids | Yp | Ys | TOL | MP | GMP | SSI | STI | HAR |
|---|---|---|---|---|---|---|---|---|
| KSC704 | 3825.1 | 1822.1 | 1434.1 | 3421 | 2314.3 | 0.9 | 0.70 | 2416 |
| KSC260 | 2514 | 1902.6 | 787 | 1412.1 | 2287.5 | 0.65 | 0.43 | 2236 |
| KSC707 | 2741 | 1485.3 | 1231 | 878 | 1985.3 | 1.1 | 0.34 | 1874.6 |
| BC540 | 2778 | 1542 | 1281 | 2021.1 | 2201.2 | 1.01 | 0.52 | 2105.9 |
| SC640 | 3125 | 1987 | 1412.1 | 2432 | 2434 | 1.1 | 0.72 | 2185.2 |
| SC647 | 2987.2 | 2087 | 1105.1 | 232 | 2612.5 | 0.75 | 0.68 | 2538.74 |
Table 3.
Values of water-stress-tolerance indices on maize in the flowering stage.
| Hybrids | YP | YS | TOL | MP | GMP | SSI | STI | HAR |
|---|---|---|---|---|---|---|---|---|
| KSC704 | 3225.6 | 2012 | 1412.75 | 2785 | 2612.2 | 1.06 | 0.72 | 2395 |
| KSC260 | 2514 | 1965 | 615.2 | 2351.6 | 2214.1 | 0.61 | 0.56 | 2200.71 |
| KSC707 | 2469 | 1596 | 1110 | 2096.6 | 2105 | 0.85 | 0.57 | 2005 |
| BC540 | 2958.6 | 1312.1 | 1401.1 | 2045.3 | 2025 | 1.13 | 0.54 | 1897.41 |
| SC640 | 3305.9 | 1685.5 | 1742.3 | 516 | 2356.2 | 1.2 | 0.61 | 2365.6 |
| SC647 | 3042 | 1724 | 1185.6 | 2336 | 2295.6 | 0.91 | 0.59 | 1085.1 |
Table 4.
Values of water-stress-tolerance indices for maize genotypes under stress conditions on ear.
Table 4.
Values of water-stress-tolerance indices for maize genotypes under stress conditions on ear.
| Genotype | Yp | Ys | TOL | MP | GMP | SSI | STI | HAR |
|---|---|---|---|---|---|---|---|---|
| KSC704 | 3100 | 1802.3 | 1785 | 2752 | 2541.2 | 1.1 | 0.59 | 2121.15 |
| KSC260 | 2485 | 1901 | 795.7 | 2205 | 2214 | 0.72 | 0.58 | 2141.3 |
| KSC707 | 2415.3 | 1506.5 | 1302.3 | 2102.3 | 1903 | 0.9 | 0.41 | 1848.75 |
| BC540 | 2818.75 | 1902.3 | 1001 | 2327.17 | 2142.3 | 0.92 | 0.66 | 2332 |
| SC640 | 3456.1 | 2104 | 1402.6 | 2554.12 | 2468 | 1 | 0.71 | 2412 |
| SC647 | 3102.1 | 2489 | 503.1 | 2885.2 | 2748.6 | 0.66 | 0.79 | 2805 |
Table 5.
The correlation coefficient between tolerance index and performance under moderate water-stress conditions.
Table 5.
The correlation coefficient between tolerance index and performance under moderate water-stress conditions.
| SSI | STI | TOL | MP | GMP | HAR | Yp | |
|---|---|---|---|---|---|---|---|
| STI | −0.05 | 1 | |||||
| TOL | 0.9 | 0.32 | 1 | ||||
| MP | 0.14 | 0.86 * | 0.49 | 1 | |||
| GMP | −0.08 | 0.99 ** | 0.36 | 0.86 * | 1 | ||
| HAR | −0.21 | 0.98 ** | 0.13 | 0.83 * | 0.99 ** | 1 | |
| Yp | 0.43 | 0.86 * | 0.89 | 0.84 * | 0.85 * | 0.77 | 1 |
| Ys | −0.57 | 0.84 * | −0.27 | 0.63 | 0.85 * | 0.91 ** | 0.36 |
Note(s): * p < 0.05; ** p < 0.01. Correlation between water-stress-tolerance indices in the flowering stage.
Table 6.
Correlation between tolerance index and performance under stress conditions in the flowering stage.
Table 6.
Correlation between tolerance index and performance under stress conditions in the flowering stage.
| SSI | STI | TOL | MP | GMP | HAR | Yp | |
|---|---|---|---|---|---|---|---|
| STI | 0.15 | 1 | |||||
| TOL | 0.91 ** | 0.52 | 1 | ||||
| MP | 0.21 | 0.99 ** | 0.62 | 1 | |||
| GMP | 0.14 | 0.99 ** | 0.49 | 0.98 ** | 1 | ||
| HAR | 0.06 | 0.29 | 0.15 | 0.28 | 0.37 | 1 | |
| Yp | 0.81 | 0.66 | 0.36 | 0.66 | 0.51 | 0.46 | 1 |
| Ys | −0.39 | 0.68 | −0.11 | 0.70 | 0.80 | 0.18 | 0.44 |
Note(s): ** p < 0.01. Correlation between drought tolerance indices in the stage of ear emergence.
Table 7.
Correlation coefficients between tolerance index and yield under stress conditions on the ear stage.
Table 7.
Correlation coefficients between tolerance index and yield under stress conditions on the ear stage.
| SSI | STI | TOL | MP | GMP | HAR | Yp | |
|---|---|---|---|---|---|---|---|
| STI | −0.47 | 1 | |||||
| TOL | 0.93 ** | −0.12 | 1 | ||||
| MP | −0.31 | 0.98 ** | 0.03 | 1 | |||
| GMP | −0.55 | 0.99 ** | −0.10 | 0.99 ** | 1 | ||
| HAR | −0.56 | 0.99 ** | −0.23 | 0.96 ** | 0.99 ** | 1 | |
| Yp | 0.24 | 0.74 | 0.47 | 0.83 * | 0.75 | 0.66 | 1 |
| Ys | −0.80 | 0.90 * | −0.53 | 0.82 * | 0.89 * | 0.94 ** | 0.38 |
Note(s): * p < 0.05; ** p < 0.01.
Table 8.
Principal components analysis of drought-stress and yield indices.
| Levels | Component | Variance% | Cumulative Variance% | Yp | Ys | TOL | SSI | MP | GMP | STI | HAR |
|---|---|---|---|---|---|---|---|---|---|---|---|
| Average | 1 | 56.83 | 56.80 | 0.35 | 0.15 | 0.02 | 0.81 | 0.24 | 0.00 | 0.00 | 0.22 |
| 2 | 22.12 | 78.95 | 0.32 | −0.44 | 0.77 | −0.13 | −0.15 | 0.00 | 0.00 | −0.23 | |
| Flowering | 1 | 57.52 | 57.53 | 0.58 | 0.13 | 0.14 | 0.34 | 0.31 | 0.00 | 0.00 | 0.49 |
| 2 | 29.95 | 87.47 | 0.32 | 0.01 | 0.31 | 0.15 | 0.14 | 0.00 | 0.00 | −0.86 | |
| On-ear stage | 1 | 65.35 | 65.35 | 0.41 | 0.46 | −0.07 | 0.42 | 0.46 | 0.00 | 0.00 | 0.46 |
| 2 | 34.62 | 99.98 | 0.48 | −0.32 | 0.81 | 0.08 | 0.00 | 0.00 | 0.00 | −0.07 |
Publisher’s Note: MDPI stays neutral with regard to jurisdictional claims in published maps and institutional affiliations. |
© 2022 by the authors. Licensee MDPI, Basel, Switzerland. This article is an open access article distributed under the terms and conditions of the Creative Commons Attribution (CC BY) license (https://creativecommons.org/licenses/by/4.0/).
Share and Cite
MDPI and ACS Style
Khatibi, A.; Omrani, S.; Omrani, A.; Shojaei, S.H.; Mousavi, S.M.N.; Illés, Á.; Bojtor, C.; Nagy, J. Response of Maize Hybrids in Drought-Stress Using Drought Tolerance Indices. Water 2022, 14, 1012. https://doi.org/10.3390/w14071012
AMA Style
Khatibi A, Omrani S, Omrani A, Shojaei SH, Mousavi SMN, Illés Á, Bojtor C, Nagy J. Response of Maize Hybrids in Drought-Stress Using Drought Tolerance Indices. Water. 2022; 14(7):1012. https://doi.org/10.3390/w14071012
Chicago/Turabian StyleKhatibi, Ali, Saeed Omrani, Ali Omrani, Seyed Habib Shojaei, Seyed Mohammad Nasir Mousavi, Árpád Illés, Csaba Bojtor, and János Nagy. 2022. "Response of Maize Hybrids in Drought-Stress Using Drought Tolerance Indices" Water 14, no. 7: 1012. https://doi.org/10.3390/w14071012
Note that from the first issue of 2016, this journal uses article numbers instead of page numbers. See further details here.