Article

Yield, Physiology, Fruit Quality and Water Footprint in Persian Lime (Citrus latifolia Tan.) in Response to Soil Moisture Tension in Two Phenological Stages in Campeche, México

by
Benigno Rivera-Hernández
1,
Vianey González-Jiménez
1,
Eugenio Carrillo-Ávila
2,*,
René Garruña-Hernández
3,
José Luis Andrade
4,
Víctor Hugo Quej-Chi
2 and
Jesús Arreola-Enríquez
2
1
Universidad Popular de la Chontalpa, Carretera Cárdenas-Huimanguillo, km 2.0, Ranchería Invitab Paso y Playa, Heroica Cárdenas C.P. 86556, Tabasco, Mexico
2
Colegio de Postgraduados Campus Campeche, Carretera Federal Haltunchén-EdznaEdzná, km 17.5, Sihochac, Municipio de Champotón C.P. 24450, Campeche, Mexico
3
Instituto Tecnológico de Conkal, Av. Tecnológico S/N, Conkal C.P. 97345, Yucatán, Mexico
4
Centro de Investigación Científica de Yucatán, Calle 43 No. 130, Col. Chuburná de Hidalgo, Mérida C.P. 97205, Yucatán, Mexico
*
Author to whom correspondence should be addressed.
Water 2022, 14(7), 1011; https://doi.org/10.3390/w14071011
Submission received: 30 January 2022 / Revised: 11 March 2022 / Accepted: 16 March 2022 / Published: 22 March 2022
(This article belongs to the Section Water Resources Management, Policy and Governance)

Abstract

:
Sixteen irrigation treatments were applied on Persian lime, based on the combination of four soil moisture tensions (SMTs) used to define the start of irrigation: −10, −35, −60, and −85 kPa during the phenological stages (PSs) of flowering (FL) and fruiting (FR). Variables evaluated were, among others: leaf water potential (Ψ), leaf stomatal conductance (gs), fruit weight (FW), fruit juice content (FJC), total soluble solids in juice (TSS), fruit yield (FY), and water footprint (WF). Greater values on the Ψ and gs variables were observed in plants subjected to SMTs of −10 and −35 kPa (p < 0.05). The SMT of −85 kPa during FR produced a low FW value, while the lower SMTs in this PS increased it (p < 0.05). FY was greater in the treatments including −10 kPa or −35 kPa during either of the two PSs, with the exception of those with −85 kPa in one of the stages (p < 0.05). Lower FJC values were obtained at a SMT of −85 kPa in FR, and higher TSS values were observed in the two driest treatments (p < 0.05). The smallest WF values were observed in the −60 kPa FL and −60 kPa FR treatment (p ≤ 0.05). Irrigation management based on the SMT significantly affected almost all the response variables evaluated. It is recommended to irrigate the crop at a SMT of −35 kPa in FL and −60 kPa in FR, the treatment in which the greatest FW, FY, and FJC values and the lowest TSS and WF values were obtained (p < 0.05) and in which only 93 L of water was used by the trees to produce one kilogram of fruit (16% of the amount used in the treatment with the largest WF). The use of blue water is limited by its scarcity and high opportunity cost, an aspect that can be mitigated if blue water is used efficiently in Persian lime production systems, based on the results of this study.

1. Introduction

Citrus fruits are cultivated in around 140 countries in the world’s tropical and subtropical regions [1]. In 2018, Mexico was the top lime producer worldwide, with production of 2,533,176 t (13.7% of global production), of which 49% consisted of Persian lime [2]. In Mexico, over 65% of Persian lime production is obtained from humid tropical and subhumid subtropical zones, where an increase in the mean temperature has been observed in recent years, along with a reduction in the magnitude and a greater seasonal irregularity of rainfall [3]. This has increased incident solar radiation and vapor pressure deficit values [4], extending the dry season (February to May), meaning that the rains are not capable of meeting the crop’s water needs. As a result, the irrigated area cultivated with citrus in Mexico has increased by 46% over the past 16 years [5]. On the other hand, farmers generally lack the technology required for adequate irrigation water management during cultivation, meaning that scheduling the start and end of irrigations is based on subjective judgements, based solely on their practical experience and observation, or on the recommendations of studies carried out on other citrus species. Currently the information generated on the effect of irrigation on yield and fruit quality is very limited, and there are practically no estimates of the crop’s irrigation water use efficiency, virtual water content, or water footprint, which are important indicators for evaluating water use sustainability [6,7]. Furthermore, it is important to note that, to our knowledge, work has not been carried out on Persian lime related to estimating the physiological water use based on estimates of photosynthesis, which is important because it allows for a more precise explanation of productivity observed in irrigation treatments [8,9].
Irrigation is one of the most important agriculture management practices that benefit farmers [10]. Maximum water use efficiency depends on adequate irrigation scheduling [9]. Kandelous et al. [11] stated that irrigation scheduling based on soil moisture tension (SMT) is a precise method for studying the effect of water stress on crop growth and yield in situ. Several researchers have evaluated the effect of applying irrigations based on different SMT values in various crops [12], such as the studies carried out on potato (Solanum tuberosum) [13,14,15], banana (Musa AAA) [16], sweet corn (Zea mays) [17,18], rice (Oryza sativa) [19,20], sunflowers for flowers (Helianthus annuus) [21], sugar cane (Saccharum officinarum) [22], and habanero pepper (Capsicum chinense Jacq) [23], among others. In all of these works, the authors determined ranges of optimal SMT values for obtaining the greatest yields, and in some of them SMT ranges were defined that led to greater water use efficiency and a lower water footprint.
In the case of citrus, García-Sánchez et al. [24] stated that SMT values must be kept within −10 and −60 kPa, depending on the soil texture and growing conditions. The effect of different SMT levels can be evaluated more precisely by measuring physiological and fruit growth variables [8,9]. Chartzoulakis et al. [8] evaluated the effect of three soil moisture tension treatments on “Bonanza” oranges: −10, −50, and −1500 kPa. The authors found no statistical difference in virtually any of the assessed variables between the −10 and −50 kPa treatments, with significantly lower values observed in the −1500 kPa treatment. They concluded that moisture tension greater than −50 kPa can significantly reduce leaf photosynthetic rate, leaf water use efficiency, and also crop yield, and they recommend that irrigation scheduling for “Bonanza” oranges be done when SMT is at or slightly below −50 kPa for the vegetative, flowering, fruit set, and growth phases. The effect of three soil moisture tension treatments (−10 kPa, −35 kPa, and −85 kPa) on Persian lime trees was evaluated by Rivera-Hernández et al. [25]. Final crop yield and fruit size were statistically different in the three treatments, with higher values at lower soil moisture tension. Percentage of fruit juice content was statistically equal between the −10 and −35 kPa treatments, with values significantly higher than those observed in the −85 kPa treatment. Zermeño-González et al. [26] evaluated the application of three soil moisture tension treatments (−30 kPa, −50 kPa, and −70 kPa) as indicators of the onset of irrigation in Italian lemon (Citrus limon L.) without finding significant statistical differences in the fruit yield (t ha−1), fruit equatorial diameter (cm), and juice brix variables. These results suggest that a higher soil moisture tension should have been explored.
Microirrigation has an irrigation water use efficiency of between 70% and 95% [27]. However, different novel water management techniques have been explored in drip irrigation to further improve agricultural water use efficiency, notably including partial drying of the root area [28], reducing the percentage of wetted soil area [29], and reducing or suspending irrigation during phenological stages less sensitive to water deficit [30], as well as implementing crops in high sowing density by forming a group that reduces the water requirements of the crop without affecting yield per area [31]. These techniques are taking on increasing importance as a strategy for adapting to climate change, given that they reduce agricultural water use, simultaneously increasing the efficiency of its use and reducing the water footprint of agricultural products. The consequences of climate change on water resources for agricultural production mainly include: (i) increased water demand due to increased evapotranspiration of crops in response to increased temperatures and (ii) increased water shortages, particularly in spring and summer months, due to increased demand for irrigation water, especially in areas currently under water stress [32].
The effect of water deficit on citrus depends on the species and can vary considerably based on duration and severity, phenological stage, soil type, and other location-specific factors [33,34]. As far as the application of irrigation depending on the phenological stage is concerned, as a strategy for reducing the volume of water applied in citrus, González-Altozano and Castel [35,36] reported that in “Clemenules” trees the application of deficient irrigation in the flowering and fruit set period produced fruit drop on restarting irrigation when the restriction had been intense. The harvest suffered a reduction due to high flower and fruit drop, although without affecting fruit quality or caliber. During the initial fruit growth period, this management did not affect the fruit yield or quality and allowed for water savings of between 8% and 22%. Gasque et al. [37] applied restrictions of 40% to 60% of the normal irrigation dose in Navelina/Cleopatra during the initial fruit growth period and found that these restrictions did not affect fruit yield or weight, allowing for an increase in water use efficiency of between 14% and 27%.
Based on the above, the main aim of this work consisted of evaluating the effect of a combination of four soil moisture tensions on defining the start and the duration of irrigations (four SMT values for the phenological stage of flowering combined with four SMT values for the phenological stage of fruit fill) on the following groups of variables: (1) Leaf physiology: water potential before dawn (ΨLBD) and at midday (ΨLMD), relative water content (LRWC), net carbon assimilation rate (AN), stomatal conductance (gs), transpiration (LT), and water use efficiency (LWUE); (2) Fruit quality: mean weight (FW), size code (FSC), and juice content (FJC); (3) Fruit peel quality: thickness (FPT), presence of sun spots (FWSS), scarring (FWS), luminance (L*), color saturation (C*), and hue angle (h°); (4) Juice quality: total soluble solids (TSS), titratable acidity (TA), and TSS/TA ratio; (5) Yield and water use: yield (FY), leaf area index (LAI), irrigation water use efficiency (IWUE), total water use efficiency (TWUE), blue water footprint (BWF), green water footprint (GWF), and total water footprint (WF) in Persian lime established in high density sowing, a crop for which, to our knowledge, work related to quantifying the water footprint does not exist in the scientific literature. The hypothesis to be tested consisted of assuming that the application of irrigation performed, based on different soil moisture tension values during the phenological stages of flowering and fruit set (FL) and initial fruit growth (FR), affects the response variables listed above.

2. Materials and Methods

2.1. Site Location and Characteristics

The experiment was conducted from February to June 2019 in the experimental field of the Colegio de Postgraduados, Campeche Campus, Mexico, located at the coordinates 19°29′51″ N, 90°33′02″ W. An 18-year-old Persian lime (Citrus latifolia Tan.) plantation grafted onto bitter orange (Citrus aurantium L.), sowed in high density with rows of trees every 10 m and trees at 1.5 m between trunks (666 trees ha−1), irrigated by drip irrigation, was used to apply the treatments. Soil is classified as calcic vertisol according to the World Reference Base for Soil Resources [38], with a clayey texture (78–84% clay), a bulk density of 1.04 to 1.17 g cm−3, organic matter of 1.0% to 2.3%, and a pH of 6.53. The fertilization applied per plant at the start of the work was 450, 380, and 170 g of N, P, and K, respectively.

2.2. Soil Water Content (θ) and Soil Moisture Tension (h) Measurement

Volumetric moisture content (θ) of the soil profile was measured, next to the Persian lime trees, at 0.30 m depth using a time domain reflectometry (TDR) probe (IMKO, TRIME-IPH PICO-BT model) [39,40]. The soil moisture tension h was measured simultaneously using pressure gauge tensiometers (Irrometer©, model “R”, Riverside, CA, USA) installed also at 0.30 m depth. Details of the implementation of these measurements can be found in Rivera-Hernández et al. [41].

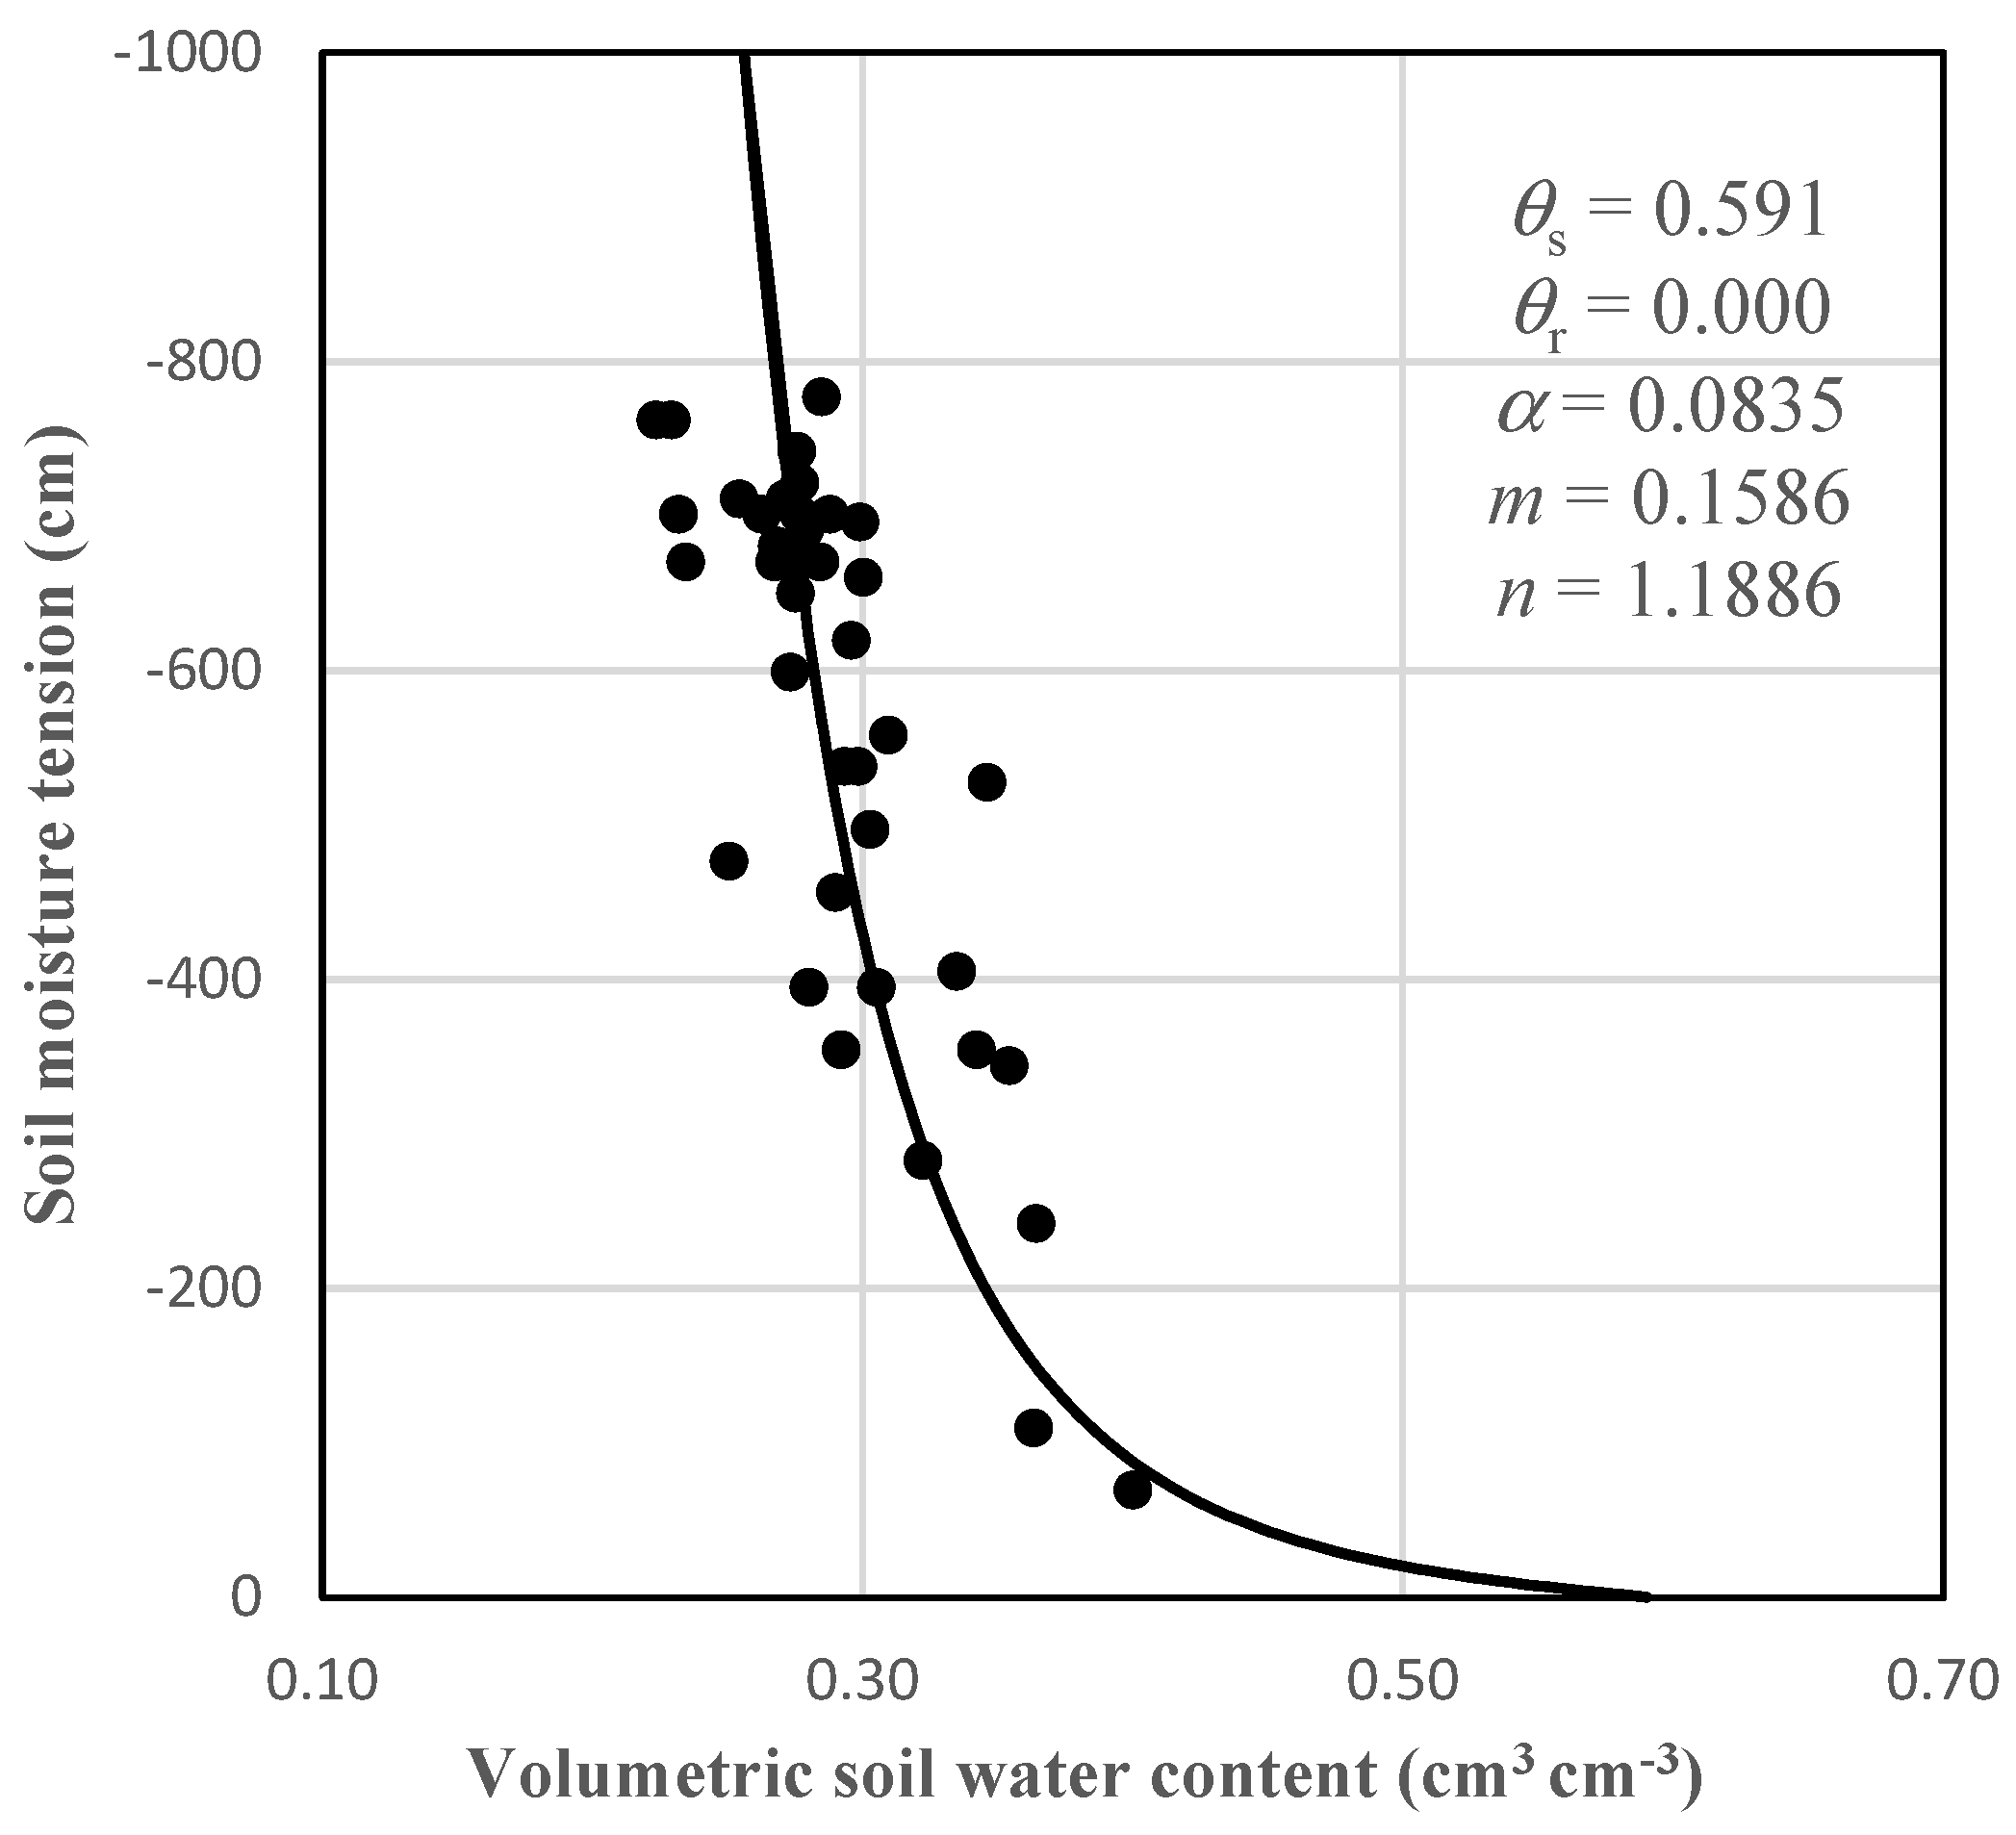
2.3. h(θ) Relationship

In order to establish the h(θ) relationship at 0.3 m soil depth, the equation proposed by van Genuchten [42,43] was adjusted to the pairs of values of h and θ:
θ ( h ) = θ r + θ s θ r [ 1 + ( α h ) n ] m
with:
m = 1 − 1/n
where θ is the volumetric soil water content (cm3 cm−3); θr is the volumetric residual water content (cm3 cm−3); θs is the saturated volumetric water content (cm3 cm−3); h is the soil moisture tension (cm); α is a model parameter (cm−1); n and m are the shape parameters (dimensionless).
The parameter θs was estimated based on the particle and bulk densities (the latter being determined with an Uhland type auger), being considered to be numerically equal to the soil porosity and calculated based on the mass–volume relationships of the soil. The other parameters in Equation (1) were adjusted using a non-linear regression technique according to the Levenberg–Marquardt algorithm [44] by minimizing the sum of the squares of the differences between the soil water content values observed and those estimated. The complete hydrodynamic characterization of the entire soil profile was carried out and is presented in Rivera-Hernández et al. [41].

2.4. Soil Moisture Tensions

In order to apply the irrigations, four soil moisture tensions were used—namely, −10, −35, −60, and −85 kPa—measured at a depth of 30 cm in the soil profile during two phenological stages of the trees: stage I (flowering and fruit set; FL) and stage II (initial fruit growth, FR). The soil moisture tensions were selected taking into account the results obtained by other authors in works on irrigation of citrus [8,25,26], while the evaluation in the two phenological stages stated above was performed based on the results of authors in previous works, which showed sensitivity to water stress in some citrus species during flowering and fruit growth [34,35,37,45,46].

2.5. Treatments and Experimental Units

The treatments evaluated were generated from the combination of the different soil moisture tensions in the two phenological stages, shown in Table 1. The experimental units (EUs) were composed of groups of six plants. In each row of trees, two drip tapes (with droppers every 30 cm and a flow rate of 0.42 L per dropper per hour, or 1.41 L per hour per meter of tape) were installed at a distance of 20 cm from the plant stem, with a drip tape on each side. To apply the irrigation treatments, individual valves installed in the irrigation system were used in each experimental unit, with which the start and end of irrigation was controlled. The moment for irrigation application was determined based on water tension in soil, corresponding to each treatment. To measure the soil moisture tension, a manometer tensiometer was installed near to the central trees of each experimental unit (Irrometer Model “R”, Riverside, CA, USA), whose porous cup was installed at a depth of 30 cm, approximately 30 cm from the nearest tree trunk and between the drip tapes. Soil moisture tension was measured daily at 8:00 a.m., and irrigations were started in each experimental unit when the tensiometer manometer reached the corresponding treatment value and ended when the manometer returned to zero. The amount of water was quantified by multiplying the flow rate of the tapes by the irrigation time of each experimental unit in each irrigation.

2.6. Experimental Design

A fully randomized complete block experimental design with three repetitions was used: 4 × (−10) kPa, 4 × (−35) kPa, 4 × (−60) kPa, 4 × (−85) kPa = 16 treatments per stage; 16 treatments × 3 repetitions = 48 experimental units (EU) per stage in total, 16 treatments per block (Table 1).

2.7. Variables Evaluated

2.7.1. Microclimatic Data

Throughout the entire experiment, an automated portable weather station (Onset HOBO U30-NRC-SYS-B. Tequipment. 205 Westwood Avenue. Long Branch, NJ, USA) was used to record global solar global radiation (GR, MJ m−2), temperature (°C), and relative air humidity (%) data every 10 min. The sensors were placed at the height of the tree canopy. These values were used to calculate the vapor pressure deficit (VPD).

2.7.2. Leaf Water Potential (ΨL) and Leaf Relative Water Content (LRWC)

Leaf water potential was measured before dawn (ΨLBD) at 6:00 a.m. and at midday (ΨLMD) at 13:00 p.m. using a “Scholander” pressure chamber (Model 600-EXP, Albany, OR, USA). To determine the leaf relative water content (LRWC), the leaf weight was measured (known as fresh weight, FW), and the leaves were then placed in distilled water for 12 h until they gained a constant weight (known as turgid weight, TW). The dry weight (DW) was determined by placing the leaves in an oven at 80 °C until a constant weight was achieved. The LRWC was estimated following the procedure used by Panigrahi et al. [47], using the formula
L R W C = F W D W T W D W × 100
where measurements were performed on 4-month-old leaves located in the middle third of the plant with a northern orientation on leaves exposed to the sun. Five leaves were evaluated per plant, and the four central trees of the experimental units corresponding to each treatment were measured.

2.7.3. Gas Exchange and Leaf Water Use Efficiency (LWUE)

Gas exchange parameters were only evaluated in the treatments with the same soil moisture tensions during the two phenological stages (T1, T3, T9, and T16; Table 1). The net carbon assimilation rate (AN), stomatal conductance (gs), and leaf transpiration (LT) were measured in the leaves with a portable photosynthesis system (LICOR LI-6400xt, Lincoln, NE, USA) equipped with a leaf chamber (6.0 cm2) and a red/blue light source (LED 6400-02B). The leaf water use efficiency was calculated as the ratio AN/LT (LWUE = AN/LT), similar to Panigrahi et al. [47]. Measurements were taken between 9:30 and 11:30 a.m. on 4-month-old leaves in a manner identical to the water potential determinations, also on 5 leaves per tree, on the four central trees of the experimental units corresponding to each treatment.

2.7.4. Leaf Area Index (LAI)

The leaf area index (LAI) was measured with a canopy area analyzer (LAI-2000 Plant Canopy Analyzer, PCA, Li-Cor, Lincoln, NE, USA). Because the high-density lime trees formed a dense hedge canopy pattern, 10 measurements were made in each experimental unit, both above and below the canopy, always keeping a distance of 30 cm between the instrument and the canopy.

2.7.5. Yield and Fruit Quality

The fruits of the four central trees of each experimental unit were harvested on four cutting dates (15, 22 and 29 May, 11 June) and were counted. The average fruit weight (FW, g) was quantified using a Mettler brand electronic scale (500 ± 0.001 g) on a sample of 50 fruits per experimental unit selected at random in each of the four harvests. In these same samples, the percentage of fruits with sun spots (FWSS) and the percentage of fruits with scarring on the surface (FWS) were determined. With the cumulative average fruit weight values from the four harvests, the yield was calculated (FY) per tree (kg tree−1) and per hectare (t ha−1) in each treatment and in each block. The fruits harvested in each experimental unit were classified in percentage terms by the size code of the Official Mexican Standard [48]. This code refers to the equatorial diameter of the fruit: code 1 (58–67 mm), code 2 (53–62 mm), and code 3 (48–57 mm), and they are reported as a percentage of fruit size code (FSC 1, FSC 2, and FSC 3, respectively).
Quality attributes were also determined, evaluated only in the first harvest and in fruits of size code one, one day after harvest, in a sample of 10 fruits per experimental unit: peel thickness (FPT; mm), measured in the equatorial zone of the fruit at three different points with a digital caliper; juice content in the fruit as a percentage (FJC; %), calculated using the ratio between the juice weight and the fruit weight; total soluble solids content (TSS, °Brix), determined directly by placing a drop of juice in a refractometer (PAL-1 Atago®, Tokyo, Japan); titratable acidity (TA), determined according to the Official Mexican Standard [49]; peel color, evaluated on three opposing sides around the equatorial region of each fruit, measuring luminance (L*), chroma (C*), and hue or color angle (h°) with a Minolta CR-400 colorimeter.

2.7.6. Water Use Efficiency

An estimate of the water use efficiency of each experimental unit was made with the following expression, similar to the ones used by Lu et al. [50], and Gutiérrez-Gómez et al. [23]:
I W U E = F Y I w
T W U E = F Y T w
where IWUE is irrigation water use efficiency (t ha−1 mm−1); FY is fruit yield (t ha−1); Iw is irrigation water depth applied (mm); TWUE is total water use efficiency (t ha−1 mm−1), and Tw is total water depth received by the crop (mm, irrigation plus rainfall)

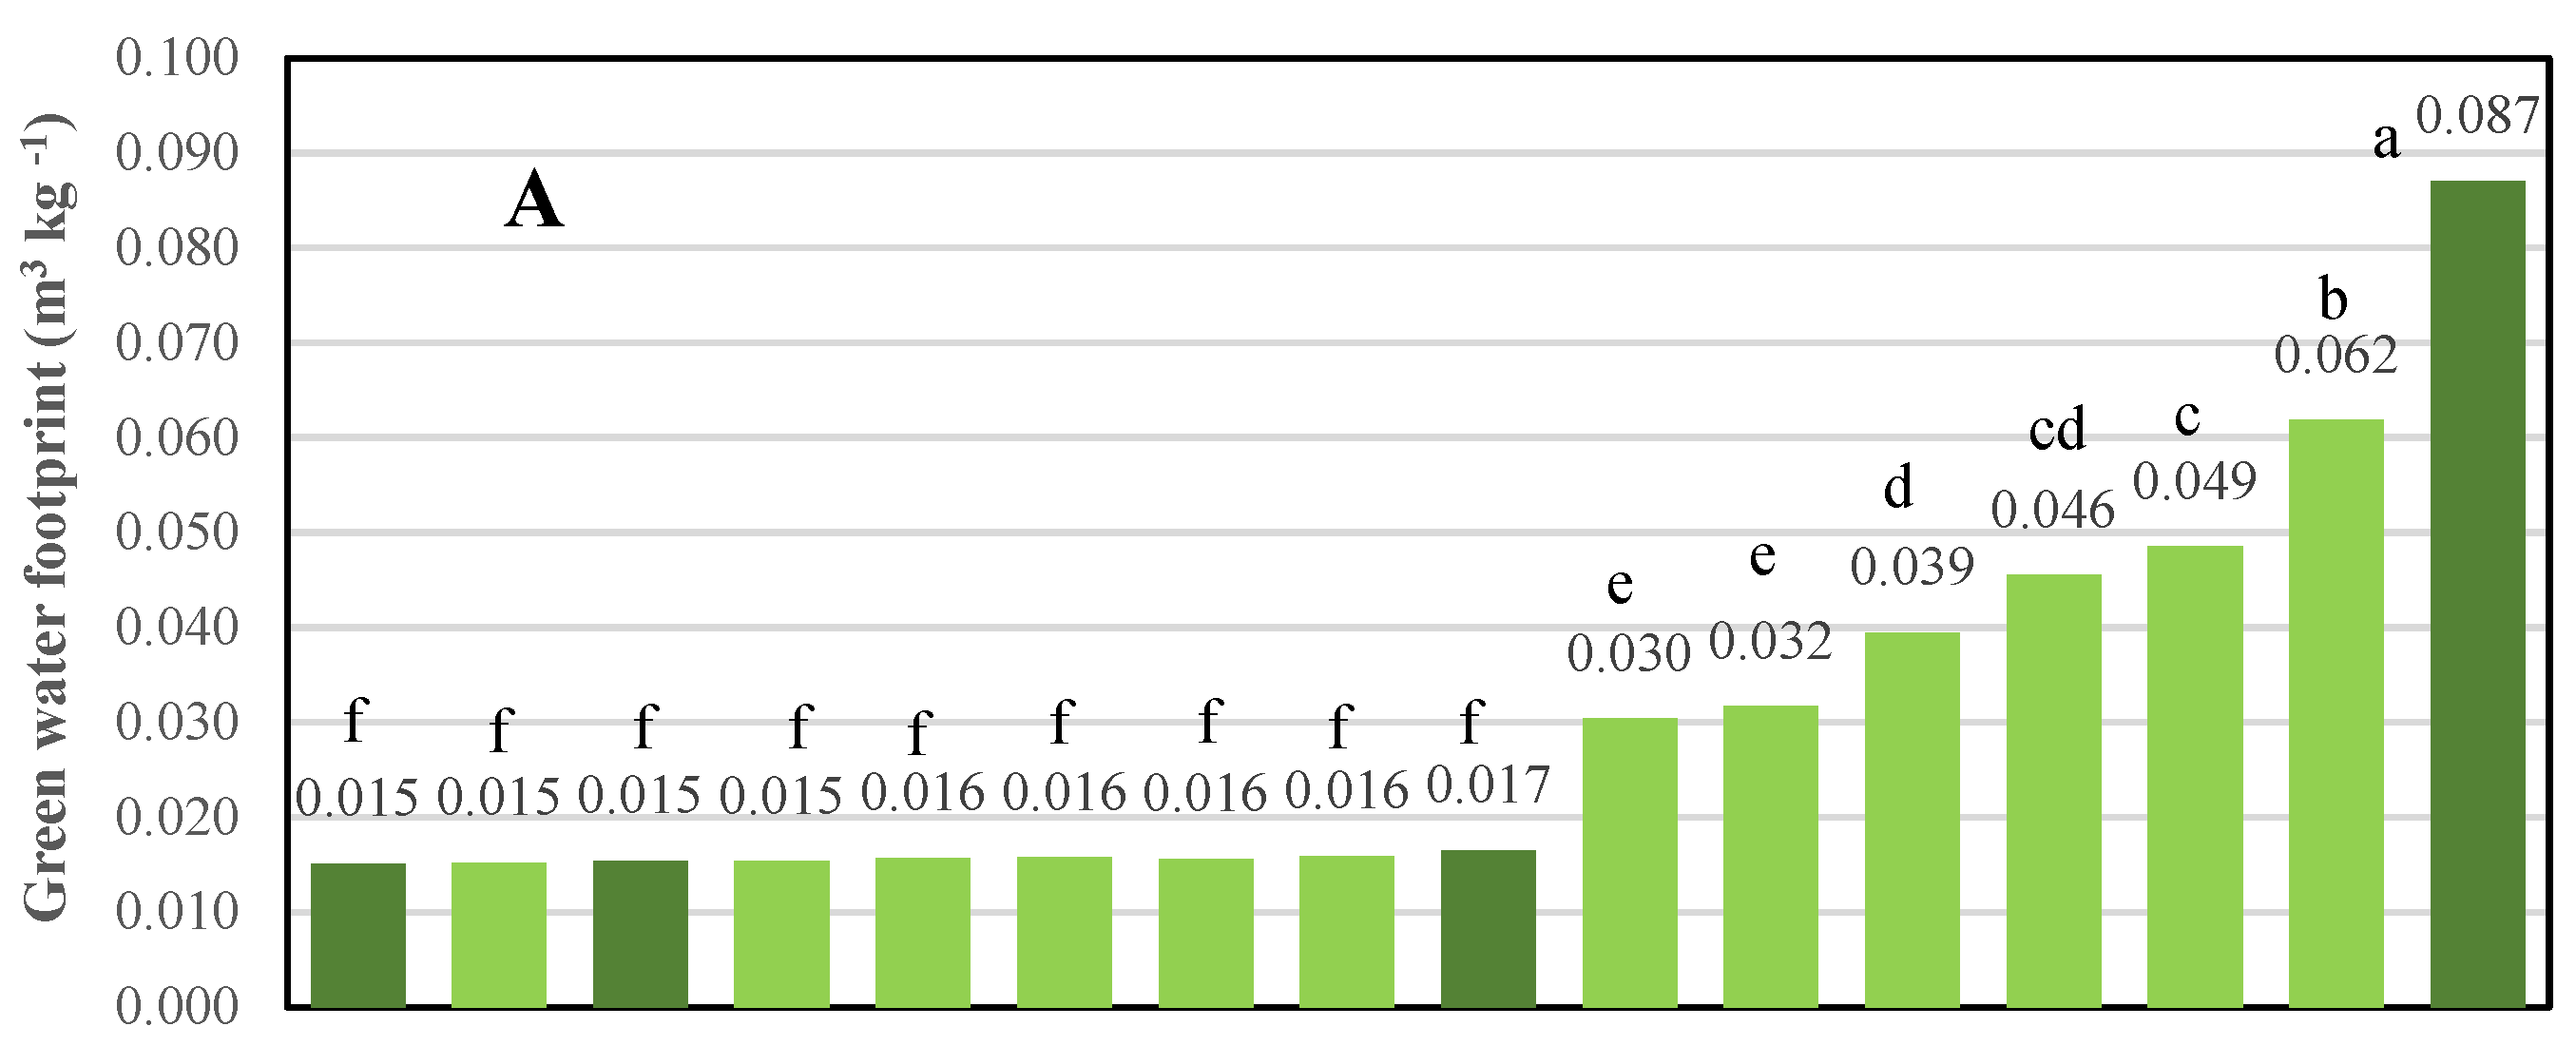
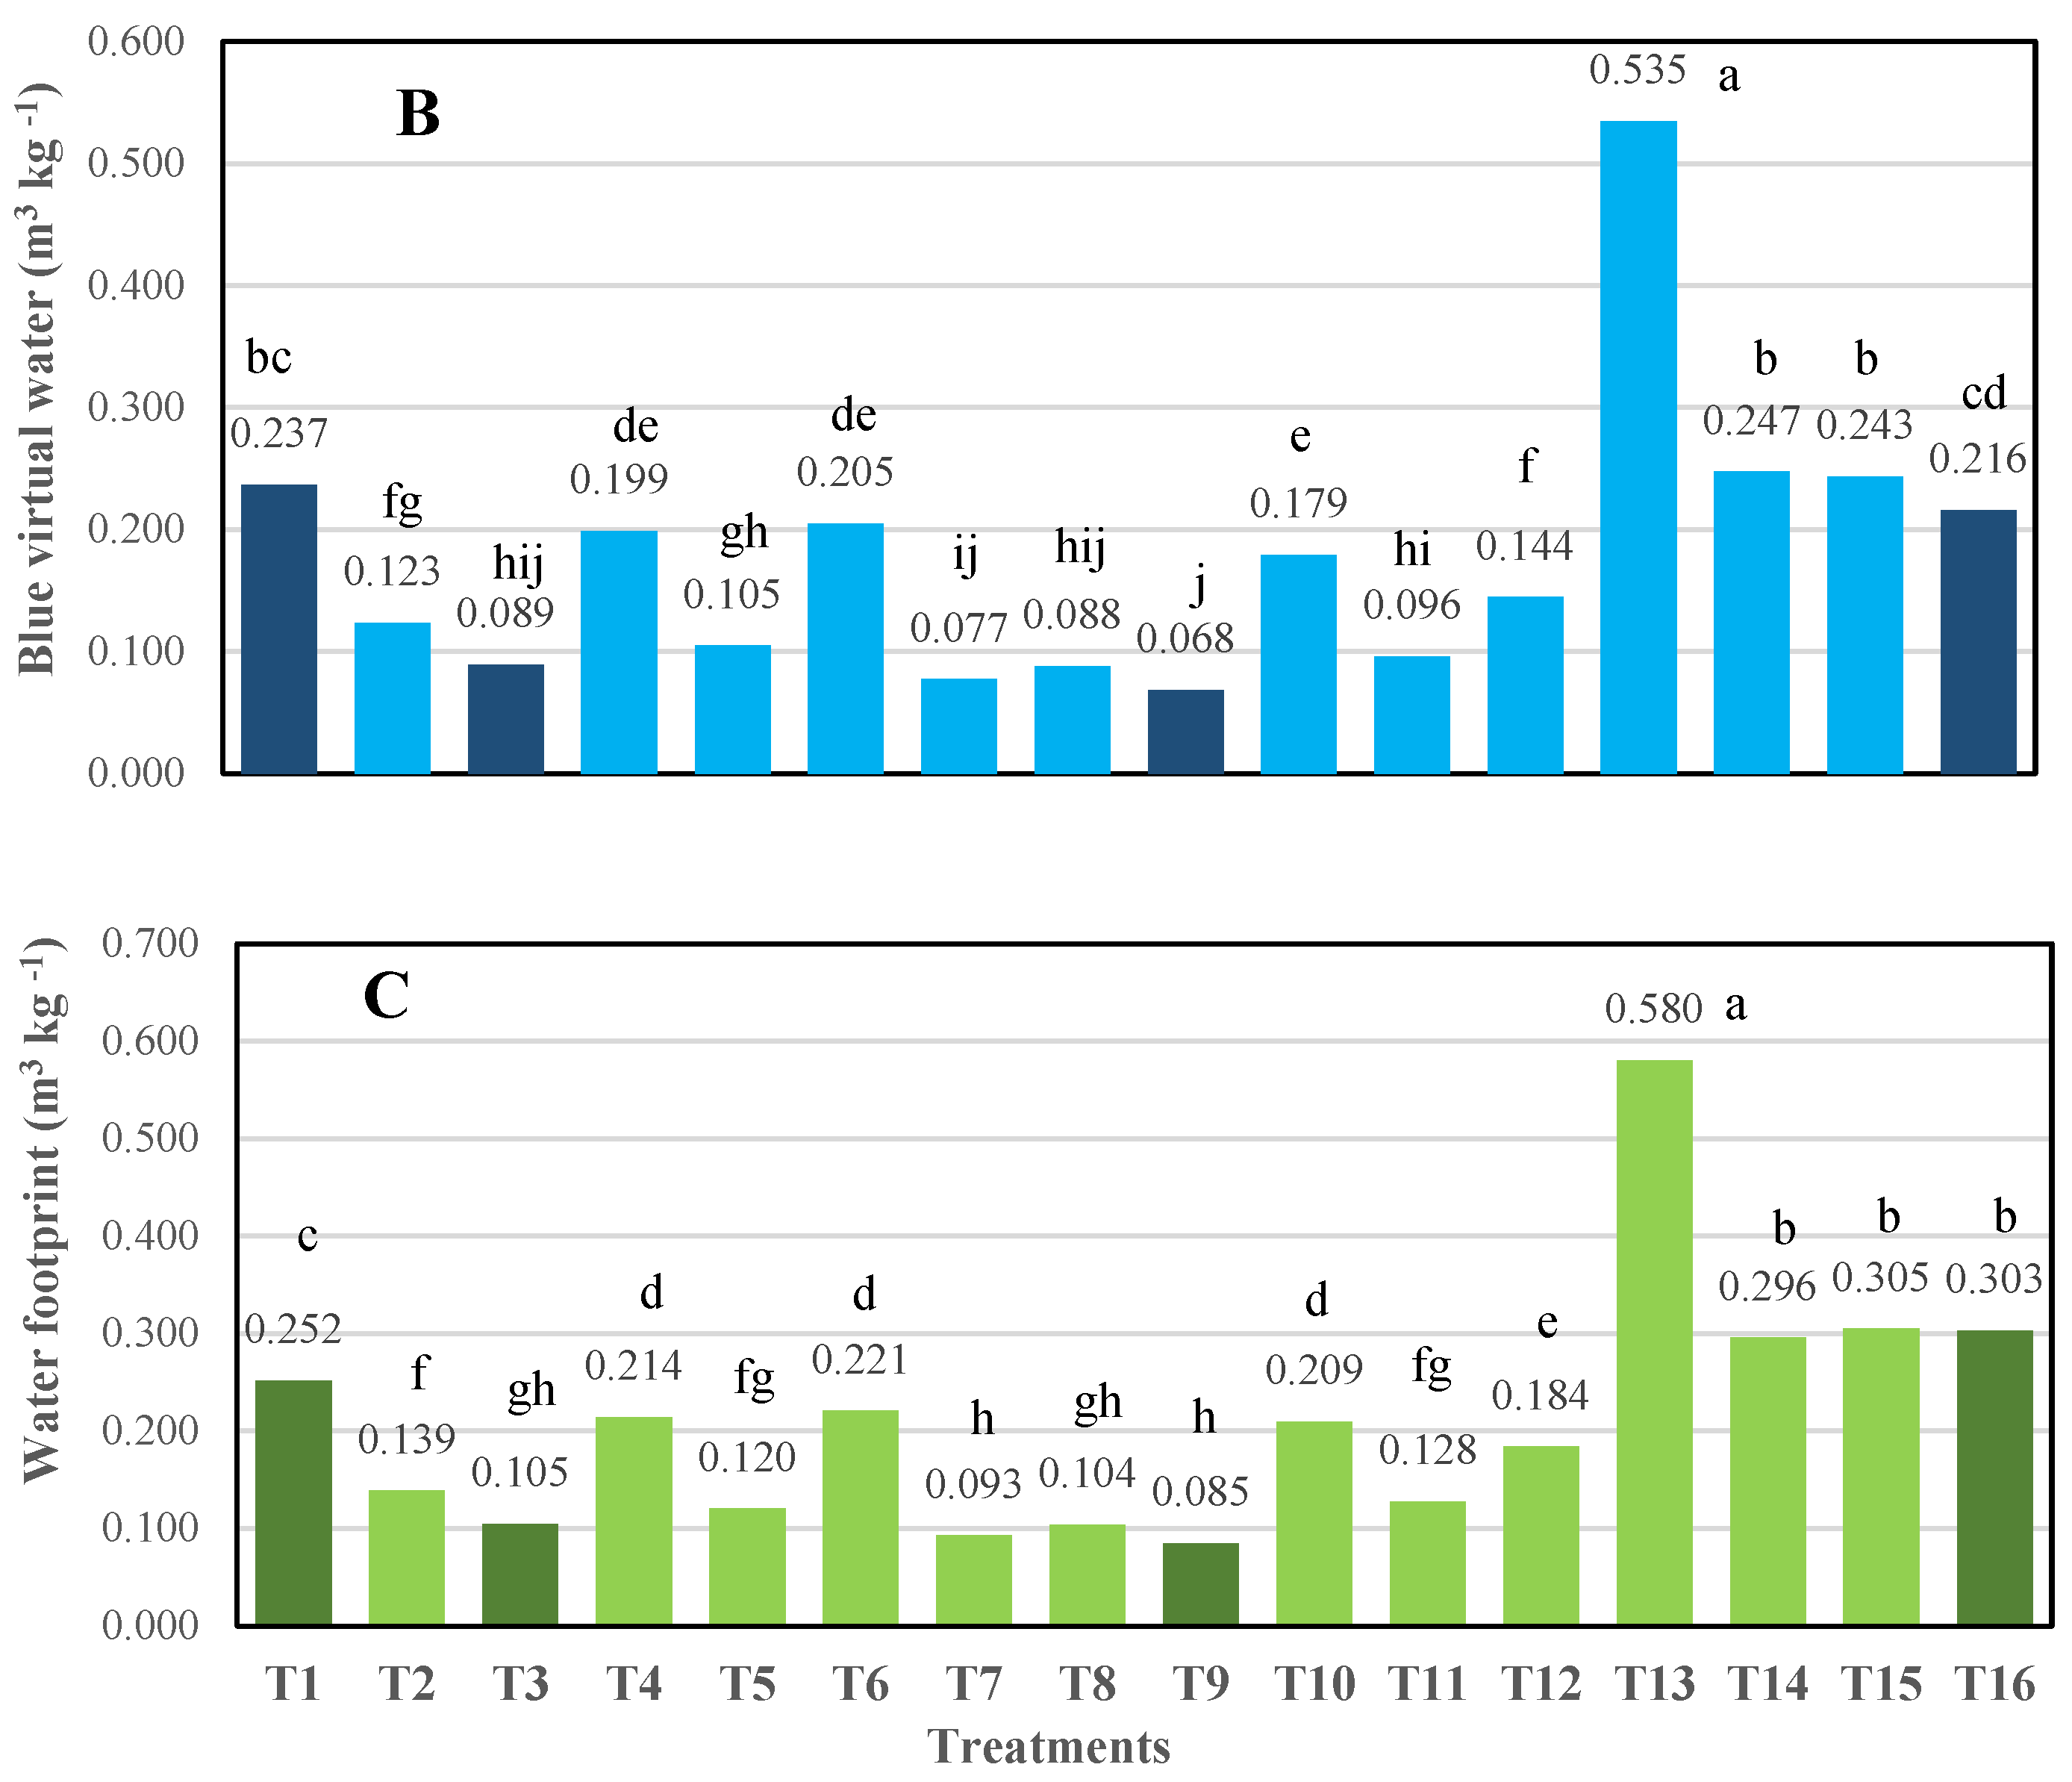
2.7.7. Water Footprint: Blue and Green

The water footprint (WF) or virtual water was estimated for each treatment based on the expression used previously by Sun et al. [7] and Gutiérrez-Gómez et al. [23]:
W F = T w F Y
where WF is water footprint (m3 kg−1); Tw is total water volume applied to the crop (m3 ha−1, irrigation plus rainfall), and FY is crop fruit yield obtained (kg ha−1).
The blue and green water footprint values were estimated with the following expressions [23]:
G W F = R F Y
B W F = I w F Y
where GWF is green water footprint (m3 kg−1); R is rainfall (m3 ha−1); BWF is blue water footprint (m3 kg−1), and Iw is irrigation water volume applied (m3 ha−1).

2.8. Statistical Analysis

Analysis of variance was performed of the randomized complete block design for all of the response variables, with a significance level of p = 0.05. In cases in which significant effects of the treatments were detected, the comparison of multiple means was performed with Tukey’s test (p = 0.05). The statistical analysis was performed with the program SAS V9.1.3 [51].

3. Results

3.1. h(θ) Relationship

The van Genuchten equation adapted well to the observed values, passing through the center of the set of points (Figure 1). The soil moisture characteristic curve provides information on the soil moisture content that corresponds to the different soil moisture tension values that were used to define the start of irrigation in the different treatments evaluated. The movement of water from the soil to the roots of Persian lime trees depends on the total soil water pressure potential, in which the soil moisture tension plays a major role when the soil water content is not very close to saturation. In Figure 1, the parameters of Equation (1) are included.

3.2. Microclimatic Data of the Study Site

Table 2 shows the microclimatic conditions present during the period when the experiment was conducted. The global radiation (GR), temperature (T), relative humidity (RH), vapor pressure deficit (VPD), and potential evapotranspiration (ETo) values are monthly averages, and the precipitation (R) values correspond to the amount of rainfall accumulated each month. The high GR values produced an increase in the average air temperature and therefore increased the VPD value, which led to greater atmospheric water demand. This was reflected in high ETo values, with greater accentuation in the months of April and May, in which precipitation was almost zero. Machado et al. [52] found that the ideal temperature for photosynthesis in Persian lime is around 25 °C and that VPD values of 1.5 to 3.5 kPa and temperatures greater than 28 °C promoted the partial closure of stomata, which causes a reduction in the photosynthetic rate.

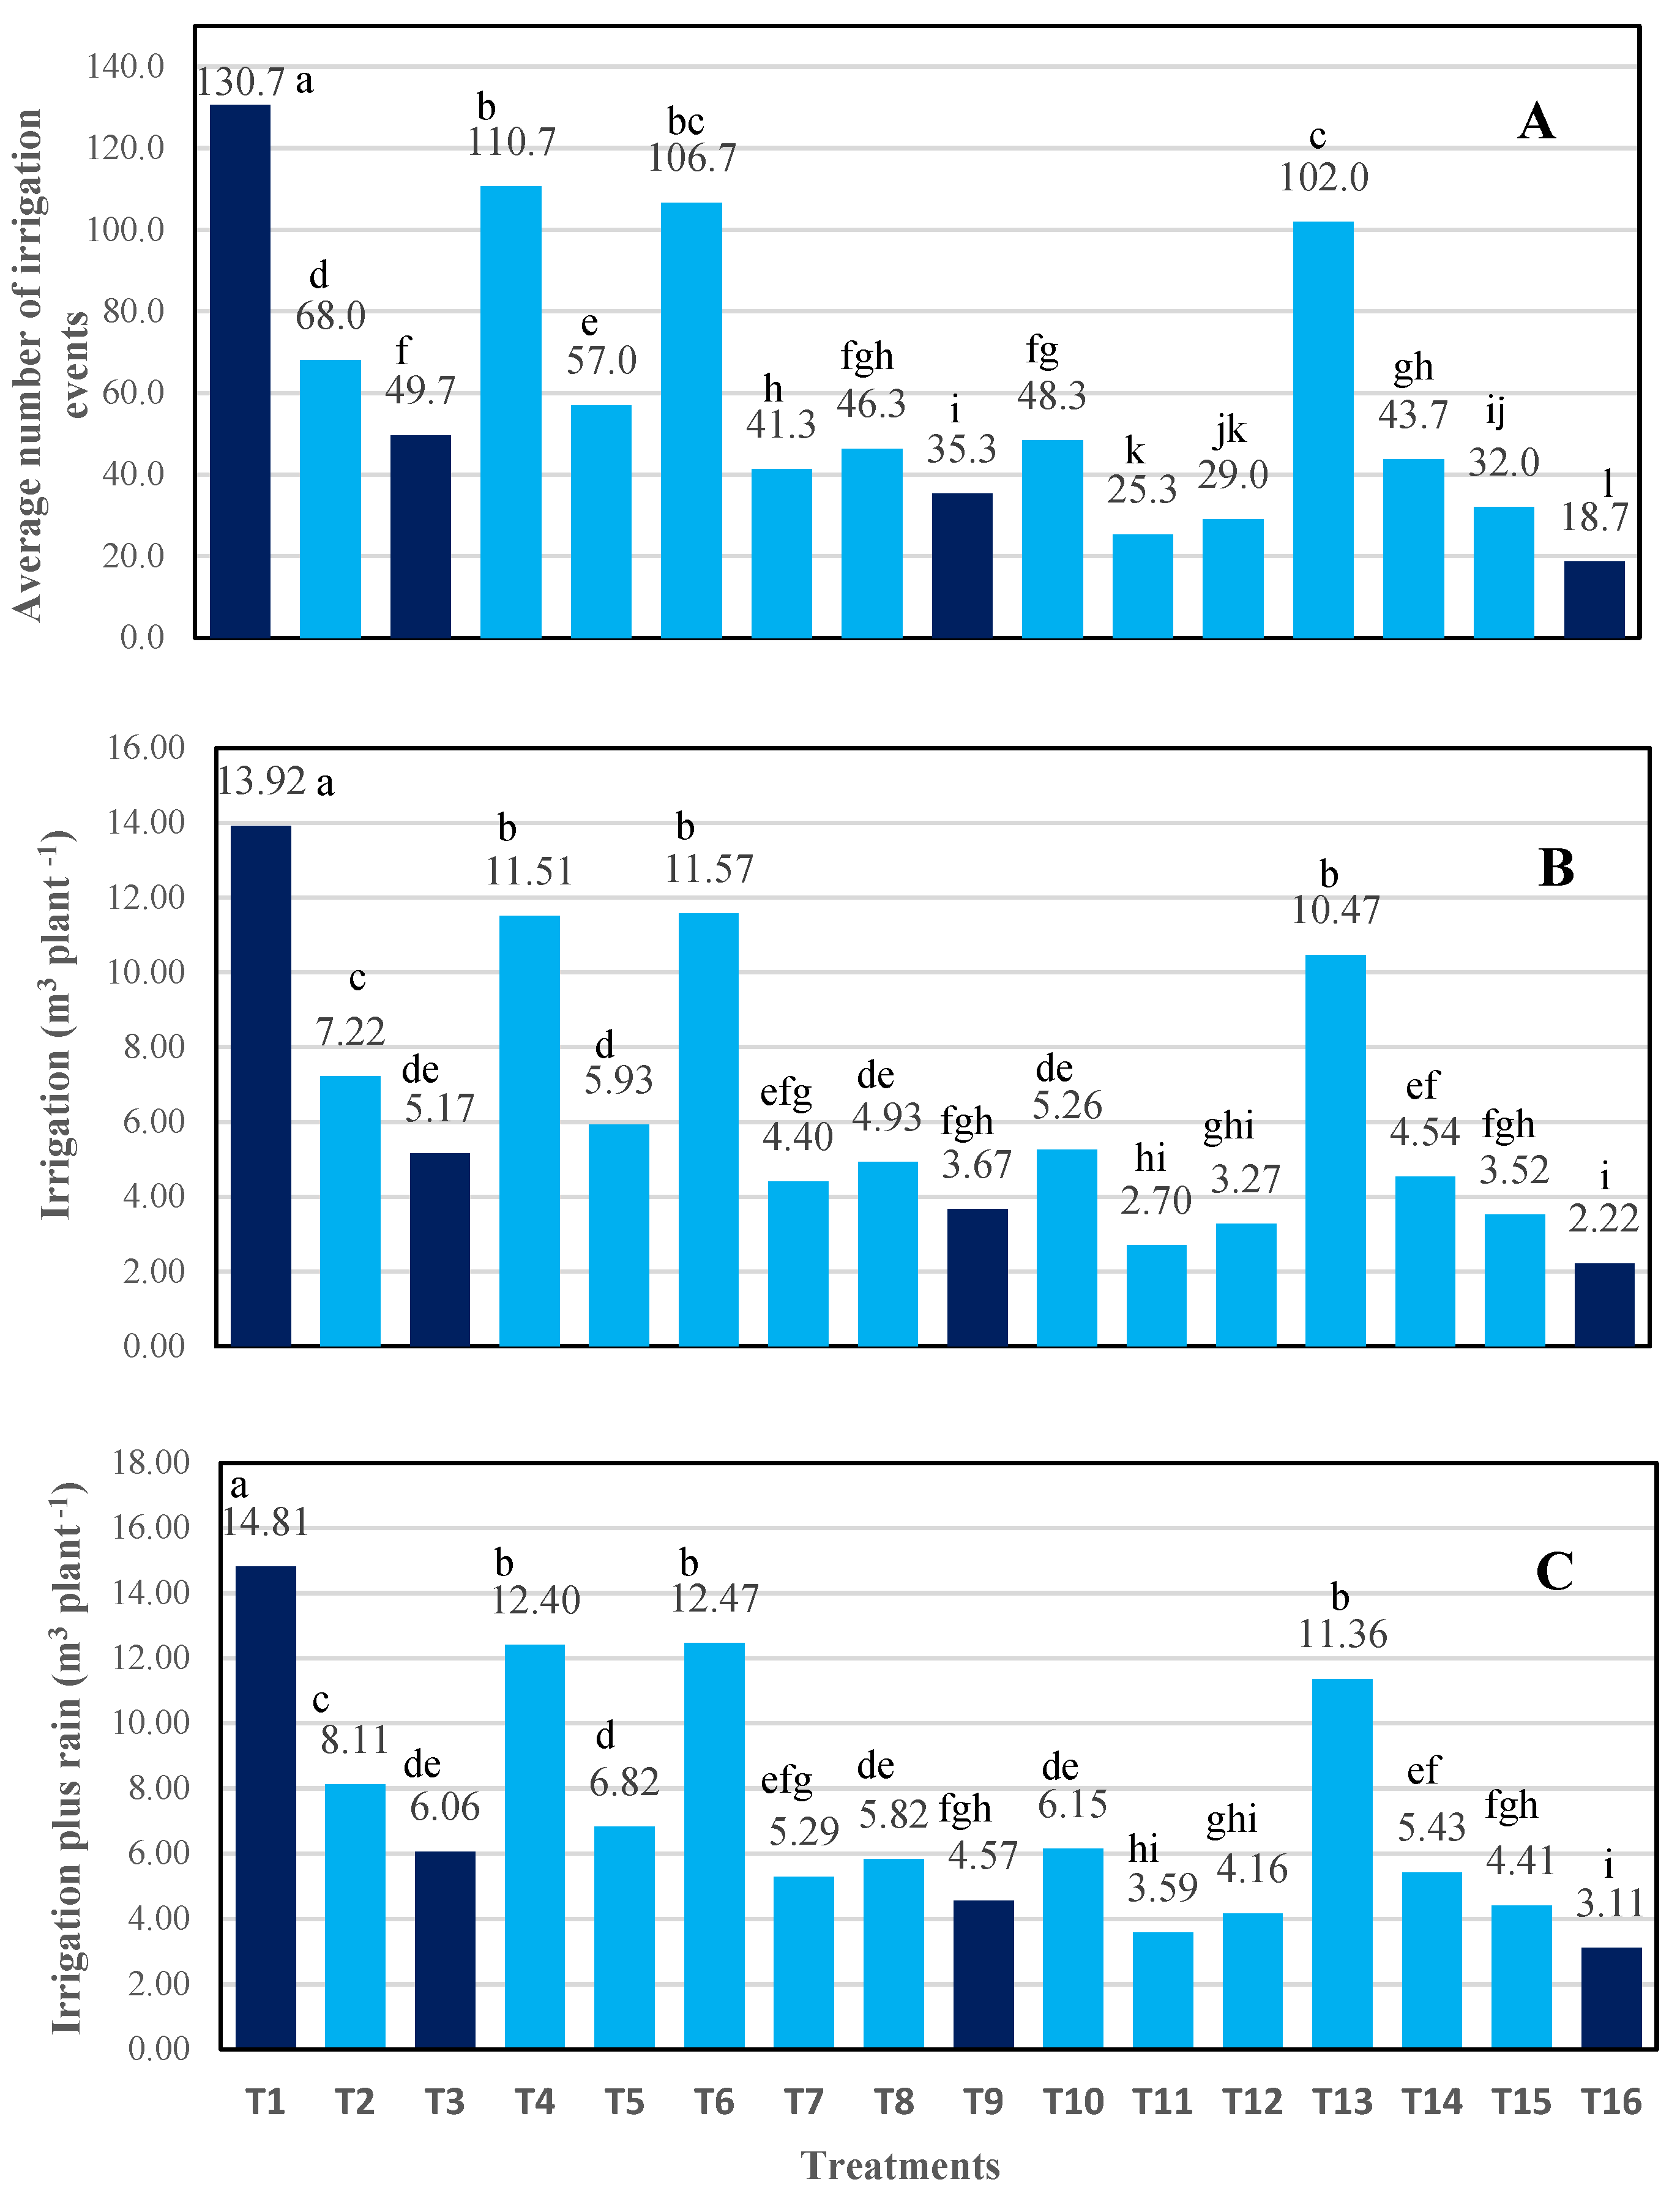
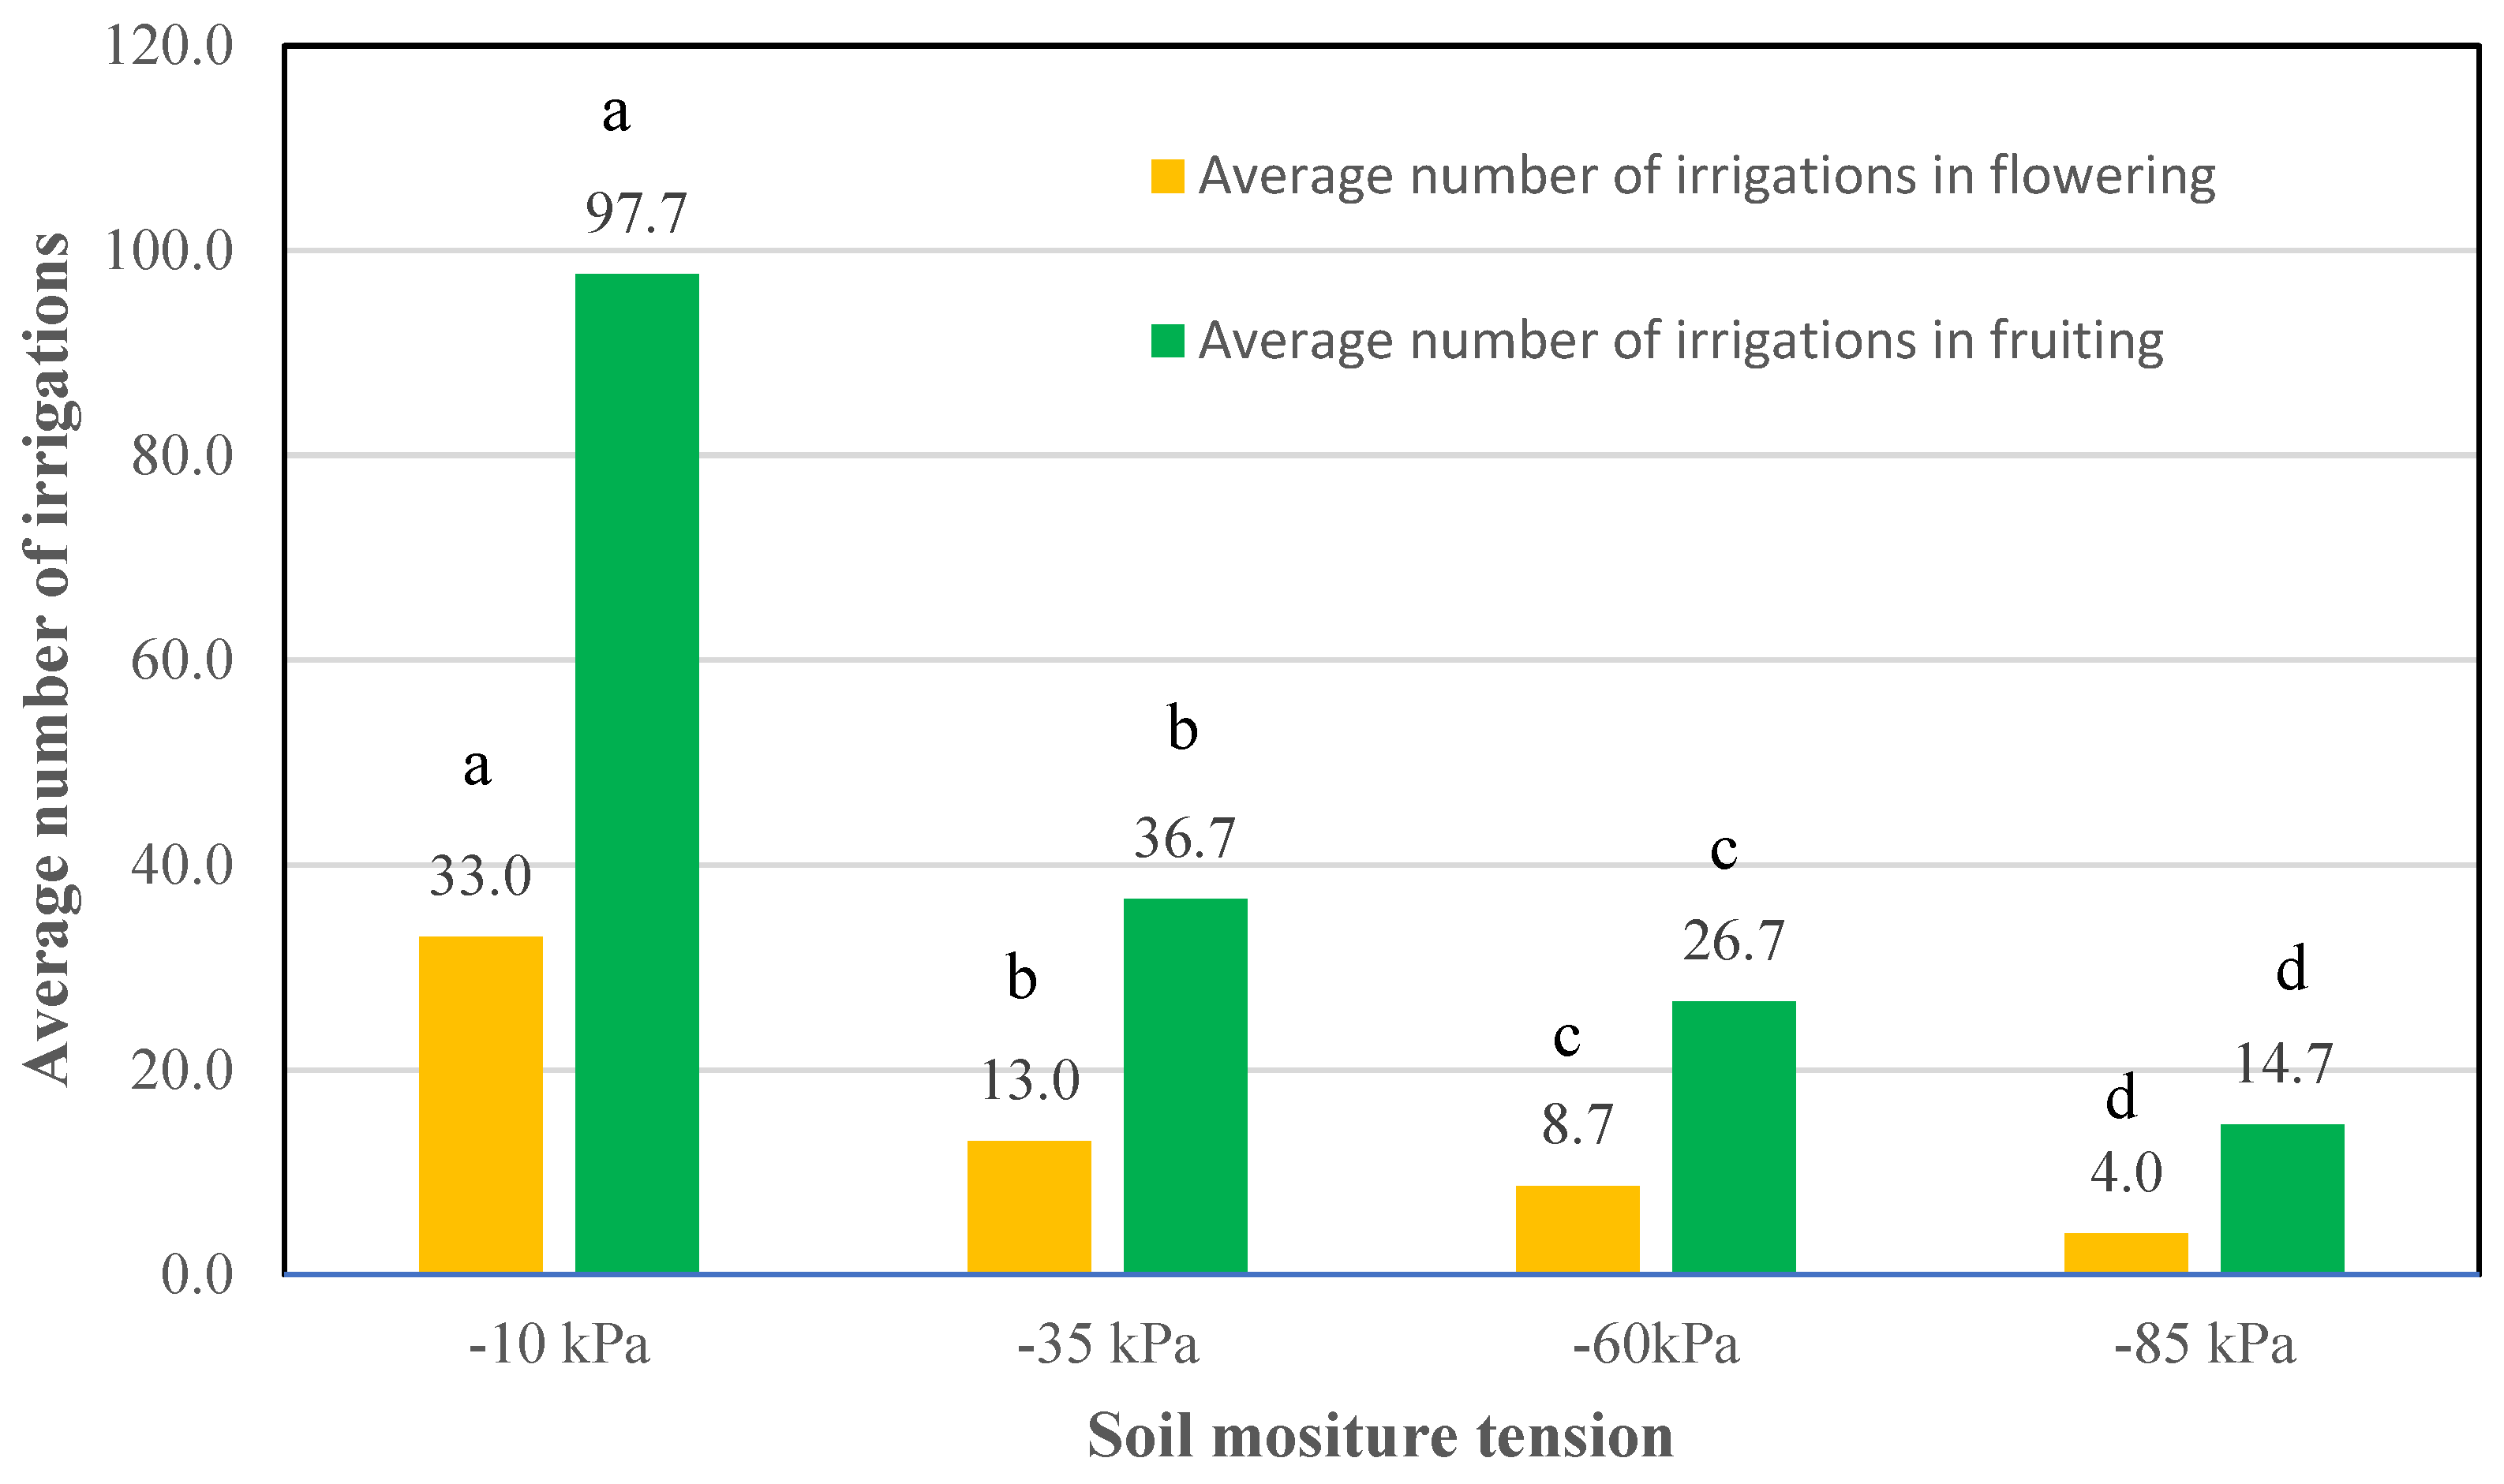
3.3. Number of Irrigations and Volume of Water Applied

The amount of water consumed by Persian lime trees in the different treatments was quantified in order to estimate the water use efficiency and water footprint values in each treatment (see Section 2.7.6 and Section 2.7.7). Figure 2 shows the average volume of irrigation water and the average total water volume (irrigation plus rainfall) that each tree received, as well as the average total number of irrigations for each treatment. The application of irrigations in each experimental unit was based on the soil moisture tension value in the flowering and fruit growth phenological stages, meaning that the number of irrigations applied varied and that different amounts of irrigation water were applied in each treatment. The number of irrigations in less moist treatments in which the same soil moisture tension was maintained in the two phenological stages (T3: −35 kPa FL, −35 kPa FR; T9: −60 kPa FL, −60 kPa FR; T16: −85 kPa FL, −85 kPa FR) were, respectively, 262.97%, 370.25%, and 698.55% lower than the treatment in which the soil was kept most moist (T1: −10 kPa FL, −10 kPa FR;) (Figure 2A).
The frequency of application of irrigations in these same treatments was one irrigation every 1 (T1), 2.3 (T3), 6.4 (T9), and 12.5 (T16) days, respectively, although these values may vary in other plantations depending on the site weather conditions and tree size. The trees in treatments T3, T9, and T16 received 269.24%, 379.29%, and 627.02% less water, respectively, than the trees in treatment T1 (Figure 2B). The same trend was maintained in total water applied (irrigation plus rainfall) (Figure 2C), although with slightly different values. Changing the SMT from the flowering to fruit growth phenological stage substantially reduced the number of irrigations and the volume of water applied in the treatments in which the SMT was increased from the first stage to the second (Treatments T2, T5, and T10 compared with T1; T7 and T12 compared with T3; and T11 compared with T9; Figure 2A,B). In contrast, in the treatments in which the SMT was reduced from the first stage to the second, the number of irrigations and the volume of water applied increased compared with the values of the first stage (T4 compared with T3; T6 and T8 compared with T9; and T13, T14 and T15 compared with T16).
Figure 3 shows the average number of irrigations in the treatments that maintained the same SMT in the flowering and fruit growth phenological stages (T1, T3, T9, and T16). The average number of irrigations applied during the flowering stage in treatments T3, T9, and T16 was, respectively, 256.69%, 370.45%, and 795.12% lower than the average number of irrigations in Treatment T1 (−10 kPa), while in the fruit growth stage the reduction in the average number of irrigations was 268.32%, 369.17%, and 621.51%, respectively, in the same order.

3.4. Leaf Water Potential and Relative Water Content, Gas Exchange, and Leaf Area Index

The leaf water potential before dawn (ΨLBD) was statistically similar (p ≤ 0.05) in the plants subjected to a SMT of −10 and −35 kPa (Table 3), with significantly greater values that exceeded the ΨLBD of the plants at −60 kPa by 19% and 12.9% and the ΨLBD of the plants at a SMT of −0.85 kPa by 35% and 30.3% (statistically lower than the value observed at −60 kPa), respectively. The leaf water potential at midday (ΨLMD) presented the same trend as ΨLBD, with values that were statistically similar in the wettest treatments and significantly different from the driest treatments, but in this case a reduction in the values of ΨLMD was observed in all treatments, with lower values observed in the plants subjected to soil moisture tensions of −60 kPa (−2.11 MPa) and −85 kPa (−2.78 MPa, statistically different from each other). This behavior observed in both ΨLBD and ΨLMD was related to the leaf relative water content (LRWC), such that the average values of this variable showed the same trend as the leaf water potential (Table 3). The leaves of the plants from the treatments at −10 kPa and −35 kPa had LRWC percentages that were statistically similar (p ≤ 0.05) but that were significantly greater than the LRWC of the trees maintained at −60 kPa by 7.85% and 6.52%, respectively, and greater than the LRWC of the plants at −85 kPa by 27.11% and 25.55%, respectively. The statistically higher ΨLBD, ΨLMD, and LRWC values at soil moisture tensions of −10 and −35 kPa are the result of greater irrigation frequency and the greater volume of water applied.
The carbon assimilation rate (AN) was statistically similar (p ≤ 0.05) among treatments with soil moisture tensions of −10, −35, and −60 kPa, with values significantly higher by 125.1%, 127.9%, and 118.2%, respectively, than the values measured at −85 kPa (Table 3). Stomatal conductance (gs) showed the same behavior as the variables ΨLBD, ΨLMD, and LRWC: it was statistically equal (p ≤ 0.05) in soil moisture tensions of −10 and −35 kPa, with values statistically greater by 32.4% and 35.3% than those observed at −60 kPa and significantly greater by 66.7% and 70.4% than those measured at −85 kPa, respectively. In this last treatment, a statistically lower value was observed (Table 3). Leaf transpiration (LT), as a result of the behavior of the previous variables, also showed a similar behavior: it was greater at soil moisture tensions of −10 and −35 kPa (0.88 and 0.83 mmol H2O m−2 s−1, respectively), values that were found to be statistically equal (p ≤ 0.05) and which significantly exceeded the values observed in the −60 kPa treatment (0.781 mmol H2O m−2 s−1) by 15.8% and 9.2%, respectively, and greater than those measured in the −85 kPa treatment (0.572 mmol m−2 s−1) by 54.4% and 45.6%, respectively (Table 3). In contrast, leaf water use efficiency (LWUE) was greater in trees maintained at soil moisture tensions of −60 and −35 kPa, with statistically equal values in the two treatments, which exceeded the values recorded in the −10 kPa treatment (3.65 μmol CO2/mmol H2O) by 12.33% and 7.40%, respectively, and greater than the values observed in the −85 kPa treatment (2.51 μmol CO2/mmol H2O) by 63.35% and 56.18%, respectively (Table 3). The highest value on the LWUE variable was observed in the −60 kPa treatment because the value of AN reduced more slowly than LT when the SMT value increased. On the other hand, a downward trend was observed in the leaf area index of 11.69%, 20.30%, and 38.15% as the SMT went from −10 to −35, −60, and −85 kPa, respectively (Table 3).
It is important to note that on the ΨLBD, ΨLMD, LRWC, gs, and LT variables, the values observed in the −10 and −35 kPa SMT treatments were statistically equal, with significantly higher values than those observed in the −60 kPa treatment, which in turn were statistically greater than those recorded in the −85 kPa treatment. This behavior clearly denotes the effect that SMT has on the physiological behavior of Persian lime plants and allows us to affirm that soil moisture tensions of −60 kPa and greater affect photosynthetic processes by significantly reducing the leaf water potential and relative water content, as well as stomatal conductance, and therefore the transpiration rate of the crop. Significantly lower values of AN were only found when the SMT reached −80 kPa.

3.5. Yield and Fruit Production

Average fruit weight (FW, g), fruit yield per tree (FWT, kg plant−1), and total fruit yield (FY, t ha−1) showed significant differences (p ≤ 0.05) in response to the SMT treatments depending on the phenological stage (Table 4). Average fruit weight was statistically equal in all treatments that included tensions of −10 kPa, −35 kPa, and −60 kPa in their different combinations during the two phenological stages (Treatments T1 to T9; Table 4). Notably, the change in SMT from −10 kPa, −35 kPa, or −60 kPa in the FL stage to −85 kPa during the fruit growth stage caused a significant reduction in average fruit weight (Treatments T10, T11, and T12; Table 4). The same occurred when the SMT was maintained at −80 kPa in the FL stage, and it was changed to −10 kPa, −35 kPa, or −60 kPa in the fruit growth stage (Treatments T13, T14, and T15; Table 4). The treatment with a fixed SMT of −85 kPa in both stages presented the lowest average fruit weight value of all of the treatments evaluated. The change from a SMT of −85 kPa in flowering to −10 kPa, −35 kPa, or −60 kPa during fruit growth significantly increased average fruit weight compared with the fixed −85 kPa treatment, but none of these cases managed to statistically equal the average fruit weight value observed in the treatments with lower soil moisture tensions.
With regard to the FWT (kg plant−1) and FY (t ha−1) variables, they showed greater statistically equal values (p ≤ 0.05) in all fixed and combined treatments that included a SMT of −10 kPa or −35 kPa during either of the two phenological stages (Treatments T1 to T7; Table 4), except for the combinations that included a soil moisture tension of −85 kPa in one of the stages. In treatment T9 (fixed at −60 kPa in the two phenological stages), as well as the rest of the treatments in which the soil moisture tension was maintained at −85 kPa in either of the two stages, the values were found to be statistically lower. The FWT values in the treatments in which the soil moisture tension was kept fixed at −10 kPa, −35 kPa, and −60 kPa (T1, T3 and T9) in the two phenological stages were reduced by 50.11%, 51.48%, and 53.63% in the treatments in which the soil moisture tension was changed from −10 kPa, −35 kPa, and −60 kPa during the flowering stage to −85 kPa in the fruit growth stage (Treatments T10, T12, and T11), while the FY was reduced by 46.75%, 49.44%, and 47.26%, respectively, in those same treatments. These results show that the availability of water in the soil during the fruit growth stage is very important for fruit fill and the yield of the plantation. On the other hand, significantly lower values were observed on these same variables when the SMT was maintained at −85 kPa during the flowering stage, with the value statistically lower in the treatment at −85 kPa in both stages (T16; Table 4). The change from −85 kPa in the flowering stage to −10 kPa, −35 kPa, and −60 kPa in the fruit growth stage increased FWT by 90.55%, 78.77% and 40.79%, respectively, compared with the value obtained in T16, while FY increased by 103.07%, 106.43%, and 43.13%, respectively, in those same cases. Nevertheless, the increases did not statistically equal the yield and production obtained in the lowest soil moisture tensions and their combinations. The lack of moisture in the soil during the flowering stage may have influenced flower set and fruit formation.

3.6. Physicochemical Variables and Fruit Quality

The treatments with soil moisture tension values of −10 and −35 kPa during the flowering stage and with values of up to −60 kPa during the fruit growth stage presented the greatest percentage of largest-diameter fruits (FSC 1) and were statistically similar (p ≤ 0.05), with significantly higher values than the percentage of FSC 1 fruits obtained in the treatments maintained at −60 kPa in the flowering stage or at −85 kPa in either of the two phenological stages (T10 to T16; Table 4). In contrast, the treatments in which the SMT was maintained at −85 kPa during the flowering stage presented significantly greater values in the percentage of caliber 2 fruits (FSC 2), with the exception of treatment T16 (−85 kPa FL, −85 kPa FR). In this last treatment, a statistically greater value was obtained in the percentage of fruits with caliber 3 diameters (with smaller diameter, FSC 3) compared with the rest of the treatments (Table 4).
In this treatment, statistically greater values (p ≤ 0.05) were also found in the percentage of physical damage of fruits with sun spots (FWSS), in the percentage of fruits with surface scarring (FWS), and in fruit luminance (L*) and fruit chroma or color saturation (C*) (Table 5). The physical damage can be attributed to the lower LAI value presented by trees in the driest treatment (Table 3). Leaf area acts as a physical barrier that prevents fruits from colliding with branches and thorns when it is windy. Significantly lower values on the FWSS and FWS variables were observed in all treatments in which a soil moisture tension of −10, −35, or −60 kPa was maintained in either or both of the two phenological stages (T1 to T8), except for treatment T9, which was maintained at −60 kPa during the two phenological stages (Table 5).
The trees from the treatments that were maintained at a SMT of −85 kPa during the fruit growth stage, regardless of the moisture tension that they were subjected to during the flowering stage, produced fruits with a significantly lighter peel color (higher L* values), including the trees subjected to treatment T15 (−85 kPa FL, −60 kPa FR). The fruits harvested in the other treatments (SMT of −10, −35, or −60 kPa in either of the two phenological stages, plus treatments T13 and T14) presented a darker peel color (lower L* values). On the other hand, trees subjected to the treatments in which the SMT was maintained at −60 or −85 kPa during the fruit growth stage, regardless of the SMT used in the flowering stage (T5, T7, T9, T10, T11, T12, T15, and T16), presented a significantly brighter color (higher C* value) compared with the fruits harvested in the rest of the treatments (Table 5). Significantly higher fruit peel hue values (h°) were presented by the trees where the SMT was maintained at −10, −35, or −60 kPa in either of the two phenological stages (T1 to T9), including treatments T13 (−85 FL, −10 FR) and T14 (−85 FL, −35 FR), in which the trees were subject to low soil moisture tensions during the fruit growth stage. In the rest of the treatments, in which the SMT was maintained at −85 kPa in this stage (T10, T11, T12, and T16, including T15: −85 FL, −60 FR), significantly lower hue values were observed, which were associated with a less green peel color (Table 5). These results suggest that a high soil moisture tension applied to lime trees during the fruit growth stage (greater than −60 kPa) results in a significant increase in the hue (h°) of the fruit peel.
Juice content (FJC) was significantly greater (p < 0.05) in the treatments in which low soil moisture tensions (−10, −35, and −60 kPa) were applied in both phenological stages. In Table 6 it can be seen that juice formation in fruits is strongly influenced by the SMT applied during the fruit growth stage: significantly lower values were obtained on this variable in the treatments in which a SMT of −85 kPa was applied in this stage (T10, T11, T12, T16), including in T15, in which a SMT of −85 kPa was applied in the flowering stage and −60 kPa in the fruit growth stage. This result was to be expected, given that the juice is formed in the fruits in this last phenological stage. The FJC value in treatment T16, in which a SMT of −85 kPa was applied in both phenological stages, did not meet the minimum juice content requirement in fruits (42%) set by the Official Mexican Standard [48] for export fruits. The fruit peel thickness (FPT) was not affected statistically by the SMT treatments, although the highest values were observed in the treatments where a SMT of −85 kPa was maintained in either of the two phenological stages (Table 6). In the variables defining juice quality (TSS, TA, and TSS/TA ratio), significant differences between the treatments were only detected on the TSS variable (p < 0.001). The treatments in which soil moisture tensions greater than −60 kPa were applied in the flowering or in the fruit growth stages (T11, T15, and T16) presented significantly greater TSS values compared with the rest of the treatments (Table 6). For this variable, the Official Mexican Standard [48] sets a minimum value of 6.8 °Brix, and this value was exceeded by all of the treatments evaluated. With regard to the TA variable, the Official Mexican Standard [48] mandates that this value must not be less than 7% citric acid for export fruits, and this value was exceeded by the majority of treatments except for T1, T2, and T5, in which the SMT was maintained at −10 kPa in the flowering stage, plus treatment T4 (−35 kPa FL, −10 kPa FR; Table 6).
This result suggests that a very low soil moisture tension during the flowering stage can induce low citric acid content percentages in fruit. The TSS/TA ratio was not statistically affected by the SMT changes evaluated, but the value observed in treatment T16 (−85 kPa FL, −85 kPa FR) is very close to the limit set as the maximum for good quality Persian lime fruit, which is 1.5 [53].

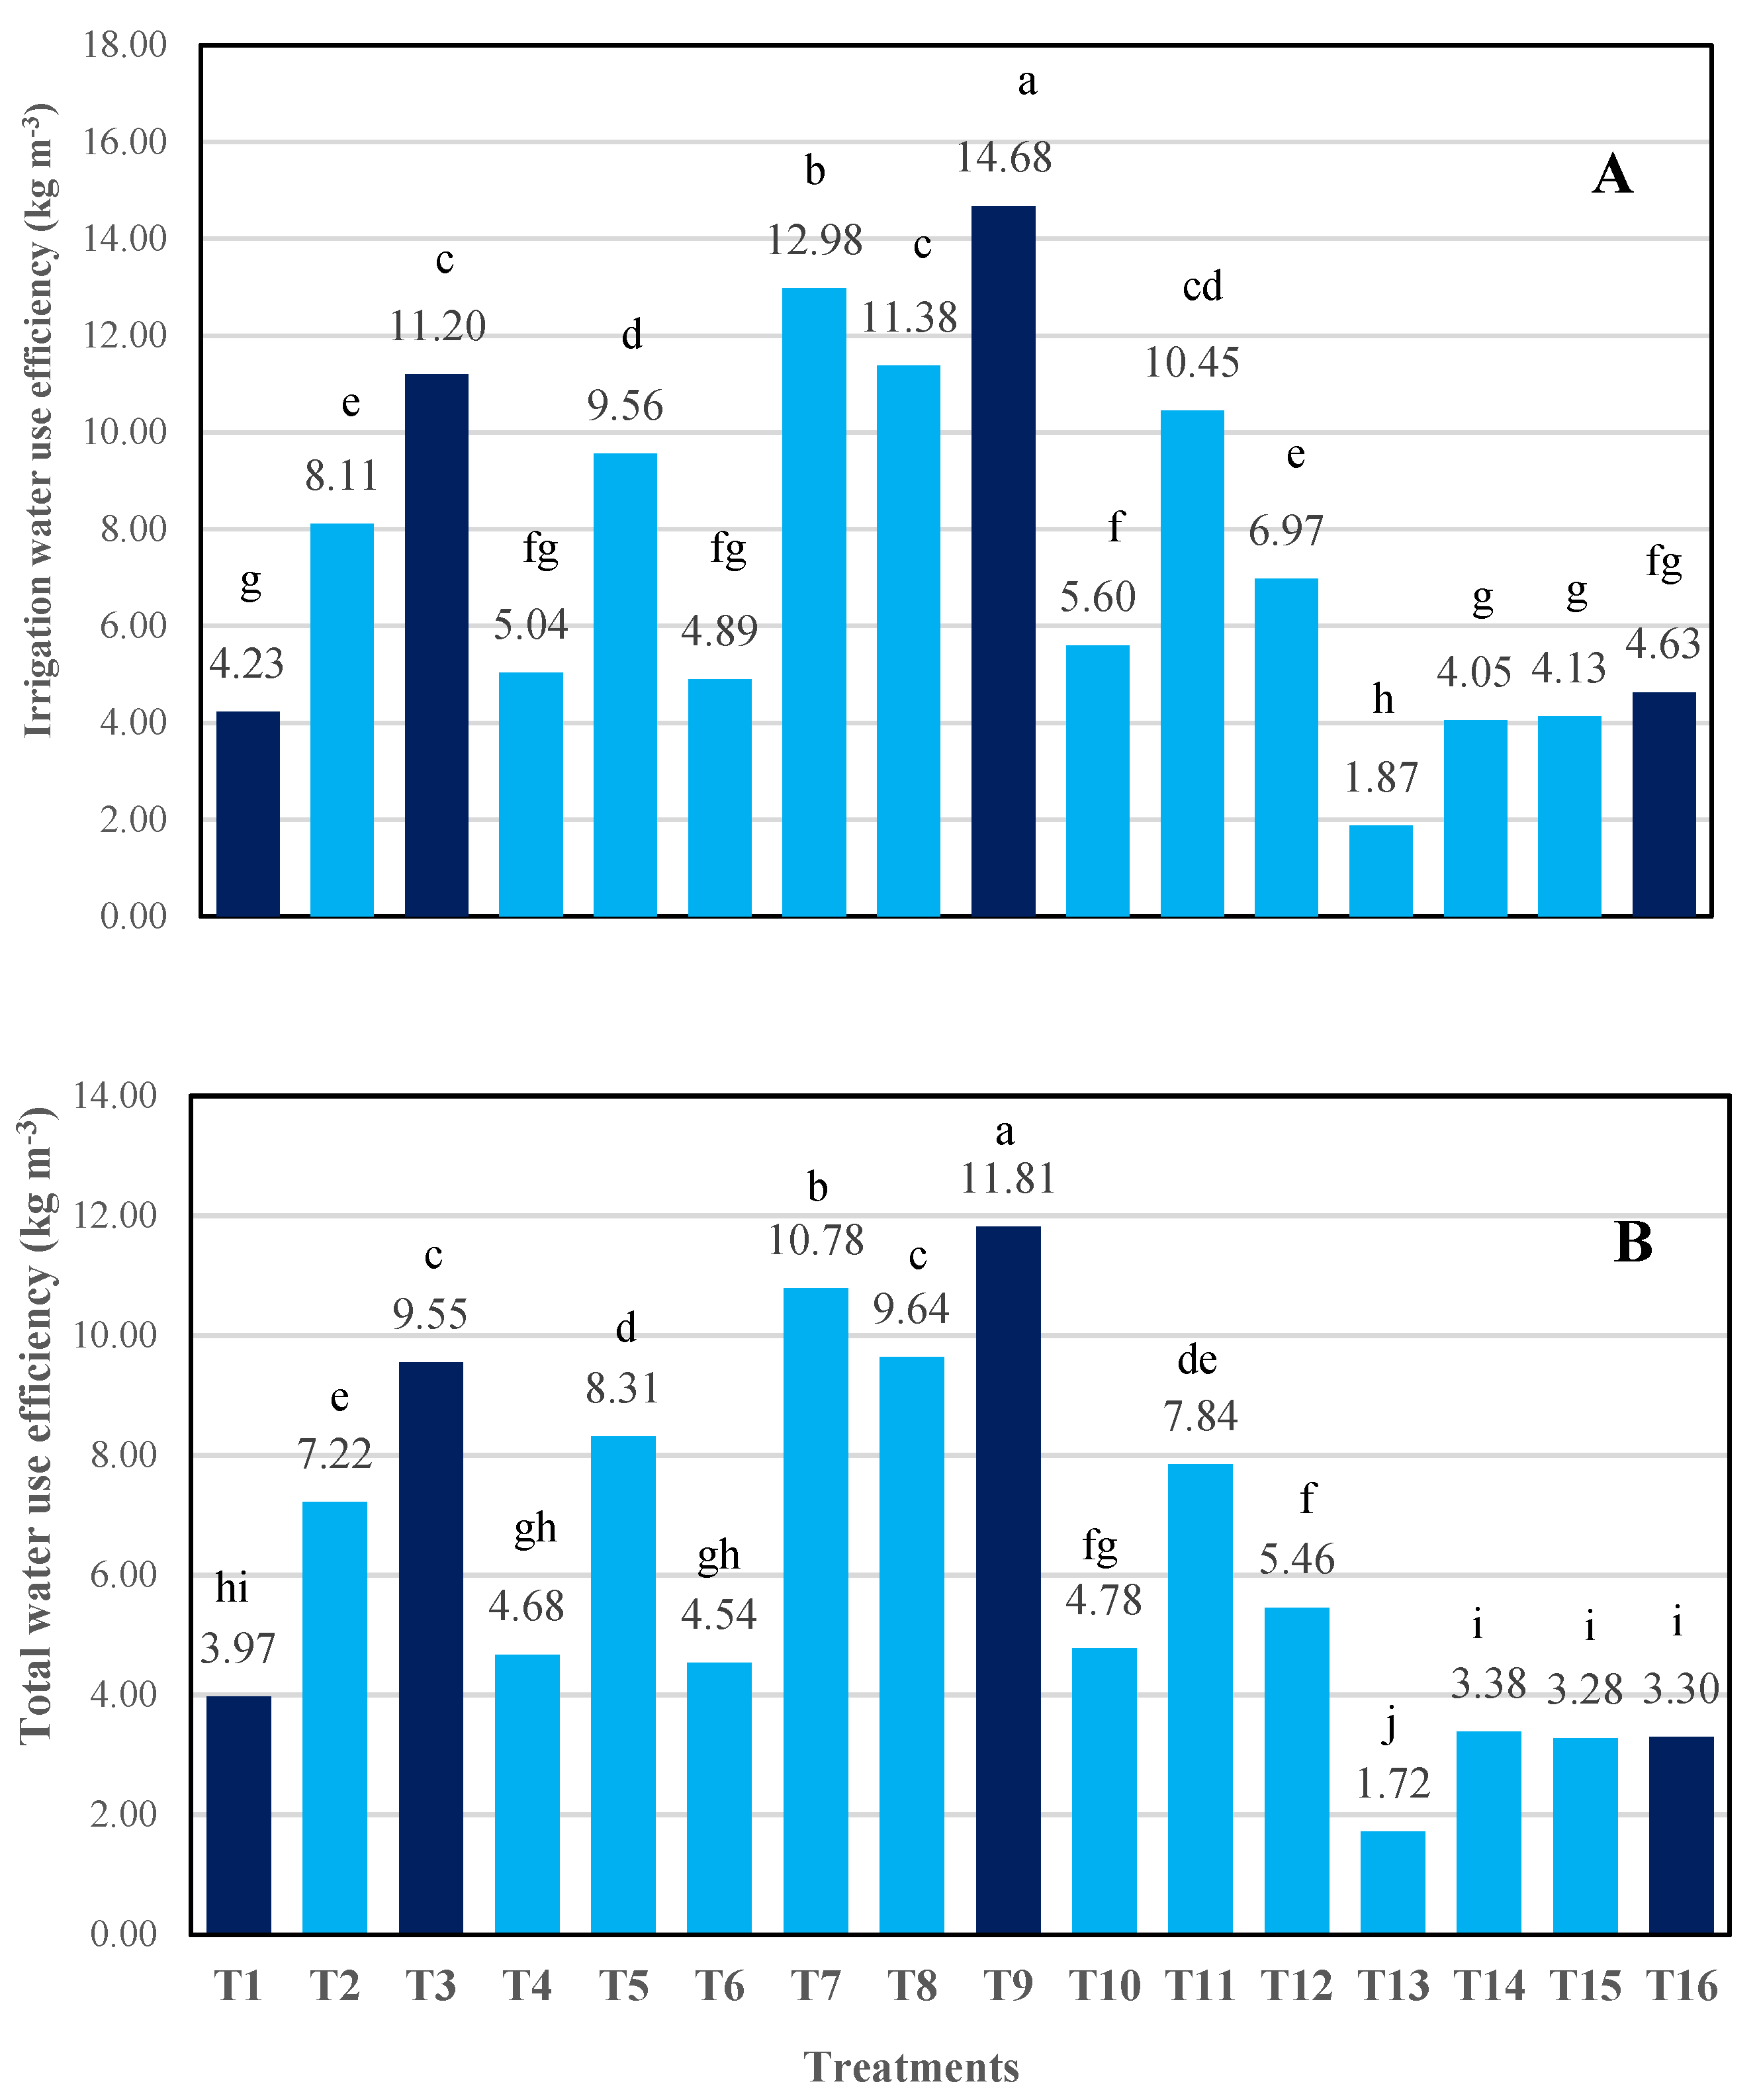
3.7. Water Use Efficiency

Figure 4 shows the values found for irrigation water use efficiency (IWUE, kg m−3) and total water use efficiency (TWUE, kg m−3) for the 16 treatments evaluated. Treatment T9 (−60 kPa FL, −60 kPa FR) presented the statistically (p ≤ 0.05) highest values for IWUE and TWUE, which were significantly higher than the values observed in the rest of the treatments, given that a good fruit yield (34.91 t ha−1; Table 4) was obtained in this treatment, which was statistically equal to the one obtained in treatments T6 and T8 (wetter), with a significantly lower amount of irrigation water applied compared with that used in treatments T1 to T6 (3.67 m3 plant−1; Figure 2B). Significantly lower IWUE and TWUE values in the treatments with lower soil moisture tensions (T1 to T8) are mainly attributed to the greater volume of irrigation water applied (Figure 2B), which, although it led to significantly higher FY values in T1 to T5 (Table 4), involved a greater amount of water applied to the crop. As such, for example, the FY obtained in the wettest treatment (T1) exceeded the one observed in treatment T9 by 4.12 t ha−1 (11.8%) but required 3.79 times more irrigation water (379%). The significantly greatest IWUE value observed in T9, in which SMT values of −60 kPa were applied in both phenological stages, matches the value of the SMT in which the greatest LWUE value was obtained (Table 3). This indicates that greater carbon capture per molar unit of evapotranspired water leads to a greater crop yield per unit volume of irrigation water applied to the crop.
On the other hand, significantly lower values than those observed in T9, both in IWUE and TWUE, were found in treatments T10 to T16, in which the trees were subjected to a SMT of −80 kPa in either of the two phenological stages (or both). In these treatments a similar amount of irrigation water was applied, as was used in T9 (with the exception of T13, in which more irrigation water was applied, and T16, in which less was applied; Figure 2B), but in which the FY value was found to be significantly lower to the one observed in T9 (Table 4). Increasing the soil moisture tension to −80 kPa in either of the phenological stages significantly reduced both FY and IWUE and TWUE. The significantly lowest value both for IWUE and TWUE was observed in treatment T13 (−85 kPa FL, −10 kPa FR), which was the result of the high SMT to which the crop was subjected during the flowering stage, affecting flower formation, and the low SMT in the fruit growth stage, involving a high application of irrigation water, but this did not translate into fruit production as a result of the low number of flowers. This result suggests that the amount of water available to the crop during the flowering stage is of great importance in defining the final crop yield.

3.8. Water Footprint

The water footprint (WF) and blue water footprint (BWF) showed a similar behavior in all treatments, given that the difference between the two is a result of the amount of rainfall, which is added to the amount of irrigation water applied in each treatment for calculating the WF (Figure 5A,B). In treatments T9 (−60 kPa FL, −60 kPa FR), T7 (−35 kPa FL, −60 kPa FR), T8 (−60 kPa FL, −35 kPa FR), and T3 (−35 kPa FL, −35 kPa FR), the significantly lowest WF and BWF values were observed, with statistically similar values (p ≤ 0.05; Figure 5A,B). In treatment T9, just 85 L of water was used to produce one kg of lime fruit, while in treatment T1, the one corresponding to the lowest soil moisture tension and in which the WF was significantly greater, 252 L was used to obtain the same result, a value 248.5% greater. The statistically greatest WF value was observed in treatment T13 (−85 kPa FL, −10 kPa FR), which required 580 L of water to produce one kilogram of lime fruit (752.9% greater than in T9), the treatment in which the significantly lowest values were obtained for both IWUE and TWUE. This was as a result, as stated above, of the negative effect on flower formation caused by the high SMT to which the crop was subjected during the flowering phenological stage and the large amount of water applied to the crop in the fruit growth stage, which in total for the two stages was statistically similar to the amount received by wetter treatments, such as T4 and T6 (Figure 2C). High values for WF were also observed in treatments T14, T15, and T16 (statistically equal), in which 296, 305, and 303 L of water was required to produce one kilogram of fruit, values 248.2%, 258.8%, and 256.5% greater than in T9, respectively.
As for GWF, values tended to be greater in the treatments where the soil moisture tension was maintained at −85 kPa in either of the phenological stages, with values increasing from T10 to T16, for which the number of irrigations and the volume of irrigation water applied per plant were lower. The less irrigation water applied to the crop, the greater the importance of rainwater for flower and fruit formation, which explains the increasing behavior of GWF for treatments with fewer irrigations. In contrast, in the treatments in which low SMTs were maintained (T1 to T9), the GWF values were statistically similar and practically identical, which indicates that in these cases the formation of flowers and fruits by the trees was essentially based on irrigation water, which was permanently available to the root system. In treatment T16, the driest, 87 L of rainwater was used by the trees to form one kilogram of fruit, while in treatment T9, in which the significantly lowest WF value and significantly highest IWUE and TWUE values were obtained, only 17 L of rainwater was used by the trees to produce one kilogram of fruit, a value that represents just 19.5% of the amount used in T16.

4. Discussion

Water stress is one of the factors that most affects growth and productivity in citrus. This work was carried out in the dry season, in which there was little rainfall on the crop. Under these conditions, the soil water content tended to decrease as a result of the water extracted by the lime trees in response to the evapotranspiration demand of the atmosphere. This was reflected, in the driest treatments, in an increase in the soil moisture tension, which in turn reduced ΨLBD, ΨLMD, and LRWC, as well as AN, stomatal conductance gs and transpiration LT of the lime trees. The ΨLBD, ΨLMD, and LRWC values measured in this work in the leaves of the plants subjected to a SMT of −60 kPa are similar to those reported in “Bonanza” orange and Persian lime by Chartzoulakis et al. [8] and Silva et al. [9], respectively. When the evapotranspiration demand exceeds the water uptake capacity of the plant, the water state of the trees deteriorates, resulting in a reduction in their photosynthetic rate [54]. In our study, the net carbon assimilation rate AN only reduced significantly when the SMT was greater than −60 kPa, with a statistically lower value only observed in the treatment with a SMT of −85 kPa. The lower diffusivity of water vapor when gs is lower constitutes the main factor limiting the value of AN in the leaves of citrus plants that experience moderate and high water deficit [55,56]. In other studies carried out on Persian lime, reductions were only observed in the values of AN, LT, and LWUE when the SMT was greater than −50 kPa [9,56]. Similar results were also found in “Bonanza” orange by Chartzoulakis et al. [8]. The AN values measured in this work, for the treatments that were maintained with fixed SMT values at −10, −35, and −60 kPa in both phenological stages, are considered medium to low for C3 plants [57]. Rios-Rojas et al. [56] reported slightly lower AN values in Persian lime to the ones reported in this work when applying continuous irrigations that maintained the SMT between −33 and −50 kPa.
On the other hand, based on the values measured in this work, it is possible to assert that when subjected to a soil moisture tension greater than −60 kPa, Persian lime trees significantly reduce the value of gs due to the closure of stomata in order to prevent dehydration of the plant and to preserve their water state [9]. If the SMT value is kept high, greater than −60 kPa, the plants also tend to significantly reduce their LAI due to leaf abscission and the reduction in their area exposed to the sun, as a result of their “curling” caused by a curving of the edges towards the upper side [36,56]. Significantly lower LAI values were observed when the SMT increased from −10 kPa (T1) to −35 and −60 kPa (T3 and T9, statistically equal) and from these to −85 kPa (T16). Flexas and Medrano [57] carried out a review of studies in this regard and found that the closure of stomata is the main response of plants to drought, which in turn represents the main factor limiting the photosynthetic rate under mild to moderate water stress conditions. The greatest leaf water use efficiency (LWUE), observed in this work in the treatment with a SMT of −60 kPa, can be attributed to the plants maintaining statistically equal results for AN in this treatment compared with the wetter treatments (−10 kPa and −35 kPa) but a significantly lower transpiration value. In this regard, Chartzoulakis et al. [8], in a similar study performed on “Bonanza” orange, did not find any difference in LWUE values between treatments with soil moisture tensions of −10 and −50 kPa, with very similar values to those found in this work in the treatment with a SMT of −60 kPa.
The favorable influence of irrigation on vegetative growth and fruit yield has been reported in different clones of Persian lime grafted onto different rootstocks, where the effect of water stress was evaluated based on the evapotranspiration value of the crop [56,58,59,60]. Alves et al. [55] noted that plant growth and yield are associated with high net CO2 assimilation rates (AN). High AN values produce greater availability of carbohydrates, which are essential for flower production and set and fruit set and growth [56,60]. The differences in the yield obtained in this work among the plants subjected to lower soil moisture tensions (−10 and −35 kPa) and those in which higher SMTs were evaluated (−60 and −85 kPa) can probably be explained by the abortion of flowers and lower fruit set when the higher moisture tensions were applied in the flowering stage, due to dehydration caused by the high temperatures [52]. Significantly lower values in crop yield were observed in the treatments in which the plants were subjected to a SMT of −85 kPa during the flowering stage (T13, T14, T15, and T16; Table 4), the result of the high SMT to which the crop was subjected in that stage, which affected flower formation. This result suggests that the amount of water available to the crop during the flowering stage is of great importance in defining the final crop yield. Similar to what was observed in this study, González-Altozano and Castel [35,36] reported flower and fruit drop in response to water stress in the flowering stage in other citrus species. The results of this work confirm the high sensitivity of Persian lime trees to water stress during the flowering and fruit growth phenological stages. The sensitivity to water stress during the fruit growth stage appears to be lower, given that the change from a SMT of −10 and −35 kPa in the flowering stage to −60 kPa in the fruit growth stage (T5 and T7) did not significantly affect crop yield, which agrees with the results found by González-Altozano and Castel [35,36] and by Gasque et al. [37] in other citrus species. Nevertheless, when the SMT was increased to −85 kPa in the fruit growth stage (T10 and T12), the yield was significantly reduced with respect to the one obtained in the wetter treatments (Table 4).
On the other hand, this study found that lime fruit size depends on the SMT that the plants were subjected to and the duration of water stress, given that the increase in fruit size depends largely on the supply of water from the soil [8]. The lowest percentage of size one coded fruits (greatest diameter) was observed in all of the treatments in which the trees were subjected to a SMT of −85 kPa in either of the phenological stages, with significantly lower values when this SMT was applied during the flowering stage, as a result of the application of a lower volume of water, which reduced the percentage of export quality fruits. In these same treatments, significantly greater values in the percentage of caliber 2 diameter fruits (smaller) were observed, except for the treatment in which the SMT was maintained at −85 kPa in both phenological stages. In this last treatment, a statistically greater value of the percentage of smallest-diameter (FSC 3) fruits was obtained. The reduction in fruit diameter in response to soil water deficit has also been observed in other studies carried out on Persian lime [44,60], as well as on Italian lemon [43]. The results obtained here show that it is not recommended to irrigate Persian lime at soil moisture tensions greater than −60 kPa during the flowering stage, given that the yield, production, and percentage of largest-diameter fruits reduce significantly. However, during the fruit growth stage, irrigation can be scheduled up to −60 kPa without a significant reduction in these variables, provided that the SMT in the flowering stage was not greater than −35 kPa. High luminance (*L) and chroma or color saturation (C*) values and low hue or color angle (h°) values in fruits of the trees subjected to a SMT of −85 kPa, especially in the fruit growth stage, were due to the reduction in LAI, which caused the fruits to be more exposed to solar radiation. The lower frequency and lower volume of water applied to the trees corresponding to treatments with a SMT of −85 kPa during the fruit growth stage significantly reduced the percentage of juice in the fruit, a logical outcome given that juice formation requires water to be available to the plant. Although the effect of SMT on the initial period of stage III of fruit growth was not evaluated in this study, it is possible that the greater accumulation of TSS and TA occurred during this stage, where the greatest accumulation of sugars occurs [61]. TSS content is one of the parameters most affected by water stress [62,63]. Treeby et al. [33], Hutton and Loveys [28], and Rivera-Hernández et al. [44] state that water stress produces smaller fruits that contain a greater TSS concentration and greater TA percentage, which agrees with the results obtained in this work, given that significantly greater TSS values were observed in the driest treatments. In other similar studies carried out on Persian lime, significant effects of water stress on TSS were not found, although these results are likely the consequence of the water stress values imposed being low [9] or due to the presence of constant rains during the evaluation period [29].
On the other hand, the greater supply of irrigation water applied in the wettest treatments, especially where a SMT of −10 kPa was used in either of the two physiological stages (or in both), led to a reduction in IWUE and TWUE and an increase in WF and BWF, and the differences in these variables were statistically significant. The main negative aspects associated with the application of a large quantity of irrigation water are the reduction in the financial viability of the production system due to the greater energy cost and wear on equipment and the reduced environmental sustainability of irrigation agriculture due to increased water extraction, as well as the possible pollution of aquifers caused by the leaching of agrochemicals diluted in the percolated water.
As far as we know, there are no studies that have estimated the water footprint or virtual water content of Persian lime crops under field conditions, although Siebert and Döll [64] applied a global model to estimate virtual water content in various crops around the world. For citrus, these authors report a value of 212 m3 t−1 (0.212 m3 kg−1) for blue virtual water (BVW) and 423 m3 t−1 (0.423 m3 kg−1) for green virtual water (GVW). The first figure is 3.12 times greater than the value obtained in treatment T9 (−60 kPa FL, −60 kPa FR; Figure 5). The second figure is much greater than the values found in this study. The results of this study confirm the conclusions of Montesinos et al. [65], who state that global or national-scale studies hide the regional differences of countries that have a wide range of agroclimatic zones. Furthermore, based on the results obtained in this work, it is possible to suggest that the production of Persian lime in the dry season allows for a reduction in the consumption of blue water (extracted from aquifers or bodies of surface water) if irrigations are applied based on different soil moisture tension values in the phenological stages of flowering and fruiting. The use of blue water is restricted by its scarcity, high opportunity cost, and large influence on the destruction of water tables in many regions of the world, which makes it an important limiting factor for socioeconomic development in areas with water shortages, especially under uncertain climatic conditions as a result of climate change [7]. In the case of tropical zones of Mexico, this problem can be mitigated if blue water is used efficiently in Persian lime production systems based on the results of this study.
The results found in this study, regarding the soil moisture tension values that would be recommended to be used to start irrigation events in Persian lime crop, can be used as input data in mathematical framework models for the control and optimization of irrigation, in which it is necessary to know the limit values of soil water content that must be maintained to maximize crop yield and minimize water footprint, such as those presented by Berardi et al. [66] and Pereira et al. [67]. The soil moisture characteristic curve shown in Figure 1 can be used to convert the soil moisture tension values recommended for starting irrigation in this work to soil water content values used, for example, in the model presented by Berardi et al. [66] to estimate soil water extraction by crop roots.

5. Conclusions

The hypothesis proposed in this study is accepted: the application of irrigation performed based on different soil moisture tension values during the phenological stages of flowering and fruit set and initial fruit growth affects the response of almost all of the response variables evaluated.
The average juice content was significantly greater in the treatments in which low soil moisture tensions (−10, −35, and −60 kPa) were applied in both phenological stages, and their values only significantly decreased when the highest SMT (−85 kPa) was applied in the fruiting stage. The treatments with soil moisture tension values of −10 and −35 kPa during the flowering stage, and with values of up to −60 kPa during the fruit growth stage, presented the greatest percentage of largest-diameter fruits (FSC 1), and they were statistically similar. In the driest treatment (−85 kPa FL, −85 kPa FR), a statistically greater value was obtained for the percentage of smallest-diameter fruits (caliber 3), and statistically greater values (p ≤ 0.05) were observed for the percentage of physical damage of fruits with sun spots and the percentage of fruits with surface scarring, fruit luminance, and fruit chroma or color saturation.
On the variables defining juice quality, the treatments in which soil moisture tensions greater than −60 kPa were applied in the flowering stage and −85 kPa in the fruit growth stage presented significantly greater values of total soluble solids, although in all of the treatments evaluated the values observed surpassed the minimum value set by the Official Mexican Standard [48].
Significantly higher values in the plantation yield were obtained in all treatments in which the lower soil moisture tension values were applied (−10 kPa and −35 kPa) in either of the two phenological stages, except for the combinations that included a soil moisture tension of −85 kPa in one of the stages.
As for irrigation water use efficiency, the maximum value was observed in the −60 kPa flowering and −60 kPa fruit growth treatment, in which the statistically second best fruit yield was obtained, but with a significantly lower quantity of irrigation water applied compared with the amount used in the wetter treatments. Lower values for the water footprint and blue water footprint were also observed in this treatment: a total of just 85 L of water (68 L of irrigation water) was used to produce 1 kg of lime fruits, while in the wettest treatment 252 L was used to obtain the same result, and the water footprint observed was significantly higher.
It is recommended to irrigate the crop at a SMT of −35 kPa during the flowering stage and −60 kPa during the fruit growth stage, as that treatment obtained the greatest values on the variables of lime weight and juice content, crop yield, percentage of largest-diameter fruit, and fruit hue or color angle. In this treatment, significantly lower values were also observed on the variables of percentage of fruits with sun spots, luminance, chroma, peel scarring, total juice soluble solids content, green water footprint, blue water footprint, and water footprint. For this, farmers can use tensiometers such as those employed in this work, as their installation and use are very easy and only a little training is required.
Finally, the results found in this study can be used as input data in mathematical framework models for the control and optimization of irrigation in which it is necessary to know the limit values of soil water content that must be maintained to maximize crop yield and minimize water footprint.

Author Contributions

Conceptualization, B.R.-H., E.C.-Á. and R.G.-H.; data curation, B.R.-H., V.G.-J. and E.C.-Á.; formal analysis, B.R.-H., V.G.-J. and E.C.-Á.; investigation, B.R.-H., V.G.-J., E.C.-Á. and R.G.-H.; methodology, B.R.-H., V.G.-J., E.C.-Á., R.G.-H. and J.L.A.; supervision, E.C.-Á., R.G.-H., J.L.A. and V.H.Q.-C.; visualization, E.C.-Á. and R.G.-H.; writing—original draft, B.R.-H. and V.G.-J.; writing—review and editing, E.C.-Á., R.G.-H., V.H.Q.-C. and J.A.-E. All authors have read and agreed to the published version of the manuscript.

Funding

This research received no external funding.

Institutional Review Board Statement

Not applicable.

Informed Consent Statement

Not applicable.

Data Availability Statement

Not applicable.

Acknowledgments

The Program for the Docent Professional Development (PRODEP) of the Secretary of Public Education in Mexico (SEP) provided a scholarship to the first author to pursue postgraduate studies.

Conflicts of Interest

The authors declare no conflict of interest.

References

  1. Food and Agriculture Organization of the United Nations (FAO). FAOSTAT Crops and Livestock Products. 2021. Available online: https://www.fao.org/faostat/en/#data/QCL (accessed on 8 November 2021).
  2. Servicio de Información Agroalimentaria y Pesquera (SIAP). Panorama Agroalimentario, 1st ed.; Secretaría de Agricultura y Desarrollo Rural: Mexico City, Mexico, 2019.
  3. Rivera-Hernández, B.; Aceves-Navarro, L.A.; Arrieta-Rivera, A.; Juárez-López, J.F.; Méndez-Adorno, M.; Ramos-Álvarez, C. Evidencias del cambio climático en el estado de Tabasco durante el periodo 1961–2010. Rev. Mex. Cienc. Agric. 2016, 14, 2645–2656. [Google Scholar]
  4. Quej-Chi, V.H.; Almorox, J.; Arnaldo, J.A.; Moratiel, R. Evaluation of temperature based methods for the estimation of reference evapotranspiration in the Yucatán peninsula, Mexico. J. Hydrol. Eng. 2018, 24, 05018029. [Google Scholar] [CrossRef]
  5. Servicio de Información Agroalimentaria y Pesquera (SIAP). Atlas Agroalimentario 2017. 2017. Available online: https://www.gob.mx/siap (accessed on 8 November 2021).
  6. Hanasaki, N.; Inuzuka, T.; Kanae, S.; Oki, T. An estimation of global virtual water flow and sources of water withdrawal for major crops and livestock products using a global hydrological model. J. Hydrol. 2010, 384, 232–244. [Google Scholar] [CrossRef]
  7. Sun, S.K.; Wu, P.; Wang, Y.B.; Zhao, X.N. The virtual water content of major grain crops and virtual water flows between regions in China. J. Sci. Food Agric. 2013, 93, 1427–1437. [Google Scholar] [CrossRef] [PubMed]
  8. Chartzoulakis, K.; Michelakis, N.; Stefanoudaki, E. Water use, growth, yield and fruit quality of ‘Bonanza’ oranges under different soil water regimes. Adv. Hortic. Sci. 1999, 13, 6–11. [Google Scholar]
  9. Silva, C.R.; Folegatti, M.V.; Araújo, S.T.J.; Alves, J.J.; Fonseca, S.C.; Vasconcelos, R.R. Water relations and photosynthesis as criteria for adequate irrigation management in ‘Tahiti’ lime trees. Sci. Agric. 2005, 62, 415–422. [Google Scholar] [CrossRef] [Green Version]
  10. Boman, B. Citrus best management practices. In Advances in Citrus Nutrition; Srivastava, A.K., Ed.; Springer: Dordrecht, The Netherlands, 2012; pp. 391–413. [Google Scholar]
  11. Kandelous, M.M.; Moradi, B.A.; Hopmans, J.W. An alternative tensiometer design for deep vadose zone monitoring. Soil Sci. Soc. Am. J. 2015, 79, 1293–1296. [Google Scholar] [CrossRef] [Green Version]
  12. Jabro, J.D.; Stevens, W.B.; Iversen, W.M.; Allen, B.L.; Sainju, U.M. Irrigation scheduling based on wireless sensors output and soil-water characteristic curve in two soils. Sensors 2020, 20, 1336. [Google Scholar] [CrossRef] [Green Version]
  13. Kang, Y.; Wang, F.X.; Liu, H.J.; Yuan, B.Z. Potato evapotranspiration and yield under different drip irrigation regimes. Irrig. Sci. 2004, 23, 133–143. [Google Scholar] [CrossRef]
  14. Wang, F.X.; Kang, Y.; Liu, S.P.; Hou, X.Y. Effects of soil matric potential on potato growth under drip irrigation in the North China Plain. Agric. Water Manag. 2007, 88, 34–42. [Google Scholar] [CrossRef]
  15. Carli, C.; Yuldashev, F.; Khalikov, D.; Condori, B.; Mares, V.; Monneveux, P. Effect of different irrigation regimes on yield, water use efficiency and quality of potato (Solanum tuberosum L.) in the lowlands of Tashkent, Uzbekistan: A field and modeling perspective. Field Crops Res. 2014, 163, 90–99. [Google Scholar] [CrossRef]
  16. Orozco-Romero, J.; Pérez-Zamora, O. Tensión de humedad del suelo y fertilización nitrogenada en plátano (Musa AAA Simmonds) cv. Gran Enano. Agrociencia 2006, 40, 149–162. Available online: https://www.agrociencia-colpos.mx/index.php/agrociencia/article/view/450 (accessed on 15 March 2022).
  17. Rivera-Hernández, B.; Carrillo-Ávila, E.; Obrador-Olán, J.J.; Juárez-López, J.F.; Aceves-Navarro, L.A.; García-López, E. Soil moisture tension and phosphate fertilization on yield components of A-7573 sweet corn (Zea mays L.) hybrid, in Campeche, Mexico. Agric. Water Manag. 2009, 96, 1285–1292. [Google Scholar] [CrossRef]
  18. Rivera-Hernández, B.; Carrillo-Ávila, E.; Obrador-Olán, J.J.; Juárez-López, J.F.; Aceves-Navarro, L.A. Morphological quality of sweet corn (Zea mays L.) ears as response to soil moisture tension and phosphate fertilization in Campeche, Mexico. Agric. Water Manag. 2010, 97, 1365–1374. [Google Scholar] [CrossRef]
  19. Sudhir-Yadav; Humphreys, E.; Kukal, S.S.; Gill, G.; Rangarajan, R. Effect of water management on dry seeded and puddled transplanted rice. Part 2: Water balance and water productivity. Field Crops Res. 2011, 120, 123–132. [Google Scholar] [CrossRef]
  20. Mahajan, G.; Chauhan, B.S.; Timsina, J.; Singh, P.P.; Singh, K. Crop performance and water- and nitrogen-use efficiencies in dry-seeded rice in response to irrigation and fertilizer amounts in northwest India. Field Crops Res. 2012, 134, 59–70. [Google Scholar] [CrossRef]
  21. Carrillo-Ávila, E.; García-Acedo, C.; Arreola-Enríquez, J.; Landeros-Sánchez, C.; Osnaya-González, M.L.; Castillo-Aguilar, C.C. Evaluation of four sunflower hybrids (Helianthus annuus) under three irrigation regimes and two doses of fertilization on flower production. J. Agric. Sci. 2015, 7, 183–194. [Google Scholar] [CrossRef] [Green Version]
  22. Alamilla-Magaña, J.C.; Carrillo-Ávila, E.; Obrador-Olán, J.J.; Landeros-Sánchez, C.; Vera-López, J.; Juárez-López, J.F. Soil moisture tension effect on sugar cane growth and yield. Agric. Water Manag. 2016, 177, 264–273. [Google Scholar] [CrossRef]
  23. Gutiérrez-Gómez, C.; Carrillo-Avila, E.; Landeros-Sánchez, C.; Coh-Méndez, D.; Monsalvo-Espinosa, A.; Arreola-Enríquez, J.; Pimentel-López, J. Soil moisture tension as an alternative for improving sustainable use of irrigation water for habanero chilies (Capsicum chinense Jacq.). Agric. Water Manag. 2018, 204, 28–37. [Google Scholar] [CrossRef]
  24. García-Sánchez, F.; Simón-Grao, S.; Gimeno, V.; Martínez-Nicolás, J.J.; Srivastava, A.K. Irrigation and fertilization management in lime trees. In The Lime: Botany, Production and Uses; Khan, M.M., Al-Yahyai, R., Al-Said, F., Eds.; CAB eBooks; CAB International: Wallingford, UK, 2017; pp. 91–114. [Google Scholar]
  25. Rivera-Hernández, B.; Garruña-Hernández, R.; Santamaría-Basulto, F.; Andrade-Torres, J.L.; Carrillo-Ávila, E.; Andueza-Noh, R.H. Lime yield (Citrus × latifolia Tanaka ex Q. Jiménez) and fruit quality in winter season from orchards mainteined with different soil moisture tension. Agroproductividad 2020, 13, 83–88. [Google Scholar] [CrossRef]
  26. Zermeño-González, A.; García-Delgado, M.A.; Castro-Meza, B.I.; Rodríguez-Rodríguez, H. Soil moisture tension and fruit yield of italian lemon. Rev. Fitotec. Mex. 2007, 30, 295–303. [Google Scholar]
  27. Howell, T.A. Irrigation Efficiency. In Encyclopedia of Water Science; Stewart, B.A., Howell, T.A., Eds.; Marcel Dekker: New York, NY, USA, 2003; pp. 467–472. [Google Scholar]
  28. Hutton, R.J.; Loveys, B.R. A partial root zone drying irrigation strategy for citrus. Effects on water use efficiency and fruit characteristics. Agric. Water Manag. 2011, 98, 1485–1496. [Google Scholar] [CrossRef]
  29. Souza, M.J.H.; Ramos, M.M.; de Siqueira, D.L.; Costa, L.C.; Lhamas, A.J.M.; Mantovani, E.C.; Cecon, P.R.; Salomão, L.C.C. Produção e qualidade dos frutos da limeira ácida ‘Tahiti’ submetida a diferentes porcentagens de área molhada. Rev. Bras. Eng. Agric. Ambient. 2003, 7, 245–250. [Google Scholar] [CrossRef] [Green Version]
  30. Ballester, C.; Castel, J.; Intrigliolo, D.S.; Castel, J.R. Response of Clementina de Nules citrus trees to summer deficit irrigation. Yield components and fruit composition. Agric. Water Manag. 2011, 98, 1027–1032. [Google Scholar] [CrossRef]
  31. Mishra, D.S.; Goswami, A.K. High density planting in fruit crops. HortFlora Res. Spectr. 2016, 5, 261–264. [Google Scholar]
  32. Iglesias, A.; Garrote, L. Adaptation strategies for agricultural water management under climate change in Europe. Agric. Water Manag. 2015, 155, 113–124. [Google Scholar] [CrossRef] [Green Version]
  33. Treeby, M.T.; Henriod, R.E.; Bevington, K.B.; Milne, D.J.; Storey, R. Irrigation management and rootstock effects on navel orange [Citrus sinensis (L.) Osbeck] fruit quality. Agric. Water Manag. 2007, 91, 24–32. [Google Scholar] [CrossRef]
  34. Pérez-Pérez, J.G.; Romero, P.; Navarro, J.M.; Botía, P. Response of sweet orange cv ‘Lane late’ to deficit irrigation in two rootstocks. I: Water relations, leaf gas exchange and vegetative growth. Irrig. Sci. 2008, 26, 415–425. [Google Scholar] [CrossRef]
  35. González-Altozano, P.; Castel, L., Jr. Regulated deficit irrigation in ‘Clementina de Nules’ citrus trees. I. Yield and fruit quality effects. J. Hortic. Sci. Biotechnol. 1999, 74, 706–713. [Google Scholar] [CrossRef]
  36. González-Altozano, P.; Castel, L., Jr. Regulated deficit irrigation in ‘Clementina de Nules’ citrus trees. II. Vegetative effects. J. Hortic. Sci. Biotechnol. 2000, 75, 388–392. [Google Scholar] [CrossRef]
  37. Gasque, M.; Granero, B.; Turegano, J.V.; Gonzalez-Altozano, P. Regulated deficit irrigation effects on yield, fruit quality and vegetative growth of ‘Navelina’ citrus trees. Span. J. Agric. Res. 2010, 8, S40–S51. [Google Scholar] [CrossRef] [Green Version]
  38. World Reference Base for Soil Resources (WRB); IUSS Working Group. Base Referencial Mundial del Recurso Suelo 2014, Actualización 2015; Sistema internacional de clasificación de suelos para la nomenclatura de suelos y la creación de leyendas de mapas de suelos. Informes sobre recursos mundiales de suelos 106; FAO: Roma, Italy, 2015. [Google Scholar]
  39. Jabro, J.D.; Stevens, W.B.; Iversen, W.M. Field performance of three real-time moisture sensors in sandy loam and clay loam soils. Arch. Agron. Soil Sci. 2018, 64, 930–938. [Google Scholar] [CrossRef]
  40. Golia, E.E.; Angelaki, A.; Giannoulis, K.D.; Skoufogianni, E.; Bartzialis, D.; Cavalaris, C.; Vleioras, S. Evaluation of soil properties, irrigation and solid waste application levels on Cu and Zn uptake by industrial hemp. Agron. Res. 2021, 19, 92–99. [Google Scholar] [CrossRef]
  41. Rivera-Hernández, B.; Garruña-Hernández, R.; Carrillo-Ávila, E.; Quej-Chi, V.H.; Andrade, J.L.; Andueza-Noh, J.L.; Arreola-Enríquez, J. Using Splines in the Application of the Instantaneous Profile Method for the Hydrodynamic Characterization of a Tropical Agricultural Vertisol. Rev. Bras. Cienc. Solo, 2022; accepted for publication. [Google Scholar]
  42. Van Genuchten, M.T.H. A closed-form equation for predicting the hydraulic conductivity of unsaturated soils. Soil Sci. Soc. Am. J. 1980, 44, 892–898. [Google Scholar] [CrossRef] [Green Version]
  43. Sakellariou-Makrantonaki, M.; Angelaki, A.; Evangelides, C.; Bota, V.; Tsianou, E.; Floros, N. Experimental determination of Hydraulic Conductivity at unsaturated soil column. Procedia Eng. 2016, 162, 83–90. [Google Scholar] [CrossRef] [Green Version]
  44. Marquardt, D.W. An algorithm for least-squares estimation of nonlinear parameters. J. Soc. Ind. Appl. Math. 1963, 11, 431–441. [Google Scholar] [CrossRef]
  45. Da Souza, M.J.H.; Ramos, M.M.; Siqueira, D.L.; Costa, L.C.; Lhamas, A.J.M.; Mantovani, E.C.; Cecon, P.R.; Salomão, L.C.C. Estresse hídrico e época de produção da lima ácida ‘Tahiti’. Rev. Bras. Eng. Agric. Ambient. 2004, 8, 31–38. [Google Scholar] [CrossRef] [Green Version]
  46. Hutton, R.J.; Landsberg, J.J.; Sutton, B.G. Timing irrigation to suit citrus phenology: A means of reducing water use without compromising fruit yield and quality. Aust. J. Exp. Agric. 2007, 47, 71–80. [Google Scholar] [CrossRef]
  47. Panigrahi, P.; Sharma, R.K.; Hasan, M.; Parihar, S.S. Deficit irrigation scheduling and yield prediction of ‘Kinnow’ mandarin (Citrus reticulate Blanco) in a semiarid region. Agric. Water Manag. 2014, 25, 1635–1651. [Google Scholar] [CrossRef]
  48. NMX-FF-077-1996; Productos Alimenticios no Industrializados para Consumo Humano Fruta Fresca. Limón persa (Citrus latifolia L.). Especificaciones. Normas Mexicanas. Dirección General de Normas. Available online: https://studylib.es/doc/8755804/nmx-ff-077-1996.-productos-alimenticios-no (accessed on 15 March 2022).
  49. NMX-FF-011-1982; Productos Alimenticios no Industrializados para Consumo Humano Fruta Fresca. Determinación de Acidez titulable. Método de Titulación. non Industrialized Food Products for Human Use. Fresh Fruit. Determination of Titrable acidity. Titration Method. Normas Mexicanas. Dirección General de Normas. Available online: https://www.coursehero.com/file/107006413/NMX-FF-011-1982PDF/ (accessed on 15 March 2022).
  50. Lu, J.; Ookawa, T.; Hirasawa, T. The effects of irrigation regimes on the wáter use, dry matter production and physiological responses of paddy rice. Plant Soil 2000, 223, 207–216. [Google Scholar] [CrossRef]
  51. SAS Institute Inc. Statistical Analysis System (SAS) for Windows 9 1.3. Service Pack 2; SAS Institute Inc.: Cary, NC, USA, 2003. [Google Scholar]
  52. Machado, E.C.; Tambelli, S.P.; Medina, C.L.; Ribeiro, R.V. Respostas da fotossíntese de três espécies de citros a fatores ambientais. Pesqui. Agropecu. Bras. 2005, 40, 1161–1170. [Google Scholar] [CrossRef]
  53. Luchetti, M.A.; Mattos Júnior, D.; De Negri, J.D.; Figueiredo, J.O. Aspectos gerais e distribuição de cultivo. In Lima Ácida Tahiti; Mattos, D., Jr., De Negri, J.D., Figueiredo, J.O., Eds.; Instituto Agronômico: Sao Paulo, Brasil, 2003; pp. 1–12. [Google Scholar]
  54. Pettigrew, W. Physiological consequences of moisture deficit stress in Cotton. Crop Sci. 2004, 44, 1265–1272. [Google Scholar] [CrossRef] [Green Version]
  55. Alves, J.; Silva, C.R.; Ribeiro, R.V.; Silva, T.J.A.; Folegatti, M.V. Growth of young “Tahiti” lime trees under irrigation levels. Eng. Agríc. 2005, 25, 170–178. [Google Scholar] [CrossRef] [Green Version]
  56. Ríos-Rojas, L.; Chaali, N.; Jaramillo-Barrios, C.I.; Ouazaa, S.; Correa, J.F. Irrigation and nutrition as criteria for adequate management of Tahiti acid lime trees affected by a physiological disorder in tropical conditions. Sci. Hortic. 2020, 270, 109438. [Google Scholar] [CrossRef]
  57. Flexas, J.; Medrano, H. Drought-inhibition of photosynthesis in C3 plants: Stomatal and non-stomatal limitations revisited. Ann. Bot. 2002, 89, 183–189. [Google Scholar] [CrossRef] [PubMed] [Green Version]
  58. Espinoza-Núñez, E.; Mourao-Filho, F.A.A.; Stuchi, E.S.; Cantuarias-Avilés, T.; Santos-Días, C.T. Performance of ‘Tahiti’ lime on twelve rootstocks under irrigated and non-irrigated conditions. Sci. Hortic. 2011, 129, 227–231. [Google Scholar] [CrossRef]
  59. Alves, J.; Folegatti, M.V.; Silva, C.R.; Silva, T.J.A.; Evangelistas, A.W.P. Response of young ‘Tahiti’ lime trees to different irrigation levels. Eng. Agríc. 2011, 31, 303–304. [Google Scholar] [CrossRef] [Green Version]
  60. Bremer, N.H.; Mourão-Filho, F.A.A.; Stuchi, E.S.; Espinosa-Nuñez, E.; Cantuarias-Avilés, T. The horticultural performance of five ‘Tahiti’ lime selections grafted onto ‘Swingle’ citrumelo under irrigated and non-irrigated conditions. Sci. Hortic. 2013, 150, 181–186. [Google Scholar] [CrossRef]
  61. Barry, G.H.; Castle, W.S.; Davies, F. Rootstocks and plant water relations affect sugar accumulation of citrus fruit via osmotic adjustment. J. Am. Soc. Hortic. Sci. 2004, 129, 8. [Google Scholar] [CrossRef]
  62. Aguado, A.; Frías, J.; García-Tejero, I.; Romero, F.; Muriel, J.L.; Capote, N. Towards the improvement of fruit-quality parameters in citrus under deficit irrigation strategies. Int. Sch. Res. Not. 2012, 2012, 940896. [Google Scholar] [CrossRef] [Green Version]
  63. Pérez-Pérez, J.G.; Robles, J.M.; Botía, P. Influence of deficit irrigation in phase III of fruit growth on fruit quality in ‘lane late’ sweet orange. Agric. Water Manag. 2009, 96, 969–974. [Google Scholar] [CrossRef]
  64. Siebert, S.; Döll, P. Quantifying blue and green virtual water contents in global crop production as well as potential production losses without irrigation. J. Hydrol. 2010, 384, 198–217. [Google Scholar] [CrossRef]
  65. Montesinos, P.; Camacho, E.; Campos, B.; Rodriguez-Diaz, J.A. Analysis of virtual irrigation water. application to water resources management in a Mediterranean river basin. Water Resour. Manag. 2011, 25, 1635–1651. [Google Scholar] [CrossRef]
  66. Berardi, M.; D’Abbicco, M.; Girardi, G.; Vurro, M. Optimizing water consumption in Richards’ equation framework with step-wise root water uptake: A simplified model. Transp. Porous Media 2022, 141, 469–498. [Google Scholar] [CrossRef]
  67. Pereira, R.M.S.; Lopes, S.; Caldeira, A.; Fonte, V. Optimized planning of different crops in a field using optimal control in Portugal. Sustainability 2018, 10, 4648. [Google Scholar] [CrossRef] [Green Version]
Figure 1. Representation of the h(θ) relationship of the soil profile at 0.30 m depth.
Water 14 01011 g001
Figure 2. Average number of irrigation events per treatment (A), volume of irrigation applied per plant (B), and total water application per plant (irrigation plus rain) (C). Dark blue bars correspond to treatments with the same soil moisture tension during the two phenological stages. Different letters on the bars mean statistical differences (Tukey, p ≤ 0.05). T1 to T16 are soil moisture tension treatments (kPa).
Water 14 01011 g002
Figure 3. Average number of irrigations during the phenological stages of flowering and fruit growth, in treatments with the same soil moisture tension at both stages (T1, T3, T9, and T16). Different letters in the bars corresponding to each phenological stage indicate statistically significant differences (Tukey, p ≤ 0.05).
Water 14 01011 g003
Figure 4. Irrigation water use efficiency (A) and total water use efficiency (B). Dark blue bars correspond to treatments with the same soil moisture tension during the two phenological stages. Different letters on the bars mean statistical differences (p ≤ 0.05); n = 3. T1 to T16 are soil moisture tension treatments (kPa).
Water 14 01011 g004
Figure 5. Green water footprint (A), blue water footprint (B), and water footprint (C). Dark green and blue bars correspond to treatments with the same soil moisture tension during the two phenological stages. Different letters on the bars mean statistical differences (Tukey, p ≤ 0.05). T1 to T16 are soil moisture tension treatments (kPa).
Water 14 01011 g005aWater 14 01011 g005b
Table 1. Soil water moisture tension (SMT) treatments.
TreatmentSMT in the Flowering Stage
(kPa)
SMT in the Fruit Growth Stage (kPa)TreatmentSMT in the Flowering Stage
(kPa)
SMT in the Fruit Growth Stage (kPa)
T1−10−10T9−60−60
T2−10−35T10−10−85
T3−35−35T11−60−85
T4−35−10T12−35−85
T5−10−60T13−85−10
T6−60−10T14−85−35
T7−35−60T15−85−60
T8−60−35T16−85−85
Table 2. Global radiation (GR), temperature (T), relative humidity (RH), vapor pressure deficit (VPD), potential evapotranspiration (ETo), and rain during the experimental work (February to June 2019).
Meteorological VariableFebruaryMarchAprilMayJune
GR (MJ m−2)18.41 ± 2.0720.11 ± 3.521.95 ± 3.2922.41 ± 3.4418.42 ± 6.25
T (°C)27.7 ± 1.6229.43 ± 1.6430.10 ± 2.3331.55 ± 1.2328.45 ± 2.12
RH (%)71.73 ± 5.4364.95 ± 7.1062.49 ± 7.3061.11 ± 6.3079.13 ± 9.61
VPD (kPa)2.62 ± 0.352.75 ± 0.443.59 ± 0.543.87 ± 0.392.45 ± 0.54
ETo (mm)4.25 ± 0.624.94 ± 0.795.83 ± 0.906.12 ± 0.884.54 ± 1.50
R (mm)382311763
Note: Numbers to the right of the mean values are the standard deviation of the observations. Values are monthly averages. Precipitation (R) values correspond to the amount of rainfall accumulated each month.
Table 3. Leaf water potential before dawn (ΨLBD) and at midday (ΨLMD), leaf relative water content (LRWC), net carbon assimilation rate (AN), stomatal conductance (gs), leaf transpiration (LT), leaf water use efficiency (LWUE), and leaf area index (LAI) in treatments with the same soil moisture tension during the two phenological stages.
Physiological VariablesSoil Moisture Tension (kPa)
−10−35−60−85
ΨLBD (MPa)−0.94 ± 0.15 a−1.01 ± 0.02 a−1.16 ± 0.02 b−1.45 ± 0.24 c
ΨLMD (MPa)−1.88 ± 0.19 a−1.87 ± 0.23 a−2.11 ± 0.25 b−2.78 ± 0.29 c
LRWC (%)82.13 ± 5.51 a81.12 ± 4.47 a76.15 ± 5.52 b64.61 ± 7.27 c
AN (μmol CO2 m−2 s−1)3.22 ± 0.19 a3.26 ± 0.18 a3.12 ± 0.22 a1.43 ± 0.45 b
gs (mmol m−2 s−1)0.045 ± 0.002 a0.046 ± 0.003 a0.034 ± 0.002 b0.027 ± 0.003 c
LT (mmol H2O m−2 s−1)0.88 ± 0.08 a0.83 ± 0.07 a0.76 ± 0.09 b0.57 ± 0.98 c
LWUE (μmol CO2/mmol H2O)3.65 ± 0.21 b3.92 ± 0.12 a4.10 ± 0.21 a2.51 ± 0.24 c
LAI (dimensionless)3.25 ± 0.19 a2.87 ± 0.27 b2.59 ± 0.22 b2.01 ± 0.24 c
Note: Means with different letters in the same row are statistically different (Tukey, p = 0.05). Values are means ± standard deviation.
Table 4. Average fruit weight (FW), fruit weight per tree (FWT), fruit yield (FY), and fruit size code percentages (FSC 1, 2, and 3).
Treatments (kPa)FW (g)FWT (kg plant−1)FY (t ha−1)FSC 1 (%)FSC 2 (%)FSC 3 (%)
T1 (−10 FL, −10 FR)88.89 ± 4.5 a58.81 ± 2.3 a39.03 ± 0.85 a58.95 ± 2.3 a25.36 ± 1.3 d15.69 ± 2.1 g
T2 (−10 FL, −35 FR)89.52 ± 3.3 a58.49 ± 2.5 a38.29 ± 0.78 a57.21 ± 2.4 a22.46 ± 1.7 f20.33 ± 2.3 ef
T3 (−35 FL, −35 FR)87.23 ± 6.5 a57.96 ± 3.7 a38.63 ± 0.65 a58.17 ± 2.2 a27.22 ± 2.1 e14.61 ± 2.4 g
T4 (−35 FL, −10 FR)89.29 ± 4.2 a57.82 ± 2.4 a37.98 ± 0.74 a56.79 ± 2.1 ab24.17 ± 1.5 d19.04 ± 2.2 f
T5 (−10 FL, −60 FR)87.98 ± 4.1 a56.45 ± 3.2 ab38.09 ± 0.98 a56.92 ± 2.1 ab22.33 ± 1.9 f20.75 ± 2.2 ef
T6 (−60 FL, −10 FR)85.96 ± 5.8 a56.97 ± 3.9 ab36.71 ± 0.98 ab55.83 ± 3.4 b25.05 ± 1.7 de19.12 ± 2.5 f
T7 (−35 FL, −60 FR)89.13 ± 4.7 a56.08 ± 3.5 ab37.95 ± 1.15 a56.24 ± 1.9 ab21.35 ± 1.4 f22.41 ± 2.9 de
T8 (−60 FL, −35 FR)86.54 ± 5.9 a56.67 ± 3.6 ab36.83 ± 1.12 ab55.90 ± 1.9 b21.13 ± 2.4 f22.92 ± 2.7 de
T9 (−60 FL, −60 FR)86.58 ± 4.6 a55.23 ± 2.3 b34.91 ± 1.24 b52.07 ± 2.3 b25.98 ± 2.5 de21.95 ± 2.6 ef
T10 (−10 FL, −85 FR)77.26 ± 4.8 b29.34 ± 4.2 e20.78 ± 1.16 c41.95 ± 2.5 c36.97 ± 2.3 b21.08 ± 2.4 ef
T11 (−60 FL, −85 FR)72.59 ± 6.1 c25.61 ± 3.6 f18.41 ± 1.32 d37.12 ± 2.2 d30.30 ± 2.9 c32.58 ± 2.7 b
T12 (−35 FL, −85 FR)78.76 ± 5.8 b28.12 ± 3.7 e19.53 ± 0.98 cd40.91 ± 3.1 c32.27 ± 2.8 c26.82 ± 3.3 c
T13 (−85 FL, −10 FR)78.46 ± 5.3 b19.57 ± 4.7 g13.89 ± 0.98 e33.97 ± 1.9 e39.08 ± 3.1 a26.95 ± 3.4 c
T14 (−85 FL, −35 FR)76.13 ± 6.2 b18.36 ± 3.7 g14.12 ± 1.12 e34.12 ± 2.4 e40.40 ± 2.9 a25.48 ± 3.6 cd
T15 (−85 FL, −60 FR)76.46 ± 6.8 b14.46 ± 3.5 h9.79 ± 1.28 f29.84 ± 2.1 f39.91 ± 2.7 a30.25 ± 2.5 b
T16 (−85 FL, −85 FR)70.23 ± 7.2 c10.27 ± 4.6 i6.84 ± 1.34 g26.07 ± 2.6 g30.25 ± 3.3 c43.68 ± 2.8 a
Note: Means with different lowercase letter in column are statistically different (Tukey, p = 0.05). FL: flowering phenological phase. FR: fruit growth phenological phase. Values are means ± standard deviation.
Table 5. Percentage of fruits with sun spots (FWSS), percentage of fruits with scarring (FWS), fruits luminance (L*), fruits chroma or color saturation (C*), and fruits hue or color angle (h°) in the treatments evaluated.
Treatments (kPa)FWSS (%)FWS (%)L*C*h°
T1 (−10 FL, −10 FR)0.24 ± 0.02 d0.04 ± 0.10 e45.12 ± 3.4 c35.51 ± 3.5 c123.74 ± 5.2 a
T2 (−10 FL, −35 FR)0.25 ± 0.03 d0.07 ± 0.12 e44.88 ± 2.9 c35.76 ± 2.7 c122.42 ± 5.1 a
T3 (−35 FL, −35 FR)0.25 ± 0.03 d0.04 ± 0.13 e45.27 ± 5.7 c35.96 ± 3.9 c122.18 ± 5.2 a
T4 (−35 FL, −10 FR)0.24 ± 0.02 d0.05 ± 0.11 e44.94 ± 4.2 c36.14 ± 3.1 c121.71 ± 6.2 a
T5 (−10 FL, −60 FR)0.31 ± 0.03 d0.09 ± 0.11 e45.16 ± 3.9 c37.85 ± 3.4 cb120.82 ± 6.4 a
T6 (−60 FL, −10 FR)0.27 ± 0.04 d0.05 ± 0.18 e46.96 ± 6.5 c36.21 ± 4.2 c121.15 ± 5.9 a
T7 (−35 FL, −60 FR)0.37 ± 0.02 d0.07 ± 0.14 e45.37 ± 4.5 c37.97 ± 3.7 cb120.53 ± 5.2 a
T8 (−60 FL, −35 FR)0.26 ± 0.04 d0.06 ± 0.12 e45.09 ± 4.5 c36.28 ± 4.4 c121.81 ± 6.3 a
T9 (−60 FL, −60 FR)1.23 ± 0.05 c1.32 ± 0.19 d46.71 ± 4.9 c37.52 ± 6.1 cb119.89 ± 6.2 ab
T10 (−10 FL, −85 FR)2.25 ± 0.41 b2.51 ± 0.31 c54.25 ± 5.2 b39.99 ± 4.3 b118.11 ± 5.6 bc
T11 (−60 FL, −85 FR)3.25 ± 0.43 a4.21 ± 0.54 b54.18 ± 3.9 b46.27 ± 3.8 a116.48 ± 5.2 c
T12 (−35 FL, −85 FR)2.31 ± 0.34 b 2.98 ± 0.34 c53.09 ± 3.5 b40.08 ± 4.2 b117.22 ± 4.4 bc
T13 (−85 FL, −10 FR)0.57 ± 0.06 d1.87 ± 0.63 d46.44 ± 4.2 c35.89 ± 4.2 c120.64 ± 6.5 a
T14 (−85 FL, −35 FR)0.67 ± 0.08 d1.65 ± 0.48 d45.12 ± 5.4 c36.12 ± 4.1 c121.07 ± 5.7 a
T15 (−85 FL, −60 FR)1.92 ± 0.19 bc1.89 ± 0.55 d54.28 ± 6.5 b39.54 ± 6.1 b118.74 ± 4.9 bc
T16 (−85 FL, −85 FR)4.21 ± 0.51 a6.51 ± 0.72 a57.56 ± 7.8 a47.28 ± 5.8 a115.28 ± 5.2 d
Note: Means with different lowercase letter in column are statistically different (Tukey, p = 0.05). FL: flowering phenological phase. FR: fruit growth phenological phase. Values are means ± standard deviation.
Table 6. Fruit juice content (FJC), fruit peel thickness (FPT), juice total soluble solids content (TSS), juice titratable acidity (TA), and TSS/TA ratio.
Treatments (kPa)FJC (%)FPT ** (mm)TSS (°Brix)TA ** (%)TSS/TA **
T1 (−10 FL, −10 FR)49.2 ± 2.3 a2.80 ± 0.228.34 ± 0.86 b6.93 ± 0.361.20 ± 0.13
T2 (−10 FL, −35 FR)48.9 ± 2.7 a2.80 ± 0.288.35 ± 0.85 b6.92 ± 0.371.21 ± 0.11
T3 (−35 FL, −35 FR)48.7 ± 2.4 a2.73 ± 0.238.48 ± 0.87 b7.00 ± 0.321.21 ± 0.12
T4 (−35 FL, −10 FR)49.3 ± 2.2 a2.85 ± 0.198.36 ± 0.86 b6.95 ± 0.431.20 ± 0.13
T5 (−10 FL, −60 FR)45.2 ± 2.4 ab2.78 ± 0.228.47 ± 0.87 b6.90 ± 0.481.22 ± 0.14
T6 (−60 FL, −10 FR)47.1 ± 2.6 ab2.85 ± 0.218.69 ± 0.98 b7.18 ± 0.401.21 ± 0.15
T7 (−35 FL, −60 FR)45.5 ± 2.3 ab2.88 ± 0.278.62 ± 0.88 b7.01 ± 0.421.21 ± 0.13
T8 (−60 FL, −35 FR)47.1 ± 2.6 ab2.89 ± 0.218.64 ± 0.96 b7.07 ± 0.431.20 ± 0.14
T9 (−60 FL, −60 FR)45.7 ± 3.2 ab2.82 ± 0.278.64 ± 1.01 b7.12 ± 0.581.21 ± 0.15
T10 (−10 FL, −85 FR)42.3 ± 2.7 b2.89 ± 0.258.67 ± 1.11 b7.18 ± 0.771.22 ± 0.14
T11 (−60 FL, −85 FR)42.2 ± 3.5 b2.99 ± 0.299.68 ± 1.21 a7.20 ± 0.891.27 ± 0.19
T12 (−35 FL, −85 FR)42.5 ± 3.2 b2.97 ± 0.278.59 ± 1.13 b 7.12 ± 0.681.22 ± 0.16
T13 (−85 FL, −10 FR)45.6 ± 2.5 ab2.89 ± 0.258.65 ± 0.98 b7.07 ± 0.461.22 ± 0.14
T14 (−85 FL, −35 FR)45.4 ± 3.8 ab2.91 ± 0.278.55 ± 0.89 b7.11 ± 0.471.20 ± 0.15
T15 (−85 FL, −60 FR)43.6 ± 3.2 b2.98 ± 0.289.24 ± 1.1 ab7.23 ± 0.981.29 ± 0.19
T16 (−85 FL, −85 FR)38.8 ± 3.4 c3.11 ± 0.369.84 ± 1.32 a7.32 ± 1.111.46 ± 0.21
Note: Means with different lowercase letter in column are statistically different (Tukey, p = 0.05). FL: flowering phenological phase. FR: fruit growth phenological phase. Values are means ± standard deviation. ** No statistical difference between treatments.
Publisher’s Note: MDPI stays neutral with regard to jurisdictional claims in published maps and institutional affiliations.

