
External Phosphorus Loading in New Lakes
by
 , , , ,
Theis Kragh
1,* ,
,
Thor Kolath
1,
Anja Svane Kolath
1,
Kasper Reitzel
1,
Kenneth Thorø Martinsen
2,
Martin Søndergaard
3 ,
,
Carl Christian Hoffmann
3,
Lars Baastrup-Spohr
2 and
Sara Egemose
1 1
Department of Biology, University of Southern Denmark, 5230 Odense, Denmark
2
Freshwater Biological Laboratory, Biological Institute, University of Copenhagen, 2100 Copenhagen, Denmark
3
Department of Ecoscience, Aarhus University, 8600 Silkeborg, Denmark
*
Author to whom correspondence should be addressed.
Water 2022, 14(7), 1008; https://doi.org/10.3390/w14071008
Submission received: 7 February 2022
/
Revised: 7 March 2022
/
Accepted: 15 March 2022
/
Published: 22 March 2022
(This article belongs to the Topic Aquatic Ecological Monitoring and Wastewater Treatment in Agricultural Systems)
Abstract
:The water quality of lakes is highly dependent on external phosphorus (P) loading. The vast external loadings from sewage and other wastewater discharge that European lakes have historically received have been dramatically reduced today by improved wastewater treatment. Gaining knowledge of the catchment characteristics that influence external P-loading should enable predictions of the achievable water quality of lakes. In this study, we tested this proposition. Data from 90 new Danish lakes show no apparent relationship between the mean summer P-concentration and the size or land use of the catchments. The external P-loading and resulting annual P-concentration were further investigated on a representative subset of 12 of the new lakes, using six methods. Three of the methods used empirical estimates of P-transport from catchments, based on the national average P-transport, runoff-dependent P-transport, and crop-dependent P-transport, and the other three methods used different empirical models tested on the lakes. External P-loading was reliably predicted by several of the methods. The predictions of the annual P-concentration were highly dependent on the inclusion of annual runoff. However, the predicted P-concentrations were generally overestimated, most pronounced for the nutrient-poor and most recently established lakes. In these lakes, internal P-loading was found to be the most important factor in predicting achievable water quality.
1. Introduction
Many lakes have been subject to eutrophication due to historical nutrient input from urban and rural sewage, as well as from runoff from agricultural catchments [1,2]. Implementation of regulations, e.g., the Danish action plans for the aquatic environment, led to improved wastewater management and markedly reduced the external phosphorus (P) loading to streams and lakes [1]. Despite the apparent reduction in external loading, the ecological state of many lakes has not improved as much as expected [3]. Two widely supported explanations are that lakes still receive substantial P from the increasingly intensified agricultural practices [1,4] and the recycling, over time, of internal P-pools accumulated in the sediment [5].
During the last three decades, more than 100 new lakes have been established in Denmark [6] and many more are to be created. Hence, there is great interest in ensuring that new lake ecosystems are as robust as possible. New lakes are not impacted by historical wastewater discharge in the same way as many natural lakes, though the inundation of previously terrestrial soils has been found to release a variable amount of P [7], after which the sediment–water exchange gradually diminishes [7,8,9]. Hence, there is great interest in ensuring that new lake ecosystems are as robust as possible. New lakes better reflect the present external loading, and P-transport from the catchment may be a key factor controlling the water quality of new lakes. If these expectations are shown to be relevant, then it becomes crucial to understand how catchment characteristics impact the external P-loading and the resulting water quality of new lakes.
Diffuse P-loading to lakes from the catchment is caused by atmospheric deposition, surface runoff, sub-surface runoff through the soil matrix of the root zone, and groundwater transporting natural and anthropogenic pollutants to surface waters [2,4,10]. Measurement of these discharges is more difficult than measurement of discharges from point sources such as wastewater from sewage, industry, aquaculture, and stormwater-related emissions. The P content in the latter discharges has been reduced considerably due to pre-release processing in wastewater treatment plants [5].
External P-loading to surface waters is dependent on the land use in the catchment [5]. The P-loading from point sources is primarily dependent on the characteristics and extent of urban development and the efficiency of wastewater treatment installations [5]. Diffuse P-loading is impacted by multiple parameters [11]. Forests and other natural habitats show low area-specific P-transport to lakes due to effective incorporation of phosphorus into biomass, high turnover and recycling of nutrients within the systems, and reduced use of fertilizer [4,12]. P-transport from agricultural areas depends on crops and fertilization practices and may be several times larger than transport from natural habitats [4,5].
Agricultural areas receive P as manure, sludge, and commercial fertilizers, and these P-inputs generally exceed P-removal through the harvest of crops, leading to accumulation and saturation of the P-binding capacity of the soils, and consequently increased P-transport to surface waters [4,5]. The proportion of P-saturated soils in Denmark has increased markedly during the last century [5]. However, 60–90% of P-transport from the agricultural area is incorporated into either mineral or organic matter or adsorbed to soil particles; only a minor fraction enters surface waters as dissolved P that is directly available to primary producers [13]. The transport of soluble P from natural soils is generally negligible, due to an excess of free adsorption sites that contain iron (Fe), aluminum (Al), or calcium (Ca) compounds [4]. Thus, P-transport depends on soil composition, and the ability to retain P increases with the proportion of small particles with P-sorption capabilities, such as clay colloids and minerals [14]. Therefore, the transport of dissolved P from sandy soils is higher than in loamy soils due to increased percolation and lower P-adsorption capacity [5]. The transport of both soluble and particulate P from agricultural soils is highly dependent on annual precipitation and the distribution of precipitation events [5,14,15]. Precipitation events following dry periods can result in increased P-transport from first flush surface runoff, leading to large variations in runoff P-concentrations even during a single precipitation event [16]. Following precipitation events, waterlogged soils show increased transport of both particulate and soluble P due to emerging reduced conditions decreasing the P-binding capacity of the soil [5,17]. In agricultural fields, tile drains may bypass water from potential P-binding sites in the soil matrix and thus increase the transport of both soluble and particulate P [5,11]. The increased intensity of precipitation events due to climate changes may, thus, increase the external P-loading to surface waters in the future [16].
The catchment slope influences the extent of soil erosion, and a steeper slope, especially of plowed or bare agricultural fields, increases the transport of particulate P [14,18]. When present next to streams and lakes, vegetation and semi-aquatic nature such as bogs, wetlands, and riparian meadows can reduce the input of soil and particulate P to surface waters [14,18,19]. Designated buffer zones have thus been established as tools to reduce diffuse P-loading [19].
Nielsen and Trolle [20] find that the annual TP-concentrations in natural Danish lakes were best described when including the entire catchment instead of only focusing on land use nearby, indicating that P from the entire catchment reached and influenced water quality. Statistical relationships between simple land use characteristics and the water quality of lakes are often weak and affected by current and historical point sources [1,20]. Methods of varying complexity have been developed to predict external P-loading from empirical data gathered from a variety of catchments [11].
Aim
The aim of this study was to investigate if the lake water P-concentration of new lakes can be predicted based on an analysis of their catchment characteristics. Catchment characteristics and P-concentration were identified for 90 new lakes. The relationships between catchment and lake water quality were compared to relationships found between the catchments and the water quality of natural lakes.
This study also used data from a subset of 12 of the lakes to investigate whether the external P-loading and resulting water quality could be determined using six methods of different complexity to predict the TP-transport of the catchment. The accuracy of the predictions of the six methods was further examined by assessing their relationship to direct measurements, and the trade-off between complexity and performance of the methods was assessed.
2. Methods
2.1. Study Design
This study investigated the catchment characteristics of all 90 lakes (Figure 1) identified in [6] or the Danish database of surface waters [21], and a representative subset of 12 lakes were selected and studied in detail. This study includes new or re-established lakes, either established where natural lakes had previously been drained and reclaimed for agricultural purposes or established where no natural lakes had previously existed, e.g., created on mineral excavation sites. The lakes were established to reduce N emissions, as a climate adaptation, or to improve recreational value and biodiversity [22]. The 12 new lakes selected for detailed studies are of different ages, sizes, and geographic locations within Denmark, and their catchments have a varying composition in relation to soil types and land use (see Table 1 and Figure 2).
2.2. Lake and Catchment Characteristics
Catchment characteristics were determined using geographical information systems (GIS; Mapinfo 11.5, 2021, Precisely, NY, USA). The lake area of the 90 new lakes was compiled from data from the Danish environmental agency or from recent high-resolution orthophotos [23]. For each lake, the topographical catchment area was delineated using a digital elevation model (1 m resolution) and layers containing streams and drains [23].

Table 1.
Year of establishment, year of sampling, the lake area, lake volume, catchment area, and annual hydrological residence time modeled from the DNC model of the 12 selected new lakes.
Table 1.
Year of establishment, year of sampling, the lake area, lake volume, catchment area, and annual hydrological residence time modeled from the DNC model of the 12 selected new lakes.
| Lake | ID | Established | Sampling | Lake Area | Catchment | Volume | Annual Net Precipitation a | ID15 Model Runoff | tW |
|---|---|---|---|---|---|---|---|---|---|
| Year | Year | ha | ha | 1000 m3 | mm Year−1 | 1000 m3 | Days | ||
| Alsønderup | ALS | 1987 | 2017 | 49 | 9789 | 407.2 | 250 ± 25 | 30,084 ± 8710 | 5 ± 2 |
| Botofte | BSM | 2009 | 2017 | 31 | 521 | 198.1 | 150 ± 25 | 842 ± 313 | 94 ± 48 |
| Bunds | BUN | 2015 | 2018 | 141 | 1057 | 3010.3 | 275 ± 25 | 2204 ± 703 | 424 ± 186 |
| Bølling | BOL | 2004 | 2018 | 344 | 2643 | 4838.4 | 400 ± 50 | 34,450 ± 3187 | 49 ± 6 |
| Egå | EGA | 2006 | 2019 | 112 | 5436 | 992.9 | 275 ± 25 | 16,375 ± 4371 | 22 ± 9 b |
| Filsø | FIL | 2013 | 2018 | 889 | 10,468 | 7626.7 | 450 ± 25 | 51,615 ± 6264 | 50 ± 8 c |
| Gyldensteen | GES | 2014 | 2017 | 139 | 112 | 510.3 | 175 ± 50 | 672 ± 68 | 203 ± 44 d |
| Hindemade | HIN | 1994 | 2018 | 41 | 6248 | 302.5 | 400 ± 50 | 29,519 ± 2324 | 4 ± 1 e |
| Syberg | SYB | 2017 | 2018 | 29 | 306 | 635.8 | 125 ± 25 | 574 ± 174 | 380 ± 175 |
| Lillelund | LES | 2015 | 2018 | 4.5 | 149 | 70.5 | 450 ± 50 | 2326 ± 314 | 11 ± 2 |
| Rønnebæk | RBS | 2018 | 2018 | 8 | 270 | 74.6 | 175 ± 25 | 658 ± 100 | 41 ± 9 f |
| Vilsted | VIL | 2006 | 2017 | 450 | 8857 | 5439.7 | 300 ± 50 | 38,230 ± 5308 | 50 ± 10 g |
The land use of the catchment of all 90 new lakes was determined from a simple division into six categories: nature, agriculture, urban, park, forest, and unclassified—which includes features such as barren soil, building sites, small roads and paths, or areas that for some reason have not yet been classified (see Figure 2; see also Supplementary Materials). Soil composition within the catchments of the 12 selected lakes was divided into the categories sand, loamy sand, sandy loam, loam, and humus (Figure 2). For use in the determination of external P-loading by empirical values and models (see below), soil composition was further simplified into sand (sand and loamy sand) and loam (sandy loam, loam, and humus). Land use in the catchments of the 12 selected lakes was determined by analysis of more detailed data, including 24 land use categories, and was updated according to the latest orthophotos, thus taking land use changes since 2014 into account. Agricultural land use was further investigated by identification of crop distribution collected into seven categories: wheat, maize, other cereals (e.g., rye, barley, and oats), legumes (e.g., rapes and peas), grass (used for forage), fallow (fallow fields and areas out of rotation), and all other crops (e.g., potatoes, carrots, and onions) (Figure 2). For use in the determination of external P from crop-specific empirical values, the average distribution of area covered by the crop categories for five years (2014–2018) was used.
2.3. Determination of External P-Loading
P-loading from point sources within each of the 90 catchments was identified [30]. All point sources and associated annual TP discharges within the catchments were identified and summed. The loading from point sources was cross-checked by comparing our results with the Danish national catchment model (DNC model) (see Table 2).
Diffuse external P-loading (TPDiffuse), from diffuse runoff and leaching from the catchment, was determined by six methods. Three models are based on empirical values of TP-transport from the catchment (national average, runoff dependent, and crop distribution). Two empirical models estimate catchment-specific TP-transport from catchment characteristics (Models 4 and 5), and the sixth model is based on the DNC model (Model 6).
The first model, national average, estimates TPDiffuse from empirical values of the average TP-transport from Danish agricultural land (0.3–0.5 kg P ha−1 year−1) [31]. The cover of agriculture, park, and unclassified in the catchment was calculated as an interval using the minimum and maximum coverage. The nature (lakes and streams excluded) and forest categories were designated with an average P-transport of 0.09 kg P ha−1 year−1 corresponding to the diffuse P-transport of uncultivated natural areas [31]. Diffuse P-loading from the urban catchment was assumed negligible due to the sewage systems, and urban P was assumed only lost from point sources.
The second model, runoff dependent, accounts for the high correlation between soil composition, annual rainfall, and runoff and P-transport from the catchment [15,31]. TPDiffuse was calculated by using regression models (Supplementary Materials) of P-transport and runoff from agricultural catchments [31]. For the agriculture, park, and unclassified cover, minimum and maximum TP-transport were calculated from the regression models that contain TP-transport and runoff from Danish loamy and sandy catchments [31]. A specific TP-transport was calculated for loamy and sandy soil for each catchment. To determine total TP-loss, these values were added to diffuse P-loss from nature, urban, and forest and were determined as described in the national average approach.
The third model, crop distribution, utilized empirical values of crop-specific diffuse TP-transport [4]. TPDiffuse was estimated from the average crop distribution over a five-year period, as described above. P-transport from fields with different crops was estimated from empirical values: 3.5 kg P ha−1 year−1 for wheat [32,33], 6.3 kg P ha−1 year−1 for maize [33], 1.0 kg P ha−1 year−1 for other cereals and legumes [34,35,36,37,38], 0.80 kg P ha−1 year−1 for grass [37,39], and 0.56 kg P ha−1 year−1 for fallow fields [33,36,40]. P-transport from forests with coniferous trees was calculated using the empirical value 0.12 kg P ha−1 year−1 [35,36] and with deciduous trees 0.02 kg P ha−1 year−1 (calculated from [12]). The diffuse P-transport of the park and unclassified categories was calculated with the empirical value of fallow fields. To determine total TP-loss, these values were added to diffuse P-loss from nature and urban categories were determined using empirical values as described in the first approach.
External P-loading (TPExternal) from the above three methods based on empirical values (national average, runoff dependent, and crop distribution) was calculated using TPDiffuse in addition to P from point sources and the contribution from atmospherically deposited P. Atmospheric deposition was calculated from the lake area and area of other lakes and streams in the catchment using the average atmospheric TP deposition in Denmark of 0.22 kg ha−1 year−1 [41].
The fourth and fifth approaches to predict TPDiffuse are based on empirical models that describe variations in TP-transport to surface waters due to differing catchment characteristics [11,15]. Both models were validated using data from Europe, Model 4 was validated using P-transport from 108 catchments smaller than 100 km2 situated in 10 European countries, and Model 5 was validated using 24 small Danish catchments.
Model 4 [15]:
Variables included in Model 4 are the proportion of the catchment used for agriculture, the area of the catchment in km2 and ha, and the catchment runoff in mm year−1. TPtransport was calculated for both the minimum and maximum runoff, and TPDiffuse was stated as an interval for each catchment.
Variables of Model 5 are the proportion of the catchment used for agriculture, the proportion of sandy soils, and the proportion of buffer areas, calculated as the wet and occasionally wet habitats of the catchment, e.g., lakes, bogs, riparian meadows, and wetlands. Model 5 also includes the average slope of the stream bed and the quick flow, a fraction of the runoff [11]. Quick flow was the speed of the water flow at the fastest-responding part of the stream-flow hydrograph after at least one year of flow measurements from the station closest to the lake’s inlet. In catchments without streams, the average slope of the catchment was determined, and for catchments not containing water flow stations, the quick flow was calculated using data from the closest station outside the catchment.
Briefly, Models 4 and 5 first predicted diffuse P-transport (TPTransport) in kg TP ha−1 year−1. This was then multiplied by the number of hectares that comprise the catchment area to determine TPDiffuse. To obtain TPExternal, P discharged from point sources and supplied by atmospheric deposition was summed.
TPExternal was also estimated using the sixth approach, the Danish National Catchment (DNC) model, designed to calculate the monthly water runoff, TN, and TP-transport from land to the coastal environment [42,43]. The DNC model is based on a combination of flow measurements and a deterministic hydrological model established for Denmark’s 3195 hydrological units [44,45]. P-transport was determined from a combination of monitoring measurements at gauging stations and modeled P-loading from unmeasured catchments based on empirical models of catchment characteristics, including P-retention in upstream lakes and external P-loading from point sources [45,46,47].
The DNC model was used to estimate runoff and P-transport to each lake by using data from the hydrological subunits within the lake catchments [44]. In lake catchments containing several hydrological subunits, the water runoff and P-transport of all subunits were summed. Catchments including only a fraction of a hydrological subunit were assumed to receive runoff and P equal to the fractional cover. Both water runoff and P-transport from the catchment were calibrated to the local conditions by calculating correction factors for each month from gauging stations within the catchment. The correction factor was calculated from the difference between the modeled water runoff and TP-transport compared to actual measurements for at least three years from a gauging station. For catchments containing several gauging stations, correction factors were calculated using data from the station closest to the lake inlet, and the same monthly correction factors were used for all hydrological subunits within the catchment. For catchments not containing a gauging station, data from the station closest to the catchment were used for the calculation of the correction factors.
TPExternal was calculated as the sum of the corrected P-transport from the DNC model as an average for the period 2008–2018 and the atmospheric deposition.
2.4. Determination of Lake TP
TP in the 12 selected new lakes was measured from water sampled from the epilimnion at the deepest part of the lake once a month from May to September, in November, and in February the following year. Each lake was sampled during one year—either 2017, 2018, or 2019 (Table 1)—and TP was measured spectrophotometrically (Koroleff [48]. The annual TP-concentration (TPAnnual) was calculated as a time-weighted average from all measurements, and the mean summer TP-concentration (TPSummer) was calculated as a time-weighted average from the five measurements from May to September. TPSummer of 78 other new lakes collected from [21]. TPSummer was calculated from the most recent survey (between 2007 and 2017 for included lakes) for lakes monitored for several years. For most of the 90 new lakes, the hydrological residence time (tW) was not known; as a proxy, the catchment area (CA) to lake area (LA) ratio was determined for each lake (Figure 3). CA:LA ratios were used as a proxy because the ratio has been found to correlate negatively with tW [49] and also showed a significant power function for the 12 selected lakes (R2 = 0.66, p < 0.05; Supplementary Materials).
TPInlet was calculated from TPExternal, as determined by each of the six methods described above. Next, for each lake, a bathymetric map (1 m resolution) was constructed from manual depth measurements using bilinear interpolation [50], and the lake volume was calculated as the product of mean depth and surface area. The tW was calculated by dividing the volume of each lake by the annual water runoff [51]. Both TPInlet and tW were calculated for the minimum and maximum annual water runoff conditions from the corrected runoff, estimated by the DNC model from 2008 to 2018 [44], and the net precipitation on the lake surface [24]. Thus, the DNC model provided annual TPInlet and tW for each year between 2008 and 2018, thus enabling calculation of TP annual average (TPModAnnual) and not only at the minimum and maximum runoff.
The models used to calculate TPAnnual were validated using empirical data of Danish lakes [52]. Three models were used: one adapted for lakes with a short residence time (Model A, tW < 1 month), one for lakes with a long residence time (Model B, tW > 1 month), and one for all lakes with a measured TPAnnual below 0.2 mg TP L−1 (Model C, TP < 0.2 mg L−1).
2.5. Determination of Internal P-Loading
The internal P-loading (TPInternal) of the 12 selected lakes was estimated from the maximum increase in monthly TP-concentrations during the period May–September [53], corrected for TP-input from the inlet and TP discharge from the outlet. The external TP-loading to the lakes during this period was calculated from the DNC model with a monthly resolution, and the outlet of P from the lakes was calculated from the runoff modeled by the DNC model. Water level changes within the lakes were measured according to Kragh and Andersen [54] continuously (accuracy of 1 mm) using a submerged pressure sensor (Odyssey, Dataflow Systems, Christchurch, New Zealand). This information enabled quantification of daily surface area and volume of the lake in 1 cm-depth intervals.
Table 2.
External P-loading from point sources, external P-loadings (TPExternal) calculated using the six methods, and the estimated internal P-loading (TPInternal).
Table 2.
External P-loading from point sources, external P-loadings (TPExternal) calculated using the six methods, and the estimated internal P-loading (TPInternal).
| ID | GIS | Topographic | National Average | Runoff Values | Crop Values | DNC Model | TPInternal | TPInternal % of TPExternal | ||
|---|---|---|---|---|---|---|---|---|---|---|
| Model # | Model 1 | Model 2 | Model 3 | Model 4 | Model 5 | Model 6 | ||||
| kg year−1 | kg year−1 | kg year−1 | kg year−1 | kg year−1 | kg year−1 | kg year−1 | kg year−1 | kg season−1 | % | |
| ALS | 3064 | 2843 ± 870 | 4820 ± 479 | 4663 ± 128 | 7072 | 8727 ± 474 | 4531 | 3852 ± 815 | −223 | −3–−5 |
| BSM | 0 | 19 ± 4 | 142 ± 42 | 162 ± 14 | 484 | 162 ± 13 | 100 | 115 ± 46 | 90 | 19–90 |
| BUN | 0 | 12 ± 14 | 414 ± 133 | 558 ± 44 | 2068 | 731 ± 59 | 353 | 390 ± 127 | 348 | 17–99 |
| BOL | 24 | 28 ± 13 | 652 ± 154 | 609 ± 51 | 1483 | 896 ± 67 | 284 | 1149 ± 133 | 166 | 11–59 |
| EGA | 999 | 951 ± 225 | 2527 ± 504 | 2365 ± 166 | 6106 | 3559 ± 214 | 2319 | 1918 ± 448 | 203 | 23–9 |
| FIL a | 75 | 36 ± 25 | 3269 ± 964 | 3300 ± 247 | 13,250 | 16,777 ± 1397 | 4042 | 7006 ± 1052 | 1968 | 12–60 |
| GES | 4 | 0 | 63 ± 9 | 68 ± 3 | 105 | 69 ± 3 | 39 | 98 ± 20 | 38 | 36–97 |
| HIN b | 662 | 378 ± 159 | 2600 ± 635 | 2892 ± 198 | 9943 | 6228 ± 470 | 3302 | 2538 ± 305 | −389 | −4–−15 |
| SYB | 44 | 10 ± 2 | 120 ± 24 | 89 ± 7 | 319 | 107 ± 5 | 91 | 79 ± 21 | 84 | 26–106 |
| LES | 77 | 28 ± 4 | 100 ± 7 | 100 ± 2 | 104 | 102 ± 2 | 94 | 232 ± 30 | −9 | −4–−10 |
| RBS | 0 | 43 ± 11 | 86 ± 28 | 63 ± 9 | 282 | 78 ± 6 | 104 | 113 ± 18 | 17 | 6–27 |
| VIL c | 42 | 105 ± 68 | 2725 ± 843 | 2431 ± 215 | 10,652 | 10,223 ± 853 | 2706 | 3760 ± 547 | 367 | 4–15 |
Values reported as the averages ± standard deviation. Measurements of TPExternal to lakes previously studied: a TPExternal = 4490 kg TP year−1 for FIL in 2014 [7]. b TPExternal in HIN was measured to 3400 kg TP year−1 in 1995, 1600 kg TP year−1 in 1996, 2300 kg TP year−1 in 1997 [27] and to 2727 kg TP year−1 in 2003 [55]. c TPExternal = 4493 kg TP year−1 to VIL in 2015 [29].
2.6. Statistics
Statistical differences between the land use of the catchment of new lakes were identified by a one-way ANOVA. Linear relationships between TP-concentrations and catchment characteristics were assessed using the analysis tool pack for linear regression. Statistical analyses were performed with SigmaPlot 14.0. All statistics are reported as confidence intervals calculated with an alpha of 0.05 unless specified otherwise.
3. Results
3.1. Characteristics of New Lake Catchments
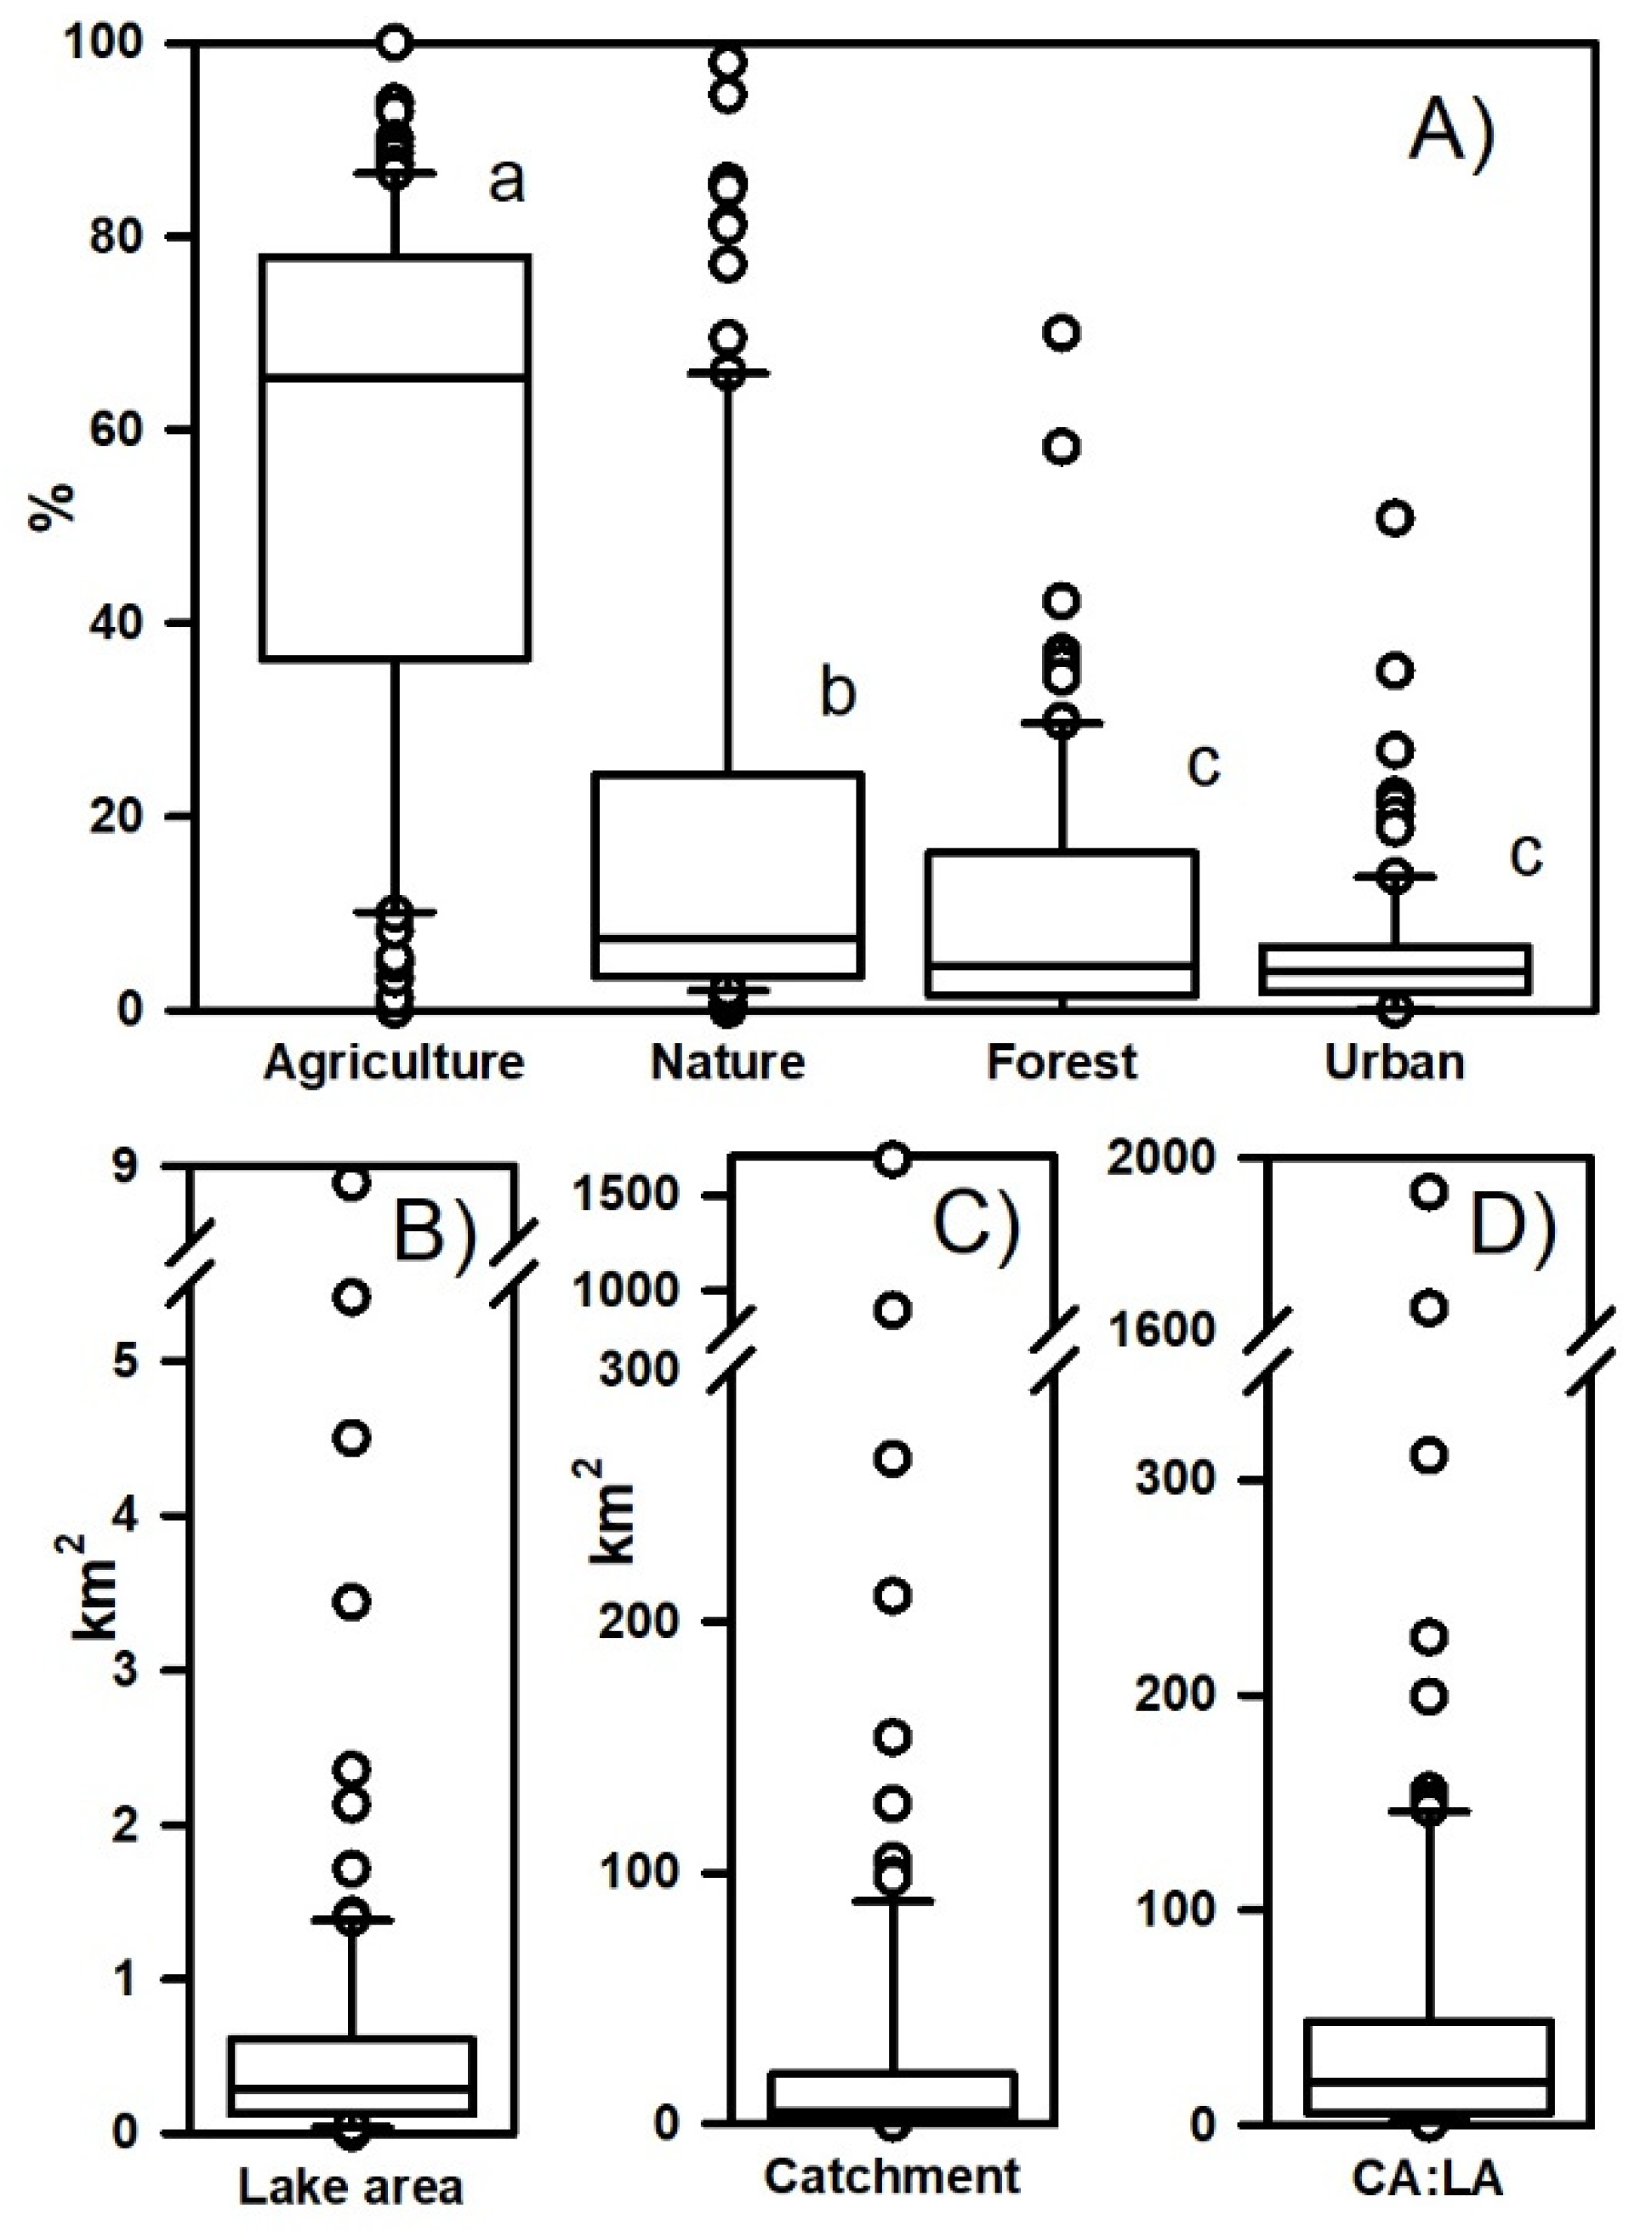
The 90 new Danish lakes showed a large variation in surface (0.01–8.9 km2) and catchment (0.1–1683.2 km2) area, dominated by similarly sized (CA:LA mean = 77, Figure 1) smaller lakes (>0.7 km2) and catchments (>49.2 km2). The land use of the catchments was dominated by agriculture, on average covering 57% of the catchments, significantly more than that by nature (19%), again constituting significantly more of the catchments compared to forest (11%) and urban (7%; ANOVA, p < 0.05 Figure 1).
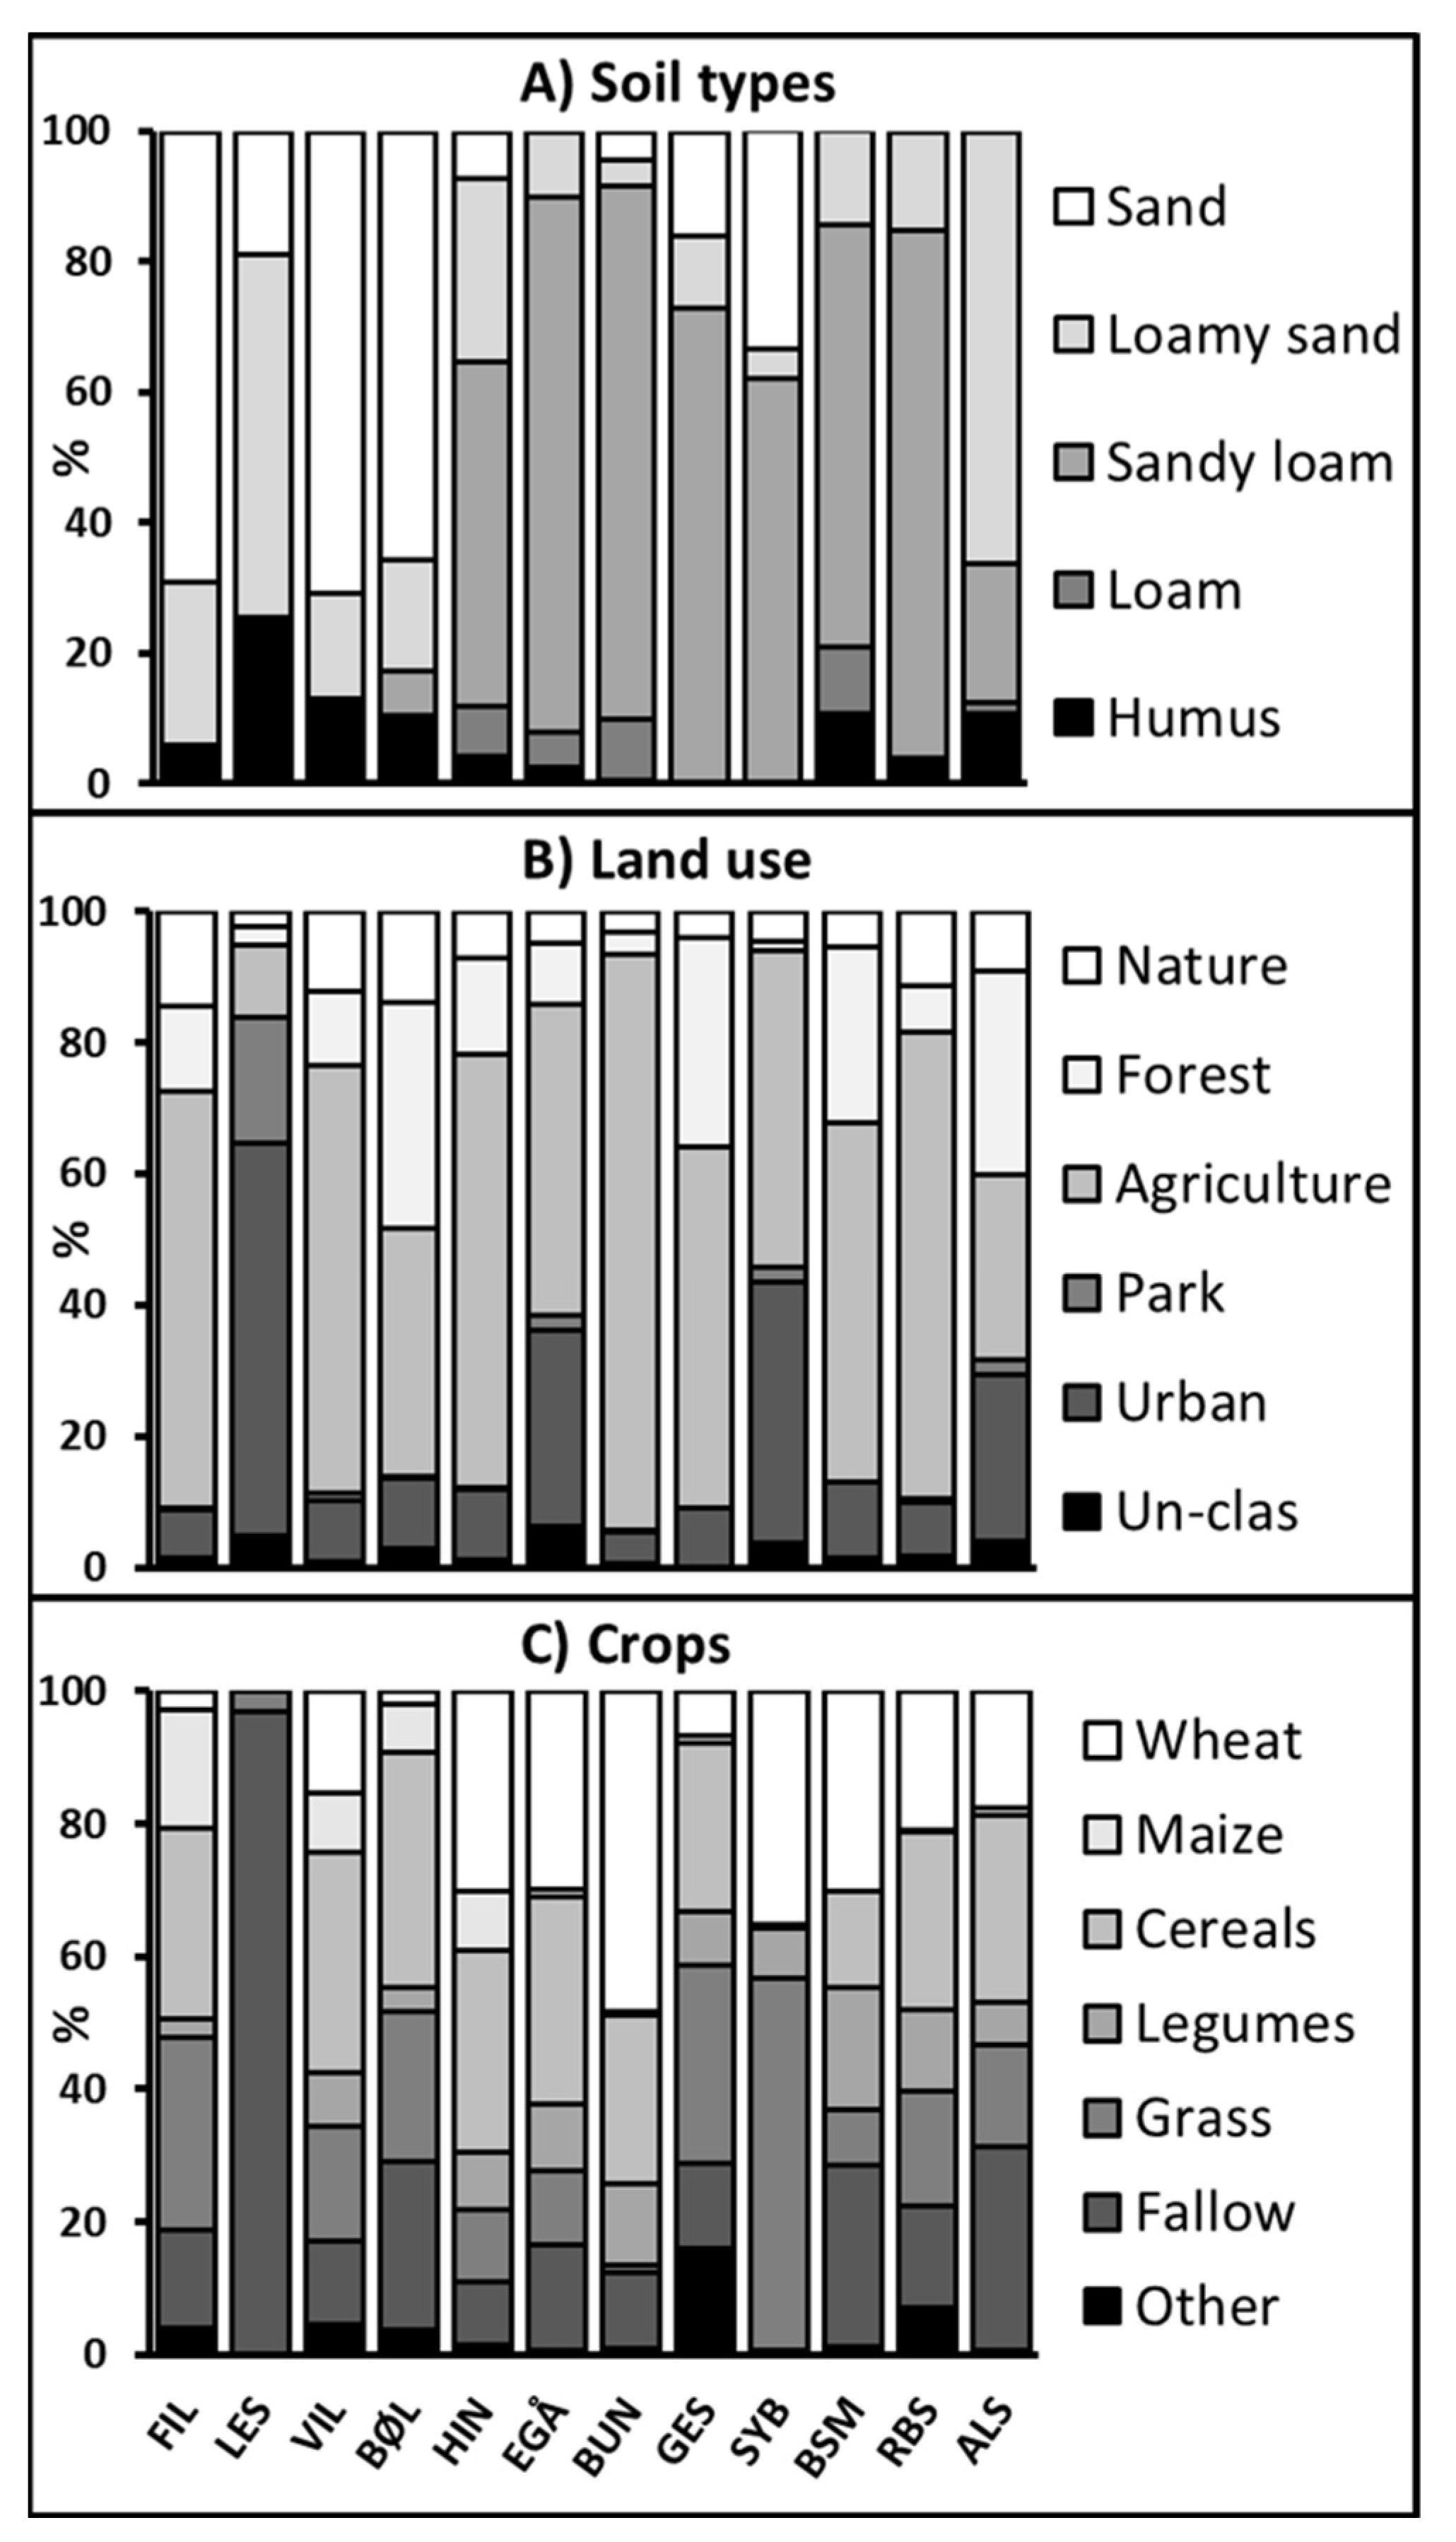
For the 12 selected new lakes, the soil composition of the catchments was dominated by sand and loamy sand for lakes in the western regions of Denmark (FIL, LES, VIL, and BOL) and also in ALS, while loamy soils dominated in the eastern regions (BSM, GES, SYB, RBS, BUN, HIN, and EGA). Loam and humus constituted only minor proportions of the catchments (Figure 2).
A large part of the catchments consisted of agriculture, constituting >50% except for the catchments of ALS, BOL, and LES. Forest constituted a major part of the catchment of ALS, BSM, BOL, and GES. Urban constituted a major part of the catchment of ALS, SYB, LES, and EGA. Nature, Park, and Unclassified only constituted minor parts of the catchments (Figure 2).
The catchments containing larger agricultural areas showed a similar crop distribution dominated by wheat, other cereals, grass, and fallow fields or areas out of rotation, each category constituting 10–25% of total area. Wheat was prominent in the catchments of the eastern lakes, while maize constituted a larger proportion (7–18%) in the catchment of only the most western-located lakes, and legumes and other crops only constituted small percentage of the catchments. Small catchments (GES, SYB, and LES) showed markedly different crop compositions and large variation between years (Figure 2). The hydrological residence time of the lakes varied considerably, from less than a week (ALS, HIN, and LES) to more than a year (BUN and SYB) (Table 1).
Relationships between TPSummer and Catchment Characteristics
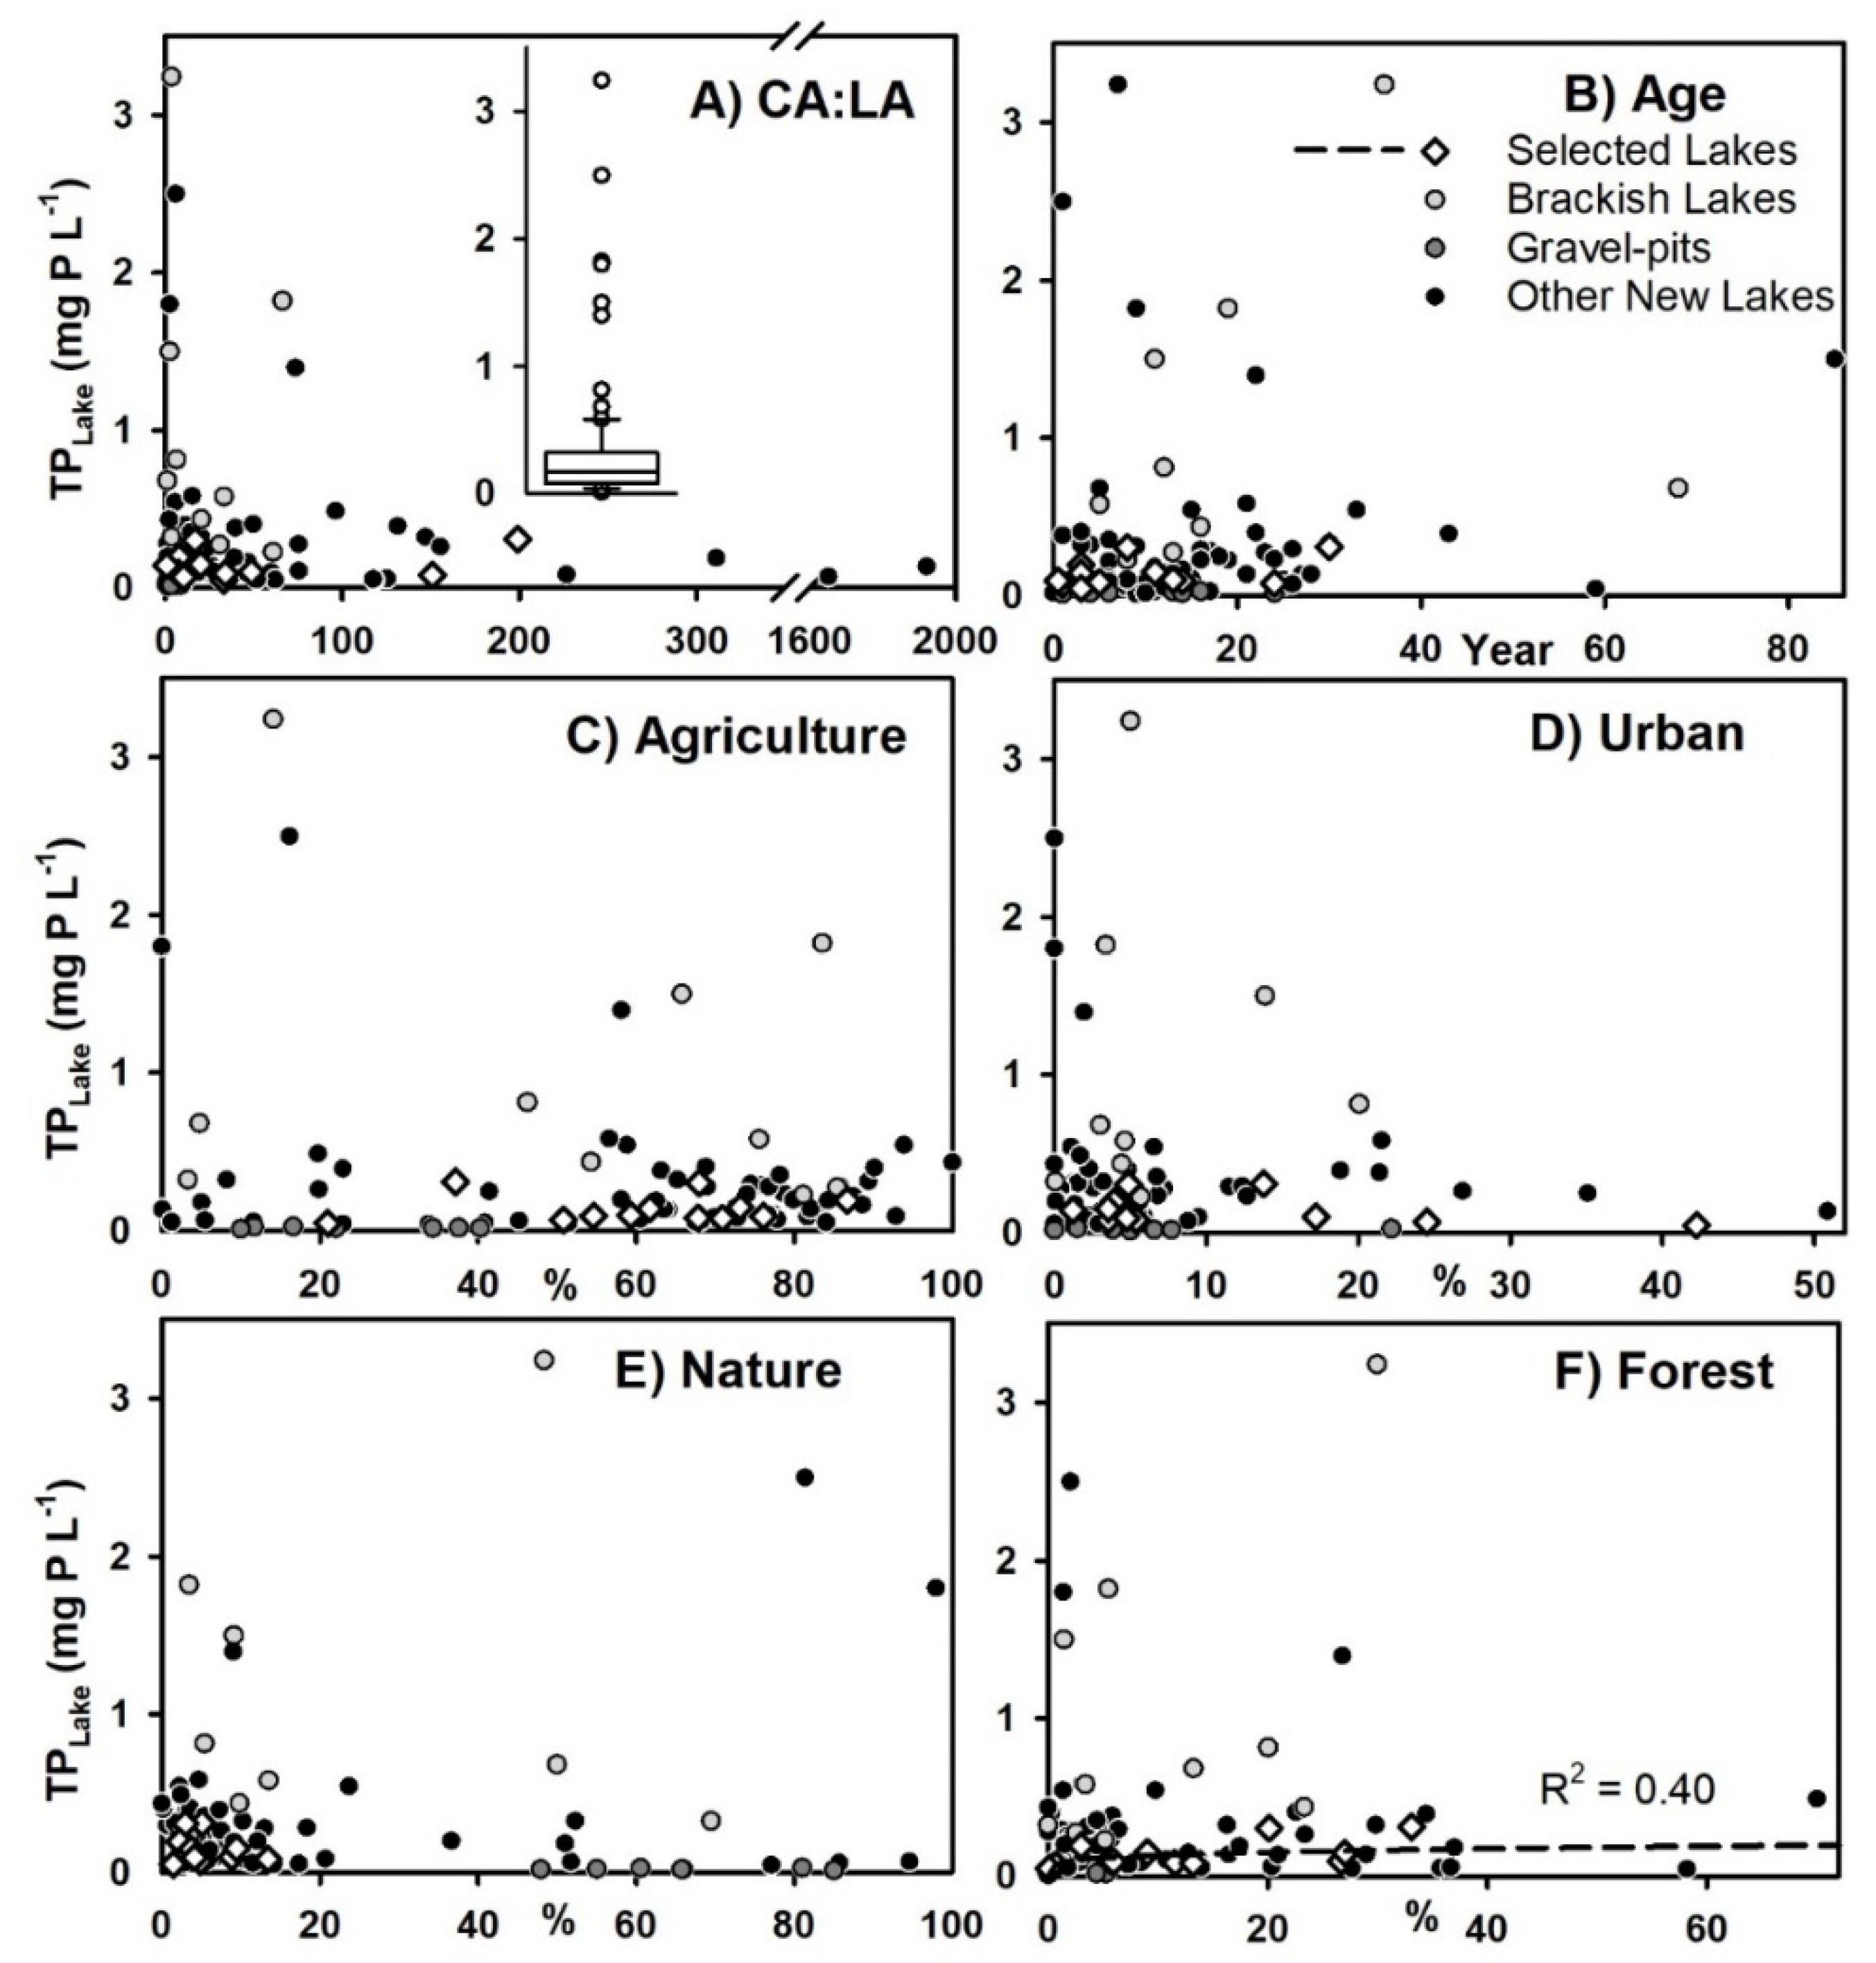
No significant linear, exponential, or power relationships could be identified between TPSummer of the 90 new lakes and the CA:LA ratio, the age of the lakes, or the proportion of agriculture, nature, forest, or urban of the catchments (Figure 3). The CA:LA ratio was low both for gravel-pit lakes (<9) and lakes with brackish water (<65, median = 13). TPSummer of the gravel-pit lakes was low (<0.026 mg TP L−1), and TPSummer of lakes with brackish water was high (up to 3.2 mg TP L−1, median = 0.63 mg TP L−1) regardless of land use (Figure 3). TPSummer showed a tendency to increase with the age of the 12 selected lakes and only lakes with CA:LA < 70 had TPSummer above 0.5 mg L−1.
TPSummer showed a tendency to increase with an increasing proportion of forest in the catchment of the 12 selected lakes (power: R2 = 0.40, p < 0.05) (Figure 4) and with an increasing proportion of agriculture (linear: R2 = 0.23, p > 0.05) and to decrease with an increasing proportion of urban (exponential: R2 = 0.26, p > 0.05) (Supplementary Materials).
TPSummer of the new lakes also showed a decreasing trend with an increasing proportion of nature (exponential: R2 = 0.31, n = 77, p < 0.05) and age (Figure 5) when excluding lakes with brackish water, BSM, and Birkesø, which indicate the presence of colonies of cormorant (Phalacrocorax carbo) and showing extreme TPSummer.
3.2. Prediction of External P-Loading
The external P-loading predicted by Models 3 and 4 was high compared to the other models, and Model 6 predicted the lowest load for most of the lakes (Table 2).
The same applied to the resulting TPModAnnual modeled from TPExternal (see Table 3). However, for the small and recently established lakes RBS and LES, Model 6 predicted high TPExternal compared to the other methods and TPModAnnual twice as high as the measured TPAnnual (Table 2 and Table 3.) Compared to the measured TPExternal of FIL, the closest predictions were from Models 2, and 6 overestimated the loading by more than 50%. For HIN, the predicted TPExternal of all methods except Models 3 and 4 falls within the measured external loading, with Model 6 correlating most closely to the actual measurements (Figure 6). The measured TPExternal of VIL was lower than the predictions from Models 3 and 4 and markedly higher than predictions by Models 1, 2, and 5. The average annual TPExternal predicted by Model 6 was also lower. However, Model 6 predicted an external loading of 4700 kg TP year−1 in 2015, deviating by less than 5% from the actual measurement.
The modeled TPModAnnual of the lakes were expected to constitute less than 100% of the measured TPAnnual, as the internal loading was expected to contribute to TPAnnual. All methods predicted TPModAnnual to represent less than 100% of TPAnnual for BOL (18–54%) and GES (23–77%). Model 6 showed a tendency to overestimate TPModAnnual with lower measured TPAnnual and showed a weak tendency toward increased overestimation for the most recently established lakes.
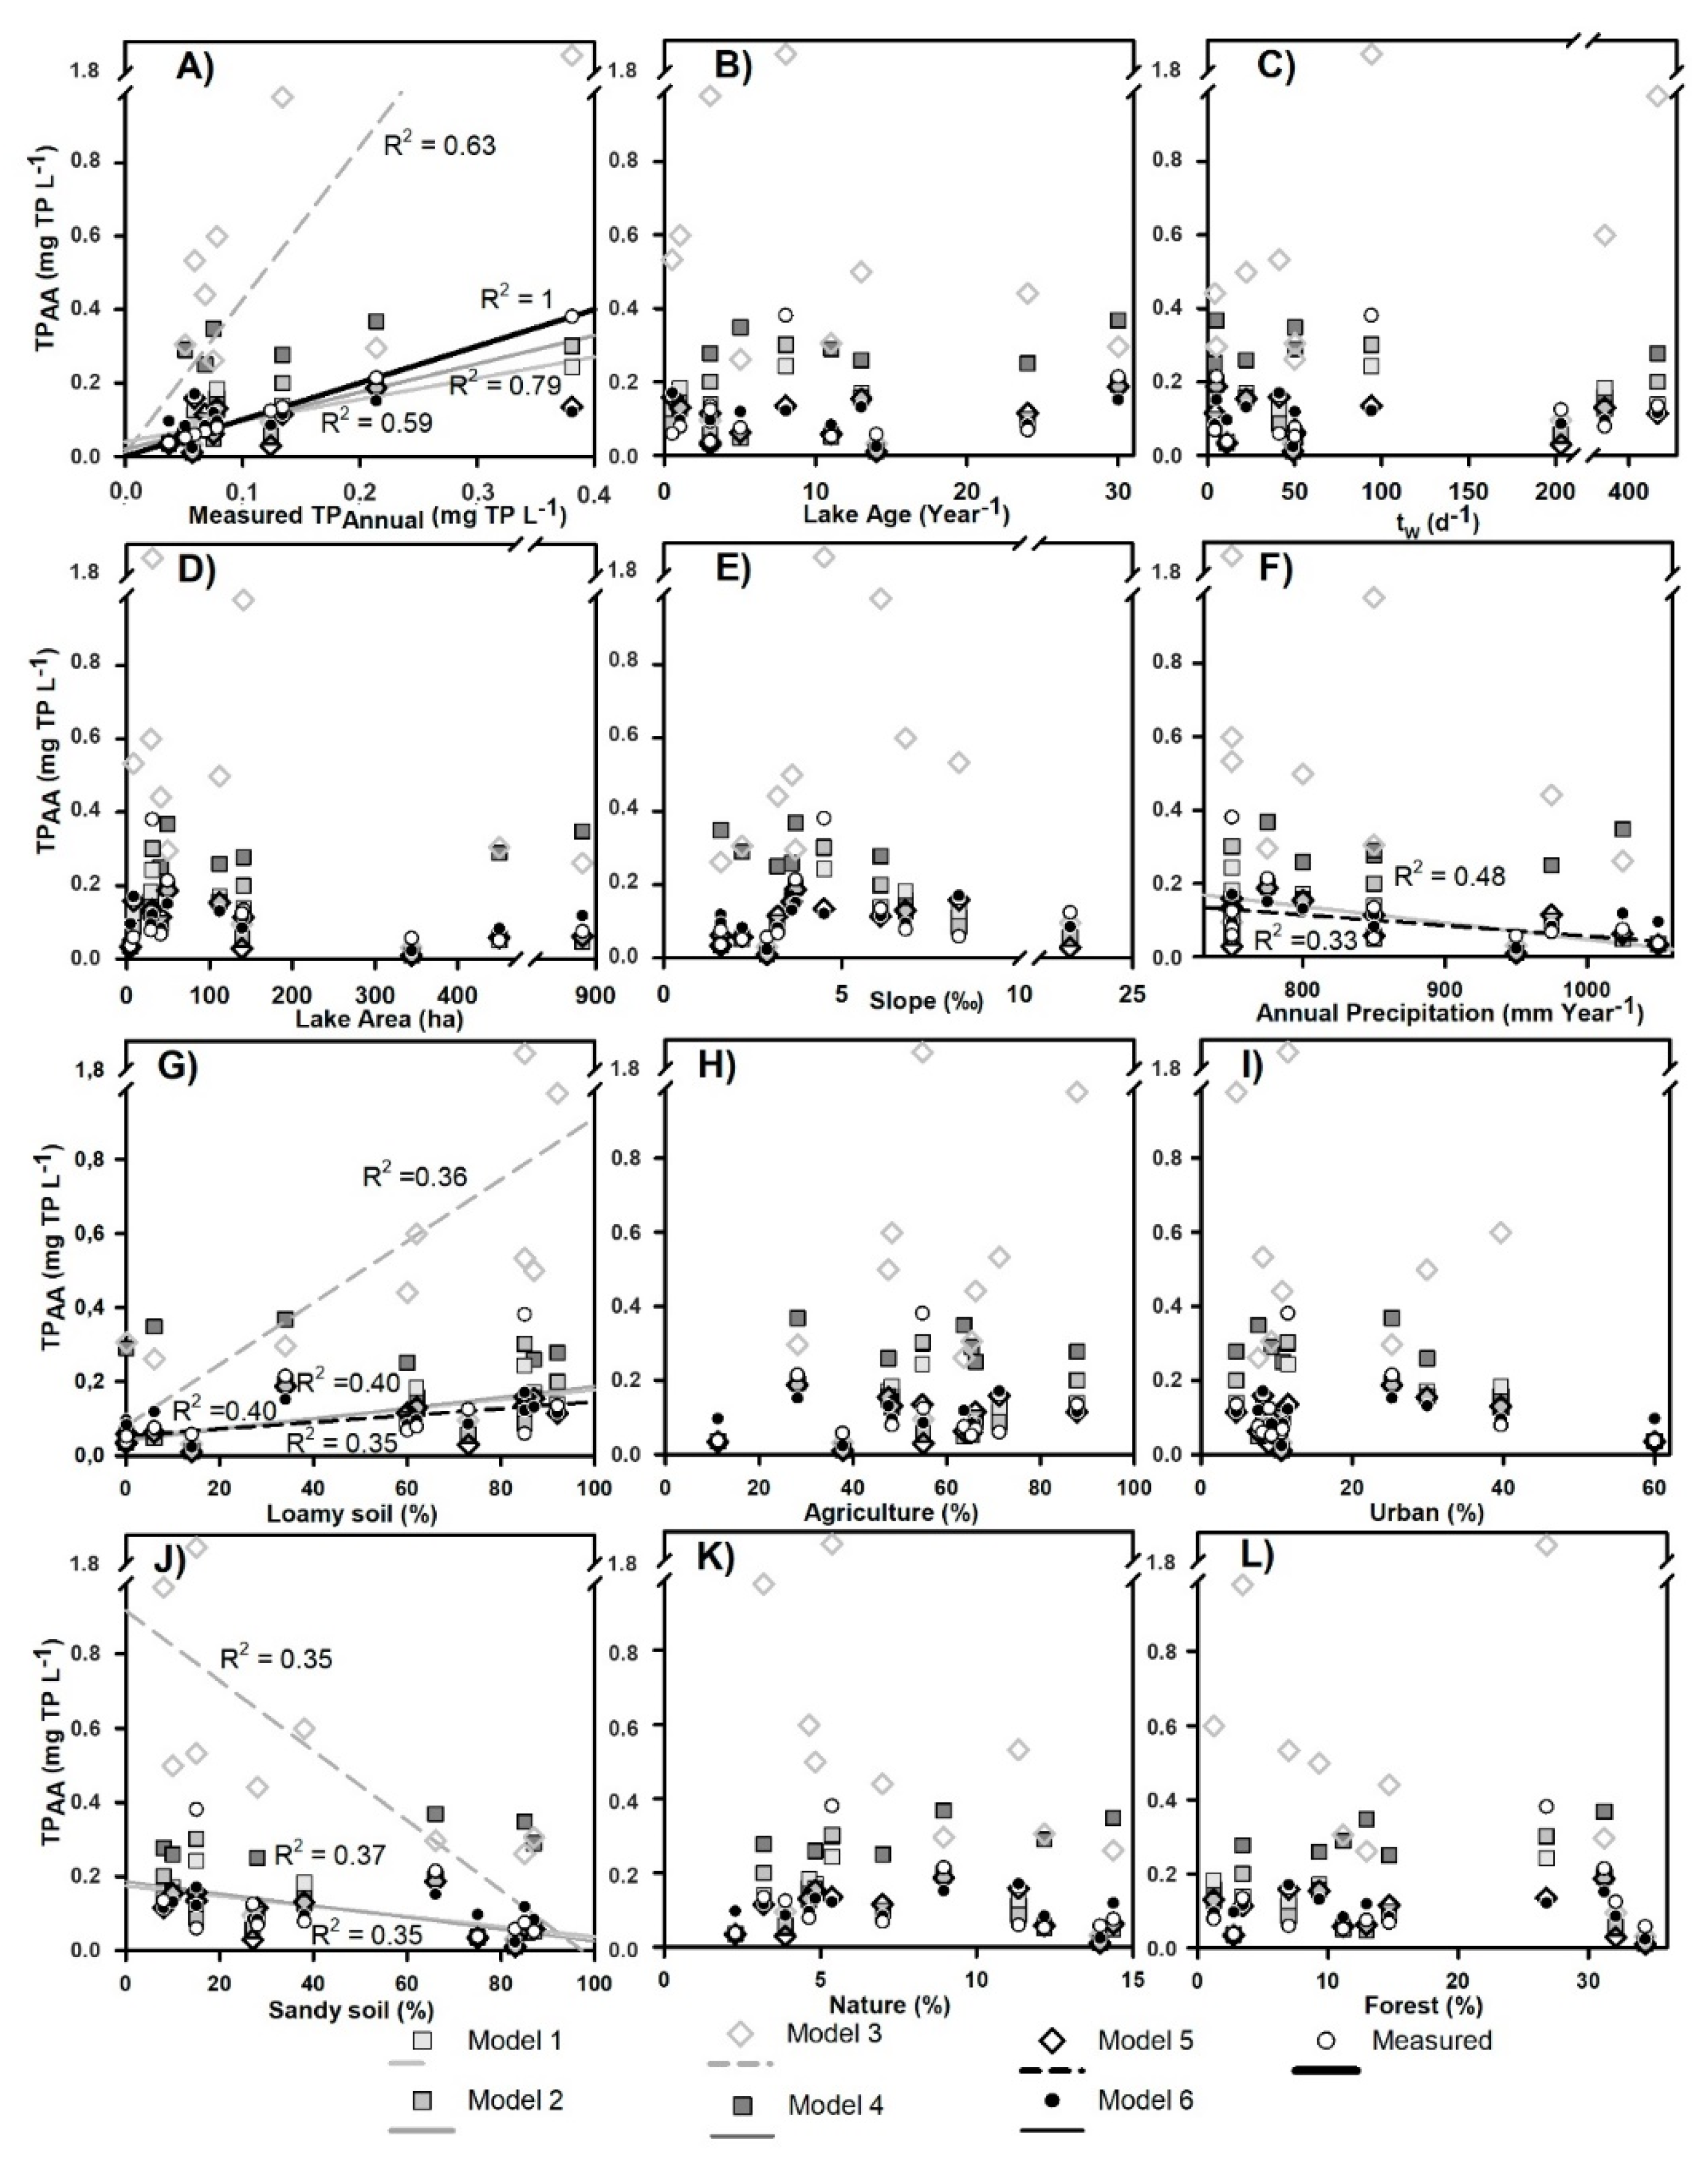
Models 1–3, based on empirical values, overestimated TPModAnnual compared to the measured TPAnnual, increasingly so as lake area, catchment cover of loamy soils, and agricultural land use increased (Figure 4).
There was a tendency for all six methods to overestimate TPModAnnual in lakes with low measured TPAnnual, except for Model 3 (Figure 4). TPModAnnual predicted by Models 1, 2, 5, and 6 showed a tendency to be closer to TPAnnual as the age and lake area increased. The discrepancy between modeled TPModAnnual concentrations also showed a tendency to decrease as catchment slope increased. No significant relationship between tW and TPModAnnual was found; however, TPModAnnual decreased with increased annual precipitation. TPModAnnual was estimated from Models 1,2 and 3 and increased significantly (p < 0.05) with an increased proportion of loamy soils in the catchments and decreased likewise for increasing proportions of sandy soils. TPModAnnual was not highly affected by the land use of the catchment. However, predicted TPModAnnual tended to increase (significantly increasing for Model 3) as the proportion of agriculture increased. Both TPAnnual and TPModAnnual decreased with increased proportions of the urban and nature categories, and the discrepancy between TPModAnnual estimated by the different methods decreased as the proportion of the catchment constituted by urban, nature, and forest increased (Figure 4; Supplementary Materials).
3.3. Internal P-Loading
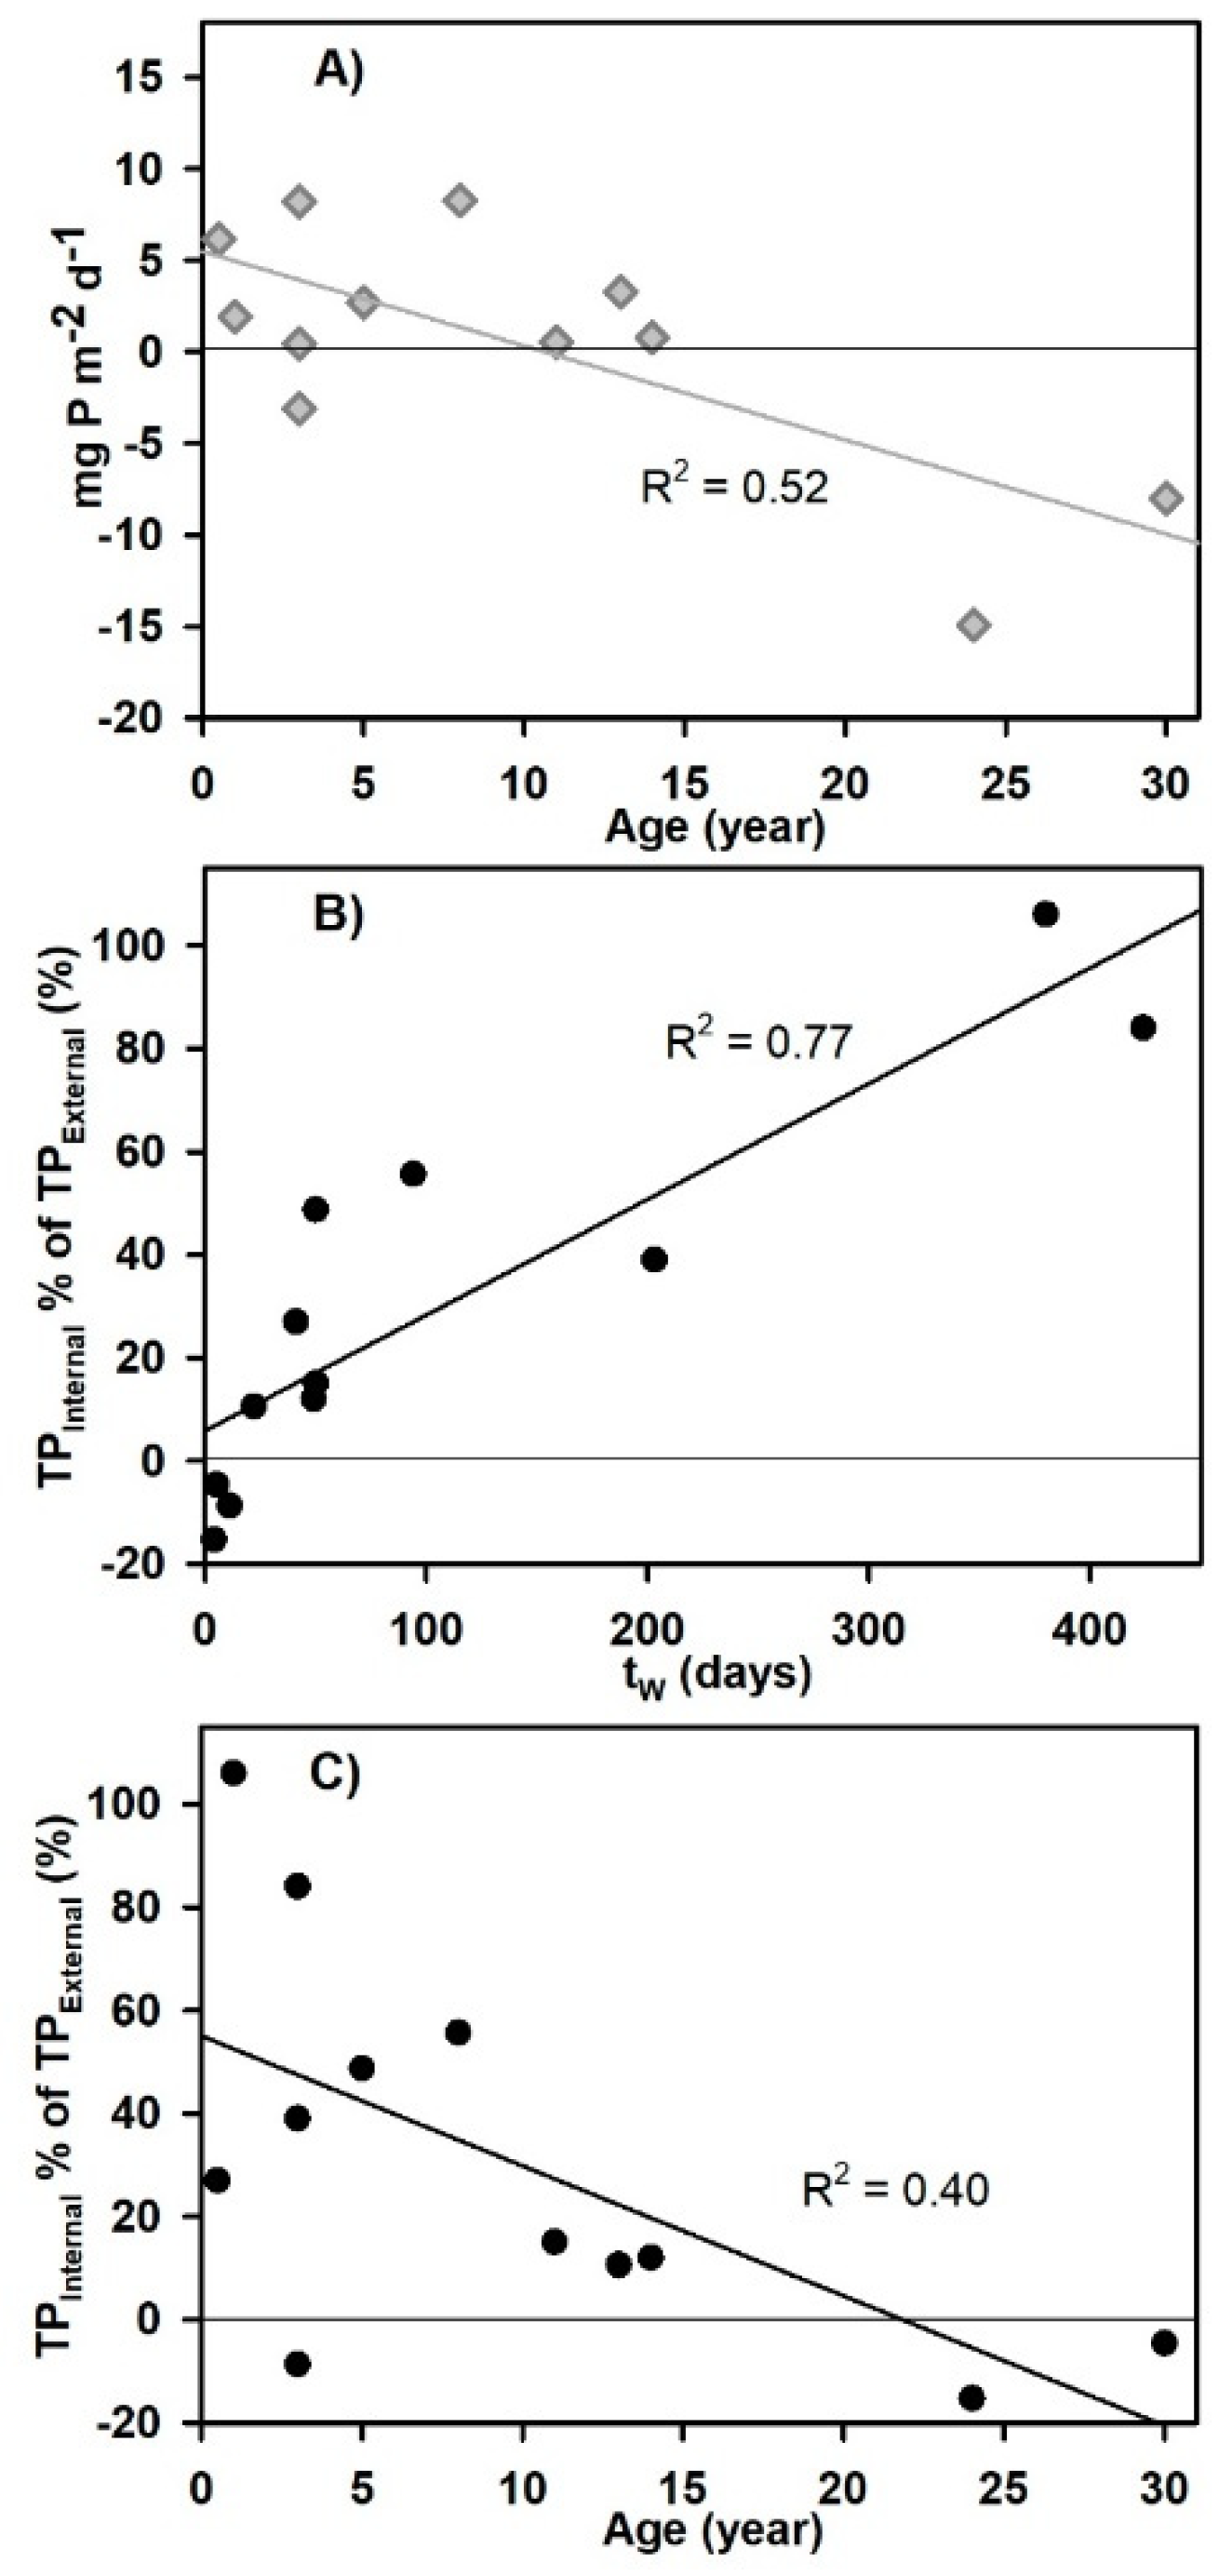
The internal loading was highly variable in the new lakes, and the importance of TPInternal in relation to TPExternal depended on the method used to estimate the external loading (Table 2). In ALS, HIN and LES, TPInternal was negative, indicating a net TP-uptake in the sediment. In contrast, TPInternal contributed up to 106% of TPExternal in SYB when utilizing the method that, for a given lake, predicted TPModAnnual closest to the measured TPAnnual. TPInternal decreased significantly with the age of the new lakes (R2 = 0.52, p < 0.05). The contribution of TPInternal in relation to TPExternal also decreased significantly with the age of the lakes (R2 = 0.40, p < 0.05), and the contribution of TPInternal in relation to TPExternal increased with longer tW (Figure 5). FIL showed a high TPInternal constituting a high proportion of TPExternal the large catchment and relatively short tW (Table 2; Figure 5). TPInternal also showed a tendency to be highest in lakes with catchments containing a high proportion of loamy soils; however, the regressions were not statistically significant (Supplementary Materials).
3.4. Temporal Resolution
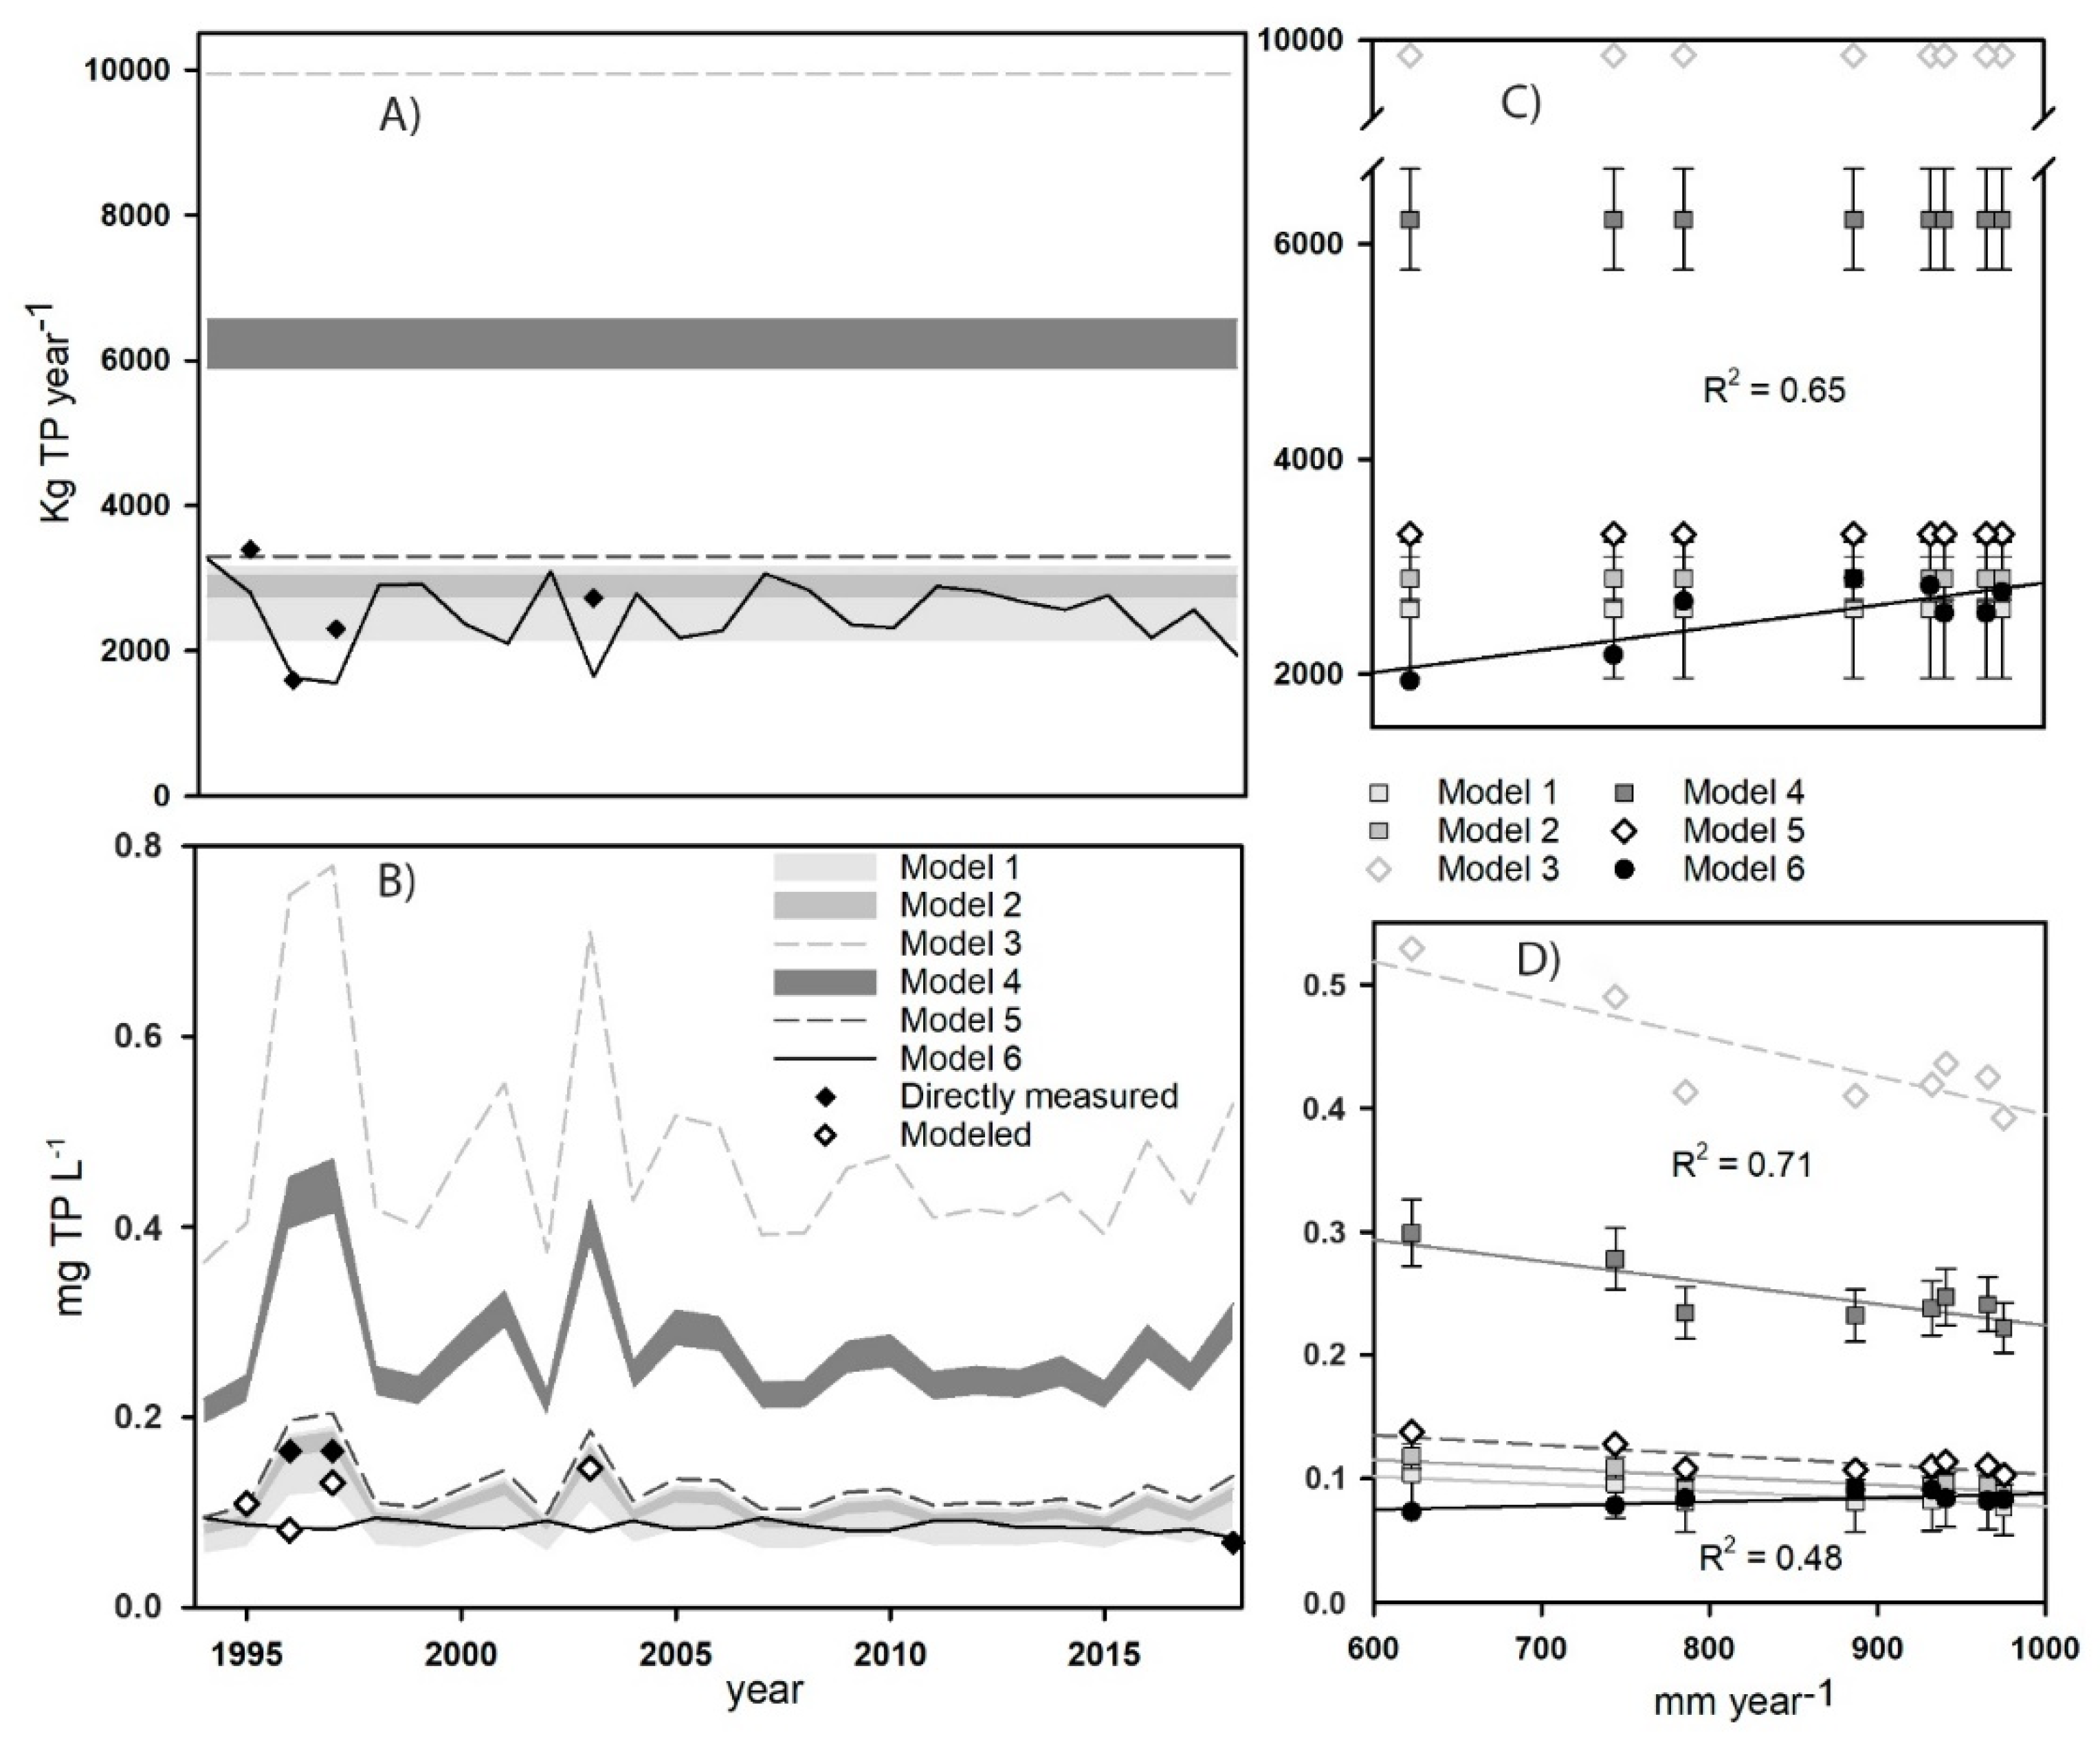
This study’s only method predicting TPExternal with a temporal element was Model 6 (Figure 6). Thus, TPExternal was constant despite the varying annual precipitation between years for all methods except for Model 6, showing a significant increase with increasing precipitation for HIN (R2 = 0.65, p < 0.05) (Figure 6C).
The measured TPExternal for HIN in 1996, 1997, and 2003 was lower than the predicted TPExternal by all methods except for Model 6, which predicted slightly lower external loadings for each year but containing the measured TPExternal within the range predicted by the model during the entire period. The annual differences highly influenced the TPAnnual predicted by all methods except for Model 6, resulting in the predicted TPAnnual deviating by up to 100% between years. The annual fluctuations in TPAnnual predicted by Model 6 were low in comparison to the other methods (Figure 6) due to the runoff-weighted annual TPExternal. TPAnnual of all methods except the Model 6 decreased with increased annual precipitation for HIN, showing a significant relationship (R2 = 0.71, p < 0.05), while the DNC model predicted an increased TPAnnual with a significant relationship (R2 = 0.48, p < 0.05) (Figure 6). The measured TPAnnual and TPAnnual modeled from the measured TPExternal in HIN were lower than predicted by all models, except in 1995 and except for the concentration predicted by Model 6 and the range of Model 1.
4. Discussion
4.1. Water Quality of New Lakes
The average TPSummer of the new lakes was 0.35 mg P L−1 (n = 90) and, thus, almost twice as high (0.20 mg P L−1) as found in a study of 412 natural Danish lakes [20]. The new lakes had on average a smaller surface area (new: 0.66 km2, n = 90 and natural: 0.80 km2, n = 414), and the area of the catchment was on average almost three times as large (new: 49.6 km2, n = 90 and natural: 17.5 km2, n = 414), all of which influences the differences in water quality [20]. On average, due to high P levels, the ecological state of the natural lakes was on the threshold of low ecological quality; the new lakes were even worse [3]. The median TPSummer of the new lakes was considerably lower (0.17 mg P L−1) than the average, as the average was skewed by four very new lakes with extremely high TP-concentrations.
However, the high TPSummer and larger catchment of new lakes could be anticipated since the majority of new Danish lakes are intended to retain nutrients and decrease emissions to natural recipients, and thus have been established where the effect would be largest [6,22]. High TPSummer could also be a result from the expected P-release after a lake is initially established on agricultural soil [8,56].
The correlation between lower TPSummer and proportions of nature catchment was expected due to the low TP-transport of this type of land use in comparison to agricultural areas [4,31]. However, this finding was statistically insignificant until we omitted lakes with brackish water and lakes with a high external loading from cormorant colonies [9,57]. Even though no obvious relationship was found between TPSummer and the proportion of agricultural areas of new lakes’ catchment, other studies have found TP-concentrations to increase with an increased agricultural catchment [20,58]. Thus, the higher proportion of agriculture may explain the lower water quality of the new lakes, since the average proportion of agriculture was higher (new: 57%, n = 90 and natural: 45%, n = 414) and the proportion of impermeable urban and forest areas on average was almost half that for the natural Danish lakes studied by Nielsen and Trolle [20].
The lack of significant regressions between water quality and the land use and size of the catchment indicates that point sources, internal P-loading, and or other catchment characteristics constituted important deterministic variables that have to be included in the prediction of the water quality of new lakes. The TPSummer of the 12 selected lakes increased as the proportion of agricultural catchment increased, which was in agreement with the higher expected TP-transport in such catchments [4,5]. However, that TPSummer decreased with an increased proportion of urban catchment for the 12 selected lakes was not expected and was driven by LES and SYB, with very low TPSummer. This could be explained by the small catchments of LES and SYB and that both lakes were recently established through excavation, removing P in the topsoil and possibly exposing P-binding sites in deeper soil layers that could sequester P from the water column [8]. Despite small catchments and land use, the high TPSummer found in the brackish new lakes suggests a low impact of the catchment on this type of new lake. This could be explained by nutrient input from the marine environment during storm events, low P-export and concentration of nutrients during dry periods, and a large external loading from birds [59]. In the brackish new Lake Østerø, birds supplied 72% of the annual external P-loading [57] and in BSM, a freshwater lake, bird droppings constituted up to 27.5% of the annual external loading [59]. Thus, further investigation of birds as a nutrient vector may aid in predicting the water quality of lakes in general.
Previous studies have improved the regressions between water quality, external TP-loading, and composition of the catchment by selecting lakes not impacted by point sources and divided lakes after depth, hydrological residence time, and water quality [20,60]. Thus, further division of the new lakes may improve the regressions obtained. However, new lakes are predominantly shallow [6], and regressions to CA:LA or the age of new lakes did not indicate obvious thresholds for division.
The general problem in analyzing all 90 new lakes was that data were obtained over a period of years, reflecting the water quality of years with varying precipitation and runoff conditions. In addition, land use information of the catchment for the year the model was constructed might have been different in the year TPSummer for all lakes measured. However, more than 70% of the TPSummer measurements were obtained between 2012 and 2016, only a few years on either side of the land use information used (2014), and land use changes can, on average, be expected to be minor at this time scale [61].
4.2. Determination of External P-Loading
The consistent overestimation of TPexternal and resulting TPModAnnual of the 12 selected lakes by Models 3 and 4 was likely caused by the inclusion of data not representative of Danish conditions. The empirical values for the crop-specific TP-transport of the catchment were calculated from the few available studies originating from different countries; these showed large variations in P-transport from the same crop [4]. This indicates that general tendencies of P-transport cannot be explained from crop distribution alone, probably due to soil type-specific P-contents and the effect of P-saturation of the soil, the slope of fields, and fertilization practices, all of which vary considerably among geological regions [4,5]. The method could be improved by customization to Danish conditions. However, this would require large-scale studies of P-transport from a large array of crops, and even these might not be adequate since parameters such as soil type, fertilization practices, and saturation level of the soils P-binding capacity have been suggested to be more important drivers of TP-transport from agricultural land [5,11]. The other models (Models 1, 2, and 5) based on empirical values predicted TPExternal and resulting TPModAnnual of the 12 lakes better. However, the broad interval of the national average TP-transport provided a similarly broad interval of TPExternal, decreasing the usefulness of this method for predicting a meaningful nutrient level for the management of newly established lakes. By incorporating runoff and simple division into soil types, both parameters easily available on a catchment scale, the runoff-dependent model provided a narrow interval of TPExternal and more reliable predictions of TPModAnnual. Thus, the importance of both runoff and soil type on the TP-transport of the catchment can be emphasized, which is also emphasized from the significant regressions between modeled TPModAnnual, precipitation, and soil type. Better predictions of TP may be obtained by further studies of TP-transport from catchments with varying soil composition, thus improving the specifications of the runoff-dependent empirical values of TP-transport.
Since Model 4 includes the impact of slope on TP, its high predictions were partly due to its incorporation of specifications based on data from European countries with a topography different from the flat Danish landscape [11,14,15].
Model 5 provided more reliable predictions than the first four models, which was expected since it is based exclusively on Danish conditions [11]. The inclusion of quick-flow and catchment-slope parameters contributes to better prediction of soil erosion under conditions prevailing in Denmark, as it better distinguishes between catchments with different slopes. By substituting the overall runoff with the quick flow, the TP-transport from Danish arable land was better described. Hence, the quick-flow fraction mainly depends on runoff from drainage pipes and shallow groundwater and depends on surface runoff to a lesser degree [11,15]. The inclusion of the catchment slope further enabled a reliable description of TP transported by surface runoff and lost from the catchment through stream bank erosion [11]. Its close predictions of TPModAnnual to actual TPAnnual thus imply that transport from drains and the root zone constitute an important route of TP-export from the arable catchment to new lakes [2,11]. Model 4 includes even more complex variables, and demands flow measurements of a certain detail that is not available for the catchments of all the selected new lakes and thus complicated the use of this method. GES and LES do not contain streams in the catchments, which possibly explains why their measured TPModAnnual is lower than that predicted by Model 4, since their quick flow was calculated on data obtained outside of these.
The division of Denmark into the hydrological units used in Model 6 and correction of the model to local gauging stations, thus describing TP-transport at the specific region of the catchment, were expected to result in predictions closest to the actual external export. Model 6 predictions of TPModAnnual are rather close to the actually measured TPAnnual of the selected new lakes with catchments comprised of one or more whole hydrological units. Thus, correction of the model output to local gauging stations generally seemed to provide reliable predictions. However, when the catchment constituted only a fraction of a hydrological unit, which is the case for several of the smaller lakes, the predicted TPModAnnual of these lakes was consistently high. This may explain the overestimation of RBS, which was possibly caused by the point source contribution predicted from the DNC model, which was not otherwise identified in the catchment. The DNC model uses the easily accessible data, since only the catchment area calculation was necessary. However, the model is based on data from gauging station measurements, which requires continuous operation and thus increases the cost of the method.
The ease of use and general performance of the methods to predict TPModAnnual of new lakes were assessed for the 12 selected new lakes; see Table 4.
The modeled TPModAnnual was expected to constitute less than 100% of the measured TPAnnual of the 12 selected lakes since a contribution to TPAnnual would be expected to be constituted by TPInternal. However, all methods showed a tendency to overestimate TPModAnnual of the nutrient-poor lakes and of the smallest lakes, which may be because the models used to estimate TPexternal and TPModAnnual primarily were modified in response to their ability to estimate P in larger eutrophic lakes and thus are not suited to estimate the conditions of small or nutrient-poor lakes [11,52]. This shortcoming was taken into account by calculating TPModAnnual from TPexternal based on the residence time and nutrient level of each lake [52]. However, the setpoint of “low” nutrient conditions of 0.2 mg P L−1 was still high compared to the nutrient-poor new lakes [52]. Thus, the estimations of water quality may be improved by the use of models based on conditions relevant to nutrient-poor lakes or new lakes. The P-retention in HIN and ALS may be explained by the high inlet concentration and high macrophyte cover, increasing particulate P retention, and P incorporation into biomass [62].
The methods that generally provide the closest estimations of the measured TPAnnual, Model 2 and Model 6, predicted rather low TPModAnnual, only constituting 32% and 35% of TPAnnual.
Their estimates of TPModAnnual tended to be high for the most recently established new lakes (SYB, LES, and RBS). However, the estimations improved with increased lake age, which could be expected since the models perform optimally when the lakes are in equilibrium [52], and recently established new lakes probably are not in equilibrium [7,8,9,56]. This shortcoming is also apparent in predictions of TPInternal, which was highest and constituted a greater influence on TPAnnual in the most recently established lakes, thus indicating that P was primarily released shortly after inundation and the P-exchange between water and lakebed gradually decreased, so that the nutrient levels became increasingly dependent on the external loading, as previously found [7,8,9,56]. The internal loading of recently established lakes also influenced the overestimation of TPModAnnual. The increased contribution of TPInternal to TPAnnual of lakes with a long residence time was also expected, due to the resulting lower external loading. The vast impact of TPInternal on FIL could be due to the young age of the lake, established in 2012, and due to frequent resuspension and increased mineralization of labile organic matter in the water column of this large and shallow lake [7]. The tendency of lakes with an increased proportion of loamy soils in the catchment and presumably the original lakebed to have higher TPInternal could be explained by the greater fertilization and P-binding capabilities of loamy soils [5] and the potential for larger P-pools to be released following inundation. This was also reflected in the regression of increased modeled TPModAnnual with an increased proportion of loamy soil in the catchment.
4.3. Temporal Resolution
In this study, the only method of predicting TPExternal with a temporal resolution was Model 6, which caused large fluctuations in the modeled TPAnnual of HIN by the other methods. Thus, the methods providing a constant TPexternal predicted a decreased TPAnnual for years with increasing precipitation and runoff due to dilution of the constant TPExternal. In comparison, TPAnnual, as predicted by Model 6, was corrected for annual runoff and thus predicted increased TPExternal and TPAnnual with increased annual precipitation and resulting runoff, leading to a larger transport of P to the new lakes from the catchment. Thus, the runoff-corrected TPExternal of Model 6 resulted in predicted TPAnnual only showing limited fluctuations between years and predicting TPAnnual slightly lower than the measured TPAnnual. The tendency of the discrepancy between measured and predicted TPAnnual of HIN to decrease with time indicated a larger internal loading during the first years after establishment, as expected [7,8]. The predicted TPAnnual of HIN by all the different methods showed the importance of including the annual runoff and deriving runoff-corrected TPExternal to obtain reliable predictions. However, the remaining methods could provide a temporal resolution by directly utilizing the annual runoff either from direct measurements or from modeled data instead of the interval of empirical values of runoff used in this study. Thus, annual resolution and dependence of annual fluctuations in precipitation and runoff could be obtained, provided sufficient data are available. However, this was not carried out in this study to avoid mixing of the methods used for the determination of TPExternal.
When determining the potential water quality achievable in future new lakes, the models presented here provide adequate information, since the general water quality is of interest and not the water quality of specific years. The models could be improved by incorporating the initial P-release from the inundated soil after establishment [7] and the potentially high loading from birds [59], at least for lakes with a long residence time and a relatively limited external loading from the catchment. Reliable prediction of the water quality of future lakes from the available catchment characteristics is a tool to assess the potential requirement of additional measures such as sedimentation ponds [63] and buffer zones [19] to reduce the external loading enough to acquire acceptable nature quality.
5. Conclusions
The best prediction of the water quality of new lakes can be achieved most easily and reliably by Model 6 if the catchment consists of one or more whole hydrological units. The water quality of lakes with small catchments that constitute only a fraction of a hydrological unit was not reliably predicted by this model. However, Models 2 and 5 provided more adequate predictions. Model 5 requires rather detailed information on the catchment and variables based on inlets from streams. Thus, the best achievable water quality predictions of new lakes with small catchments may be determined from empirical values of TP-transport, only requiring information on catchment soil composition and runoff. Generally, the internal P-loading was found to be most important in the most recently established lakes, and no significant regressions were found between water quality and land use of the catchment without further subdivision of the new lakes.
Supplementary Materials
The following supporting information can be downloaded at: https://www.mdpi.com/article/10.3390/w14071008/s1.
Author Contributions
Conceptualization, T.K. (Thor Kolath), T.K. (Theis Kragh), K.R. and S.E.; methodology, T.K. (Thor Kolath), T.K. (Theis Kragh), K.R., S.E., M.S. and C.C.H.; software, T.K. (Thor Kolath), T.K. (Theis Kragh) and K.T.M.; validation, T.K. (Thor Kolath), T.K. (Theis Kragh), S.E., K.R. and K.T.M.; formal analysis, T.K. (Thor Kolath), T.K. (Theis Kragh), A.S.K. and K.T.M.; investigation, T.K. (Thor Kolath), T.K. (Theis Kragh), A.S.K. and K.T.M.; resources, T.K. (Theis Kragh), K.R. and S.E.; data curation, T.K. (Thor Kolath) and T.K. (Theis Kragh); writing—original draft preparation, T.K. (Thor Kolath) and T.K. (Theis Kragh); writing—review and editing, T.K. (Theis Kragh), K.R., K.T.M., M.S., C.C.H., L.B.-S., A.S.K. and S.E.; visualization, T.K. (Thor Kolath) and T.K. (Theis Kragh); supervision, T.K. (Theis Kragh), K.R. and S.E.; project administration, T.K. (Theis Kragh) and S.E.; funding acquisition, T.K. (Theis Kragh). All authors have read and agreed to the published version of the manuscript.
Funding
This research was funded by Aage V. Jensen Nature Foundation, grant “New Danish Lakes”, “Mapping the catchment of Filsø” and “Monitoring Filsø”.
Data Availability Statement
Data used in the study is available as part of the Supplementary Materials.
Acknowledgments
We thank the Aage V. Jensen Nature Foundation for grants to T.K., K.R., M.S. and S.E. We thank David Stuligross for comments and linguistic corrections.
Conflicts of Interest
The authors declare that they have no known competing financial interests or personal relationships that could have appeared to influence the work reported in this paper.
References
- Jeppesen, E.; Jeppesen, E.; Søndergaard, M.; Kronvang, B.; Jensen, J.P.; Svendsen, L.M.; Lauridsen, T.L. Lake and Catchment Management in Denmark; Springer: Dordrecht, The Netherlands, 1999; pp. 419–432. [Google Scholar]
- King, K.W.; Williams, M.R.; Macrae, M.L.; Fausey, N.R.; Frankenberger, J.; Smith, D.R.; Kleinman, P.J.A.; Brown, L.C. Phosphorus Transport in Agricultural Subsurface Drainage: A Review. J. Environ. Qual. 2015, 44, 467–485. [Google Scholar] [CrossRef] [PubMed] [Green Version]
- Søndergaard, M.; Jeppesen, E.; Jensen, J.P.; Bradshaw, E.; Skovgaard, H.; Grünfeld, S. Vandrammedirektivet og Danske Søer. Del 1: Søtyper, Referencetilstand og Økologiske Kvalitetsklasser; Miljøundersøgelser: Rønde, Danmarks, 2003; p. 142. [Google Scholar]
- Reynolds, C.; Davies, P. Sources and bioavailability of phosphorus fractions in freshwaters: A British perspective. Biol. Rev. 2001, 76, 27–64. [Google Scholar] [CrossRef]
- Kronvang, B.; Iversen, H.L.; Jørgensen, J.O.; Paulsen, I.; Jensen, J.P.; Conley, D.J.; Ellermann, T.; Laursen, K.D.; Wiggers, L.; Jørgensen, L.F.; et al. Afdeling for Ferskvandsøkologi. In Fosfor i Jord og Vand Udvikling, Status og Perspektiver; Faglig Rapport fra DMU; Danmarks Miljøundersøgelser: Rønde, Denmark, 2001; p. 308. [Google Scholar]
- Hansen, K. Det tabte land: Den store fortælling om magten over det danske landskab. Gad 2008, 1, 847. [Google Scholar]
- Kragh, T.; Sand-Jensen, K.; Petersen, K.; Kristensen, E. Fast phosphorus loss by sediment resuspension in a re-established shallow lake on former agricultural fields. Ecol. Eng. 2017, 108, 2–9. [Google Scholar] [CrossRef]
- Kolath, T.; Reuss, L.; Egemose, S.; Reitzel, K. Reduction of Internal Phosphorus Load in New Lakes by Pretreatment of the Former Agricultural Soil—Methods, Ecological Results and Costs. Sustainability 2020, 12, 3575. [Google Scholar] [CrossRef]
- Sø, J.S.; Sand-Jensen, K.; Kragh, T. Optimal physical design in a new lake for reducing phosphorus pools. Ecol. Eng. 2021, 161, 106160. [Google Scholar] [CrossRef]
- Kristensen, E.; Madsen-Østerbye, M.; Massicotte, P.; Pedersen, O. Catchment tracers reveal discharge, recharge and sources of groundwater-borne pollutants in a novel lake modelling approach. Biogeosciences 2018, 15, 1203. [Google Scholar] [CrossRef] [Green Version]
- Andersen, H.E.; Kronvang, B.; Larsen, S.E. Development, validation and application of Danish empirical phosphorus models. J. Hydrol. 2005, 304, 355–365. [Google Scholar] [CrossRef]
- Hobbie, J.E.; Likens, G.E. Output of phosphorous, dissolved organic carbon, and fine particulate carbon from Hubbard brook watersheds. Limnol. Oceanogr. 1973, 18, 734–742. [Google Scholar] [CrossRef]
- Sharpley, A.N.; Smith, S.J.; Jones, O.R.; Berg, W.A.; Coleman, G.A. The transport of bioavailable phosphorus in agricultural runoff. J. Environ. Qual. 1992, 21, 30–35. [Google Scholar] [CrossRef]
- Ockenden, M.C.; Deasy, C.; Quinton, J.N.; Surridge, B.; Stoate, C. Keeping agricultural soil out of rivers: Evidence of sediment and nutrient accumulation within field wetlands in the UK. J. Environ. Manag. 2014, 135, 54–62. [Google Scholar] [CrossRef] [PubMed]
- Kronvang, B.; Bechmann, M.; Pedersen, M.L.; Flynn, N. Phosphorus dynamics and export in streams draining micro-catchments: Development of empirical models. J. Plant Nutr. Soil Sci. 2003, 166, 469–474. [Google Scholar] [CrossRef] [Green Version]
- Kragh, T.; Martinsen, K.T.; Kristensen, E.; Sand-Jensen, K. From drought to flood: Sudden carbon inflow causes whole-lake anoxia and massive fish kill in a large shallow lake. Sci. Total Environ. 2020, 739, 140072. [Google Scholar] [CrossRef] [PubMed]
- Gonzales-Inca, C.; Valkama, P.; Lill, J.; Slotte, J.; Hietaharju, E.; Uusitalo, R. Spatial modeling of sediment transfer and identification of sediment sources during snowmelt in an agricultural watershed in boreal climate. Sci. Total Environ. 2018, 612, 303–312. [Google Scholar] [CrossRef]
- Kronvang, B.; Hansen, B.; Hald, A.B.; Laubel, A.R.; Olsen, P. Jorderosion og bræmmer i landskabet. Vand Jord 2000, 7, 7. [Google Scholar]
- Hoffmann, C.C.; Kjaergaard, C.; Uusi-Kämppä, J.; Hansen, H.C.; Kronvang, B. Phosphorus Retention in Riparian Buffers: Review of Their Efficiency. J. Environ. Qual. 2009, 38, 1942–1955. [Google Scholar] [CrossRef]
- Nielsen, A.; Trolle, D.; Søndergaard, M.; Lauridsen, T.L.; Bjerring, R.; Olesen, J.E.; Jeppesen, E. Watershed land use effects on lake water quality in Denmark. Ecol. Appl. 2012, 22, 1187–1200. [Google Scholar] [CrossRef]
- Miljø- og Fødevareministeriets. The Danish Database of Surface Waters 2021. 2021. Available online: https://odaforalle.au.dk/ (accessed on 1 December 2021).
- Hoffmann, C.C.; Baattrup-Pedersen, A. Re-establishing freshwater wetlands in Denmark. Ecol. Eng. 2007, 30, 157–166. [Google Scholar] [CrossRef]
- SDFE. 2021. Available online: https://download.kortforsyningen.dk/ (accessed on 10 September 2021).
- Scharling, M.; Kern-Hansen, C. Klimagrid–Danmark–Nedbør og Fordampning 1990–2000 Beregningsresultater til Belysning af Vandbalancen i Danmark. Technical Report 02-03. 2002. Available online: www.dmi.dk (accessed on 1 December 2021).
- Hansen, K. Folk & Fortællinger fra Det Tabte Land, Bind 1: Jylland; Bæredygtighed: Køge Municipality, Danmark, 2011. [Google Scholar]
- Kristensen, E.; Flindt, M.; Thorsen, S.W.; Holmer, M.; Valdemarsen, T.B. Gyldensteen strand—Fra agerland til kystlagune. Vand Jord 2016, 1, 36–40. [Google Scholar]
- Mæhl, P. Miljøtilstanden i Haderslev-Vojens Tunneldalens Søer 1990–1998; Rambøll: Copenhagen, Denmark, 1999. [Google Scholar]
- Rasmussen, A. Permission for Restoration of Roennebaekken and Establishment of Lakes Adjacent to Roennebaekken in the New Woodland Area at Roennebaek; Center of Plan and Environment, Team Water and Nature: Næstved, Denmark, 2017. [Google Scholar]
- Hoffmann, C.C.; Audet, J.; Ovesen, N.B.; Larsen, S.E.; Kjeldgaard, A. Overvågning af Vådområder 2015; DCE—Nationalt Center for Miljø og Energi: Roskilde, Denmark, 2018. [Google Scholar]
- Miljøportal, D. PunktUdLedningsSystem (PULS). 2021. Available online: https://puls.miljoeportal.dk (accessed on 1 December 2021).
- Blicher-Mathiesen, G.; Rasmussen, A.; Rolighed, J.; Andersen, H.E.; Carstensen, M.V.; Jensen, P.G.; Wienke, J.; Hansen, B.; Thorling, L. Landovervågningsoplande 2016, in NOVANA; Videnskabelig Rapport; Aarhus Universitet: Aarhus, Danmark, 2018. [Google Scholar]
- Haith, D.A.; Shoemaker, L.L. Generalized watershed loading functions for stream flow nutrients 1. JAWRA J. Am. Water Resour. Assoc. 1987, 23, 471–478. [Google Scholar] [CrossRef]
- Sharpley, A.; Rekolainen, S. Phosphorus in agriculture and its environmental implications. In Phosphorus Loss from Soil to Water; CAB International: Wallingford, UK, 1997; pp. 1–53. [Google Scholar]
- Cooke, G.W.; Williams, R.J.B. Significance of man-made sources of phosphorus: Fertilizers and farming. The phosphorus involved in agricultural systems and possibilities of its movement into natural water. Water Res. 1973, 7, 19–33. [Google Scholar] [CrossRef]
- Pietilainen, O. Agricultural Phosphorus Load and Phosphorus as a Limiting Factor for Algal Growth in Finnish Lakes and Rivers; CAB International: Wallingford, UK, 1997. [Google Scholar]
- Pommel, B.; Dorioz, J.M. Movement of Phosphorus from Agricultural Soil to Water; CAB International: Wallingford, UK, 1997; pp. 243–251. [Google Scholar]
- Withers, P. Phosphorus loss to water from agriculture in the UK. In Phosphorus Loss from Soil to Water; CAB International: Wallingford, UK, 1997. [Google Scholar]
- Kolenbrander, G. Eutrophication of surface water by agriculture and the urban population. Stikstof Transl. 1972, 15, 56–76. [Google Scholar]
- Lennox, S.; Foy, R.H.; Smith, R.V.; Jordan, C. Estimating the Contribution from Agriculture to the Phosphorus Load in Surface Water; CAB International: Wallingford, UK, 1997; pp. 55–75. [Google Scholar]
- Hayward, J.; Foy, R.; Gibson, C. Nitrogen and phosphorus budgets in the Erne system, 1974–1989. In Biology and Environment: Proceedings of the Royal Irish Academy; Royal Irish Academy: Dublin, Ireland, 1993. [Google Scholar]
- Tipping, E.; Toberman, H.; Boyle, J.F.; Crow, P.; Davies, J.; Fischer, U.; Guyatt, H.; Helliwell, R.; Jackson-Blake, L.; Lawlor, A.J.; et al. Atmospheric deposition of phosphorus to land and freshwater. Environ. Sci. Process. Impacts 2014, 16, 1608–1617. [Google Scholar] [CrossRef] [PubMed] [Green Version]
- Thodsen, H.; Molina-Navarro, E.; Nielsen, J.W.; Larsen, J.; Maar, M. Afstrømning og næringsstoftilførsler til Limfjorden baseret på tre forskellige modeller. In Teknisk Rapport fra DCE—Nationalt Center for Miljø og Energi; Aarhus Universitet, DCE—Nationalt Center for Miljø og Energi: Roskilde, Denmark, 2018; p. 20. [Google Scholar]
- Windolf, J.; Thodsen, H.; Troldborg, L.; Larsen, S.E.; Bøgestrand, J.; Ovesena, N.B.; Kronvanga, B. A distributed modelling system for simulation of monthly runoff and nitrogen sources, loads and sinks for ungauged catchments in Denmark. J. Environ. Monit. 2011, 13, 2645–2658. [Google Scholar] [CrossRef] [PubMed]
- Thodsen, H.; Tornbjerg, H.; Troldborg, L.; Windolf, J.; Ovesen, N.B.; Kjeldgaard, A.; Højberg, A.L. Udvikling af Vanddelen af DK-QNP til Havbelastningsberegninger; Aarhus Universitet, DCE—Nationalt Center for Miljø og Energi: Roskilde, Denmark, 2019; p. 20. [Google Scholar]
- Windolf, J.; Wiberg-Larsen, P.; Bøgestrand, J.; Larsen, S.E.; Thodsen, H.; Hansen, R.B.; Ovesen, N.B.; Kjeldgaard, A.; Kronvang, B. Vandløb 2010. NOVANA. Aarhus Universitet, DCE–Nationalt Center for Miljø og Energi. 46 s; Videnskabelig Rapport fra DCE–Nationalt Center for Miljø og Energi; DCE—Nationalt Center for Miljø og Energi: Roskilde, Denmark, 2011. [Google Scholar]
- Thodsen, H.; Windolf, J.; Rasmussen, J.; Bøgestrand, J.; Larsen, S.E.; Tornbjerg, H.; Ovesen, N.B.; Kjeldgaard, A.; Wiberg-Larsen, P. Vandløb 2015. In NOVANA; Videnskabelig Rapport fra DCE—Nationalt Center for Miljø og Energi; DCE—Nationalt Center for Miljø og Energi: Roskilde, Denmark, 2016. [Google Scholar]
- Henriksen, H.J.; Troldborg, L.; Nyegaard, P.; Sonnenborg, T.O.; Refsgaard, J.C.; Madsen, B. Methodology for construction, calibration and validation of a national hydrological model for Denmark. J. Hydrol. 2003, 280, 52–71. [Google Scholar] [CrossRef]
- Koroleff, F. Determination of nutrients. In Methods of Seawater Analysis, 2nd ed.; Grasshof, K., Ehrhardt, M., Kremling, K., Eds.; Verlag Chemie: Weinheim, Germany, 1983; pp. 159–226. [Google Scholar]
- Huser, B.J.; Egemose, S.; Harper, H.; Hupfer, M.; Jensen, H.; Pilgrim, K.M.; Reitzel, K.; Rydin, E.; Futter, M. Longevity and effectiveness of aluminum addition to reduce sediment phosphorus release and restore lake water quality. Water Res. 2016, 97, 122–132. [Google Scholar] [CrossRef] [Green Version]
- Akima, H.; Gebhardt, A.; Petzold, T.; Maechler, M. Akima: Interpolation of Irregularly and Regularly Spaced Data. R Package Version 0.6-2.1.(2016). 2020. Available online: https://cran.r-project.org/web/packages/akima/index.html (accessed on 1 December 2021).
- Rueda, F.; Moreno-Ostos, E.; Armengol, J. The residence time of river water in reservoirs. Ecol. Model. 2006, 191, 260–274. [Google Scholar] [CrossRef]
- Søndergaard, M.N.A.; Levi, E.E.; Johansson, L.S.; Sørensen, P.B.; Trolle, D. Empiriske Sømodeller for Sammenhænge Mellem Indløbs- og Søkoncentrationer af Fosfor og Kvælstof; Aarhus Universitet, DCE—Nationalt Center for Miljø og Energi: Roskilde, Denmark, 2020; p. 32. [Google Scholar]
- Søndergaard, M.; Reitzel, K.; Jeppesen, E.; Egemose, S.; Lauridsen, T.L.; Jensen, H. Vejledning for Gennemførelse af Sørestaurering; Aarhus Universitet, DCE-Nationalt Center for Miljø og Energi, Videnskabelig: Roskilde, Denmark, 2015. [Google Scholar]
- Kragh, T.; Andersen, M.R.; Sand-Jensen, K. Profound afternoon depression of ecosystem production and nighttime decline of respiration in a macrophyte-rich, shallow lake. Oecologia 2017, 185, 157–170. [Google Scholar] [CrossRef]
- Müller, J.P.; Jensen, H.J. Miljøtilstanden i Haderslev-Vojens Tunneldalens søer 2003; Fiskeøkologisk Laboratorium: Helsingør, Denmark, 2003. [Google Scholar]
- Pant, H.; Reddy, K. Potential internal loading of phosphorus in a wetland constructed in agricultural land. Water Res. 2003, 37, 965–972. [Google Scholar] [CrossRef]
- Jensen, T.; Egemose, S.; Andersen, F.Ø.; Reitzel, K. Fugle som ekstern næringsstofkilde. Vand Jord 2019, 4, 158–161. [Google Scholar]
- Sønderup, M.J.; Egemose, S.; Hansen, A.S.; Grudinina, A.; Madsen, M.H.; Flindt, M.R. Factors affecting retention of nutrients and organic matter in stormwater ponds. Ecohydrology 2016, 9, 796–806. [Google Scholar] [CrossRef] [Green Version]
- Banke, T. Vurdering af næringstilstand I Botofte Skovmose; University of Southern Denmark: Odense, Denmark, 2019. [Google Scholar]
- Kragh, T.; Sand-Jensen, K. Carbon limitation of lake produvctivity. Proc. R. Soc. Lond. Ser. B Biol. Sci. 2018, 285. [Google Scholar] [CrossRef] [Green Version]
- Levin, G.; Normander, B. Arealanvendelse i Danmark Siden Slutningen af 1800-Tallet; Faglig Rapport fra DMU; Danmarks Miljøundersøgelser: Rønde, Danmark, 2008; p. 46. [Google Scholar]
- Quilliam, R.S.; van Niekerk, M.A.; Chadwick, D.R.; Cross, P.; Hanley, N.; Jones, D.L.; Vinten, A.J.A.; Willby, N.; Oliver, D.M. Can macrophyte harvesting from eutrophic water close the loop on nutrient loss from agricultural land? J. Environ. Manag. 2015, 152, 210–217. [Google Scholar] [CrossRef] [PubMed] [Green Version]
- Fiener, P.; Auerswald, K.; Weigand, S. Managing erosion and water quality in agricultural watersheds by small detention ponds. Agric. Ecosyst. Environ. 2005, 110, 132–142. [Google Scholar] [CrossRef]
Figure 1.
Catchment characteristics of newly established Danish lakes. (A) Percent proportion of catchments constituted by agriculture, nature, forest, and impermeable urban areas. Significant differences are denoted by a, b, and c. (B) The lake area of new lakes is given in km2. (C) Area of the catchments in km2. (D) Ratio between catchment area and lake area, CA:LA (n = 90).

Figure 2.
Catchment composition of the 12 selected new lakes, ordered geographically with FIL in the west to ALS in the east. (A) Proportion of soil types constituting the catchment. (B) Proportion of land use within the catchment. (C) Proportion of crops cultured within the agricultural areas of the catchment.

Figure 3.
TPSummer of the 12 selected new lakes (n = 12) and additional new lakes (n = 78), of which (n = 10) were impacted by seawater (brackish lakes), and (n = 7) were lakes formed from mineral excavation (gravel-pits). (A) TPSummer as a function of the ratio between catchment area and lake area, CA:LA with a boxplot of TPSummer included. (B) TPSummer as a function of the age of the lakes at the time of sampling. (C) TPSummer is a function of the proportion of the catchment constituted by agriculture, (D) urban (E) nature, and (F) forest catchments. Significant relationships are shown, and the R2-values stated; all regressions can be found in Supplementary Materials.

Figure 4.
The measured TPAnnual and modeled TPModAnnual from the six methods as functions of lake and catchment characteristics. (A) TPModAnnual as a function of the measured TPAnnual concentration. (B) TPModAnnual as a function of lake age. (C) TPModAnnual as a function of hydrological residence time (tW). (D) TPModAnnual as a function of the lake surface area. (E) TPModAnnual as a function of the catchment slope. (F) TPModAnnual as a function of the average annual precipitation. (G) TPModAnnual as a function of the catchment cover of loamy soil. (H) TPModAnnual as a function of the catchment cover of agriculture. (I) TPModAnnual as a function of the catchment cover of urban. (J) TPModAnnual as a function of the catchment cover of sandy soil types. (K) TPModAnnual as a function of the catchment cover of nature. (L) TPModAnnual as a function of the catchment with forest cover. All significant regressions are shown, and R2-values stated (p < 0.05); all regressions can be found in Supplementary Materials.

Figure 5.
(A) Regression between the internal loading estimated from the TP-concentration changes during summer (TPInternal) and the age of the new lakes at the time of sampling. (B) Regression between the hydrological residence time (tW) of the lakes and the importance of the internal P-loading as a source of P expressed as the proportion of TPInternal to TPExternal by the method providing the closest estimation of modeled annual average TP-concentration (TPModAnnual) of each lake. (C) Regression between the contributions of TPInternal in relation to TPExternal to the age of the new lakes.

Figure 6.
Annual external TP-loading (TPExternal) (A) and annual TP-concentration (TPAnnual) (B) in Lake Hindemade (HIN) from establishment in 1994 to 2018 modeled using six methods. TPExternal (C) and TPAnnual (D) in relation to annual precipitation in the HIN catchment from 2011 to 2018. (C) The relationship between annual precipitation and Model 6 (linear regression, R2 = 0.65, p < 0.05). (D) Model 6 shows a positive relationship between TPAnnual and precipitation (linear regression R2 = 0.48, p < 0.05), while all other methods show a decreasing regression (linear regression, R2 = 0.71, p < 0.05). R and p values are only given for significant relationships (p < 0.05).

Table 3.
Modeled average annual TP-concentration (TPModAnnual) and the proportion of the measured TPAnnual.
Table 3.
Modeled average annual TP-concentration (TPModAnnual) and the proportion of the measured TPAnnual.
| ID | Measured | TPModAnnual | |||||||||||
|---|---|---|---|---|---|---|---|---|---|---|---|---|---|
| TPAnnual | Model 1 | Model 2 | Model 3 | Model 4 | Model 5 | Model 6 | |||||||
| mg L−1 | mg L−1 | % | mg L−1 | % | mg L−1 | % | mg L−1 | % | mg L−1 | % | mg L−1 | % | |
| ALS a | 0.214 | 0.200 ± 0.084 | 93 | 0.193 ± 0.081 | 90 | 0.296 ± 0.125 | 138 | 0.368 ± 0.155 | 172 | 0.187 ± 0.079 | 87 | 0.151 ± 0.032 | 71 |
| BSM b | 0.381 | 0.243 ± 0.182 | 64 | 0.302 ± 0.225 | 79 | 1.857 ± 1.387 | 487 | 0.300 ± 0.224 | 79 | 0.135 ± 0.101 | 35 | 0.121 ± 0.031 | 32 |
| BUN c | 0.134 | 0.139 ± 0.060 | 104 | 0.200 ± 0.086 | 149 | 0.979 ± 0.422 | 731 | 0.277 ± 0.119 | 207 | 0.114 ± 0.049 | 85 | 0.115 ± 0.015 | 86 |
| BOL c | 0.057 | 0.011 ± 0.002 | 19 | 0.011 ± 0.002 | 19 | 0.031 ± 0.005 | 54 | 0.017 ± 0.002 | 30 | 0.010 ± 0.007 | 18 | 0.023 ± 0.001 | 40 |
| EGA a | 0.101 d | 0.171 ± 0.073 | 169 | 0.157 ± 0.068 | 155 | 0.499 ± 0.214 | 494 | 0.259 ± 0.111 | 256 | 0.154 ± 0.066 | 152 | 0.131 ± 0.009 | 129 |
| FIL c | 0.075 | 0.048 ± 0.009 | 64 | 0.048 ± 0.009 | 64 | 0.261 ± 0.049 | 348 | 0.348 ± 0.065 | 464 | 0.062 ± 0.012 | 83 | 0.118 ± 0.011 | 157 |
| GES b | 0.124 | 0.051 ± 0.012 | 41 | 0.056 ± 0.013 | 45 | 0.095 ± 0.022 | 77 | 0.057 ± 0.013 | 46 | 0.029 ± 0.007 | 23 | 0.085 ± 0.027 | 69 |
| HIN c | 0.068 | 0.086 ± 0.015 | 126 | 0.098 ± 0.014 | 144 | 0.441 ± 0.059 | 649 | 0.250 ± 0.033 | 368 | 0.115 ± 0.015 | 169 | 0.083 ± 0.005 | 121 |
| SYB c | 0.078 | 0.183 ± 0.082 | 235 | 0.127 ± 0.057 | 163 | 0.599 ± 0.270 | 768 | 0.158 ± 0.071 | 203 | 0.130 ± 0.059 | 167 | 0.095 ± 0.004 | 121 |
| LES c | 0.037 | 0.035 ± 0.008 | 95 | 0.035 ± 0.008 | 95 | 0.037 ± 0.008 | 100 | 0.036 ± 0.008 | 97 | 0.033 ± 0.007 | 89 | 0.096 ± 0.005 | 259 |
| RBS c | 0.059 | 0.126 ± 0.031 | 214 | 0.086 ± 0.021 | 146 | 0.533 ± 0.131 | 903 | 0.112 ± 0.027 | 190 | 0.158 ± 0.039 | 268 | 0.170 ± 0.013 | 288 |
| VIL c | 0.051 | 0.058 ± 0.019 | 114 | 0.051 ± 0.015 | 100 | 0.305 ± 0.069 | 598 | 0.290 ± 0.065 | 569 | 0.058 ± 0.013 | 114 | 0.083 ± 0.004 | 163 |
a TPModAnnual estimated from Model 3; b was estimated using Model 4; c concentrations estimated from Model 5; d TPAnnual calculated from only five samplings. The concentrations are shown as the mean values ± standard deviation from values estimated from the highest and lowest hydrological residence time.
Table 4.
Assessed ease of use and performance of the six tested methods to reliably predict TPModAnnual of new lakes.
Table 4.
Assessed ease of use and performance of the six tested methods to reliably predict TPModAnnual of new lakes.
| Model 1 | Model 2 | Model 3 | Model 4 | Model 5 | Model 6 | |
|---|---|---|---|---|---|---|
| Ease of use | Easy | Medium | Difficult | Medium | Difficult | Easy |
| Performance | Bad | Medium | Bad | Bad | Good | Good |
Publisher’s Note: MDPI stays neutral with regard to jurisdictional claims in published maps and institutional affiliations. |
© 2022 by the authors. Licensee MDPI, Basel, Switzerland. This article is an open access article distributed under the terms and conditions of the Creative Commons Attribution (CC BY) license (https://creativecommons.org/licenses/by/4.0/).
Share and Cite
MDPI and ACS Style
Kragh, T.; Kolath, T.; Kolath, A.S.; Reitzel, K.; Martinsen, K.T.; Søndergaard, M.; Hoffmann, C.C.; Baastrup-Spohr, L.; Egemose, S. External Phosphorus Loading in New Lakes. Water 2022, 14, 1008. https://doi.org/10.3390/w14071008
AMA Style
Kragh T, Kolath T, Kolath AS, Reitzel K, Martinsen KT, Søndergaard M, Hoffmann CC, Baastrup-Spohr L, Egemose S. External Phosphorus Loading in New Lakes. Water. 2022; 14(7):1008. https://doi.org/10.3390/w14071008
Chicago/Turabian StyleKragh, Theis, Thor Kolath, Anja Svane Kolath, Kasper Reitzel, Kenneth Thorø Martinsen, Martin Søndergaard, Carl Christian Hoffmann, Lars Baastrup-Spohr, and Sara Egemose. 2022. "External Phosphorus Loading in New Lakes" Water 14, no. 7: 1008. https://doi.org/10.3390/w14071008
Note that from the first issue of 2016, this journal uses article numbers instead of page numbers. See further details here.