Article

Aosta Valley Mountain Springs: A Preliminary Analysis for Understanding Variations in Water Resource Availability under Climate Change

1
Department of Environment, Land and Infrastructure Engineering, Politecnico di Torino, Corso Duca degli Abruzzi 24, 10129 Torino, Italy
2
Regione Piemonte, Environmental, Energy and Territory Directorate, Division of Sustainable Development, Biodiversity and Natural Areas, Corso Bolzano 44, 10121 Torino, Italy
*
Author to whom correspondence should be addressed.
Water 2022, 14(7), 1004; https://doi.org/10.3390/w14071004
Submission received: 28 February 2022 / Revised: 16 March 2022 / Accepted: 18 March 2022 / Published: 22 March 2022
(This article belongs to the Special Issue Groundwater Management in a Changing World: Challenges and Endeavors)

Abstract

:
The availability of freshwater resources in mountain areas has been affected by climate change impacts on groundwater storage mechanisms. As a web of complex interactions characterizes climate systems, understanding how water storage conditions have changed in response to climate-driven factors in different Italian contexts is becoming increasingly crucial. In order to comprehend the relationship between changes in weather conditions and water availability in the Aosta Valley region and how their trends have changed over the last decade, a 7-year discharge series of different Aosta Valley springs (Promise, Alpe Perrot, Promiod, Cheserod) and precipitation data are analysed. Precipitation and flow rate trends using the Mann–Kendall and Sen’s slope trend detection tests were also performed. Not all of the Aosta Valley mountain springs detected seem to respond to the climate variation with a decrease in their stored water resources. Unlike Promiod, Alpe Perrot, Cheserod, and Promise springs have experienced an increase in water discharged amount during the detected 7-year period. This behavior occurs despite the available precipitation data for the associated Sant Vincent, Aymaville-Viayes, La Thuile-Villaret, Champdepraz meteorological stations revealing an overall decreasing trend in annual rainfall (mm), with a slight increase in intensity (mm/day) as a result of the reduction in rainfall events (number of rainy days).

1. Introduction

Groundwater, the water reserve beneath the Earth’s surface, is an essential resource for humans and ecosystems. Globally, water use has increased by a factor of six over the past 100 years and continues to grow steadily at about 1% per year due to the increasing population, economic development, and consumption patterns. Additionally, because of the higher population density of cities and urbanization levels, limited water supplies are becoming increasingly vulnerable in such areas [1].
Over recent decades, the availability and sustainability of freshwater resources have been affected by the impacts of climate change on groundwater storage mechanisms [2]. As reported by [3], the most vulnerable societies are often characterized by insufficient observation systems and monitoring equipment, and they also lack impact-based models. This is particularly the case of the Mediterranean region. Here, average annual temperatures are now approximately 1.5 °C higher than from 1880 to 1899, which is well above current global warming trends. Moreover, available climate models suggest scenarios with a reduction in recharge in the coming decades [4,5].
A web of complex interactions characterizes climate systems, and several potential effects of climate change remain largely unknown. Therefore, examining how groundwater storage mechanisms are changing in response to climate-driven agents is becoming increasingly crucial [6,7]. In terms of known effects on the hydrological cycle, climate change can affect the amount of soil infiltration, deeper percolation, and groundwater recharge. In addition, rising temperature increases the evaporative demand over land, limiting the available surface water for groundwater replenishment [8].
A wide array of scientific research has been conducted to explore how water resources might respond to global change in recent decades. However, existing studies about climate change’s impacts on groundwater recharge are generally global in scale [9,10]. Moreover, research has been focused dominantly on surface-water systems, due to their visibility, accessibility, and more obvious recognition of surface waters being affected by global change. Only recently have water resource policies recognized the critical role of groundwater resources in meeting the demands for drinking water, agricultural and industrial activities, and sustaining ecosystems [7].
The available global researches describe an intensification of the hydrological cycle: higher temperatures are expected to drive increases in evaporation and evapotranspiration (ET), while many places are projected to experience drought in terms of precipitation amount and intensity [11,12,13,14,15]. Reference [11] investigated the event-to-event hydroclimatic intensity under future warming scenarios. According to a set of targeted multi-model large ensemble experiments, the authors described how event-wise intensification will significantly increase globally for an additional 0.5 °C warming beyond 1.5 °C. For the Mediterranean region, the enhancement of dry spells seems to be dominating compared to the decrease in wet spell strength, and this will lead to an overall event-wise intensification. With a focus on Central Europe, reference [13] analysed the long-term impact of snow cover and precipitation changes along with their interaction with reservoir constructions. In their results, the authors showed that runoff seasonality of snow-dominated rivers decreases. Runoff increases in winter and spring, while discharge decreases in summer and at the beginning of autumn. Reference [15] aimed to understand whether or not the shortage of water supply in the Alto Sabor watershed, northeast Portugal, can be effectively addressed by constructing a new reservoir (two-reservoir system) by considering future climate projections. A general increase in temperature is described for the future, while the change in precipitation is more uncertain as per the differences among climatic models. In general, annual precipitation would slightly decrease while seasonal changes would be more significant, with more precipitation in winter and much less in spring and summer. According to reference [16], climate change brings multiple changes in different regions, including changes to wetness and dryness, winds, snow and ice, coastal areas, and oceans. Precipitation is projected to increase in high latitudes, while decreasing over large parts of the subtropics. Further warming will amplify permafrost thawing, the loss of seasonal snow cover, and the melting of glaciers and ice sheets. For cities in temperate zones, some aspects of climate change may be amplified, including heat (since urban areas are usually warmer than their surroundings), flooding from heavy precipitation events, and sea-level rise in coastal cities.
Until recently, there have been fewer studies on the relationship between climate change and groundwater recharge mechanisms at an Italian regional and local scale [17,18,19,20]. In their work, reference [17] analysed data from 126 rain gauges, 41 temperature gauges, 8 river discharge gauges, and 239 wells located in Southern Italy to characterize the effects of recent climate change on water resource availability, observing a widespread decreasing trend in annual rainfall over 97% of the area. In addition, reference [19] evaluated projected changes in extreme rainfall events across the region of Sicily (Italy). Their results showed a predicted future increase in the growth curves, clearly indicating an increase in the intensity of extreme precipitation events, especially for the shortest durations. Reference [20] proposed an ensemble approach to estimate possible impacts of climate changes on the extreme precipitation regime, using the Napoli Servizio Idrografico (Naples, Italy) rain gauge as a test case.
As reported by [21], the trends of the leading climate variables (i.e., rainfall, snow, and temperature) have direct control over groundwater storage conditions as well as spring discharge amounts. Therefore, long-term spring discharge time series, combined with available climate variables trend analyses, can facilitate the investigation of the possible effects of climate change on groundwater recharge mechanisms in different regions. Given the variety of climatic conditions recorded in Italian territory, providing a complete picture of groundwater response to the country’s changing climate is even more challenging. In particular, the impacts of climate change are continuously modified by human and indirect agents such as land-use change and over-exploitation of groundwater.
Given the above considerations, this paper aims to investigate the existing relationships between precipitation regimes and groundwater sources’ recharge amounts on a local scale. In detail, the proposed study focuses on the analysis of variations in groundwater discharge and recharge (i.e., precipitation) in the Aosta Valley (Northwestern Italy), defining how their trends have changed over the past years. A 7-year discharge series of different Aosta Valley springs (Promise, Alpe Perrot, Promiod, Cheserod), rainfall data, and measured snow heights from selected meteorological stations were analysed. Firstly, spring discharge measurements and available hydro-meteorological data of the four mentioned case studies were investigated, identifying the extent of the correlations between the two variables described above. Subsequently, a comparison between the rainfall and spring discharge time series of the Promiod and Alpe Perrot springs was carried out to properly examine the evolution of meteorological conditions during the entire considered period of 7 years. Then, flow rate and precipitation trends were defined and validated for all case studies using the Mann–Kendall and Sen’s slope trend detection tests applied to the entire series of data.
The Aosta Valley was selected because of the importance of groundwater resources for the local inhabitants: its territory includes aquifer systems with different described recharge mechanisms, thus providing valuable examples of recharge responses to climate change in various geological settings.

2. Materials and Methods
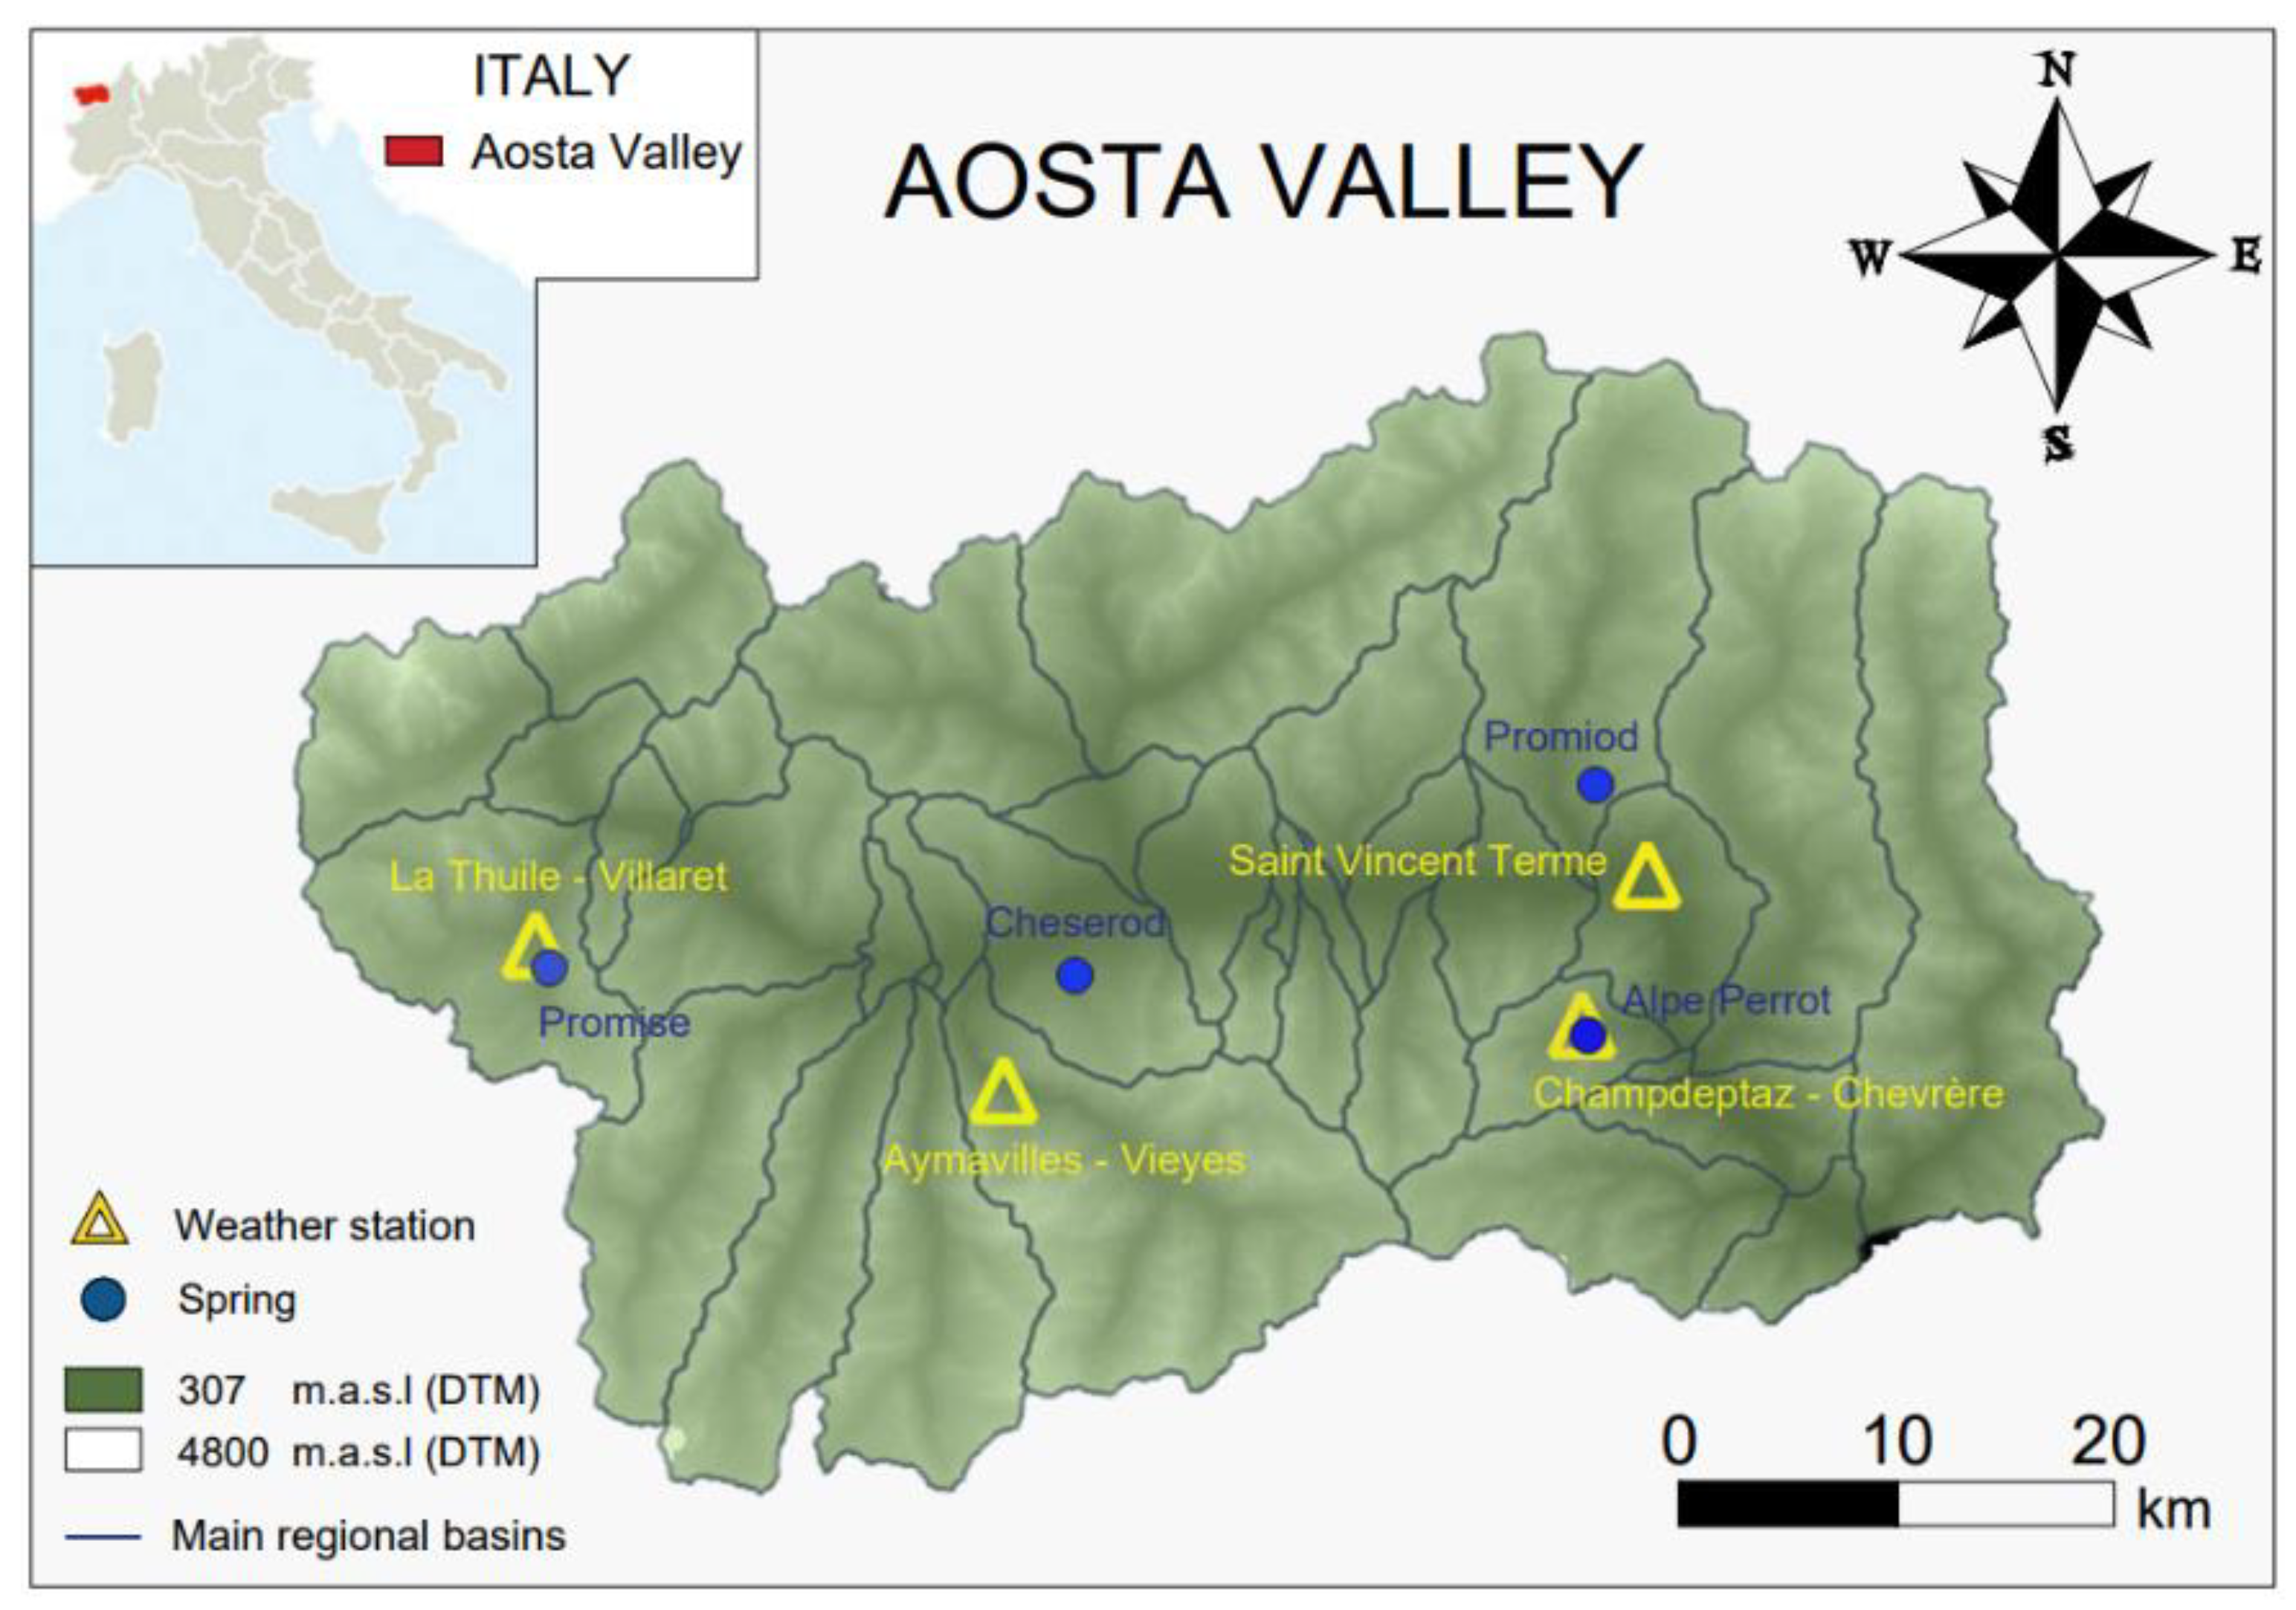
2.1. Case Studies

The Aosta Valley region is geographically located in the northwestern sector of the Italian peninsula (Figure 1). It is characterized by a typical alpine climate, associated with cold winter and cool summer seasons. Monthly rainfall reaches its annual peaks in the spring and autumn seasons, while the minimum values are recorded in the summer and winter seasons. The highest mean precipitation value by month is roughly 140 mm of rainfall, and the minimum mean value is 30 mm [22]. However, according to studies by several researchers [16,23], the climatic conditions have undergone significant variations over recent decades.
From a geological point of view, the quaternary deposits of the Aosta Valley region span the entire Quaternary period and mainly relate to the last Upper Pleistocene glacial episode and the post-glacial period (Holocene to present). Usually, Quaternary deposits overlie the mountain slopes that constitute the aquifers in the area; these aquifers supply hundreds of tiny springs that are widespread over the entire region, with 1800 water springs [24].
Four of the most representative water springs were analysed in this paper: the Promise spring, Alpe Perrot spring, Promiod spring, and Cheserod spring. The selected springs, characterized by different aquifer types, are located in four minor tributary valleys. These springs have been studied since 2010 through the activities carried out in the frameworks of several EU Cooperation and national projects.

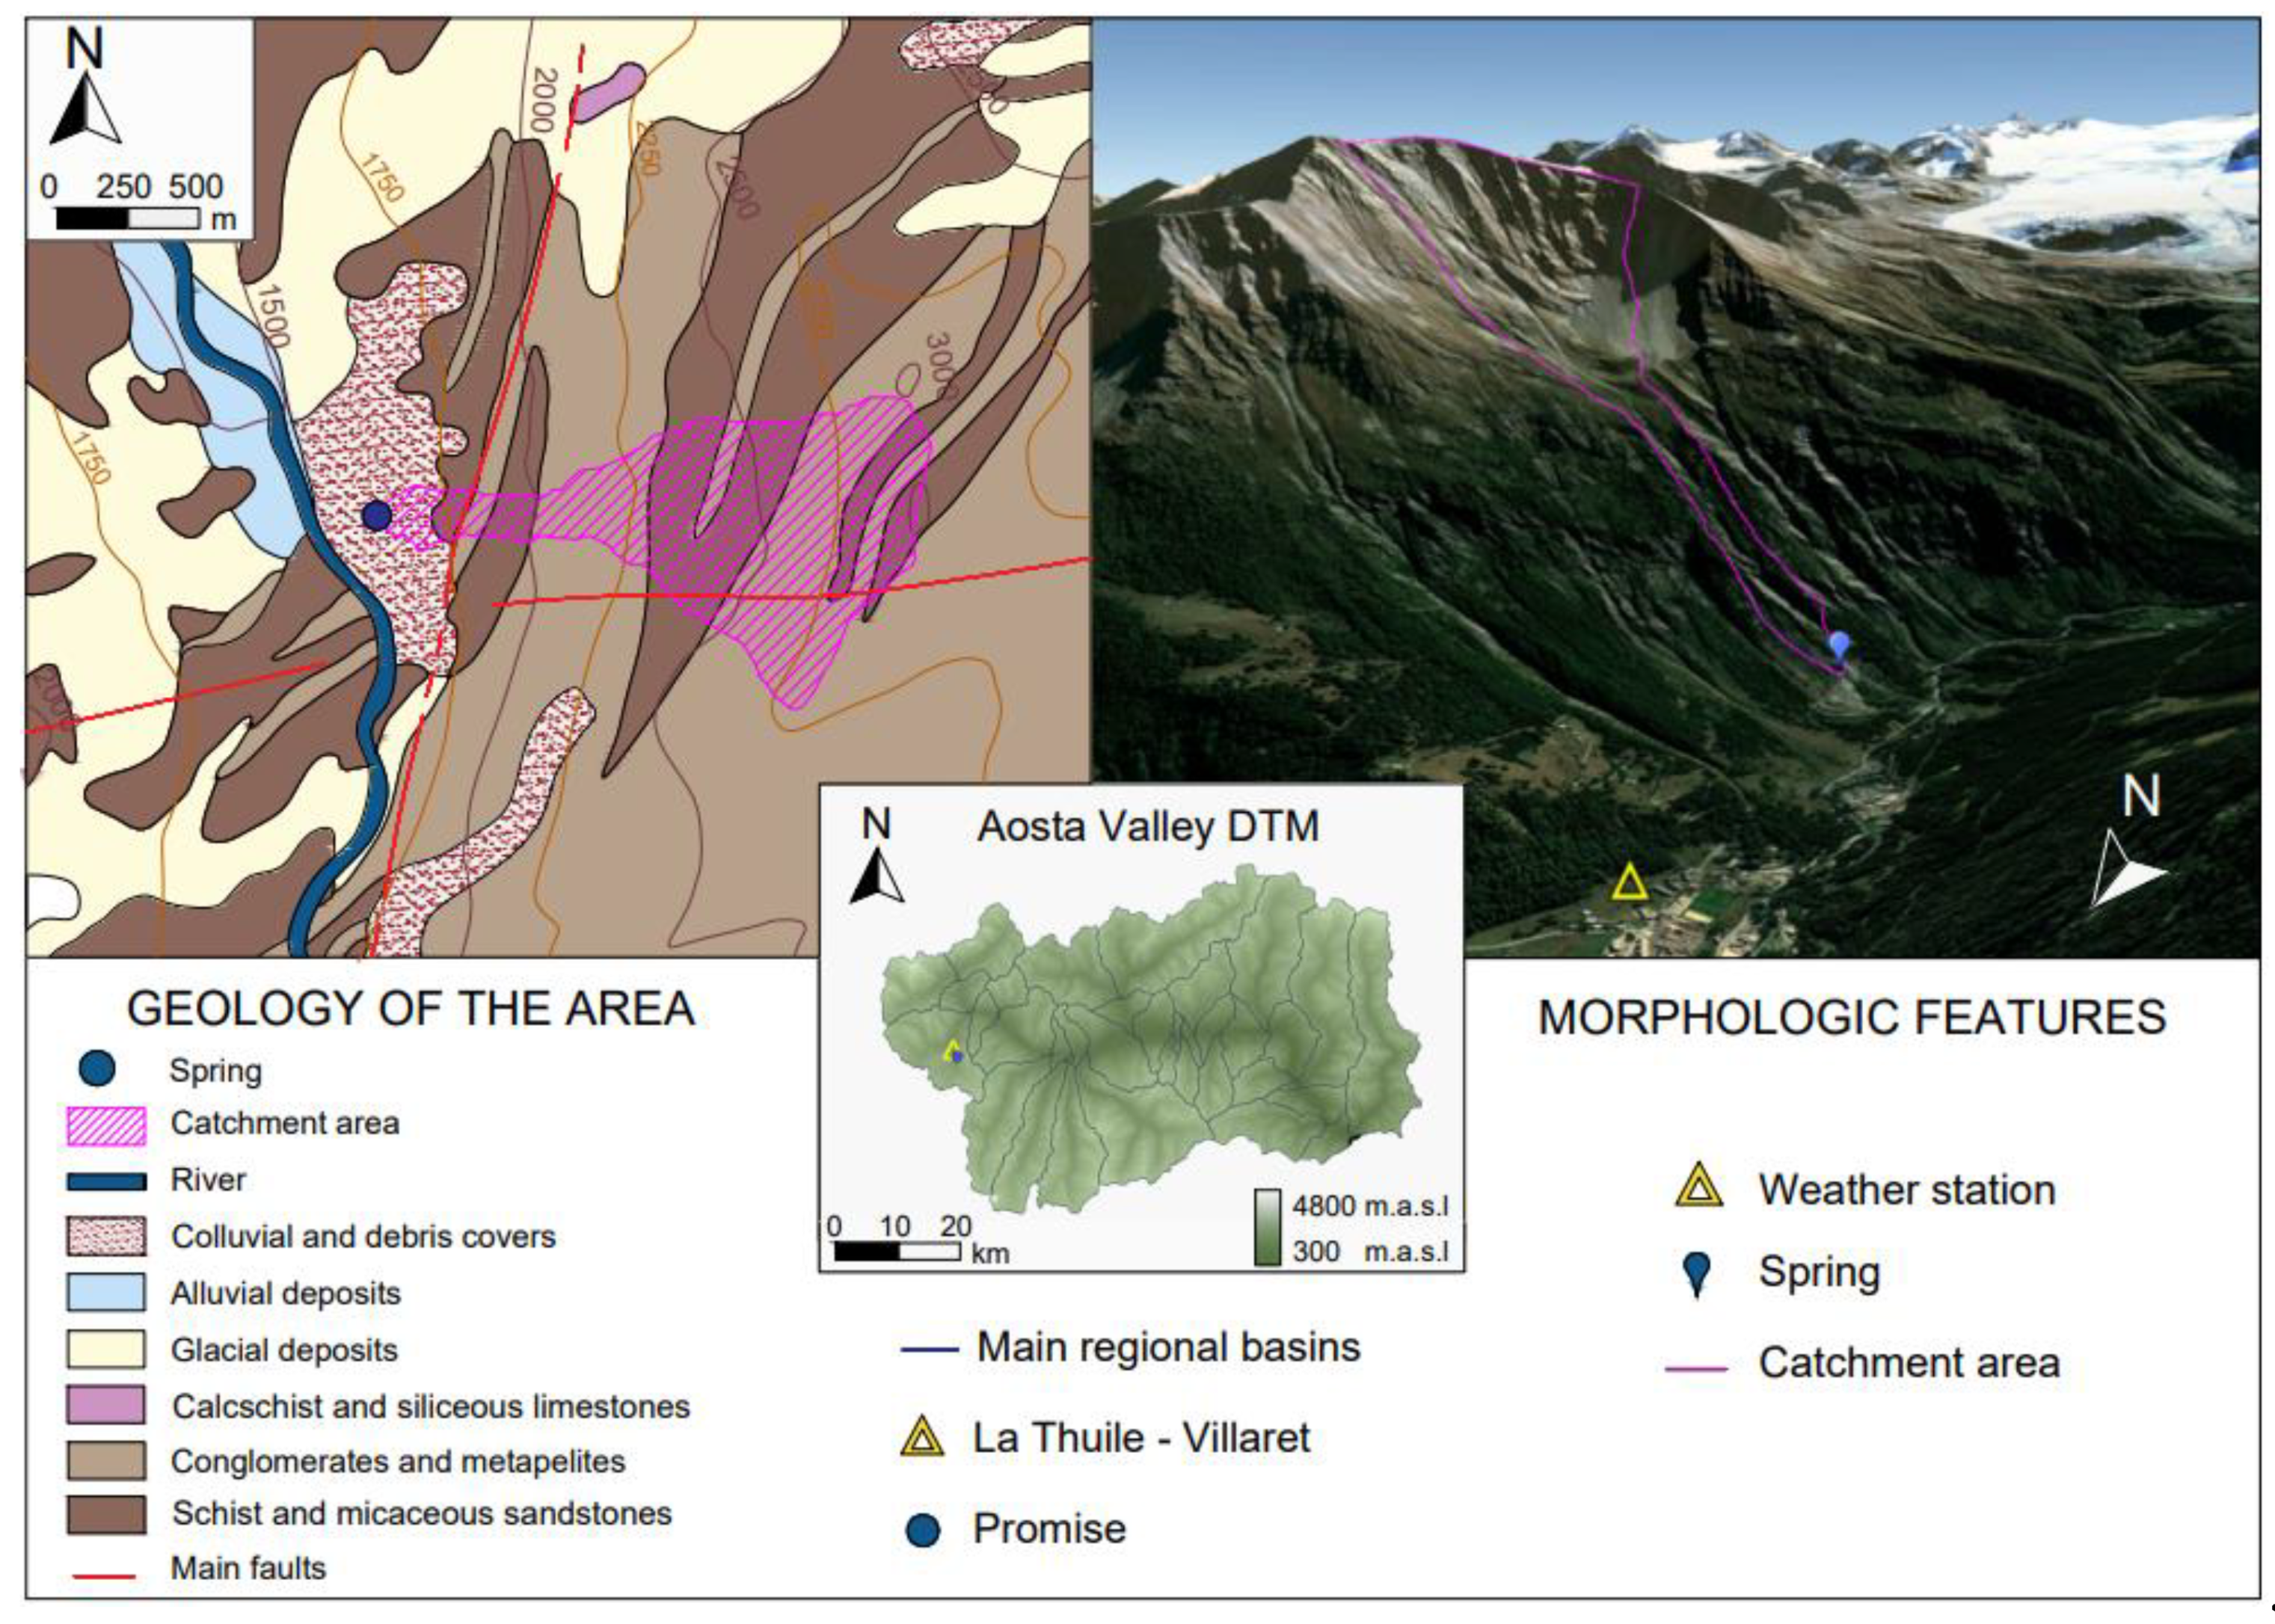
2.1.1. Promise Spring

The Promise spring is located at an elevation of 1580 m.a.s.l. in the La Thuile municipality (812 inhabitants [25]). This area corresponds to outcrops of the Houillère Zone sequence (Upper Paleozoic), a unit of the Outer Brianzonese Domain, forming part of the Middle Pennidic System of San Bernardo (Figure 2). The Outer Brianzonese Zone comprises the polymetamorphic geology of the Ruitor area, consisting of orthogneiss, Permo-Carboniferous sequences of the Houillère Zone and Permo-Triassic cover, rich in evaporites [26]. The Quaternary and recent formations comprise glacial deposits, deposits of gravitational origin, and eluvial–colluvial deposits. A series of gravitational structures and deposits are recognizable on the slope where the spring is located.
The spring is hosted in an old argentiferous lead mine that reached its peak of production in the early 1900s. At present, the entire mine serves as the drainage of the spring, which has an intake spoil near the mine exit.

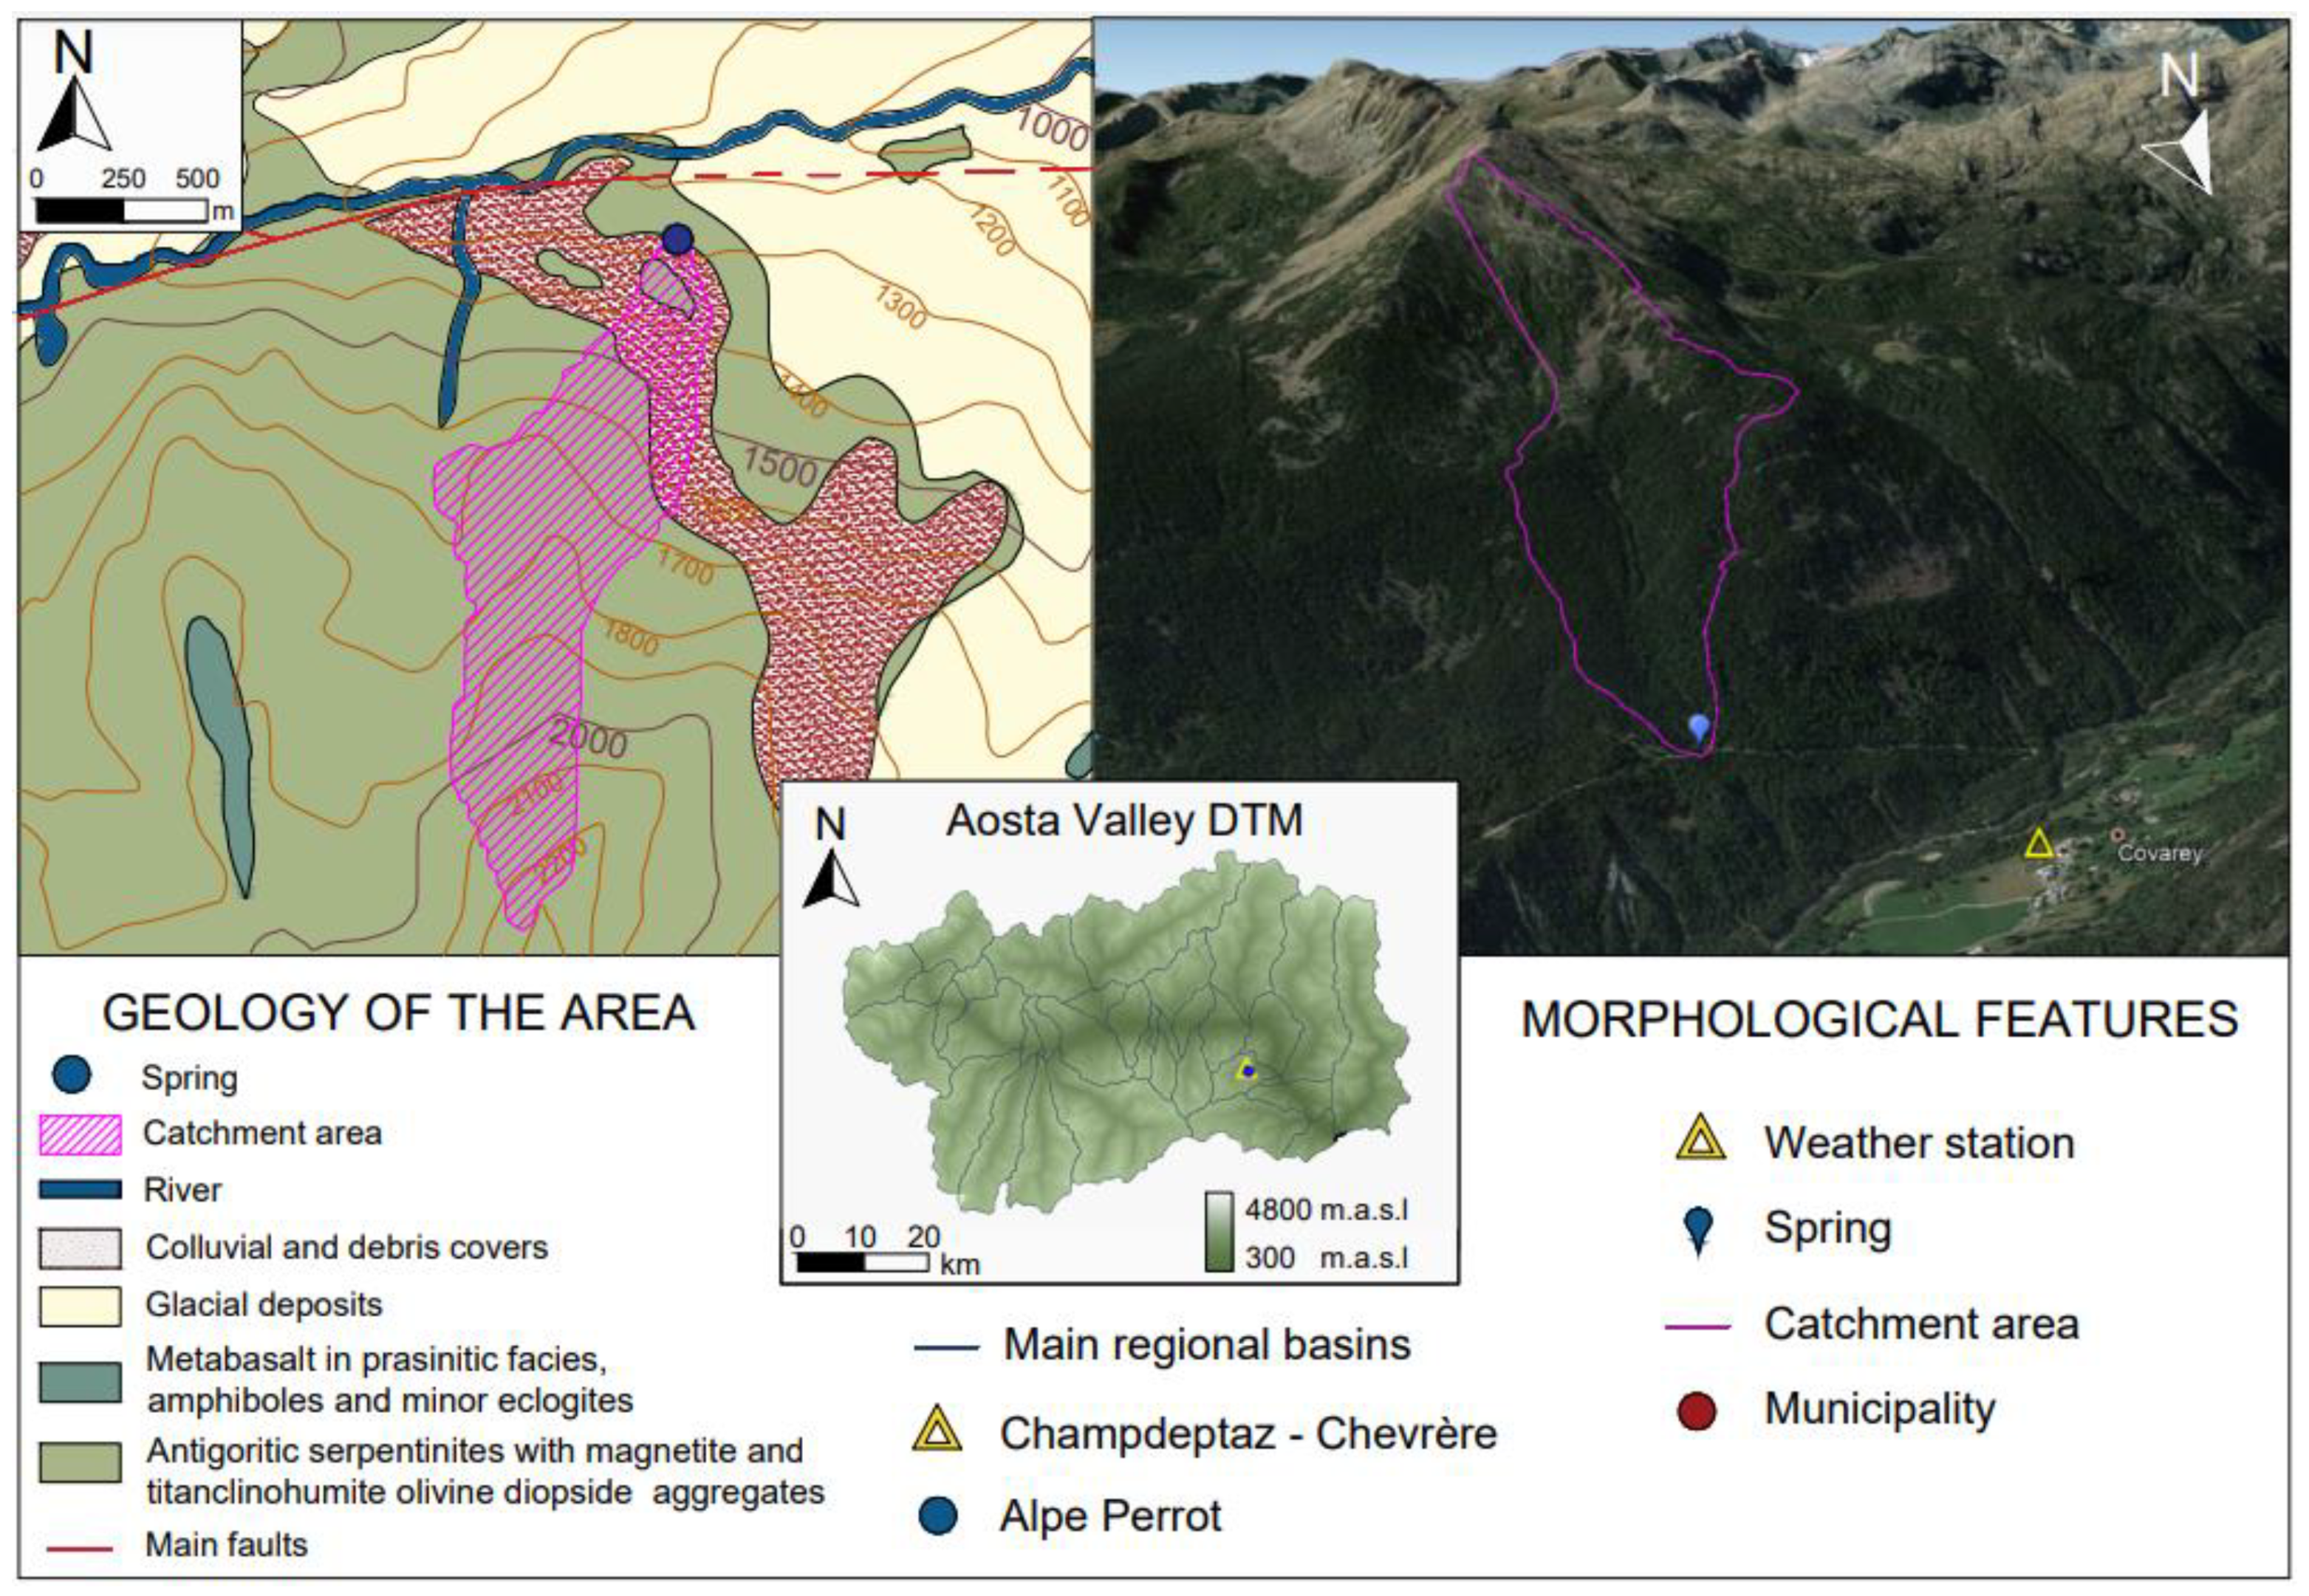
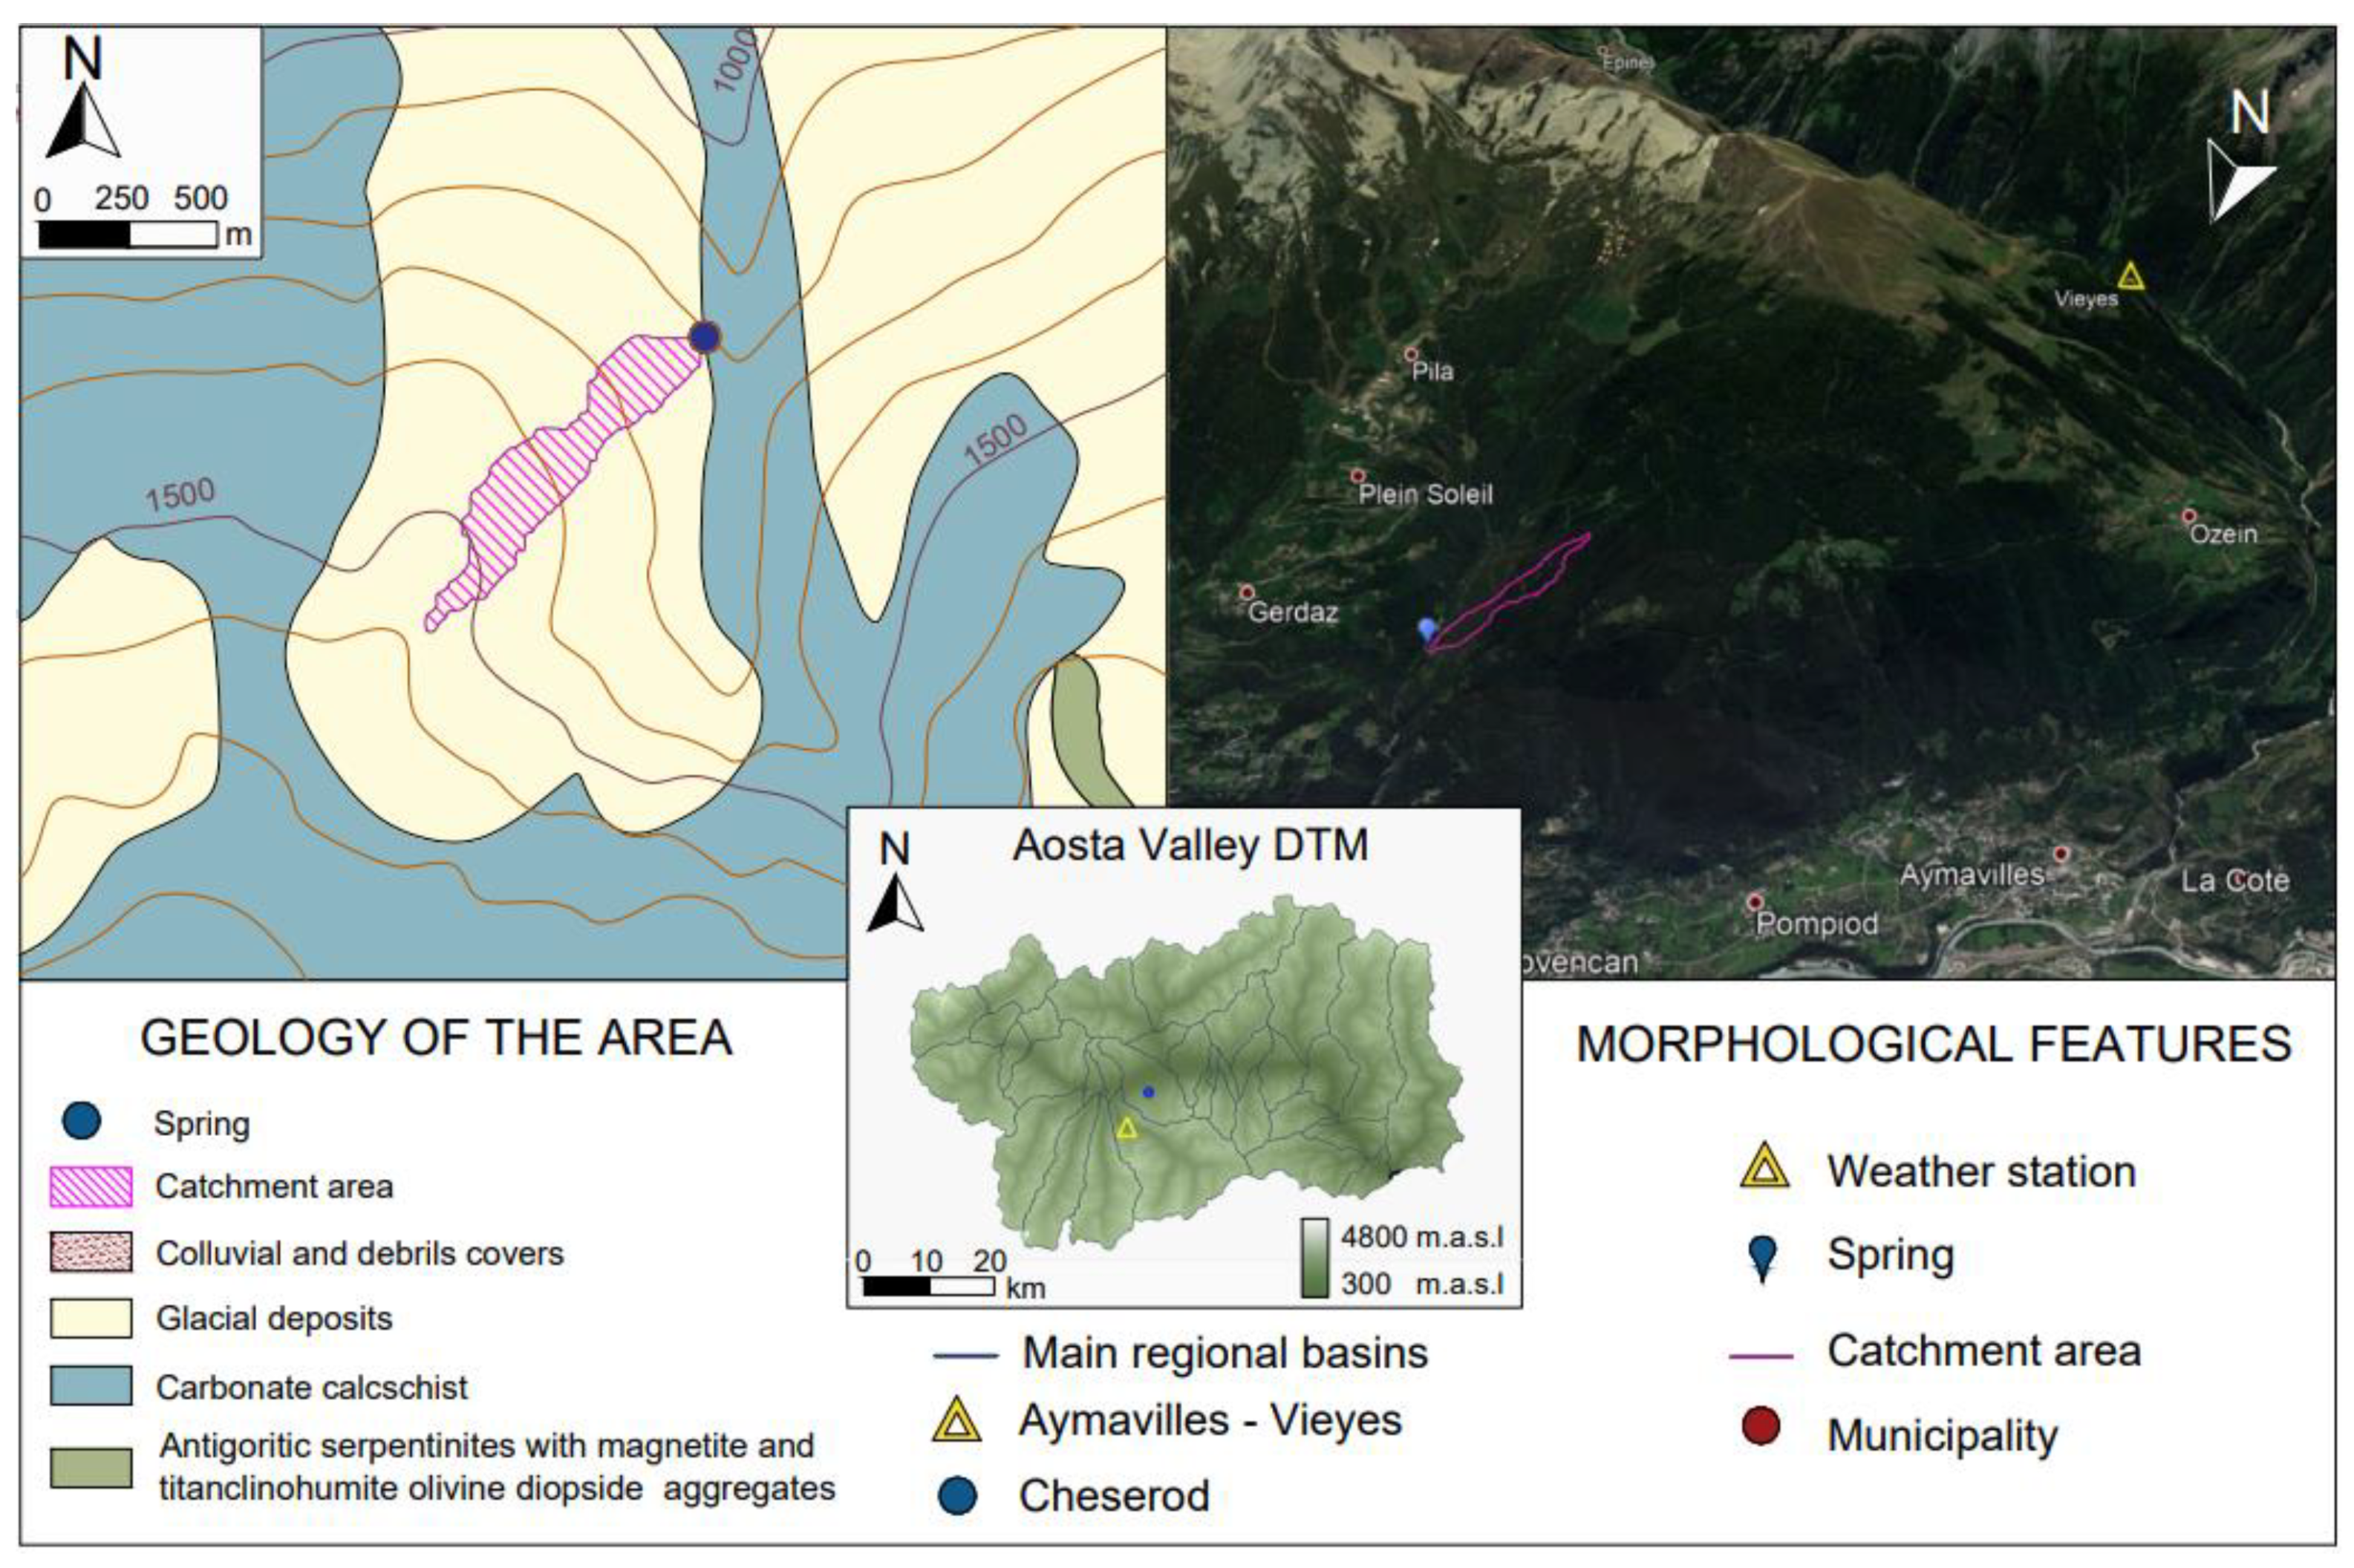
2.1.2. Alpe Perrot Spring

The Alpe Perrot spring is located at an elevation of 1280 m (Champdepraz municipality, 714 inhabitants [25]), corresponding to the Serpentinite massif of Mont Avic, one of the largest in the Western Alps, extending from Val Clavalitè to the Champorcher Valley (Figure 3).
The massif is composed of serpentinized peridotites with intercalations of magnetite chlorite schists, strands and lenses of rhodingites, and a few metagabbro bodies.
In the study area, the outcropping lithology is dominated by the Zermatt-Saas Unit, which is a Jurassic–Cretaceous age ophiolite.
The Quaternary cover that characterizes the slope where the spring is located comprises Pleistocene glacial deposits (undifferentiated till, ablation or bottom deposits, landslide deposits with glacial transport, and scattered moraine skeletons) and glaciogenic deposits (glacial contact, glacial-lacustrine, and fluvioglacial). In addition, two other deposits are also present, namely, a glacial deposit consisting of poorly sorted pebbles and angular boulders mixed with eluvial–colluvial cover, present along the entire route leading to the spring, and a gravitational accumulation of large blocks that characterizes the entire area upstream of the spring at an altitude of approximately 1750 m.a.s.l.

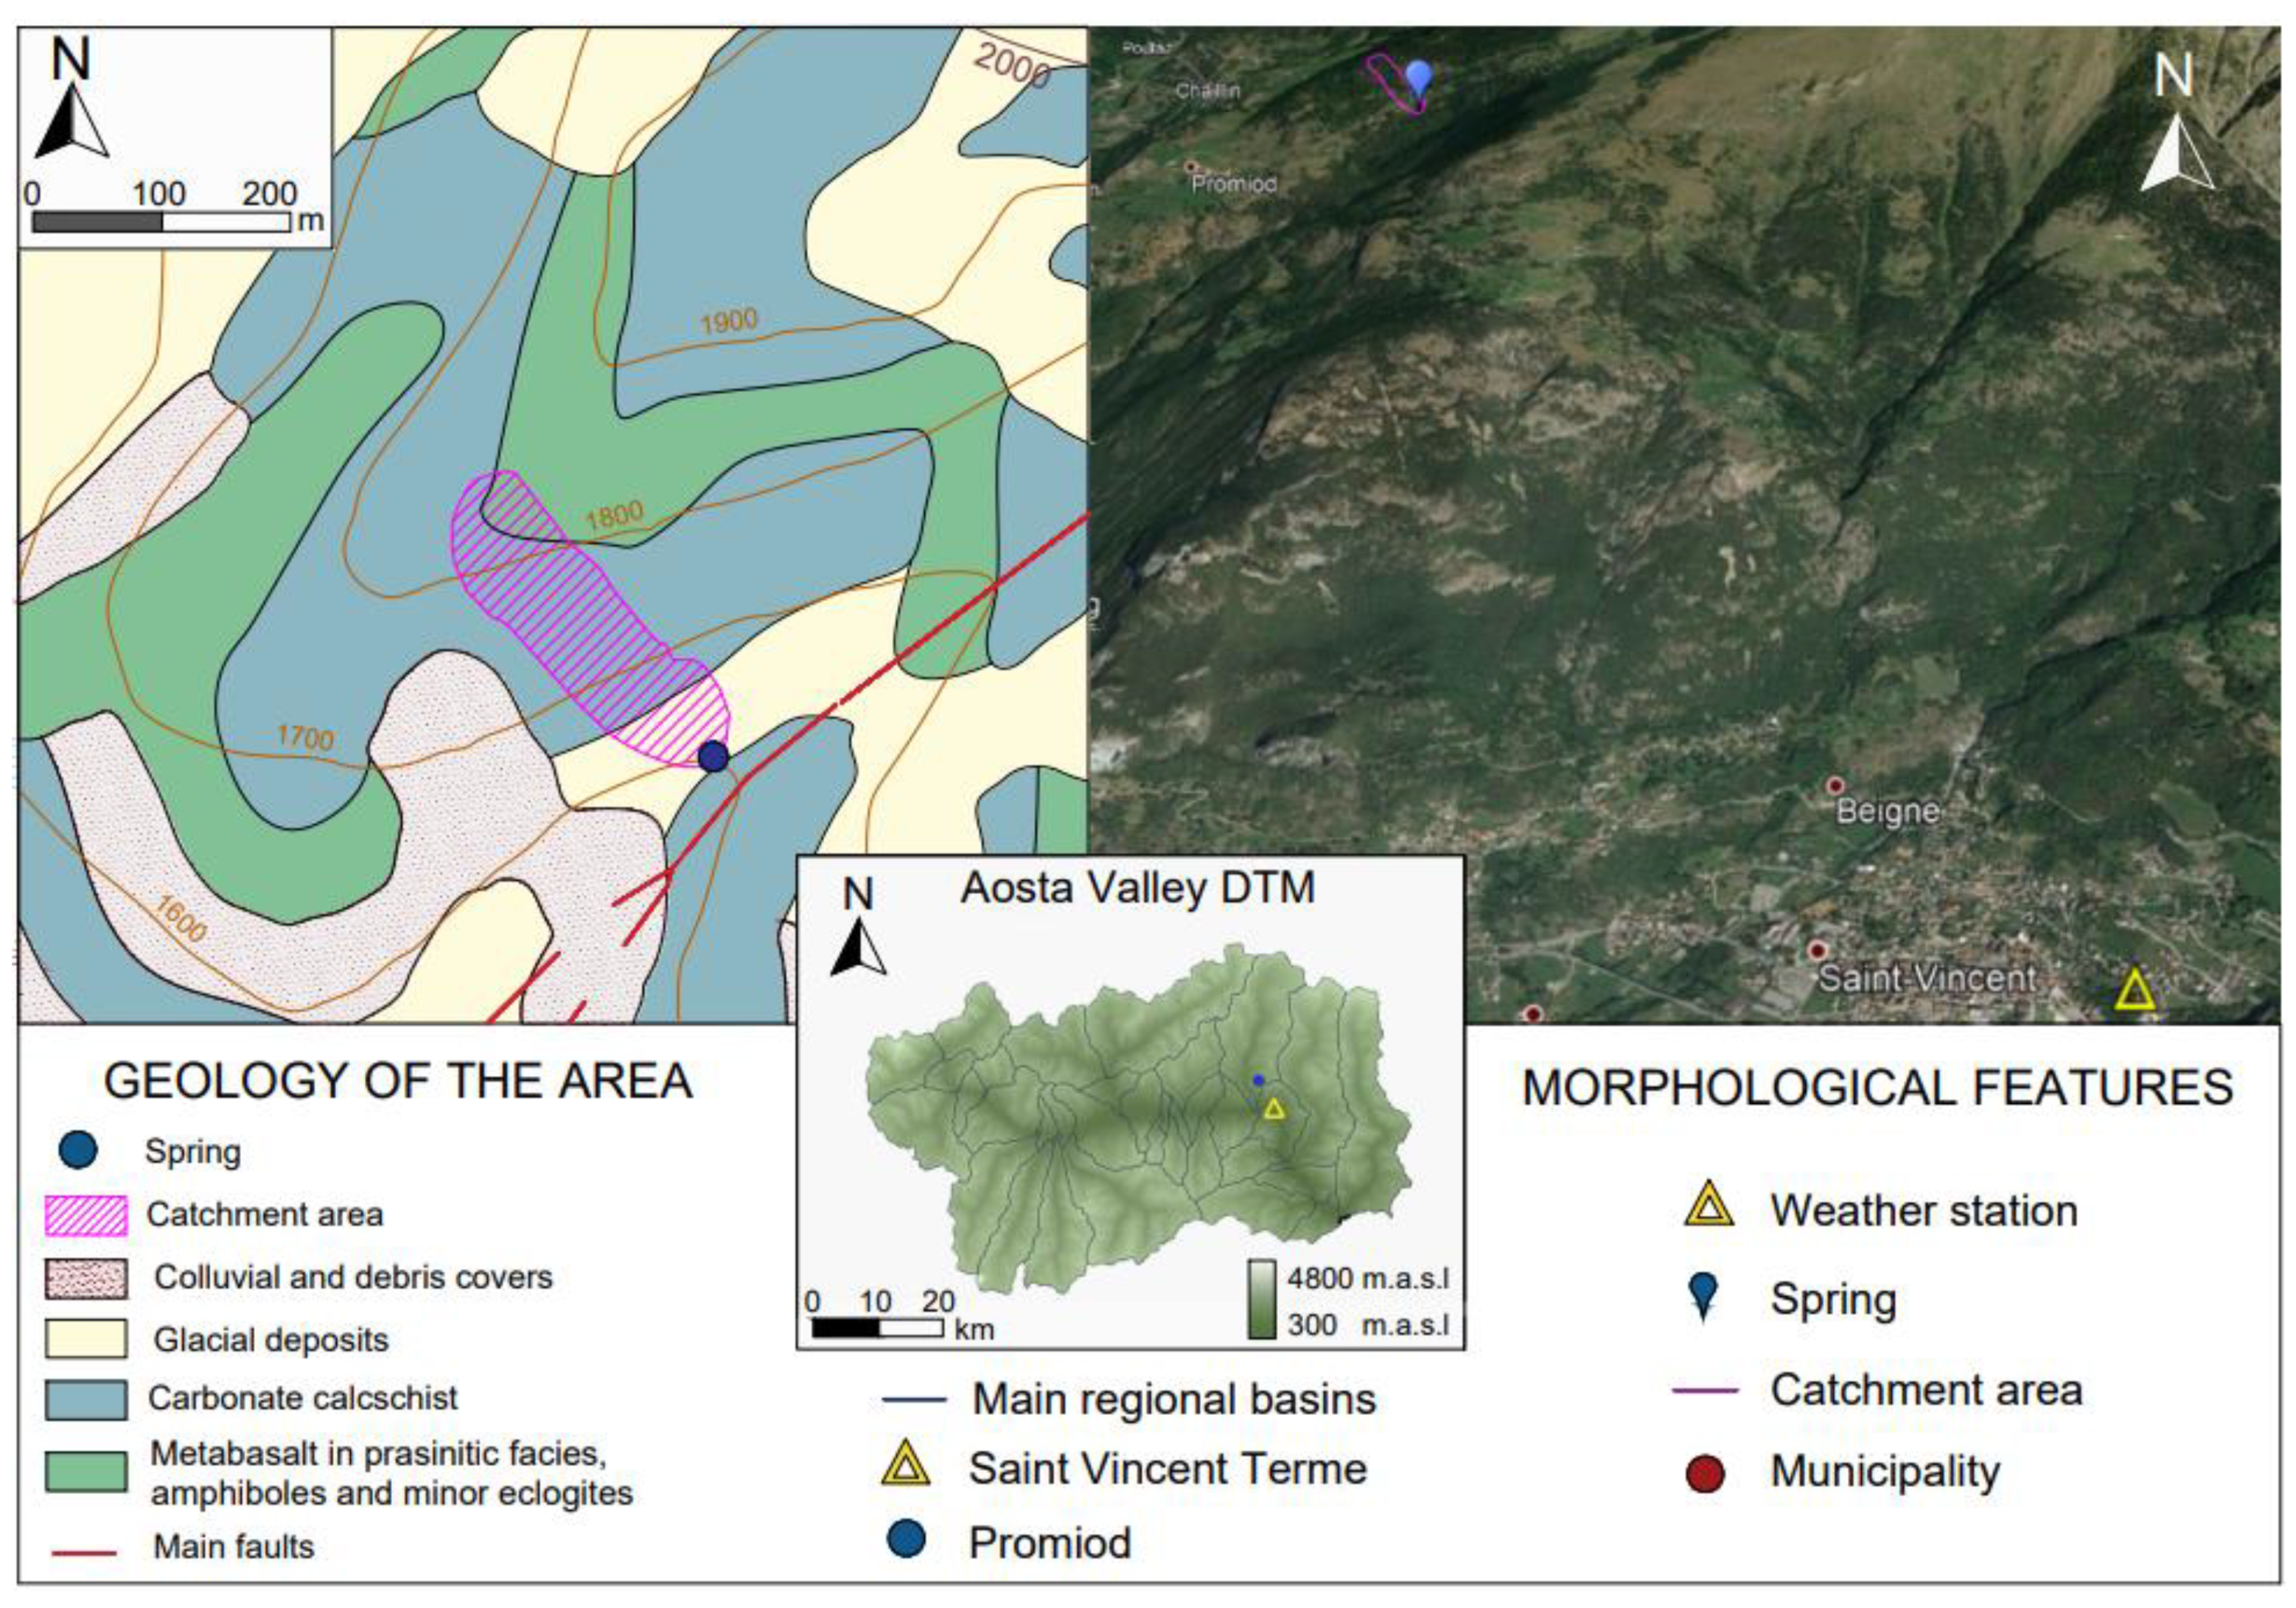
2.1.3. Promiod Spring

The Promiod spring is located at an elevation of 1650 m (Chatillȏn municipality, 4524 inhabitants [25]), corresponding to the Jurassic–Cretaceous Combin Zone, which mainly comprises ophiolitic units, characterized by a robust blueschist/greenschist facies footprint (Figure 4). Both metasediments and metamorphosed ophiolites outcrop in the spring area. The metasediments are mainly composed of undifferentiated calcareous schists, including carbonate, pelitic, and siliciclastic metasediments, derived primarily from turbiditic deposits of probable Cretaceous age, which constitute the most recent part of the cover overlying the ophiolites. In contrast, the metamorphosed ophiolites comprise Prasinites that form flattened tabular or lenticular bodies, intercalated within the calcareous schists. Similar to the Alpe Perrot spring, the Promiod spring is also a permeability limit spring. The defined permeability limit is likely due to the juxtaposition of more fractured and less fractured calcareous schists, resulting from the presence of the fault that runs parallel to the valley in a NE–SW direction (Figure 4). Faults are of considerable importance for the geology of the area as they are very numerous, relating to two brittle deformation phases during the Oligocene and Miocene, defined as D1 and D2. In particular, phase D1 is associated with important hydrothermal and magmatic events of the Oligocene age ([27] and references therein); during this phase, normal fault systems with NE–SW and E–W directions, which characterize the study area, were activated. Therefore, the spring has a source basin located in fractured schists, overlain by a glacial deposit consisting of angular, poorly sorted pebbles and boulders mixed with eluvial–colluvial cover.

2.1.4. Cheserod Spring

The Cheserod/Chézerod spring is located in the village of Cheserod (1095 m.a.s.l.), within the Gressan municipality (3393 inhabitants [25]), and overlies geology similar to that of the Combin area (Figure 5). Even though they have not been reported in the official geological cartography, a specific survey allowed numerous outcrops of soluble Triassic rocks in the area to be identified, such as carbonate breccias, gypsum, and anhydrite. The carbonate clasts are centimetric to sub-centimetric in size, saccharine in appearance, and white in color. These are immersed in a fine, pale-yellow matrix that becomes yellow ochre upon contact with the clasts. The surface deposits are largely composed of undifferentiated glacial deposits, strongly reworked by the eluvial–colluvial action of external agents.
The described spring is located in an impluvium from which derives part of its water resource. However, the overall catchment was discovered to be larger as the water amount is not affected by seasonal variations in the flow rate of the stream.

2.2. Data

Since 2010, the analysed springs (Promise, Alpe Perrot, Promiod, Cheserod springs) have been constantly monitored through multiparametric water probes, which record the discharge (l/s) that flows out of the spring and temperature values with a time step hourly. Additionally, the different case studies turn out to be associated with close weather stations (Table 1). A good network of meteorological monitoring instruments has been developed over time in the territory of the Valle d’Aosta under the responsibility of the Functional Centre, which collects data from 92 meteorological stations. Available sensors installed at the different meteorological stations, particularly rainfall gauges and thermometers, allow a continuous recording of cumulated rainfall (mm) and air temperature values.
In this study, continuous datasets of hourly spring discharge values, air temperature, rainfall data, and measured snow heights from springs and meteorological stations, respectively, were used. Helpful information about climate change impacts in the Aosta Valley region were also found in a cross-border study called Espace Mont Blanc of 2019 (Haute Savoie, Savoie, Canton Valais, Autonomous Region Valle d’Aosta) [28].

2.3. Hydro-Meteorological Data Analysis

Analyzing mountain spring discharge hydrographs still represents the most useful way to detect aquifer characteristics, such as the type and quantity of stored groundwater reserves [29]. A spring hydrograph is the final result of various processes that control the transformation of precipitation and other water inputs into a single output at the spring. The hydrograph shape strictly depends on precipitation characteristics and is constructed based on discharge values (Q) measured during a hydrogeological year, the period between two hydrograph minima.
In this study, hourly spring discharge measurements and hydro-meteorological data (i.e., precipitation values) of the aforementioned case studies (Promise, Alpe Perrot, Promiod, Cheserod springs) and meteorological stations, respectively, were investigated, with the aim of defining the extent of the correlation between the two different analysed variables. Firstly, seven hydrogeological years were individuated along the seven years’ time series of data available (from 2012 to 2019). Each hydrogeological year was then subdivided into two main seasons, based on the recharge and depletion phases of the associated springs’ aquifers (Table 2).
Subsequently, by comparing the springs’ hydrograph and the precipitation graph, the aquifers’ primary recharge sources were identified, explicitly distinguishing between liquid, solid–liquid or solid sources.
Cumulative discharge and rainfall values, recorded at the end of each defined season, are compared to determine the correlation between the spring and the meteorological regimes. In detail, the correlation index was evaluated by estimating the coefficient of determination R2, defined by Equations (1)–(3)
R 2 = E S S T S S
      E S S = i = 1 n ( y i ^ y ¯ ) 2
T S S = i = 1 n ( y i y ¯ ) 2
where ESS is the Explained Sum of Squares, TSS represents the Total Sum of Squares, y i   are the observed data points, y ¯   is their average, and y i ^   are the corresponding estimated data obtained from regression.
The R2 factor describes the proportion of the variation in the dependent variable that can be predicted from the independent variable(s). R2 varies between 0 and 1; when its value is 0, the model used does not explain the data at all, whereas, when the value is 1, the model explains the data perfectly [30].

2.4. Rainfall Time Series Analysis

As noted above, the effects of climate change on groundwater, together with the increasing variability in global water demand during the 21st century, has made time series analysis of rainfall—a primary replenishing source of water—more imperative than ever before [31]. Generally, for a proper characterization of the pluviometric regime, time series of rainfall data at the ground level in millimeters have to be considered. The choice of time step for representing temporal series of rainfall depends on the length of the dataset period and the temporal accuracy required for the specific case study. Several authors have considered time series in terms of annual time steps. In contrast, others have proposed dividing the annual interval into four sub-intervals of equal length, thus increasing the accuracy of the analysis [32].
For the second analysis step of this study, after defining an equal series interval for both the flow rate data and the rainfall, the pluviometric characteristics were analyzed with the aim to identify the possible presence of variations in meteorological conditions during the entire period of analysis (7 years). Specifically, pluviometric properties over the selected period of 7 years were defined by observing whether the amount of rainfall increased or decreased in each month over the years analysed: a linear regression of the time series of data was performed for this purpose, thus defining the slope of the trend line.
A rainfall property characterization was also performed by estimating the frequency of rainfall calculated by counting rainy days for each month and rainfall intensity defined as the ratio between the amount of rain that falls in a month interval of time and the number of rainy days within the same interval.

2.5. Trend Analysis of Flow Rate Long-Term Series

Trends are a gradual change in a data series over time: investigating trends by detecting if there is a significant positive or negative correlation between data and time is one of the most commonly performed analyses in hydro-meteorological research [33].
In the third analysis step of this study, trend analyses on spring discharge measurements at the four analysed springs (Promise, Alpe Perrot, Promiod, Cheserod springs) were conducted to understand (1) how the volumes drained by the different case studies have changed during each period of recharge and depletion and (2) if the annual flow rate amounts have increased over time. In detail, flow rate trends were defined and validated using the Mann–Kendall [34,35] and Sen’s slope trend detection [36] tests, applied to the entire data series. These tests were executed to detect statistically significant trends in 7-year series of annual mean spring discharge, seasonal and hourly datasets.
The Mann–Kendall test is a rank-based non-parametric method, whose purpose is to assess the sign and the significance of monotonic trends in time series. It does not need to satisfy the assumption of normality of the data; its statistic is based on the signs of the variables. The mathematical equations for calculating Mann–Kendall statistics, i.e., S, Var(S), and standardized test statistics ZMK are
S = i = 1 n 1 j = i + 1 n sgn ( Y j Y i )
sgn ( Y j Y i ) = { + 1   i f   s g n ( Y j Y i ) > 0   0   i f   s g n   ( Y j Y i ) = 0   1   i f   s g n   ( Y j Y i ) < 0
V a r   ( S ) = 1 18 n ( n 1 ) ( 2 n + 5 ) p = 1 q t p ( t p 1 ) ( 2 t p + 5 )
Z m k = { S 1 V a r ( S )   i f   S > 0 S + 1 V a r ( S )   i f   S < 0
where Yj and Yi are data at time points j and i (j < i) respectively, n is the length of the time series, tp is the number of ties for the pth value, and q is the number of tied values. The sign of the trend is represented by the sign of standardized test statistic (ZMK).
The true slope of the trend detected by the Mann–Kendall test was then computed by using Sen’s slope test. Sen’s test assumes that trend is linear; the slope, bSen, and the intercept, aSen, of the trend line, are given by
  b s e n = m e d i a n ( ( Y j Y i ) ( j i ) )  
a s e n = m e d i a n ( Y i b s e n t i )
where Yi is the data point at time ti.

3. Results

3.1. Hydro-Meteorological Data Analysis Results

During the first analysis step, the extent of the correlation between the hourly spring discharge measurements and the precipitation amounts is investigated. In detail, the cumulative values of discharge and rainfall, recorded at the end of each season (2012–2019), are used to define the correlation coefficient between the analysed variables.
Figure 6 shows the linear regression trendlines and corresponding R 2 coefficient values. Higher values of R 2 (>0.75; classified as substantial correlation) obtained for the Promiod and Alpe Perrot springs indicate the springs’ tendency to show a clear response to precipitation inputs (Figure 6b,c). In contrast, the Cheserod and Promise springs show R 2 values of 0.67 and 0.52, respectively (i.e., moderate correlation) (Figure 6a,d).
Considering their springs’ hydrographs, the Alpe Perrot and Promiod springs appear to be largely supplied by liquid precipitation throughout each hydrological year. Unlike Alpe Perrot and Promiod, the Promise and Cheserod springs are supplied by solid sources (snow) in winter and liquid (rain) in summer. Consequently, both springs needed to consider the available snow data, eventually modifying the starting date of the next considered hydrogeological year. Furthermore, Promise spring turns out to be the most affected by extreme events due to its geological and hydrogeological features. Considering the fractured nature of its aquifer, part of the infiltrated water appears not to be collected by the drainage network. This phenomenon was confirmed by the correlation coefficient value obtained for the Promise spring equal to 0.52. However, by considering the snow data available and avoiding the contributions of the recorded extreme events, a correlation value of 0.87 was obtained (Figure 6a).

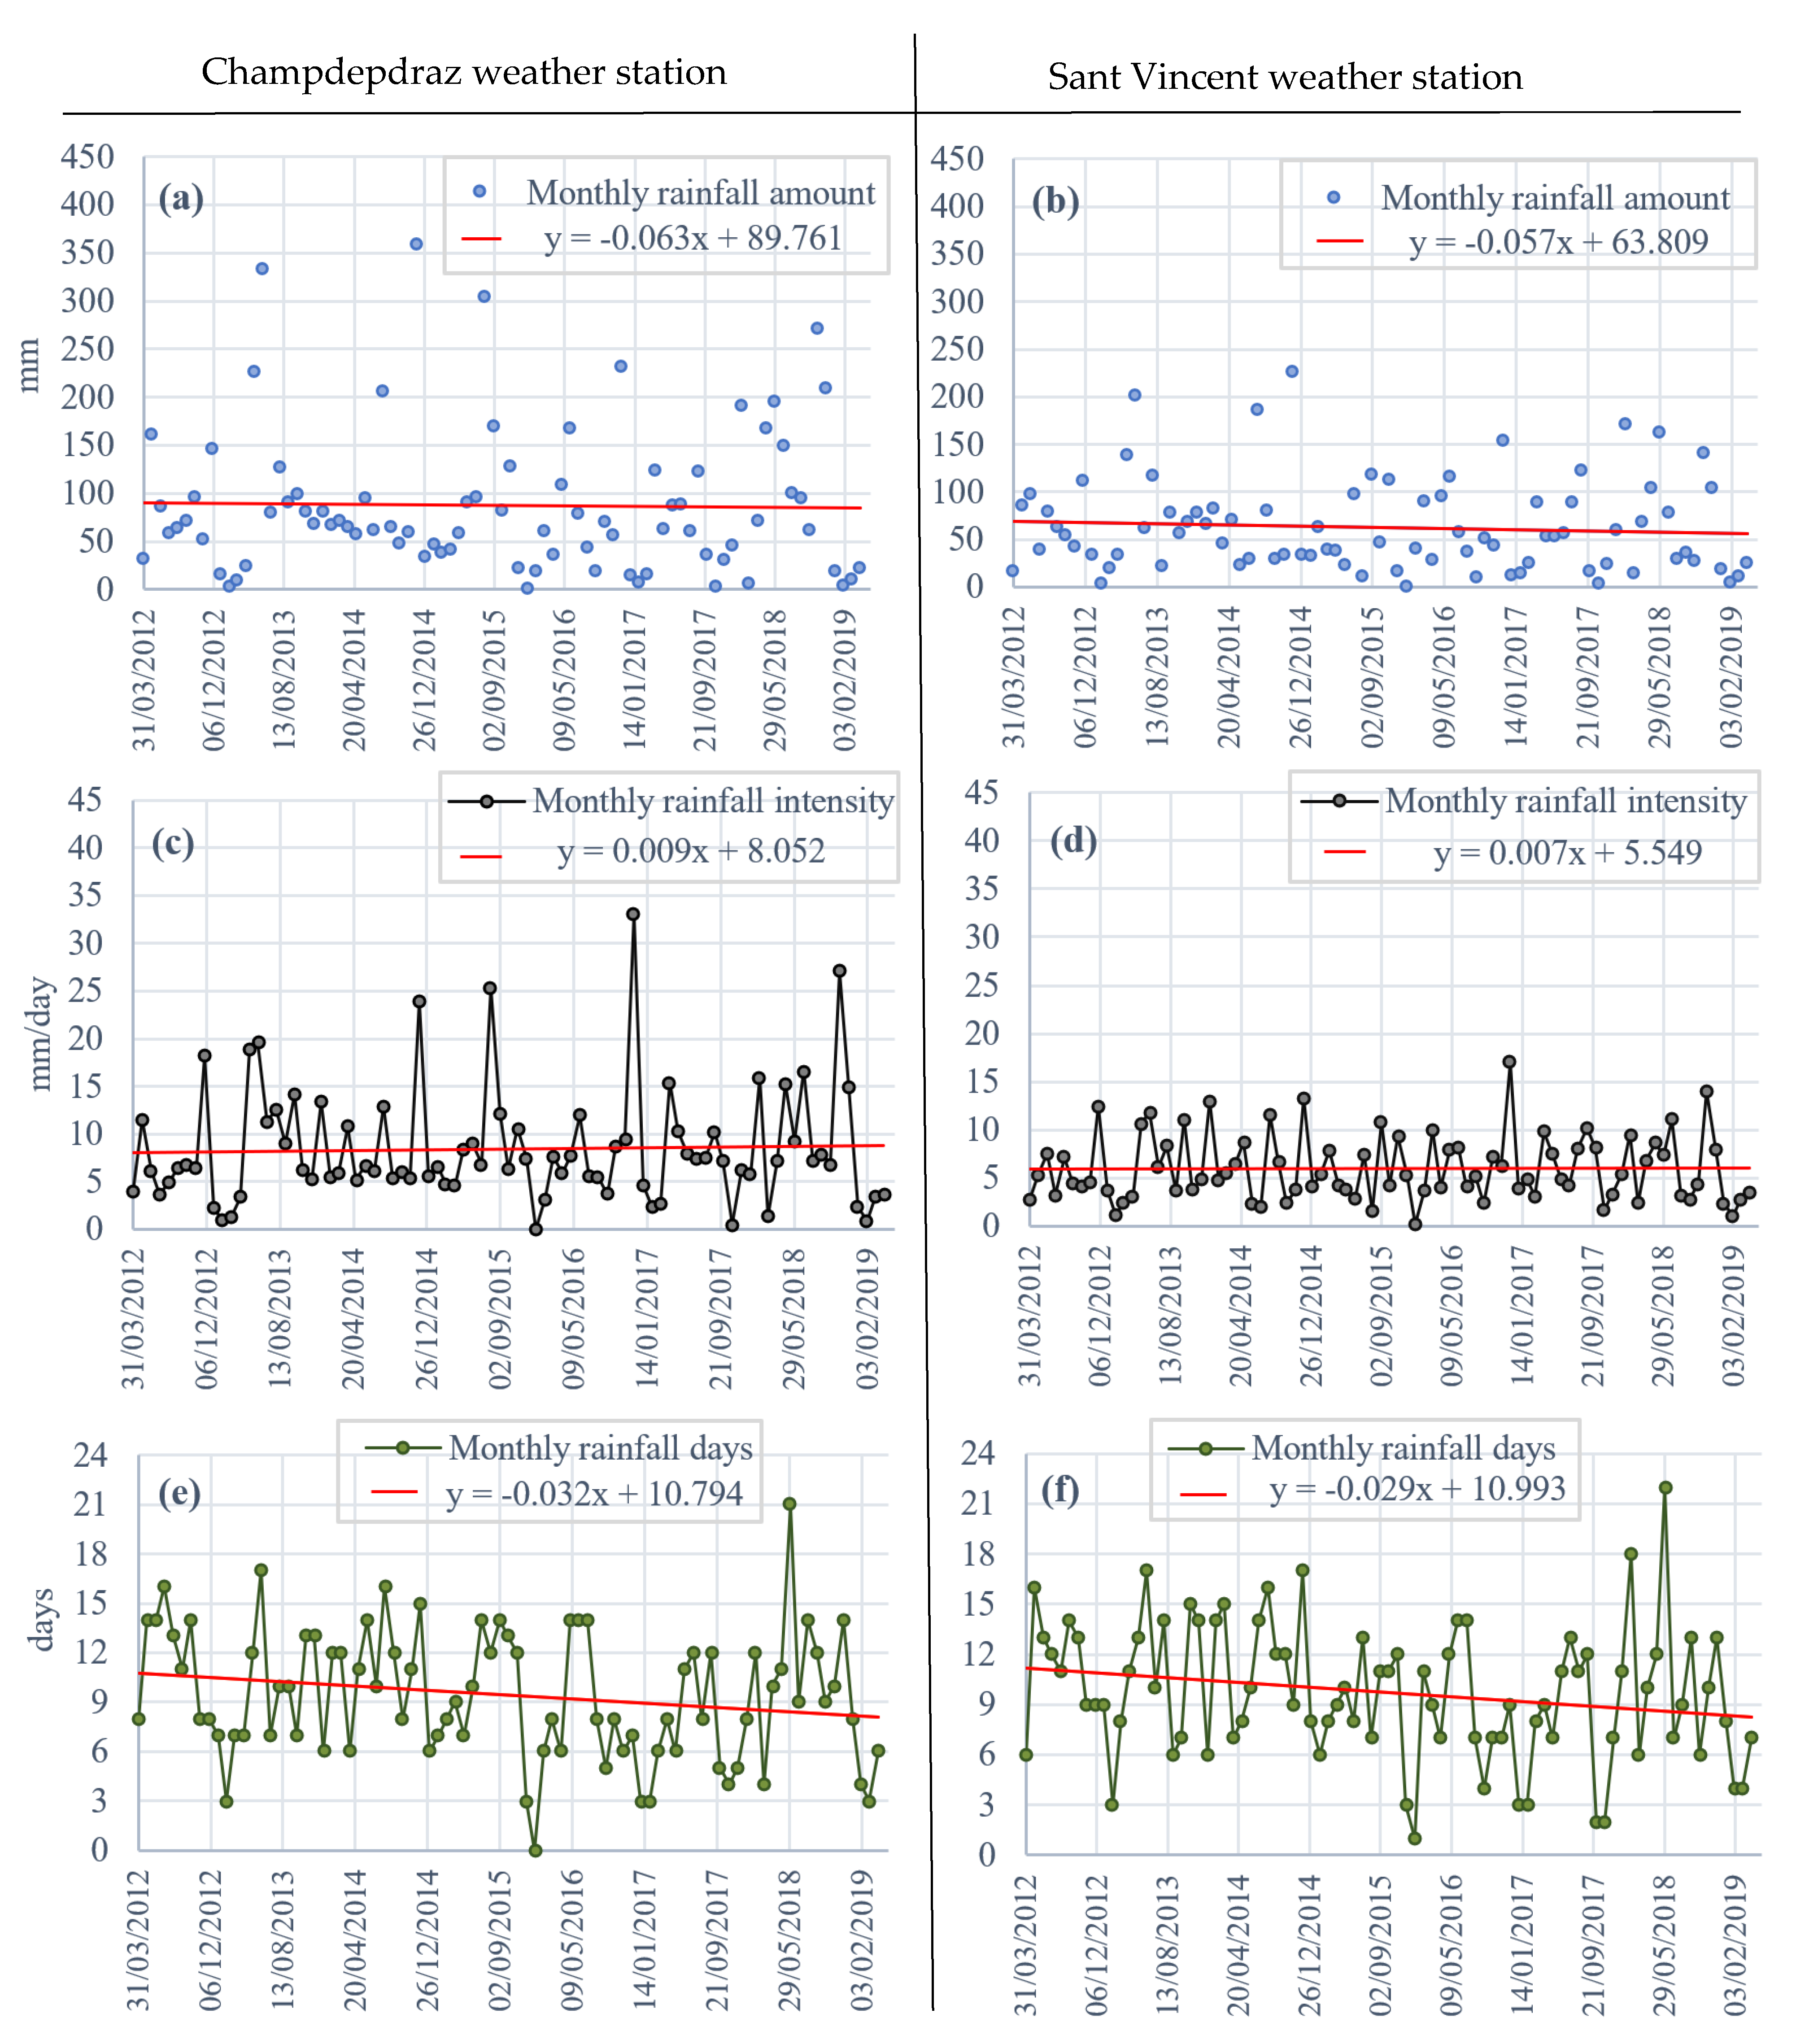
3.2. Rainfall Time Series Analysis Results

During the second analysis step of this study, a comparison between the rainfall and spring discharge time series of the two best-correlated case studies, i.e., Promiod and Alpe Perrot springs was carried out. The main aim was properly examining the evolution of meteorological conditions during the entire considered period of 7 years.
Figure 7 shows the rainfall regime of the analysed weather stations over the selected period (2012–2019) in terms of cumulative precipitation, intensity, and frequency: rainfalls lose their seasonality more evidently for Champdepraz weather station (Figure 7a).
Weather stations’ recorded values (i.e., Champdepraz meteorological station for Alpe Perrot spring and Saint Vincent meteorological station for Promiod spring) revealed an overall decrease in precipitation water amount (mm) (Figure 7a,b), with a slight increase in intensity (mm/day) (Figure 7c,d) relating to a reduction in rainfall events (i.e., the number of rainy days) (Figure 7e,f).
Comparing the months characterized by high rainfall values and present at the beginning of the historical series, rainfall amounts decrease in favor of less rainy months. This behavior can interrupt the annual pattern of the hydrogram into multiple charging and discharging phases, as shown in Figure 8a,b.
Analyzing hydrographs of the Alpe Perrot spring (Figure 8a), it is possible to notice an increasing trend of the minima points, meaning that the aquifer has released less water during each recession period. Unlike Alpe Perrot, Promiod springs turn out to be characterized by a decreasing trend in values of minimums: the discharge amounts better reflect a reduction in the total precipitation contribution over time, i.e., a decreasing trend (Figure 8b).

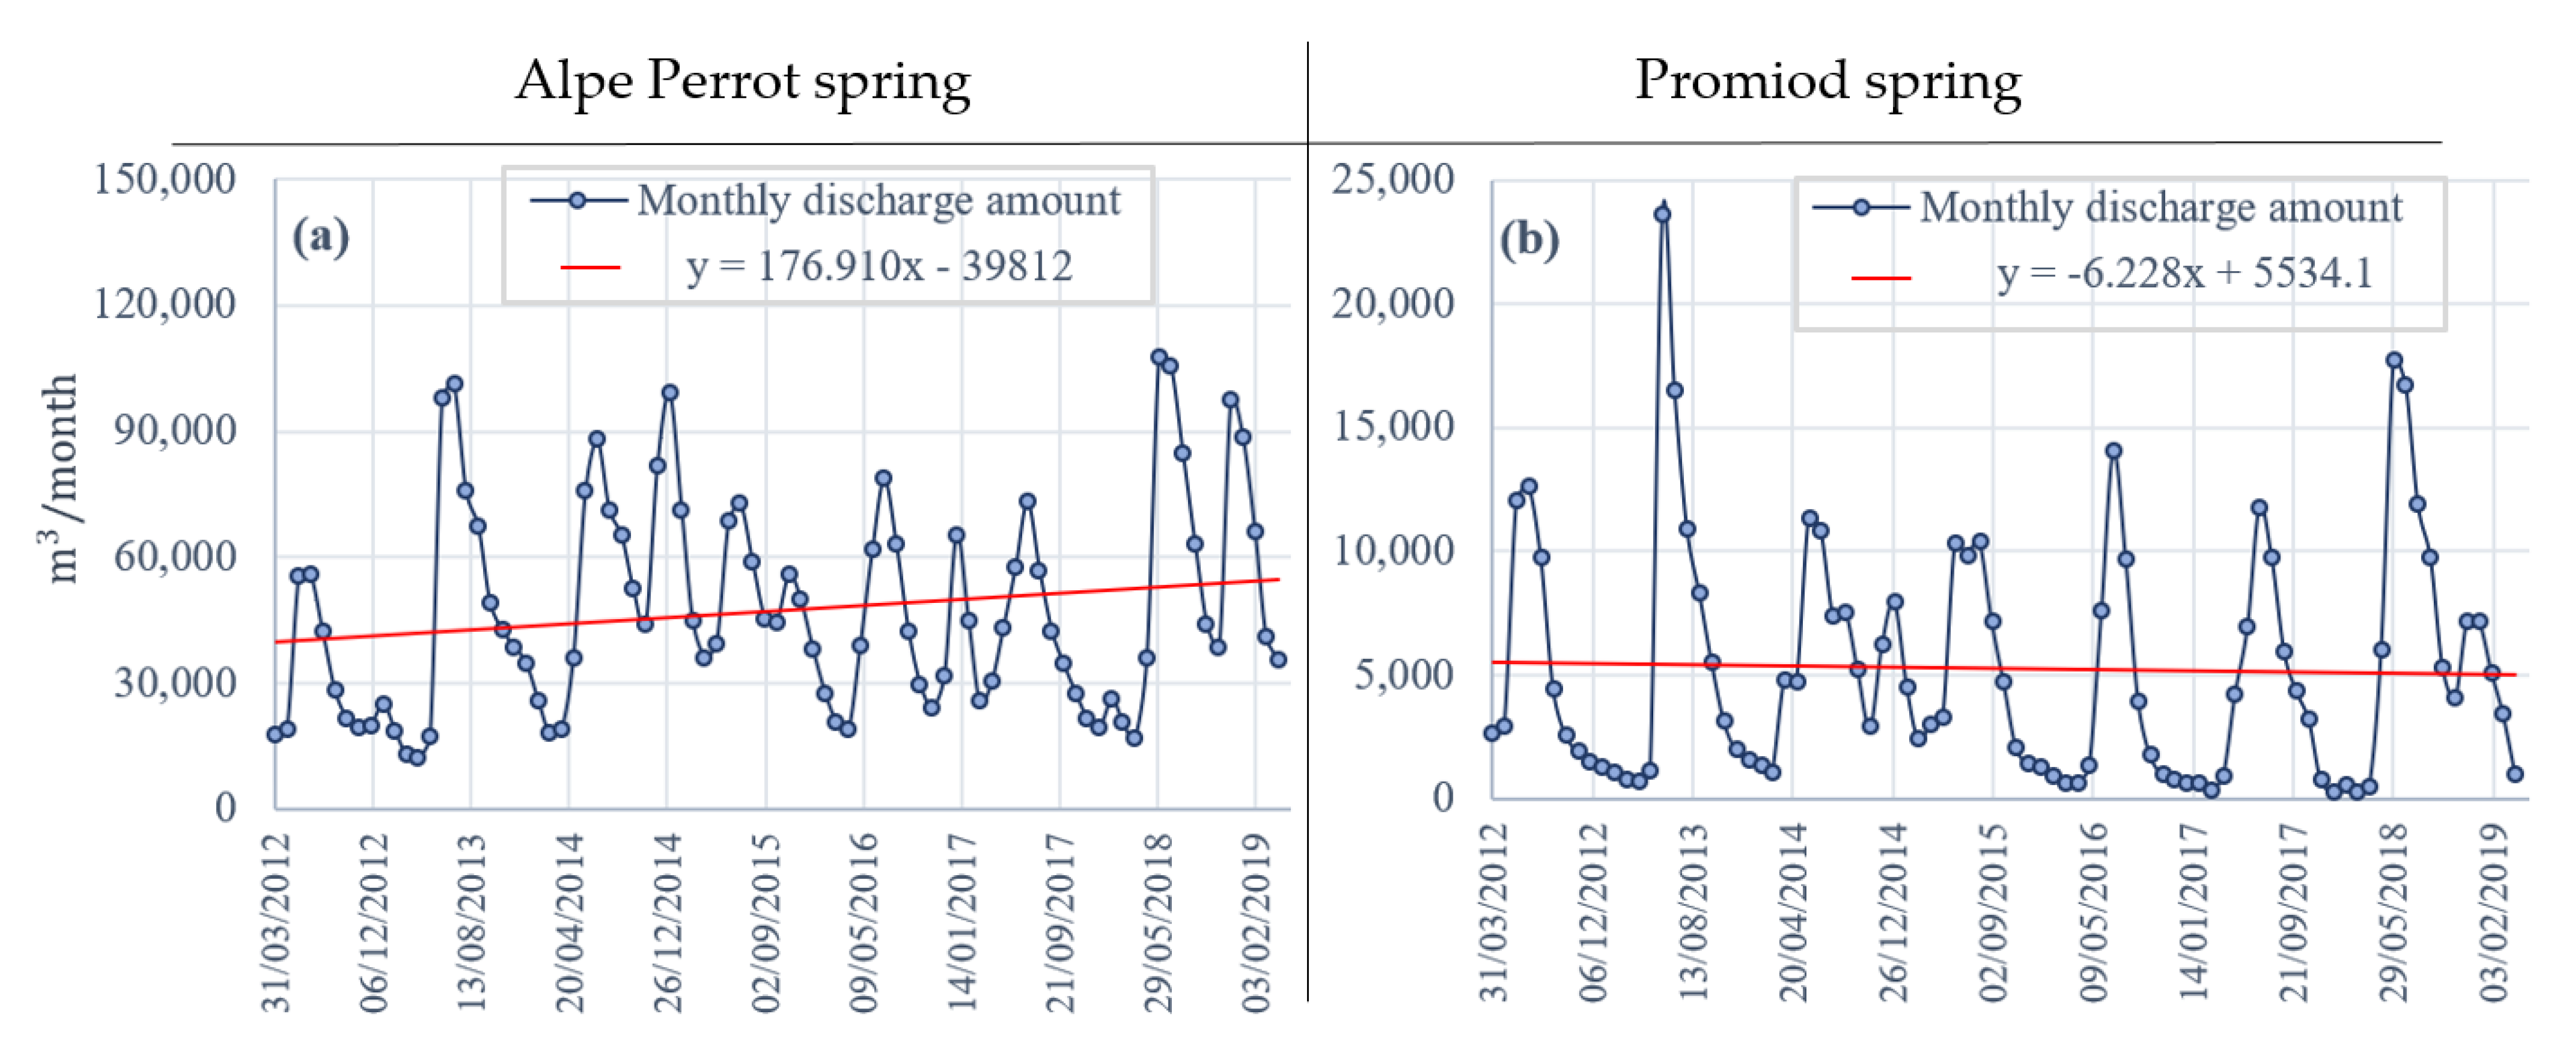
3.3. Trend Analysis Results

During the third analysis step, the variation in the annual quantities of water outflow was assessed by applying the Mann–Kendal/Sen’s slope statistical tests. Furthermore, in order to evaluate the quality of the observations, the approaches mentioned above were compared with the Least Square Linear Regression slope coefficient obtained considering both average daily discharge and monthly cumulative time series.
Table 2 synthesizes the analysis results performed to the entire historical series available from 2800 to 3000 days, depending on the start of measurement of the installed probe. The considered time window with hourly time interval means 67,200–72,000 total values, available for the Mann–Kendal/Sen’s Slope tests. Both Mann–Kendal and Sen’s slope tests revealed statistically significant increasing trends in spring discharge series for the Promise, Alpe Perrot, and Cheserod springs (ZMK > 0, bsen > 0). In contrast, the Promiod spring showed a reduction in discharge over time (ZMK < 0, bsen < 0).
As reported in Table 3, the Promiod spring results in negative slope values for the Sen’s Slope test (bsen < 0) and for both Least Square Linear Regression tests (bLSLR < 0), expressing the decreasing trend in the discharge amount over the selected time interval. The positive trends described by the statistical tests performed for the Cheserod, Promise, and Perrot springs validate the increasing amount of water discharged during the detected period. Moreover, for all case studies data recorded, the low p-values (<0.05) provide the statistical significance of monotonic trend for the springs’ datasets.
Unlike the Mann–Kendal statistical approach, Sen’s slope meaning is quantitative, confirming which spring describes the highest increasing rate in discharge. Cheserod spring shows the highest increasing trend, validated by the two linear regression slopes values (bLSLR), followed by Alpe Perrot and Promise springs.
The three different levels of statistical analysis were performed by considering the hour time interval for the Mann–Kendal/Sen’s slope tests, annual daily average, and monthly discharge for linear regression tests, respectively. This choice aimed to compare and cross-validate each approach applied for trend analysis.

4. Discussion

The Aosta Valley territory includes several aquifer systems with different recharge rates and mechanisms: analyzing the impact of climatic variations on the water resources in these contexts is becoming increasingly important to develop appropriate management strategies for drinkable water resources.
The analysed springs’ recharge mechanisms are closely correlated with the geological and hydrogeological nature of the aquifers. Their intrinsic features and solid precipitation amounts strongly influence the extent of the correlation between a spring’s discharge and rainfall variables. Due to their hydrogeological characteristics and the storage capacity of the drainage network system, porous aquifers, such as those of the Alpe Perrot and Cheserod springs, respond favorably to intense precipitation events. Differently, Promiod and Promise springs’ fractured aquifers suffer intense rainfall conditions, leading to a faster saturation of the recharge system. Moreover, for fractured aquifers, the rapid saturation of the system causes a loss of water through the surface runoff phenomenon. The high correlation factor values between the hourly spring discharge measurements and hydro-meteorological data estimated for the Alpe Perrot and Promiod springs lead to identifying these sites as suitable case studies for further analysis about the short-term effects of climate change on groundwater resources.
Similar to findings of previous studies in other regions of Southern Italy (e.g., [17,20]), the Aymaville-Viayes, La Thuile-Villaret, Champdepraz, and Sant Vincent meteorological stations revealed an overall decreasing trend in annual rainfall (mm), with a slight increase in intensity (mm/day) as a result of the reduction in rainfall events (number of rainy days). Nonetheless, based on the analysis of flow rate data relating to the associated springs, Alpe Perrot, Cheserod, and Promise show an overall increasing trend of discharge over time. Although the Cheserod and Promise springs were not found to be highly correlated with rainfall, their aquifers appear to positively respond to the modified climate conditions, increasing the amount of groundwater stored. The moderate correlation values of these two springs can be a consequence of several factors such as: aquifer features, distance from weather station, and solid precipitation amounts that supply water in the following hydrogeological year. However, since their pluviometric conditions are consistent with regional rainfall evolution, it can be assumed that the increasing discharge is principally due to the drainage network.
Unlike Promiod, the positive trends detected and the positive values estimated for all other statistical tests obtained for Cheserod, Promise, and Perrot springs confirm an increase in the amount of water discharged during the seven-year detected period.

5. Conclusions

A preliminary analysis of the discharge rate variations in mountain springs located within the Aosta Valley territory (Northwestern Italy) and trend analyses of hydro-meteorological time series was presented in this work. The main aim of the study was to evaluate the short-term effects of climate change on springs’ recharge mechanisms in this specific geographical context. To accomplish this, 7-year continuous hydro-meteorological data series from Promise, Alpe Perrot, Promiod, and Cheserod springs and related meteorological stations were examined.
Not all of the Aosta Valley mountain springs detected seem to respond to climate variation with a decrease in their stored water resources. Unlike Promiod, Cheserod, Promise, and Alpe Perrot springs have experienced an increase in water discharged amount during the detected 7 year period. This behavior occurs despite the available precipitation data for the associated Sant Vincent, Aymaville-Viayes, La Thuile-Villaret, Champdepraz meteorological stations revealing an overall decreasing trend in annual rainfall (mm), with a slight increase in intensity (mm/day) as a result of the reduction in rainfall events (number of rainy days). Furthermore, the high correlation case study of Alpe Perrod—Champdepraz meteorological station, improves the significance of the identified phenomenon.
As weather conditions are continually changing, it becomes more and more likely that the amount of water supplies from mountain hydrological systems will also change. Thus, being able to continuously monitor the effects induced by changed climatic conditions on water reserves through simplified analysis approaches such as those presented in this paper is increasingly necessary. Moreover, implementing future studies through in-depth analyses of soil infiltration, deeper percolation, and groundwater recharge and storage mechanisms are required.
The simplified approach proposed in this paper, if applied for analyzing other case studies in different Italian geographical contexts, could help to immediately detect how the groundwater springs, located in Italy, are responding to changes in weather conditions, thus providing correlations between the key indices of springs and precipitation trends.

Author Contributions

Conceptualization, M.G., M.M. and E.S.; Data curation, M.M. and E.S; Formal analysis, M.G.; Funding acquisition, S.L.R.; Investigation, E.S; Methodology, M.G.; Project administration, S.L.R.; Resources, S.L.R.; Software, E.S; Supervision, G.T.; Visualization, S.L.R.; Writing—original draft, M.G., M.M. and E.S; Writing—review & editing, M.G. and M.M. All authors have read and agreed to the published version of the manuscript.

Funding

This research received no external funding.

Institutional Review Board Statement

Not applicable.

Informed Consent Statement

Not applicable.

Data Availability Statement

The hourly recorded data used to support the findings of this study have not been made directly available because they are the property of Politecnico di Torino. However, they are reported as graphs throughout this study.

Conflicts of Interest

The authors declare that they have no known competing financial interest or personal relationships that could have appeared to influence the work reported in this paper.

References

  1. Unesco, Leaving No One Behind, The United Nations World Water Development Report; United Nations Educational, Scientific and Cultural Organization: Paris, France, 2019.
  2. Wu, W.Y.; Lo, M.H.; Wada, Y.; Famiglietti, J.S.; Reager, J.T.; Yeh, P.J.F.; Ducharne, A.; Yang, Z.L. Divergent Effects of Climate Change on Future Groundwater Availability in Key Mid-Latitude Aquifers. Nat. Commun. 2020, 11, 3710. [Google Scholar] [CrossRef]
  3. Cramer, W.; Guiot, J.; Fader, M.; Garrabou, J.; Gattuso, J.-P.; Iglesias, A.; Lange, M.A.; Lionello, P.; Llasat, M.C.; Paz, S.; et al. Climate Change and Interconnected Risks to Sustainable Development in the Mediterranean. Nat. Clim. Chang. 2018, 8, 972–980. [Google Scholar] [CrossRef] [Green Version]
  4. Saadi, S.; Todorovic, M.; Tanasijevic, L.; Pereira, L.S.; Pizzigalli, C.; Lionello, P. Climate Change and Mediterranean Agriculture: Impacts on Winter Wheat and Tomato Crop Evapotranspiration, Irrigation Requirements and Yield. Agric. Water Manag. 2015, 147, 103–115. [Google Scholar] [CrossRef]
  5. De Biase, M.; Chidichimo, F.; Maiolo, M.; Micallef, A. The Impact of Predicted Climate Change on Groundwater Resources in a Mediterranean Archipelago: A Modelling Study of the Maltese Islands. Water 2021, 13, 3046. [Google Scholar] [CrossRef]
  6. Van Engelenburg, J.; Hueting, R.; Rijpkema, S.; Teuling, A.J.; Uijlenhoet, R.; Ludwig, F. Impact of Changes in Groundwater Extractions and Climate Change on Groundwater-Dependent Ecosystems in a Complex Hydrogeological Setting. Water Resour. Manag. 2018, 32, 259–272. [Google Scholar] [CrossRef] [Green Version]
  7. Green, T.R. Linking Climate Change and Groundwater. In Integrated Groundwater Management: Concepts, Approaches and Challenges; Jakeman, A.J., Barreteau, O., Hunt, R.J., Rinaudo, J.-D., Ross, A., Eds.; Springer International Publishing: Cham, Switzerland, 2016; pp. 97–141. [Google Scholar] [CrossRef] [Green Version]
  8. Riedel, T.; Weber, T.K.D. Review: The Influence of Global Change on Europe’s Water Cycle and Groundwater Recharge. Hydrogeol. J. 2020, 28, 1939–1959. [Google Scholar] [CrossRef]
  9. Szwed, M. Variability of Precipitation in Poland under Climate Change. Theor. Appl. Climatol. 2019, 135, 1003–1015. [Google Scholar] [CrossRef] [Green Version]
  10. Amanambu, A.C.; Obarein, O.A.; Mossa, J.; Li, L.; Ayeni, S.S.; Balogun, O.; Oyebamiji, A.; Ochege, F.U. Groundwater System and Climate Change: Present Status and Future Considerations. J. Hydrol. 2020, 589, 125163. [Google Scholar] [CrossRef]
  11. Madakumbura, G.D.; Kim, H.; Utsumi, N.; Shiogama, H.; Fischer, E.M.; Seland, Ø.; Scinocca, J.F.; Mitchell, D.M.; Hirabayashi, Y.; Oki, T. Event-to-Event Intensification of the Hydrologic Cycle from 1.5 °C to a 2 °C Warmer World. Sci. Rep. 2019, 9, 3483. [Google Scholar] [CrossRef]
  12. Koutsoyiannis, D. Revisiting the Global Hydrological Cycle: Is It Intensifying? Hydrol. Earth Syst. Sci. 2020, 24, 3899–3932. [Google Scholar] [CrossRef]
  13. Rottler, E.; Francke, T.; Bürger, G.; Bronstert, A. Long-Term Changes in Central European River Discharge for 1869-2016: Impact of Changing Snow Covers, Reservoir Constructions and an Intensified Hydrological Cycle. Hydrol. Earth Syst. Sci. 2020, 24, 1721–1740. [Google Scholar] [CrossRef] [Green Version]
  14. Todzo, S.; Bichet, A.; Diedhiou, A. Intensification of the Hydrological Cycle Expected in West Africa over the 21st Century. Earth Syst. Dyn. 2020, 11, 319–328. [Google Scholar] [CrossRef] [Green Version]
  15. Carvalho-Santos, C.; Monteiro, A.T.; Azevedo, J.C.; Honrado, J.P.; Nunes, J.P. Climate Change Impacts on Water Resources and Reservoir Management: Uncertainty and Adaptation for a Mountain Catchment in Northeast Portugal. Water Resour. Manag. 2017, 31, 3355–3370. [Google Scholar] [CrossRef] [Green Version]
  16. Duratorre, T.; Bombelli, G.M.; Menduni, G.; Bocchiola, D. Hydropower Potential in the Alps under Climate Change Scenarios. The Chavonne Plant, Val D’Aosta. Water 2020, 12, 2011. [Google Scholar] [CrossRef]
  17. Polemio, M.; Casarano, D. Climate Change, Drought and Groundwater Availability in Southern Italy. Geol. Soc. Spec. Publ. 2008, 288, 39–51. [Google Scholar] [CrossRef] [Green Version]
  18. Bocchiola, D.; Diolaiuti, G. Evidence of Climate Change within the Adamello Glacier of Italy. Theor. Appl. Climatol. 2010, 100, 351–369. [Google Scholar] [CrossRef]
  19. Forestieri, A.; Arnone, E.; Blenkinsop, S.; Candela, A.; Fowler, H.; Noto, L.V. The Impact of Climate Change on Extreme Precipitation in Sicily, Italy. Hydrol. Process. 2018, 32, 332–348. [Google Scholar] [CrossRef] [Green Version]
  20. Padulano, R.; Reder, A.; Rianna, G. An Ensemble Approach for the Analysis of Extreme Rainfall under Climate Change in Naples (Italy). Hydrol. Process. 2019, 33, 2020–2036. [Google Scholar] [CrossRef]
  21. Leone, G.; Pagnozzi, M.; Catani, V.; Ventafridda, G.; Esposito, L.; Fiorillo, F. A Hundred Years of Caposele Spring Discharge Measurements: Trends and Statistics for Understanding Water Resource Availability under Climate Change. Stoch. Environ. Res. Risk Assess. 2020, 35, 345–370. [Google Scholar] [CrossRef]
  22. Atlante Climatico Della Valle d’Aosta/Coord; Societá Meteorologica Subalpina: Torino, Italy, 2003.
  23. Amanzio, G.; Bertolo, D.; De Maio, M.; Lodi, L.P.; Pitet, L.; Suozzi, E. Global Warming in the Alps: Vulnerability and Climatic Dependency of Alpine Springs in Italy, Regione Valle d’aosta and Switzerland, Canton Valais. In Engineering Geology for Society and Territory; Springer: Cham, Switzerland, 2015; Volume 5, pp. 1375–1378. [Google Scholar] [CrossRef]
  24. Lo Russo, S.; Amanzio, G.; Ghione, R.; De Maio, M. Recession Hydrographs and Time Series Analysis of Springs Monitoring Data: Application on Porous and Shallow Aquifers in Mountain Areas (Aosta Valley). Environ. Earth Sci. 2015, 73, 7415–7434. [Google Scholar] [CrossRef]
  25. ISTAT. Available online: https://demo.istat.it/bilmens/index.php?anno=2021&lingua=ita (accessed on 1 March 2022).
  26. Martin, S.; Godard, G.; Rebay, G. 32nd International Geological Congress. The Subducted Tethys in the Aosta Valley (Italian Western Alps). Volume 2. APAT Roma. 2004. Available online: https://www.researchgate.net/publication/236944206_The_subducted_Tethys_in_the_Aosta_Valley_Italian_Western_Alps (accessed on 27 February 2022).
  27. Bistacchi, A.; Dal Piaz, G.; Massironi, M.; Zattin, M.; Balestrieri, M. The Aosta-Ranzola Extensional Fault System and Oligocene-Present Evolution of the Austroalpine-Penninic Wedge in the Northwestern Alps. Int. J. Earth Sci. 2001, 90, 654–667. [Google Scholar] [CrossRef]
  28. Cremonese, E.; Carlson, B.; Filippa, G.; Pogliotti, P.; Alvarez, I.; Fosson, J.P.; Ravanel, L.; Delestrade, A. AdaPT Mont-Blanc: Rapport Climat: Changements climatiques dans le massif du Mont-Blanc et impacts sur les activités humaines. In Rédigé dans le Cadre du Projet AdaPT Mont-Blanc Financé par le Programme Européen de Coopération Territoriale Alcotra Italie-France 2014–2020; 2019; 101p, Available online: https://www.preventionweb.net/publication/climate-report-climate-change-mont-blanc-massif-and-its-impacts-human-activity (accessed on 27 February 2022).
  29. Cerino Abdin, E.; Taddia, G.; Gizzi, M.; Lo Russo, S. Reliability of spring recession curve analysis as a function of the temporal resolution of the monitoring dataset. Environ. Earth Sci. 2021, 80, 249. [Google Scholar] [CrossRef]
  30. Tiao, G.C.; Draper, N.R.; Smith, H. Applied Regression Analysis. Rev. l’Institut Int. Stat./Rev. Int. Stat. Inst. 1968, 36, 104. [Google Scholar] [CrossRef]
  31. Attah, D.A.; Bankkole, G.M. Time Series Analysis Model for Annual Rainfall Data in Lower Kaduna Catchment Kaduna, Nigeria. Glob. J. Res. Eng. 2012, 2, 82–87. [Google Scholar]
  32. Olatayo, T.O.; Taiwo, A.I. Statistical Modelling and Prediction of Rainfall Time Series Data. Glob. J. Comuter Sci. Technol. 2014, 14, 1–10. [Google Scholar]
  33. Machiwal, D.; Jha, M.K. Time Series Analysis of Hydrologic Data for Water Resources Planning and Management: A Review. J. Hydrol. Hydromech. 2006, 54, 237–257. [Google Scholar]
  34. Mann, H.B. Nonparametric tests against trend. Econometrica 1945, 13, 245–259. [Google Scholar] [CrossRef]
  35. Kendall, M.G. Rank Correlation Methods, 4th ed.; Charles Griffin: London, UK, 1975. [Google Scholar]
  36. Sen, P.K. Estimates of the regression coefficient based on Kendall’s tau. J. Am. Stat. Assoc. 1968, 63, 1379–1389. [Google Scholar] [CrossRef]
Figure 1. Aosta Valley region sketch map. Yellow triangles indicate the weather stations, blue points the mountain springs locations.
Water 14 01004 g001
Figure 2. Geological and morphological characterization of the Promise spring. The superficial catchment area of the spring was calculated using the SAGA GIS toolbox hydrology algorithms within QGIS 3.16.3 software.
Water 14 01004 g002
Figure 3. Geological and morphological characterization of Alpe Perrot spring. The superficial catchment area of the spring was calculated using the SAGA GIS toolbox hydrology algorithms within QGIS 3.16.3 software.
Water 14 01004 g003
Figure 4. Geological and morphological characterization of Promiod spring. The superficial catchment area of the spring was calculated using the SAGA GIS toolbox hydrology algorithms within QGIS 3.16.3 software.
Water 14 01004 g004
Figure 5. Geological and morphological characterization of Cheserod spring. The superficial catchment area of the spring was calculated using the SAGA GIS toolbox hydrology algorithms within QGIS 3.16.3 software.
Water 14 01004 g005
Figure 6. Graphs representing the correlation between seasonal values of cumulative discharge (x-axis) and cumulative precipitation (y-axis) for each hydrogeological season from 2012 to 2019. The coefficient of determination ( R 2 ) for the linear regression of the two datasets in each graph is shown. (a) Promise spring; (b) Alpe Perrot spring; (c) Promiod spring (d); Cheserod spring.
Water 14 01004 g006
Figure 7. Time series plots of rainfall amount (a,b), intensity (c,d) and rainy days (e,f) over the analyzed period taking into account the two best-correlated weather station—springs study cases: Alpe Perrot—Champdepdraz (a,c,e) and Promiod—Saint Vincent (b,d,f). The linear interpolation trend is represented by a red line and the regression equation is shown in each plot.
Water 14 01004 g007
Figure 8. Time series of discharge (a,b) of the two sets of best-correlated weather station—springs study cases: Alpe Perrot—Champdepdraz (a) and Promiod—Saint Vincent (b). The linear interpolation trend is represented by a red line and the regression equation is shown on each plot.
Water 14 01004 g008
Table 1. Selected meteorological stations.
Weather Stations:Aymavilles—VieyesSaint Vincent—TermeLa Thuile—VillaretChampdepraz—Chevrère
Place:VieyesTermeVillaretChevrère
Municipality:AymavillesSaint VincentLa ThuileChampdepraz
Basin:s. Grand’EyviaDora Balteas. Ruitors. Chalamy
Spring:Cheserod springPromiod springPromise springAlpe Perrot spring
Elevation (m a.s.l.):113962614881260
Latitude (WGS84)45.6497°45.7495°45.7095°45.6835°
Longitude (WGS84)7.2508°7.6526°6.95609°7.61357°
Weather Station–Spring distance6650 m5147 m1342 m612 m
Water 14 01004 i001 Water 14 01004 i002 Water 14 01004 i003 Water 14 01004 i004
Aymavilles—VieyesSaint Vincent—TermeLa Thuile—VillaretChampdepraz—Chevrère
Table 2. Hydrogeological years (seasons) analyzed for each spring.
Promise Alpe Perrot PromiodCheserod
1° h.y.09/03/2012–12/04/2013 12/03/2012–25/03/2013 29/02/2012–19/04/2013 17/12/2011–26/03/2013
(recharge season; discharge season)(09/03/2012–08/05/2012; 09/05/2012–12/04/2013) (12/03/2012–05/06/2012; 06/06/2012–25/03/2013)(29/02/2012–21/05/2012; 22/05/2012–19/04/2013)(17/12/2011–06/07/2012; 07/07/2012–26/03/2013)
2° h.y.13/04/2013–09/03/2014 26/03/2013–14/03/2014 20/04/2013–08/02/2014 27/03/2013–23/05/2014
(recharge season; discharge season)(13/04/2013–06/05/2013; 07/05/2013–09/03/2014)(26/03/2013–24/05/2013; 25/05/2013–14/03/2014(20/04/2013–18/05/2013; 19/05/2013–08/02/2014)(27/03/2013–25/08/2013; 26/08/2013–23/05/2014)
3° h.y.10/03/2014–15/03/2015 15/03/2014–13/03/2015 09/02/2014–13/03/2015 24/05/2014–02/05/2015
(recharge season; discharge season)(10/03/2014–21/04/2014; 22/04/2014–15/03/2015)(15/03/2014–30/05/2014; 31/05/2014–13/03/2015)(09/02/2014–23/05/2014; 24/05/2014–13/03/2015)(24/05/2014–05/06/2014; 06/06/2014–02/05/2015)
4° h.y.16/03/2015–26/02/2016 14/03/2015–20/03/2016 14/03/2015–17/02/2016 03/05/2015–09/04/2016
(recharge season; discharge season)(16/03/2015–08/05/2015; 09/05/2015–26/02/2016)(14/03/2015 -17/06/2015; 18/06/2015–20/03/2016)(14/03/2015–21/05/2015; 22/05/2015–17/02/2016)(03/05/2015–11/07/2015; 12/07/2015–09/04/2016)
5° h.y.27/02/2016–10/03/2017 21/03/2016–09/03/2017 18/02/2016–11/02/2017 10/04/2016–13/05/2017
(recharge season; discharge season)(27/02/2016–27/04/2016; 28/04/2016–10/03/2017)(21/03/2016–06/06/2016; 07/06/2016–09/03/2017)(18/02/2016 -10/06/2016; 11/06/2016–11/02/2017)(10/04/2016–07/09/2016; 08/09/2016–13/05/2017)
6° h.y.11/03/2017–05/04/2018 10/03/2017–24/03/2018 12/02/2017–17/02/2018 14/05/2017–12/04/2018
(recharge season; discharge season)(11/03/2017–20/04/2017; 21/04/2017–05/04/2018)(10/03/2017–01/06/2017; 02/06/2017–24/03/2018)(12/02/2017–12/06/2017; 13/06/2017–17/02/2018)(14/05/2017–07/06/2017; 08/06/2017–12/04/2018)
7° h.y.06/04/2018–02/04/2019 25/03/2018–31/03/2019 18/02/2018–31/03/2019 13/04/2018–06/06/2019
(recharge season; discharge season)(06/04/2018–02/05/2018; 03/05/2018–02/04/2019)(25/03/2018–04/06/2018; 05/06/2018–31/03/2019)(18/02/2018–11/05/2018; 12/05/2018–31/03/2019)(13/04/2018–23/07/2018; 24/07/2018–06/06/2019)
Table 3. Results of different methods used to assess the trend in spring discharge. * MK = Mann–Kendal; bLSLR = Least Square Linear Regression slope; bsen = Sen’s slope.
MK   *   Standardized   Test   Statistic   ( Z M K ) ;   Hour   Interval   Time   Series   ( l / s )   Sen s   Slope   Test   ( b s e n * ) ;   Hour   Interval   Time   Series   ( l / s ) p-Value Linear   Regression   ( b L S L R * ) ;   Average   Daily   Discharge   Time   Series   ( (   m 3 / d a y ) / y e a r ) Linear   Regression   ( b L S L R * ) ;   Monthly   Cumulate   Time   Series   ( m 3 / m o n t h )
Promise87.023.66 × 10−50.0025.643130.2
Alpe Perrot33.136.39 × 10−50.0087.107176.91
Promiod−23.04−5.08 × 10−60.00−0.214−6.23
Cheserod69.819.68 × 10−50.00219.32378.44
Publisher’s Note: MDPI stays neutral with regard to jurisdictional claims in published maps and institutional affiliations.

