
Compost Amendment Impact on Soil Physical Quality Estimated from Hysteretic Water Retention Curve


1
Department of Agricultural, Food and Forest Sciences, University of Palermo, 90128 Palermo, Italy
2
Council for Agricultural Research and Economics–Research Center for Agriculture and Environment (CREA–AA), Via C. Ulpiani 5, 70125 Bari, Italy
*
Author to whom correspondence should be addressed.
Water 2022, 14(7), 1002; https://doi.org/10.3390/w14071002
Submission received: 23 February 2022
/
Revised: 18 March 2022
/
Accepted: 20 March 2022
/
Published: 22 March 2022
(This article belongs to the Special Issue Advances in Ecohydrology for Water Resources Optimization in Arid and Semi-arid Areas)
Abstract
:Capacity-based indicators of soil physical quality (SPQ) and pore distribution parameters were proposed to assess the effects of compost amendment but their determination was limited to desorption water retention experiments. This study also considered the pore size distribution obtained from adsorption experiments to establish the effectiveness of compost amendment in modifying the physical and hydrological attributes of a sandy loam soil. Repacked soil samples with different compost to soil ratios, r, were subjected to a wetting–drying cycle, and the water retention data were fit to the van Genuchten model to obtain the pore volume distribution functions. The soil bulk density was minimally affected by the wetting–drying cycle but a significant negative correlation with r was obtained. The sorption process involved larger and more heterogeneous pores than the desorption one thus resulting in an estimation of the air capacity SPQ indicators (Pmac and AC) that were higher for the wetting–water retention curve (WWRC) than the drying one (DWRC). The opposite result was found for the water storage SPQ indicators (PAWC and RFC). In general, SPQ indicators and pore distribution parameters were generally outside the optimal range but estimates from the DWRC were closer to the reference values. The water entry potential increased and the air entry potential decreased with an increase in the compost rate. Significant correlations were found between the SPQ indicators estimated from the DWRC and r but the same result was not obtained for the WWRC. It was concluded that compost addition could trigger positive effects on soil hydrological processes and agronomic service as both water infiltration during wetting and water storage during drying are favored. However, the effectiveness of the sorption process for evaluating the physical quality of soils needs further investigation.
1. Introduction
Application of compost is one efficient way to increase soil organic matter level and indirectly improve soil structure and hydrological functions [1,2]. A large number of studies have documented positive effects of compost application on different soil physical and hydrological attributes: total porosity [3], bulk density [4], soil resistance to penetration [5], pore size distribution [6], aggregation and aggregate stability [1,7,8], water retention capacity [9,10], and saturated and unsaturated hydraulic conductivity [11,12]. As a consequence of improved water retention capacity, compost addition increases the plant available water capacity (PAWC) of soils [13]. Comparative analysis of twenty-five studies showed that compost incorporation had positive effects on degraded urban soils in terms of reduced compaction, enhanced infiltration and hydraulic conductivity, and increased water content and PAWC [14].
The above-mentioned positive effects depend on the compost application rate but also on the feedstock type, compost maturity, and compost quality. Application rate usually ranges from 30 to 150 Mg ha−1 [3,6,10] but values up to 750 Mg ha−1 have been reported [12]. A variety of organic wastes have been proposed as soil amendment materials, also with the aim to find sustainable disposal for urban and agricultural byproducts. Compost types include sewage sludge and municipal waste [15,16], maize and sewage sludge [9], pruning waste [17], farm crop residues [18], yard waste [3,19], orange juice processing wastes [20], and mixtures of these materials. As an example, Glab et al. [21] reported the effects of co-composted maize, sewage sludge, and biochar mixtures addition on the hydrological and physical quality of a loamy sandy soil. Compared with the control soil, the physical properties of the amended soil were significantly improved with beneficial effects that were dependent on the rate of compost application and the type of feedstock. Likewise, Rivier et al. [22] investigated the effect of compost and vermicompost on soil structure, water retention, aggregate stability, and plant water use efficiency, compared with that of mineral fertilizers and food-waste digestate.
Binding primary particles into stable aggregates, organic matter influences attributes of soil pores such as size, distribution, shape, and connectivity [18]. The soil–water retention curve (SWRC), relating volumetric water content, θ, to pressure head, h, provides an indirect method to estimate soil porosity and, therefore, to assess the effectiveness of compost for improving the conditioning of soil. A complete description of the pore volume distribution function can be obtained by fitting appropriate semi-empirical functions to θ(h) data [23,24]. Reynolds et al. [25] classified pore size distribution on the basis of selected “location” and “shape” parameters and proposed optimal ranges for each parameter. Another approach relies on estimation of capacity-based indicators of soil physical quality (SPQ) accounting for soil ability to store air and water [23,26]. In any case, comparison of measured pore distribution parameters and SPQ indicators with optimal ranges deduced from literature allows a straightforward assessment of compost application effects [27,28]. To date, such an approach has proved useful for studying different agro-environments and evaluating their sustainability [29,30,31,32,33,34].
The SWRC is not unique because of hysteresis [35]. Briefly, hysteresis is a phenomenon depending on several factors, including non-uniformity in pore cross-sections, variation of dynamic contact angles in the advancing or receding water–air interface menisci, and entrapped air effects, air volume changes, and aging phenomena [36]. Due to hysteresis, the soil water content at a given pressure head is higher during the drying than the wetting process. Nevertheless, estimation of pore distribution parameters and capacitive SPQ indicators has been generally conducted from θ(h) data obtained from desorption experiments under the simplified assumption that hysteresis can be neglected in field conditions because its influence is often masked by heterogeneities and spatial variability [37]. Another reason for using desorption SWRC is that capacity-based SPQ indicators are generally associated with the soil’s ability to store water and transfer it from wet to dry periods, i.e., across a relatively long temporal scale. Adsorption SWRC, i.e., the water retention curve determined for a wetting process, can give additional information on the soil’s ability to store water over the shorter time scale related to the infiltration process. However, to the best of our knowledge, wetting SWRC was never used to determine SPQ nor the effects of compost addition on water retention hysteresis evaluated.
The study investigates the reliability of capacity-based indicators of SPQ and pore size distribution parameters for assessing the effectiveness of compost amendment on a sandy loam soil. With the aim to move forward from the traditional approach based on the analysis of the desorption SWRC, the effects of water retention hysteresis on the estimation of soil physical quality were evaluated. The assumed hypothesis was that analysis of the pore distribution system obtained from the wetting SWRC could complete our knowledge of active porosity under different hydrological processes.
2. Materials and Methods
2.1. Sample Preparation and SWRC Measurement
Soil samples were collected in a citrus orchard at the Department of Agriculture and Forestry Sciences of the University of Palermo, Italy (UTM 33S 355511E-4218990N). The soil (Typic Rhodoxeralf) was classified as sandy loam with a relatively high gravel content (13% by weight) [38] and moderate organic carbon content at the time of sampling (Table 1). The soil samples were air-dried, gently crushed, and passed through a 2 mm sieve before mixing with compost.
The amending compost consisted of 5-months-aged compost from orange juice processing wastes (75%) and garden cleaning (25%) [20]. Agro-industrial wastes were composed of about 60% peel, 30% pulp, and 10% pips, while garden cleaning contained triturated pruning residues and mown grasses. The characteristics of the used compost are reported in Table 1. Compost was preliminarily screened through a 2 mm sieve to eliminate large vegetal residues.
Air-dried compost was mixed with soil in five different proportions by weight: 10% (M10); 20% (M20); 30% (M30); 50% (M50); and 75% (M75). For comparative purposes, the two unmixed matrices, i.e., 100% soil (M0) and 100% compost (M100), were also considered. It is worth noting that the highest compost to soil ratios, r, are far above the maximum usually applied in the field [3,39]. However, the choice to also use high compost application rates was considered reasonable given the ash content of the compost is above and the total carbon content is below the average values for usual food waste and/or dairy animal manure composts [3,18].
Replicate samples of each mixture were obtained by compacting into 5 cm diameter by 5 cm height cylinders a dry mass of the two constituents given by:
in which Mc (g) and Ms (g) are the dry masses of compost and soil, respectively, BDs (g cm−3) and BDc (g cm−3) are the dry bulk densities of the two constituents [40], V (cm3) is the sample volume, and r is the compost to soil ratio. The air-dried masses were corrected to account for the initial soil water content and then gently mixed for 5 min by means of a mechanical sieve to obtain a homogeneous mixture. Sample compaction was conducted in four successive steps by beating the mixture with five strokes from a height of 5 cm followed by five rotations with a pestle at each increment. The same treatment was applied to M0 and M100 to avoid any artifacts due to sample preparation. The samples were then weighted to check that the measured initial bulk density was the same as the theoretical one determined from Equation (1). This sample preparation procedure allowed to obtain highly replicable results even with a limited sample number (n = 2).
The water retention curve was determined by the tension hanging water column apparatus [41] for pressure head, h (m), values ranging from −0.01 to −1 m, and the pressure plate extractors [42] for h values ranging from −1 to −150 m. Each sample was placed on the porous plate of a glass funnel and saturated from the bottom by progressively raising the water level in a graduated burette that allowed to measure the volume of water adsorbed by or drained from the sample. Initial saturation was obtained in four equilibrium steps of 24 h each at h values of −0.2, −0.1, and −0.05 m followed by submersion. Then, the sample was drained by lowering h in several successive steps of 24 h each and finally equilibrated at h = −1 m.
The water retention curve was measured by applying a wetting/drainage cycle consisting of a sequence of 14 h values applied in ascending/descending order (h = −0.01 m, −0.02 m, −0.03 m, −0.05 m, −0.075 m, −0.10 m, −0.15 m, −0.20 m, −0.25 m, −0.30 m, −0.40 m, −0.50 m, −0.70 m, and −1 m). At each h level, the volume of water adsorbed or drained from/into the burette was recorded. The volumetric water content, θ (m3m−3), at each equilibrium stage was calculated by adding the drained or adsorbed volumes to the final θ−1 value determined at h = −1 m by weighting the sample after oven-drying at 105 °C for 24 h. The sample height was measured at the end of the experiment (h = −1 m) and the sample dry soil bulk density, BD (g cm−3) was calculated from the oven-dried weight of the soil sample [43]. Additional replicate samples (n = 3), prepared by the same procedure using only soil (M0) and compost (M100), were intensively monitored during the water retention experiment to evaluate changes in bulk density due to swelling or consolidation processes. At this aim, the sample height was measured at nine fixed points of the sample surface by using a gauge with a precision of 0.5 mm and an average value was determined by the arithmetic mean. Measurements were conducted after sample preparation (H0), at initial saturation (HS), at the initial equilibrium pressure head h = −1 m (H1), at the end of the wetting process when the sample was equilibrated at h = −0.01 m (H2), and at the end of the drainage process for the final equilibrium pressure head h = −1 m (H3).
Water retention data at pressure heads of −1 m, −3.3 m, −10 m, −30 m, and −150 m were determined in pressure plate extractors on three replicated samples of 5 cm diameter by 1 cm height. For each of the seven considered mixtures, the dry masses of compost and soil were calculated from Equation (1) to obtain the same theoretical bulk density value of the 5 cm by 5 cm samples. Determination of volumetric water content at h = −1 m was included in pressure plate experiments for comparison with the θ value measured at the same potential in the tension apparatus. All the measurements were conducted under temperature-controlled conditions at 22 ± 1 °C.
2.2. SWRC Parameterization
Experimental data were fitted by the van Genuchten [24] model (VGN):
in which θs (m3m−3) and θr (m3m−3) are the saturated and residual volumetric water contents, respectively, α is a scale parameter, and n and m with m = 1−1/n are shape parameters. Equation (2) was fitted to experimental data by the SWRC Fit software [44]. Separate fitting was conducted for the two replicates of a given mixture and for the wetting (WWRC) and drainage (DWRC) water retention data. In the second case (DWRC), both the tension and the pressure plate data (n = 19) were considered given the latter were obtained for a drainage process. The VGN model shape and scale parameters (α, n, θs, and θr) were estimated without any constraint to their possible range. For the WWRC, only the tension data (n = 14) were considered and the VGN model was fitted to the data with θr fixed at the value determined for the DWRC. The reliability of estimates was evaluated by the coefficient of correlation, R, the mean error, ME, and the root mean square error, RMSE [45]:
in which Pi is the value of the volumetric water content at a given pressure head estimated from Equation (2), Oi is the corresponding measured value, and and are, respectively, the mean of estimated and measured θ values. Only the van Genuchten model was considered in this investigation as a preliminary visual analysis of the θ(h) data highlighted a typical S-shaped curve that could be adequately fitted by a unimodal water retention curve model.
2.3. Estimation of Soil Physical Quality
The fitted VGN water retention curves were used to estimate the following capacity-based indicators of soil physical quality [25,27,28,46]:
where θm (m3m−3) is the saturated volumetric water content of the soil matrix (h = −0.1 m). The Pmac parameter gives the volume of large (macro) pores (i.e., >300 μm equivalent pore diameter) indirectly indicating the soil’s ability to quickly drain excess water:
where θFC (m3m−3) is the field capacity water content (h = −1 m). The AC parameter is an indicator of soil aeration:
where θPWP (m3m−3) is the permanent wilting point corresponding to h = −150 m:
that expresses the soil’s capacity to store water (and air) relative to the soil’s total pore volume (as represented by θs):
where Us (g g−1) and Ur (g g−1) are the gravimetric saturated and residual water content that, under the assumption of rigid soil, can be calculated from θs and θr. The Sindex represents the magnitude of the slope of the SWRC at the inflection point when the curve is expressed as gravimetric water content versus a natural logarithm of the pressure head [23]. The theory of the Sindex is based on the premise that the shape of the SWRC is controlled primarily by structure pores for h values from saturation to the inflection point and by matrix pores for lower h values. While the former can be modified by soil management (including amendments), the latter mainly depends on more stable soil properties, such as texture.
Optimal soil physical quality conditions require [25,31,47]: Pmac ≥ 0.07 m3m−3, AC ≥ 0.14 m3m−3, PAWC ≥ 0.20 m3m−3, and 0.60 ≤ RFC ≤ 0.70; S ≥ 0.050.
The pore volume distribution function, Sv(h), may be defined as the slope of the SWRC expressed as volumetric water content versus ln(h), and plotted against equivalent pore diameter, de (μm) [25]:
The capillary rise equation was used to estimate the equivalent diameter de = 2980/h (μm) with h expressed in cm. The pore volume distribution function was normalized by dividing Sv by the magnitude of the slope at the inflection point, Svi. Note that Svi is given by Svi = (BD × Sindex) for a rigid soil. The normalized soil pore volume distribution, S*(h), provides a means for comparing among different porous materials being 0 ≤ S*(h) ≤ 1. Pore volume distributions can be characterized and compared using “location” and “shape” parameters, where the location parameters include the modal diameter, dmode (μm), the median diameter, dmedian (μm), and mean diameter, dmean μm). The shape parameters include standard deviation, SD (-), skewness, SK (-), and kurtosis, KU (-). For brevity reasons, the expressions for estimating the location and shape parameters are not given here but the reader is referred to Reynolds et al. [25]. The optimal ranges for these indicators are: dmedian = 3–7 μm; dmode = 60–140 μm; dmean = 0.7–2 μm; SD = 400–1000; SK: from −0.43 to −0.41; and KU = 1.13–1.14.
The flow chart in Figure 1 depicts the procedures and the calculations used to estimate the SPQ indicators and the pore volume distribution functions.
2.4. Data Analisys
For each considered variable and soil property, mean and associated coefficients of variation (CV) were calculated according to the assumed cumulative frequency distribution. Specifically, sample height, BD, Pmac, AC, PAWC, RFC, Sindex, dmode, and dmedian, were assumed to be normally distributed whereas, according to Reynolds et al. [25], the other data (dmean, SD, SK, and KU) were assumed to be ln distributed.
Comparison of means was conducted by the HSD Tukey test (p = 0.05). The influence of compost addition was investigated by assessing the significance of the regression coefficients between the considered soil variables (i.e., BD, VGN parameters, SPQ indicators, and pore distribution parameters) and the compost to soil ratio, r (p = 0.05).
3. Results and Discussion
3.1. Soil Bulk Density
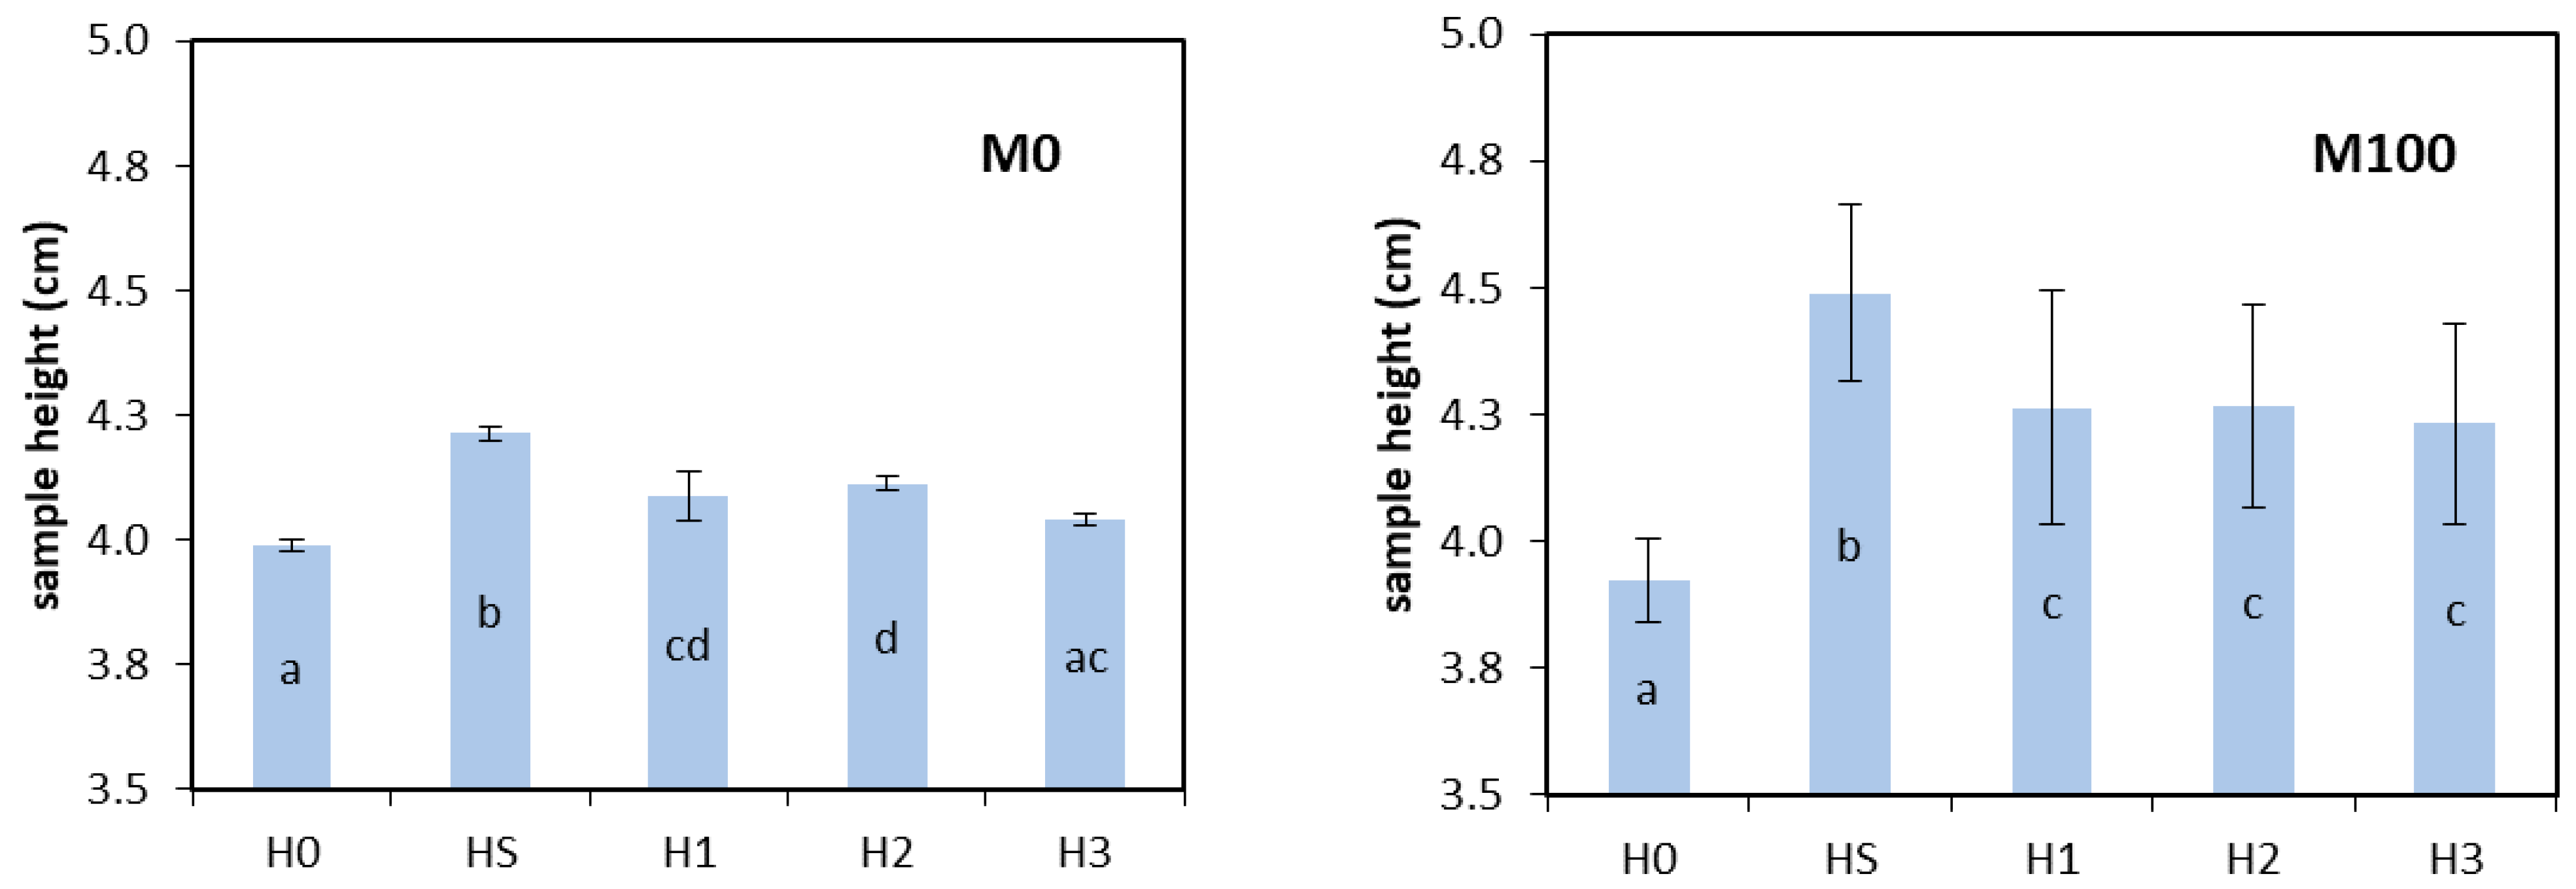
The average height of the samples after preparation under air-dried conditions, H0, varied between 3.99 cm for M0 and 3.92 cm for M100 (Figure 2). The corresponding bulk density values were characterized by the coefficient variations (CV) of 0.29% and 2.14% that are far below the limit of 15% considered acceptable for the properties of this soil [48], thus confirming the reliability of the sampling preparation procedure. Following initial saturation (HS), the mean sample height increased to 4.21 cm for M0 (+5.6%) and 4.49 cm (+14.4%) for M100. Moreover, the CV of the M100 increased following saturation thus showing a higher susceptibility of the amended soil to undergo particle rearrangement as a consequence of the saturation process. According to an HSD Tukey test, the difference in sample heights between preparation and saturation was significant (p = 0.05) for both M0 and M100. After equilibration at the initial pressure head of h = −1 m (H1), the mean sample height significantly decreases to 4.09 cm (M0) and 4.26 cm (M100). Therefore, initial saturation followed by the first drainage cycle modified the original bulk density of the laboratory packed samples probably as a consequence of inter-particle bonds relaxation during wetting followed by settling during drainage. The M100 samples showed higher and more variable heights than M0 samples thus indicating a greater sensitivity to such modifications (Figure 2).
In the subsequent wetting–drainage cycle, the samples were subjected to much fewer height modifications. For M0, height increased by a not significant 0.6% during wetting and decreased by 1.75% during drainage. The height after the wetting–drainage loop (H3 = 4.04 cm) was not statistically different from H1 measured at the same equilibrium pressure head, and it slightly increased only for the higher pressure head of the sequence (H2). For M100, the mean height was practically the same (H1 = 4.26 cm, H2 = 4.27 cm, and H3 = 4.23 cm) being the differences well within the precision of the measurement technique (Figure 2). Therefore, provided a preliminary wetting–drainage cycle had been performed, the sample bulk density was not influenced by subsequent sorption–desorption processes and the soil samples can be considered rigid independently of the applied pressure head in the range −1 ≤ h ≤ −0.01 m. It is worth noting that the mean height of the M100 samples is on average 1.04 times the mean height of the M0 samples. The results of this preliminary investigation allow us to conclude that the laboratory repacked samples may undergo changes in particle configuration as a consequence of the applied sequence of pressure head values. These changes, however, tend to be negligible after the first wetting–drainage loop, at least in the range of h values that are requested for estimating the SPQ indicators. Therefore, the hypothesis of rigid porous medium was considered reasonable and, following the suggestion by Reynolds et al. [25], the BD measured at h = −1 m was assumed to assess the effects of compost amendment.
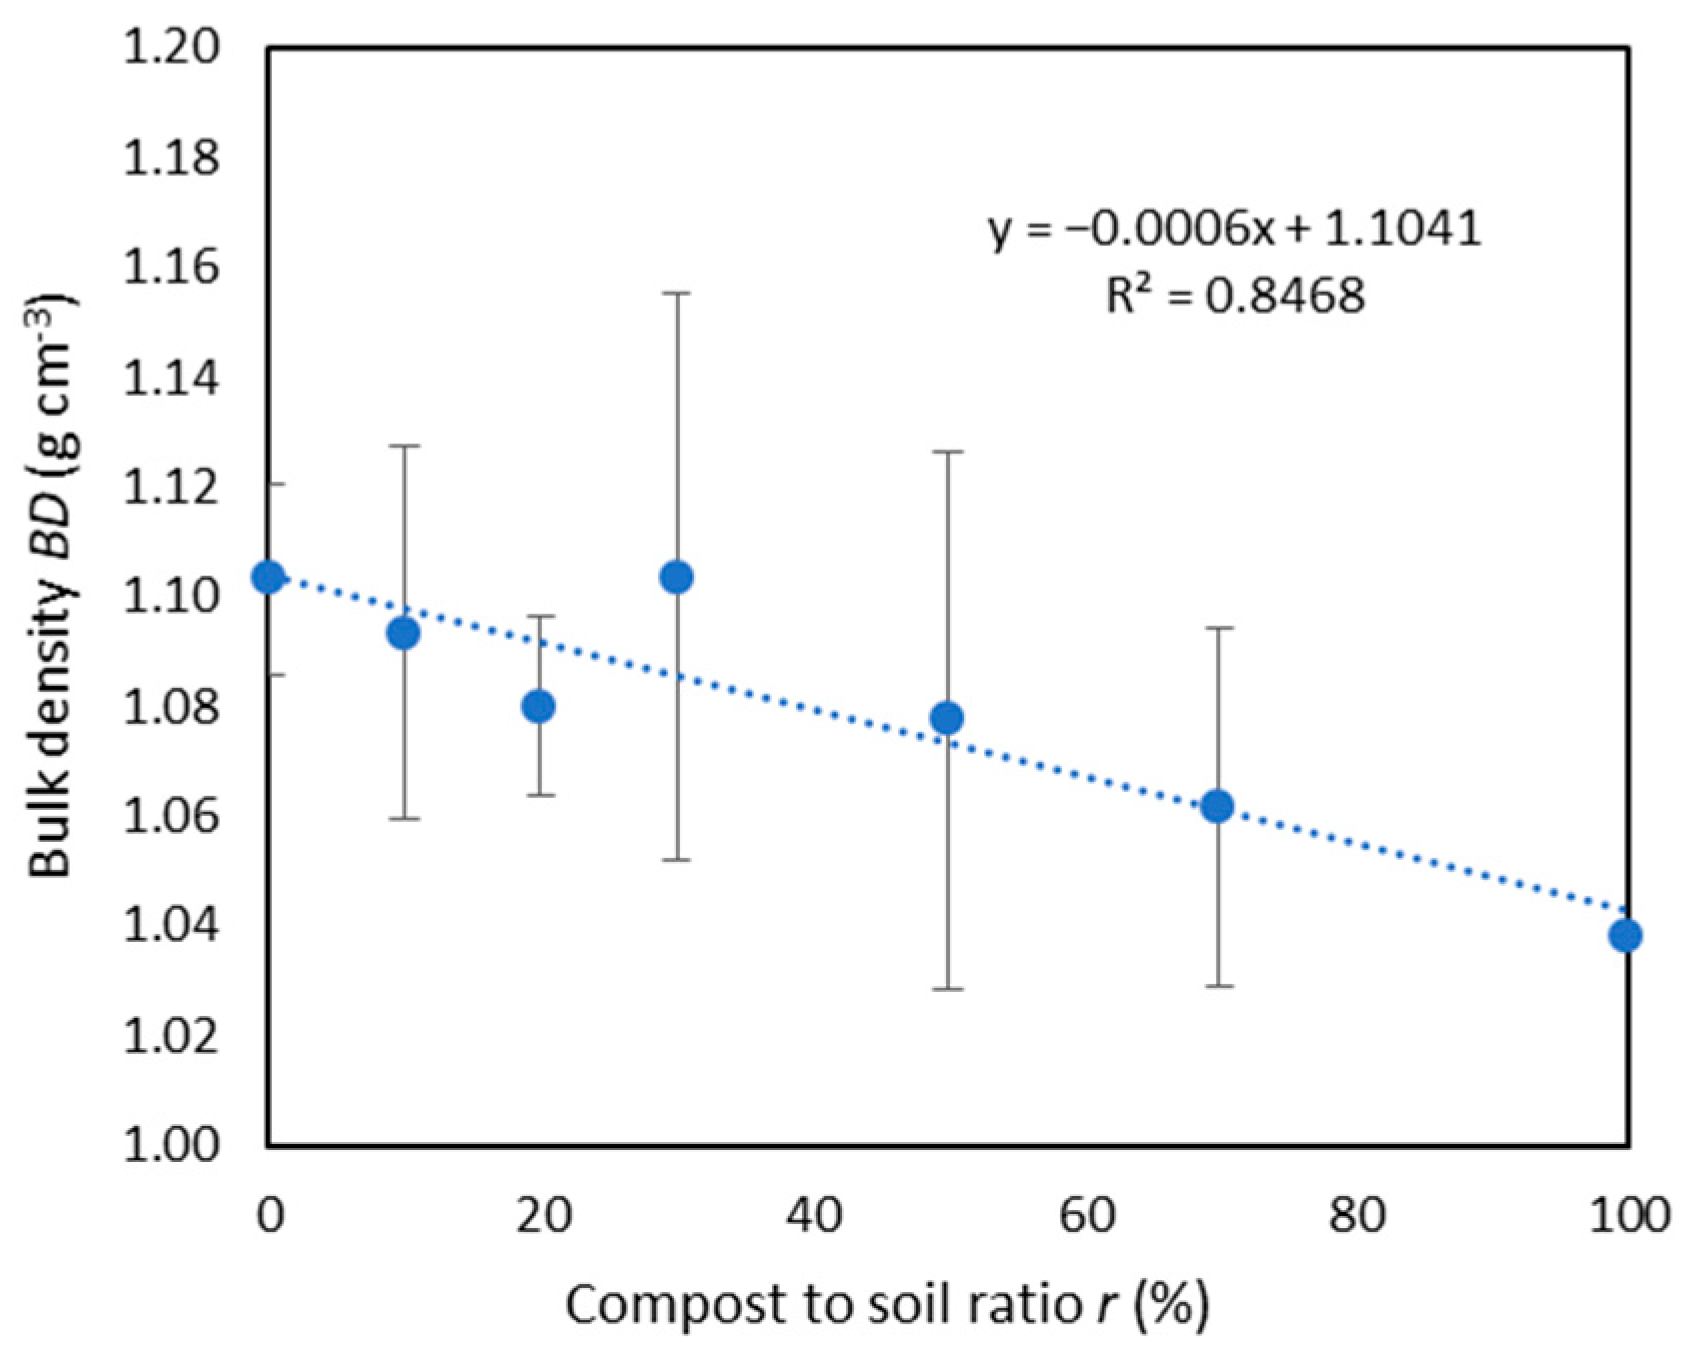
The BD values measured at the end of the wetting–drainage cycle (H3) ranged from 1.03 to 1.14 g cm−3 with a mean value of 1.08 g cm−3 (CV = 3.10%). Independently of the compost to soil ratio, the soil BD was always within the range of BD values considered as optimal for field crop production (0.90 ≤ BD ≤ 1.2 g cm−3) [31,43]. A significant negative correlation (p < 0.005) was found between the sample bulk density and the compost percentage (Figure 3). Similar results were reported by Khaleel et al. [49] and Eden et al. [39] in their review articles on the long-term effects of organic waste recycling in agriculture. Mandal et al. [4] obtained a linear decreasing BD relationship for a silt loam soil amended with composted poultry litter up to 40% v/v. However, a closer examination of the plot also highlights that a threshold type behavior for BD vs. r relationship could be supposed. In particular, compost addition seems to have no effect on BD until a threshold value of r = 30% is reached. Afterward, the soil BD decreases at increasing r value. Such a different soil response was observed, among others, by Reynolds et al. [26] for the short-term effects of a single high rate addition of yard waste compost to a clay loam soil. They found significant differences only at the highest compost rate application, i.e., 300 t ha−1, whereas 75 t ha−1 and 150 t ha−1 produced negligible or small improvements relative to the control. Similarly, Brown and Cotton [50] observed significant changes of a loamy soil BD only for application rates higher than 168 t ha−1.
3.2. Soil Water Retention and Pore Volume Distribution
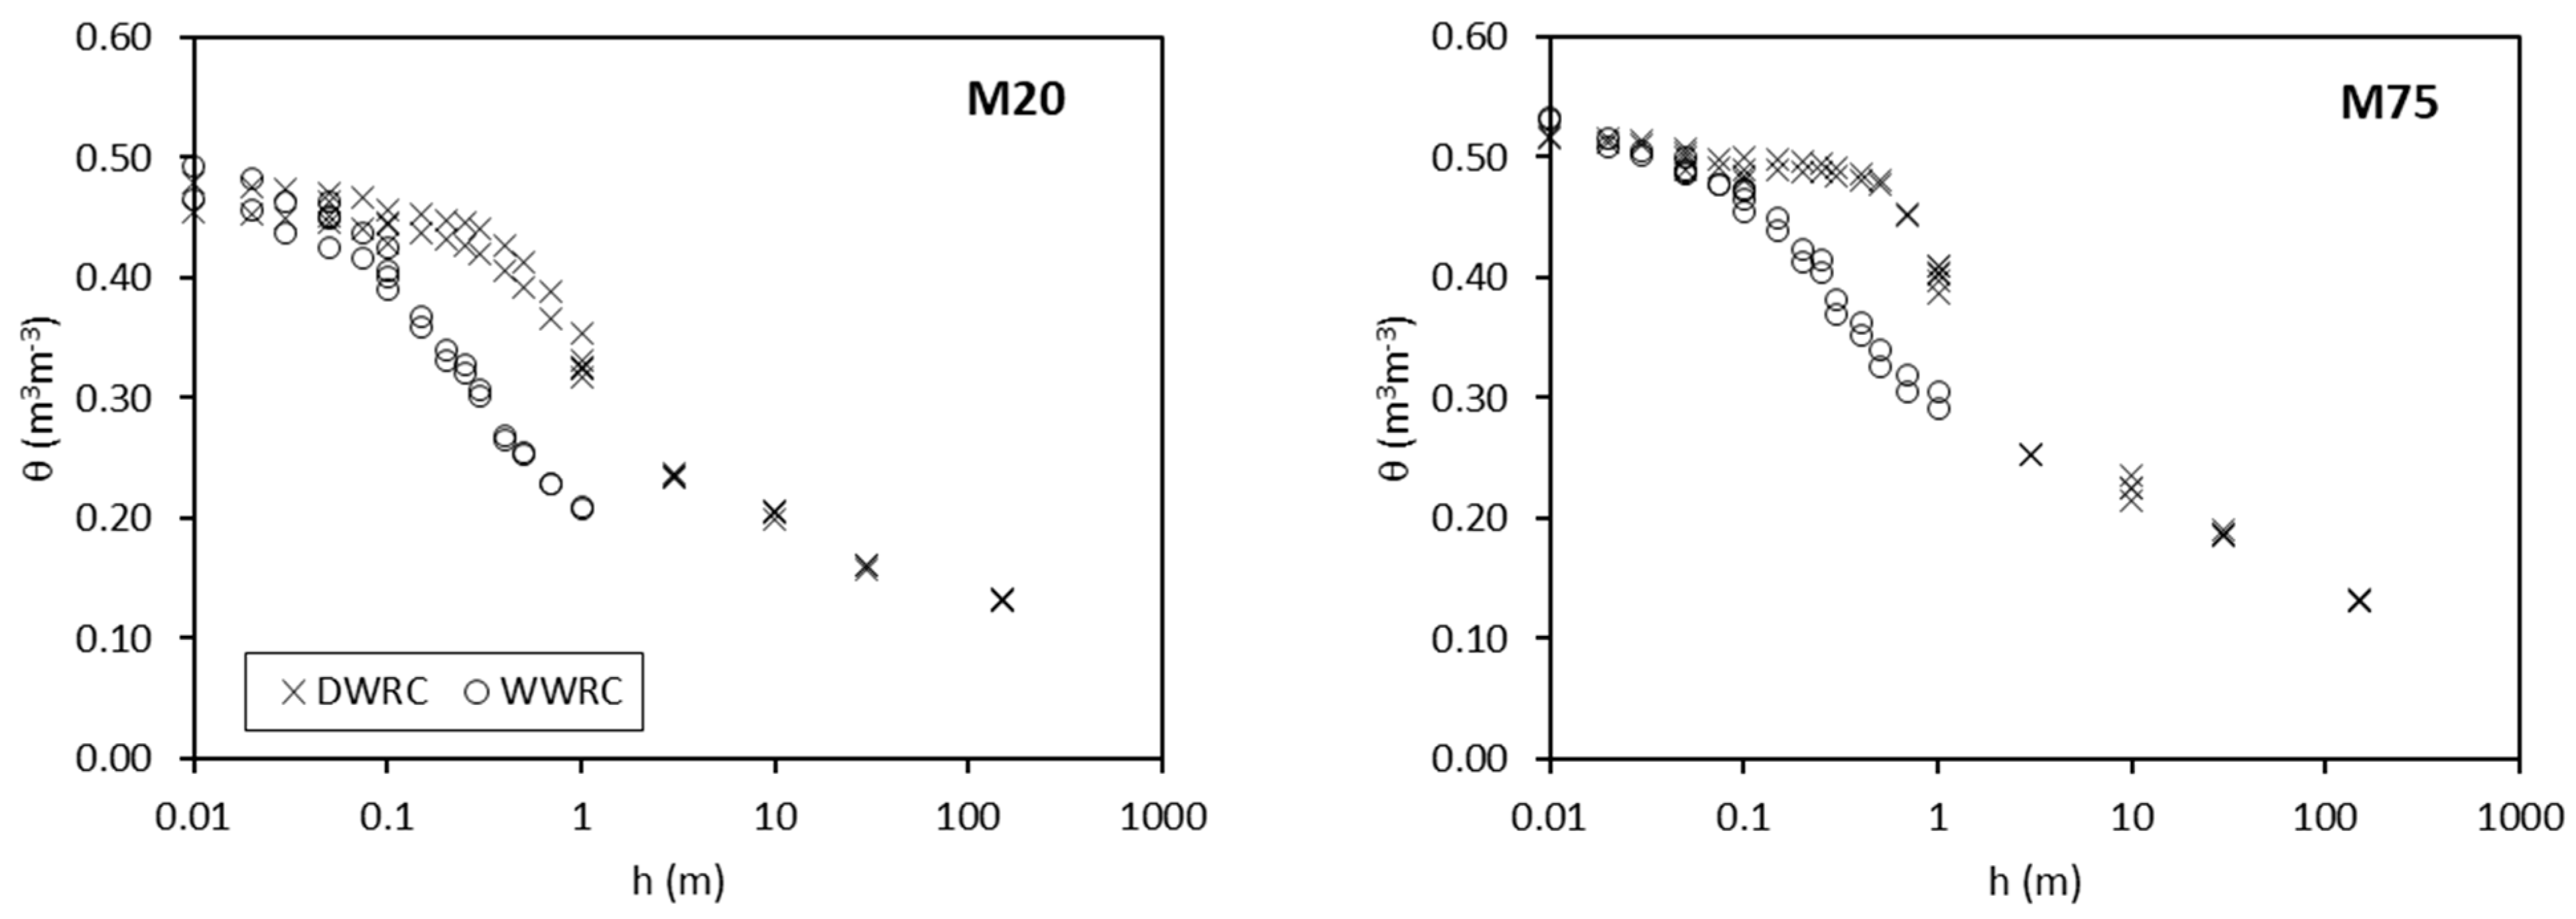
The wetting–drainage water retention curves exhibited a typical hysteretic behavior with volumetric water content at a given pressure head that was always lower for the wetting curve, θW, than the draining one, θD. As an example, Figure 4 compares the wetting (WWRC) and draining (DWRC) water retention curves obtained for M20 and M75 mixtures. The two curves were practically coincident close to saturation (h ≥ −0.05 m). At lower h values, the differences between θD and θW first increased up to a maximum 0.156 m3m−3 at h = 0.50 m and then tended to decrease but remained as high as 0.135 m3m−3 at the lowest h value measured with the tension apparatus (h = −1 m).
The statistics of the estimated VGN model parameters and the indices of the fitting quality (R, ME, and RMSE) for both the wetting and the drainage WRC are listed in Table 2. A complete dataset of the estimated parameters is provided in the Supplementary Materials, Table S1.
The VGN model adequately fitted the water retention data as detected by the high R and low ME and RMSE values. The mean α value for the WWRC was 5.8 times higher than for the DWRC. This αW/αD value is above those usually reported (αW/αD ≈ 2) [35]. The mean n parameter of the WWRC was 0.95 times that of the DWRC (Table 2). A significant negative correlation (R2 = 0.544) was found between nW and nD thus indicating that, for the considered soil–compost mixture, estimation of the n parameter for one of the two branches of the water retention curve is also able to retrieve information for the other one. The estimated saturated water contents for the wetting, θsW, and drying, θsD, branches were highly correlated (R2 = 0.917) but the slope of the regression line was significantly different from one thus indicating that the water contents close to saturation for the WWRC were higher than for the DWRC (Figure 3, Table 2). The reason for the observed discrepancies between θsW and θsD is unknown but could be associated to the observed variability of sample height during the sorption and desorption processes (Figure 2). In any case, these differences can be considered negligible for the aims of estimating the SPQ given they were always lower than 0.033 m3m−3 and equal to 0.020 m3m−3 on average.
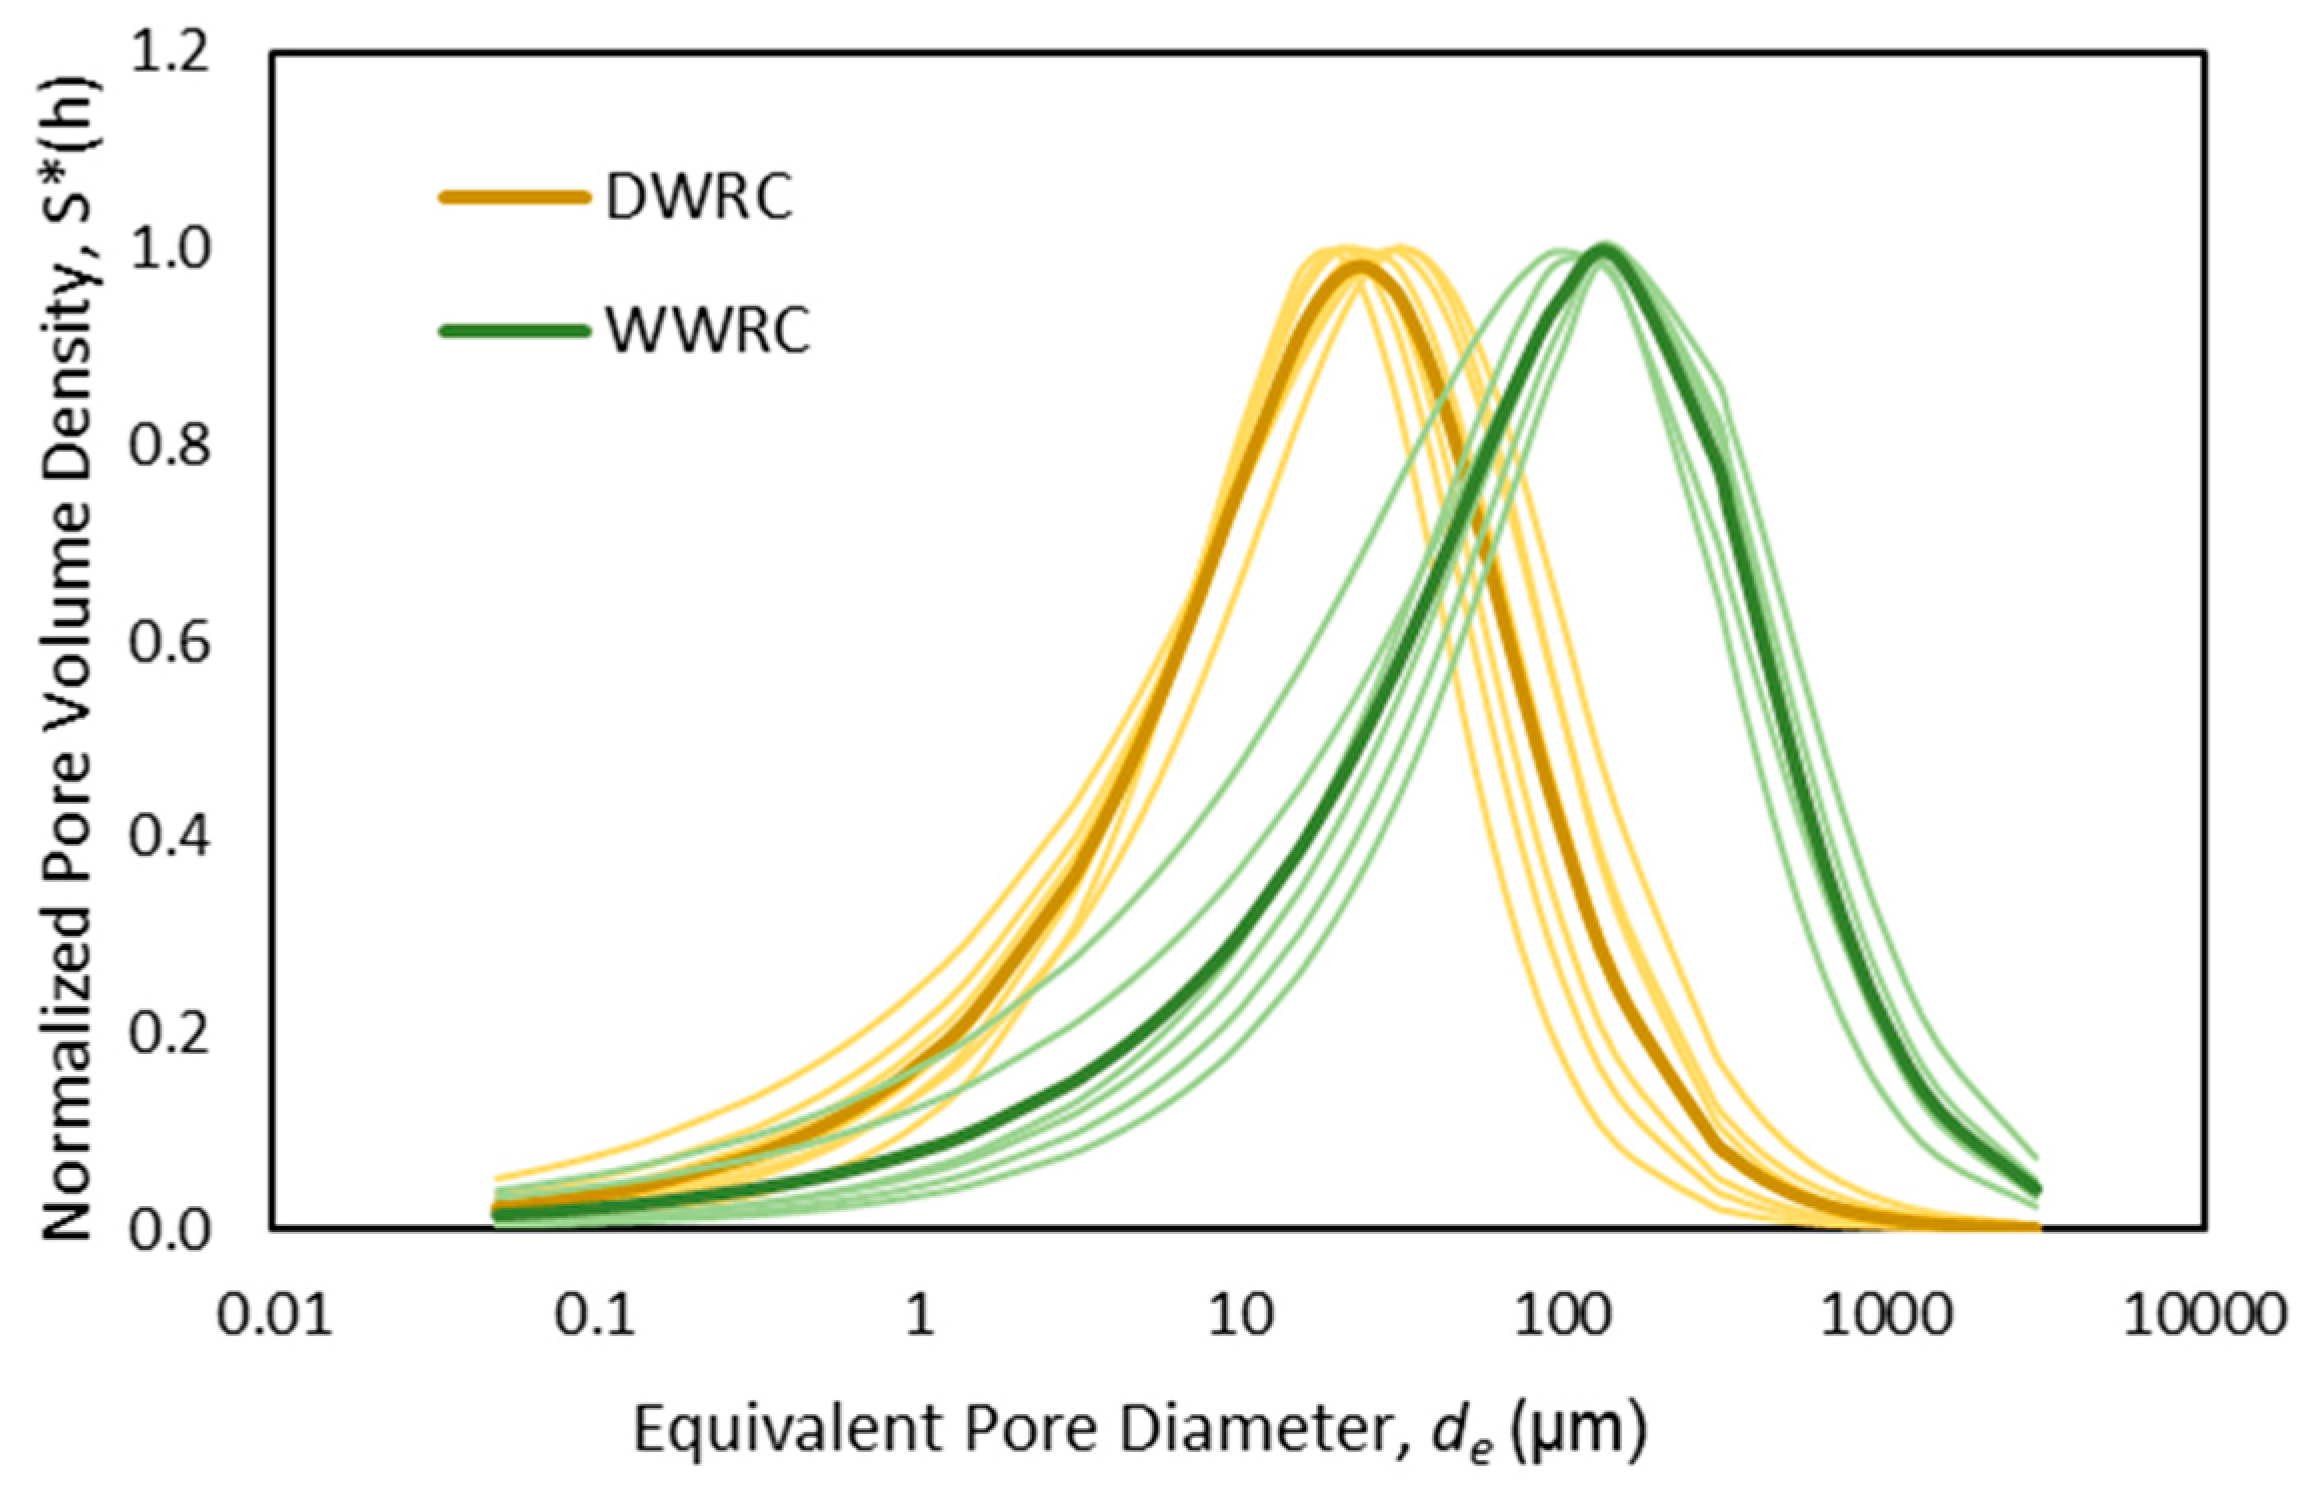
The scale parameter α decreased and the shape parameter n increased in the passage from the WWRC to the DWRC (Table 2). Generally, the α and n parameters are positively correlated (e.g., [51,52]); therefore, the observed inverse relationship is a sign that active soil pore classes are different in the two processes. Comparison between the pore volume distribution functions confirms that the sorption process (WWRC) involves larger and more heterogeneous pores (Figure 5). Therefore, different information is provided by the two soil water retention curves and, consequently, by the respective estimates of the SPQ indicators.
3.3. Influence of Hysteresis on Soil Physical Quality
The capacity-based indicators linked to the macro- and mesoporosity (Pmac and AC) calculated for the WWRC were generally higher than for the DWRC (Table 3). In particular, the maximum values of Pmac and AC obtained from the DWRC (Pmac = 0.012 m3m−3 and AC = 0.146 m3m−3) were lower than the minimum values of the same parameters obtained from the WWRC (Pmac = 0.047 m3m−3 and AC = 0.224 m3m−3). Differences were also observed for indicators linked to the plant water availability (PAWC and RFC) but, in this case, the WWRC yielded lower values than the DWRC one. According to these results, use of the WWRC in spite of the DWRC yielded larger estimates of SPQ indicators related to soil aeration and lower estimation of those related to water storage. These findings were not entirely predictable and, to the best of our knowledge, they were experimentally assessed for the first time in this study. Similar estimates of the Sindex were obtained by the two sets of water retention data (Table 3), probably because of the observed compensation between the two domains (macro- and micropores) involved in its calculation.
According to the observed differences between the pore volume distribution curves, the location parameters (dmedian, dmode, and dmean) obtained from the WWRC were larger than the DWRC. In particular, the median diameter of water-filled pores during sorption (dmedian = 95 μm) is larger than the draining ones (dmedian = 18 μm) in agreement with the hysteresis theory (Figure 5). Indeed, during a drainage process, the soil holds water in relatively smaller pores whereas the water entry process takes place, on average, at lower suction heads (i.e., larger pores). The shape parameters of the pore volume distribution functions were more similar but a tendency to increase SD and decrease SK for the WWRC was observed (Table 3). The mean pore volume distribution function was in both cases skewed towards small pores (SK < 0) whereas the two curves were classified as leptokurtic, i.e., more peaked in the center and more tailed in the extremes than the lognormal curve (KU > 1) [25].
According to the literature suggestions for optimal soil physical quality [23,25,31], the mean values of capacity-based SPQ indicators and pore distribution parameters were generally outside the optimal range but estimates from the DWRC were closer to the reference values (Table 3). The only exception was for Pmac and AC estimated from the WWRC that fell in the optimal range whereas the corresponding indicators estimated from the DWRC signaled an aeration deficit for soil. Location and shape parameters of pore volume distribution were always non-optimal. The observed discrepancies were not surprising given the soil samples considered in this investigation were laboratory repacked (i.e., structureless) whereas the literature guidelines for optimal SPQ were generally obtained from undisturbed soil samples. A recent study conducted on repacked soil samples of a loamy sand amended with crop residues and dairy manure compost [18] yielded location parameters, dmedian, dmode, and dmean, of 21–26 μm, 28–32 μm, and 19–23 μm, respectively, and shape parameters, SD, SK, and KU of 3.1–3.9, −0.18 to −0.15 and 1.14, respectively. These values were outside the optimal range reported by Reynolds et al. [25] and closer to the mean values obtained in the present study from the DWRC (dmedian = 17.8 μm, dmode = 25.7 μm, dmean = 15.0 μm, SD = 5.1, SK = −0.21, and KU = 1.15) thus confirming that the existing guidelines for optimal pore size distribution parameters need to be applied with caution to repacked soil samples. Furthermore, estimation of the SPQ indicators, as well as the definition of their optimal intervals, was almost exclusively conducted considering desorption data and our results show that different information can be obtained if sorption data are considered. Providing specific experimental information on the effect of water retention hysteresis on repacked soil samples is essential to fill the knowledge gap and provide recalibrated values for the current optimal SPQ guidelines.
3.4. Influence of Compost Amendment on Soil Water Retention and Physical Quality
The lack of reference values for the SPQ indicators obtained from the WWRC does not allow drawing of definitive conclusions about the reliability of such an approach. However, an indirect validation could be gathered from the analysis of compost amendment effects on the VGN model parameters as well as the related capacity-based SPQ indicators and pore size distribution parameters obtained by the two approaches (i.e., WWRC and DWRC).
Compost amendment influenced the shape and the scale parameters of the SWRC to different extents depending on the considered wetting or draining process (Table 4). In particular, α increased with r for the WWRC and decreased for the DWRC. However, only the latter relationship was statistically significant. Symmetrically, the n parameter decreased with r for the WWRC and increased for the DWRC. The α parameter is related to the inverse of the water or air entry potential. As expected from the hysteresis theory, the absolute value of the water entry potential (i.e., the inverse of αW) is lower than the air entry potential (i.e., the inverse of αD) (Table 2). However, at increasing the compost content, the water entry potential tended to decrease (Table 4) thus meaning that the compost amendment facilitates the water entry into the soil during a wetting process or, in other words, that infiltration is favored. On the contrary, the air entry potential tended to increase, that is, water loss is impeded during the soil drainage. The observed modifications have positive effects on soil hydrological and agronomic response under dryland agriculture as either infiltration is promoted during rainfall periods or storage enhanced during dry periods, in both cases, increasing the water availability for crops.
Compost addition tended to decrease the shape parameter n for the WWRC and to increase it for the DWRC. As the n parameter is related to the slope of the water retention curve at the inflection point, it means that due to amendment, the WWRC tended to be less S-shaped and the DWRC more S-shaped. In other words, not only did the wetting or the draining processes activate different pore systems but the compost addition seems to influence them in a different way, i.e., increasing the active pore assortment for the WWRC and decreasing it for the DWRC. Independently of the considered process (wetting or draining), θsW, θsD, and θrD were positively correlated with r indicating that the compost amendment was effective in increasing the water content of the considered sandy loam soil at, or close to, saturation as well as at the dry end of the SWRC (Table 4).
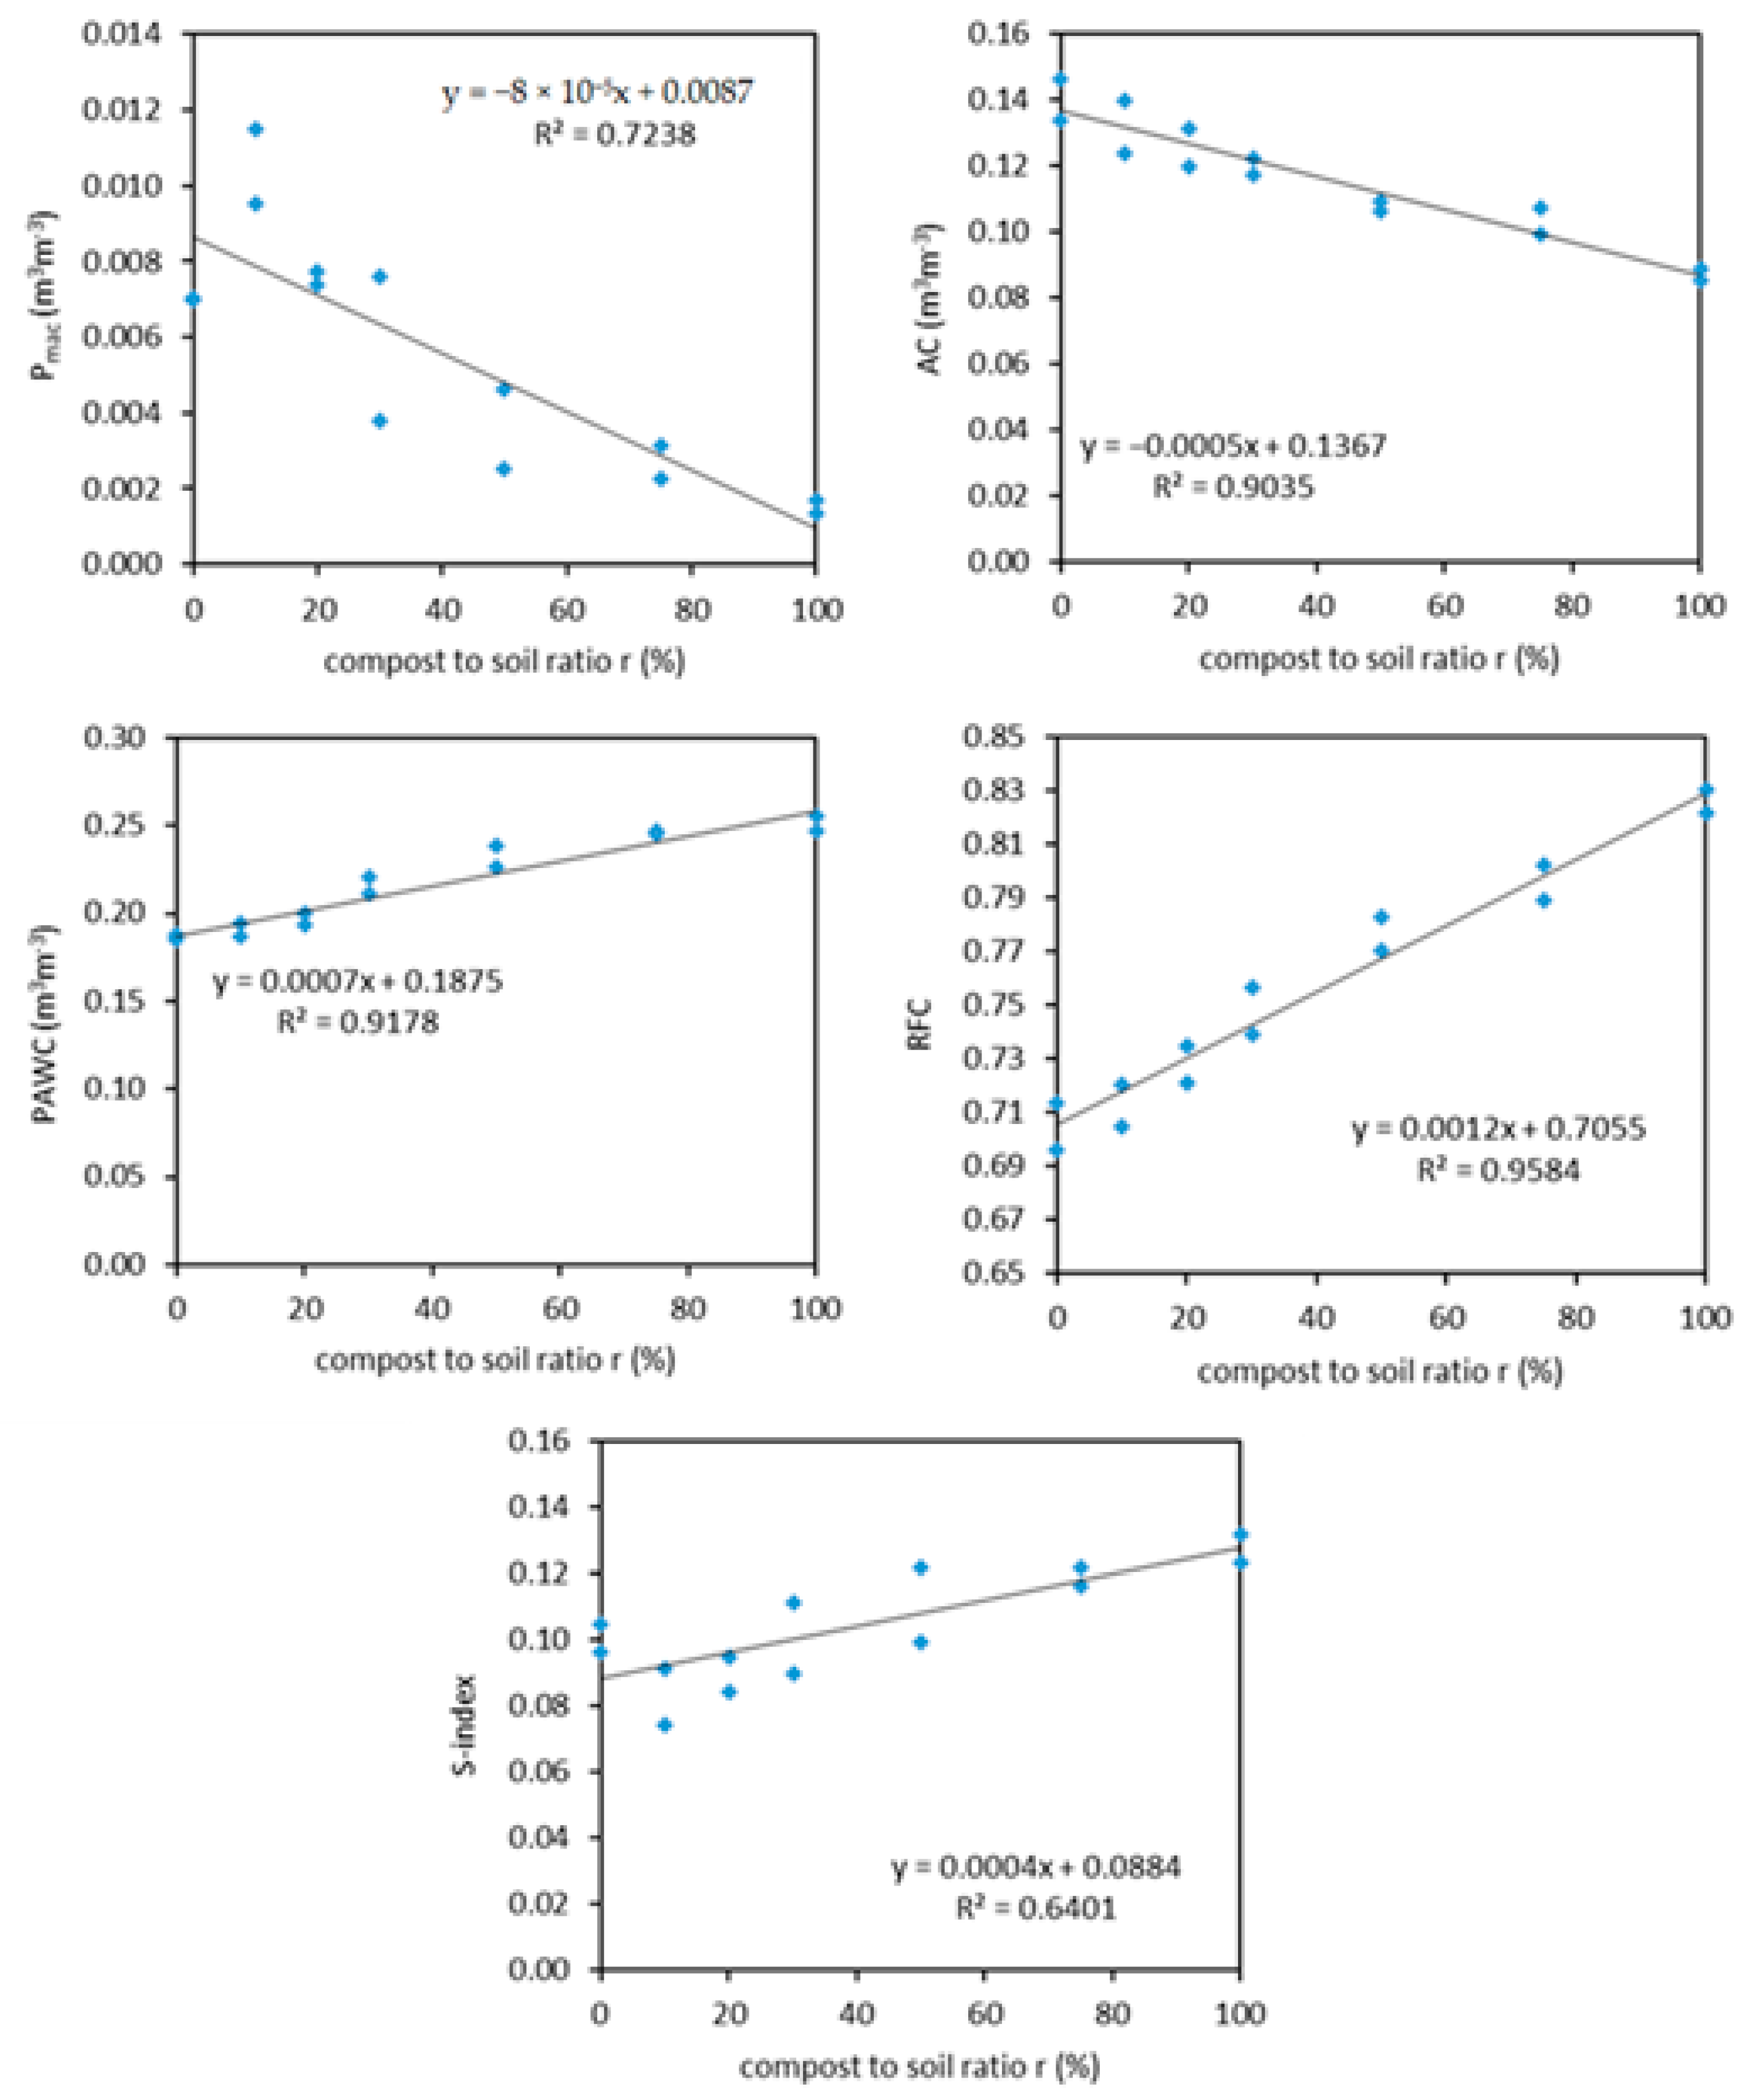
The significant correlations between the capacity-based SPQ indicators estimated from the DWRC and the compost ratio, r, strengthened the reliability of the procedure that estimates the soil physical quality from the water release experiments (Table 3). A significant reduction in Pmac and AC and an increase in PAWC, RFC, and Sindex was observed (Figure 6) that was attributed to an increase in micropores and a decrease in macropores associated to the modification of pore volume distribution. Similar results were observed in literature with PAWC that increased [18] or was practically unaffected by compost addition [3]. On the other hand, many studies showed long-term benefits on AC that increased up to 26% in a fine-textured soil [26] and 15% in a loamy sand [3] when food waste compost was used. Our results lead to the conclusion that short-term organic matter incorporation probably increased micropore volume as a consequence of compost mineral residue (13.7% of particles less than 2 μm in diameter) but had negative effects on macroporosity.
The highly significant negative correlation observed for dmedian, dmode, and dmean (Table 3) confirmed that amending was effective in modifying the pore systems. Ibrahim and Horton [18] reported a similar result that was also attributed to filling of loamy sand pore spaces by amendment material. Shape parameters were likewise significantly affected by compost amendment (Table 3). In particular, as the compost percentage increased, the pore distributions were less sorted (decreasing SD) and shifted toward large soil pores (increasing SK). Moreover, KU was affected by compost addition even if the range of variation was limited (Table 3). Al-Omran et al. [53] showed that SD and SK increased by 18% and 12%, respectively, whereas KU values were practically unaffected by compost amendment.
The results obtained from the DWRC data clearly show that compost had a positive effect on soil water storage. These results are in agreement with the extensive literature showing how the use of compost improves the physical properties of the soil. However, information is lacking for hysteretic soil water retention. Our data showed that, in most cases, correlations between SPQ indicators obtained from the WWRC and r were not significant indicating that the sorption process is probably less recommended for the aim of SPQ evaluation. The only exception was for the PAWC that exhibited a positive, even less strong (R = 0.642), correlation with r (Table 3). Determination of the wetting branch of the SWRC is more affected by experimental errors due, for example, to soil hydrophobicity [54], air entrapment [55], and slaking or swelling of soil aggregates [56]. Therefore, it is possible that one, or all these factors, hampered the sensitivity of the estimated SPQ to compost addition. On the other hand, there are signs that also support the use of the WWRC for soil physical quality evaluation. For example, the circumstance that a negative, despite not significant, trend with r was observed for AC and the location parameters. It is also worth to note, that the relationship between Sindex and r (Table 3) followed the same trend found for the shape parameter n (Table 4). Skewness and kurtosis had a contrasting behavior with compost amendments, that is, a negative correlation was found for the WWRC when it was positive for the DWRC and vice versa.
Dynamic indicators of SPQ were not considered in this investigation, but our results suggest that the use of compost could also affect them, depending on the wetting or drainage phase considered. More in-depth analysis is therefore desirable to investigate the effect of hysteresis on dynamic indicators of SPQ, including number and volume of the hydraulically active pores [32,57]. As an example, Bagarello et al. [58] identified a clear hysteresis effect on soil water retention of a sandy loam soil that also affected soil hydraulic conductivity data [59]. Consequently, different estimates of the dynamic indicators are expected, depending whether the wetting or drying process is considered.
Another point that requires further investigation is the use of repacked soil samples that could be non-representative of field conditions. Many researchers hypothesized that incorporation of compost would influence soil structure and, consequently, soil hydraulic properties in the short term (among others, [1,22]). The addition of compost to sieved soil, to obtain a repacked laboratory sample, can be likened, to some extent, to the real soil shortly after compost incorporation followed by tillage. Further investigations are necessary to test the adopted methodology after several wetting–drainage cycles with the aim to study the combined effects of compost and the soil structural restoration.
4. Conclusions
Hysteresis of the water retention curve affected the estimation of capacity-based indicators of SPQ and pore volume distribution parameters of a sandy loam soil amended with compost obtained from orange juice processing wastes and garden cleaning. The sorption process involved larger and more heterogeneous pores thus resulting in capacity-based indicators linked to soil aeration (Pmac and AC) that were generally higher and plant water availability indicators (PAWC and RFC) were generally lower than those determined from desorption data. The SPQ indicators estimated from the DWRC were closer to the reference literature values that were usually retrieved from the same desorption process.
The absolute value of the water entry potential decreased and the air entry potential increased at increasing the percentage of added compost. In terms of the SPQ response to compost amendment, all the selected indicators estimated from the DWRC were sensitive to compost amendment. The same result was not obtained for the SPQ indicators estimated from the WWRC. In this case, the correlations with compost percentage were generally not significant thus indicating that the sorption process is probably less recommended than the desorption one for evaluating the physical quality of soils.
Overall, the results showed that compost amendment was effective in modifying the soil pore distribution system and the related SPQ indicators. In particular, compost addition could trigger positive effects on soil hydrological processes and agronomic services as both water infiltration during wetting and water storage during drying are favored. It is necessary to extend this investigation to other soils exploring to what extent the observed modification in pore volume distribution could also affect hydrodynamic indicators of soil quality directly related to the soil’s ability to transmit water down into the profile. The perspectives opened by these studies could help to improve our understanding of the effects of organic matter (compost) incorporation on soil structure, hydrological functions, and physical quality.
Supplementary Materials
The following supporting information can be downloaded at: https://www.mdpi.com/article/10.3390/w14071002/s1, Table S1: Estimated values of the van Genuchten parameters for the wetting and draining water retention curve and corresponding fitting statistics.
Author Contributions
Conceptualization, M.C. and M.I.; methodology, M.C. and M.I.; formal analysis, M.C., C.B. and M.I.; investigation, C.B.; data curation, C.B. and M.I.; writing—original draft preparation, C.B. and M.I.; writing—review and editing, M.C. and M.I. All authors have read and agreed to the published version of the manuscript.
Funding
This work was supported by the project WATER4AGRIFOOD, contratto “Tetto Verde”, Codice Progetto: CON-0375, CUP B94I20000300005.
Informed Consent Statement
Not applicable.
Data Availability Statement
The data presented in this study are available on request from the corresponding author.
Conflicts of Interest
The authors declare no conflict of interest.
References
- Dong, L.; Zhang, W.; Xiong, Y.; Zou, J.; Huang, Q.; Xu, X.; Ren, P.; Huang, G. Impact of short-term organic amendments incorporation on soil structure and hydrology in semiarid agricultural lands. Int. Soil Water Conserv. Res. 2021, in press. [Google Scholar] [CrossRef]
- Reynolds, W.D.; Drury, C.F.; Yang, X.M.; Fox, C.A.; Tan, C.S.; Zhang, T.Q. Land management effects on the near-surface physical quality of a clay loam soil. Soil Tillage Res. 2007, 96, 316–330. [Google Scholar] [CrossRef]
- Arthur, E.; Cornelis, W.M.; Vermang, J.; de Rocker, E. Amending a loamy sand with three compost types: Impact on soil quality. Soil Use Manag. 2011, 27, 116–123. [Google Scholar] [CrossRef]
- Mandal, M.; Chandran, R.; Sencindiver, J. Amending Subsoil with Composted Poultry Litter-I: Effects on Soil Physical and Chemical Properties. Agronomy 2013, 3, 657–669. [Google Scholar] [CrossRef] [Green Version]
- Negiş, H.; Şeker, C.; Gümüş, I.; Manirakiza, N.; Mücevher, O. Effects of Biochar and Compost Applications on Penetration Resistance and Physical Quality of a Sandy Clay Loam Soil. Commun. Soil Sci. Plant Anal. 2020, 51, 38–44. [Google Scholar] [CrossRef]
- Aggelides, S.M.; Londra, P.A. Effects of compost produced from town wastes and sewage sludge on the physical properties of a loamy and a clay soil. Bioresour. Technol. 2000, 71, 253–259. [Google Scholar] [CrossRef]
- Annabi, M.; Houot, S.; Francou, C.; Poitrenaud, M.; Bissonnais, Y.L. Soil Aggregate Stability Improvement with Urban Composts of Different Maturities. Soil Sci. Soc. Am. J. 2007, 71, 413–423. [Google Scholar] [CrossRef]
- Ibrahim, A.; Marie, H.A.M.E.; Elfaki, J. Impact of biochar and compost on aggregate stability in loamy sand soil. Agric. Res. J. 2021, 58, 34–44. [Google Scholar] [CrossRef]
- Głąb, T.; Żabiński, A.; Sadowska, U.; Gondek, K.; Kopeć, M.; Mierzwa-Hersztek, M.; Tabor, S.; Stanek-Tarkowska, J. Fertilization effects of compost produced from maize, sewage sludge and biochar on soil water retention and chemical properties. Soil Tillage Res. 2020, 197, 104493. [Google Scholar] [CrossRef]
- Zemánek, P. Evaluation of compost influence on soil water retention. Acta Univ. Agric. Silvic. Mendel. Brun. LIX 2011, 3, 227–232. [Google Scholar] [CrossRef] [Green Version]
- Schneider, S.; Coquet, Y.; Vachier, P.; Labat, C.; Roger-Estrade, J.; Benoit, P.; Pot, V.; Houot, S. Effect of Urban Waste Compost Application on Soil Near-Saturated Hydraulic Conductivity. J. Environ. Qual. 2009, 38, 772–781. [Google Scholar] [CrossRef] [PubMed]
- Whelan, A.; Kechavarzi, C.; Coulon, F.; Sakrabani, R.; Lord, R. Influence of compost amendments on the hydraulic functioning of brownfield soils. Soil Use Manag. 2013, 29, 260–270. [Google Scholar] [CrossRef] [Green Version]
- Şeker, C.; Manirakiza, N. Effectiveness of compost and biochar in improving water retention characteristics and aggregation of a sandy clay loam soil under wind erosion. Carpathian J. Earth Environ. Sci. 2020, 15, 5–18. [Google Scholar] [CrossRef]
- Kranz, C.N.; McLaughlin, R.A.; Johnson, A.; Miller, G.; Heitman, J.L. The effects of compost incorporation on soil physical properties in urban soils—A concise review. J. Environ. Manag. 2020, 261, 110209. [Google Scholar] [CrossRef] [PubMed]
- Sadeghi, S.; Ebrahimi, S.; Zakerinia, M. The Study of the Parametric Changes in Water Potential Points by Using Waste Manuciple Compost in Three Kinds of Soils. Int. J. Basic Sci. Appl. Res. 2014, 3, 254–260. Available online: http://www.isicenter.org (accessed on 22 February 2022).
- Paradelo, R.; Basanta, R.; Barral, M.T. Water-holding capacity and plant growth in compost-based substrates modified with polyacrylamide, guar gum or bentonite. Sci. Hortic. 2019, 243, 344–349. [Google Scholar] [CrossRef]
- Benito, M.; Masaguer, A.; Moliner, A.; de Antonio, R. Chemical and physical properties of pruning waste compost and their seasonal variability. Bioresour. Technol. 2006, 97, 2071–2076. [Google Scholar] [CrossRef]
- Ibrahim, A.; Horton, R. Biochar and compost amendment impacts on soil water and pore size distribution of a loamy sand soil. Soil Sci. Soc. Am. J. 2021, 85, 1021–1036. [Google Scholar] [CrossRef]
- Curtis, M.J.; Claassen, V.P. Regenerating topsoil functionality in four drastically disturbed soil types by compost incorporation. Restor. Ecol. 2009, 17, 24–32. [Google Scholar] [CrossRef]
- Palazzolo, E.; Laudicina, V.A.; Roccuzzo, G.; Allegra, M.; Torrisi, B.; Micalizzi, A.; Badalucco, L. Bioindicators and nutrient availability through whole soil profile under orange groves after long-term different organic fertilizations. SN Appl. Sci. 2019, 1, 468. [Google Scholar] [CrossRef] [Green Version]
- Glab, T.; Zabinski, A.; Sadowska, U.; Gondek, K.; Kopec, M.; Mierzwa-Hersztek, M.; Tabor, S. Effects of co-composted maize, sewage sludge, and biochar mixtures on hydrological and physical qualities of sandy soil. Geoderma 2018, 315, 27–35. [Google Scholar] [CrossRef]
- Rivier, P.-A.; Jamniczky, D.; Nemes, A.; Makó, A.; Barna, G.; Uzinger, N.; Rékási, M.; Farkas, C. Short-term effects of compost amendments to soil on soil structure, hydraulic properties, and water regime. J. Hydrol. Hydromech. 2022, 70, 74–88. [Google Scholar] [CrossRef]
- Dexter, A.R. Soil physical quality Part I. Theory, effects of soil texture, density, and organic matter, and effects on root growth. Geoderma 2004, 120, 201–214. [Google Scholar] [CrossRef]
- Van Genuchten, M.T. A Closed-form Equation for Predicting the Hydraulic Conductivity of Unsaturated Soils. Soil Sci. Soc. Am. J. 1980, 44, 892–898. [Google Scholar] [CrossRef] [Green Version]
- Reynolds, W.D.; Drury, C.F.; Tan, C.S.; Fox, C.A.; Yang, X.M. Use of indicators and pore volume-function characteristics to quantify soil physical quality. Geoderma 2009, 152, 252–263. [Google Scholar] [CrossRef]
- Reynolds, W.D.; Drury, C.F.; Tan, C.S.; Yang, X.M. Temporal effects of food waste compost on soil physical quality and productivity. Can. J. Soil Sci. 2015, 95, 251–268. [Google Scholar] [CrossRef] [Green Version]
- Reynolds, W.D.; Bowman, B.T.; Drury, C.F.; Tan, C.S.; Lu, X. Indicators of good soil physical quality: Density and storage parameters. Geoderma 2002, 110, 131–146. [Google Scholar] [CrossRef]
- Topp, G.C.; Reynolds, W.D.; Cook, F.J.; Kirby, J.M.; Carter, M.R. Physical attributes of soil quality. In Development in Soil Science; Soil Quality for Crop Production and Ecosystem Health; Gregorich, E.G., Carter, M.R., Eds.; Elsevier: New York, NY, USA, 1997; Volume 25, pp. 21–58. [Google Scholar]
- Manici, L.M.; Castellini, M.; Caputo, F. Soil-inhabiting fungi can integrate soil physical indicators in multivariate analysis of Mediterranean agroecosystem dominated by old olive groves. Ecol. Indic. 2019, 106, 105490. [Google Scholar] [CrossRef]
- Stellacci, A.M.; Castellini, M.; Diacono, M.; Rossi, R.; Gattullo, C.E. Assessment of soil quality under different soil management strategies: Combined use of statistical approaches to select the most informative soil physico-chemical indicators. Appl. Sci. 2021, 11, 5099. [Google Scholar] [CrossRef]
- Agnese, C.; Bagarello, V.; Baiamonte, G.; Iovino, M. Comparing physical quality of forest and pasture soils in a Sicilian watershed. Soil Sci. Soc. Am. J. 2011, 75, 1958–1970. [Google Scholar] [CrossRef]
- Iovino, M.; Castellini, M.; Bagarello, V.; Giordano, G. Using static and dynamic indicators to evaluate soil physical quality in a Sicilian area. Land Degrad. Dev. 2016, 27, 200–210. [Google Scholar] [CrossRef]
- Cullotta, S.; Bagarello, V.; Baiamonte, G.; Gugliuzza, G.; Iovino, M.; La Mela Veca, D.S.; Maetzke, F.; Palmeri, V.; Sferlazza, S. Comparing Different Methods to Determine Soil Physical Quality in a Mediterranean Forest and Pasture Land. Soil Sci. Soc. Am. J. 2016, 80, 1038–1056. [Google Scholar] [CrossRef]
- Shahab, H.; Emami, H.; Haghnia, G.H.; Karimi, A. Pore Size Distribution as a Soil Physical Quality Index for Agricultural and Pasture Soils in Northeastern Iran. Pedosphere 2013, 23, 312–320. [Google Scholar] [CrossRef]
- Kutilek, M.; Nielsen, D.R. Soil Hydrology. In GeoEcology Textbook; Catena Verlag: Cremlingen, Germany, 1994; 370p, ISBN 3-923381-26-3. [Google Scholar]
- Zhao, Y.; Wen, T.; Shao, L.; Chen, R.; Sun, X.; Huang, L.; Chen, X. Predicting hysteresis loops of the soil water characteristic curve from initial drying. Soil Sci. Soc. Am. J. 2020, 84, 1642–1649. [Google Scholar] [CrossRef]
- Haverkamp, R.; Reggiani, P.; Ross, P.J.; Parlange, J.Y. Soil Water Hysteresis Prediction Model Based on Theory and Geometric Scaling. Environ. Mech. 2002, 129, 213–246. [Google Scholar]
- Alagna, V.; Bagarello, V.; Cecere, N.; Concialdi, P.; Iovino, M. A test of water pouring height and run intermittence effects on single-ring infiltration rates. Hydrol. Processes 2018, 32, 3793–3804. [Google Scholar] [CrossRef]
- Eden, M.; Gerke, H.H.; Houot, S. Organic waste recycling in agriculture and related effects on soil water retention and plant available water: A review. Agron. Sustain. Dev. 2017, 37, 11. [Google Scholar] [CrossRef] [Green Version]
- Gugliuzza, G.; Verduci, A.; Iovino, M. Water retention characteristics of substrates containing biochar and compost as peat and perlite replacements for ornamental plant production. Acta Hortic. 2021, 1305, 507–511. [Google Scholar] [CrossRef]
- Dane, J.H.; Hopmans, J.W. 3.3.2.2 Hanging water column. In Methods of Soil Analysis, Part 4, Physical Methods, Number 5 in the Soil Science Society of America Book Series; Dane, J.H., Topp, G.C., Eds.; Soil Science Society of America, Inc.: Madison, WI, USA, 2002; pp. 680–683. [Google Scholar]
- Dane, J.H.; Hopmans, J.W. 3.3.2.4 Pressure plate extractor. In Methods of Soil Analysis, Part 4, Physical Methods, Number 5 in the Soil Science Society of America Book Series; Dane, J.H., Topp, G.C., Eds.; Soil Science Society of America, Inc.: Madison, WI, USA, 2002; pp. 688–690. [Google Scholar]
- Reynolds, W.D.; Drury, C.F.; Yang, X.M.; Tan, C.S. Optimal soil physical quality inferred through structural regression and parameter interactions. Geoderma 2008, 146, 466–474. [Google Scholar] [CrossRef]
- Seki, K. SWRC fit—A nonlinear fitting program with a water retention curve for soils having unimodal and bimodal pore structure. Hydrol. Earth Syst. Sci. 2007, 4, 407–437. [Google Scholar]
- Castellini, M.; Iovino, M. Pedotransfer functions for estimating soil water retention curve of Sicilian soils. Arch. Agron. Soil Sci. 2019, 65, 1401–1416. [Google Scholar] [CrossRef]
- Reynolds, W.D.; Yang, X.M.; Drury, C.F.; Zhang, T.Q.; Tan, C.S. Effects of selected conditioners and tillage on the physical quality of a clay of a clay loam soil. Can. J. Soil Sci. 2003, 83, 381–393. [Google Scholar] [CrossRef]
- Dexter, A.R.; Czyz, E.A. Applications of s-theory in the study of soil physical degradation and its consequences. Land Degrad. Dev. 2007, 18, 369–381. [Google Scholar] [CrossRef]
- Warrick, A.W. Appendix 1: Spatial variability. In Environmental Soil Physics; Hillel, D., Ed.; Academic Press: San Diego, USA, 1998; pp. 655–675. [Google Scholar]
- Khaleel, R.; Reddy, R.; Overcash, M.R. Changes in Soil Physical Properties Due to Organic Waste Applications: A Review. J. Environ. Qual. 1981, 10, 133–141. [Google Scholar] [CrossRef]
- Brown, S.; Cotton, M. Changes in soil properties and carbon content following compost application: Results of on-farm sampling. Compost Sci. Util. 2011, 19, 88–97. [Google Scholar] [CrossRef]
- Carsel, R.F.; Parrish, R.S. Developing Joint Probability-Distributions of Soil-Water Retention Characteristics. Water Resour. Res. 1988, 24, 755–769. [Google Scholar] [CrossRef] [Green Version]
- Haverkamp, R.; Leij, F.J.; Fuentes, C.; Sciortino, A.; Ross, P.J. Soil water retention: I. Introduction of a shape index. Soil Sci. Soc. Am. J. 2005, 69, 1881–1890. [Google Scholar] [CrossRef]
- Al-Omran, A.; Ibrahim, A.; Alharbi, A. Effects of Biochar and Compost on Soil Physical Quality Indices. Commun. Soil Sci. Plant Anal. 2021, 52, 2482–2499. [Google Scholar] [CrossRef]
- Doerr, S.H.; Shakesby, R.A.; Walsh, R.P.D. Soil water repellency: Its causes, characteristics and hydro-geomorphological significance. Earth Sci. Rev. 2000, 51, 33–65. [Google Scholar] [CrossRef]
- Kaluarachchi, J.J.; Parker, J.C. Effects of hysteresis with air entrapment on water flow in the unsaturated zone. Water Resour. Res. 1987, 23, 1967–1976. [Google Scholar] [CrossRef]
- DeBano, L.F. Water Repellent Soils: A State-of-the-Art; General Technical Report, PSW-46; United States Department of Agriculture, Forest Service: Berkeley, CA, USA, 1981; 21p.
- Castellini, M.; Ventrella, D. Impact of conventional and minimum tillage on soil hydraulic conductivity in typical cropping system in southern Italy. Soil Tillage Res. 2012, 124, 47–56. [Google Scholar] [CrossRef]
- Bagarello, V.; Castellini, M.; Iovino, M. Influence of the pressure head sequence on the soil hydraulic conductivity determined with the tension infiltrometer. Appl. Eng. Agric. 2005, 21, 383–391. [Google Scholar] [CrossRef]
- Bagarello, V.; Castellini, M.; Iovino, M. Comparison of unconfined and confined unsaturated hydraulic conductivity. Geoderma 2007, 137, 394–400. [Google Scholar] [CrossRef]
Figure 1.
Flow chart of the procedural steps to estimate capacity-based indicators of SPQ and pore distribution parameters.
Figure 1.
Flow chart of the procedural steps to estimate capacity-based indicators of SPQ and pore distribution parameters.

Figure 2.
Sample height measured for M0 and M100 samples after preparation (H0), at initial saturation (HS), at the beginning of wetting (H1), at the end of wetting (H2), and at the end of drainage (H3).
Figure 2.
Sample height measured for M0 and M100 samples after preparation (H0), at initial saturation (HS), at the beginning of wetting (H1), at the end of wetting (H2), and at the end of drainage (H3).

Figure 3.
Relationship between soil bulk density and compost to soil ratio.

Figure 4.
Measured water retention data for the wetting (WWRC) and draining (DWRC) curves of M20 and M75 mixtures.
Figure 4.
Measured water retention data for the wetting (WWRC) and draining (DWRC) curves of M20 and M75 mixtures.

Figure 5.
Normalized pore volume distribution functions for the wetting and draining processes.

Figure 6.
Regressions between the capacity-based SPQ indicators derived from the DWRC and the compost ratio.
Figure 6.
Regressions between the capacity-based SPQ indicators derived from the DWRC and the compost ratio.


Table 1.
Physicochemical attributes of soil and compost.
| Soil | Compost | ||
|---|---|---|---|
| Clay (%) | 17.6 | pH | 7.2 |
| Silt (%) | 29.8 | EC (dS/m) | 0.54 |
| Sand (%) | 52.6 | C (%) | 9.91 |
| OM (%) | 2.1 | N (%) | 0.64 |
| pH | 7.8 | P (%) | 0.45 |
| EC (dS/m) | 0.48 | Ash (%) | 82.5 |
| CEC (cmol Kg−1) | 25.31 | C/N ratio | 15:1 |
Table 2.
Minimum, maximum, and mean value of the estimated van Genuchten parameters for the wetting and draining water retention curve. The statistics of coefficient of correlation, R, mean error, ME, and root mean square error, RMSE, for the estimated water retention curves are also listed.
Table 2.
Minimum, maximum, and mean value of the estimated van Genuchten parameters for the wetting and draining water retention curve. The statistics of coefficient of correlation, R, mean error, ME, and root mean square error, RMSE, for the estimated water retention curves are also listed.
| α | n | θs | θr | R | ME | RMSE | |
|---|---|---|---|---|---|---|---|
| Wetting water retention curve WWRC | |||||||
| Min | 0.0613 | 1.406 | 0.457 | 0.110 | 0.9954 | −6.54 × 10⁻⁴ | 6.00 × 10⁻³ |
| Max | 0.1203 | 1.894 | 0.536 | 0.161 | 0.9976 | 3.83 × 10⁻⁴ | 9.00 × 10⁻³ |
| Mean | 0.0871 | 1.639 | 0.500 | 0.138 | 0.9962 | −3.14 × 10⁻⁶ | 7.57 × 10⁻³ |
| Draining water retention curve DWRC | |||||||
| Min | 0.0088 | 1.458 | 0.443 | 0.110 | 0.9931 | −4.70 × 10⁻⁵ | 5.90 × 10⁻³ |
| Max | 0.0231 | 1.998 | 0.508 | 0.161 | 0.9985 | 1.13 × 10⁻⁴ | 1.58 × 10⁻² |
| Mean | 0.0149 | 1.726 | 0.479 | 0.138 | 0.9959 | 2.62 × 10⁻⁵ | 1.11 × 10⁻² |
Table 3.
Statistics of the considered SPQ indicators obtained from wetting and draining SWRC and correlation coefficients between SPQ indicators and the compost ratio r. The suggested optimal range for each SPQ indicator is also shown.
Table 3.
Statistics of the considered SPQ indicators obtained from wetting and draining SWRC and correlation coefficients between SPQ indicators and the compost ratio r. The suggested optimal range for each SPQ indicator is also shown.
| SPQ | Units | Wetting Water Retention Curve | Draning Water Retention Curve | Optimal Range | ||||||
|---|---|---|---|---|---|---|---|---|---|---|
| Min | Max | Mean | R | Min | Max | Mean | R | |||
| Pmac | m3m−3 | 0.047 | 0.087 | 0.072 | 0.1439 | 0.001 | 0.012 | 0.006 | −0.8508 | ≥0.07 |
| AC | m3m−3 | 0.224 | 0.306 | 0.267 | −0.2528 | 0.085 | 0.146 | 0.116 | −0.9505 | ≥0.14 |
| PAWC | m3m−3 | 0.051 | 0.272 | 0.102 | 0.6419 | 0.185 | 0.255 | 0.216 | 0.9580 | ≥0.20 |
| RFC | - | 0.354 | 0.571 | 0.464 | 0.5322 | 0.696 | 0.831 | 0.756 | 0.9790 | 0.60–0.70 |
| S-index | - | 0.077 | 0.125 | 0.101 | −0.4651 | 0.074 | 0.132 | 0.104 | 0.8001 | ≥0.05 |
| dmedian | μm | 51.4 | 130.9 | 94.7 | −0.3660 | 15.1 | 24.1 | 17.8 | −0.7754 | 3–7 |
| dmode | μm | 102.3 | 168.4 | 142.8 | −0.1191 | 18.5 | 33.1 | 25.7 | −0.9523 | 60–140 |
| dmean | μm | 36.8 | 116.9 | 78.3 | −0.4141 | 12.1 | 20.7 | 15.0 | −0.5329 | 0.7–2 |
| SD | - | 3.7 | 11.7 | 6.1 | 0.5079 | 3.3 | 9.2 | 5.1 | −0.6303 | 400–1000 |
| SK | - | −0.29 | −0.17 | −0.22 | −0.5725 | −0.27 | −0.16 | −0.21 | 0.7285 | −0.43 to −0.41 |
| KU | - | 1.14 | 1.16 | 1.15 | 0.5919 | 1.14 | 1.16 | 1.15 | −0.7699 | 1.13–1.14 |
Values in bold indicate statistically significant correlation (p = 0.05).
Table 4.
Correlation coefficients between the van Genuchten model parameters (i.e., α, n, θs, and θr) and compost ratio r.
Table 4.
Correlation coefficients between the van Genuchten model parameters (i.e., α, n, θs, and θr) and compost ratio r.
| α | n | θs | θr | |
|---|---|---|---|---|
| WWRC | 0.3376 | −0.5773 | 0.8188 | n.d. |
| DWRC | −0.8909 | 0.7785 | 0.7905 | 0.7367 |
Values in bold indicate statistically significant correlation (p = 0.05).
Publisher’s Note: MDPI stays neutral with regard to jurisdictional claims in published maps and institutional affiliations. |
© 2022 by the authors. Licensee MDPI, Basel, Switzerland. This article is an open access article distributed under the terms and conditions of the Creative Commons Attribution (CC BY) license (https://creativecommons.org/licenses/by/4.0/).
Share and Cite
MDPI and ACS Style
Bondì, C.; Castellini, M.; Iovino, M. Compost Amendment Impact on Soil Physical Quality Estimated from Hysteretic Water Retention Curve. Water 2022, 14, 1002. https://doi.org/10.3390/w14071002
AMA Style
Bondì C, Castellini M, Iovino M. Compost Amendment Impact on Soil Physical Quality Estimated from Hysteretic Water Retention Curve. Water. 2022; 14(7):1002. https://doi.org/10.3390/w14071002
Chicago/Turabian StyleBondì, Cristina, Mirko Castellini, and Massimo Iovino. 2022. "Compost Amendment Impact on Soil Physical Quality Estimated from Hysteretic Water Retention Curve" Water 14, no. 7: 1002. https://doi.org/10.3390/w14071002
Note that from the first issue of 2016, this journal uses article numbers instead of page numbers. See further details here.