Article

Identification of Rainfall Thresholds Likely to Trigger Flood Damages across a Mediterranean Region, Based on Insurance Data and Rainfall Observations

by
Katerina Papagiannaki
1,*,
Vassiliki Kotroni
1,
Kostas Lagouvardos
1,
Antonis Bezes
1,
Vasileios Vafeiadis
1,
Ioanna Messini
2,
Efstathios Kroustallis
2 and
Ioannis Totos
2
1
Institute of Environmental Research and Sustainable Development, National Observatory of Athens, 11810 Athens, Greece
2
Ιnteramerican Property & Casualty Insurance Company S.A., 15124 Maroussi, Greece
*
Author to whom correspondence should be addressed.
Water 2022, 14(6), 994; https://doi.org/10.3390/w14060994
Submission received: 18 February 2022 / Revised: 15 March 2022 / Accepted: 18 March 2022 / Published: 21 March 2022
(This article belongs to the Special Issue Innovative Approaches Applied to Flood Risk Management in Urban Areas)

Abstract

:
Flood-producing rainfall amounts have a significant cumulative economic impact. Despite the advance in flood risk mitigation measures, the cost of rehabilitation and compensation of citizens by the state and insurance companies is increasing worldwide. A continuing challenge is the flood risk assessment based on reliable hazard and impact measures. The present study addresses this challenge by identifying rainfall thresholds likely to trigger economic losses due to flood damages to properties across the Athens Metropolitan Area of Greece. The analysis uses eight-year rainfall observations from 66 meteorological stations and high spatial resolution insurance claims on the postal code segmentation. Threshold selection techniques were applied based on the ROC curves widely used to assess the performance of binary response models. The model evaluates the probability of flood damages in terms of insurance claims in this case. Thresholds of 24-h rainfall were identified at the municipal level, as municipalities are the first administration level where decision making to address the local risks for the citizens is needed. The rainfall thresholds were further classified to estimate and map the local risk of flood damages. Practical implications regarding the applicability of the detected thresholds in early-warning systems are also discussed.

1. Introduction

Rainfall and accompanying flooding phenomena often lead to material damage in vehicles, buildings, and infrastructure and significant road network disruptions, while they may also cause fatalities [1,2]. The substantial impact of extreme rainfall events in terms of economic losses has been documented in many ways [3,4]. The increasing trend of their occurrence in the last four decades [5] has motivated global mobilization to address the risk [6]. However, less severe yet more frequent rainfall events may also cause a significant cumulative economic impact [7]. And yet, there is evidence that there is substantial underreporting of more minor floods and their impact [8]. Studies show that particularly urban areas are vulnerable to flash floods that even less important rainfall amounts can cause [9,10,11]. Despite the progress made towards protective infrastructure, risk communication, and understanding a wide pallet of vulnerability features, rainfall events cause repetitive and eventually severe financial losses for citizens, the state, and insurance companies [8,12,13,14]. Part of the exposure of elements to the rainfall hazard can be addressed by appropriate and timely reactions, starting with identifying the potential risk occurrence related to an upcoming hazardous event [15].
Urban floods are mainly surface water floods producing localized phenomena, so flood damage risk needs to be assessed locally [16]. An essential challenge in this direction is to find reliable hazard and impact data at the local level. For example, due to a lack of data on actual economic losses, some studies targeting European cities have used alternative impact indicators, such as emergency calls to the local fire brigade [10], requests related to insurance claims received at meteorological services [17], or crowdsourced flooding reports [18]. Financial loss data, such as insurance claims, are scarce, but when available, they can be a reliable indicator of flood and storm damage [13,19,20,21]. Scientists have used insurance data to examine the role of socio-environmental or infrastructure-induced vulnerability to rainfall hazards and urban flooding [14,22], to develop damage functions for coastal flooding and storms [23,24], and to model the financial exposure to floods for the insurance market [25]. At the same time, methodological difficulties associated with collecting and processing primary insurance data have been of particular concern among scholars [12,14,26], making the elaboration of such data a methodological achievement. Overall, insurance datasets can be a promising source for weather-related damage assessment.
Determining appropriate rainfall thresholds that are likely to trigger flood damages could essentially contribute to flooding risk assessment and early warning systems. So far, they have mainly developed to determine the exact location and time of rainfall-triggered landslides [27,28,29]. Despite their usefulness, studies on flood-related rainfall thresholds are limited [30]. Most of them focus on extensive or extreme phenomena [31], or analyze only a limited number of rainfall events [32]. Furthermore, relevant studies based on the analysis of high-resolution direct loss data are yet to be undertaken. Only recently, Cortès et al. [12] investigated the relationship between rainfall and floods with severe damage based on insured losses in Catalonia, Spain. The authors explored the possibility of setting rain thresholds for the risk of a high-impact event in the area. They also demonstrated the usefulness of flood risk models based on parsimonious data.
That said, this paper is devoted to defining rainfall thresholds above which material damage is likely to be caused to citizens’ properties in Greece’s Athens Metropolitan Area (AMA). In particular, the research objectives are to investigate and model, at the local level, the relationship between rainfall hazard and the occurrence of flood-related damage to generate optimal rainfall thresholds for early warning. The present study was motivated by the urgent need for effective flood risk prevention through warning systems that allow timely precautionary action and readiness. For the AMA, the design of such systems is a top priority as the area has experienced severe flash floods in the past [15,33,34] and it is considered as an area particularly prone to floods [9,10,35]. Rainfall thresholds were identified at the municipal level, as municipalities are the first administration level and, therefore, the first level at which decision making is needed to address the local risks. For the analysis, rainfall observations and insurance claims data at the postal code level were elaborated on from the EU co-funded YANTAS project framework. Threshold selection techniques widely used to classify hazardous conditions associated with adverse effects in various disciplines, including hydrogeological sciences [12,36], were applied. Practical implications regarding the applicability of the detected optimal thresholds in flood risk early-warning systems are also discussed in this paper.

2. Materials and Methods
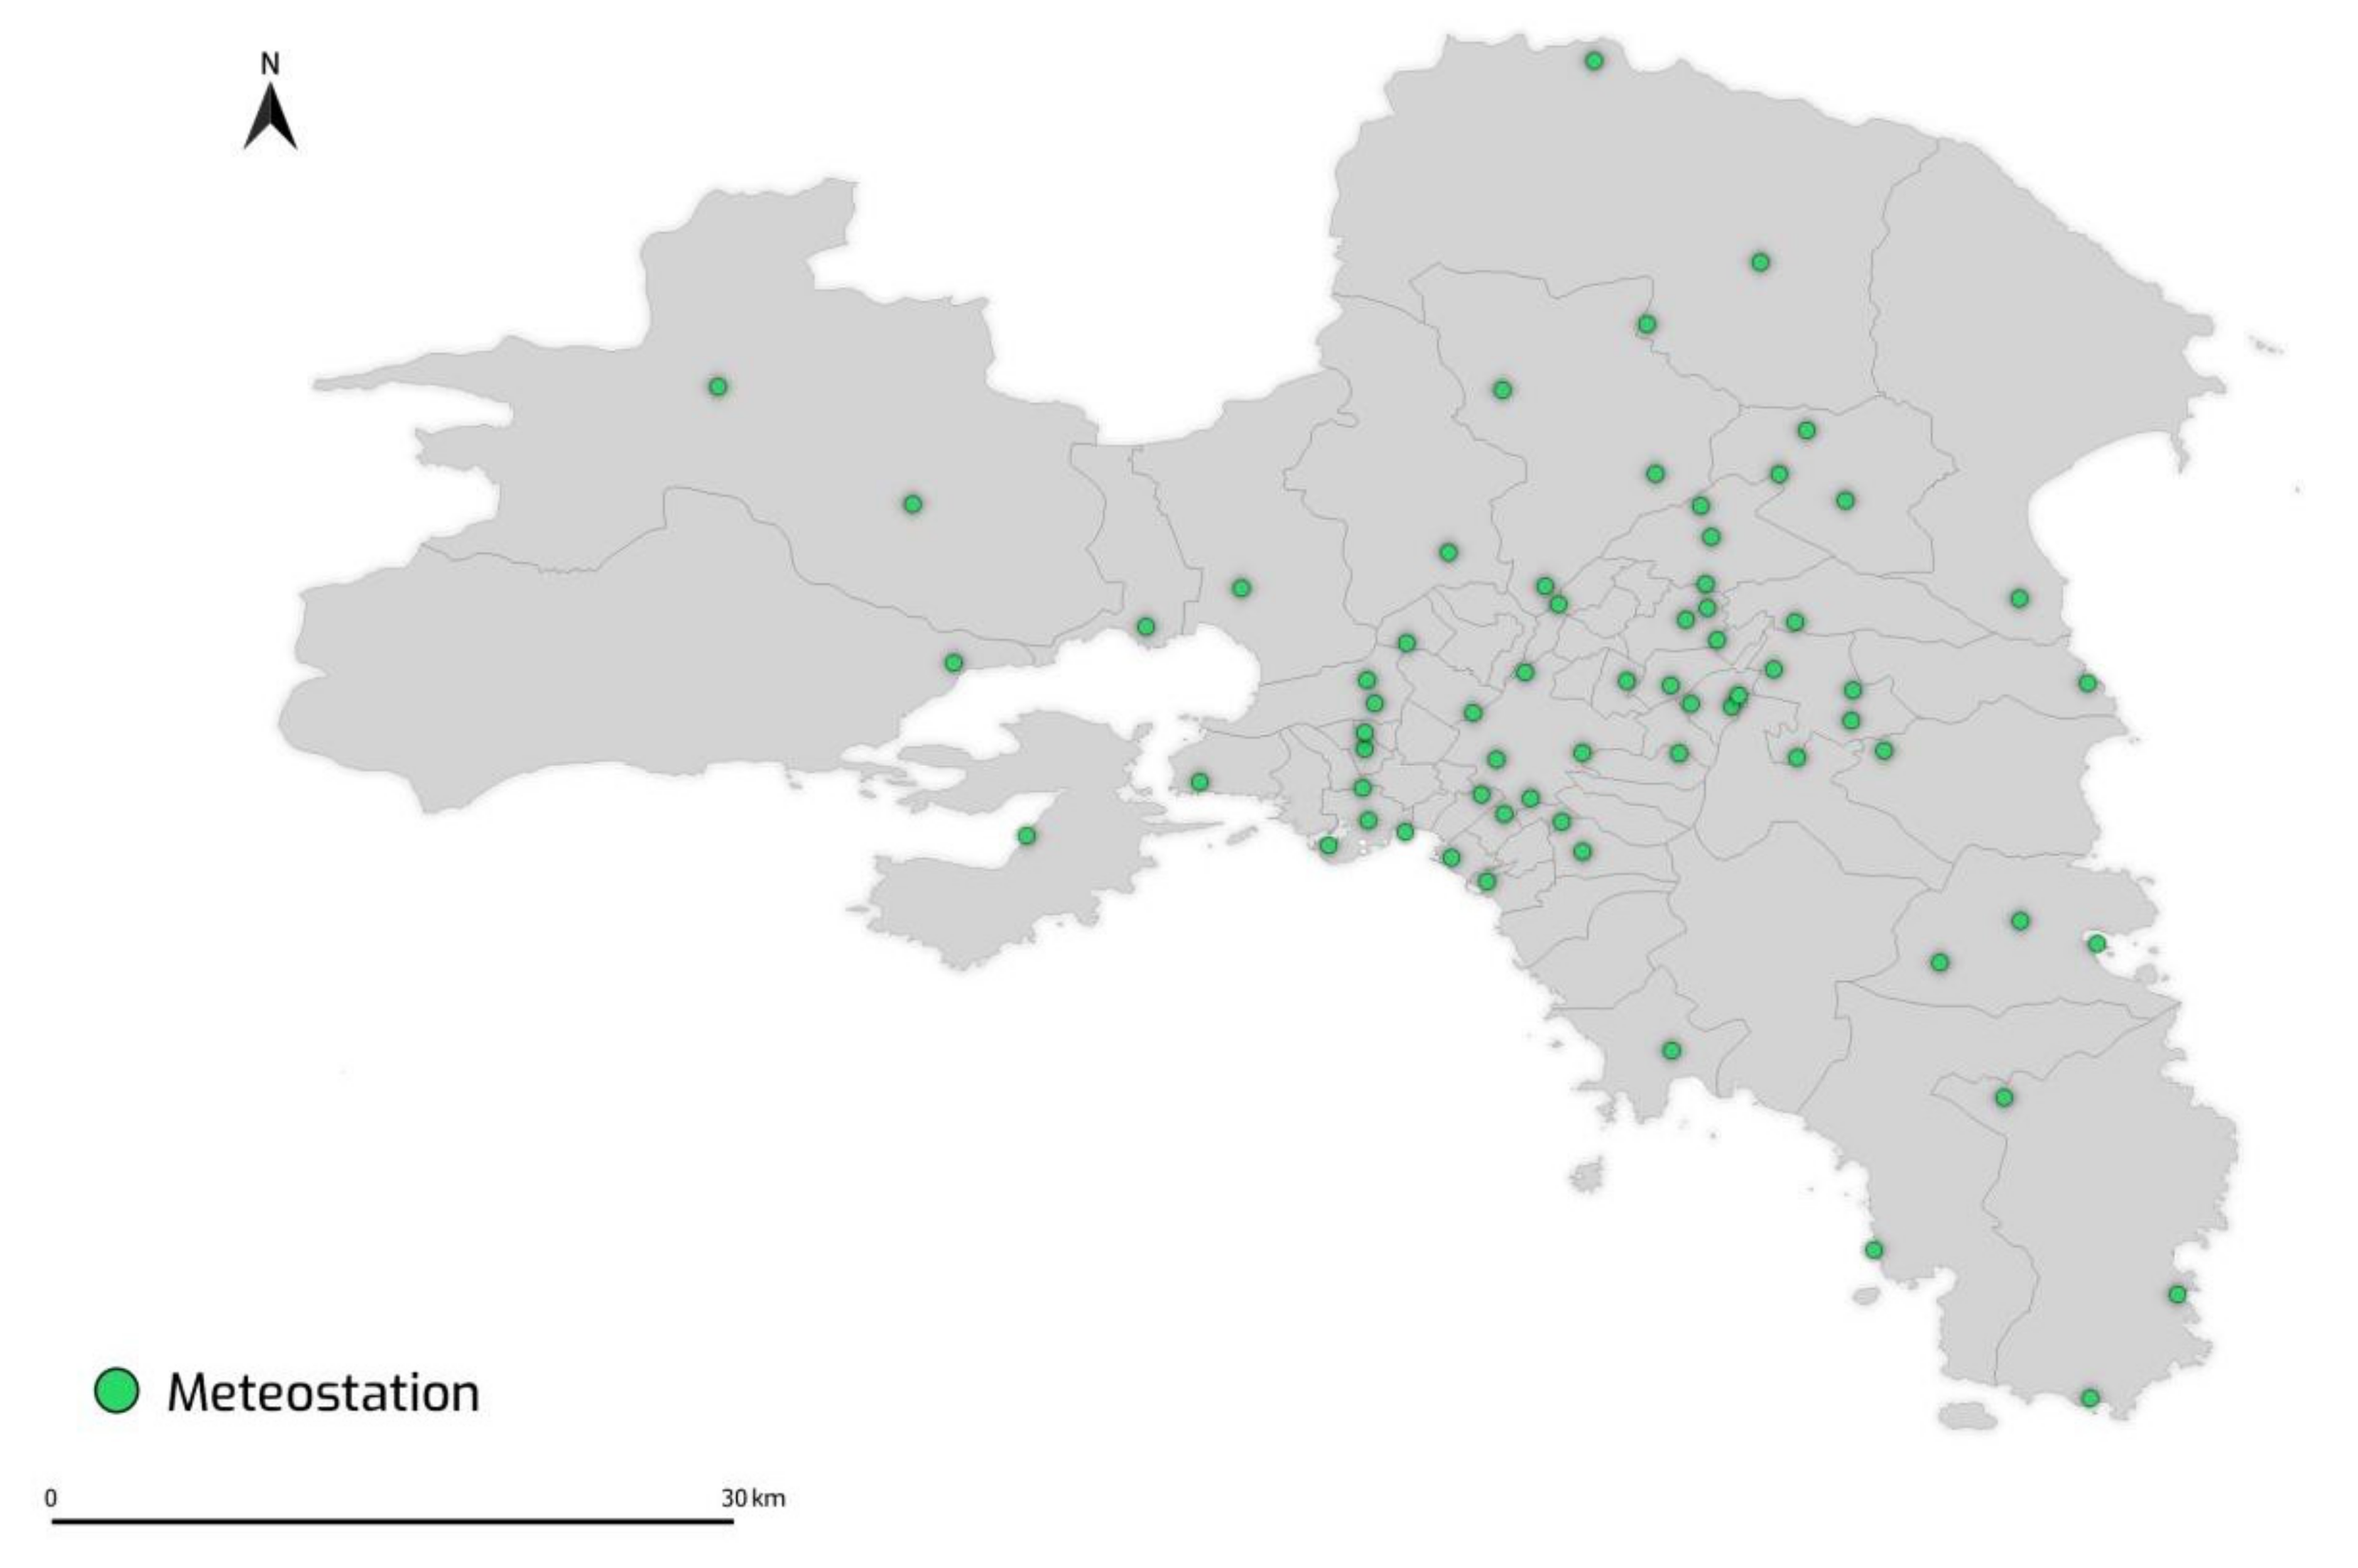
2.1. Study Area

The Athens Metropolitan Area (AMA) of the Attica prefecture is the most populated region of Greece (3.8 Mio inhabitants), as it includes the city of Athens, the capital of the country. The climate is temperate, typical Mediterranean, and the average annual precipitation is approximately 450 mm, with the highest peaks recorded in late autumn and early winter [10,33]. Regarding weather-related societal impacts, the AMA is the most affected region in Greece. According to the high-impact weather events (HIWE) database developed by the METEO unit of the National Observatory of Athens (NOA) [9], the study area suffers especially from rainfall-induced flash floods.
The AMA covers 3200 km2 and includes 284 sub-areas following the postal code (PC) segmentation. The PCs have a mean area of 11 km2 (ranging from 0.05 to 348 km2) and a mean population of 12,100 inhabitants (ranging from 990 to 59,000 inhabitants). Population data were derived from the Hellenic Statistical Authority and refer to the latest population-housing Census of 2011 [37].

2.2. Data Spatial Analysis and Sources

The analysis is based on two main data sources, rainfall data and damage claim data for the AMA area, spanning from 2012 through 2019.
Rainfall data were derived from a dense network of 66 surface meteorological stations spread in the AMA (Figure 1), that are installed at altitudes ranging from 2 to 1230 m (M = 157, SD = 195). These stations belong to the network of surface weather stations operated by the METEO unit at NOA, the denser network across Greece [38]. The stations provide 10 min observations of various meteorological parameters such as temperature, pressure, humidity, wind velocity and direction, rain and rain intensity.
Damage claim data were provided by Interamerican, one of the most significant Greek insurance companies, part of the Achmea insurance group, with the PC as a geographical reference (Figure 1). The insurance company accounts for about 11% of the domestic insurance market in the non-life insurance branches and is ranked first based on this share. The data are available at the branch level and include a series of information for each claim, such as the date when the damage occurred, the cause and type of damage, and the amount of approved compensation, among others. The processing and analysis of the data were carried out at the PC level to be consistent with the corresponding level of geospatial monitoring of the insurance data followed by the insurance company.

2.3. Rainfall Events

Rainfall events were identified based on the meteorological observations, according to an accredited methodology developed by the METEO unit of EAA [10]. Two consecutive rainfall events have a start time difference of at least 24 h.
Each event affected one or more PCs. The cumulative maximum rolling 24-h rainfall (R24) was calculated for each event and PC from a representative station selected from the pool of stations located at a distance of up to 5 km from the PC centroid. In the few cases where this limit was exceeded, the station closest to the centroid at a distance up to 20 km was selected. The R24 rain parameter was chosen as the most suitable for use in early warning systems based on 24-h meteorological forecasts.
Only events with cumulative total rainfall above 20 mm and 60-min rainfall above 5 mm were included in the analysis to account for actual hazardous conditions. These thresholds are based on previous studies on the flash-flood occurrence in the study area [10].

2.4. Statistical Methods

A binary variable for the damage occurrence (DO) was developed based on whether the rainfall event caused flood-related damages to properties within a PC area, namely if insurance claims resulting from flood damages were recorded. A set of R24–DO pairs were therefore identified for each PC. Binary logistic regression was applied to model the relationship between DO and R24. Logistic regression was selected over other powerful classification model types applied to machine learning tasks, such as non-parametric decision tree models. The main reasons were that logistic regression might more effectively address small sample sizes and is easy to interpret based on the coefficients alone [39]. The level of significance (p-value) was set at 0.05. The model performance, specifically the model’s discrimination ability, was further assessed using the AUC, namely the area under the receiver operating characteristic curve (ROC curve).
ROC and AUC are commonly used to assess the performance of binary response models such as logistic models [40]. Furthermore, ROC curves are among the most widely used techniques for selecting the optimal threshold of a binary classifier, above which there is a strong probability of adverse effects [36]. The use of ROC curves is becoming more widespread in a vast range of application areas, including biostatistics and machine learning [40].
The ROC curve is constructed by plotting two contingency scores, the true-positive (y-axis) and the false-positive (x-axis) rates, at each cutpoint of the classifier, in this case, the R24 rain parameter. The true-positive rate (TPR) is a synonym for the hit rate and is defined as follows:
TPR = TP/(TP + FN)
The false-positive rate (FPR) is a synonym for the false alarm rate and is defined as follows:
FPR = FP/(FP + TN)
where, for this study: TP (true-positive result) is the number of events correctly classified as damaging ones, FN (false-negative result) is the number of missed events that caused damages, FP (false-positive result) is the number of events incorrectly classified as damaging ones, and TN (true-negative result) is the number of events correctly classified as non-damaging ones. Thus, TPR expresses the proportion of the total damaging events that have been correctly classified, and FPR expresses the proportion of the non-damaging events that have been incorrectly classified as damaging ones.

2.4.1. Analysis for the AMA as a Whole

First, binary logistic regression was applied to determine whether the association between DO and R24 is statistically significant for the study area as a whole. The full dataset was used for the analysis, i.e., all R24-DO pairs at the PC level. The PC population was added as a control variable, based on the hypothesis that a higher population is associated with a higher probability of any damage to occur in the area. For the logistic regression, the continuous independent variables R24 and population were converted into logarithmic ones to ensure comparability of their effects and a better interpretation of the results. An overall optimal 24-h rainfall threshold above which flood-related damages are likely to occur in the AMA was estimated as the value of the rainfall cutpoint for which the difference between true-positive rate and false-positive rate is maximized [41]. This condition ensures that the degree of false alarms will be low compared to successful predictions.
K-fold cross-validation was further performed to generate a more realistic estimate of the model’s predictive performance [42] by averaging the AUCs corresponding to each fold and bootstrapping the cross-validated AUC to obtain statistical inference and 95% bootstrap bias-corrected confidence intervals (CI) [43]. Eight k-folds were defined, with approximately 1100 observations each.

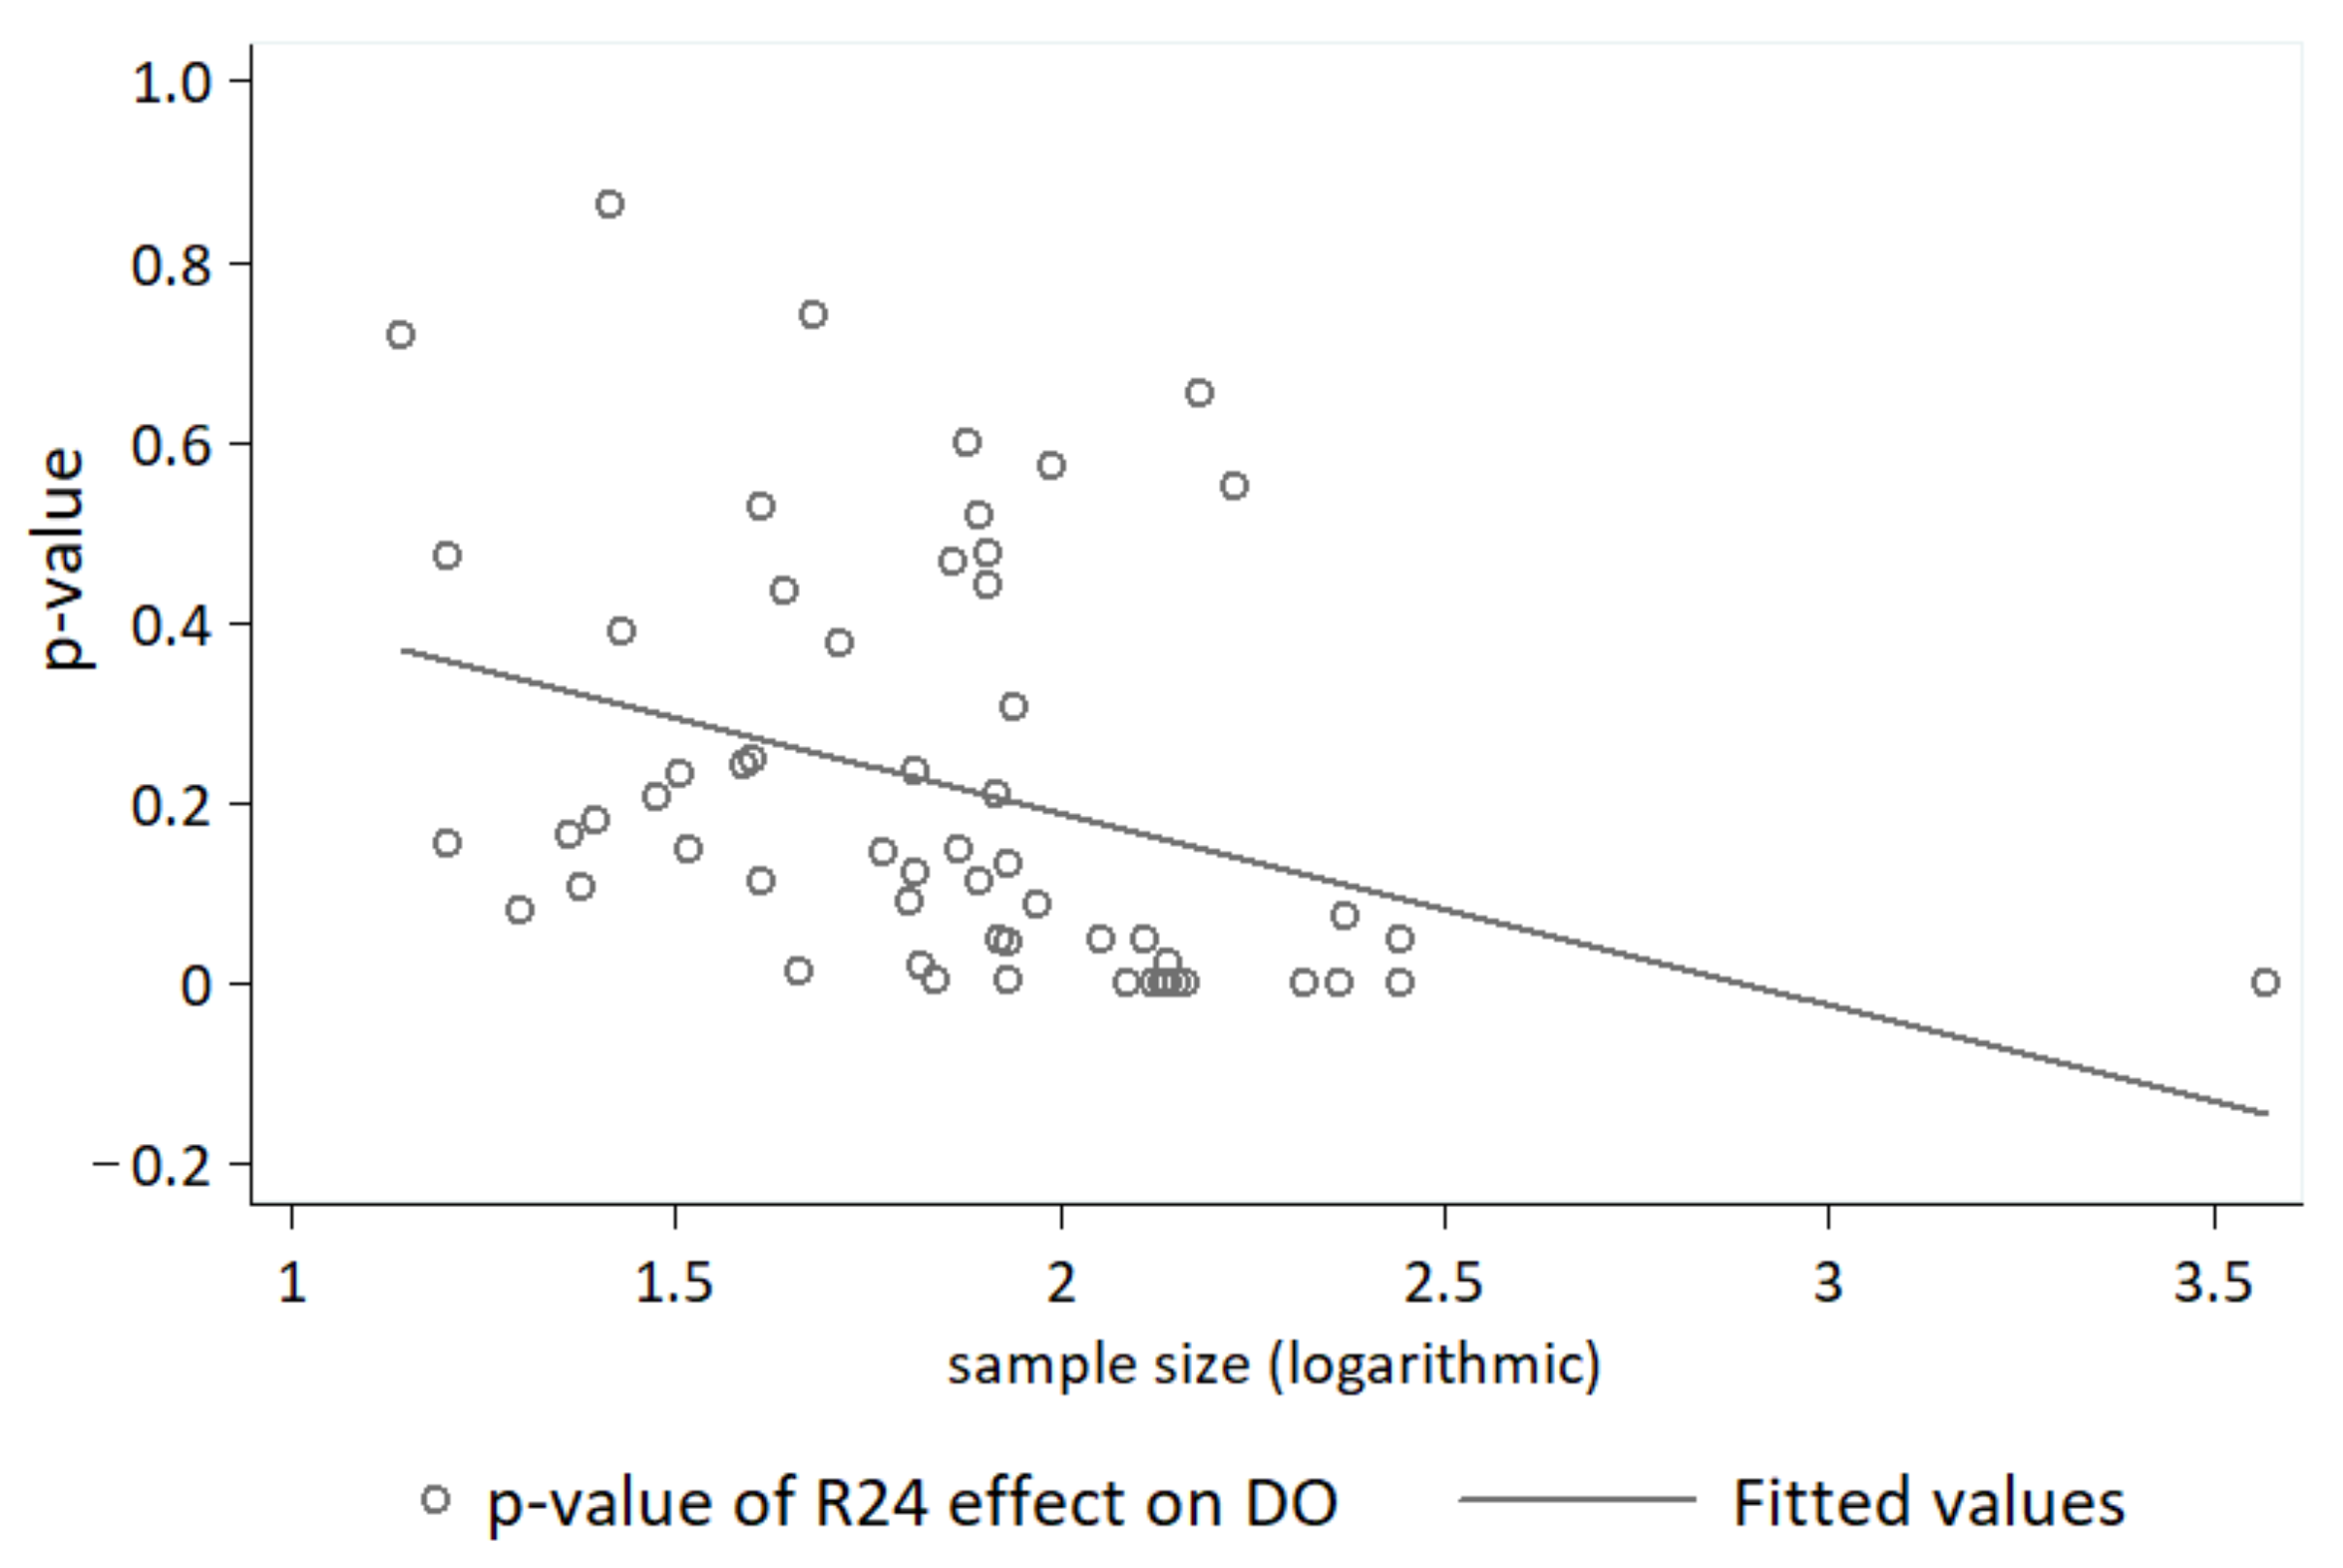
2.4.2. Analysis at the Municipality Level

Municipalities constitute the first level of administration and, therefore, the administrative level at which decision making to address local flood risks is needed. Therefore, R24 thresholds at a municipality level would better fit the needs of the end-users and decision-makers. For the analysis, we aggregated the R24–DO pairs from the PC area segmentation to the municipality level segmentation. The sets of R24–DO pairs were therefore remapped at the municipality level.
Optimal R24 thresholds were defined for the municipalities for which the logistic regression models were found significant and upon acceptable AUC. Specifically, the performance of R24 as a binary classifier was acceptable only if AUC was above 60%. In general, an AUC up to 60% suggests a failure to discriminate; between 60–80%, it is considered acceptable; and above 80%, it is deemed to be excellent.
The level of confidence as to the discriminating performance of the estimated R24 thresholds was also defined. Specifically, a three-level confidence index was defined based on the AUC parameter: level 1 (low confidence) for AUC between 60% and 70%, level 2 (moderate confidence) for AUC between 70% and 80%, and level 3 (high confidence) for AUC more than 80%.
Optimal thresholds at the municipality level were selected to maximize the difference between TPR and FPR, with an additional criterion of TPR exceeding 50%. We consider a hit rate of 50% as the minimum requirement for an effective warning and decision support system.

3. Results

3.1. Overview of the Study Area

During 2012–2019, 228 rainfall events occurred in the AMA, half of which (115) caused flood damages in parts of the area. Each event spatially affected from 1 up to 243 (out of the 284 in total) PCs (M(SD) = 38.3 (56.3)), leading to 8,726 R24–DO pairs at the PC spatial analysis. The R24 ranged from 20.0 mm, the chosen minimum threshold, to 179.6 mm, with a mean value of 38.2 mm. Figure 2a shows the frequency distribution (histogram) of R24, at the PC level, indicating that frequency decreases as R24 (above 20 mm) increases. Figure 2b shows the statistical distribution (boxplot) of R24 over the binary damage occurrence variable, DO. A one-way ANOVA revealed that there was a statistically significant difference in R24 between the cases (i.e., the R24–DO pairs) with and without damage occurrence (F(1, 8724) = 387.38, p < 0.001). The mean R24 was 36.8 mm among the cases without flood damages and 48.5 mm for those that caused flood damages, indicating a positive relationship between R24 and DO.
During the study period, the number of R24–DO pairs per PC ranged from 2 to 66, with a mean value of 31 events. The number of damage occurrences per PC ranged from 1 to 20, with a mean value of 4. In 12% (33) of the PCs, there was no damage claim recorded during the analysed period, while there was only one PC in which all rainfall events caused damages.
Table 1 shows the results for the logistic regression analysis used to examine the effect of R24 on DO across the PCs of the AMA. The model is significant at the 5% level [44].
The effect of R24 on DO was found positive and statistically significant (b = 3.03, p < 0.001). Given a specific population, an increase in R24 is associated with an increased likelihood of causing flood damages. The population was also found to affect DO positively (b = 1.51, p < 0.001) given a specific R24, confirming our initial hypothesis. Figure 3a depicts the predicted probability (fitted values) of DO as a function of R24, controlled for the population. Results indicate that the DO probability in the AMA increases monotonically with increasing amounts of R24.
Figure 3b shows the ROC curve used to evaluate the model’s performance and identify an optimal R24 threshold associated with damage occurrence. Specifically, the optimal R24 across the AMA was defined based on the TPR and FPR values at each R24 cut-off point, under the condition of maximizing the difference between the hit and false alarm rates. Given this condition, the overall optimal threshold for the AMA corresponds to R24 of 39.8 mm and produces a 52.2% TPR (hit rate), a 29.0% FPR (false alarm rate), and 68.8% rainfall observations correctly classified.
Table 2 presents the cross-validated results for the ROC–AUC. The cross-validated mean AUC is 0.64 (SD = 0.02), denoting an acceptable but low performance of the R24 as a predictor of damage occurrence across the whole AMA.

3.2. Optimal R24 Thresholds per Municipality

Table 3 presents descriptive statistics for the numbers of PCs, R24–DO pairs, and damage occurrences per municipality. Within the AMA, there are 59 municipalities, and the number of PCs per municipality ranges from 1 to 90, with a mean value of 5 PCs. The maximum number of PCs (90), which is far from the second in order (18), corresponds to the municipality of Athens, the capital city of Greece. A mean of 148 R24–DO pairs with R24 above 20 mm was defined per municipality, while about 17% was the mean percentage of damage occurrences per municipality. The standard deviation for the number of R24–DO pairs is very high due to the much higher number of PCs and, thus, examined cases in Athens’s municipality than the other municipalities.
Logistic regression was then applied separately for each municipality, except for the one in which there were no damage occurrences; thus, there was no dichotomous variable DO. According to the results, the R24 p-values ranged from 0.00 to 0.86 (M = 0.22, SD = 0.23). Out of the 58 logistic models (corresponding to the 58 municipalities), only 19 (33%) were found to be statistically significant, i.e., the p-value was less than 0.05.
Since there is evidence that statistical significance in regression models depends heavily on the statistical sample size [45], we tested its effect on the estimated p-value. The sample size, namely the total number of R24–DO pairs included in the statistical analysis, was converted to a logarithmic value to decrease its high variability (Table 3). Figure 4 depicts the relationship between the sample size and the R24 p-value, showing the scatter plot and the fit line. The linear regression analysis was found to be statistically significant (R2 = 0.13, F(1, 56) = 8.55, p = 0.005). Specifically, the sample size was found to have a statistically significant and negative effect (coefficient = −0.21, p = 0.005) on the R24 p-value, which indicates that a small statistical sample may be responsible for the statistical insignificance of the logistic models of some of the examined municipalities.
Therefore, to overcome the limitation likely posed by the sample size to determine rainfall thresholds for as many municipalities as possible, we proceeded to merge neighboring municipalities for which the individualized logistic models were not found to be statistically significant (the p-value was greater than 0.05). The statistical results were then re-evaluated and found to be statistically significant for nine groups of merged municipalities. Overall, we defined optimal R24 thresholds for 78% of the AMA’s municipalities.
Table 4 presents statistical results for 28 municipalities and merged municipalities with significant model performance. Specifically, the table summarizes statistics for the number of R24–DO pairs, the logistic regression results, and ROC–AUC results, including the optimal R24 thresholds under the condition the difference between the hit and false alarm rates is maximized and TPR is equal to or higher than 50%. The optimal R24 threshold ranged from 30.4 mm to 78.0 mm, with a mean value of 43.9 mm. Also, the mean TPR (hit rate) was 65%, ranging from 25% to 100%, while the mean percentage for rainfall observations correctly classified was estimated at 71%, ranging from 51% to 92%. Finally, the mean AUC was calculated at 68%, ranging from 60% to 85%. Indicatively, 35% of the AUC values were above 70% (moderate confidence), and 7% had a value above 80% (high confidence).
The optimal R24 thresholds were further classified to estimate the local risk of flood-related damage, considering that threshold rates are inversely proportional to the risk. Namely, the lower the R24 threshold associated with a high probability of damage, the higher the risk in the area since there is a higher probability of lower R24 occurrences, as shown by the frequency distribution of R24 in the AMA (Figure 2a). The 75th and 90th percentiles on the distribution of the optimal rainfall thresholds at the municipality level were used to define three risk levels, as shown in Table 5. Specifically, municipalities were classified at risk level 1 (low) for R24 above 56 mm (90th percentile), risk level 2 (moderate) for R24 between 42 mm (75th percentile) and 56 mm, and risk level 3 (high) for R24 between 30 mm (minimum value) and 42 mm. Table 5 also presents the confidence classification in the discriminating performance of the estimated R24 thresholds, as measured by AUC.
Figure 5 shows the distribution at the municipality level of the optimal R24 threshold and flood damage risk using a 3-color palette. Three different shades for each color indicate the level of confidence, which increases as the color darkens. Therefore, the darker the color, the higher is the confidence about the estimated risk of flood damage.

4. Discussion

The meteorological and insurance data used in this study showed that in 2012–2019, there were 228 rainfall events with R24 over 20 mm in the AMA, half of which caused damage to citizens’ properties in parts of the area. The events manifested locally with different intensities in terms of R24, which was found to affect the occurrence of flood damages. This work determines the hazard conditions using an essential parameter, the 24-h accumulated rainfall (R24). Other rainfall parameters, such as the maximum accumulated rainfall of a rainfall event over a shorter period (e.g., in 1-h, 3-h, or 6-h), which may indicate the rainfall intensity, may also play an essential role in causing adverse effects and flood damage. However, we consider R24 more suitable for the ultimate purpose of such an analysis, that of the early warning of risk. Namely, in terms of rainfall forecasting, a shorter accumulation time is related to a lower forecasting skill as the temporal distribution of rainfall is also a forecasting challenge [46,47]. Using R24 to estimate the likelihood for flood damage would increase the forecast skill of the flood risk through the increased skill of the rain forecast at this specific accumulation time.
According to the results, the probability of damage occurring (DO) across the AMA increases as a function of R24. The logistic regression for the AMA as a whole shows that the model is able to simulate the DO probability. However, the model’s performance is low (cv AUC = 64%). This may be partly related to the differentiation of geophysical and sociodemographic vulnerability at the local level, which may significantly affect the response of each area to flood risk. Therefore, we do not expect uniformity in the R24 thresholds throughout the AMA. Cortès et al. [12] also found low to moderate AUC (<74%) in logistic regression models that predict the probability of severe flood damage across Catalonia based on 24-h rainfall. Note, however, that the present study, in contrast to Cortès et al., considers also the occurrence of small-scale damages. Therefore, the model may be more sensitive to exposure factors such as drainage systems that respond to small precipitation amounts. This kind of sensitivity explains the reason why, for example, Santos and Fragoso [30], in their work to determine precipitation thresholds in a northern Portuguese basin, excluded from their analysis events with low precipitation (less than one-year return period), to prevent the increase in false positives. However, although more fragile, the estimation of low-impact critical rainfall amount for a basin may have implications for hydrological models and their sensitivity or uncertainty analysis [48].
The optimal rainfall threshold estimated for the AMA as a whole is 39.8 mm. Papagiannaki et al. [10], who studied the relationship between flash floods and the rainfall hazard in the Attica basin using data from fire service operations and meteorological observations, found that 50% of damaging events were associated with R24 between 30 mm and 60 mm. A relevant study using requests related to insurance claims received at meteorological services in Barcelona [17] suggested an R24 of 40 mm as the rainfall threshold associated with societal impact in densely populated areas. Both studies highlighted the critical role for the degree of urbanization on how urban areas respond to rainfall.
The AMA overview provides information about the overall response of the area as a whole to rainfall, a key prerequisite for establishing a hazard–impact relationship and assessing the risk of rainfall-induced flood damages. Determining an optimal rainfall threshold capable of triggering flood damages in the area is helpful. Still, the value of the hazard–impact relationship is limited by the diversity of local vulnerability. To contribute more substantially to the improvement of flood resilience, we attempted to identify flood risk-related rainfall thresholds at a more local level. Indeed, the results showed that we could have statistically improved models and, therefore, more reliable results when analyzing smaller geographical areas, thus absorbing part of the local vulnerability effect. However, the moderating role of data availability emerged, which was found to affect the statistical significance and thus the performance of the individual local models. Therefore, areas with a larger number of observations, i.e., R24–DO pairs, were associated with higher statistical significance (Figure 3). The R24–DO pairs were created using the insurance company raw data reported at the PC level and then aggregated at the municipality level, the smaller administrative level of the area division. Accordingly, the resulting number of observations per municipality depends largely on the included number of PCs. Even large municipalities in terms of spatial extent may exhibit few observations due to the small number of PCs. This limitation could be overcome with geolocation of damage data and given a very dense network of meteorological stations. However, the network is denser in the municipalities with more PCs (Figure 1).
The importance of the density of meteorological stations in capturing the rain–damage relationship is evident through the observation of the response of nearby areas (in the PC spatial analysis) to rain events with very high R24. Specifically, there were extreme values of R24, as shown by the distribution of Figure 2b, which were not associated with damage in a PC while they were in the neighboring one. The specific events occurred in suburban areas with significant geomorphological differences, especially in slope and altitude due to the study area’s mountains. As the network of stations in these areas is not yet very dense, likely some stations will not be representative enough for some areas, especially amid extreme episodes with a possible high spatial variability of rainfall amount and intensity [49].
Essential for an in-depth understanding of the behavior of predictive models is to highlight inconsistencies related to the occurrence or not of flood-related damage in a specific area under similar rainfall conditions. With the aim to shed some light on the behavior of the predictive model developed in this work, a specific municipality is discussed in the following with more detail. Indeed, the municipality of Zografou, which borders the capital city of Athens to the west, was selected as this is one of the municipalities that is not subject to the restrictions of either the statistical sample or the density of meteorological stations. The associated model had a moderate to high performance (AUC = 78%), and the optimal R24 threshold was determined at 47.2 mm (Figure 5). It consists of four PCs with a total of 142 R24–DO pairs. Among the R24–DO pairs, 100 (71%) relate to events with R24 less than the optimal threshold. Only two of these events are related to damage in the area, specifically in a single PC, thus affecting the model performance. These false-negative observations concern winter events in January 2014 and February 2019, with R24 at 32.6 mm and 37.2 mm, respectively. Looking more closely at the additional weather parameters, we noticed that the January event had a very high maximum 30-min rainfall, i.e., 23.8 mm. This value is the maximum one recorded among the winter events in the municipality of Zografou, while it belongs to the top 10% in the AMA in winter. Therefore, it is possible that the high rain intensity, as reflected by the 30-min rainfall, is responsible for the flood event of January 2014 in the specific municipality. It is worth noting that the correlation of the DO parameter with the 30-min rainfall in the AMA was found to be statistically significant but very weak (Spearman’s rho = 0.14, p < 0.001). Therefore, it provides only an additional assessment of the conditions associated with damage occurrence within the study area. For example, the February 2019 event is not explained by the 30-min rainfall, which was very low (7 mm). In this case, further investigation is required regarding the damaged item’s specifications, location, and associated vulnerability.
In the last decade, we have observed a growing interest in determining thresholds for weather hazard parameters to support early warning systems, mainly in the field of rainfall-induced landslides [50,51]. The selection of optimal damage-triggering rainfall thresholds may also enable more efficient detection in the likelihood of flood damage [36]. Therefore, it may be applicable in early-warning systems for flood-related damages and economic losses [6]. Warnings at the municipality level can strengthen the preparedness and coping capacity mechanisms for civil protection at the local level. The results showed differentiation of the local R24 thresholds (>20% higher or lower) from those estimated for AMA as a whole for at least half of the examined areas. Overall, higher R24 thresholds for flood damage occurrence apply to the municipalities than the overall AMA R24 threshold.
We should emphasize that the estimated thresholds were selected so as to maximize the difference between the observed hit rate and false alarm rate. The hit rate shows what fraction of the events with damage is correctly forecasted. The false alarm rate represents the fraction of the observed non-damaging events incorrectly denoted as damaging ones. Naturally, different considerations regarding the requested hit rate and false alarm rate in an early warning system and subsequent decision making may result in the selection of different R24 thresholds. For example, Table 6 presents the ROC coordinates for three possible R24 to be used as thresholds for the municipality of Athens, selected based on a different trade-off between the hit and false alarm rates. This example shows that requesting a higher percentage of hit rate leads to an increase in the percentage of false alarm rate, but also a decrease in the overall successful classifications.
Note that these percentages are not related to the model’s classification performance, as they only directly relate to the choice of a risk threshold. A fixed high hit rate might be desirable for an early warning system. However, any decision should consider that reducing critical rainfall to achieve a higher hit rate could lead to a high false alarm rate and potentially affect trust in the system. Due to the large margins of rain threshold selection, we argue that it should be customized for each study area to meet the local geophysical and sociodemographic vulnerability against flood risk. Given this information locally, we could suggest choosing a lower threshold, especially for the most vulnerable areas; thus, we would achieve greater TPR, which is desirable for the areas most at risk. The message to the final recipient could then play a role in balancing the degree of false-positive alarms. While there is evidence that public risk perception and preparedness are enhanced by the warnings of scientists and risk management agencies about the threats of extreme weather events [52], we do not know whether this is the case with less severe phenomena. For the time being, studies on the impact of false alarms for tornadoes in the USA have conflicting results as to whether they ultimately negatively affect the precautionary behavior of citizens [53,54].
Given a specified trade-off between the hit and false alarm rate, we compared the R24 thresholds at the municipal level to estimate each municipality’s risk of flood damages due to rainfall. The estimated R24 threshold indicates the local flood risk, as it is used to classify rainfall events as positive, namely with increased risk of flood damage, or negative, with low risk of flood damage [55]. Lower thresholds indicate greater risk, as the probability of rain events with low R24 is higher. As shown by the frequency distribution (Figure 2a), 70% of rainfall events had R24 less than 42 mm (low risk), 20% of events had 42 mm to 56 mm (moderate risk), and 10% of events had more than 56 mm (high risk).
The proposed methodological approach has the advantage of being based on a few components (rainfall and dammage occurrence) and can be applied to areas with a lack of detailed hydrological monitoring networks. However, there are limitations that must be considered when using the information produced. First of all, only the occurrence of flood-related damage is considered, not the damage magnitude. The rainfall thresholds are therefore mostly low, indicative of the area’s response on the first degree. Moreover, the determination of thresholds at the municipal level does not completely eliminate the variability in the topographic and sociodemographic vulnerability to flood risk that exists at a more local level. Finally, other weather-related factors not considered in this analysis might affect the outcome, such as the rainfall intensity and the spatial and temporal variability of rainfall [56].
Τhe present analysis has practical implications in terms of the possibility for exploiting the results in the early warning of local risk managers and citizens for rainfall risk. Every step towards recognizing flood risk at the local level can contribute to more effective risk prevention, preparedness, and mitigation. While the coordinating role of governments remains essential, it is necessary to empower local authorities and local communities to reduce risk, including through decision-making responsibilities [6]. Meanwhile, insurance companies can play a significant role in conveying information about impending threats to citizens. Given the involvement of climate change in increasing rainfall and flood risk, insured losses are also expected to increase. Therefore, practices that enhance the preventive capacity of insured clients could be beneficial to both parties. The cooperation of research bodies and the insurance industry offers a new perspective on weather-related risk management and community and corporate adaptation to a possible increase in the frequency and intensity of rainfall events.

5. Conclusions

The primary purpose of this study was to identify, at municipality level, the rainfall thresholds likely to trigger flood damages in urban areas. The analysis answers under what specific rainfall amounts there is a risk of flood damages and therefore direct economic losses given the existing local geophysical and sociodemographic vulnerability to rainfall hazard. The study manages to identify optimal 24-h rainfall thresholds while assessing the level of confidence in their discriminative ability. The local thresholds were further classified to assess the risk of flood damage to occur locally in the form of a risk index. Τhe three levels of information, namely the R24 threshold associated with a high probability of flood damage, the confidence in thresholds’ performance, and the relative risk level, compose a tool for the monitoring and early detection of upcoming rainfall hazard. The results for analyses such as that which was carried out in the present study are susceptible to the primary information provided. Low-quality data can jeopardize the effectiveness of the analysis. In this case, we relied on solid and accurate data representing both the hazard and the impact on the local level. In fact, this work showed that the claim insurance data can be used successfully in modeling the relationship between the rainfall hazard and the occurrence of flood damage, addressing the need for early warning of flood risk.

Author Contributions

Conceptualization, K.P., V.K. and K.L.; methodology, K.P., K.L., A.B. and V.V.; statistical software, K.P.; data curation, I.M., V.V. and E.K.; writing—original draft preparation, K.P.; writing—review and editing, V.K., K.L., V.V., I.M., E.K. and I.T.; funding acquisition, V.K. and I.T. All authors have read and agreed to the published version of the manuscript.

Funding

This research has been co-financed by the European Regional Development Fund of the European Union and Greek national funds through the Operational Program Competitiveness, Entrepreneurship and Innovation 2014-2020, under the call RESEARCH–CREATE–INNOVATE (project code: T2EDK-01108).

Data Availability Statement

The raw data of the observations and all of the datasets generated during the current study are available from the corresponding author upon reasonable request.

Acknowledgments

The authors acknowledge the contribution of G. Kyros is geospatial analysis and graphics preparation.

Conflicts of Interest

The authors declare no conflict of interest.

References

  1. Petrucci, O.; Papagiannaki, K.; Aceto, L.; Boissier, L.; Kotroni, V.; Grimalt, M.; Llasat, M.C.; Llasat-Botija, M.; Rosselló, J.; Pasqua, A.A.; et al. Meff: The database of mediterranean flood fatalities (1980 to 2015). J. Flood Risk Manag. 2018, 12, e12461. [Google Scholar] [CrossRef] [Green Version]
  2. Petrucci, O.; Aceto, L.; Bianchi, C.; Bigot, V.; Brázdil, R.; Pereira, S.; Kahraman, A.; Kılıç, Ö.; Kotroni, V.; Llasat, M.C.; et al. Flood fatalities in Europe, 1980–2018: Variability, features, and lessons to learn. Water 2019, 11, 1682. [Google Scholar] [CrossRef] [Green Version]
  3. MunichRe. Risks from Floods, Storm Surges and Flash Floods. Underestimated Natural Hazard. Available online: https://www.munichre.com/en/risks/natural-disasters-losses-are-trending-upwards/floods-and-flash-floods-underestimated-natural-hazards.html (accessed on 31 December 2021).
  4. European Environmental Agency. Economic Losses from Climate-Related Extremes in Europe. Available online: https://www.eea.europa.eu/data-and-maps/indicators/direct-losses-from-weather-disasters-4/assessment (accessed on 31 December 2021).
  5. Hoeppe, P. Trends in weather related disasters—Consequences for insurers and society. Weather. Clim. Extrem. 2016, 11, 70–79. [Google Scholar] [CrossRef] [Green Version]
  6. UNDRR. Global Assessment Report on Disaster Risk Reduction. 2019. Available online: https://gar.unisdr.org (accessed on 31 December 2021).
  7. Moftakhari, H.R.; AghaKouchak, A.; Sanders, B.F.; Matthew, R.A. Cumulative hazard: The case of nuisance flooding. Earth’s Future 2017, 5, 214–223. [Google Scholar] [CrossRef]
  8. Paprotny, D.; Sebastian, A.; Morales-Nápoles, O.; Jonkman, S.N. Trends in flood losses in europe over the past 150 years. Nat. Commun. 2018, 9, 1985. [Google Scholar] [CrossRef]
  9. Papagiannaki, K.; Lagouvardos, K.; Kotroni, V. A database of high-impact weather events in greece: A descriptive impact analysis for the period 2001–2011. Nat. Hazards Earth Syst. Sci. 2013, 13, 727–736. [Google Scholar] [CrossRef]
  10. Papagiannaki, K.; Lagouvardos, K.; Kotroni, V.; Bezes, A. Flash flood occurrence and relation to the rainfall hazard in a highly urbanized area. Nat. Hazards Earth Syst. Sci. 2015, 15, 1859–1871. [Google Scholar] [CrossRef] [Green Version]
  11. Faccini, F.; Luino, F.; Paliaga, G.; Roccati, A.; Turconi, L. Flash flood events along the west mediterranean coasts: Inundations of urbanized areas conditioned by anthropic impacts. Land 2021, 10, 620. [Google Scholar] [CrossRef]
  12. Cortès, M.; Turco, M.; Llasat-Botija, M.; Llasat, M.C. The relationship between precipitation and insurance data for floods in a Mediterranean region (Northeast Spain). Nat. Hazards Earth Syst. Sci. 2018, 18, 857–868. [Google Scholar] [CrossRef] [Green Version]
  13. Blumenthal, B.; Nyberg, L. The impact of intense rainfall on insurance losses in two Swedish cities. J. Flood Risk Manag. 2019, 12, e12504. [Google Scholar] [CrossRef]
  14. Spekkers, M.H.; Clemens, F.H.L.R.; ten Veldhuis, J.A.E. On the occurrence of rainstorm damage based on home insurance and weather data. Nat. Hazards Earth Syst. Sci. 2015, 15, 261–272. [Google Scholar] [CrossRef] [Green Version]
  15. Papagiannaki, K.; Kotroni, V.; Lagouvardos, K.; Ruin, I.; Bezes, A. Urban area response to flash flood–triggering rainfall, featuring human behavioral factors: The case of 22 October 2015 in Attica, Greece. Weather. Clim. Soc. 2017, 9, 621–638. [Google Scholar] [CrossRef]
  16. Bernet, D.B.; Trefalt, S.; Martius, O.; Weingartner, R.; Mosimann, M.; Röthlisberger, V.; Zischg, A.P. Characterizing precipitation events leading to surface water flood damage over large regions of complex terrain. Environ. Res. Lett. 2019, 14, 064010. [Google Scholar] [CrossRef]
  17. Barbería, L.; Amaro, J.; Aran, M.; Llasat, M.C. The role of different factors related to social impact of heavy rain events: Considerations about the intensity thresholds in densely populated areas. Nat. Hazards Earth Syst. Sci. 2014, 14, 1843–1852. [Google Scholar] [CrossRef] [Green Version]
  18. Tian, X.; ten Veldhuis, M.C.; Schleiss, M.; Bouwens, C.; van de Giesen, N. Critical rainfall thresholds for urban pluvial flooding inferred from citizen observations. Sci. Total Environ. 2019, 689, 258–268. [Google Scholar] [CrossRef] [PubMed]
  19. André, C.; Monfort, D.; Bouzit, M.; Vinchon, C. Contribution of insurance data to cost assessment of coastal flood damage to residential buildings: Insights gained from Johanna (2008) and Xynthia (2010) storm events. Nat. Hazards Earth Syst. Sci. 2013, 13, 2003–2012. [Google Scholar] [CrossRef] [Green Version]
  20. Spekkers, M.H.; Kok, M.; Clemens, F.H.L.R.; ten Veldhuis, J.A.E. Decision-tree analysis of factors influencing rainfall-related building structure and content damage. Nat. Hazards Earth Syst. Sci. 2014, 14, 2531–2547. [Google Scholar] [CrossRef] [Green Version]
  21. Torgersen, G.; Bjerkholt, J.T.; Kvaal, K.; Lindholm, O.G. Correlation between extreme rainfall and insurance claims due to urban flooding—Case study Fredrikstad, Norway. J. Urban Environ. Eng. 2015, 9, 127–138. [Google Scholar] [CrossRef]
  22. Leal, M.; Fragoso, M.; Lopes, S.; Reis, E. Material damage caused by high-magnitude rainfall based on insurance data: Comparing two flooding events in the Lisbon metropolitan area and Madeira Island, Portugal. Int. J. Disaster Risk Reduct. 2020, 51, 101806. [Google Scholar] [CrossRef]
  23. Prahl, B.F.; Rybski, D.; Boettle, M.; Kropp, J.P. Damage functions for climate-related hazards: Unification and uncertainty analysis. Nat. Hazards Earth Syst. Sci. 2016, 16, 1189–1203. [Google Scholar] [CrossRef] [Green Version]
  24. Prahl, B.F.; Rybski, D.; Burghoff, O.; Kropp, J.P. Comparison of storm damage functions and their performance. Nat. Hazards Earth Syst. Sci. 2015, 15, 769–788. [Google Scholar] [CrossRef] [Green Version]
  25. Moncoulon, D.; Labat, D.; Ardon, J.; Leblois, E.; Onfroy, T.; Poulard, C.; Aji, S.; Rémy, A.; Quantin, A. Analysis of the French insurance market exposure to floods: A stochastic model combining river overflow and surface runoff. Nat. Hazards Earth Syst. Sci. 2014, 14, 2469–2485. [Google Scholar] [CrossRef] [Green Version]
  26. Zhou, Q.; Panduro, T.E.; Thorsen, B.J.; Arnbjerg Nielsen, K. Verification of flood damage modelling using insurance data. Water Sci. Technol. 2013, 68, 425–432. [Google Scholar] [CrossRef] [PubMed]
  27. Menon, V.; Kolathayar, S. Review on Landslide Early Warning System: A Brief History, Evolution, and Controlling Parameters. In Civil Engineering for Disaster Risk Reduction; Kolathayar, S., Pal, I., Chian, S.C., Mondal, A., Eds.; Springer: Singapore, 2022; pp. 129–145. [Google Scholar]
  28. Chikalamo, E.E.; Mavrouli, O.C.; Ettema, J.; van Westen, C.J.; Muntohar, A.S.; Mustofa, A. Satellite-derived rainfall thresholds for landslide early warning in Bogowonto Catchment, Central Java, Indonesia. Int. J. Appl. Earth Obs. Geoinf. 2020, 89, 102093. [Google Scholar] [CrossRef]
  29. De Luca, D.L.; Versace, P. Diversity of rainfall thresholds for early warning of hydrogeological disasters. Adv. Geosci. 2017, 44, 53–60. [Google Scholar] [CrossRef] [Green Version]
  30. Santos, M.; Fragoso, M. Precipitation thresholds for triggering floods in the Corgo Basin, Portugal. Water 2016, 8, 376. [Google Scholar] [CrossRef] [Green Version]
  31. Alfieri, L.; Thielen, J. A European precipitation index for extreme rain-storm and flash flood early warning. Meteorol. Appl. 2015, 22, 3–13. [Google Scholar] [CrossRef] [Green Version]
  32. Ávila, A.D.; Carvajal, Y.E.; Justino, F. Representative rainfall thresholds for flash floods in the Cali river Watershed, Colombia. Nat. Hazards Earth Syst. Sci. Discuss. 2015, 3, 4095–4119. [Google Scholar]
  33. Lagouvardos, K.; Kotroni, V.; Dobricic, S.; Nickovic, S.; Kallos, G. On the storm of 21–22 October 1994 over Greece: Observations and model results. J. Geophys. Res. 1996, 101, 26217–26226. [Google Scholar] [CrossRef]
  34. Kotroni, V.; Lagouvardos, K.; Kallos, G.; Ziakopoulos, D. Severe flooding over central and southern Greece associated with pre-cold frontal orographic lifting. Q. J. R. Meteorol. Soc. 1999, 125, 967–991. [Google Scholar] [CrossRef]
  35. Diakakis, M.; Foumelis, M.; Gouliotis, L.; Lekkas, E. Preliminary Flood Hazard and Risk Assessment in Western Athens Metropolitan Area. In Advances in the Research of Aquatic Environment; Environmental Earth Sciences; Lambrakis, N., Stournaras, G., Katsanou, K., Eds.; Springer: Berlin/Heidelberg, Germany, 2011. [Google Scholar] [CrossRef]
  36. Postance, B.; Hillier, J.; Dijkstra, T.; Dixon, N. Comparing threshold definition techniques for rainfall-induced landslides: A national assessment using radar rainfall. Earth Surf. Process. Landf. 2018, 43, 553–560. [Google Scholar] [CrossRef] [Green Version]
  37. Hellenic Statistical Authority, Census 2011. Available online: https://www.statistics.gr/en/2011-census-pop-hous (accessed on 31 December 2021).
  38. Lagouvardos, K.; Kotroni, V.; Bezes, A.; Koletsis, I.; Kopania, T.; Lykoudis, S.; Mazarakis, N.; Papagiannaki, K.; Vougioukas, S. The automatic weather stations noann network of the national observatory of Athens: Operation and database. Geosci. Data J. 2017, 4, 4–16. [Google Scholar] [CrossRef]
  39. Baesens, B.; Van Gestel, T.; Viaene, S.; Stepanova, M.; Suykens, J.; Vanthienen, J. Benchmarking state-of-the-art classification algorithms for credit scoring. J. Oper. Res. Soc. 2003, 54, 627–635. [Google Scholar] [CrossRef]
  40. Medlock, C.; Oppenheim, A. Optimal ROC Curves from Score Variable Threshold Tests. In Proceedings of the ΙΕΕΕ International Conference on Acoustics, Speech and Signal Processing (ΙΕΕΕ ICASSP 2019), Brighton, UK, 12–17 May 2019. [Google Scholar] [CrossRef]
  41. England, W.L. An exponential model used for optimal threshold selection on roc curves. Med. Decis. Making 1988, 8, 120–131. [Google Scholar] [CrossRef] [PubMed]
  42. Arlot, S.; Celisse, A. A survey of cross-validation procedures for model selection. Stat. Surv. 2010, 4, 40–79. [Google Scholar] [CrossRef]
  43. Luque-Fernandez, M.A.Q.; Redondo-Sanchez, D.; Maringe, C. Cross-Validated Area Under the Curve. GitHub Repository. 2019. Available online: https://github.com/migariane/cvauroc (accessed on 31 December 2021).
  44. Allison, P.D. Measures of Fit for Logistic Regression. In Proceedings of the SAS Global Forum, Washington, DC, USA, 23–26 March 2014; Paper 1485. Available online: https://support.sas.com/resources/papers/proceedings14/1485-2014.pdf (accessed on 31 December 2021).
  45. Thiese, M.S.; Ronna, B.; Ott, U. P Value interpretations and considerations. J. Thorac. Dis. 2016, 8, E928–E931. [Google Scholar] [CrossRef] [PubMed] [Green Version]
  46. Kotroni, V.; Lagouvardos, K. Evaluation of MM5 high-resolution real-time forecasts over the urban area of Athens, Greece. J. Appl. Meteorol. 2004, 43, 1666–1678. [Google Scholar] [CrossRef]
  47. Kotroni, V.; Lagouvardos, K. Precipitation forecast skill of different convective parameterization and microphysical schemes: Application for the cold season over Greece. Geophys. Res. Lett. 2001, 28, 1977–1980. [Google Scholar] [CrossRef]
  48. Arnaud, P.; Lavabre, J.; Fouchier, C.; Diss, S.; Javelle, P. Sensitivity of hydrological models to uncertainty of rainfall input. Hydrol. Sci. J. 2011, 56, 397–410. [Google Scholar] [CrossRef]
  49. Maier, R.; Krebs, G.; Pichler, M.; Muschalla, D.; Gruber, G. Spatial rainfall variability in urban environments—High-density precipitation measurements on a city-scale. Water 2020, 12, 1157. [Google Scholar] [CrossRef] [Green Version]
  50. Segoni, S.; Battistini, A.; Rossi, G.; Rosi, A.; Lagomarsino, D.; Catani, F.; Moretti, S.; Casagli, N. Technical note: An operational landslide early warning system at regional scale based on space–time-variable rainfall thresholds. Nat. Hazards Earth Syst. Sci. 2015, 15, 853–861. [Google Scholar] [CrossRef] [Green Version]
  51. Lee, W.Y.; Park, S.K.; Sung, H.H. The optimal rainfall thresholds and probabilistic rainfall conditions for a landslide early warning system for Chuncheon, Republic of Korea. Landslides 2021, 18, 1721–1739. [Google Scholar] [CrossRef]
  52. Kotroni, V.; Lagouvardos, K.; Bezes, A.; Dafis, S.; Galanaki, E.; Giannaros, C.; Giannaros, T.; Karagiannidis, A.; Koletsis, I.; Kopania, T.; et al. Storm naming in the eastern mediterranean: Procedures, events review and impact on the citizens risk perception and readiness. Atmosphere 2021, 12, 1537. [Google Scholar] [CrossRef]
  53. Jauernic, S.T.; van den Broeke, M.S. Tornado warning response and perceptions among undergraduates in Nebraska. Weather Clim. Soc. 2017, 9, 125–139. [Google Scholar] [CrossRef]
  54. Lim, J.R.; Liu, B.F.; Egnoto, M. Cry wolf effect? Evaluating the impact of false alarms on public responses to tornado alerts in the Southeastern United States. Weather Clim. Soc. 2019, 11, 549–563. [Google Scholar] [CrossRef]
  55. Verbakel, J.Y.; Steyerberg, E.W.; Uno, H.; de Cock, B.; Wynants, L.; Collins, G.S.; van Calster, B. Roc curves for clinical prediction models part 1. Roc plots showed no added value above the auc when evaluating the performance of clinical prediction models. J. Clin. Epidemiol. 2020, 126, 207–216. [Google Scholar] [CrossRef]
  56. Young, A.; Bhattacharya, B.; Zevenbergen, C. A rainfall threshold-based approach to early warnings in urban data-scarce regions: A case study of pluvial flooding in Alexandria, Egypt. J. Flood Risk Manag. 2021, 14, e12702. [Google Scholar] [CrossRef]
Figure 1. Location of the meteorological stations in the Athens Metropolitan Area (AMA), highlighting the postal code (PC) boundaries.
Water 14 00994 g001
Figure 2. (a) Frequency distribution (histogram) of R24, at the PC spatial analysis. (b) Distribution (boxplot) of R24 over the binary damage occurrence variable, DO.
Water 14 00994 g002
Figure 3. (a) Fitted values of DO predicted probability as a function of R24 controlled for the population. (b) ROC curve, highlighting the TPR/FPR coordinates related to the AMA optimal R24 threshold given that the difference between TPR and FPR is maximized.
Water 14 00994 g003
Figure 4. Relationship (scatter plot and fit line) between statistical sample size and R24 p-value of the logistic regression models examining the effect of R24 on DO per municipality.
Water 14 00994 g004
Figure 5. Optimal R24 thresholds (mm) above which flood damage is likely to occur, level of flood damage risk (3-color palette), and level of confidence in R24’s discriminating performance, at the municipality level.
Water 14 00994 g005
Table 1. Results for the logistic regression analysis of the probability of damage occurrence (DO) across the PCs of the AMA depending on R24 and controlled for the population.
VariablebSEp Value95% Conf. Interval
R24 13.030.180.0002.683.39
Population 11.510.110.0001.291.72
Intercept−12.870.540.000−13.93−11.80
N = 8726
LR chi2(5) = 498.85
Prob > chi2 = 0.000
Pseudo R2 = 0.08
1 Variables were log-transformed.
Table 2. ROC–AUC cross-validated results for the study area (AMA).
ROC–AUC Metrics
Cross-validated (cv) mean AUC0.64
cvSD AUC0.02
Bootstrap bias corrected 95% CI0.620.66
k-folds8
Table 3. Descriptive statistics (mean, standard deviation (SD), min, max) for PCs, R24–DO pairs, and damage occurrences at the municipality level (Ν = 59).
MeanSDMinMax
R24–DO pairs 1147.9474.173695
Damage occurrences
(i.e., DO = 1)
17.534.70266
% damage16.78.7043
PCs4.811.6190
1 Rainfall events with R24 above 20 mm.
Table 4. Statistics (mean, standard deviation (SD), min, max) of R24–DO pairs, logistic regression results, and ROC–AUC results for the municipalities and the merged ones with significant model performance (Ν = 28).
MeanSDMinMax
R24–DO pairs275673463695
Damage occurrences
(i.e., DO = 1)
31487266
Logistic regression results
R24 coefficient4.161.692.0110.21
R24 p-value0.020.020.000.05
ROC–AUC results 1
AUC (0 to 1)0.680.070.600.85
AUC SE0.070.030.020.13
LCI0.540.090.380.75
HCI0.820.080.681.00
R24 opt. (mm) 240.410.630.478.0
TPR (hit rate, %)68.715.750.0100.0
FPR (false alarm rate, %)32.514.43.059.0
Correctly classified (%)67.911.451.092.0
1 AUC SE: standard error of AUC; LCI/HCI: low/high confidence interval. 2 R24 opt.: optimal R24 threshold for which the difference between TPR and FPR is maximized, given a TPR equal to or higher than 50%.
Table 5. Specifications for the classification of flood damage risk and confidence in discriminating performance of the estimated R24 thresholds.
Flood Damage Risk ClassificationConfidence Classification
ClassR24 opt. (mm)Corresponding PercentileAUC (%)Corresponding Percentile
1—low>5690th60–70Minimum–68th
2—moderate42–5675th–90th70–8068th–93th
3—high30–42Minimum–75th>80>93th
Table 6. Selected R24 thresholds for damage occurring in the municipality of Athens for different trade-offs among TPR and FPR.
R24 (mm)TPR (Hit Rate)
%
FPR (False Alarm Rate) %Correctly Classified
%
35.060.240.359.7
41.8 150.425.772.6
50.440.216.580.4
1 Optimal R24 threshold for which the difference between TPR and FPR is maximized.
Publisher’s Note: MDPI stays neutral with regard to jurisdictional claims in published maps and institutional affiliations.

