
Flood Risk Perception and Its Attributes among Rural Households under Developing Country Conditions: The Case of Pakistan

 ,
, 
 , and
, and 
Abstract
:1. Introduction
1.1. Theoretical Underpinning of Risk Perception
1.2. Research Objectives and Questions
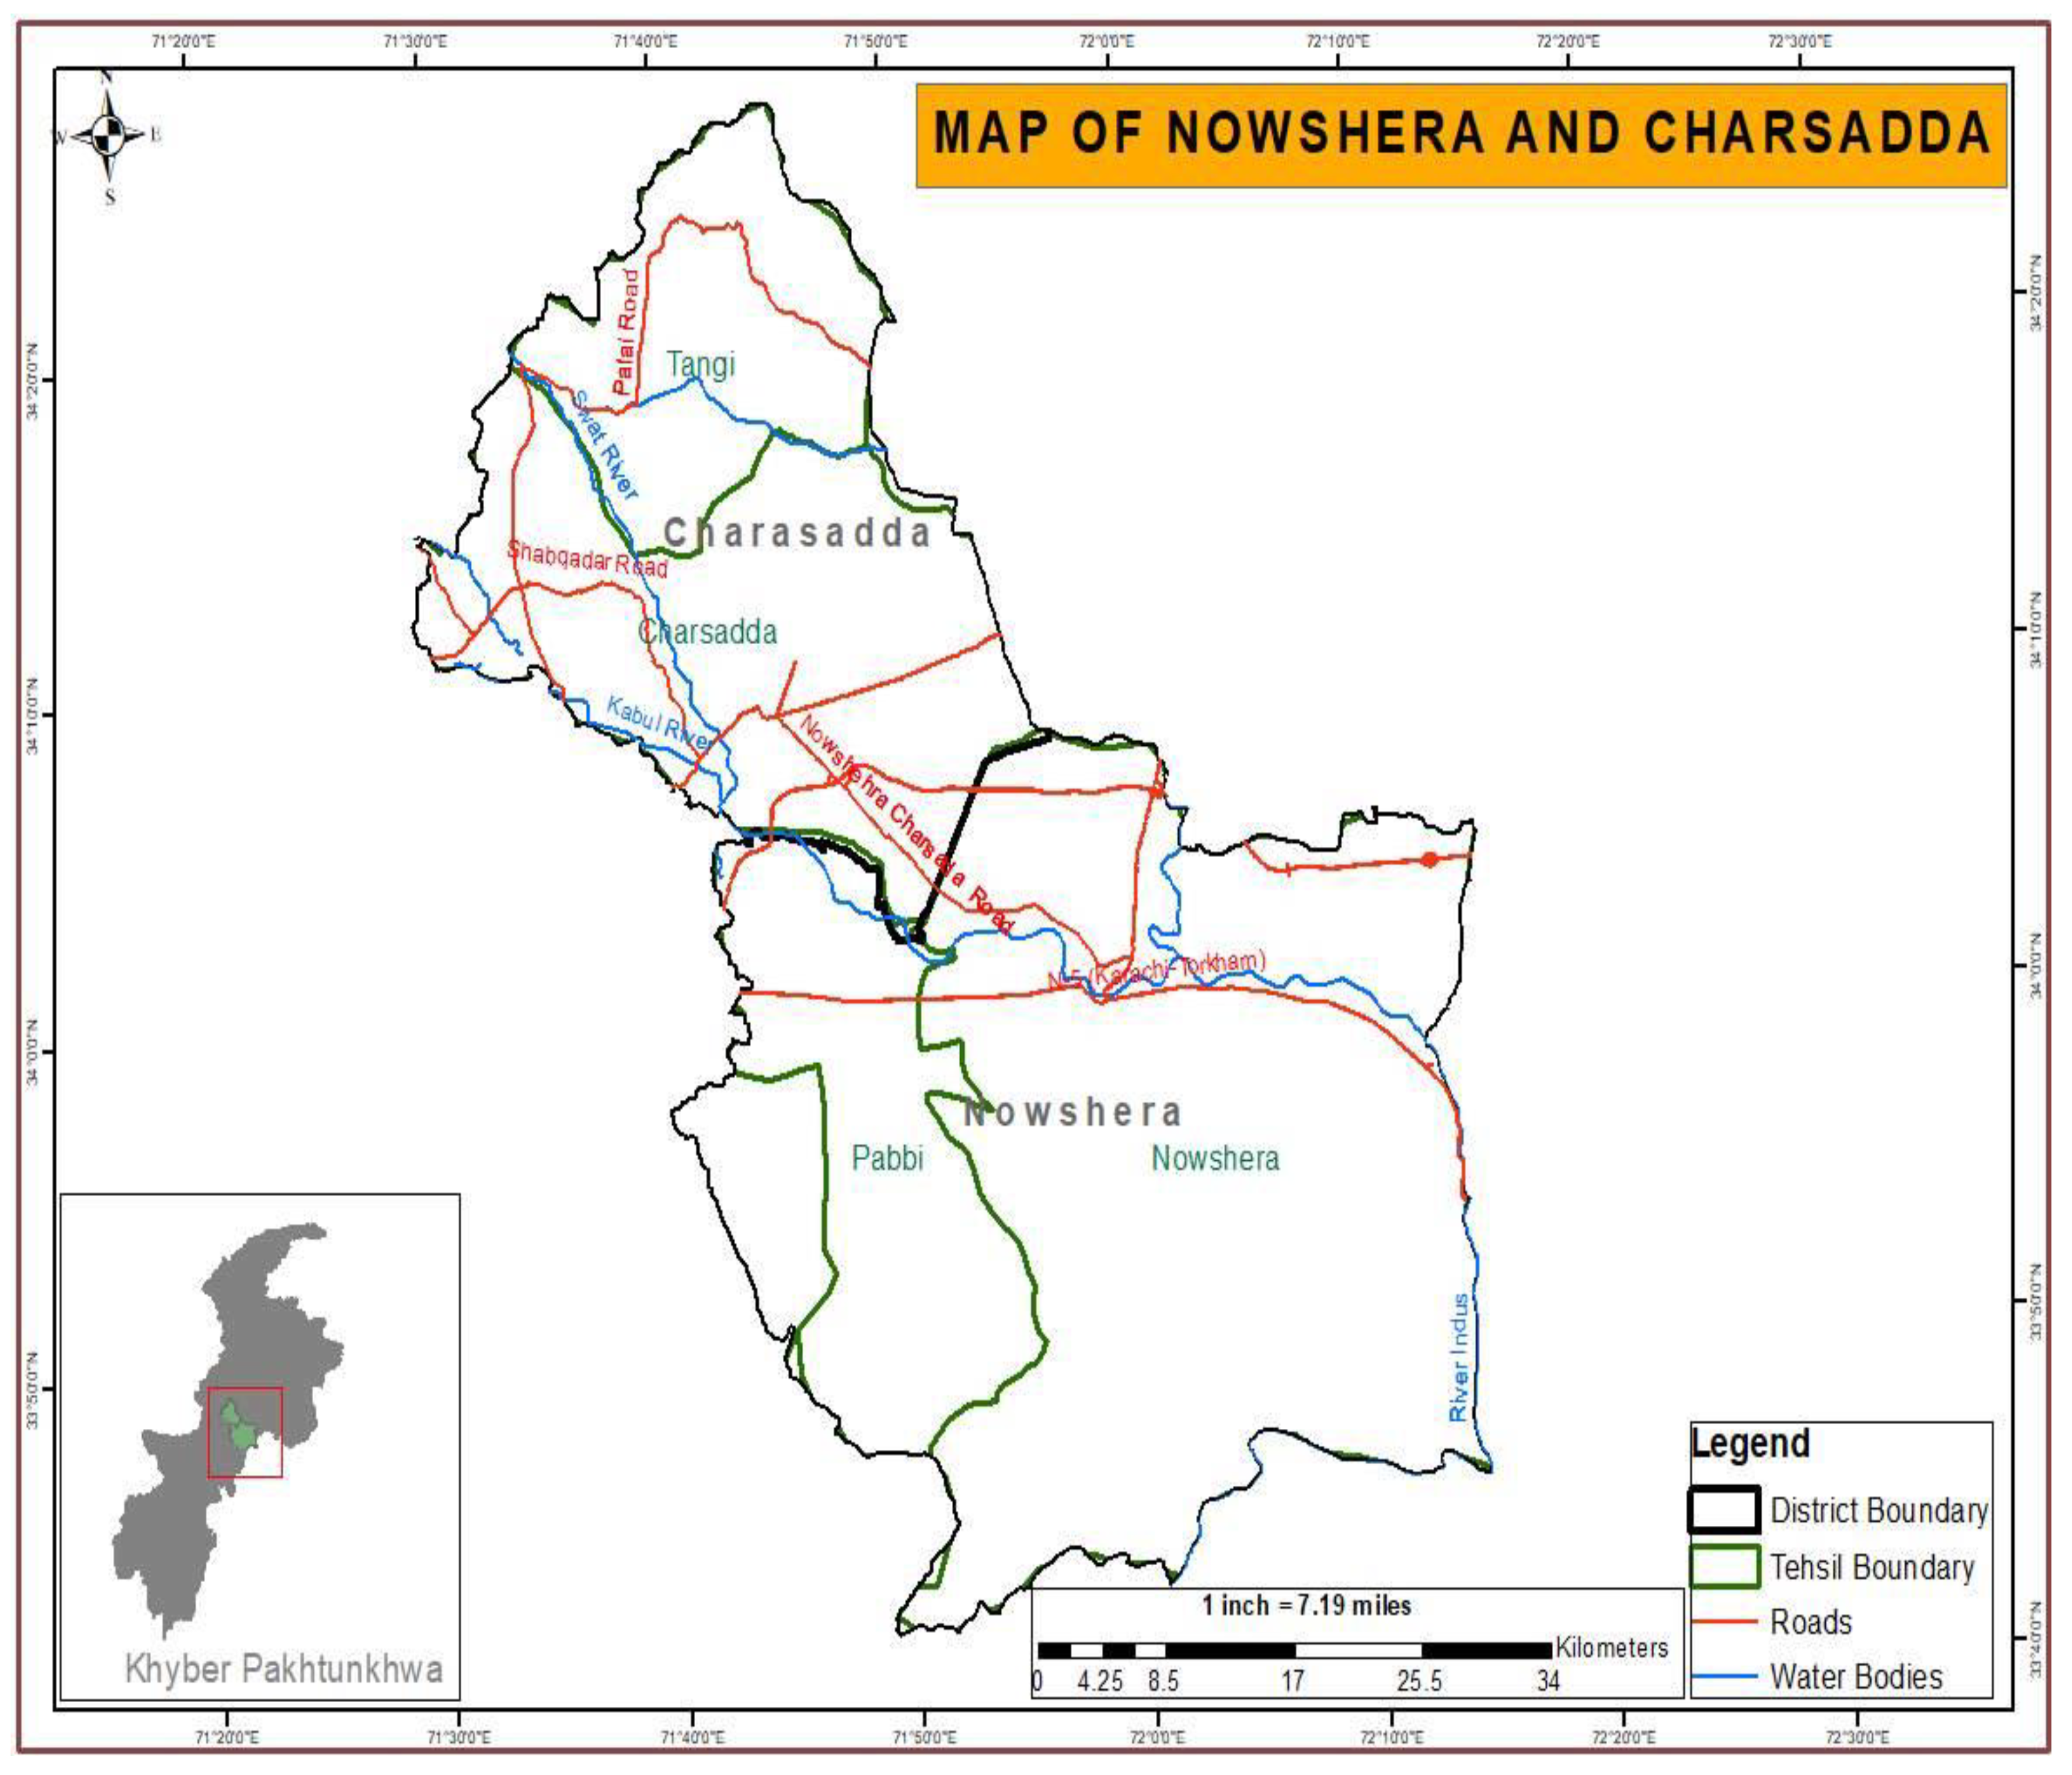
- To investigate the flood risk perception among rural households in two severely affected regions (namely Charsadda and Nowshera) in Khyber Pakhtunkhwa province, Pakistan;
- To look at the determinants that could influence rural household flood risk perception in two severely affected regions (namely Charsadda and Nowshera);
- What are the major risks experienced by the rural households in the study areas?
- What is the level of different risk sources among rural households?
- What factors influence and shape rural households’ perceptions regarding flood risks?
- How do flood risk perceptions differ among different groups based on socioeconomic characteristics, including age, education, and monthly income of the household head?
2. Materials and Methods
2.1. Study Area Description
2.2. Sampling Procedure and Data Collection
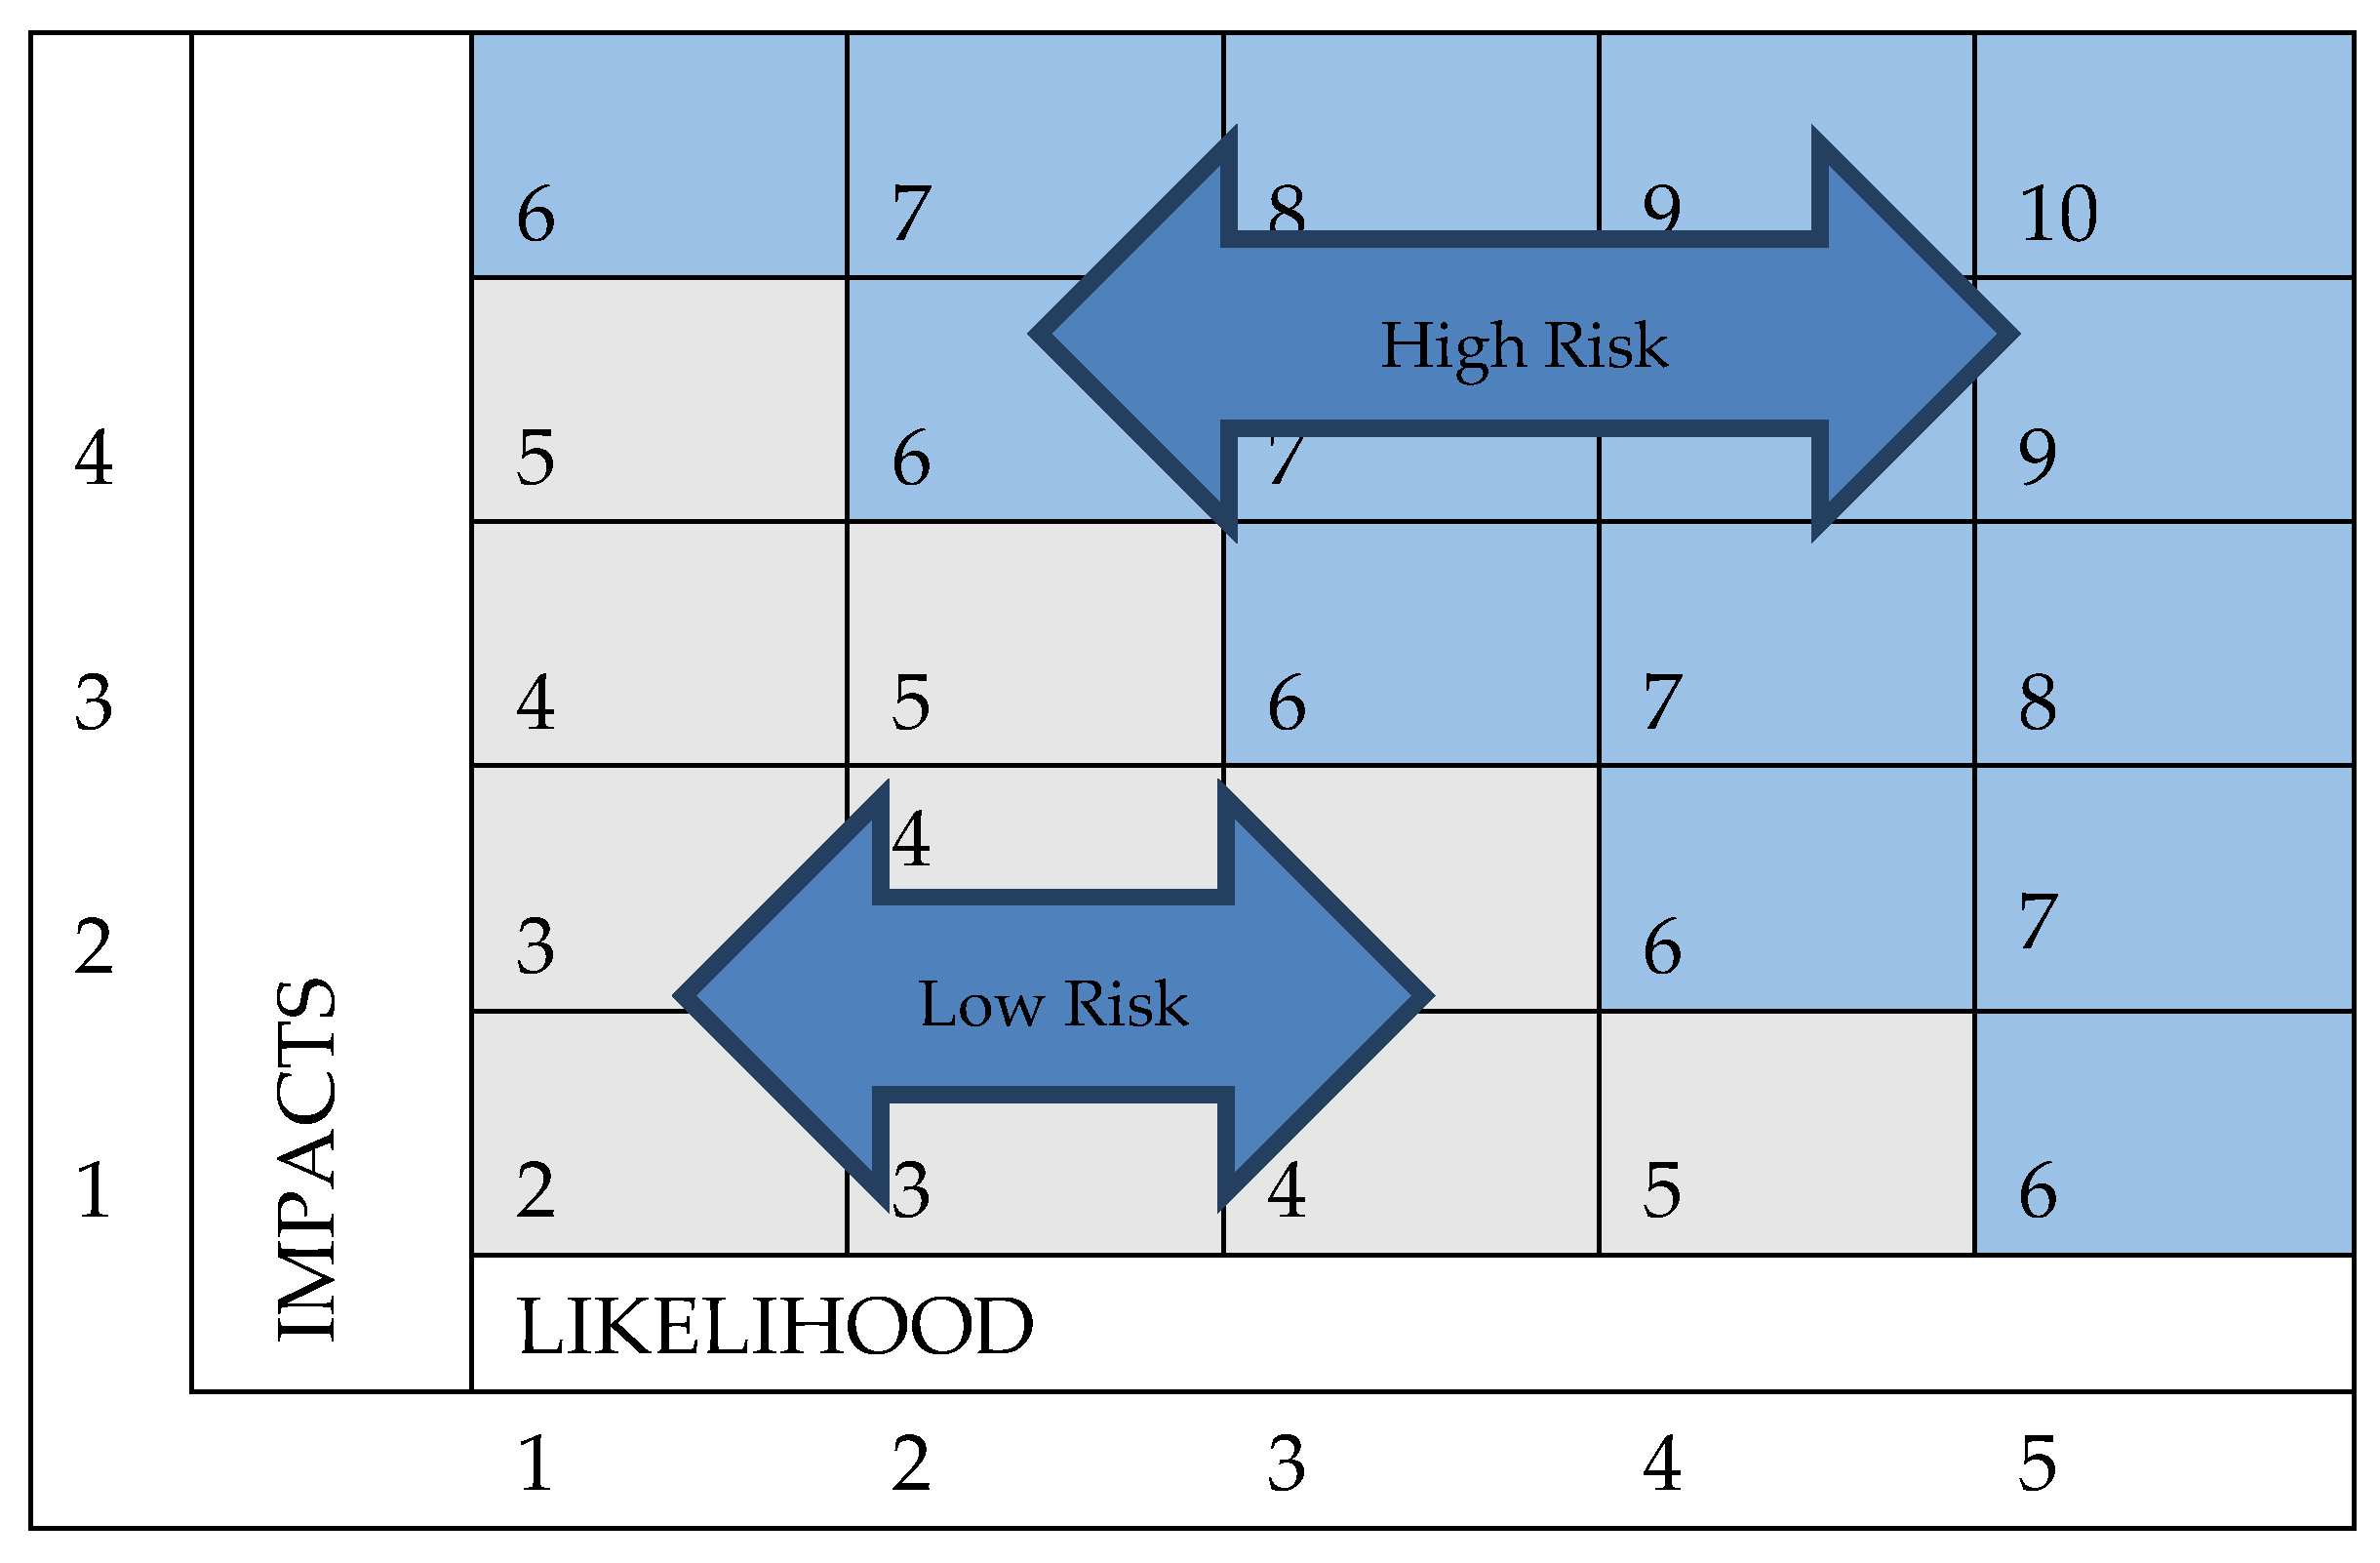
2.3. Risk Matrix Used for Rural Household’s Flood Risk Perception—Objective 1
2.4. Variable’s Selection and Description

| Variables | Description |
|---|---|
| Flood incidence | Likert scale 1 = very low to 5 = very high |
| Flood impact | Likert scale 1 = very low to 5 = very high |
| Flood risk perception (pooled) | 1 = high flood risk perception (score range 6–10); and 0, otherwise (score range 2–5) |
| Age (years) | Household head age |
| Education (Years) | Schooling years |
| Monthly income | Monthly household income in local currency (PKR) |
| Family size (numbers) | Total family members per family |
| House ownership | 1 = owner; and 0, otherwise |
| Past floods experience | 1 = past flooding experience and 0, otherwise |
| Distance from the nearest river source | Measure in Kilometers (km) |
| Credit sources | Household’s access to credit sources (1 = access to credit sources, 0 = otherwise) |
| Information sources | Household’s access to information sources (1 = access to information sources, 0 = otherwise) |
2.5. Empirical Modelling for Flood Risk Perception Attributes—Objective 2
3. Results
3.1. Descriptive Statistics of the Study
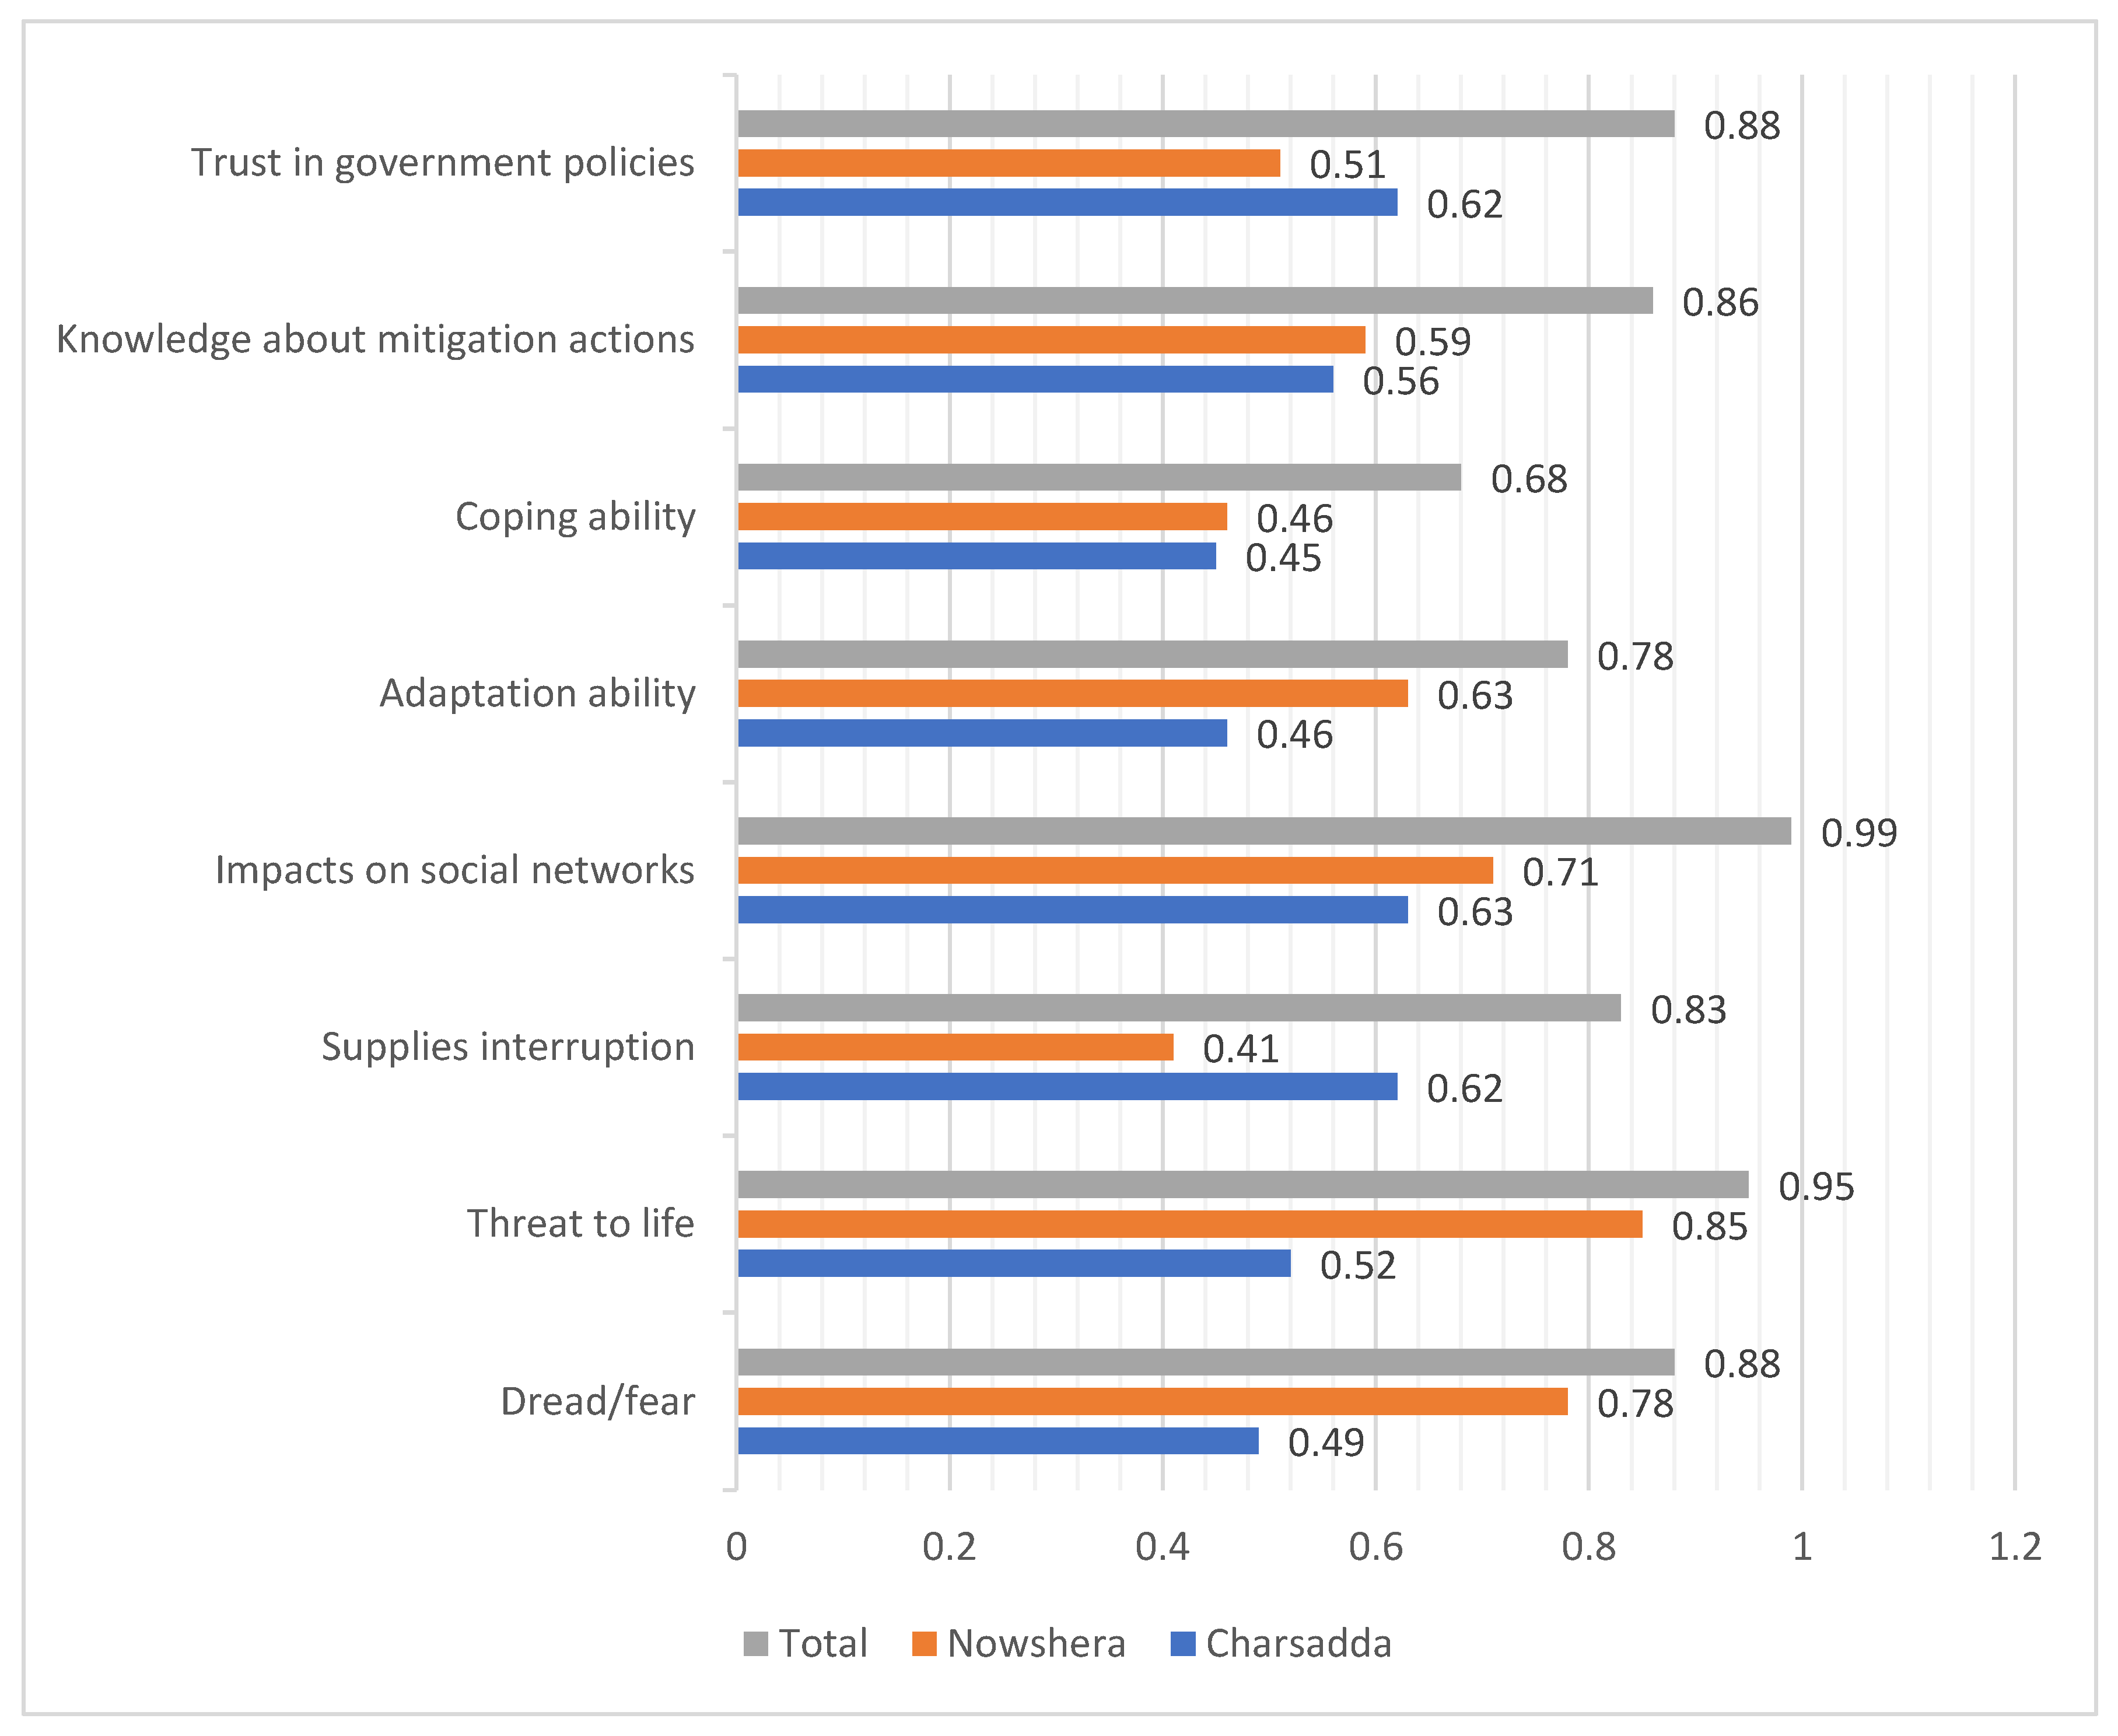
3.2. Major Risks Experienced by the Rural Households in the Study Areas
3.3. Rural Household’s Flood Risk Perception
3.4. Important Attributes That Could Influence Households Flood Risk Perception
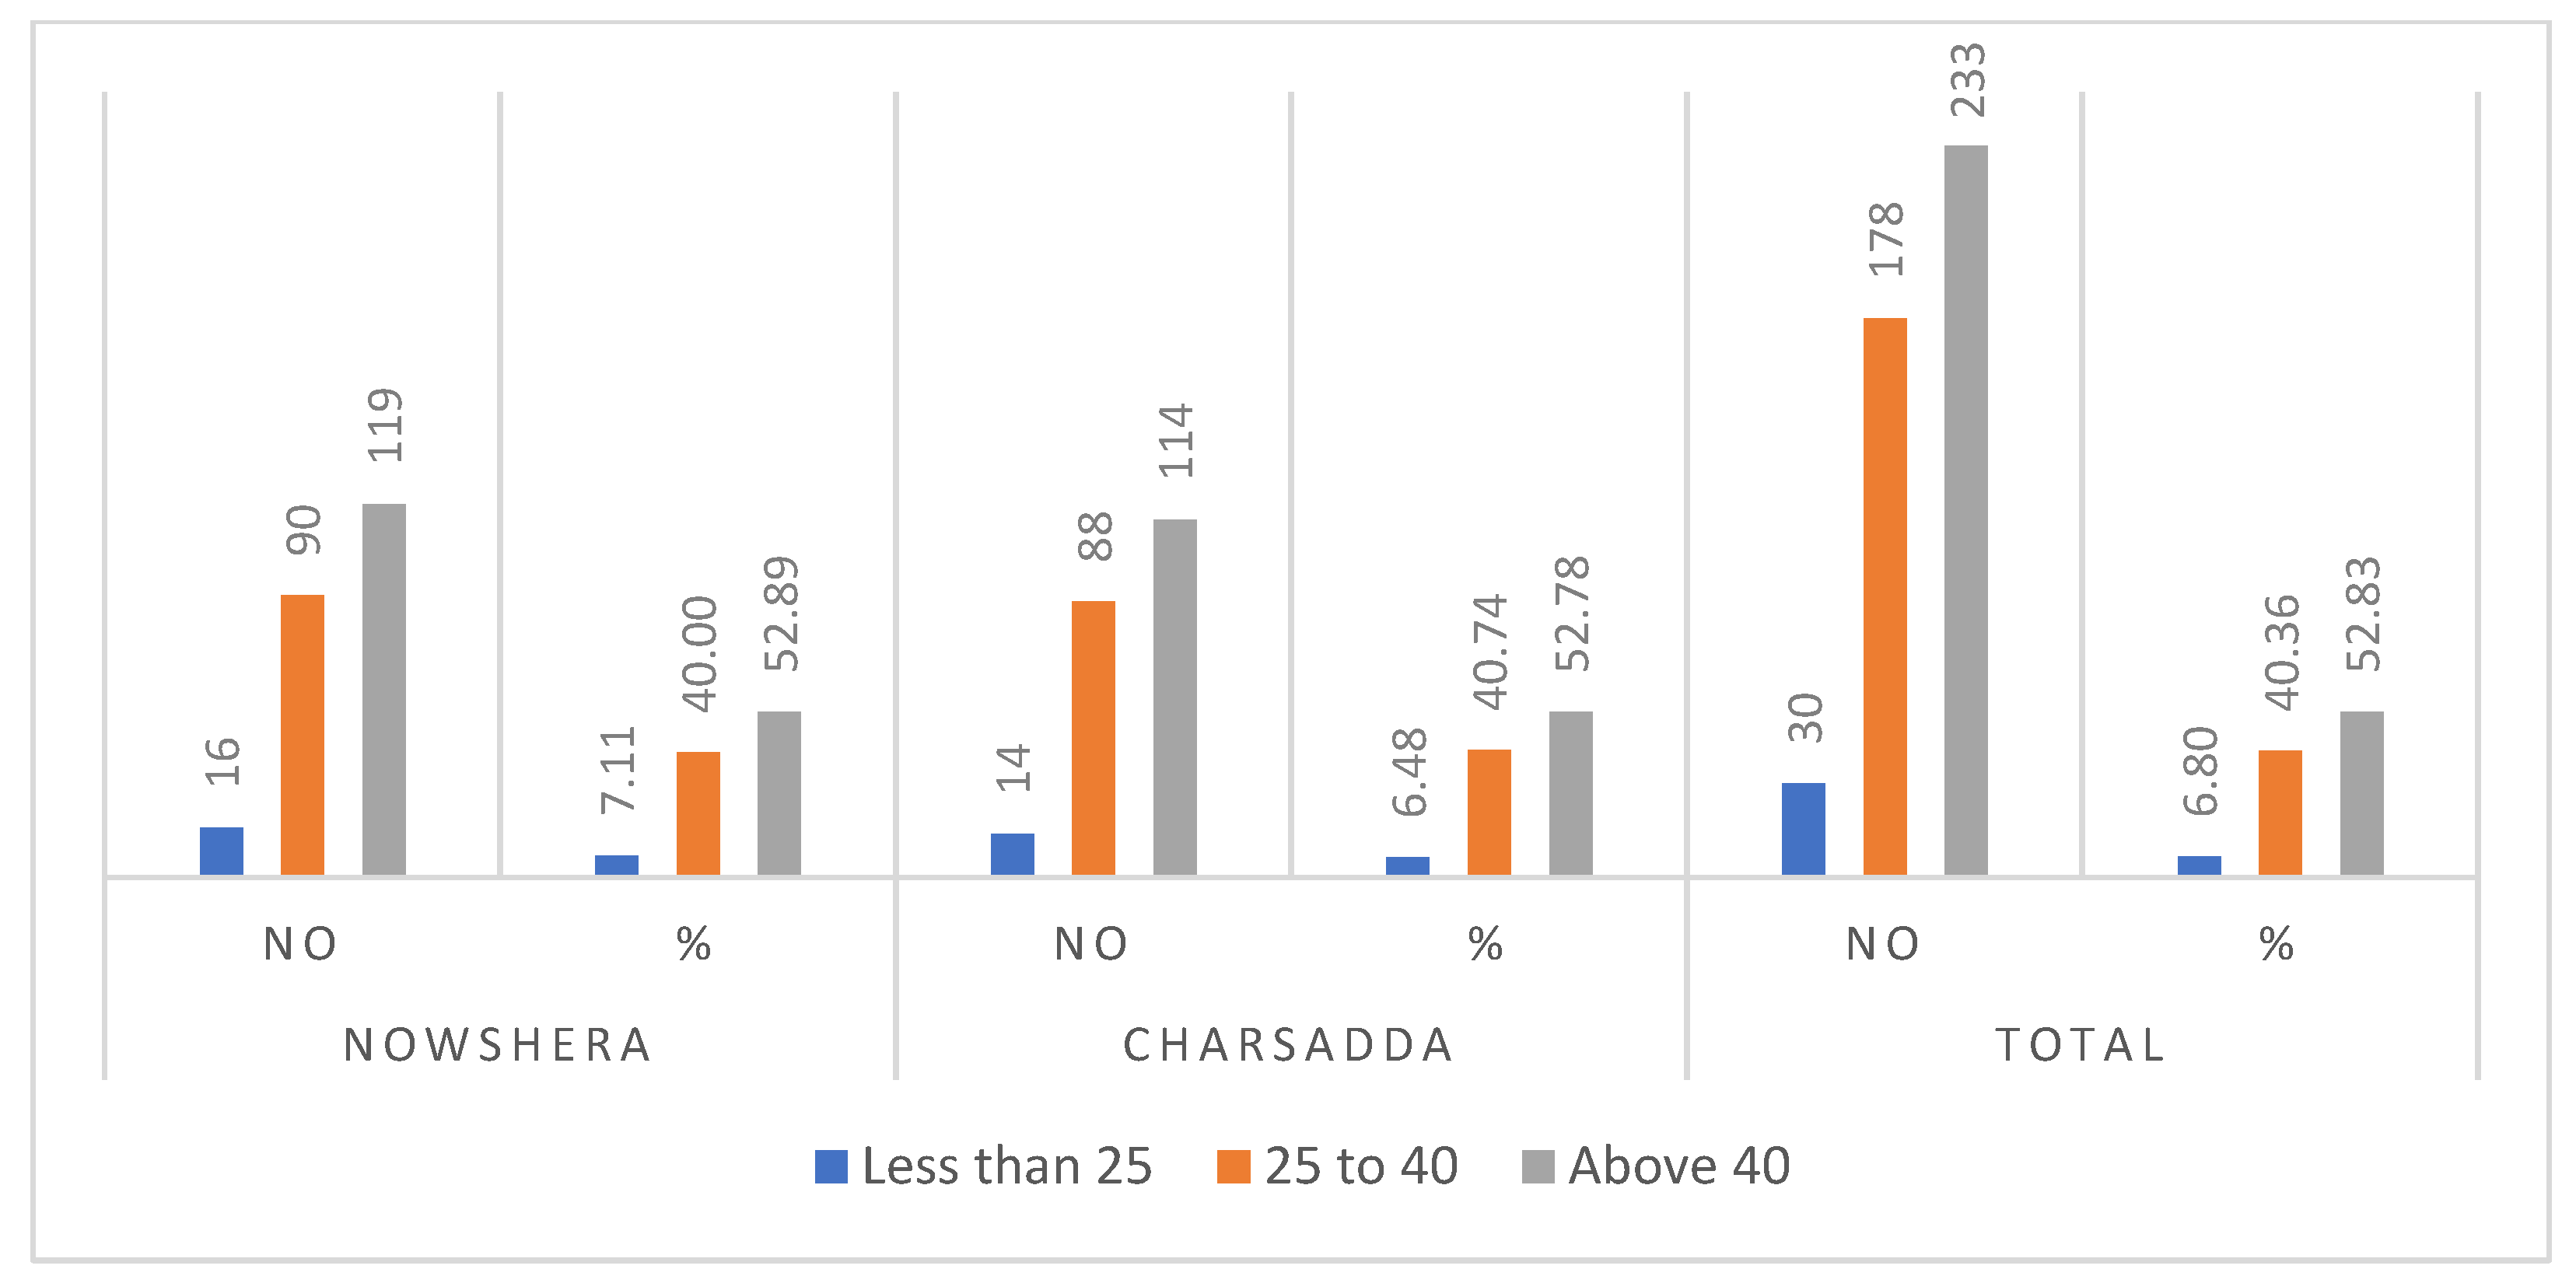
3.5. Flood Risk Perception across Regions and Socioeconomic Characteristics Categories
4. Discussion
5. Conclusions and Policy Implications
Author Contributions
Funding
Institutional Review Board Statement
Informed Consent Statement
Data Availability Statement
Acknowledgments
Conflicts of Interest
References
- Shah, A.A.; Ye, J.; Abid, M.; Khan, J.; Amir, S.M. Flood hazards: Household vulnerability and resilience in disaster-prone districts of Khyber Pakhtunkhwa province, Pakistan. Nat. Hazards 2018, 93, 147–165. [Google Scholar] [CrossRef]
- Wilkinson, E.; Brenes, A. Risk-Informed Decision-Making: An Agenda for Improving Risk Assessments under HFA2; Climate and Development Knowledge Network (CDKN) Learning Network on the Use of Climate and Disaster Risk Assessments Project: London, UK, 2014; Available online: https://cdkn.org/sites/default/files/files/CDKN-Guide_RiskAssessment_FINAL_WEB.pdf (accessed on 22 January 2022).
- Doocy, S.; Daniels, A.; Murray, S.; Kirsch, T.D. The Human Impact of Floods: A Historical Review of Events 1980–2009 and Systematic Literature Review. PLoS Curr. 2013, 5, e39. [Google Scholar] [CrossRef] [PubMed]
- Guha-Sapir, D.; Vos, F.; Below, R.; Ponserre, S. Annual Disaster Statistical Review 2011: The Numbers and Trends; Centre for Research on the Epidemiology of Disasters (CRED) Institute of Health and Society (IRSS) Université Catholique de Louvain: Brussels, Belgium, 2012; Available online: http://www.cred.be/sites/default/files/ADSR_2011.pdf (accessed on 22 January 2022).
- García-Soriano, D.; Quesada-Román, A.; Zamorano-Orozco, J.J. Geomorphological hazards susceptibility in high-density urban areas: A case study of Mexico City. J. S. Am. Earth Sci. 2020, 102, 102667. [Google Scholar] [CrossRef]
- Quesada-Román, A.; Villalobos-Portilla, E.; Campos-Durán, D.J.E.H. Hydrometeorological Disasters in Urban Areas of Costa Rica, Central America. Environ. Hazards 2021, 20, 264–278. [Google Scholar] [CrossRef]
- Quesada-Román, A.; Villalobos-Chacón, A. Flash Flood Impacts of Hurricane Otto and Hydrometeorological Risk Mapping in Costa Rica. Geogr. Tidsskr.-Dan. J. Geogr. 2020, 120, 142–155. [Google Scholar] [CrossRef]
- Eckstein, D.; Künzel, V.; Schäfer, L.; Winges, M.J.B.G. Global Climate Risk Index 2020; Germanwatch: Bonn, Germany, 2019; Available online: www.germanwatch.org/en/cri (accessed on 22 January 2022).
- Shah, A.A.; Ye, J.; Abid, M.; Ullah, R. Determinants of flood risk mitigation strategies at household level: A case of Khyber Pakhtunkhwa (KP) province, Pakistan. Nat. Hazards 2017, 88, 415–430. [Google Scholar] [CrossRef]
- Ali, A. Indus Basin floods: Mechanisms, Impacts, and Management; Asian Development Bank: Mandaluyong City, Philippines, 2013; Available online: https://think-asia.org/bitstream/handle/11540/810/indus-basin-floods.pdf?sequence=1 (accessed on 22 January 2022).
- Shah, A.A.; Shaw, R.; Ye, J.; Abid, M.; Amir, S.M.; Pervez, A.K.M.K.; Naz, S. Current capacities, preparedness and needs of local institutions in dealing with disaster risk reduction in Khyber Pakhtunkhwa, Pakistan. Int. J. Disaster Risk Reduct. 2018, 34, 165–172. [Google Scholar] [CrossRef]
- Shah, A.A.; Wu, W.; Gong, Z.; Pal, I.; Khan, J. Multidimensional six-stage model for flood emergency response in schools: A case study of Pakistan. Nat. Hazards 2020, 105, 1977–2005. [Google Scholar] [CrossRef]
- Shah, A.A.; Ye, J.; Lu Pan, R.U.; Shah, S.I.A.; Fahad, S.; Naz, S. Schools’ Flood Emergency Preparedness in Khyber Pakhtunkhwa Province, Pakistan. Int. J. Disaster Risk Sci. 2018, 9, 181–194. [Google Scholar] [CrossRef] [Green Version]
- Shah, A.A.; Ye, J.; Shaw, R.; Ullah, R.; Ali, M. Factors affecting flood-induced household vulnerability and health risks in Pakistan: The case of Khyber Pakhtunkhwa (KP) Province. Int. J. Disaster Risk Reduct. 2020, 42, 1–8. [Google Scholar] [CrossRef]
- Shaw, R. Hazard, vulnerability and risk: The Pakistan context. In Disaster Risk Reduction Approaches in Pakistan; Springer: Berlin/Heidelberg, Germany, 2015; pp. 31–52. [Google Scholar]
- Shah, A.A.; Gong, Z.; Ali, M.; Jamshed, A.; Naqvi, S.A.A.; Naz, S. Measuring education sector resilience in the face of flood disasters in Pakistan: An index-based approach. Environ. Sci. Pollut. Res. 2020, 27, 44106–44122. [Google Scholar] [CrossRef] [PubMed]
- Rana, I.A.; Jamshed, A.; Younas, Z.I.; Bhatti, S.S. Characterizing flood risk perception in urban communities of Pakistan. Int. J. Disaster Risk Reduct. 2020, 46, 1–10. [Google Scholar] [CrossRef]
- Birkholz, S.; Muro, M.; Jeffrey, P.; Smith, H. Rethinking the relationship between flood risk perception and flood management. Sci. Total Environ. 2014, 478, 12–20. [Google Scholar] [CrossRef] [PubMed]
- Ainuddin, S.; Routray, J.K.; Ainuddin, S. People’s Risk Perception in Earthquake Prone Quetta City of Baluchistan. Int. J. Disaster Risk Reduct. 2014, 7, 165–175. [Google Scholar] [CrossRef]
- Slovic, P.; Kunreuther, H.; White, G.F. Decision Processes, Rationality and Adjustment to Natural Hazards. In The Perception of Risk; Routledge: London, UK, 1973; pp. 39–69. Available online: https://scholarsbank.uoregon.edu/xmlui/bitstream/handle/1794/22308/slovic_049.pdf?sequence=1&isAllowed=y (accessed on 22 January 2022).
- Ullah, F.; Saqib, S.E.; Ahmad, M.M.; Fadlallah, M.A. Flood risk perception and its determinants among rural households in two communities in Khyber Pakhtunkhwa, Pakistan. Nat. Hazards 2020, 104, 225–247. [Google Scholar] [CrossRef]
- Terpstra, T.; Gutteling, J.M.; Geldof, G.; Kappe, B. The perception of flood risk and water nuisance. Water Sci. Technol. 2006, 54, 431–439. [Google Scholar] [CrossRef] [PubMed]
- Zaalberg, R.R.; Midden, C.C.; Meijnders, A.A.; McCalley, L.L. Prevention, Adaptation, and Threat Denial: Flooding Experiences in the Netherlands. Risk Anal. 2009, 29, 1759–1778. [Google Scholar] [CrossRef] [PubMed]
- Bradford, R.A.; O’Sullivan, J.J.; van der Craats, I.M.; Krywkow, J.; Rotko, P.; Aaltonen, J.; Bonaiuto, M.; de Dominicis, S.; Waylen, K.; Schelfaut, K. Risk Perception—Issues for Flood Management in Europe. Nat. Hazards Earth Syst. Sci. 2012, 12, 2299–2309. [Google Scholar] [CrossRef]
- Duží, B.; Vikhrov, D.; Kelman, I.; Stojanov, R.; Juřička, D. Household Measures for River Flood Risk Reduction in the Czech Republic. J. Flood Risk Manag. 2017, 10, 253–266. [Google Scholar] [CrossRef]
- Krasovskaia, I.; Gottschalk, L.; Sælthun, N.R.; Berg, H. Perception of the risk of flooding: The case of the 1995 flood in Norway. Hydrol. Sci. J. 2001, 46, 855–868. [Google Scholar] [CrossRef] [Green Version]
- Raikes, J.; Smith, T.F.; Jacobson, C.; Baldwin, C. Pre-disaster planning and preparedness for floods and droughts: A systematic review. Int. J. Disaster Risk Reduct. 2019, 38, 1–9. [Google Scholar] [CrossRef]
- Fuchs, S.; Thaler, T. (Eds.) Vulnerability and Resilience to Natural Hazards; Cambridge University Press: Cambridge, MA, USA, 2018. [Google Scholar] [CrossRef] [Green Version]
- Starr, C. Social Benefit Versus Technological Risk: What is Our Society Willing to Pay for Safety? Science 2018, 165, 136–152. [Google Scholar] [CrossRef] [PubMed]
- Starr, C. Benefit-Cost Studies in Sociotechnical Systems; Perspectives on Benefit-Risk Decision Malting, Committee on Public Engineering Policy; National Academy of Engineering: Washington, DC, USA, 1972; pp. 17–42. [Google Scholar]
- Fischhoff, B.; Slovic, P.; Lichtenstein, S.; Read, S.; Combs, B. How safe is safe enough? A psychometric study of attitudes towards technological risks and benefits. Policy Sci. 1978, 9, 127–152. [Google Scholar] [CrossRef]
- Tversky, A.; Kahneman, D. Probability, Representativeness, and the Conjunction Fallacy. Psychol. Rev. 1983, 90, 293–315. [Google Scholar] [CrossRef]
- Qasim, S.; Khan, A.N.; Shrestha, R.P.; Qasim, M. Risk perception of the people in the flood prone Khyber Pukhthunkhwa province of Pakistan. Int. J. Disaster Risk Reduct. 2015, 14, 373–378. [Google Scholar] [CrossRef]
- Douglas, M. Risk Acceptability According to the Social Sciences [Social Research Perspectives, Occasional Reports on Current Topics, No. 11.]. J. Mind Behav. 1987, 8, 11. [Google Scholar]
- Tierney, K.J. Toward a critical sociology of risk. In Sociological Forum; Kluwer Academic Publishers-Plenum Publishers: Dordrecht, The Netherlands, 1999; Volume 14, pp. 215–242. [Google Scholar]
- Weichselgartner, J. Disaster Mitigation: The Concept of Vulnerability Revisited. Disaster Prev. Manag. Int. J. 2001, 10, 85–95. [Google Scholar] [CrossRef]
- Robbins, T.; Douglas, M.; Wildavsky, A. Risk and Culture: An Essay on the Selection of Technical and Environmental Dangers. J. Sci. Study Relig. 1983, 22, 188. [Google Scholar] [CrossRef]
- Burton, I.; Kates, R.W.J.N.R.J. The Perception of Natural Hazards in Resource Management. Nat. Resour. J. 1963, 3, 412. [Google Scholar]
- Wachinger, G.; Renn, O.; Begg, C.; Kuhlicke, C. The Risk Perception Paradox-Implications for Governance and Communication of Natural Hazards. Risk Anal. 2012, 33, 1049–1065. [Google Scholar] [CrossRef]
- Aerts, J.C.J.H.; Botzen, W.J.; Clarke, K.; Cutter, S.L.; Hall, J.W.; Merz, B.; Michel-Kerjan, E.; Mysiak, J.; Surminski, S.; Kunreuther, H. Integrating human behaviour dynamics into flood disaster risk assessment. Nat. Clim. Chang. 2018, 8, 193–199. [Google Scholar] [CrossRef] [Green Version]
- Lechowska, E. What determines flood risk perception? A review of factors of flood risk perception and relations between its basic elements. Nat. Hazards 2018, 94, 1341–1366. [Google Scholar] [CrossRef] [Green Version]
- Mind’je, R.; Li, L.; Amanambu, A.C.; Nahayo, L.; Nsengiyumva, J.B.; Gasirabo, A.; Mindje, M. Flood susceptibility modeling and hazard perception in Rwanda. Int. J. Disaster Risk Reduct. 2019, 38, 1–12. [Google Scholar] [CrossRef]
- Sullivan-Wiley, K.A.; Gianotti, A.G.S. Risk Perception in a Multi-Hazard Environment. World Dev. 2017, 97, 138–152. [Google Scholar] [CrossRef]
- Miceli, R.; Sotgiu, I.; Settanni, M. Disaster preparedness and perception of flood risk: A study in an alpine valley in Italy. J. Environ. Psychol. 2008, 28, 164–173. [Google Scholar] [CrossRef]
- Kellens, W.; Terpstra, T.; De Maeyer, P. Perception and Communication of Flood Risks: A Systematic Review of Empirical Research. Risk Anal. 2012, 33, 24–49. [Google Scholar] [CrossRef] [Green Version]
- Kellens, W.; Zaalberg, R.; Neutens, T.; Vanneuville, W.; De Maeyer, P. An Analysis of the Public Perception of Flood Risk on the Belgian Coast. Risk Anal. 2011, 31, 1055–1068. [Google Scholar] [CrossRef] [PubMed] [Green Version]
- Peacock, W.G.; Brody, S.D.; Highfield, W.J.L. Hurricane Risk Perceptions among Florida’s Single Family Homeowners. Landsc. Urban Plan. 2005, 73, 120–135. [Google Scholar] [CrossRef]
- Gotham, K.F.; Campanella, R.; Lauve-Moon, K.; Powers, B. Hazard Experience, Geophysical Vulnerability, and Flood Risk Perceptions in a Postdisaster City, the Case of New Orleans. Risk Anal. 2017, 38, 345–356. [Google Scholar] [CrossRef]
- Babcicky, P.; Seebauer, S. The Two Faces of Social Capital in Private Flood Mitigation: Opposing Effects on Risk Perception, Self-Efficacy and Coping Capacity. J. Risk Res. 2017, 20, 1017–1037. [Google Scholar] [CrossRef] [Green Version]
- Botzen, W.J.W.; Aerts, J.C.J.H.; Bergh, J.C.J.M.V.D. Dependence of flood risk perceptions on socioeconomic and objective risk factors. Water Resour. Res. 2009, 45, 7743. [Google Scholar] [CrossRef] [Green Version]
- O’Neill, E.; Brereton, F.; Shahumyan, H.; Clinch, J.P. The Impact of Perceived Flood Exposure on Flood-Risk Perception: The Role of Distance. Risk Anal. 2016, 36, 2158–2186. [Google Scholar] [CrossRef] [PubMed]
- Lindell, M.K.; Hwang, S.N. Households’ Perceived Personal Risk and Responses in a Multihazard Environment. Risk Anal. 2008, 28, 539–556. [Google Scholar] [CrossRef]
- Franklin, R.C.; King, J.C.; Aitken, P.J.; Leggat, P. “Washed Away”—Assessing Community Perceptions of Flooding and Prevention Strategies: A North Queensland Example. Nat. Hazards 2014, 73, 1977–1998. [Google Scholar] [CrossRef]
- Haas, P.M. Emerging Forces in Environmental Governance (no. 333.72 E43); United Nations University Press: Tokyo, Japan, 2004; Available online: https://archive.unu.edu/unupress/sample-chapters/EmergingForces.pdf (accessed on 22 January 2022).
- Rahman, A.-U. (Ed.) Disaster Risk Management: Flood Perspective; VDM Verlag Publishing Co. Ltd.: Berlin, Germany, 2010. [Google Scholar]
- Shah, A.A.; Gong, Z.; Ali, M.; Sun, R.; Naqvi, S.A.A.; Arif, M. Looking through the Lens of schools: Children perception, knowledge, and preparedness of flood disaster risk management in Pakistan. Int. J. Disaster Risk Reduct. 2020, 50, 101907. [Google Scholar] [CrossRef]
- Birkmann, J. Measuring vulnerability to promote disaster-resilient societies: Conceptual frameworks and definitions. In Measuring Vulnerability to Natural Hazards: Towards Disaster Resilient Societies; United Nations University Press: Tokyo, Japan, 2006; Volume 1, pp. 9–54. [Google Scholar]
- Ogurtsov, V.; Van Asseldonk, M.; Huirne, R. Assessing and modelling catastrophic risk perceptions and attitudes in agriculture: A review. NJAS—Wagening. J. Life Sci. 2008, 56, 39–58. [Google Scholar] [CrossRef] [Green Version]
- Grothmann, T.; Reusswig, F. People at Risk of Flooding: Why Some Residents Take Precautionary Action While Others Do Not. Nat. Hazards 2006, 38, 101–120. [Google Scholar] [CrossRef]
- Masozera, M.; Bailey, M.; Kerchner, C. Distribution of impacts of natural disasters across income groups: A case study of New Orleans. Ecol. Econ. 2007, 63, 299–306. [Google Scholar] [CrossRef]
- Ullah, R.; Shivakoti, G.P.; Ali, G. Factors Effecting Farmers’ Risk Attitude and Risk Perceptions: The Case of Khyber Pakhtunkhwa, Pakistan. Int. J. Disaster Risk Reduct. 2015, 13, 151–157. [Google Scholar] [CrossRef]
- Raaijmakers, R.; Krywkow, J.; Van Der Veen, A. Flood risk perceptions and spatial multi-criteria analysis: An exploratory research for hazard mitigation. Nat. Hazards 2008, 46, 307–322. [Google Scholar] [CrossRef] [Green Version]
- Koks, E.E.; Jongman, B.; Husby, T.G.; Botzen, W.J. Combining hazard, exposure and social vulnerability to provide lessons for flood risk management. Environ. Sci. Policy 2015, 47, 42–52. [Google Scholar] [CrossRef]
- Viglione, A.; Di Baldassarre, G.; Brandimarte, L.; Kuil, L.; Carr, G.; Salinas, J.L.; Scolobig, A.; Blöschl, G. Insights from socio-hydrology modelling on dealing with flood risk–roles of collective memory, risk-taking attitude and trust. J. Hydrol. 2014, 518, 71–82. [Google Scholar] [CrossRef]
- Paul, S.K.; Routray, J.K. Household response to cyclone and induced surge in coastal Bangladesh: Coping strategies and explanatory variables. Nat. Hazards 2011, 57, 477–499. [Google Scholar] [CrossRef]
- Wang, Z.; Wang, H.; Huang, J.; Kang, J.; Han, D. Analysis of the Public Flood Risk Perception in a Flood-Prone City: The Case of Jingdezhen City in China. Water 2018, 10, 1577. [Google Scholar] [CrossRef] [Green Version]
- Perić, J.; Cvetković, V.M. Demographic, socio-economic and phycological perspective of risk perception from disasters caused by floods: Case study Belgrade. Int. J. Disaster Risk Manag. 2019, 1, 31–45. [Google Scholar] [CrossRef]
- Siegrist, M.; Gutscher, H. Flooding risks: A comparison of lay people’s perceptions and expert’s assessments in Switzerland. Risk Anal. 2006, 26, 971–979. [Google Scholar] [CrossRef]
- Rowe, G.; Wright, G. Differences in Expert and Lay Judgments of Risk: Myth or Reality? Risk Anal. 2001, 21, 341–356. [Google Scholar] [CrossRef]


| Variables | Mean | SD |
|---|---|---|
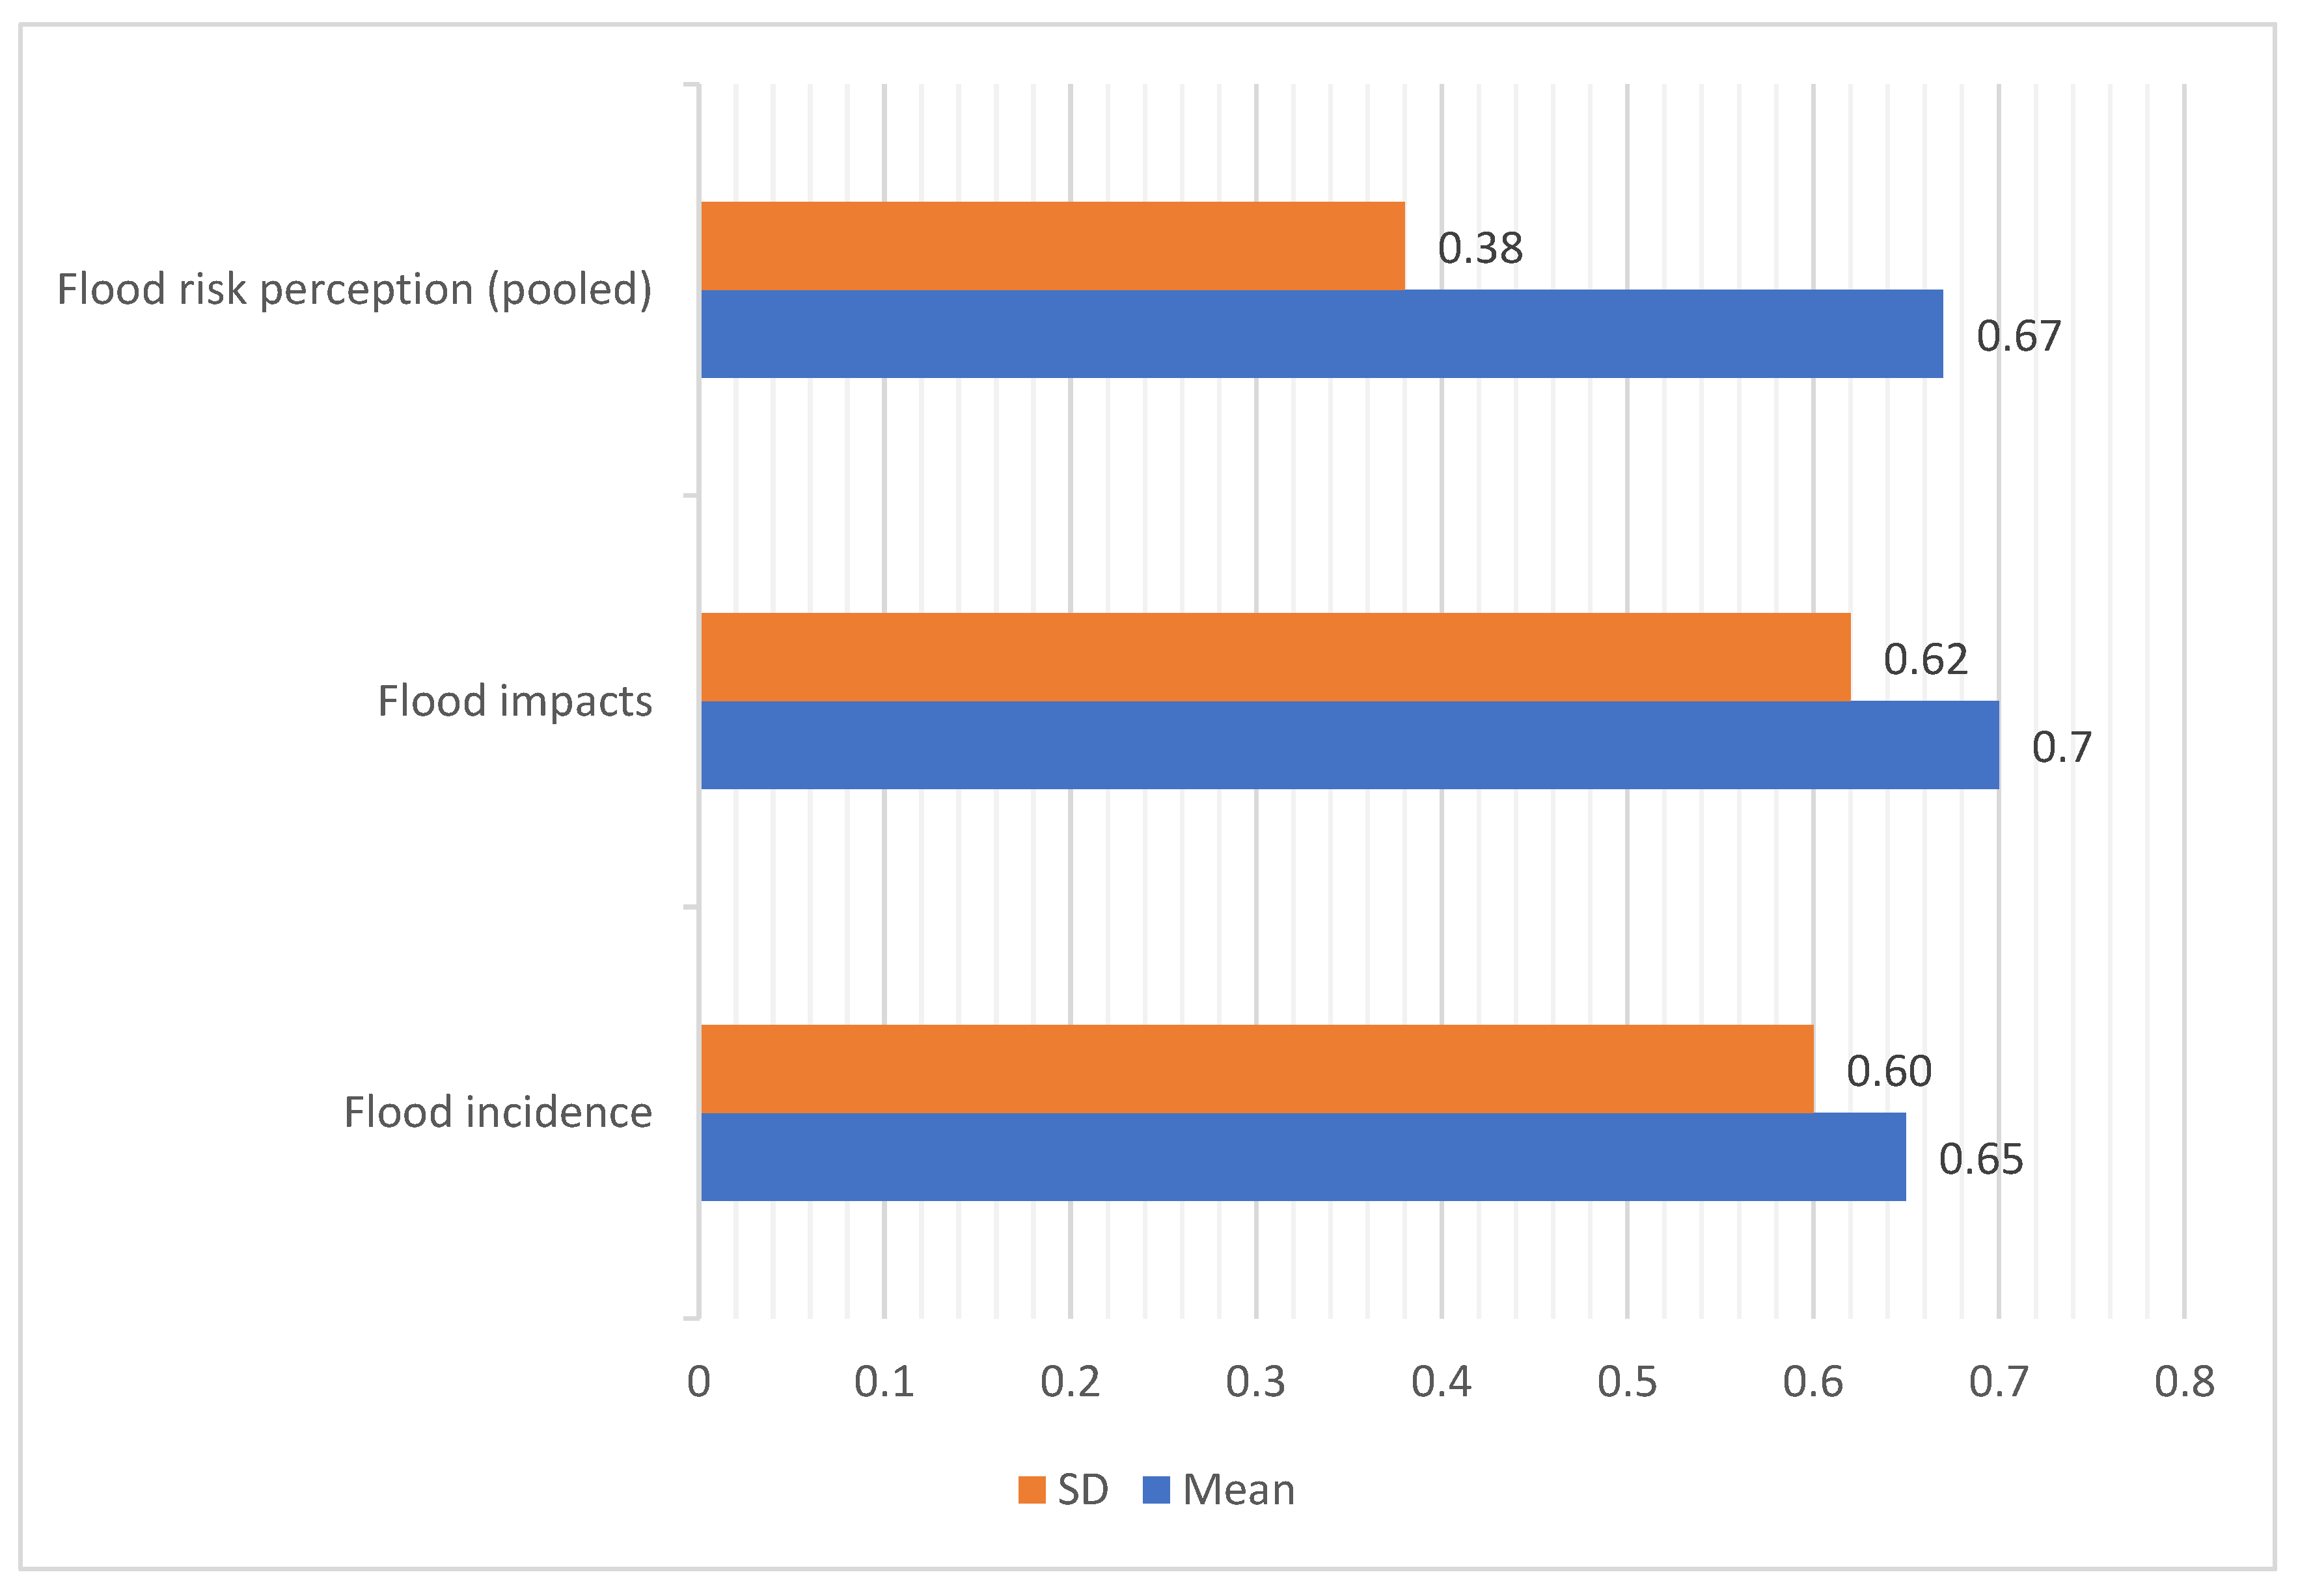
| Flood incidence | 0.65 | 0.60 |
| Flood impacts | 0.70 | 0.62 |
| Flood risk perception (pooled) | 0.67 | 0.38 |
| Age (years) | 44.79 | 13.29 |
| Education (Years) | 6.01 | 5.17 |
| Monthly income | 20,442 | 9863 |
| Family size (numbers) | 5.62 | 2.150 |
| House ownership | 0.80 | 0.593 |
| Past floods experience | 0.77 | 0.42 |
| Distance from the nearest river source | 0.11 | 0.13 |
| Credit sources | 0.88 | 0.33 |
| Information sources | 0.79 | 0.41 |
| District | Union Councils | Flood | Landslide | Earthquake | Drought | Infectious Diseases and Epidemics | Cyclone |
|---|---|---|---|---|---|---|---|
| Charsadda | Agra | 65 | 7 | 6 | 8 | 10 | 4 |
| DolatPura | 69 | 12 | 4 | 6 | 7 | 2 | |
| Do-Sehra | 64 | 8 | 7 | 7 | 11 | 3 | |
| Sub Total | 66 | 9 | 6 | 7 | 9 | 3 | |
| Nowshera | Akbar Pura | 70 | 7 | 6 | 8 | 7 | 2 |
| PirSabak | 67 | 13 | 5 | 7 | 6 | 2 | |
| Mohib Banda | 69 | 7 | 6 | 5 | 12 | 1 | |
| Sub Total | 69 | 9 | 6 | 7 | 8 | 2 | |
| Grand Total | 67 | 9 | 6 | 7 | 9 | 2 | |
| Explanatory Variables | Flood Risk Perception |
|---|---|
| Age (years) | 0.094 (0.029) *** |
| Education (years) | 0.194 (0.068) *** |
| Income (PKR) | −0.000 (0.000) ns |
| Family size | 0.566 (0.168) *** |
| Housing ownership | 1.765 (0.569) *** |
| Flood experience | 3.001 (0.534) *** |
| Credit sources | 0.935 (0.521) * |
| Information sources | 1.837 (0.510) *** |
| Distance from nearest river source | −1.044 (0.502) * |
| Constant | −6.590 (1.338) *** |
| Log-likelihood | −78.887 |
| LR chi2 (9) | 186.43 *** |
| Pseudo R2 | 0.5416 |
| Number of observations | 600 |
Publisher’s Note: MDPI stays neutral with regard to jurisdictional claims in published maps and institutional affiliations. |
© 2022 by the authors. Licensee MDPI, Basel, Switzerland. This article is an open access article distributed under the terms and conditions of the Creative Commons Attribution (CC BY) license (https://creativecommons.org/licenses/by/4.0/).
Share and Cite
Shah, A.A.; Ajiang, C.; Khan, N.A.; Alotaibi, B.A.; Tariq, M.A.U.R. Flood Risk Perception and Its Attributes among Rural Households under Developing Country Conditions: The Case of Pakistan. Water 2022, 14, 992. https://doi.org/10.3390/w14060992
Shah AA, Ajiang C, Khan NA, Alotaibi BA, Tariq MAUR. Flood Risk Perception and Its Attributes among Rural Households under Developing Country Conditions: The Case of Pakistan. Water. 2022; 14(6):992. https://doi.org/10.3390/w14060992
Chicago/Turabian StyleShah, Ashfaq Ahmad, Chen Ajiang, Nasir Abbas Khan, Bader Alhafi Alotaibi, and Muhammad Atiq Ur Rehman Tariq. 2022. "Flood Risk Perception and Its Attributes among Rural Households under Developing Country Conditions: The Case of Pakistan" Water 14, no. 6: 992. https://doi.org/10.3390/w14060992