Article

Sunflower Photosynthetic Characteristics, Nitrogen Uptake, and Nitrogen Use Efficiency under Different Soil Salinity and Nitrogen Applications

1
College of Agricultural Sciences and Engineering, Hohai University, Nanjing 210098, China
2
State Key Laboratory of Water Resources and Hydropower Engineering Science, Wuhan University, Wuhan 430072, China
*
Authors to whom correspondence should be addressed.
Water 2022, 14(6), 982; https://doi.org/10.3390/w14060982
Submission received: 13 February 2022 / Revised: 14 March 2022 / Accepted: 17 March 2022 / Published: 20 March 2022
(This article belongs to the Special Issue Efficient Use of Water and Soil Resources)

Abstract

:
Understanding salinity and fertilizer interaction is of great importance to improve crop production and fertilizer use efficiency in saline areas. To evaluate the interactive effects of different soil salinity levels and nitrogen (N) applications rates on the sunflower photosynthetic characteristics of N uptake and N use efficiency, a two-year field experiment was conducted in Hetao Irrigation District, China. The experiment consisted of three initial salinity (IS) levels expressed as the electrical conductivity of a saturated soil extract (ECe) (S0: 1.72–2.61 dS/m; S1: 4.73–5.90 dS/m; S2: 6.85–9.04 dS/m) and four N rates (45, 90, 135, and 180 kg/ha), referred as N0–N3, respectively. The results indicated that the net photosynthetic rate (Pn) of sunflowers treated with S0 and S1 levels both had a significant decrease in the bud stage, and then reached their maximum at anthesis. However, during the crop cycle, the Pn at S2 level only had small fluctuations and still remained at a high level (>40 μmol CO2/(m2 s)) at the early mature stage. When increasing IS levels from S0 to S1, the plant N uptake (PNU) under the same N rates were only decreased by less than 10% at maturity, whereas the decline was expanded to 17.2–45.7% from S1 to S2. Additionally, though applying the N2 rate could not increase sunflower PNU at the S0 and S1 levels, its N use efficiency was better than those under N3. Meanwhile, at the S2 level, the application of the N0 rate produced a higher N productive efficiency (NPE) and N uptake efficiency (NUPE) than the other N rates. Therefore, our study proposed recommended rates of N fertilizer (S0 and S1: 135 kg/ha, S2: 45 kg/ha) for sunflowers under different saline conditions.

1. Introduction

Nitrogen (N), as a key component of all nucleic acids and proteins, is crucial for the development of new plant cells and crop growth [1]. In modern cropping systems, high-yield crop production relies heavily on the application of N fertilizers [2]. However, overfertilization with N not only increases production costs, but also causes soil degradation and water eutrophication, and contributes to the emissions of greenhouse gases [3]. On the other hand, soil salinity is another major abiotic stress that limits crop production worldwide, especially in arid and semiarid regions [4]. Salinity has been proved to alter N dynamics in soils, such as mineralization, nitrification, and denitrification [5,6], thus influencing the uptake and utilization of N by crops. At the same time, as a type of salt itself, N fertilizer will aggravate soil salinization and lead to crop yield reduction when applied excessively [7,8,9]. Hence, the vulnerable saline agroecosystem has posed a major challenge for farmers when selecting the appropriate amount of N fertilizer for saline fields, which can both secure crop yields and minimize adverse environmental impacts.
In recent years, numerous studies have shown that proper management of N fertilizer in saline fields could alleviate the growth inhibition induced by salt stress, depending on plant species and salinity levels [10,11,12,13]. For example, Mansour [14] indicated that N might enhance plant salt tolerance by altering the contents of endogenous phytohormones (e.g., cytokinin and kinetin). Likewise, the study by Dong [15] reported that proper N application played not only a nutritional role, but also an osmotic role in enhancing the salt tolerance of cotton via increasing nutrient uptake and decreasing Na+ accumulation in its tissues. In addition, our previous studies on sunflower [16,17] suggested that applying 135 kg/ha of N fertilizer under low and moderate saline conditions could alleviate the detrimental effects of salt stress through optimizing the root:shoot ratio and promoting the rapid growth of fine roots in early growth stages. However, relevant studies based on phenotypic changes have also shown that the effects of N application on crop growth varied with the development of growth stages, and were quite different at different soil salinity levels. It is necessary to further explain the influence of coupled salt and N stresses on crop growth from the perspective of photosynthesis and N utilization.
The efficient use of N fertilizer is conducive to both food security and environmental quality. The existing studies on crop N use efficiency mainly focused on the effects of different tillage, planting, and water and fertilizer managements under a nonsaline condition [2,18,19], while few studies were reported concerning the coupled effects of N application rates and salt levels. It should be noted that salt stress increased the complexity of plant response to N fertilizers [20,21], which led to controversial results on the process of photosynthesis. For instance, Liu et al. [22] showed that increasing N fertilizer could always increase the chlorophyll content in the leaves of winter wheat during the crop cycle under different degrees of salt stress. However, the study by Pei et al. [23] on sunflower showed that the increase of N application at a high salt level could reduce the chlorophyll content in some growth stages, but higher chlorophyll content was remarkably found in the leaves at a medium salt level. This was also different from the results of Zhang et al. [24], who suggested that the optimal rates of N application at both medium and high salt levels were relatively low (96 kg/ha), based on the chlorophyll fluorescence parameters of tomato. Moreover, the mentioned studies on crop photosynthetic characteristics were mostly conducted at controlled pot or microplot scales, rather than naturally salt-affected field scales.
Sunflower (Helianthus annuus L.), which is classified as moderately salt-tolerant [25], has become an important industrial crop planted in salt-affected areas worldwide, especially in the arid northwest of China. The main objectives of this study were: (i) to determine the photosynthetic characteristics, N uptake, and N use efficiency of sunflower varying with different soil salinity and N applications; and (ii) to provide a physiological basis for the accumulation and partitioning rule of sunflower biomass, which has been previously reported at different salt levels and N rates [26]. The information obtained from this study will scientifically and reasonably guide the management of N fertilizer in saline fields.

2. Materials and Methods

2.1. Experimental Site

The field experiments were conducted at the Yichang experimental station, which is located in the Hetao Irrigation District (40°19′–41°18′ N, 106°20′–109°19′ E) of Inner Mongolia, China. The average annual precipitation of this area is 139 to 222 mm, with approximately 60% falling in the summer from June to August. Annual potential evaporation is approximately 2200 to 2400 mm. The strong evaporation with a high ratio of evaporation and precipitation (E/P > 10) makes the groundwater and soil water migrate upward continuously, bringing a large number of salts from the soil parent materials that then accumulate in the soil surface. Therefore, the problem of soil salinization in the Hetao Irrigation District is very serious, and it is necessary to carry out such studies in this area. The average annual groundwater depth at the Yonglian experimental station is about 2.21 m, and the groundwater depth in the irrigation period is about 0.6 m, which is a typical representation of the irrigation districts in Northwest China.

2.2. Field Experiments

Two years of field experiments (2015 and 2016) were carried out in six 7.5 × 4.5 m plots, which were established in three nearby fields (40–55 m apart) with naturally varying salinity levels, and each field had two adjacent plots applied with different nitrogen application rates (N rates). A two-factor randomized block design was used in the experiments of these two years, both including three initial salinity (IS) levels and two N rates. The electrical conductivity of 1:5 soil–water extract (EC1:5) was measured using a digital conductivity meter (Leici, Yidian Co., Ltd., Shanghai, China), then converted to the electrical conductivity of a saturated-paste extract (ECe) by an empirical formula (ECe = 7.4 × EC1:5) [27]. At a 0 to 60 cm soil depth of these three fields, the average ECe values varied within certain ranges at 10 d before sowing in 2015 and 2016, and could be divided into three soil salinity levels (Table 1): low (S0, ECe = 1.72–2.61 dS/m), medium (S1, ECe = 4.73–5.90 dS/m), and high level (S2, ECe = 6.85–9.04 dS/m). Four N rates were included in the two-year experiments: 45, 90, 135, and 180 kg/ha, referred to as the N0 (extremely low), N1 (low), N2 (moderate), and N3 (high) rates, respectively, which were set based on our previous studies [16,17,28]. As shown in Table 1, the N0 and N2 rates were determined in 2015, and the N1 and N3 rates were determined in 2016. Among them, the N0 and N1 rates were applied basally before sowing, while the N2 and N3 rates were achieved by top-dressing an additional 90 kg/ha at 20 days after sowing, based on N0 and N1, respectively. All the N rates mentioned above were achieved using diammonium phosphate (18% N) as 45 kg/ha of basal N fertilizer, while the rest basal N rate and the top-dressed N rate in Table 1 were all from urea (46% N). Moreover, all plots were basally applied with additional 78.59 kg/ha of P fertilizer as calcium superphosphate (7.86% P) and 62.23 kg/ha of K fertilizer as potassium sulfate (44.8% K), based on local practice.
The soil texture in each plot was mainly silty loam, and the basic physical and chemical properties of the soils in the experimental fields can be found in our previous study [17]. The soils were plowed and harrowed around 30 d before sowing, then each plot was mulched with three plastic films (80 cm width, with a 30 cm interval). All the basal fertilizer was applied beneath the plastic films at the same time of film mulching. In addition, all the plots were irrigated (250 mm) around 20 d before sowing in each year, and no irrigation was provided during the sunflower growth period. When soil moisture was considered acceptable for sowing, two rows of sunflower (GL601) were sown in each plastic film using manual hill-drop planting on 28 May 2015 and 5 June 2016, respectively. The cultivar GL601 was an edible sunflower that was widely planted by local farmers in recent years. Seedlings were thinned to 4.28 plants/m2 by leaving one vigorous plant per hill at the four-true-leaf stage. The sunflower plants were harvested on 11 September 2015 and 19 September 2016.

2.3. Data Collection

2.3.1. Photosynthetic Characteristics

In the field experiment of 2016, three tagged sunflower plants were selected in each plot, and their photosynthetic characteristics were measured five times by a portable photosynthetic system (LI-6400XT, LI-COR, Lincoln, NE, USA) during the crop cycle at 41 (late seedling stage), 52 (middle bud stage), 64 (anthesis), 71 (early mature stage) and 106 (maturity) days after sowing (DAS). The measured photosynthetic data included the net photosynthetic rate (Pn, μmol CO2/(m2 s)), stomatal conductance (Stomatal conductance, Gs, mmol H2O/(m2 s)), intercellular CO2 concentration (Ci, μmol CO2/mol), and leaf transpiration rate (Transpiration rate, Tr, mmol H2O/(m2 s)). Each observation was carried out at 9:00–11:00 a.m. on a windless and sunny day, and five repeated measurements were performed on the youngest fully expanded leaf of each tagged sunflower plant. The photosynthetic active radiation (PAR), the CO2 concentration, the flow rate, and the temperature in the leaf chamber were set to 1700 μmol/(m2 s), 380 μmol/mol, 500 μmol/s, and 30 °C, respectively.

2.3.2. Plant Biomass and Seed Yield

The growth cycle of sunflower can be divided into four growth stages, based on the study of Schneiter and Miller [29]: seedling, bud, flowering, and mature stages. At each sunflower growth stage, three plants were randomly chosen from each plot, and destructive measurements were undertaken at 23, 56, 73, and 106 DAS in 2015; and at 28, 52, 66, and 106 DAS in 2016, respectively. The chosen plants were cut just above the soil surface using hand clippers and separated into leaves, stems, and flower disks. All the samples were placed in paper bags and oven-dried at 70 °C to constant weight. The dry samples were weighed to calculate the shoot biomass. At harvest, 20 mature sunflower plants were also randomly chosen from each plot to obtain all their seeds on the flower disks, and the seed yield (SY) was air-dried to constant moisture (approximately 8%) and measured in each year.

2.3.3. Plant Nitrogen Uptake

To determine sunflower N uptake, the dry samples of each plant part mentioned above were milled with a pulverizer (9FZ-35, Taifeng Machinery Factory, Taizhous, China), mixed, and passed through a 0.5 mm sieve. Total N concentration was determined using the micro-Kjeldahl method [30]. The N concentration was expressed on a dry-weight basis, and total N uptake and accumulation were calculated as the product of concentration and dry weight.

2.4. Data Analysis

2.4.1. Stomatal Limitation Index

The stomatal limitation index (Ls) reflects the limitation of stomatal aperture to leaf photosynthesis. The greater the Ls value, the stronger the stomatal aperture limited plant photosynthesis. The Ls was calculated as follows:
L s = ( 1 C i C a ) × 100 %
where Ci denotes intercellular CO2 concentration, μmol CO2/mol; and Ca denotes external CO2 concentration, which was maintained at 380 μmol CO2/mol using the CO2 controlling system of LI-6400XT when measuring the photosynthetic characteristics of sunflower leaves in this study.
The factors causing the decrease in the Pn value included the partial closure of leaf stomata and a decrease in the photosynthetic activity of mesophyll cells. The former factor was called the stomatal factor, and the latter was called the nonstomatal factor. According to the judgment method proposed by Xu [31], the change direction of Ci and Ls was a reliable criterion for the decrease in the Pn value. A decreasing Ci value and increasing Ls value indicated that the stomatal factor was the main cause, whereas an increasing Ci and decreasing Ls indicated the nonstomatal factor was the main reason.

2.4.2. Nitrogen Production, Uptake, and Utilization Efficiency

In this study, three kinds of N efficiency indices were used to evaluate sunflower uptake and utilization of N fertilizer from the soils; these were N productive efficiency (NPE, kg/(kg N)), N uptake efficiency (NUPE, kg/kg), and N utilization efficiency (NUTE, kg/(kg N)). The NPE, NUPE, and NUTE could be calculated as follows:
N P E = S Y N t o t a l
N U P E = P N U N t o t a l
N U T E = S Y P N U
where Ntotal denotes the total amount of applied N fertilizer, kg/ha; SY denotes the sunflower seed yield, kg/ha; and PNU denotes the total N uptake of sunflower plants at maturity, kg/ha.

2.4.3. Photosynthetic Nitrogen Use Efficiency

Photosynthetic nitrogen use efficiency (PNUE, μmol CO2/(mg s)) reflected the instantaneous CO2 assimilation rate per unit leaf N, and could be expressed as:
P N U E = P n L T N A / L A = P n N a r e a
where Pn denotes net photosynthetic rate, μmol CO2/(m2 s); LTNA denotes the amount of total leaf N accumulation, mg/plant; LA denotes the total leaf area, cm2/plant; and Narea denotes the leaf N content per unit area, mg/cm2.

3. Results

3.1. Sunflower Photosynthetic Characteristics in Saline Fields

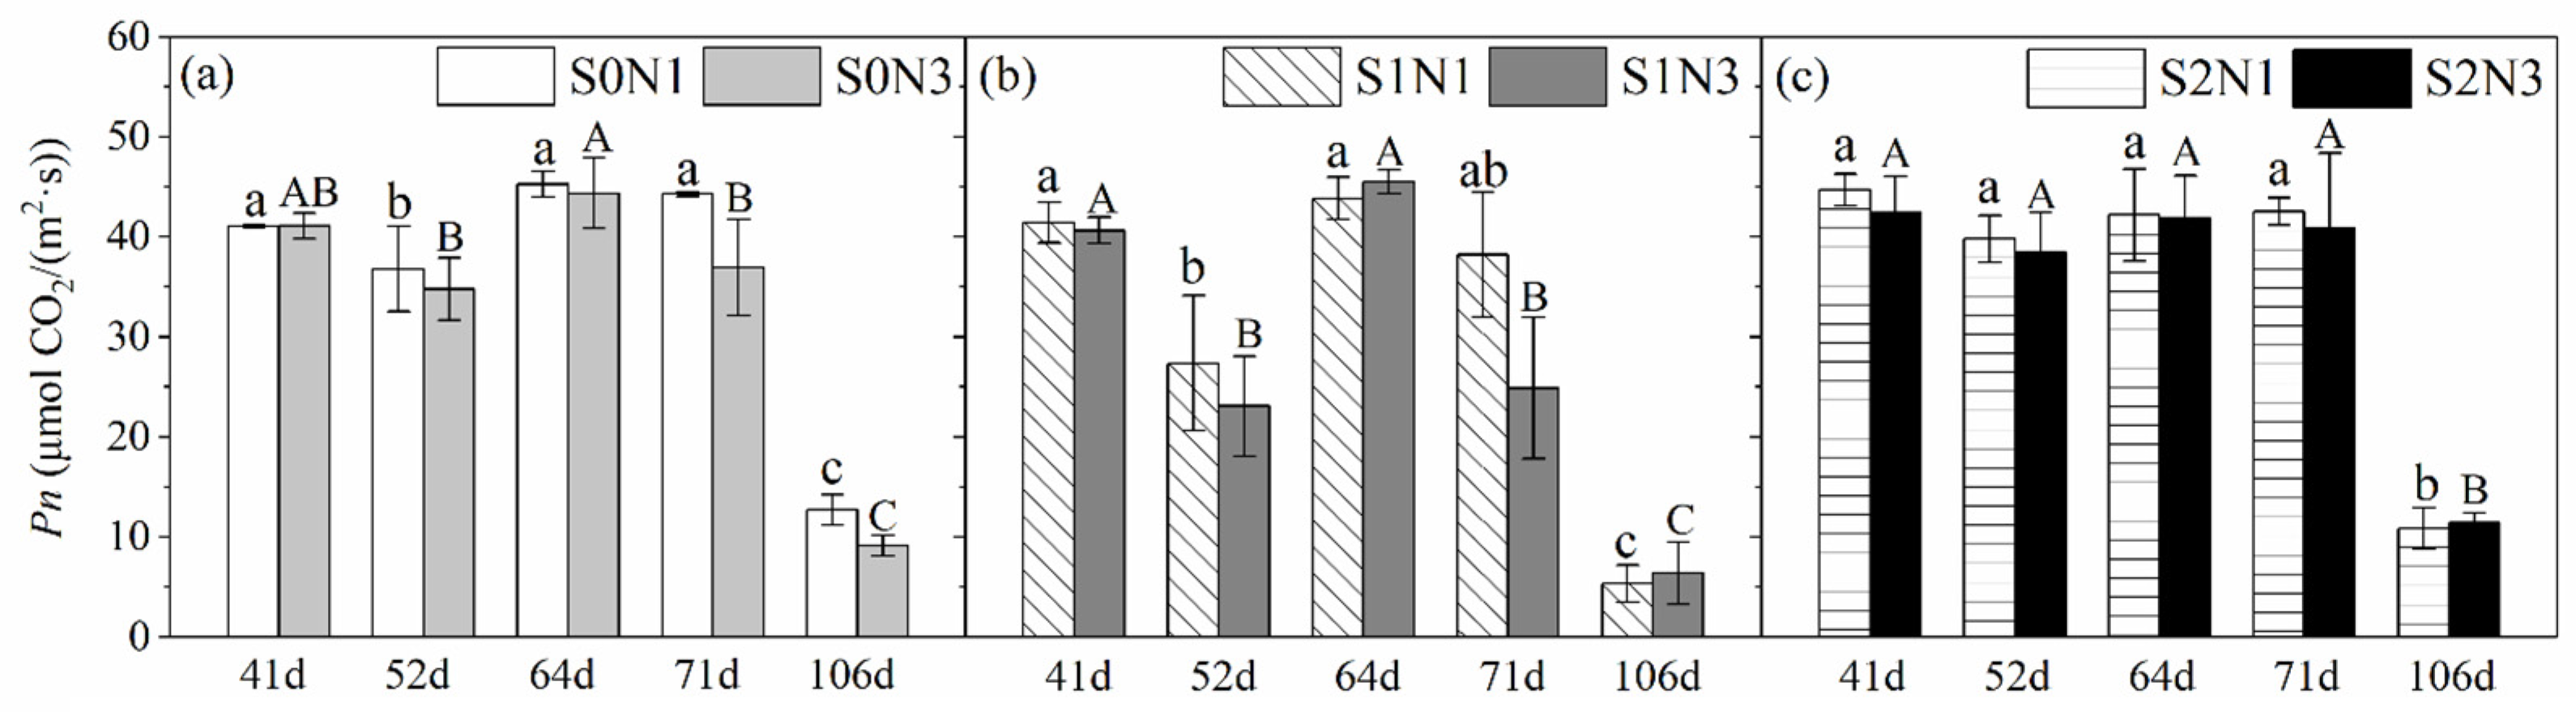
3.1.1. Net Photosynthetic Rate

As shown in Figure 1, the net photosynthetic rate (Pn) of all treatments declined from the seedling stage (41 DAS) to bud stage (52 DAS), and decreased mostly for the S1N1 and S1N3 treatments, by 33.9% and 43.2%, respectively. After that, the Pn at S0 and S1 levels (Figure 1a,b) increased significantly in the late bud stage, reached their maximum at anthesis (64 DAS), and then declined again after entering the mature stage. Particularly, only the Pn of sunflowers treated with the N3 rate were found to have a significant decline, from 64 to 71 DAS. On the other hand, at the S2 level (Figure 1c), the variations in Pn after anthesis (71 and 106 DAS) were less than 2.2% compared with the values at 64 DAS, and they could still remain at a high level of more than 40 μmol CO2/(m2 s). At maturity (106 DAS), the Pn of each treatment was significantly decreased to a very low level of less than 12.5 μmol CO2/(m2 s) due to leaf senescence.

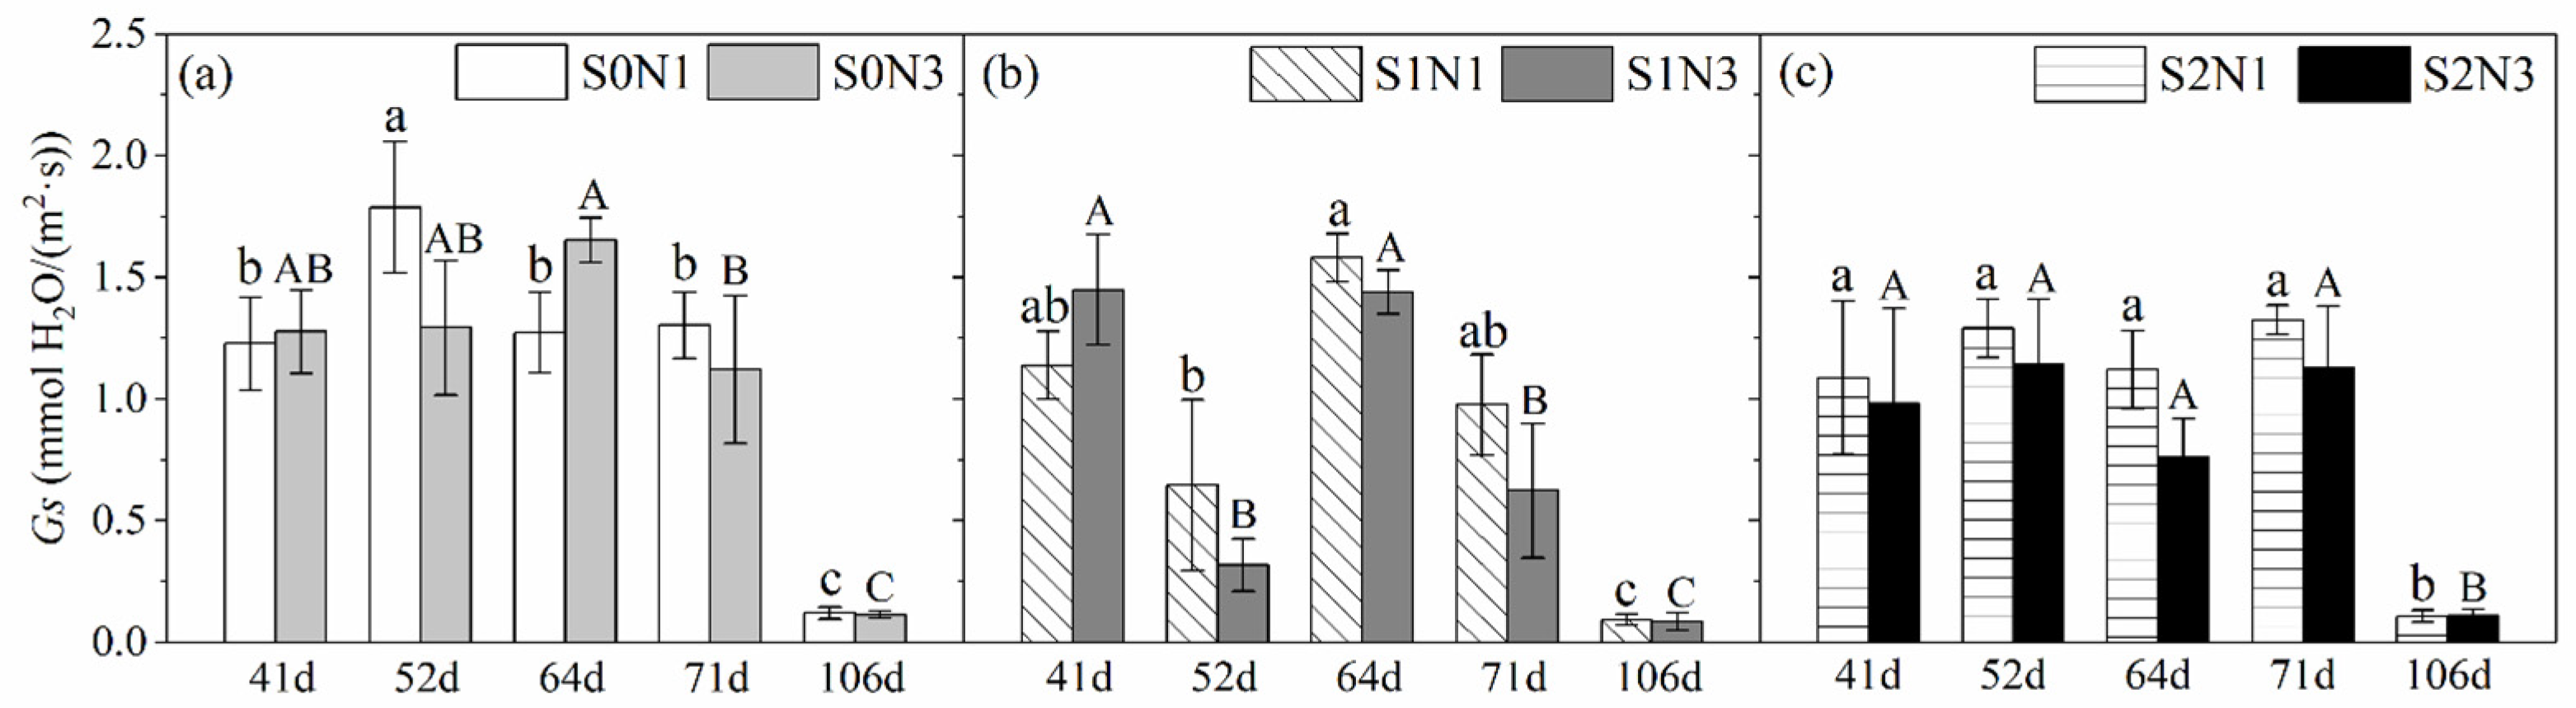
3.1.2. Stomatal Conductance

Stomatal conductance (Gs) represents the degree of stomatal opening and is proportional to the intensity of photosynthesis and transpiration. As shown in Figure 2, an increased Gs was found at the S0 and S2 levels from 41 to 52 DAS, but the increase was only significant in the S0N1 treatment, by 45.7%. Meanwhile, the Gs for the S1N1 and S1N3 treatments decreased significantly, by 43.2% and 78.0% during the same period, respectively, and then experienced a rapid rebound from 52 to 64 DAS, which was consistent with the trend of the Pn value at the S1 level. After 64 DAS, the Gs for the S0 and S1 levels decreased constantly to a low level of less than 0.12 mmol H2O/(m2 s) at maturity, while an increased Gs could still be found for the S2 level in the early mature stage.

3.1.3. Intercellular CO2 Concentration and Stomatal Limitation Index

As mentioned in Section 2.4.1, the intercellular CO2 concentration (Ci) and stomatal limitation (Ls) were important judgment bases for determining the causes of the Pn decline. Accordingly, after comparing Figure 3a–c and Figure 3d–f, we proposed that the reasons for the decline in the Pn value for different treatments shown in Figure 1 were as follows: (i) in the bud stage, the reason for the significant decline in Pn for the S0N1 treatment was the nonstomatal factor, which was due to N deficiency, while the reason for the significant decline in Pn for S1N1 and S1N3 was the stomatal factor; (ii) in the early mature stage, the significant decline in Pn for S0N3 and S1N3 were caused by stomatal factors; (iii) during the entire mature stage, the reasons for the decreased Pn in all treatments were mainly stomatal factors, which were due to the reduction in and closure of stomata caused by leaf senescence.

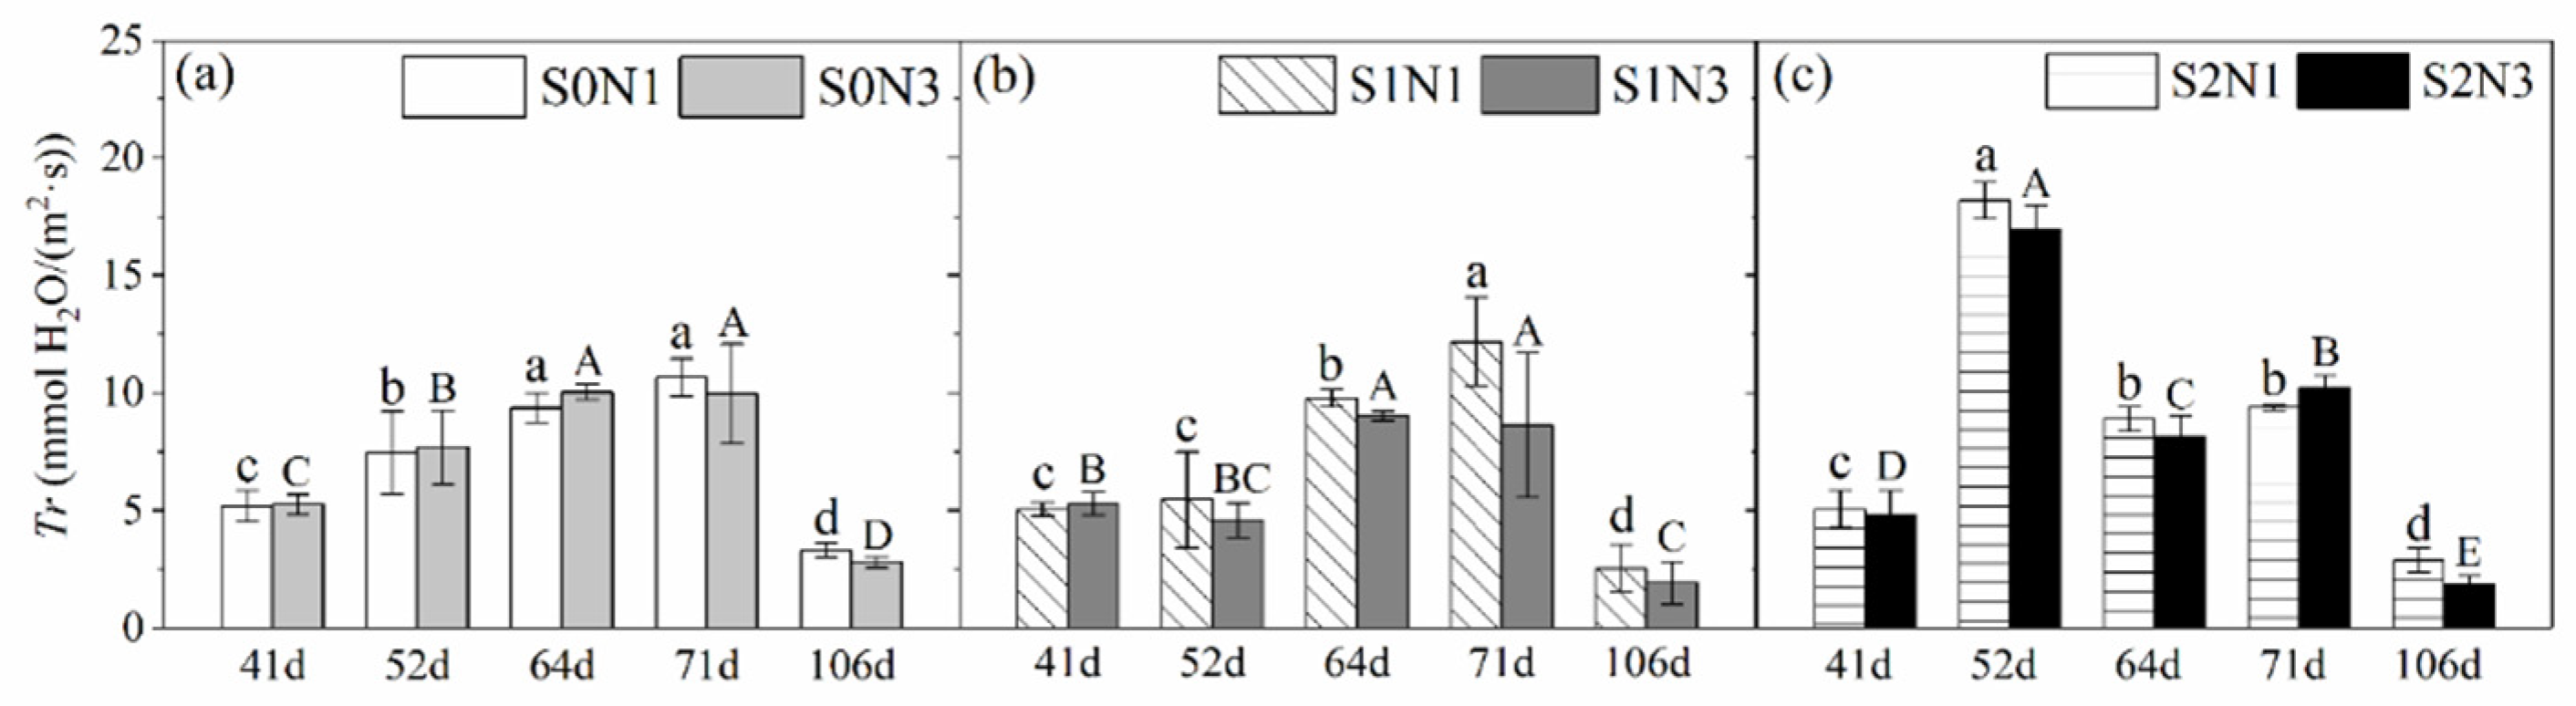
3.1.4. Leaf Transpiration Rate

Leaf transpiration rate (Tr) refers to the amount of water transpired from per unit leaf area in a certain period of time. As shown in Figure 4, the leaf Tr showed an overall upward trend from the seedling to early mature stage at the S0 and S1 levels. Among them, the leaf Tr of sunflowers treated at the N1 rate reached their maximum at the early mature stage (71 DAS), while the maximum Tr appeared earlier—at anthesis (64 DAS) at the N3 rate. At the S2 level (Figure 4c), a rapid increase of about 250% in Tr was found from 41 DAS to 52 DAS, and then followed by a fast decline of more than 50% after entering the flowering stage (64 DAS). At maturity (106 DAS), the leaf Tr of each treatment was significantly decreased to a very low level of less than 3.3 mmol H2O/(m2 s) due to leaf senescence.

3.2. Nitrogen Uptake and Utilization of Sunflowers in Saline Fields

3.2.1. Plant Nitrogen Uptake

The plant nitrogen uptake (PNU) of sunflower measured at four different growth stages in 2015 and 2016 were shown in Figure 5. Overall, sunflower PNU decreased with an increase in soil salinity under the same N rate. Compared with the sunflowers grown at the S1 level, the PNU at the S0 level was only decreased by less than 10% under the same N rate. However, when the IS level increased from S1 to S2, the PNU was decreased by 32.3%, 17.2%, 45.7%, and 43.5% under the N0, N1, N2, and N3 rates, respectively. In addition, at the S0 and S1 levels, applying different amounts of N fertilizer had different effects on sunflower PNU. In 2015, compared with N0, the application of the N2 rate had no promotion effect on sunflower PNU during the crop cycle, whereas a slight increase in sunflower PNU could be found under the N3 rate in 2016, compared with those under N1. Nevertheless, at the S2 level, applying the N2 rate of fertilizer in 2015 could decrease the PNU of sunflower at each growth stage, compared with N0, whereas the PNU of the S2N3 treatment was also lower than that of S2N1 by 18.5% at maturity in 2016. Moreover, the PNU of each treatment at maturity in 2015 and 2016 (n = 36) were combined, as shown in Figure 6, and showed a strong linear relationship with their seed yield (R2 close to 0.7).

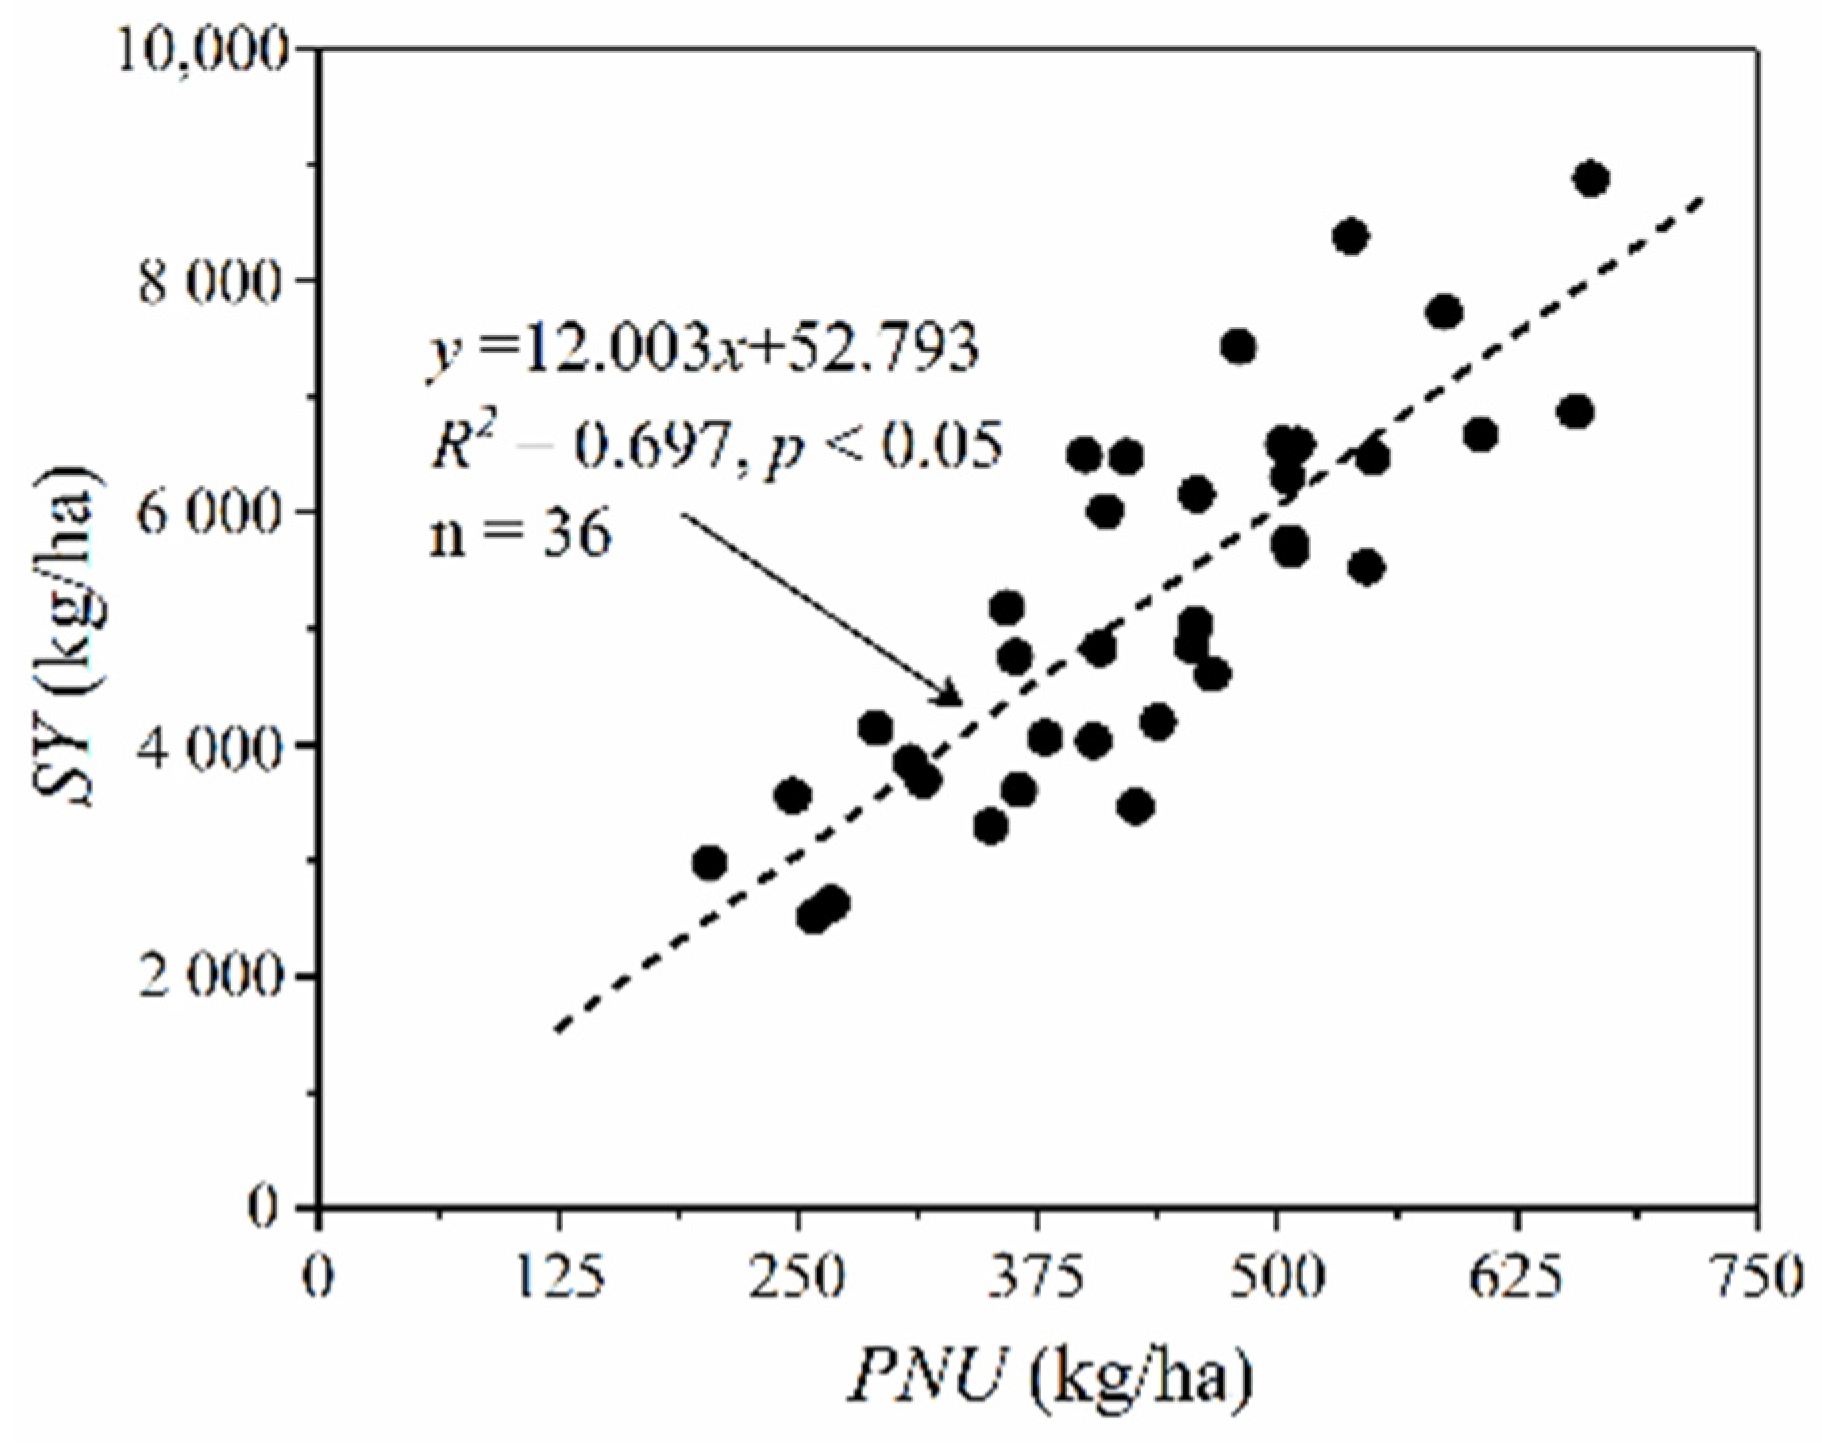
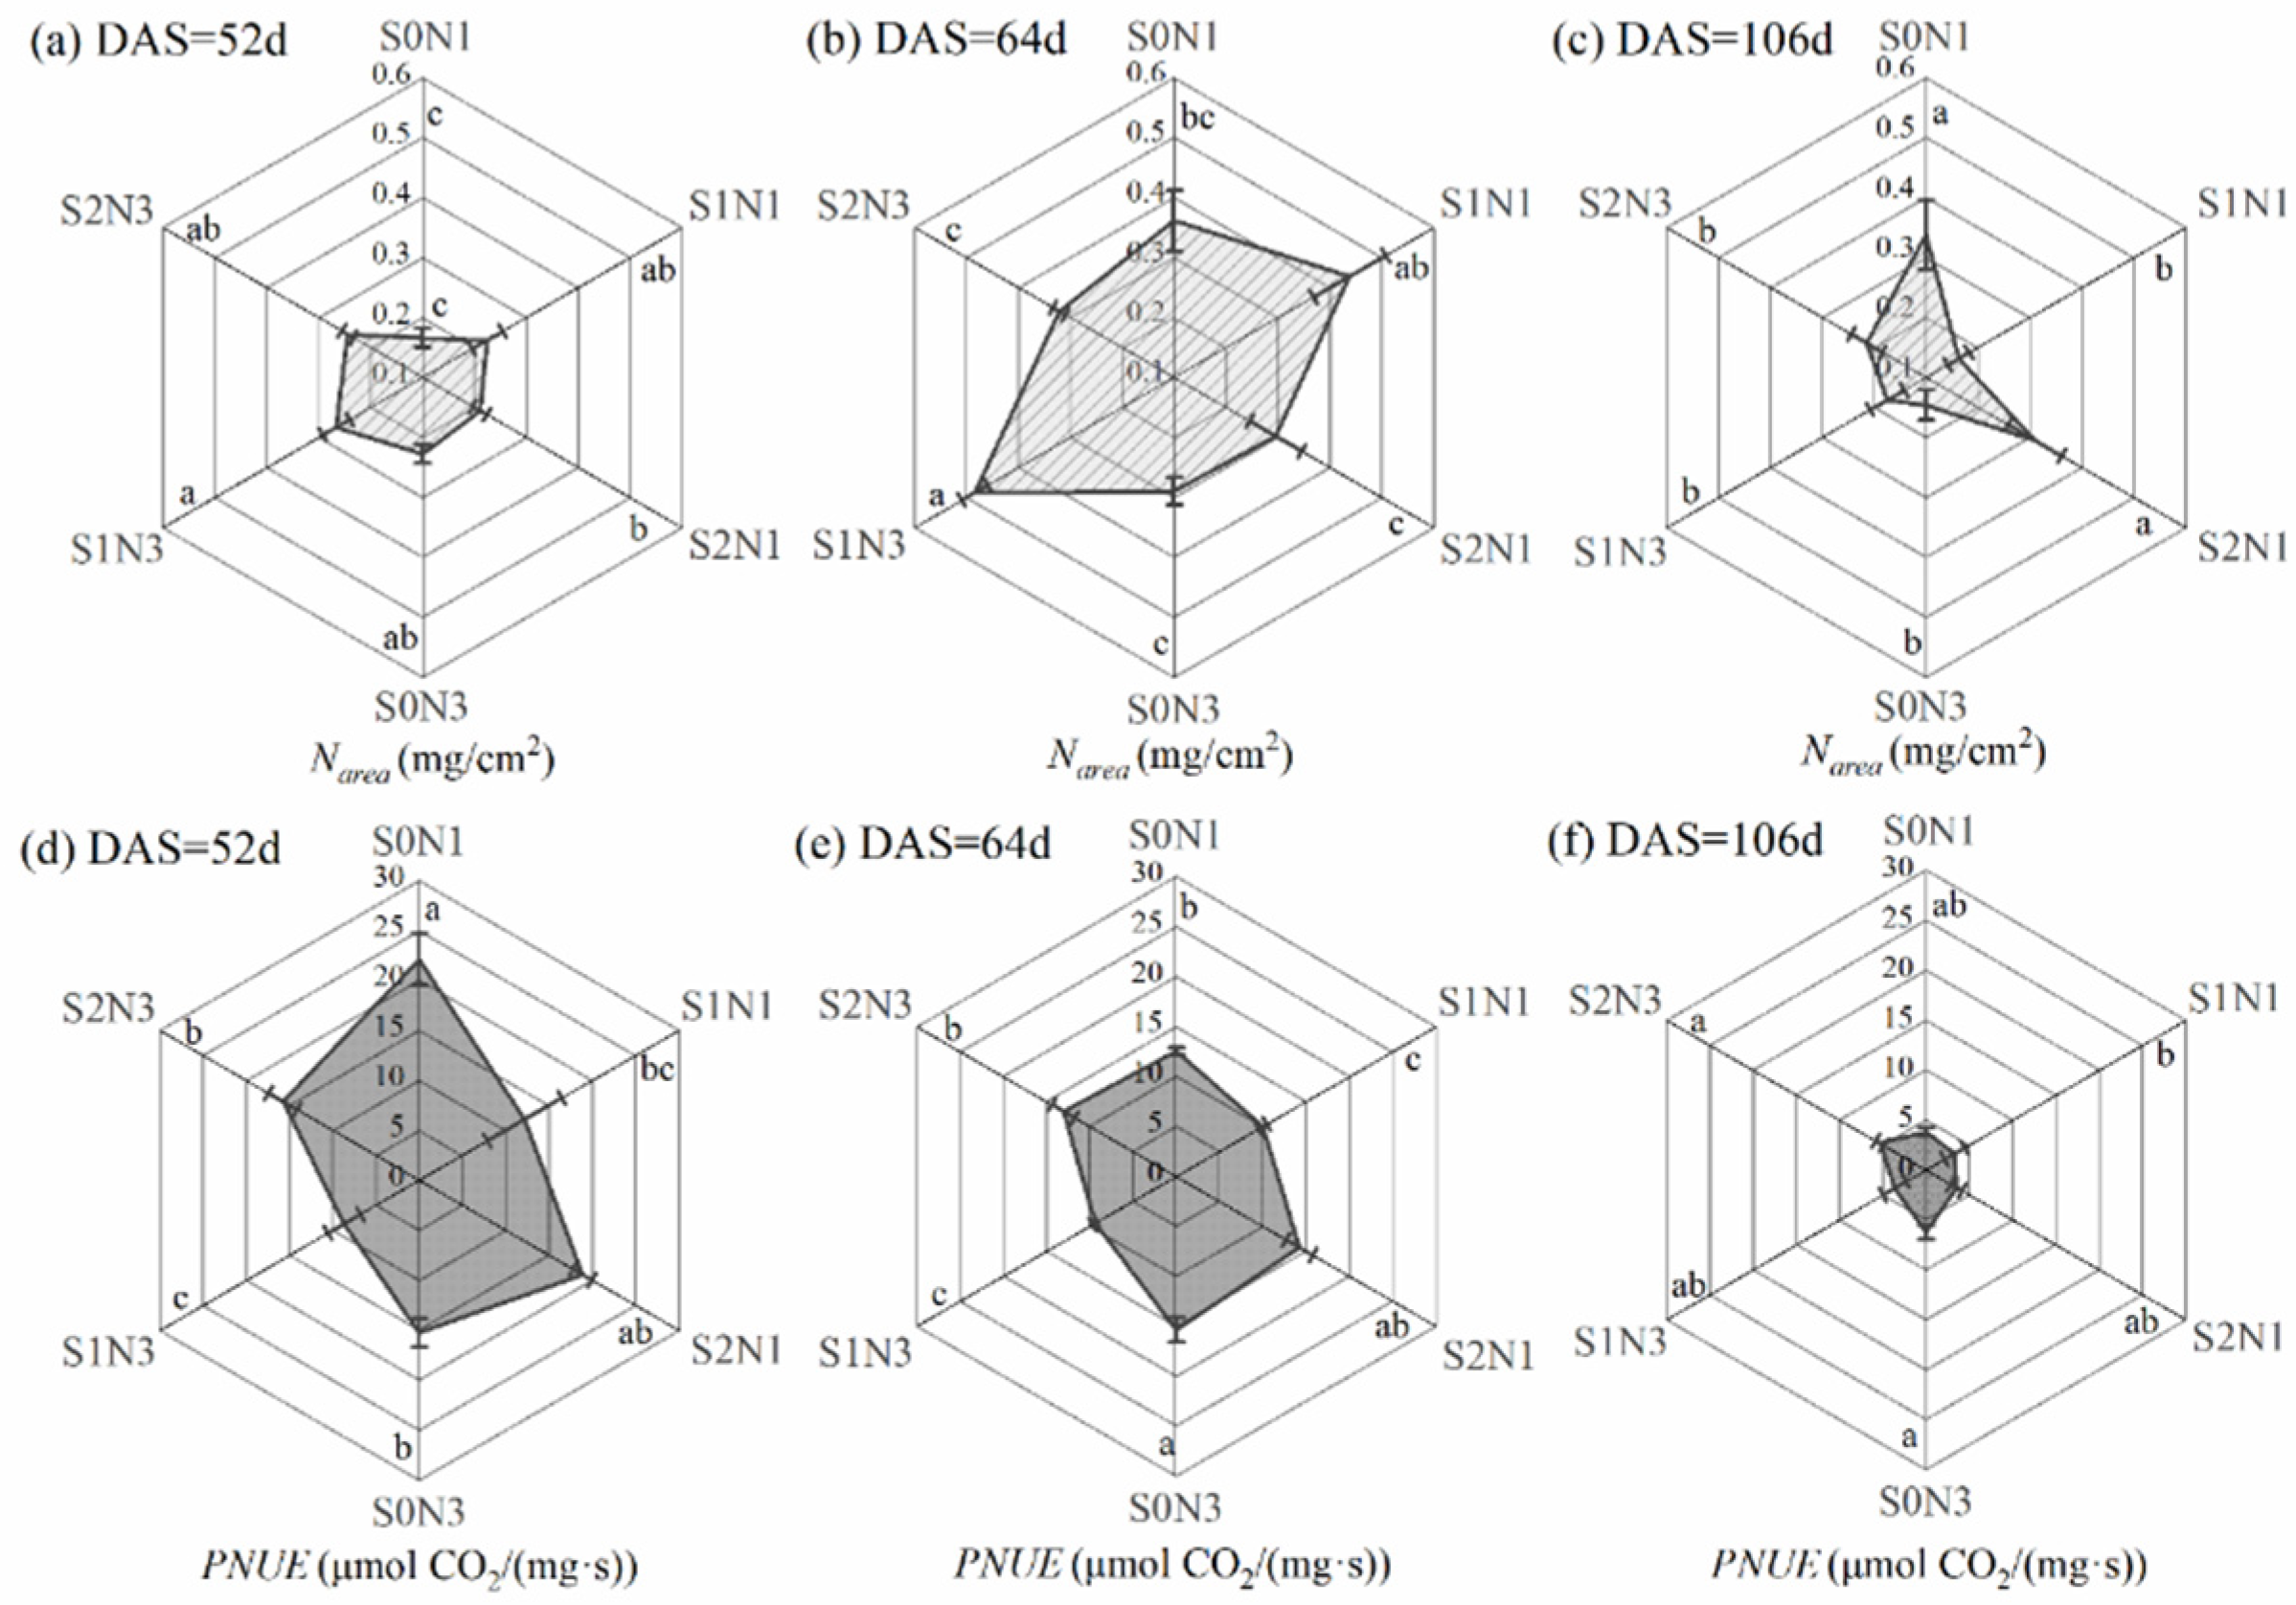
3.2.2. Photosynthetic Nitrogen Use Efficiency

In the five photosynthetic observations in 2016, the dry matter and N content of sunflower leaves were simultaneously measured three times. Therefore, the N content per unit leaf area (Narea) and photosynthetic nitrogen use efficiency (PNUE) of sunflower were calculated using Equation (5) at three different times (52, 64, and 106 DAS). The results showed that the Narea of each treatment increased significantly from the bud to flowering stage (52–64 DAS), and their maximum values both appeared in the S1N3 treatment. In particularly, when the Narea of S1N3 was increased to 0.484 mg/cm2 at 64 DAS (Figure 7b), it was significantly higher than all the treatments at the S0 and S2 levels. After entering the mature stage, the Narea at the S1 level declined sharply, by more than 60%, while the Narea of S0N1 was only decreased by 6.5%, and that of S2N1 even had an increase of 4.6%.
As can be seen in the radar charts in Figure 7d–f, the PNUE values under the N1 rate at 52 DAS were higher than those under the N3 rate. Subsequently, the PNUE values generally declined from 52 to 64 DAS, which were 43.4%, 17.8%, and 24.6% at the S0, S1, and S2 levels, respectively. Meanwhile, the PNUE of S1N1 and S2N1 were still slightly higher than those of S1N3 and S2N3 at 64 DAS. In addition, at both 52 and 64 DAS, the PNUE values for the S0 and S2 levels were significantly higher than those at the S1 level under the same N rate (except for S2N1), while no significant difference in PNUE values could be found between different IS levels at 106 DAS.

3.2.3. Nitrogen Use Efficiency

The seed yield (SY), N production efficiency (NPE), N uptake efficiency (NUPE), and N utilization efficiency (NUTE) of sunflower under different treatments in 2015 and 2016 are shown in Table 2. Among them, the variation in sunflower SY was analyzed in our previous study [26]. The NPE and NUPE of sunflowers grown at the same IS level decreased significantly with increasing N rates. On the other hand, the NPE values under the same N rate also decreased with increasing IS levels. However, the NUPE of sunflowers treated with the same N rate varied only within 10.0% when the soil salinity was aggravated from the S0 to S1 level. Additionally, the application of the N2 rate at the S0, S1, and S2 levels in 2015 increased the NUTE values by 15.1%, 7.8%, and 23.0% compared with those under N0, respectively. However, the increases in NUTE values by applying the N3 rate at different IS levels in 2016 were obviously lower than those by N2 in 2015. Among them, the average NUTE of the S0N3 treatment was only increased by 0.1 kg/(kg N) compared with that of S0N1, whereas the S1N3 even had a lower NUTE than S1N1 by 0.9 kg/(kg N).

4. Discussion

Nitrogen is an essential macronutrient for plant growth and basic metabolic processes, such as the synthesis of chlorophyll and various enzymes [32,33]. Meanwhile, a high content of salt ions reduces the activity of PSII and loosens the binding between chlorophyll and the chloroplast protein, which results in more chlorophyll decomposition and a decreased photosynthetic rate [34,35]. In this study, the photosynthetic capacity of sunflower fluctuated during the crop cycle, and different levels of soil salinity resulted in different degrees of variation. At the S1 level, after bud initiation, the indicators reflecting the photosynthetic capacity (Pn, Gs, Ci) were all significantly decreased due to stomatal limitation, while the decline at the S2 level was much smaller during the same period. This phenomenon was also reported by Zeng et al. [28] in sunflowers grown in saline fields. The reason might be explained from two aspects, which were the enhanced salt tolerance and the insufficiency of the leaf area. Firstly, after entering the bud stage, the sunflowers treated with moderate soil salinity showed improved salt tolerance faster than those with high soil salinity. This was supported by the findings of Ma et al. [17] and Zhang et al. [36], who reported significant increases in fine root growth and the uptake of water and nutrients during this period. Secondly, our previous study on sunflower [26] indicated that moderate salt stress obviously reduced the development of the leaf area in the bud stage, and the inhibition could not be alleviated until entering the flowering stage, which meant that the growth rate of sunflower leaves lagged behind the enhancement of the salt tolerance under moderate saline condition. Thus, the relatively lagging growth of the leaf area at the S1 level resulted in a large accumulation of N in sunflower leaves (highest Narea in Figure 7), and the number of stomata was insufficient to maintain the high demand of photosynthesis in the meantime. As a result, the sunflower plants had to temporarily reduce their photosynthetic capacity at the bud stage.
After developing into the mature stage, the photosynthetic capacity of sunflowers at the S0 and S1 levels decreased to varying degrees, but could still be maintained at a high level when treated with the S2 level, indicating that sunflowers still ensured a certain assimilation rate at the early mature stage to compensate for the insufficiency of vegetative growth induced by severe salt stress. This change rule of photosynthetic indicators also provided a reasonable explanation for the compensatory vegetative growth of sunflower that occurred after entering the mature stage under a high saline condition, which was reported in our previous studies [16,21,26,37]. Moreover, the studies of Zeng et al. [28] on sunflower and Pei et al. [38] on maize both showed that the stage when the maximum leaf Tr occurred had no correlation with the salt levels, and they always occurred at the flowering stage and tasseling stage, respectively. However, in the present study, the occurrence of the maximum Tr was advanced to the middle bud stage at the S2 level, compared with those at the S0 and S1 levels. Meanwhile, the peak value of leaf Tr at the S2 level was much higher than for those treated at other IS levels. Our observation of root dynamics in the same experiment [17] could explain this phenomenon, which showed a rapid growth of fine roots under a high saline condition that could significantly improve the water absorption capacity of sunflower plants during the same period.
Previous studies on sunflower [16,39], cotton [11,36], and some other crops [8,10] proved that the detrimental effects induced by moderate salt stress could be alleviated by applying additional N fertilizer properly. However, our present study found that applying a high N rate of 180 kg/ha at the S0 and S1 levels had no beneficial effects on the photosynthetic capacity of sunflower during the vegetative growth stages; instead, it resulted in an earlier and larger decline at the early mature stage, compared with those under lower N rates. The analysis of limiting factors showed that stomatal closure was the main reason for the decline in Pn during this period, which suggested that applying additional N fertilizer could accelerate the senescence of sunflower leaves under low and moderate saline conditions. In addition, the uptake and utilization of N by crops is an important factor that affects physiological processes such as photosynthesis and yield formation. It has been proved that the yield had a strong correlation with its PNU in many crops under a nonsaline condition [40,41,42,43], but there has been little evidence to support the theory in saline fields. Our study demonstrated that there was also a significant correlation between the SY and PNU for the sunflowers cultivated in salt-affected soils. Meanwhile, it is generally accepted that an increase in N fertilizer can significantly increase the PNU within a certain range [44,45]. However, under the interactive effects of salt and N stress, Chen et al. [11] showed that the PNU was mainly correlated with the salt level, and was not significantly affected by the N rate. Moreover, Zhang et al. [36] indicated that soil salinity levels, N rates, and their interactions all had significant effects on N accumulation in cotton. The present study on sunflower suggested that the effects of N applications on the uptake and utilization of N varied under different saline conditions. At the S0 and S1 levels, although the N2 rate could not increase the PNU of sunflower, it had better economic and ecological benefits than the N3 rate with the same yield-increasing effect (higher NUTE in Table 2). At the S2 level, the application of N2 and N3 rates could also improve the NUTE of sunflower, but it was mainly due to the excessive dissolved N in soils aggravating the adverse effects of salt stress on sunflower, limiting the uptake of N by roots (Figure 5), and forcing it to improve the utilization efficiency of absorbed N, which could be regarded an adaptation mechanism of crops themselves to adversity [46,47]. Therefore, considering the variation in sunflower SY shown in Table 2, our study suggested that it was not necessary to increase the amount of N fertilizer at the S2 level; instead, directly applying the N fertilizer at the N0 rate could not only alleviate the decline in sunflower SY caused by salinity, but also was superior to the N1 rate in terms of N efficiency indices.
The photosynthetic apparatus in plant leaves is the largest sink of N in the plant [48,49,50]. However, little is known about the effects of salt stress on plant PNUE, and, to the best of our knowledge, the only prior studies found that salt stress led to a decreased PNUE [51,52]. Meanwhile, such studies were carried out for halophytes under indoor hydroponic conditions, while relevant studies should also be conducted on field crops in salt-affected fields. The present study found that in the bud and flowering stages with vigorous vegetative growth, the S1 level induced a greater decrease in sunflower PNUE, indicating that although the Narea of sunflower at the S1 level was higher than those at other IS levels (Figure 7), the proportion of N that could be used for photosynthesis might be lower. This reason also indirectly led to partial closure of leaf stomata at the S1 level, resulting in a significant decrease in Pn, as mentioned above for the same period. On the other hand, this study also showed that when the N supply was limited at the bud stage, the Narea was relatively low, but it could force the sunflowers to improve their PNUE under a lower N rate. Similar findings were reported by Dinh et al. [53] under a drought stress condition; they suggested that sugarcane treated with drought stress also had a higher PNUE at 90 kg/ha of the N rate, compared with those at 180 and 270 kg/ha. After entering the flowering stage, with the increase in N accumulation in leaves, this promotion effect on the PNUE was weakened, but the PNUE value for the S2N1 treatment was still second only to that of S0N3, which also indicated that not increasing the N fertilizer at the S2 level was more conducive to the role of N in photosynthesis. Nevertheless, the present study only proved that the effects of salt, N, and their interactive stress on the PNUE of sunflower varied at different growth stages. The specific reasons for this difference remain to be further studied.

5. Conclusions

Our study illustrated that at low and medium soil salinity levels (S0 and S1), the net photosynthetic rate (Pn) of sunflowers reached their peaks at anthesis, but they decreased significantly in the bud stage in advance, and the decrease was found to be largest at the S1 level. Additionally, applying a high N rate of 180 kg/ha (N3) accelerated the senescence of sunflower leaves at the S0 and S1 levels, resulting in their photosynthetic indicators having an earlier and larger decline after anthesis due to stomatal factors. Thus, although a moderate N rate of 135 kg/ha (N2) could not increase the plant nitrogen uptake (PNU) of sunflowers, their N efficiency indexes (NPE, NUPE, NUTE) were higher than those under the N3 rate, which meant better economic and ecological benefits. Moreover, at a severe soil salinity level (S2), although sunflower PNU was obviously inhibited, their photosynthetic nitrogen use efficiency (PNUE) was not affected, and the Pn values were relatively stable from the seedling to flowering stages. After entering the mature stage, their Pn values were maintained at a high level of more than 40 μmol CO2/(m2 s); thus, the sunflower plants could still have some compensatory growth before maturity. Meanwhile, applying an extremely low N rate of 45 kg/ha (N0) could not only alleviate the decline in sunflower seed yield (SY) under severe saline condition (S2), but those plants also comprehensively outperformed those under the N1 rate (90 kg/ha) in terms of N efficiency indices. Therefore, our study led us to recommend the application of 135 kg/ha of N fertilizer in the saline fields at the S0 and S1 levels, and we proposed that 45 kg/ha of N fertilizer was sufficient for the fields affected by the S2 level of salt stress. In a future study, we will conduct additional experiments to reveal the physiological mechanism of the significant decrease in the sunflower Pn in bud stage, especially at the S1 level, as well as the variable PNUE of sunflower at different growth stages in saline fields.

Author Contributions

Conceptualization, T.M. and J.H.; methodology, T.M. and S.Y.; fieldwork, P.H., Y.Y. and S.P.; formal analysis, K.C. and Y.D.; data curation, J.D.; writing—original draft preparation, T.M.; writing—review and editing, T.M. and K.C.; supervision, S.Y.; project administration, S.Y. and J.H. All authors have read and agreed to the published version of the manuscript.

Funding

This research was funded by the National Natural Science Foundation of China (NSFC) under grant numbers 52109051 and 51879074; the Natural Science Foundation of Jiangsu Province under grant number BK20200513; and the Water Science and Technology Foundation of Jiangsu Province under grant numbers 2020047 and 2020048.

Institutional Review Board Statement

Not applicable.

Informed Consent Statement

Not applicable.

Data Availability Statement

All data are provided as tables and figures.

Acknowledgments

We thank the administrative bureau of Hetao Irrigation District, Inner Mongolia, China, for providing the experimental site and technical support.

Conflicts of Interest

The authors declare no conflict of interest.

References

  1. Sinclair, T.R.; Rufty, T.W. Nitrogen and water resources commonly limit crop yield increases, not necessarily plant genetics. Glob. Food Secur. 2012, 1, 94–98. [Google Scholar] [CrossRef]
  2. Quan, Z.; Zhang, X.; Davidson, E.A.; Zhu, F.; Li, S.; Zhao, X.; Chen, X.; Zhang, L.M.; He, J.Z.; Wei, W.; et al. Fates and use efficiency of nitrogen fertilizer in maize cropping systems and their responses to technologies and management practices: A global analysis on field 15-N tracer studies. Earth’s Future 2021, 9, e2020EF001514. [Google Scholar] [CrossRef]
  3. Luo, L.; Zhang, Y.; Xu, G. How does nitrogen shape plant architecture? J. Exp. Bot. 2020, 71, 4415–4427. [Google Scholar] [CrossRef]
  4. Zörb, C.; Geilfus, C.M.; Dietz, K.J. Salinity and crop yield. Plant Biol. 2019, 21, 31–38. [Google Scholar] [CrossRef] [PubMed]
  5. Zeng, W.Z.; Xu, C.; Wu, J.W.; Huang, J.S.; Ma, T. Effect of salinity on soil respiration and nitrogen dynamics. Ecol. Chem. Eng. S 2013, 20, 519–530. [Google Scholar] [CrossRef] [Green Version]
  6. Tao, J.Y.; Yang, J.S.; Yao, R.J.; Wang, X.P.; Liu, G.M.; Chen, Q. Effects of soil salinity on nitrogen transformation in Hetao Irrigation District of Inner Mongolia, China. Soils 2020, 52, 802–810, (In Chinese with English Abstract). [Google Scholar] [CrossRef]
  7. Han, J.; Shi, J.; Zeng, L.; Xu, J.; Wu, L. Effects of nitrogen fertilization on the acidity and salinity of greenhouse soils. Environ. Sci. Pollut. Res. 2015, 22, 2976–2986. [Google Scholar] [CrossRef]
  8. Villa-Castorena, M.; Ulery, A.L.; Catalánvalencia, E.A.; Remmenga, M.D. Salinity and nitrogen rate effects on the growth and yield of chile pepper plants. Soil Sci. Soc. Am. J. 2003, 67, 1781–1789. [Google Scholar] [CrossRef]
  9. Ju, X.T.; Kou, C.L.; Christie, P.; Dou, Z.X.; Zhang, F.S. Changes in the soil environment from excessive application of fertilizers and manures to two contrasting intensive cropping systems on North China Plain. Environ. Pollut. 2007, 145, 497–506. [Google Scholar] [CrossRef] [Green Version]
  10. Esmaili, E.; Kapourchal, A.; Malakouti, J.; Homaee, M. Interactive effect of salinity and two nitrogen fertilizers on growth and composition of sorghum. Plant Soil Environ. 2008, 54, 537–546. [Google Scholar] [CrossRef] [Green Version]
  11. Chen, W.; Hou, Z.; Wu, L.; Liang, Y.; Wei, C. Effects of salinity and nitrogen on cotton growth in arid environment. Plant Soil 2010, 326, 61–73. [Google Scholar] [CrossRef] [Green Version]
  12. Zeng, W.Z.; Xu, C.; Huang, J.S.; Wu, J.W.; Ma, T. Emergence rate, yield, and nitrogen-use efficiency of sunflowers (Helianthus annuus) vary with soil salinity and amount of nitrogen applied. Commun. Soil Sci. Plant Anal. 2015, 46, 1006–1023. [Google Scholar] [CrossRef]
  13. Che, Z.; Wang, J.; Li, J. Effects of water quality, irrigation amount and nitrogen applied on soil salinity and cotton production under mulched drip irrigation in arid Northwest China. Agric. Water Manag. 2021, 247, 106738. [Google Scholar] [CrossRef]
  14. Mansour, M.F. Nitrogen containing compounds and adaptation of plants to salinity stress. Biol. Plant 2000, 43, 491–500. [Google Scholar] [CrossRef]
  15. Dong, H.Z. Technology and field management for controlling soil salinity effects on cotton. Aust. J. Crop Sci. 2012, 6, 333–341. [Google Scholar]
  16. Ma, T.; Zeng, W.Z.; Li, Q.; Yang, X.; Wu, J.W.; Huang, J.S. Shoot and root biomass allocation of sunflower varying with soil salinity and nitrogen applications. Agron. J. 2017, 109, 2545–2555. [Google Scholar] [CrossRef]
  17. Ma, T.; Zeng, W.Z.; Lei, G.Q.; Wu, J.W.; Huang, J.S. Predicting the rooting depth, dynamic root distribution and the yield of sunflower under different soil salinity and nitrogen applications. Ind. Crops Prod. 2021, 170, 113749. [Google Scholar] [CrossRef]
  18. Sharma, L.K.; Bali, S.K. A review of methods to improve nitrogen use efficiency in agriculture. Sustainability 2018, 10, 51. [Google Scholar] [CrossRef] [Green Version]
  19. Devkota, M.; Martius, C.; Lamers, J.P.A.; Sayre, K.D.; Devkota, K.P.; Vlek, P.L.G. Tillage and nitrogen fertilization effects on yield and nitrogen use efficiency of irrigated cotton. Soil Tillage Res. 2013, 134, 72–82. [Google Scholar] [CrossRef]
  20. Ashraf, M.; Shahzad, S.M.; Imtiaz, M.; Rizwan, M.S.; Arif, M.S.; Kausar, R. Nitrogen nutrition and adaptation of glycophytes to saline environment: A review. Arch. Agron. Soil Sci. 2018, 64, 1181–1206. [Google Scholar] [CrossRef]
  21. Zeng, W.Z.; Xu, C.; Wu, J.W.; Huang, J.S. Sunflower seed yield estimation under the interaction of soil salinity and nitrogen application. Field Crops Res. 2016, 198, 1–15. [Google Scholar] [CrossRef]
  22. Liu, G.H.; Zhou, B.B.; Hou, Y.L.; Duan, M.L.; Ning, S.R.; Wang, Q.J. Effects of nitrogen on winter wheat growth under different salt stress. J. Irrig. Drain. 2019, 38, 36–40, (In Chinese with English Abstract). [Google Scholar] [CrossRef]
  23. Pei, C.Z.; Ma, T.; Liu, C.; Li, Q.; Fu, F.; Wu, J.W.; Huang, J.S. Influence of different nitrogen application rates on SPAD values of sunflower in saline field. Soil Fert. Sci. China 2016, 6, 111–115, (In Chinese with English Abstract). [Google Scholar] [CrossRef]
  24. Zhang, J.F.; Wang, Z.H.; Zhang, J.Z.; Dou, Y.Q.; Hou, Y.S. The influences of different nitrogen and salt levels interactions on fluorescence characteristics, yield and quality of processed tomato under drip irrigation. Sci. Agric. Sin. 2020, 53, 990–1003, (In Chinese with English Abstract). [Google Scholar] [CrossRef]
  25. Katerji, N.; Van Hoorn, J.W.; Hamdy, A.; Mastrorilli, M. Salt tolerance classification of crops according to soil salinity and to water stress day index. Agric. Water Manag. 2000, 43, 99–109. [Google Scholar] [CrossRef]
  26. Ma, T.; Zeng, W.Z.; Wu, J.W.; Ding, J.H.; Yu, S.E.; Huang, J.S. Sunflower canopy development, radiation absorption and use efficiency at different nitrogen application rates in saline fields. Trans. Chin. Soc. Agric. Mach. 2020, 51, 292–303, (In Chinese with English Abstract). [Google Scholar] [CrossRef]
  27. Hachicha, M.; Mansour, M.; Rejeb, S.; Mougou, R.; Askrim, H.; Abdegawed, J. Applied research for the utilization of brackish/saline water in Central Tunisia: Water use, salinity evolution and crop response. In Proceedings of the International Salinity Forum, Riverside, CA, USA, 25–27 April 2005. [Google Scholar]
  28. Zeng, W.Z.; Xu, C.; Wu, J.W.; Huang, J.S.; Zhao, Q.; Wu, M.S. Impacts of salinity and nitrogen on the photosynthetic rate and growth of sunflowers (Helianthus annuus L.). Pedosphere 2014, 24, 635–644. [Google Scholar] [CrossRef]
  29. Schneiter, A.; Miller, J. Description of Sunflower Growth Stages. Crop Sci. 1981, 21, 901–903. [Google Scholar] [CrossRef]
  30. Pontes, F.; Carneiro, M.; Vaitsman, D.; da Rocha, G.; da Silva, L.; Neto, A.; Monteiro, M. A simplified version of the total Kjeldahl nitrogen method using an ammonia extraction ultrasound-assisted purge-and-trap system and ion chromatography for analyses of geological samples. Anal. Chim. Acta 2009, 632, 284–288. [Google Scholar] [CrossRef]
  31. Xu, D.Q. Some problems in stomatal limitation analysis of photosynthesis. Plant Physiol. Commun. 1997, 33, 241–244, (In Chinese with English Abstract). [Google Scholar] [CrossRef]
  32. Wen, B.B.; Li, C.; Fu, X.L.; Li, D.M.; Li, L.; Chen, X.D.; Wu, H.Y.; Cui, X.W.; Zhang, X.H.; Shen, H.Y.; et al. Effects of nitrate deficiency on nitrate assimilation and chlorophyll synthesis of detached apple leaves. Plant Physiol. Biochem. 2019, 142, 363–371. [Google Scholar] [CrossRef] [PubMed]
  33. Gaudinier, A.; Rodriguez-Medina, J.; Zhang, L.; Olson, A.; Liseron-Monfils, C.; Bågman, A.-M.; Foret, J.; Abbitt, S.; Tang, M.; Li, B.; et al. Transcriptional regulation of nitrogen-associated metabolism and growth. Nature 2018, 563, 259–264. [Google Scholar] [CrossRef]
  34. Jia, K.; Yan, C.; Yan, H.; Gao, J. Physiological responses of turnip (Brassica rapa L. subsp. rapa) seedlings to salt stress. HortScience 2020, 55, 1567–1574. [Google Scholar] [CrossRef]
  35. Hichem, H.; El Naceur, A.; Mounir, D. Effects of salt stress on photosynthesis, PSII photochemistry and thermal energy dissipation in leaves of two corn (Zea mays L.) varieties. Photosynthetica 2009, 47, 517–526. [Google Scholar] [CrossRef]
  36. Zhang, D.M.; Li, W.J.; Xin, C.S.; Tang, W.; Eneji, E.; Dong, H.Z. Lint yield and nitrogen use efficiency of field-grown cotton vary with soil salinity and nitrogen application rate. Field Crops Res. 2012, 138, 63–70. [Google Scholar] [CrossRef]
  37. Hong, M.H.; Zeng, W.Z.; Ma, T.; Lei, G.Q.; Zha, Y.Y.; Fang, Y.H.; Wu, J.W.; Huang, J.S. Determination of Growth Stage-Specific Crop Coefficients (Kc) of Sunflowers (Helianthus annuus L.) under Salt Stress. Water 2017, 9, 215. [Google Scholar] [CrossRef] [Green Version]
  38. Pei, L.; Wang, Z.H.; Zheng, X.R.; Li, W.H. Effects of soil salt content on water-salt dynamic and photosynthetic characteristics of drip irrigated silage maize in sequential cropping systems. Agric. Res. Arid Areas 2016, 34, 77–84, (In Chinese with English Abstract). [Google Scholar] [CrossRef]
  39. Ma, T.; Zeng, W.Z.; Li, Q.; Wu, J.W.; Huang, J.S. Effects of water, salt and nitrogen stress on sunflower (Helianthus annuus L.) at different growth stages. J. Soil Sci. Plant Nutr. 2016, 16, 1024–1037. [Google Scholar] [CrossRef]
  40. Ciampitti, I.A.; Vyn, T.J. Physiological perspectives of changes over time in maize yield dependency on nitrogen uptake and associated nitrogen efficiencies: A review. Field Crops Res. 2012, 133, 48–67. [Google Scholar] [CrossRef]
  41. Wang, X.; Wang, G.; Turner, N.C.; Xing, Y.; Li, M.; Guo, T. Determining optimal mulching, planting density, and nitrogen application to increase maize grain yield and nitrogen translocation efficiency in Northwest China. BMC Plant Biol. 2020, 20, 282. [Google Scholar] [CrossRef]
  42. Zhang, L.; Zhang, M.; Li, Y.; Li, J.; Jing, Y.; Xiang, Y.; Yao, B.; Deng, Q. Linkage of crop productivity to soil nitrogen dynamics under biochar addition: A meta-analysis across field studies. Agronomy 2022, 12, 247. [Google Scholar] [CrossRef]
  43. Zhang, J.; Wang, W.; Krienke, B.; Cao, Q.; Zhu, Y.; Cao, W.; Liu, X. In-season variable rate nitrogen recommendation for wheat precision production supported by fixed-wing UAV imagery. Precis. Agric. 2021, 22, 364–386. [Google Scholar] [CrossRef]
  44. Yan, F.L.; Zhang, F.C.; Fan, X.K.; Wang, Y.; Guo, J.J.; Zhang, C.Y. Effects of water and nitrogen fertilizer supply on yield and nitrogen absorption and utilization efficiency of spring maize in sandy soil area in Ningxia. Trans. Chin. Soc. Agric. Mach. 2020, 51, 283–293, (In Chinese with English Abstract). [Google Scholar] [CrossRef]
  45. Zubillaga, M.; Aristi, P.; Lavado, S. Effect of phosphorus and nitrogen fertilization on sunflower (Helianthus annus L.) nitrogen uptake and yield. J. Agron. Crop Sci. 2002, 188, 267–274. [Google Scholar] [CrossRef]
  46. Murtaza, G.; Azooz, M.M.; Murtaza, B.; Usman, Y.; Saqib, M. Nitrogen-use-efficiency (NUE) in plants under nacl stress. In Salt Stress in Plants; Ahmad, P., Azooz, M.M., Prasad, M.N.V., Eds.; Springer: New York, NY, USA, 2013. [Google Scholar] [CrossRef]
  47. Acosta-Motos, J.R.; Ortuño, M.F.; Bernal-Vicente, A.; Diaz-Vivancos, P.; Sanchez-Blanco, M.J.; Hernandez, J.A. Plant responses to salt stress: Adaptive mechanisms. Agronomy 2017, 7, 18. [Google Scholar] [CrossRef] [Green Version]
  48. Onoda, Y.; Hikosaka, K.; Hirose, T. Allocation of nitrogen to cell walls decreases photosynthetic nitrogen-use efficiency. Funct. Ecol. 2004, 18, 419–425. [Google Scholar] [CrossRef]
  49. Hikosaka, K. Interspecific difference in the photosynthesis–nitrogen relationship: Patterns, physiological causes, and ecological importance. J. Plant Res. 2004, 117, 481–494. [Google Scholar] [CrossRef] [PubMed]
  50. Nasar, J.; Khan, W.; Khan, M.Z.; Gitari, H.I.; Gbolayori, J.F.; Moussa, A.A.; Mandozai, A.; Rizwan, N.; Anwari, G.; Maroof, S.M. Photosynthetic activities and photosynthetic nitrogen use efficiency of maize crop under different planting patterns and nitrogen fertilization. J. Soil Sci. Plant Nutr. 2021, 21, 2274–2284. [Google Scholar] [CrossRef]
  51. Nandy, P.; Das, S.; Ghose, M.; Spooner, R. Effects of salinity on photosynthesis, leaf anatomy, ion accumulation and photosynthetic nitrogen use efficiency in five Indian mangroves. Wetlands Ecol. Manag. 2007, 15, 347–357. [Google Scholar] [CrossRef]
  52. Debez, A.; Saadaoui, D.; Ramani, B.; Ouerghi, Z.; Koyro, H.; Huchzermeyer, B.; Abdelly, C. Leaf H+-ATPase activity and photosynthetic capacity of Cakile maritima under increasing salinity. Environ. Exp. Bot. 2006, 57, 285–295. [Google Scholar] [CrossRef]
  53. Dinh, T.H.; Watanabe, K.; Takaragawa, H.; Nakabaru, M.; Kawamitsu, Y. Photosynthetic response and nitrogen use efficiency of sugarcane under drought stress conditions with different nitrogen application levels. Plant Prod. Sci. 2017, 20, 412–422. [Google Scholar] [CrossRef] [Green Version]
Figure 1. Sunflower net photosynthetic rate (Pn) at different observation times under different treatments in 2016. The horizontal coordinate represents days after sowing, the data were averaged measurements from the three fixed sunflower plants (n = 15), and vertical bars indicate the standard error. In the legends, S0, S1, and S2 indicate different levels of initial soil salinity (low, medium, and high); N1 and N3 indicate different N application rates (low and high); and their combinations represent different treatments. Different lowercase letters above the bars represent significant differences at 0.05 levels under the N1 level; different uppercase letters above the bars represent significant differences at 0.05 levels under the N3 level.
Water 14 00982 g001
Figure 2. Sunflower stomatal conductance (Gs) at different observation times under different treatments in 2016. The horizontal coordinate represents days after sowing, the data were averaged measurements from the three fixed sunflower plants (n = 15), and vertical bars indicate the standard error. In the legends, S0, S1, and S2 indicate different levels of initial soil salinity (low, medium, and high); N1 and N3 indicate different N application rates (low and high); and their combinations represent different treatments. Different lowercase letters above the bars represent significant differences at 0.05 levels under the N1 level; different uppercase letters above the bars represent significant differences at 0.05 levels under the N3 level.
Water 14 00982 g002
Figure 3. Sunflower intercellular CO2 concentration (Ci) and stomatal limitation index (Ls) at different observation times under different treatments in 2016. The horizontal coordinate represents days after sowing, the data were averaged measurements from the three fixed sunflower plants (n = 15), and vertical bars indicate the standard error. In the legends, S0, S1, and S2 indicate different levels of initial soil salinity (low, medium, and high); N1 and N3 indicate different N application rates (low and high), and their combinations represent different treatments. Different lowercase letters above the bars represent significant differences at 0.05 levels under the N1 level; different uppercase letters above the bars represent significant differences at 0.05 levels under the N3 level.
Water 14 00982 g003
Figure 4. Sunflower leaf transpiration rate (Tr) at different observation times under different treatments in 2016. The horizontal coordinate represents days after sowing, the data were averaged measurements from the three fixed sunflower plants (n = 15), and vertical bars indicate the standard error. In the legends, S0, S1, and S2 indicate different levels of initial soil salinity (low, medium, and high); N1 and N3 indicate different N application rates (low and high); and their combinations represent different treatments. Different lowercase letters above the bars represent significant differences at 0.05 levels under the N1 level; different uppercase letters above the bars represent significant differences at 0.05 levels under the N3 level.
Water 14 00982 g004
Figure 5. Plant nitrogen uptake (PNU) of sunflower at different growth stages: (ac) in 2015; (df) in 2016. DAS = days after sowing. The data were averaged measurements from three sampled sunflower plants (n = 3), and the vertical bars indicate the standard error. In the legends, S0, S1, and S2 indicate different levels of initial soil salinity (low, medium, and high); N0, N1, N2, and N3 indicate different N application rates (extremely low, low, moderate, and high); and their combinations represent different treatments.
Water 14 00982 g005
Figure 6. The relationship between the plant nitrogen uptake (PNU) at maturity and sunflower seed yield (SY) of all the collected data in 2015 and 2016 (n = 36).
Water 14 00982 g006
Figure 7. Nitrogen content per unit leaf area (Narea) and photosynthetic nitrogen use efficiency (PNUE) of sunflower at different growth stages in 2016: (ac) the Narea at 52, 64, and 106 days after sowing (DAS); (df) the PNUE at 52, 64, and 106 DAS. In the legends, S0, S1, and S2 indicate different levels of initial soil salinity (low, medium, and high); N1 and N3 indicate different N application rates (low and high); and their combinations represent different treatments. The data were averaged measurements from three sampled sunflower plants (n = 3), the vertical bars indicate the standard error, and different letters located at the end of the radial lines represent significant differences at 0.05 levels between the corresponding treatments measured at the same time.
Water 14 00982 g007
Table 1. The initial soil salinity (IS) levels and nitrogen application rates (N rates) of different treatments in the field experiments of 2015 and 2016.
YearsTreatmentsS N RateBasal N RateTop-Dressed N Rate
dS/mkg/ha kg/ha kg/ha
2015S0N01.87845450
S0N21.7231354590
S1N05.01745450
S1N25.8981354590
S2N08.15745450
S2N29.0351354590
2016S0N12.61390900
S0N32.2271809090
S1N14.73190900
S1N35.5151809090
S2N16.84790900
S2N37.1581809090
Note: IS indicates the average ECe (electrical conductivity of a saturated-paste extract) values at a 0 to 60 cm depth before sowing.
Table 2. Sunflower seed yield (SY), N productive efficiency (NPE), N uptake efficiency (NUPE), and N utilization efficiency (NUTE) in the field experiments of 2015 and 2016.
YearsTreatmentsN RateSYNPENUPENUTE
kg/hakg/hakg/(kg N)kg/kgkg/(kg N)
2015S0N0 456161.6 ± 172.5 ab †136.9 ± 3.3 a10.2 ± 1.1 a13.5 ± 1.1 b
S0N21357436.3 ± 1119.7 a55.1 ± 7.0 c3.6 ± 0.4 c15.5 ± 0.1 a
S1N0454608.5 ± 1342.2 b102.4 ± 25.4 b10.4 ± 0.9 a9.9 ± 1.6 c
S1N21354853.4 ± 966.4 b36.0 ± 6.1 cd3.4 ± 0.4 c10.7 ± 0.6 c
S2N0453693.0 ± 1249.6 b82.1 ± 23.6 b7.0 ± 1.1 b11.7 ± 1.6 c
S2N21353558.5 ± 685.5 b26.4 ± 4.3 d1.8 ± 0.3 d14.4 ± 0.2 ab
2016S0N1906589.9 ± 87.5 ab73.2 ± 1.0 a5.6 ± 1.1 a13.1 ± 2.6 a
S0N31807734.9 ± 1148.5 a43.0 ± 6.4 bc3.3 ± 0.4 bc13.2 ± 0.2 a
S1N1905037.8 ± 1433.1 b56.0 ± 16.0 b5.1 ± 1.0 a11.0 ± 1.0 ab
S1N31805533.2 ± 1338.1 b30.7 ± 7.4 cd3.0 ± 0.6 bc10.1 ± 0.5 b
S2N1904061.3 ± 766.8 b45.1 ± 8.5 bc4.2 ± 0.3 ab10.7 ± 1.2 ab
S2N31803849.5 ± 1330 b21.4 ± 7.4 d1.7 ± 0.3 c12.5 ± 2.3 ab
Notes: The data are means ± standard errors. Different letters next to standard errors in each column of the same year indicate significant differences at 0.05 levels. S0, S1, and S2 indicate different levels of initial soil salinity (low, medium, and high); N0, N1, N2, and N3 indicate different N application rates (extremely low, low, moderate, and high); and their combinations represent different treatments.
Publisher’s Note: MDPI stays neutral with regard to jurisdictional claims in published maps and institutional affiliations.

