
Ballast Water Management Strategy to Reduce the Impact of Introductions by Utilizing an Empirical Risk Model


1
Department of Shipping Technology, National Kaohsiung University of Science and Technology, 482 Zhongzhou 3rd Rd, Kaohsiung 805301, Taiwan
2
Institute of Ocean Technology and Marine Affairs, National Cheng Kung University, 1 University Road, Tainan 70101, Taiwan
3
Tainan Hydraulics Laboratory, National Cheng Kung University, 1 University Road, Tainan 70101, Taiwan
*
Author to whom correspondence should be addressed.
Water 2022, 14(6), 981; https://doi.org/10.3390/w14060981
Submission received: 11 February 2022
/
Revised: 11 March 2022
/
Accepted: 17 March 2022
/
Published: 20 March 2022
(This article belongs to the Special Issue The Relationship between Ships and Marine Environment)
Abstract
:The introduction of non-indigenous aquatic species (NIASs) was identified as one of the major threats to aquatic ecosystems. Shipping is one of the potential invasive pathways for the introduction of marine NIASs, mainly via ballast water, sediments, and ship fouling. In addition, The International Convention for the Control and Management of Ships’ Ballast Water and Sediments (BWM Convention) aims to mitigate the introduction risk of harmful aquatic organisms and pathogens (HAOPs) via ships’ ballast water and sediment. Some of these species can be very harmful and cause loss of biodiversity, adverse environmental consequences, and economic and social impacts. In this study, an empirical model based on the environmental similarity and the vessel characteristics was used to assess the risk associated with the ballast water, for the incoming vessels to the port of Kaohsiung and port of Riga. The priority for port state control (PSC) inspection was established and recommended for better ballast water management.
1. Introduction
The transfer of non-indigenous species beyond their natural range is expanding due to the increased transport and trade, and the unprecedented accessibility of goods resulting from globalization [1,2]. Non-indigenous aquatic species (NIASs) can be brought to new environments due to unintentional introduction resulting from human activities [3,4]. Some of these NIASs can be established in new environments and continue to spread. They have the potential to cause adverse effects on ecosystem integrity, biodiversity, socio-economic values, and human health outcome. These invasive species, or harmful aquatic organisms and pathogens (HAOPs), are widely recognized as a significant threat due to their far-reaching harmful effects on biodiversity and losses in economic values. Another category of marine pest, i.e., harmful aquatic organisms and pathogens (HAOPs), was defined by the International Maritime Organization (IMO) as organisms that may, if introduced, create hazards to the environment, human health, property, or resources, and impair biological diversity [5]. HAOPs can also alter ecosystem processes, reduce the value of water for human activities, and cause other socioeconomic consequences for human beings [6,7,8,9,10]. Hence, the management of HAOPs is of international concern since there is an increasing trend of global trade with the likelihood of spreading HAOPs.
About 90% of international trade involves the transportation of goods as sea freight, and rapid economic development has led to the continuous growth of the world’s fleet. A ship may carry over 1000 metric tons of seawater from a departing country as ballast water for a voyage, which will then be discharged in the port region of the destination country [11,12,13,14]. Shipping has been implicated in the introduction of numerous aquatic HAOPs, from protists and macrophytes to crustaceans and fishes [15]. There are many documented cases of HAOP introductions through ship ballast water around the world that have caused a significant impact on the environment and economic development [16,17]. As a global response to mitigating the risk of introducing HAOPs via shipping, the International Maritime Organization (IMO) adopted “International Convention on the Control and Management of Ships’ Ballast Water and Sediments” (hereafter the BWM Convention) in 2004 [18]. The BWM Convention entered into force on 8 September 2017, with 67 states rectifying the BWM Convention, accounting for 74.91% of the total tonnage of the global merchant fleet [19,20,21].
The BWM Convention requires all ships to implement a ballast water management plan [22,23]. All ships must carry a ballast water record book and are required to carry out ballast water management procedures to a given standard. Parties to the Convention are given the option to take additional measures, which are subject to criteria set out in the Convention and by IMO guidelines. Implementation of the BWM Convention requires concerted international action involving different types of expertise to solve various technological, environmental, and socio-economic problems related to the ballast water management [24,25,26,27]. However, insufficient information regarding the risk of vessels related to ballast water will become a problem for implementing port state control (PSC). In this study, the environmental similarity and the characteristics of vessels as risk factors were utilized to establish a two-stage risk assessment for incoming vessels to two regional hubs, i.e., the port of Kaohsiung and port of Riga. Through the two-tiered screening processes of risk, the priority for PSC inspection can be established for all incoming vessels for better ballast water management. These inspections may include verifying valid documents, and/or sampling of the ship’s ballast water to meet the BWM Convention’s D-2 performance standard [28].
2. Research Method
2.1. Study Area and Vessels
The study area includes the port of Kaohsiung in Taiwan and the port of Riga in the Baltic Sea. Both ports were selected since they were the primary transshipment hub in each region. The port of Kaohsiung has the highest shipping volume in Taiwan, with comprehensive shipping-related data available. The port includes a ship information service area with a range of 20 nm centered on 22°36′50″ N and 120°17′4″ E. In this study, only the ocean-going merchant ships entering and leaving the port of Kaohsiung were investigated and fishing vessels, military ships, and special vessels were excluded. The Baltic Sea has been well-known for the invasion of various harmful NIASs through ballast water [29]. The port of Riga is a major port on 56°58′13″ N and 24°05′42″ E along the east coast of the Baltic Sea, located within the city limits of Riga, the capital of Latvia. In 2014, the port of Riga was the biggest port in the Baltic States by cargo turnover, which reached 37.1 million tons. Most is made up of transit cargoes to and from the Commonwealth of Independent States [30].
2.2. Data Acquisition and Analysis
The commercial shipping transit information for all the vessels arriving in the port of Kaohsiung and Riga during 2013–2015 was retrieved from the respective port authorities. Transit information from these international arrivals includes the date of entry, vessel name, IMO number, flag, type of vessel, port of origin, last port of call, next port of call, voyage routes, gross tonnage (GT), net tonnage (NT), and deadweight tonnage (DWT). In this study, two-tiered risk analysis was performed for the incoming vessels to the port of Kaohsiung and Riga, based on the environmental similarity in IMO’s guidelines and the empirical model established in a previous study [11,18,31].
2.2.1. First-Tier: Environmental Similarity Analysis
The environmental similarity in IMO’s guidelines of BWM Convention was utilized to assess the last ports of call with a similar salinity and temperature to the two target ports in this study [13,32,33,34]. The temperature of the global environment was divided into four major temperature regions: tropical, warm-temperate, cold-temperate, and Arctic/Antarctic (Polar) according to the world’s oceans. The temperature similarity between the source port and the target port determines the risk score. For example, the port of Kaohsiung is in a warm-temperate region, so the donor ports that are also warm-temperate are highly similar ports, indicating a higher risk for HOAP invasion. The risk of invasion was categorized as high, moderate, and low with scores of 3, 2, and 1, respectively (see Table 1). The salinity of the port of Kaohsiung is 30.7–33.4. If the difference between the salinity of the donor port and port of Kaohsiung was less than 3, it was listed as a highly similar port; a difference of 3–5 was considered a moderately similar port; and a difference of greater than 5 was considered as a less similar port. The risk score for invasion was given as 3, 2, and 1, respectively (see Table 1). A similar evaluation criterion was also established for the port of Riga. Furthermore, in the first stage of the risk assessment, the donor ports with five-point and six-point scores obtained by the two environmental factors (salinity and temperature) were the environmentally similar ports.
2.2.2. Tier-Two: Empirical Risk Model Analysis
In the second stage assessment, an empirical model in our previous study, i.e., Vessel’s Risk Level (VRL), was used with slight modification to determine the risk of introduction associated with ballast water and the vessel’s characteristic [10]:
VRL = 0.251 × RS + 0.215 × RT + 0.199 × RB + 0.167 × RV + 0.102 × RF + 0.034 × RFS + 0.031 × RST
The vessel’s risk level (VRL) has a maximum risk level of 3 when all of the 7 factors are in the high-risk category. The VRL for each incoming vessel can be determined using Equation (1). A vessel with a VRL greater than 2.5 was considered a high-risk vessel. VRL considers 7 risk factors, and its relative risk weights are shown in Table 2, which is calculated according to the analytic hierarchy process (AHP) expert questionnaire. The risk scores are also 3, 2, and 1 for vessels with high, moderate, and low risk of ballast water-mediated introduction, respectively (see Table 3). Based on the two-tiered risk analysis, the priority for port state control (PSC) inspection can be established for all incoming vessels to the port of Kaohsiung and port of Riga. Finally, administrative policy recommendations related to PSC were made in the face of the possible challenges in ballast water management that may emerge in the future.
3. Results and Discussion
3.1. Port of Kaohsiung
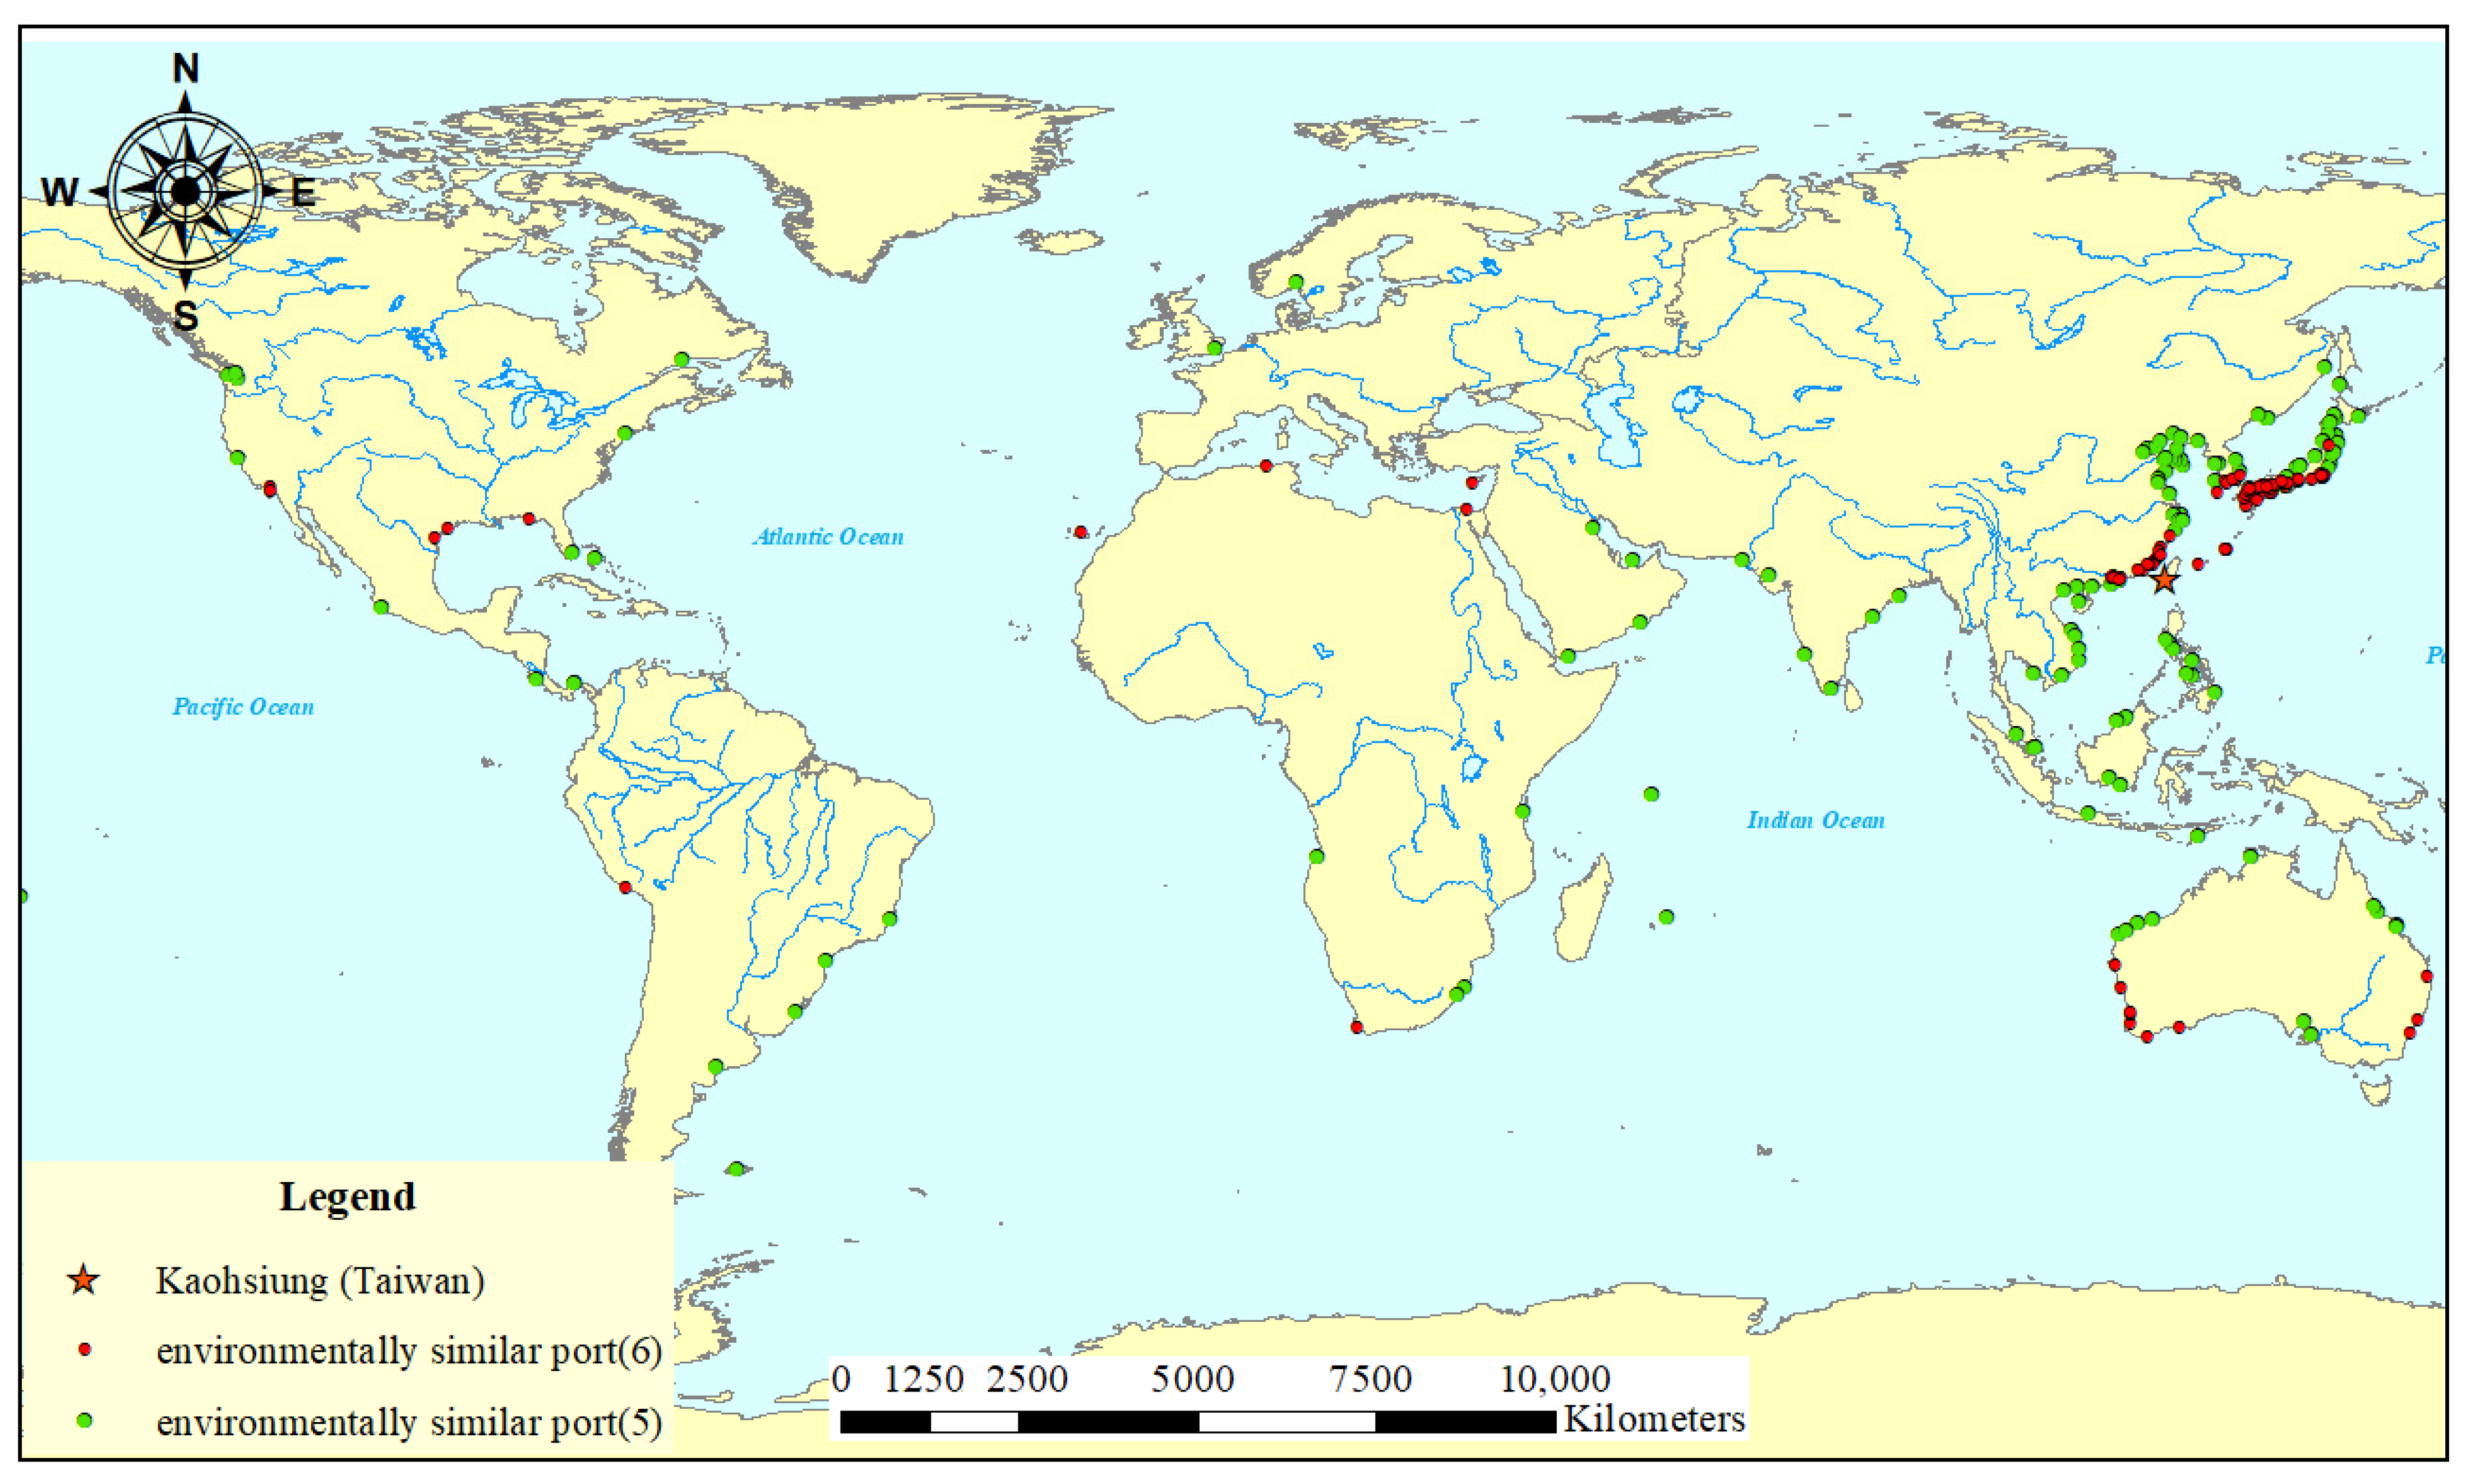
The tier-one analysis in this study was based on the environmental matching risk assessments in Guideline 7 of the BWM Convention. It compared environmental conditions, including temperature and salinity, between the donor port and the recipient port of Kaohsiung. After the tier one assessment, 262 out of 418 last ports of call were identified as having highly similar environmental conditions with the port of Kaohsiung (see Table 4 and Figure 1). About 70% of them are from Asia, mainly Japan, China, and South Korea, since they are Taiwan’s main trading partners with similar environmental conditions [11]. The tier one analysis only provides an indication of the likelihood of survival and the possible establishment of species that were transferred.
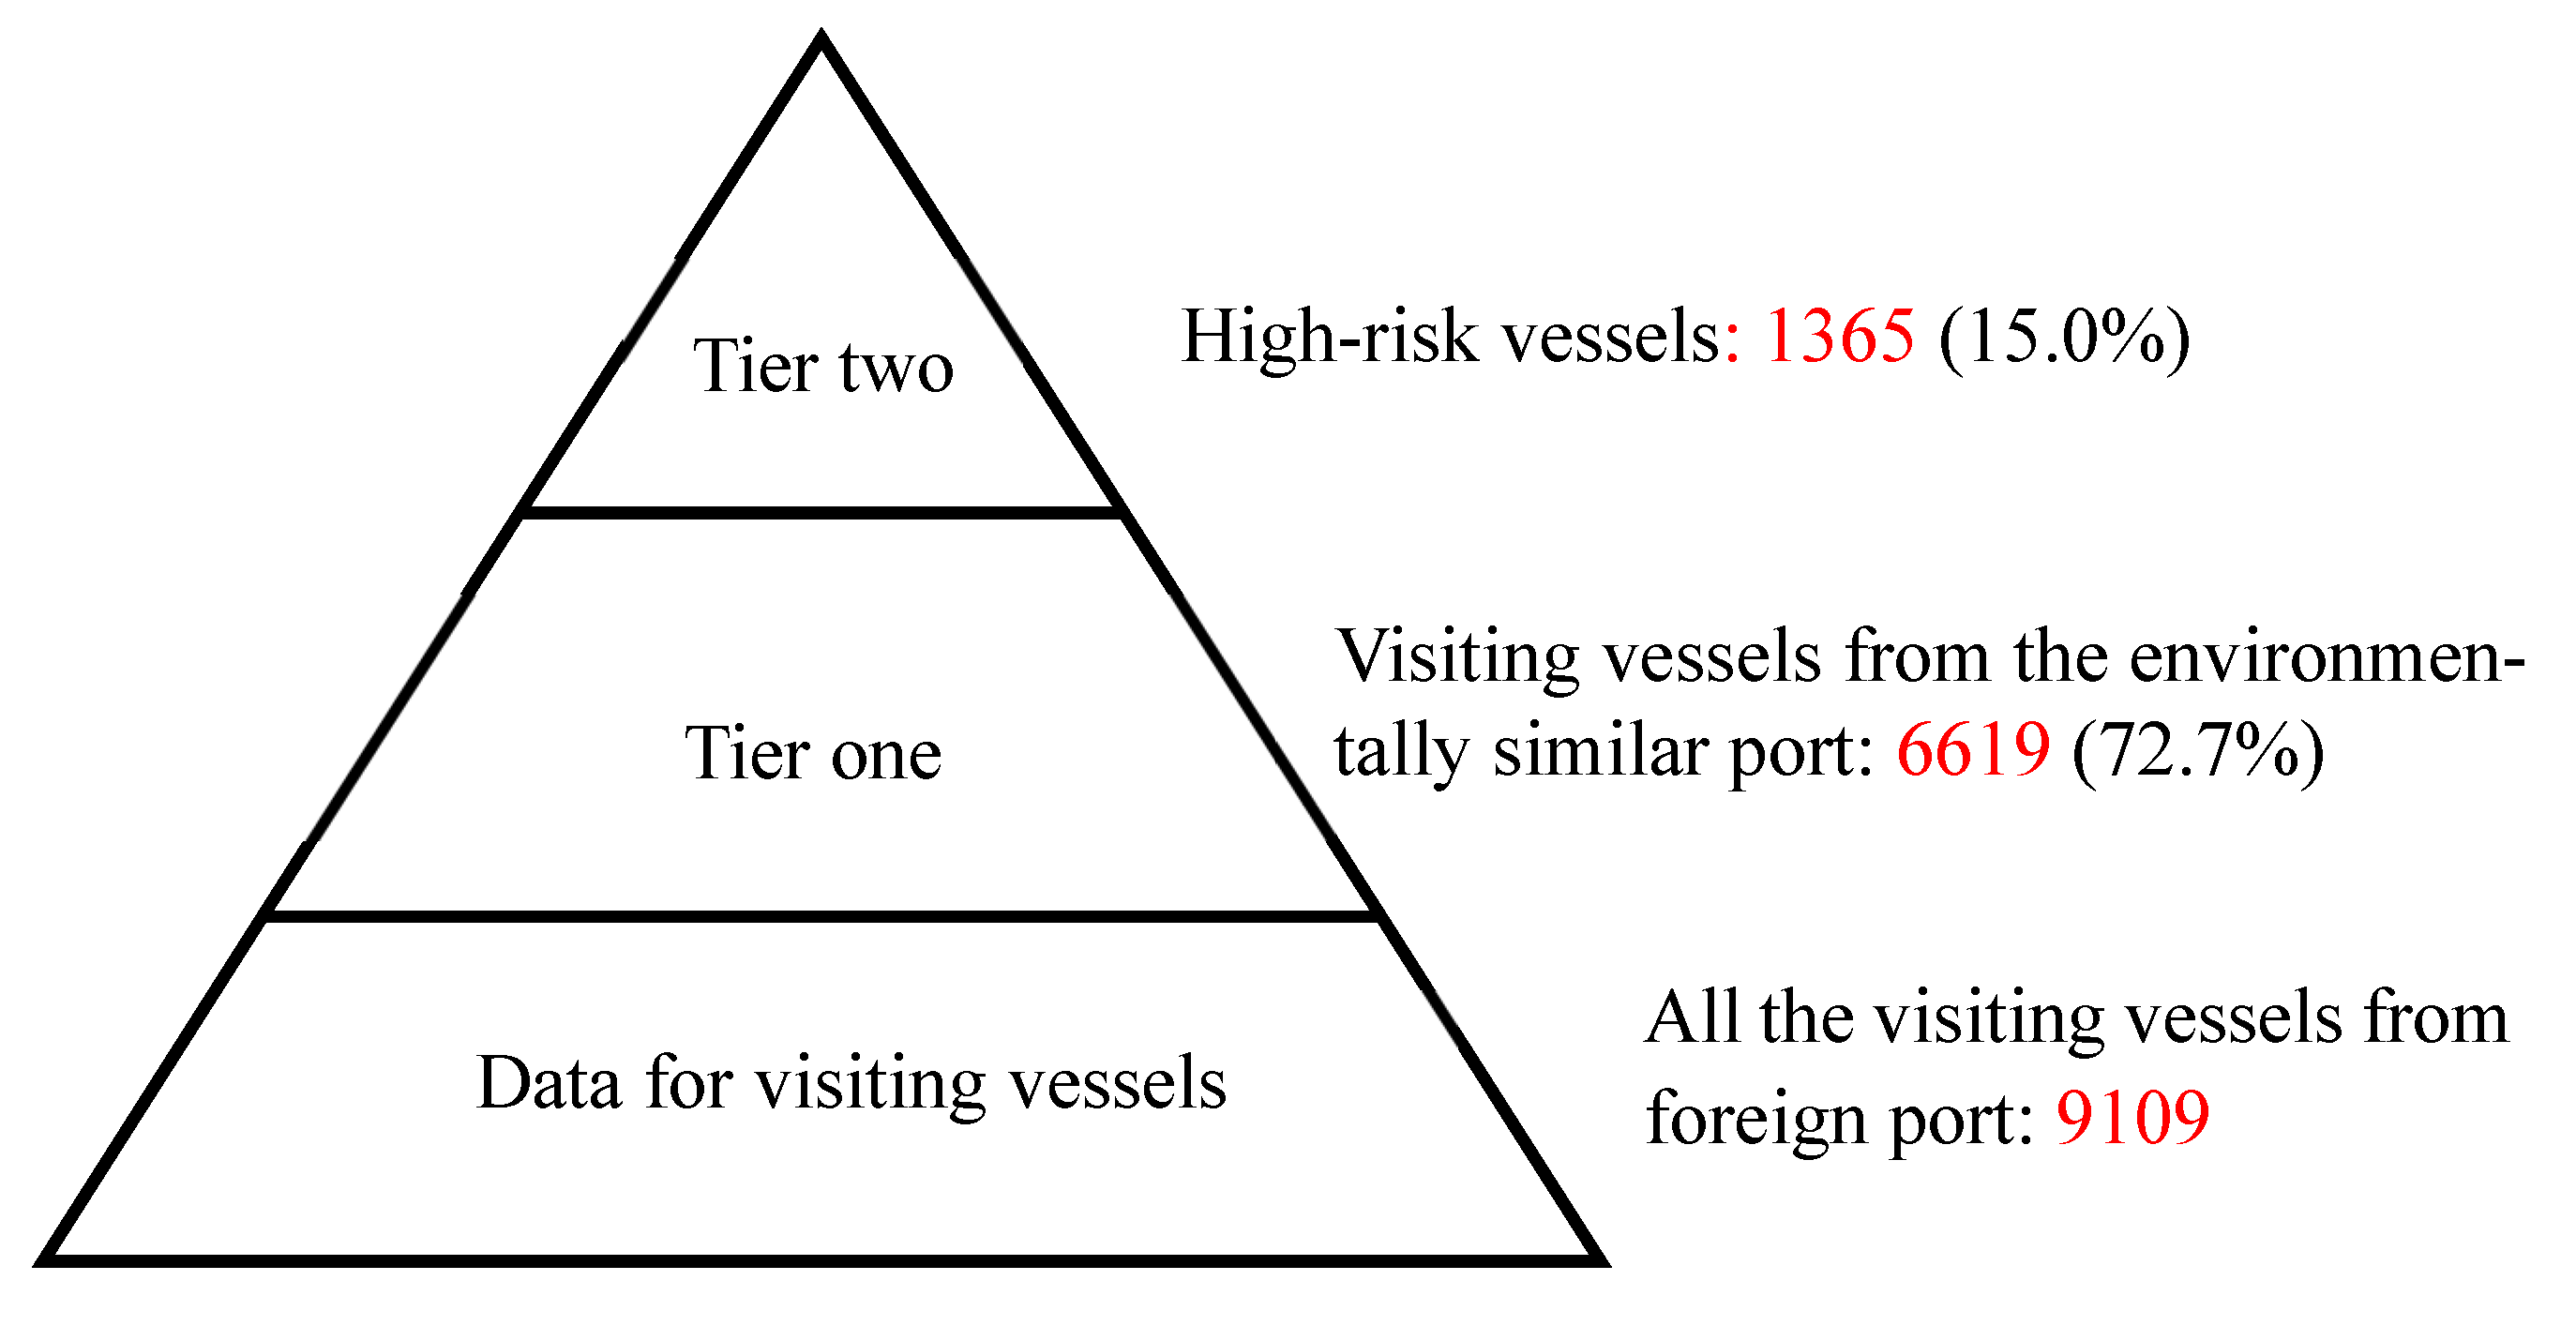
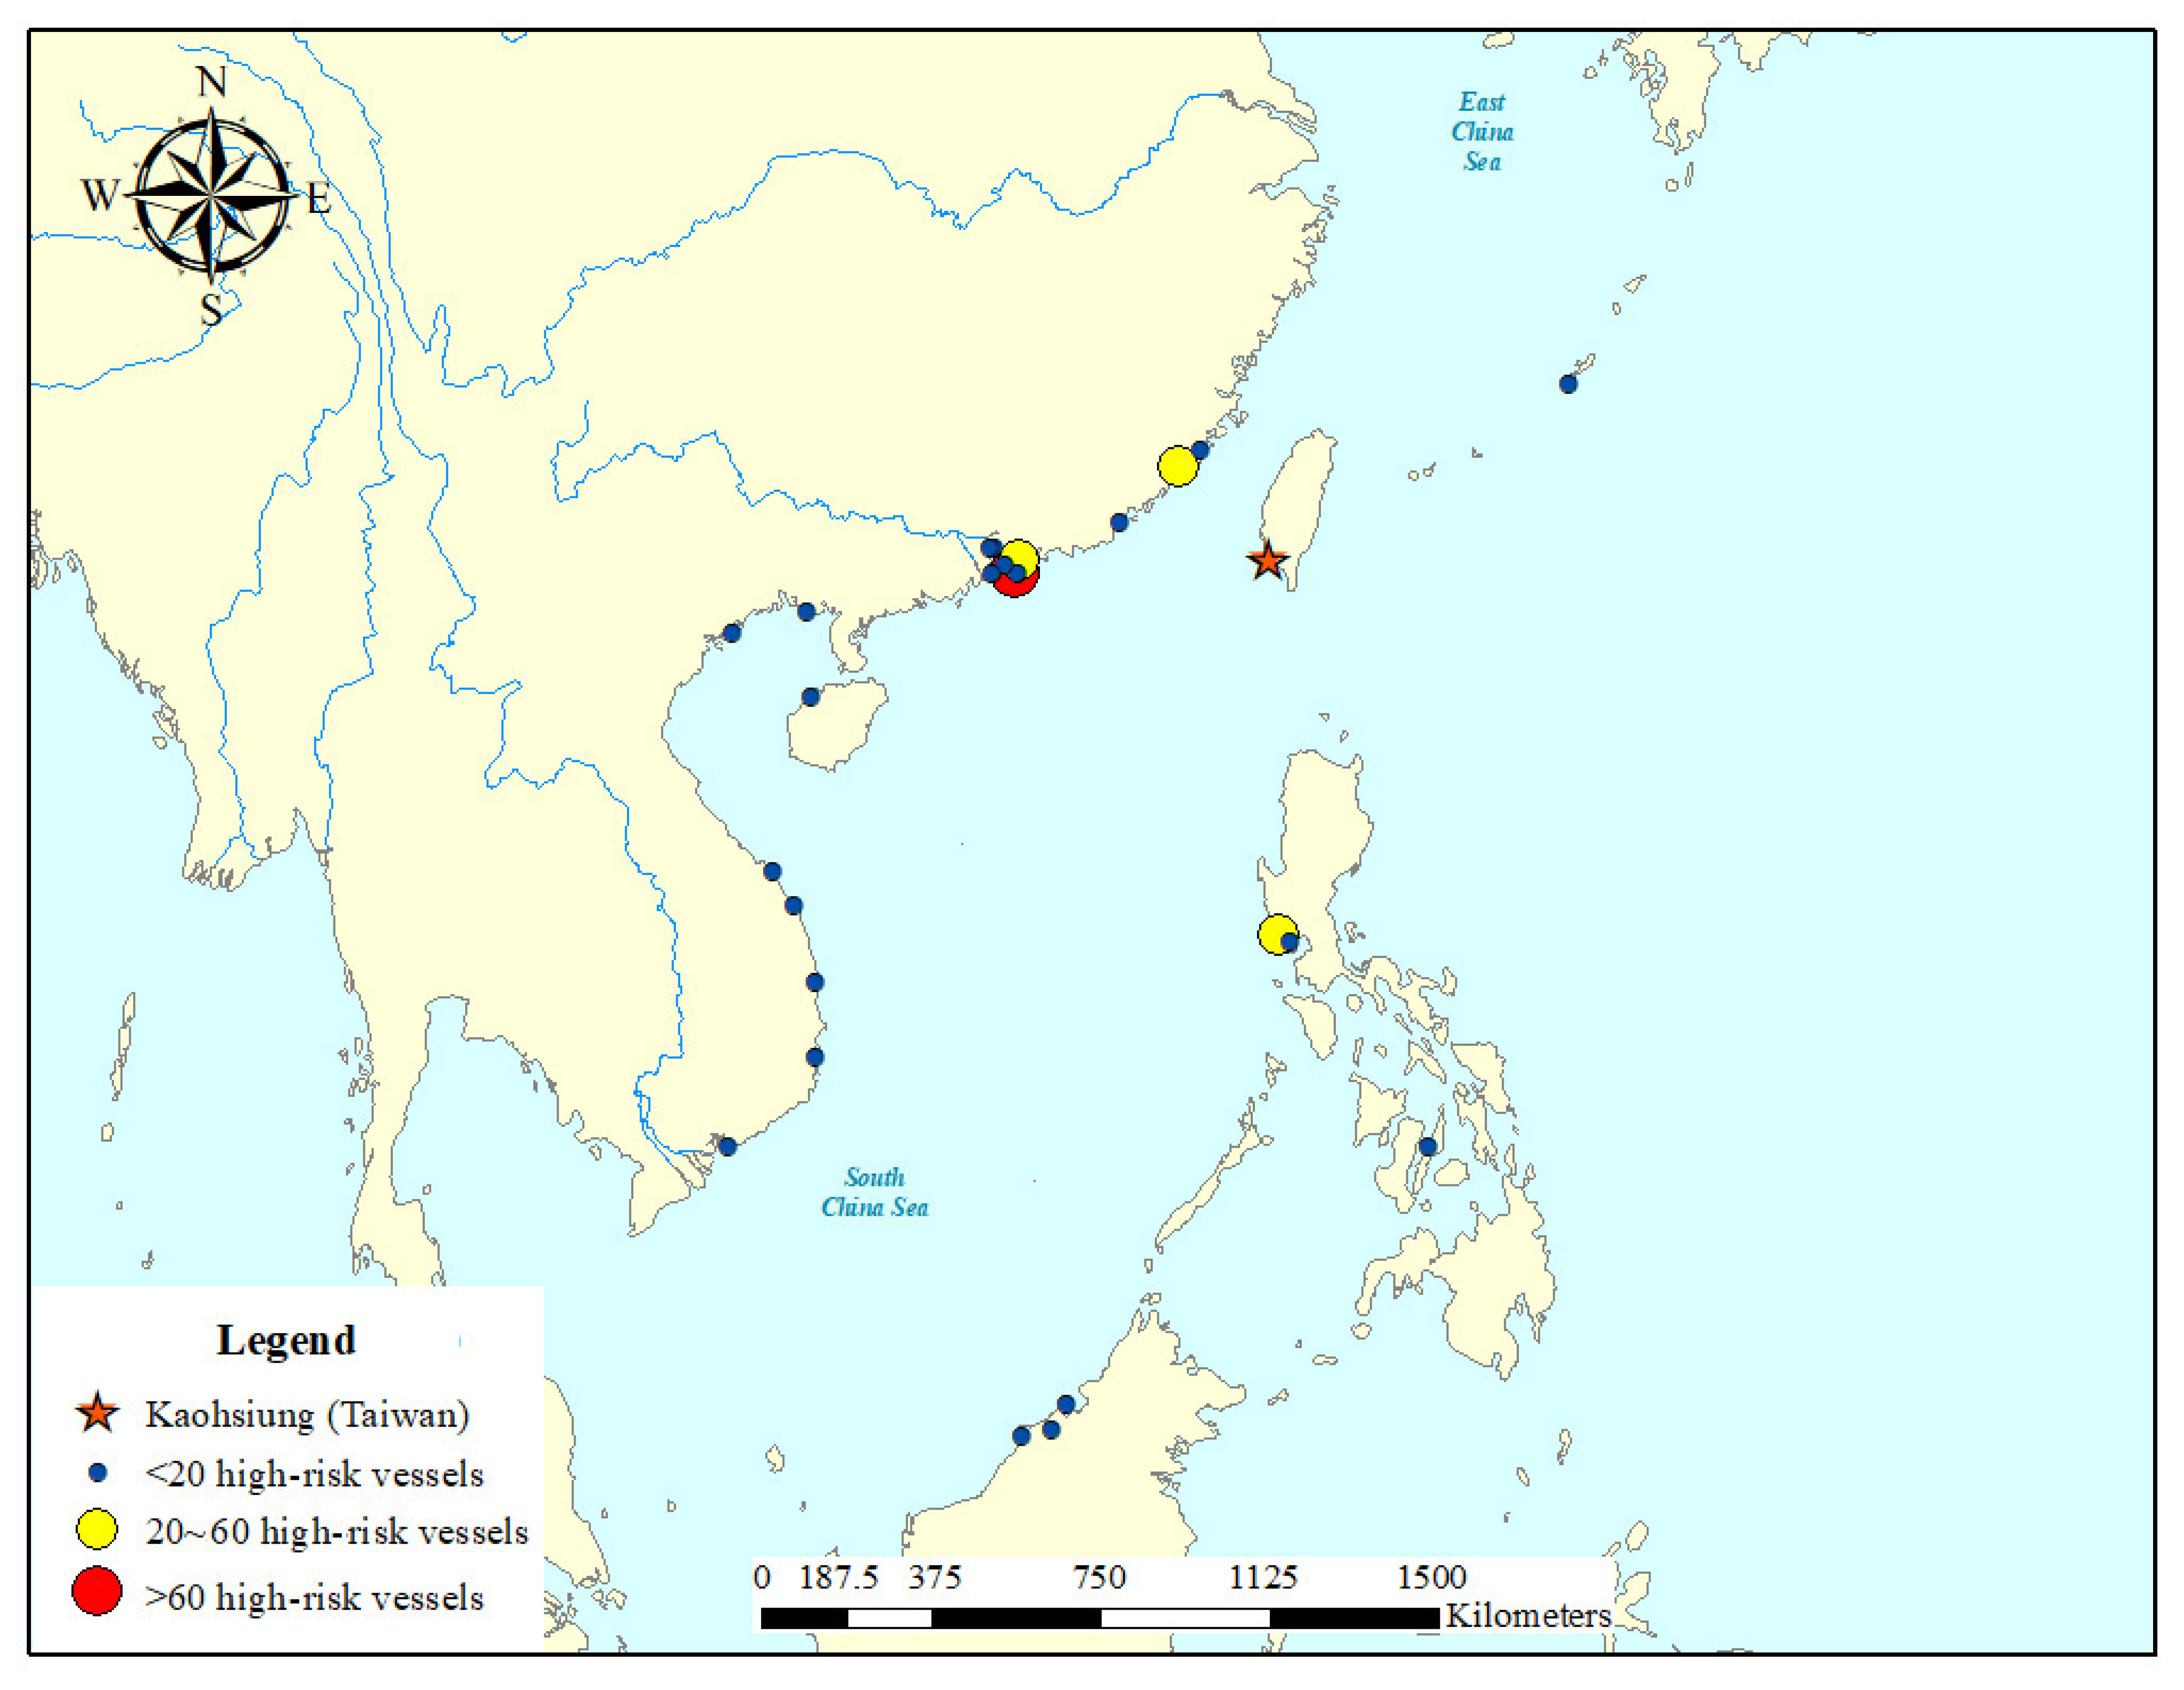
In the tier-two risk assessment, the empirical risk model was used to further assess the incoming vessels from the environmentally similar ports. Figure 2 shows the results of the two-tier risk assessment performed for the vessels that visited the port of Kaohsiung during 2013–2015. As shown in Figure 2, there were 1365 vessels in the high-risk category, representing about 15% of all visiting vessels. Figure 3 and Table 5 reveal that all the donor ports of high-risk vessels are located in Asian countries near the port of Kaohsiung. In Table 5, it can be seen that the donor ports with the highest number of high-risk vessels were the port of Hong Kong, followed by the port of Subic Bay in the Philippines, and the ports of Yantian and port of Ximen in China. The ships from these ports have a higher risk level because of the similar environmental conditions and shorter voyage time. The port of Hong Kong is the most frequent last port of call, accounting for 1073 arrivals during the study period. According to the results of this study, an average of about 1.2 high-risk vessels visited the port of Kaohsiung each day during 2013–2015. The two-tiered risk assessment helps the PSC officers to pick up the vessels that may possess more risk based on all the well-documented rick factors shown in the literature.
In this 3-year span, 1040 vessels made within 5 visits in each year, representing 76.2% of the high-risk vessels during 2013–2015. Less frequent vessels did not make repetitive visits in a short time span. Some vessels were even totally new to the port authority, which may become a problem for PSC inspection since previous records for ballast water compliance may not be available. The vessels that visited the port of Kaohsiung more than 50 times each year were from the ports in the southeast of China. The most frequent vessel visited the port of Kaohsiung more than 100 times each year.
3.2. Port of Riga
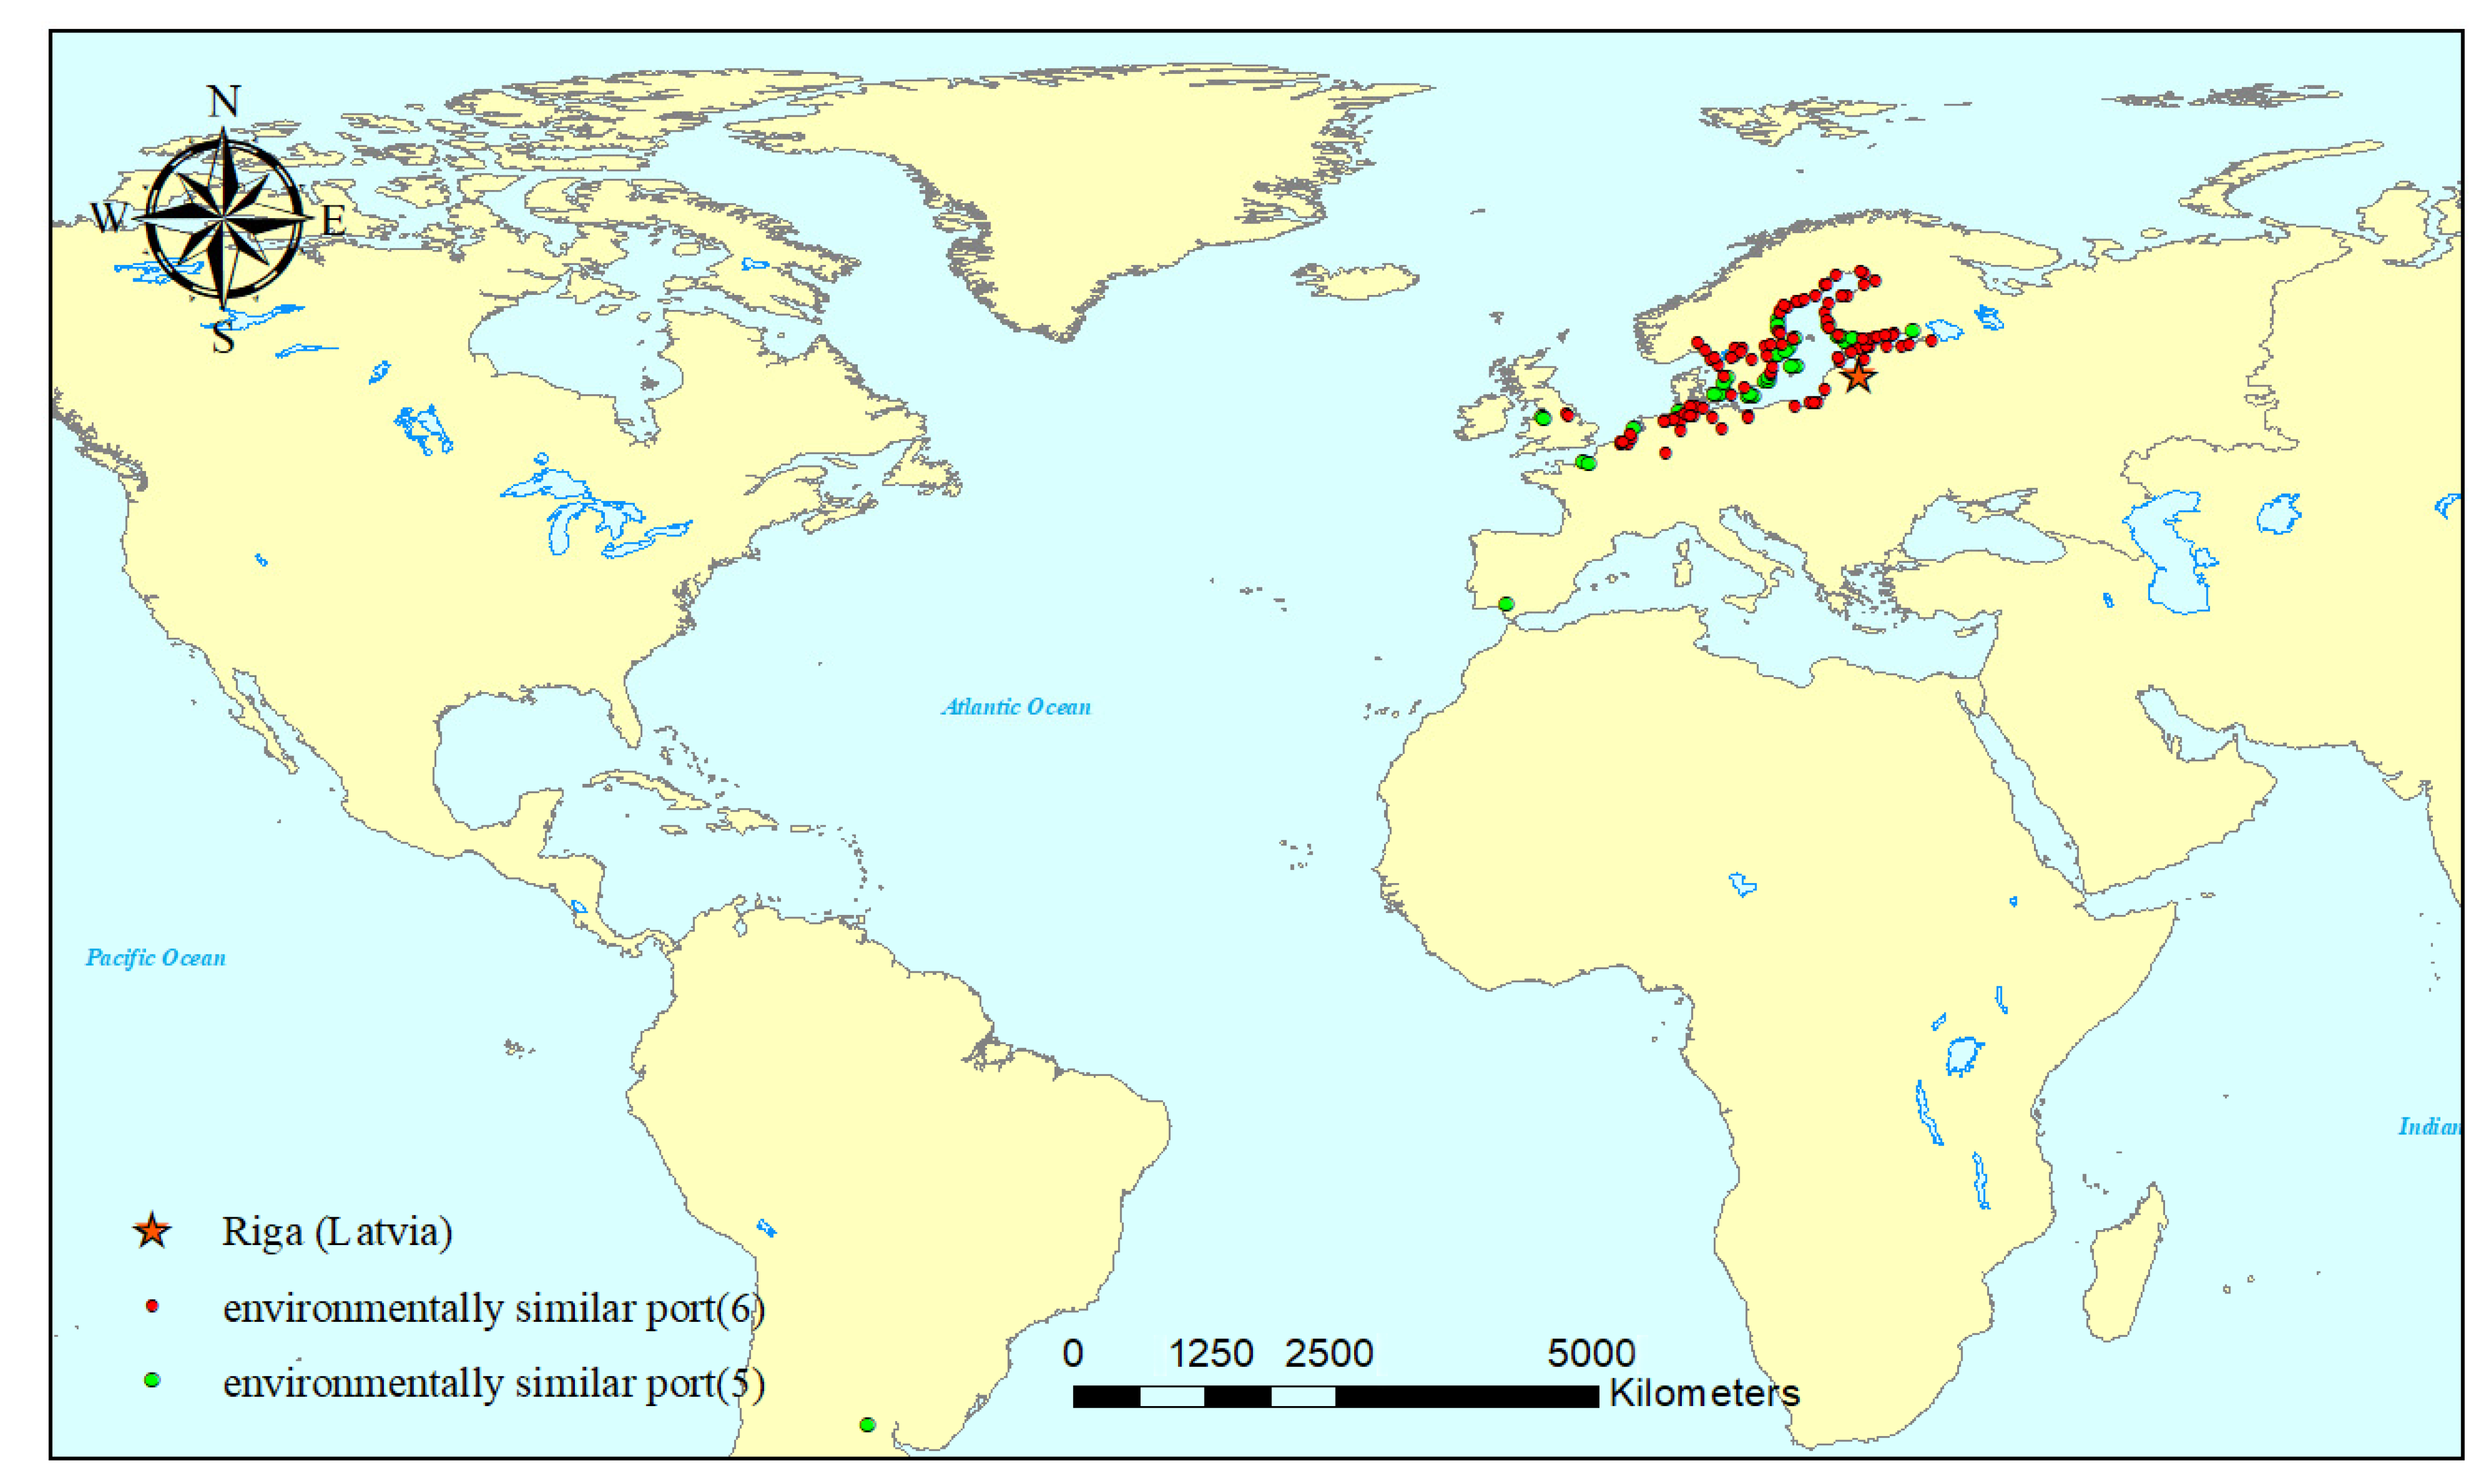
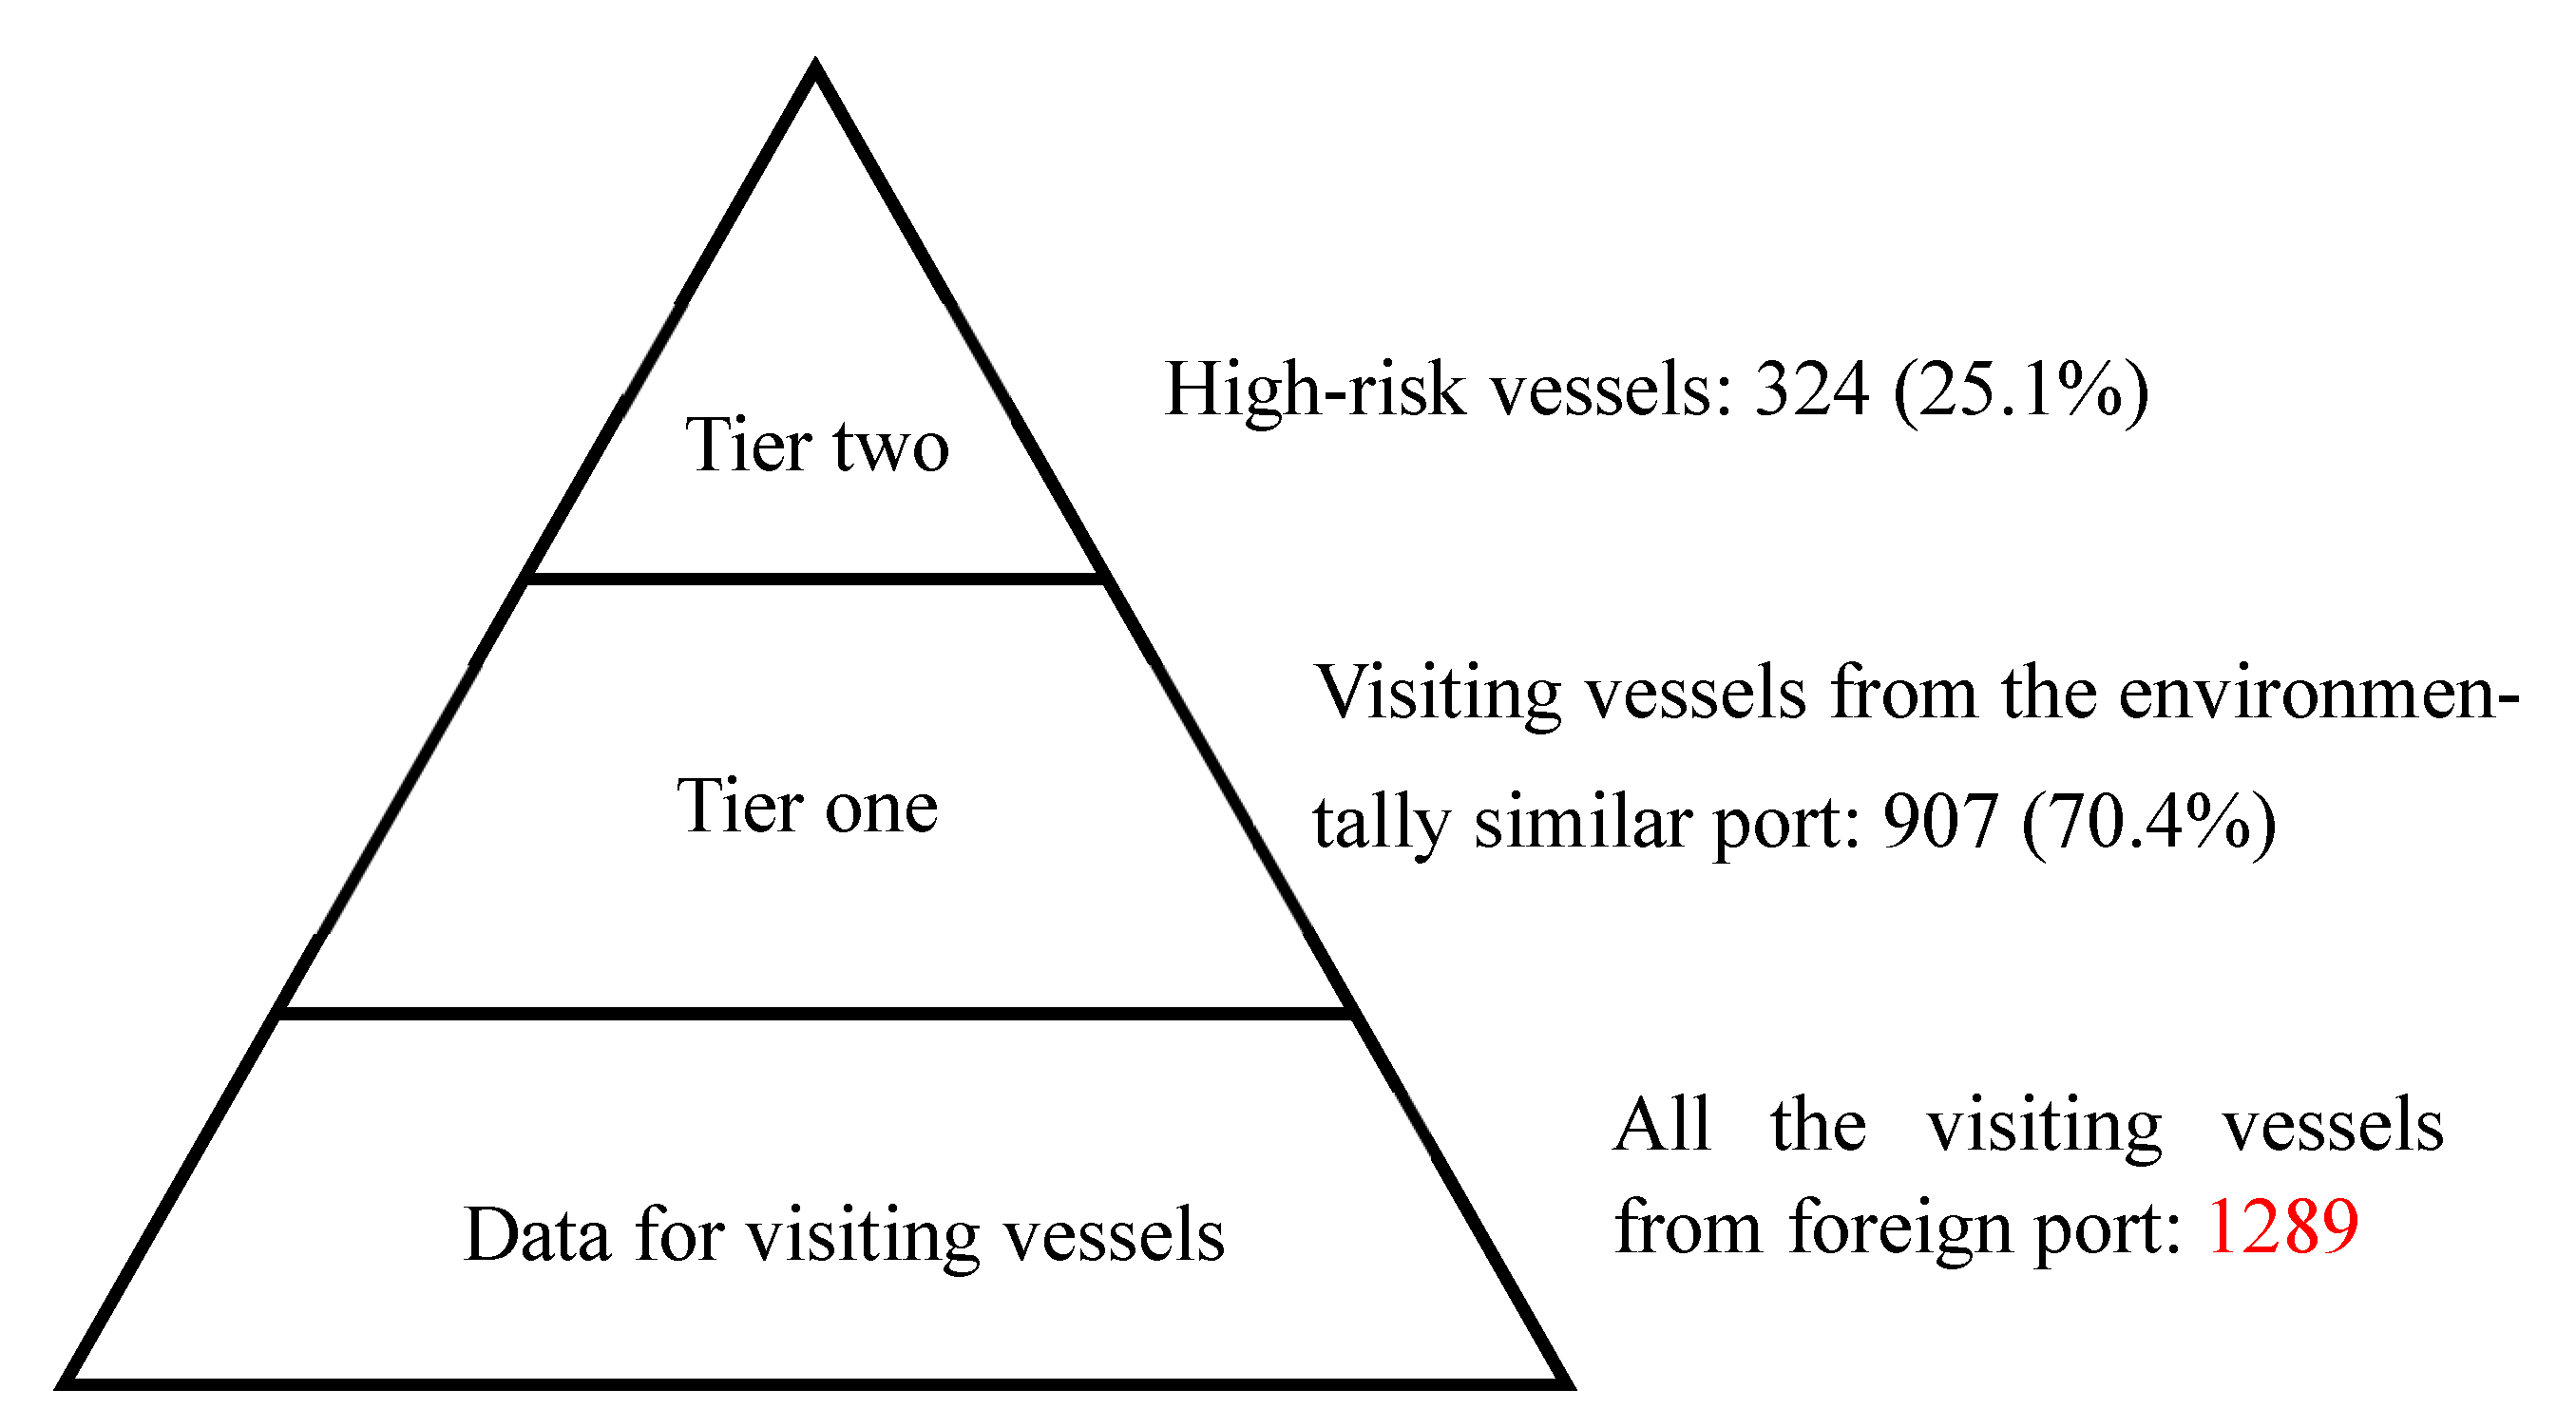
After the tier-one assessment, 144 out of 340 last ports of call were identified as having highly similar environmental conditions with the port of Riga (see Figure 4). Most of the ports are in the Baltic Sea and the North Sea regions, except the port of Cadiz Bay, Spain and the port of Lorenzo, Argentina. The top three environmentally similar donor countries to the port of Riga were Sweden, Finland, and Germany (see Table 4). Figure 5 and Figure 6 shows the results of the 2-tier risk assessment performed for the vessels that visited the port of Riga in 2015. Table 5 shows that most of the donor ports of high-risk vessels are in the Baltic Sea region. There were 324 vessels in the high-risk category, representing about 25% of all the visiting vessels. According to the results of this study, an average of about 0.9 high-risk vessels visited the port of Riga each day. From the results of the high-risk vessels arriving in the port of Riga, as shown in Figure 6, the main donor ports are St. Petersburg of the Russian Federation, Gdansk and Szczecin of Poland, and Klaipeda of Lithuania. The voyage from these donor ports to Riga is approximately ~1 day.
4. Discussion
From the data of the high-risk vessels arriving in the port of Kaohsiung during 2013–2015, the donor ports can be categorized into 3 areas, i.e., China, northeast Asia, and southeast Asia. The percentages of arrivals from these three areas are 89.4%, 0.8%, and 9.8%, respectively. The data show a great number of ships arriving frequently from Chinese ports. The highest numbers of Chinese ships came from Fujian, Guangdong, and Hong Kong Provinces. The risk assessment in this study provides PSC officers with information that some certain donor ports or vessels may possess more opportunities for introduction. PSC officers should stay alert to high-risk areas experiencing outbreaks of HOAPs, such as harmful algae blooms, from which incoming vessels originated from. Our analysis also indicated that the port authority may encounter high-risks vessel that are new to the port. Information about the prior history or ballast operation practices of these new vessels was generally unavailable. Therefore, the collection of evidence indicating violation of BWM could be challenging. Since port authorities may lack the compliance information about these vessels, more cooperation with neighboring port states under a common PSC framework is recommended.
From the results of the high-risk vessels arriving into the port of Riga, the main donor ports are St Petersburg of Russia, Gdansk and Szczecin of Poland, and Klaipeda of Lithuania. The percentages of arrivals from these areas are 12.3%, 12%, 11.7%, and 11.4%, respectively. The data show that practically all the high-risk vessels came from the donor ports in the Baltic Sea region. According to the analysis results of the ports of Kaohsiung and Riga, the donor ports of high-risk vessels are all located at the same LME as the research port. These donor ports not only have similar environmental conditions to the target ports but also have a short voyage to the research ports, which increases the risk of the introduction of NIASs.
In response to the convention, Taiwan has followed these global developments to implement ballast water management. However, an insufficient number of port state officers poses a challenge to the implementation of Taiwan’s port state control (PSC). For example, in a busy port, such as the port of Kaohsiung, 50–60 vessels enter the port every day. Some container ships may enter and leave the port within an 8-h span. Now, there are only two PSC officers to perform all the documentation checks, which could be very overwhelming. Therefore, this study used the environmental similarity and the characteristics of vessels as risk factors to establish a risk assessment model for the incoming vessels to the port of Kaohsiung. In this way, port state officials may select the ships to be inspected based on the risk level of the ship to improve the implementation efficiency of PSC [37,38,39,40,41].
5. Conclusions
It was found that for vessels visiting the port of Kaohsiung, 91.3% of the last ports of call were from Asia, indicating the busy trade between Taiwan and other Asian countries. In the first-stage assessment, 262 out of 418 last ports of call were identified as having high similar environmental conditions to the port of Kaohsiung and 70% of them were from Asian countries, such as Japan, China, and South Korea. In the second-stage assessment, there were 1365 vessels in the high-risk category, representing about 15% of all the visiting vessels. According to the results of this study, an average of about 1.2 high-risk vessels visited the port of Kaohsiung each day during the study. The following various aspects of the findings are drawn from the results. First, the VRL in the second stage of the risk assessment identified the high-risk vessels more precisely than the IMO’s environmental similarity assessment method used in the first stage. Second, the application of the empirical risk model established in this study requires more detailed information of the vessels or environment related to each risk factor. The two-tiered risk assessment procedure developed in this study can not only identify the risk level of vessels for the most appropriate management, but the resources required for PSC implementation can also be effectively reduced. Therefore, the quality and availability of the vessels’ characteristic data will be key to the application of this empirical risk model, which will affect whether the decision-maker can perform proper management according to the evaluation results [17,42,43,44,45].
Author Contributions
Conceptualization T.-K.L.; methodology, Y.-S.C. and T.-K.L.; hardware and software, C.-K.K. and Y.-S.C.; validation, T.-K.L., Y.-S.C.; writing—original draft preparation, C.-K.K. and Y.-S.C.; funding acquisition, T.-K.L. All authors have read and agreed to the published version of the manuscript.
Funding
This research was supported by Ministry of Science and Technology (MOST), Taiwan under contract number 104-2923-E-006-005-MY3.
Institutional Review Board Statement
Not applicable.
Informed Consent Statement
Not applicable.
Acknowledgments
The authors would like to express sincere thanks to the people from Taiwan International Port Company for their help in providing assistance and the vessel transit information. This work was supported by the Taiwan–Latvia–Lithuania Cooperation Project BALMAN “Development of the ships’ ballast water management system to reduce biological invasions”. The opinions expressed therein are of the authors only and any error remains the sole responsibility of the authors.
Conflicts of Interest
The authors declare no conflict of interest.
References
- Casties, I.; Briski, E. Life history traits of aquatic non-indigenous species: Freshwater vs. marine habitats. Aquat. Invasions 2019, 14, 566–581. [Google Scholar] [CrossRef]
- Chou, M.L. The Study of the Current Condition and Need for the Ballast Water Management in Taiwan. Master’s Thesis, Institute of Ocean Technology and Marine Affairs, National Cheng Kung University, Tainan, Taiwan, 2013. (In Chinese). [Google Scholar]
- Liu, T.K.; Chang, C.H.; Chou, M.L. Management strategies to prevent the introduction of non-indigenous aquatic species in response to the Ballast Water Convention in Taiwan. Mar. Policy 2014, 44, 187–195. [Google Scholar] [CrossRef]
- Tsai, H.C. The Risk Assessment for the Ballast Water Mediated Invasion of Non-indigenous Aquatic Species. Master’s Thesis, Institute of Ocean Technology and Marine Affairs, National Cheng Kung University, Tainan, Taiwan, 2011. (In Chinese). [Google Scholar]
- Liu, T.L.; Tsai, C.K. Vessel traffic patterns in the port of Kaohsiung and the management implication for preventing the introduction of non-indigenous aquatic species. Mar. Pollut. Bull. 2011, 62, 602–608. [Google Scholar] [CrossRef]
- Kraus, R.; Grilli, F.; Suplic, N.; Janekovic, I.; Brailo, M.; Cara, M.; Bratoš Cetinić, A.; Campanelli, A.; Cozzi, S.; D’Adamo, R.; et al. Oceanographic characteristics of the Adriatic Sea-Support to secondary HAOP spread through natural dispersal. Mar. Pollut. Bull. 2019, 147, 59–85. [Google Scholar] [CrossRef] [PubMed]
- Liu, T.K.; Wang, Y.C.; Su, P.H. Implementing the ballast water management convention: Taiwan’s experience and challenges in the early stage. Mar. Policy 2019, 109, 103706. [Google Scholar] [CrossRef]
- Su, P.H. Using the Environmental and Vessel Factors to Assess the Risk of Non-indigenous Species Introduced by Ship’s Ballast Water. Master’s Thesis, Institute of Ocean Technology and Marine Affairs, National Cheng Kung University, Tainan, Taiwan, 2018. (In Chinese). [Google Scholar]
- Tsai, T.K. The Study of Ballast Water Mediated Introduction of Non-Indigenous Species in Kaohsiung Harbor Using Vessel Pattern Analysis. Master’s Thesis, Institute of Ocean Technology and Marine Affairs, National Cheng Kung University, Tainan, Taiwan, 2009. (In Chinese). [Google Scholar]
- Tsiamis, K.; Zenetos, A.; Deriu, I.; Gervasini, E.; Cardoso, A.C. The native distribution range of the European marine non-indigenous species. Aquat. Invasions 2018, 13, 187–198. [Google Scholar] [CrossRef]
- Cheng, M.; Liu, T.K.; Olenin, S.; Su, P.X. Risk assessment model based on expert’s perspective for ballast water management. Ocean Coast Manag. 2019, 171, 80–86. [Google Scholar] [CrossRef]
- Dock, A.; Linders, J.; David, M.; Gollasch, S.; David, J.; Ziegler, G. Are workers on board vessels involved with chemicals from treated ballast water sufficiently protected? A decadal perspective and risk assessment. Chemosphere 2020, 247, 125824. [Google Scholar] [CrossRef] [PubMed]
- David, M.; Gollasch, S. Risk assessment for ballast water management-learning from the Adriatic Sea case study. Mar. Pollut. Bull. 2019, 147, 36–46. [Google Scholar] [CrossRef] [PubMed]
- David, M.; Gollasch, S.; Leppäkoski, E. Risk assessment for exemptions from ballast water management–the Baltic Sea case study. Mar. Pollut. Bull. 2013, 75, 205–217. [Google Scholar] [CrossRef] [PubMed]
- Gollasch, S.; David, M.; Broeg, K.; Heitmüller, S.; Karjalainen, M.; Lehtiniemi, M.; Normant-Saremba, M.; Ojaveer, H.; Olenin, S.; Ruiz, M.; et al. Target species selection criteria for risk assessment based exemptions of ballast water management requirements. Ocean Coast Manag. 2020, 183, 10502. [Google Scholar] [CrossRef]
- Bailey, J.; Cowie, B.; Cooper, B. “Maths outside of maths”: Pre-service teachers’ awareness of mathematical and statistical thinking across teachers’ professional work. Aust. J. Teach. Educ. 2020, 45, 1–18. [Google Scholar] [CrossRef]
- Outinen, O.; Bailey, S.A.; Broeg, K.; Chasse, J.; Clarke, S.; Daigle, R.M.; Gollasch, S.; Kakkonen, J.E.; Lehtiniemi, M.; Normant-Saremba, M.; et al. Exceptions and exemptions under the ballast water management convention—Sustainable alternatives for ballast water management? J. Environ. Manag. 2021, 293, 112823. [Google Scholar] [CrossRef] [PubMed]
- International Maritime Organization (IMO). International Maritime Organization International Convention for the Control and Management of Ships’ Ballast Water and Sediments. Available online: https://www.imo.org/en/About/Conventions/Pages/International-Convention-for-the-Control-and-Management-of-Ships%27-Ballast-Water-and-Sediments-(BWM).aspx (accessed on 27 May 2019).
- UK P&I Club. Legal Briefing Ballast Water Management Convention 2004—An Update; Thomas Miller P&I Ltd.: London, UK, 2013. [Google Scholar]
- UK P&I Club. Legal Briefing Latest Update on the Ballast Water Management Convention 2004; Thomas Miller P&I Ltd.: London, UK, 2015. [Google Scholar]
- UK P&I Club. Legal Briefing New Regulations for the Control of Ships’ Ballast; Thomas Miller P&I Ltd.: London, UK, 2011. [Google Scholar]
- MOU. Tokyo MOU Agreed to Include the BWM Convention as a Relevant Instrument at Its 27th PSC Committee Meeting in Australia; Tokyo MOU: Tokyo, Japan, 2016. [Google Scholar]
- International Marine Organization (IMO). Guidelines for Risk Assessment under Regulation A-4 of the BWM Convention (G7); IMO: London, UK, 2007. [Google Scholar]
- International Maritime Organization (IMO). Ballast Water Management; IMO: London, UK, 2019; Available online: http://www.imo.org/en/OurWork/Environment/BallastWaterManagement/Pages/Default.aspx (accessed on 28 June 2020).
- International Maritime Organization (IMO). GloBallast Programme; IMO: London, UK, 2019; Available online: http://www.imo.org/en/OurWork/Environment/MajorProjects/Pages/GloBallast-Programme.aspx (accessed on 28 June 2020).
- International Maritime Organization (IMO). The Lists of Ballast Water Management Systems, Which Received Type Approval Certification, Basic and Final Approval; IMO: London, UK, 2019; Available online: http://www.imo.org/en/OurWork/Environment/BallastWaterManagement/Documents/Table%20of%20BA%20FA%20TA%20updated%20October%202019.pdf (accessed on 28 June 2020).
- International Maritime Organization (IMO). Status of Conventions-Ratifications by Treaty; IMO: London, UK, 2019; Available online: http://www.imo.org/en/About/Conventions/StatusOfConventions/Pages/Default.aspx (accessed on 29 June 2020).
- International Marine Organization (IMO). Ballast Water Performance Standard D-2; IMO: London, UK, 2017. [Google Scholar]
- Ojaveer, H.; Galil, B.S.; Lehtiniemi, M.; Christoffersen, M.; Clink, S.; Florin, A.B.; Gruszka, P.; Puntila, R.; Behrens, J.W. Twenty five years of invasion: Management of the round goby Neogobius melanostomus in the Baltic Sea. Manag. Biol. Invasion 2015, 6, 329–339. [Google Scholar] [CrossRef] [Green Version]
- Free Port of Riga. Available online: http://www.rop.lv/en/ (accessed on 16 June 2019).
- Gollasch, S.; Erkki, L. Risk assessment and management scenarios for ballast water mediated species introductions into the Baltic Sea. Aquat. Invasions 2007, 2, 313–340. [Google Scholar] [CrossRef]
- Ojaveer, H.; Olenin, S.; Narščius, A.; Florin, A.B.; Ezhova, E.; Gollasch, S.; Jensen, K.R.; Lehtiniemi, M.; Minchin, D.; Normant-Saremba, M. Dynamics of biological invasions and pathways over time: A case study of a temperate coastal sea. Manag. Biol. Invasions 2017, 19, 799–813. [Google Scholar] [CrossRef]
- Xu, X.M.; Ke, J.X.; Kun, D. A new calculation method of environmental similarity. Appl. Mech. Mater. 2012, 260–261, 1104–1108. [Google Scholar] [CrossRef]
- Chang, C.H. Taiwan’s Strategy in Response to the International Development Trend for the Control and Management of Ships’ Ballast Water and Sediments-Use the Port of Kaohsiung as an Example. Master’s Thesis, Institute of Ocean Technology and Marine Affairs, National Cheng Kung University, Tainan, Taiwan, 2009. (In Chinese). [Google Scholar]
- Sherman, K. Sustaining the world’s large marine ecosystems. ICES J. Mar. Sci. 2015, 72, 2521–2531. [Google Scholar]
- Degger, N.; Hudson, A.; Mamaev, V.; Mish, H.; Trumbic, I. Navigating the complexity of regional ocean governance through the large marine ecosystems approach. Front. Mar. Sci. 2021, 8, 645668. [Google Scholar] [CrossRef]
- Gallardo, B.; Aldridge, D.C. The ‘dirty dozen’: Socio-economic factors amplify the invasion potential of 12 high-risk aquatic invasive species in Great Britain and Ireland. J Appl. Ecol. 2013, 50, 757–766. [Google Scholar] [CrossRef]
- Rak, G.; Zec, D.; Markovčić Kostelac, M.; Joksimović, D.; Gollasch, S.; David, M. The implementation of the ballast water management convention in the Adriatic Sea through States’ cooperation: The contribution of environmental law and institutions. Mar. Pollut. Bull. 2019, 147, 245–253. [Google Scholar] [CrossRef]
- Lehtiniemi, M.; Ojaveer, H.; David, M.; Galil, B.; Gollasch, S.; McKenzie, C.; Minchin, D.; Occhipinti-Ambrogi, A.; Olenin, S.; Pederson, J. Dose of truth-Monitoring marine non-indigenous species to serve legislative requirements. Mar. Policy 2015, 54, 26–35. [Google Scholar] [CrossRef]
- David, M.; Gollasch, S.; Leppäkoski, E.; Hewitt, C. Risk Assessment in Ballast Water Management, Global Maritime Transport and Ballast Water Management Issues and Solutions; Invading Nature—Springer Series in Invasion Ecology; Springer: Berlin/Heidelberg, Germany, 2015. [Google Scholar]
- Shao, K.T.; Chiu, Y. Current Status and Management for Marine Invasive Species in Taiwan, Proc. of Symposium on Biological Control of Invasive Species; National Taiwan University: Taipei, Taiwan, 2003; pp. 103–110. [Google Scholar]
- Olenin, S.; Ojaveer, H.; Minchin, D.; Boelens, R. Assessing exemptions under the ballast water management convention: Preclude the Trojan horse. Mar. Pollut. Bull. 2016, 103, 84–92. [Google Scholar] [CrossRef] [PubMed]
- David, M.; Linders, J.; Gollasch, S.; David, J. Is the aquatic environment sufficiently protected from chemicals discharged with treated ballast water from vessels worldwide? A decadal environmental perspective and risk assessment. Chemosphere 2018, 207, 590–600. [Google Scholar] [CrossRef]
- Gollasch, S.; Hewitt, C.H.; Bailey, S.; David, M. Introductions and transfers of species by ballast water in the Adriatic Sea. Mar. Pollut. Bull. 2019, 147, 8–15. [Google Scholar] [CrossRef] [PubMed]
- Strubbe, D.; White, R.; Edelaar, P.; Rahbek, C.; Shwartz, A. Advancing impact assessments of non-native species: Strategies for strengthening the evidence-base. NeoBiota 2019, 51, 41–64. [Google Scholar] [CrossRef]
Figure 1.
Location of the donor ports with similar environments to the port of Kaohsiung. The red and green solid circles represent ports with a risk score of 6 and 5, respectively, based on the criteria set in Table 1.
Figure 1.
Location of the donor ports with similar environments to the port of Kaohsiung. The red and green solid circles represent ports with a risk score of 6 and 5, respectively, based on the criteria set in Table 1.

Figure 2.
The results of the two-tier risk analysis performed for the incoming vessels to the port of Kaohsiung.
Figure 2.
The results of the two-tier risk analysis performed for the incoming vessels to the port of Kaohsiung.

Figure 3.
Location of the donor ports of high-risk vessels that visited the port of Kaohsiung. The blue, yellow, and red solid circles represent the donor ports where the high-risk vessels originated from. Each color corresponds to the number of vessels <20, 20–60, and >60, respectively.
Figure 3.
Location of the donor ports of high-risk vessels that visited the port of Kaohsiung. The blue, yellow, and red solid circles represent the donor ports where the high-risk vessels originated from. Each color corresponds to the number of vessels <20, 20–60, and >60, respectively.

Figure 4.
Location of the donor ports with similar environments to the port of Riga. The red and green solid circles represent ports with a risk score of 6 and 5, respectively, based on the criteria set in Table 1.
Figure 4.
Location of the donor ports with similar environments to the port of Riga. The red and green solid circles represent ports with a risk score of 6 and 5, respectively, based on the criteria set in Table 1.

Figure 5.
The results of the two-tier screening processes performed for the incoming vessels to the port of Riga.
Figure 5.
The results of the two-tier screening processes performed for the incoming vessels to the port of Riga.

Figure 6.
Location of the donor ports of high-risk vessels that visited the port of Riga. The blue, yellow, and red solid circles represent donor ports where the high-risk vessels originated from. Each color corresponds to the number of vessels <20, 20–60, and >60, respectively.
Figure 6.
Location of the donor ports of high-risk vessels that visited the port of Riga. The blue, yellow, and red solid circles represent donor ports where the high-risk vessels originated from. Each color corresponds to the number of vessels <20, 20–60, and >60, respectively.


Table 1.
Evaluation criteria for the environmental match of the donor port and the port of Kaohsiung and Riga.
Table 1.
Evaluation criteria for the environmental match of the donor port and the port of Kaohsiung and Riga.
| Port of Kaohsiung | Donor port | |||
| Temperature | Warm-Temperate | Warm-Temperate | Cold-Temperate/Tropics | Polar |
| Salinity | 30.7–33.4 | 27.7–36.4 | 25.7–27.6 or 36.5–38.4 | <25.7 or >38.4 |
| Similarity | High | Moderate | Low | |
| Risk Score | 3 | 2 | 1 | |
| Port of Riga | Donor port | |||
| Temperature | Cold | Cold | Warm/ Arctic &Antarctic | Arctic &Antarctic Tropics |
| Salinity | 1.6 | 0–4.6 | 4.7–6.6 | >6.6 |
| Similarity | High | Moderate | Low | |
| Point | 3 | 2 | 1 | |
Table 2.
Risk factors and its weighting coefficients in the risk assessment model.
| Category | Risk Factor | Weight |
|---|---|---|
| Risk associated with source of ballast water | Salinity similarity of donor and recipient port (RS) | 0.251 |
| Temperature similarity of donor and recipient port (RT) | 0.215 | |
| Biogeographic similarity of donor and recipient port (RB) | 0.199 | |
| Voyage from donor port to recipient port (RV) | 0.167 | |
| Risk associated with vessel character | Frequency of calling the receival port (RF) | 0.102 |
| Flag state is FOC or not (RFS) | 0.034 | |
| Ship-type (RST) | 0.031 |
Table 3.
Evaluation criteria of risk factors.
| Risk Factor | High Risk (3 Points) | Moderate Risk (2 Points) | Low Risk (1 Point) |
|---|---|---|---|
| RS (psu) | The difference between donor and recipient port is ±1 | ±3 | >±3 |
| RT (°C) | The difference between donor and recipient port is ±3 | ±5 | >±5 |
| RB | Same Large Marine Ecosystems (LME) [35,36] | Adjacent LME | other LME |
| RV | <3 days | 3–10 days | >10 days |
| RF | ≥the upper quartiles (Q3) of all ships’ visiting frequencies | Frequency of calling the recipient port is between Q1 and Q3 | ≤the lower quartiles (Q1) of all ships′ visiting frequencies |
| RFS | vessel with flag of convenience | - | vessel with other flags |
| RST | Bulk carrier | Container ship General cargo ship | Oil tanker Passenger ferry Other ships |
Table 4.
Donor ports with similar environments to the ports of Kaohsiung and Riga.
| The donor ports with similar environments to the port of Kaohsiung | |||||||
| environmentally similar port (6 points) | environmentally similar port (5 points) | ||||||
| State | No. of ports | State | No. of ports | State | No. of ports | State | No. of ports |
| Japan | 64 | Japan | 21 | Panama | 2 | South Africa | 2 |
| China | 20 | China | 37 | Argentina | 1 | Tanzania | 1 |
| South Korea | 6 | South Korea | 5 | Bahamas | 1 | Mauritius | 1 |
| Cyprus | 1 | Malaysia | 5 | Canada | 1 | Angola | 1 |
| United States | 6 | Philippines | 7 | Timor | 1 | Seychelles | 1 |
| Peru | 1 | Vietnam | 6 | Mexico | 2 | Russia | 5 |
| Islas Canarias | 1 | India | 5 | Pakistan | 1 | Australia | 12 |
| Algeria | 1 | Indonesia | 3 | Brazil | 3 | Norway | 1 |
| South Africa | 1 | Brunei Darussalam | 2 | United States | 7 | United Kingdom | 1 |
| Egypt | 1 | Cambodia | 1 | Yemen | 1 | New Zealand | 1 |
| Australia | 10 | Hong Kong | 2 | Kuwait | 1 | Fuji | 1 |
| New Zealand | 2 | Oman | 1 | Falkland Islands | 1 | Republic of Vanuatu | 1 |
| United Arab Emirates | 1 | Costa Rica | 1 | French Polynesia | 1 | ||
| Total number of ports | 114 | Total number of ports | 148 | ||||
| The donor ports with similar environments to the port of Riga | |||||||
| environmentally similar port (6 points) | environmentally similar port (5 points) | ||||||
| State | No. of ports | State | No. of ports | ||||
| Belgium | 4 | Argentina | 1 | ||||
| Estonia | 12 | Denmark | 7 | ||||
| Finland | 19 | Finland | 7 | ||||
| Germany | 17 | France | 2 | ||||
| Lithuania | 1 | Germany | 2 | ||||
| Netherlands | 4 | Netherlands | 1 | ||||
| Norway | 2 | Russian Federation | 1 | ||||
| Poland | 3 | Spain | 1 | ||||
| Russian Federation | 5 | Sweden | 14 | ||||
| Sweden | 37 | United Kingdom | 2 | ||||
| United Kingdom | 2 | ||||||
| Total number of ports | 106 | Total number of ports | 38 | ||||
Table 5.
The donor ports of high-risk vessels that visited the ports of Kaohsiung and Riga.
| The donor ports of high-risk vessels that visited the port of Kaohsiung | |||||||
| State | Donor port | high-risk vessels | Voyage (day) | State | Donor port | high-risk vessels | Voyage (day) |
| Hong Kong | Hong Kong | 1073 | 0.9 | Brunei Darussalam | Muara | 1 | 3.1 |
| Causeway Bay | 1 | 0.9 | Brunei Town | 11 | 3.1 | ||
| China | Yantian | 48 | 0.9 | Japan | Naha | 11 | 1.4 |
| Xiamen | 37 | 0.4 | Philippines | Subic Bay | 55 | 1.4 | |
| Quanzhou | 19 | 1 | Bataan | 16 | 1.5 | ||
| Humen | 12 | 1 | Sangi | 3 | 2.2 | ||
| Nansha | 12 | 1 | Vietnam | Vung Tau | 19 | 2.8 | |
| Shantou | 6 | 1 | Danang | 11 | 2.1 | ||
| Yangpu | 5 | 1.8 | Quy Nhon | 8 | 2.2 | ||
| Shekou | 3 | 1 | Chu Lai | 2 | 2.1 | ||
| Zhuhai | 2 | 1 | Nhatrang | 1 | 2.3 | ||
| Beihai | 2 | 2 | Campha | 1 | 2.1 | ||
| The donor ports of high-risk vessels that visited the port of Riga | |||||||
| State | Donor port | high-risk vessels | Voyage (day) | State | Donor port | high-risk vessels | Voyage (day) |
| Estonia | Bekkeri | 1 | 0.5 | Russian Federation | Baltisk | 4 | 0.8 |
| Kunda | 1 | 0.7 | Kaliningrad | 22 | 0.8 | ||
| Miiduranna | 1 | 0.7 | St Petersburg | 40 | 1.2 | ||
| Muuga | 14 | 0.7 | Svetlyy | 4 | 0.8 | ||
| Roomassaare | 1 | 0.2 | Ust-Luga | 4 | 1.1 | ||
| Sillamae | 1 | 1 | Sweden | Ahus | 2 | 0.9 | |
| Tallinn | 20 | 0.5 | Balsta | 1 | 0.8 | ||
| Finland | Helsinki | 3 | 0.8 | Domsjo | 1 | 1.2 | |
| Kantvik | 1 | 0.7 | Gavle | 1 | 0.9 | ||
| Kaskinen | 3 | 1.1 | Hargshamn | 1 | 0.7 | ||
| Kotka | 5 | 0.9 | Husum | 2 | 1.2 | ||
| Pietarsaari | 1 | 1.4 | Karskar | 3 | 0.9 | ||
| Pori | 1 | 1 | Lulea | 3 | 1.6 | ||
| Porvo | 11 | 0.9 | Monsteras | 1 | 0.7 | ||
| Raahe | 3 | 1.6 | Norrkoping | 4 | 0.7 | ||
| Rauma | 4 | 1 | Obbola | 1 | 1.3 | ||
| Tolkkinen | 1 | 0.9 | Ornskoldsvik | 1 | 1.2 | ||
| Tornio | 1 | 1.7 | Oskarshamn | 2 | 0.7 | ||
| Turku | 3 | 0.9 | Ronnskar | 1 | 1.5 | ||
| Vaasa | 2 | 1.3 | Rundvik | 2 | 1.2 | ||
| Valko | 2 | 0.9 | Skelleftea | 1 | 1.5 | ||
| Germany | Brake | 5 | 1.8 | Skutskar | 3 | 0.9 | |
| Lithuania | Klaipeda | 38 | 0.6 | Stockvik | 2 | 1.1 | |
| Poland | Gdansk | 39 | 0.8 | Sundsvall | 4 | 1.1 | |
| Police | 7 | 1.1 | Utansjo | 2 | 1.1 | ||
| Szczecin | 37 | 1.2 | Vaja | 2 | 1.2 | ||
| Vastervik | 4 | 0.7 | |||||
Publisher’s Note: MDPI stays neutral with regard to jurisdictional claims in published maps and institutional affiliations. |
© 2022 by the authors. Licensee MDPI, Basel, Switzerland. This article is an open access article distributed under the terms and conditions of the Creative Commons Attribution (CC BY) license (https://creativecommons.org/licenses/by/4.0/).
Share and Cite
MDPI and ACS Style
Chen, Y.-S.; Kang, C.-K.; Liu, T.-K. Ballast Water Management Strategy to Reduce the Impact of Introductions by Utilizing an Empirical Risk Model. Water 2022, 14, 981. https://doi.org/10.3390/w14060981
AMA Style
Chen Y-S, Kang C-K, Liu T-K. Ballast Water Management Strategy to Reduce the Impact of Introductions by Utilizing an Empirical Risk Model. Water. 2022; 14(6):981. https://doi.org/10.3390/w14060981
Chicago/Turabian StyleChen, Yung-Sheng, Chao-Kai Kang, and Ta-Kang Liu. 2022. "Ballast Water Management Strategy to Reduce the Impact of Introductions by Utilizing an Empirical Risk Model" Water 14, no. 6: 981. https://doi.org/10.3390/w14060981
Note that from the first issue of 2016, this journal uses article numbers instead of page numbers. See further details here.