Article

Diversity and Vertical Distribution of Sedimentary Bacterial Communities and Its Association with Metal Bioavailability in Three Distinct Mangrove Reserves of South China

Shenzhen Key Laboratory of Marine Bioresource and Eco-Environmental Science, Shenzhen Engineering Laboratory for Marine Algal Biotechnology, College of Life Sciences and Oceanography, Shenzhen University, Shenzhen 518060, China
*
Author to whom correspondence should be addressed.
These authors contributed equally to this work.
Water 2022, 14(6), 971; https://doi.org/10.3390/w14060971
Submission received: 21 December 2021 / Revised: 4 March 2022 / Accepted: 16 March 2022 / Published: 19 March 2022

Abstract

:
The structure of sedimentary bacterial communities in mangroves depends on environmental factors such as pH, salinity, organic matter content, and metal pollution. To investigate the effect of heavy metal pollution on such communities, core samples of sediments from four sites in three distinct mangrove reserves (Golden Bay Mangrove Reserve in Beihai, Guangxi province (GXJHW), Shankou Mangrove Reserve in Hepu, Guangxi province (GXSK), and MaiPo mangrove in Hong Kong (MPCT and MPFQ)) in South China were analyzed for physicochemical properties, multiple chemical forms of metals, and vertical bacterial diversity. Sedimentary bacterial communities varied greatly among the different sampling sites, with biodiversity decreasing in the order of GXSK, GXJHW, MPFQ, and MPCT. Proteobacteria was the dominant phylum, followed by Chloroflexi, across all four sampling sites. Multivariate statistical analysis of the effect of environmental factors on the sedimentary bacterial communities found that total carbon was the only physicochemical factor with a significant influence at all four sites. The correlations between environmental factors and bacterial structure were weak for the two sites in Guangxi province, but strong at MPCT in Hong Kong where environmental factors were almost all significantly negatively correlated with bacterial diversity. Variance partitioning analysis revealed that physicochemical properties and chemical forms of metals could explain most of the changes in bacterial diversity. Overall, we observed that heavy metal forms were more important than total metal content in influencing the sedimentary bacterial diversity in mangroves, consistent with the more bioavailable metal species having the greatest effect.

1. Introduction

Mangroves are unique ecosystems that are distributed worldwide in tropical and subtropical tidal areas. They play important roles in providing habitats for aquatic organisms, degrading contaminants, and shoreline protection [1,2,3]. Within a mangrove ecosystem, bacterial activity is vital for nutrient transformation, and is therefore essential to the productivity, conservation, and rehabilitation of mangroves [4,5,6,7,8].
A range of bacteria are involved in the biogeochemical cycle, which includes activities such as nitrogen fixation, ammoniation, nitrification, denitrification, solubilizing phosphate, carbon cycling, oxidizing sulfur, and oxidizing or reducing iron [7,8,9,10,11]. Acting as a buffer between the land and the sea, mangroves are subject to variable physicochemical conditions, including salinity, pH, grain size, and anthropogenic contaminants. As a result, specific bacterial community structures are formed as they adapt to various habitats [12,13,14]. For example, Lamontagne et al. [15] found that Proteobacteria was the dominant bacterial group in mangrove sediments that had been chronically affected by oil, while Basak et al. [16] showed that Proteus was dominant in the Sundarban mangrove sediments, with Bacteroides, Acidobacteria, Firmicute, and Actinomycetes relatively abundant.
As unique and effective ecosystems situated between the coast and ocean, mangroves are constantly subjected to anthropogenic influences, such as mining, agricultural wastewater, urban sewage, industrial effluents, and port activities [17]. Mangrove sediments are a significant sink for contaminants from land-sourced discharges as well as polluted tidal water [18,19]. Among the various types of contaminants, heavy metals are one of the most serious due to their toxicity, persistence, and tendency to accumulate in biological systems, including mangrove sediments [17]. Bioavailable metals are either available or can be made available for uptake by microorganisms from the surrounding environment [20]. It has been reported that bioavailable heavy metals can affect the composition and activity of bacterial communities [21,22,23,24] and have a significant impact on benthic microbial loop function [25]. Therefore, how bacterial community structure in mangrove sediments is affected by heavy metals in their various chemical forms, i.e., the relationship between bacterial diversity and metal speciation, deserves further exploration.
Although the interplay between bacterial community structure and environmental factors in mangrove sediment has been researched at a certain level, the depth-related distribution of bacterial species in sediment has received relatively little attention. This study was conducted to investigate the diversity and vertical distribution of bacterial communities and its association with metal speciation, as well as other physicochemical parameters, in three mangrove reserves in South China. The results not only provide a basis for scientific evaluation of heavy metal pollution in mangrove wetlands in South China, but also provide historical data for the study of the relationship between the bacterial community and heavy metals in mangrove core sediments, thereby providing both theoretical and practical significance.

2. Materials and Methods

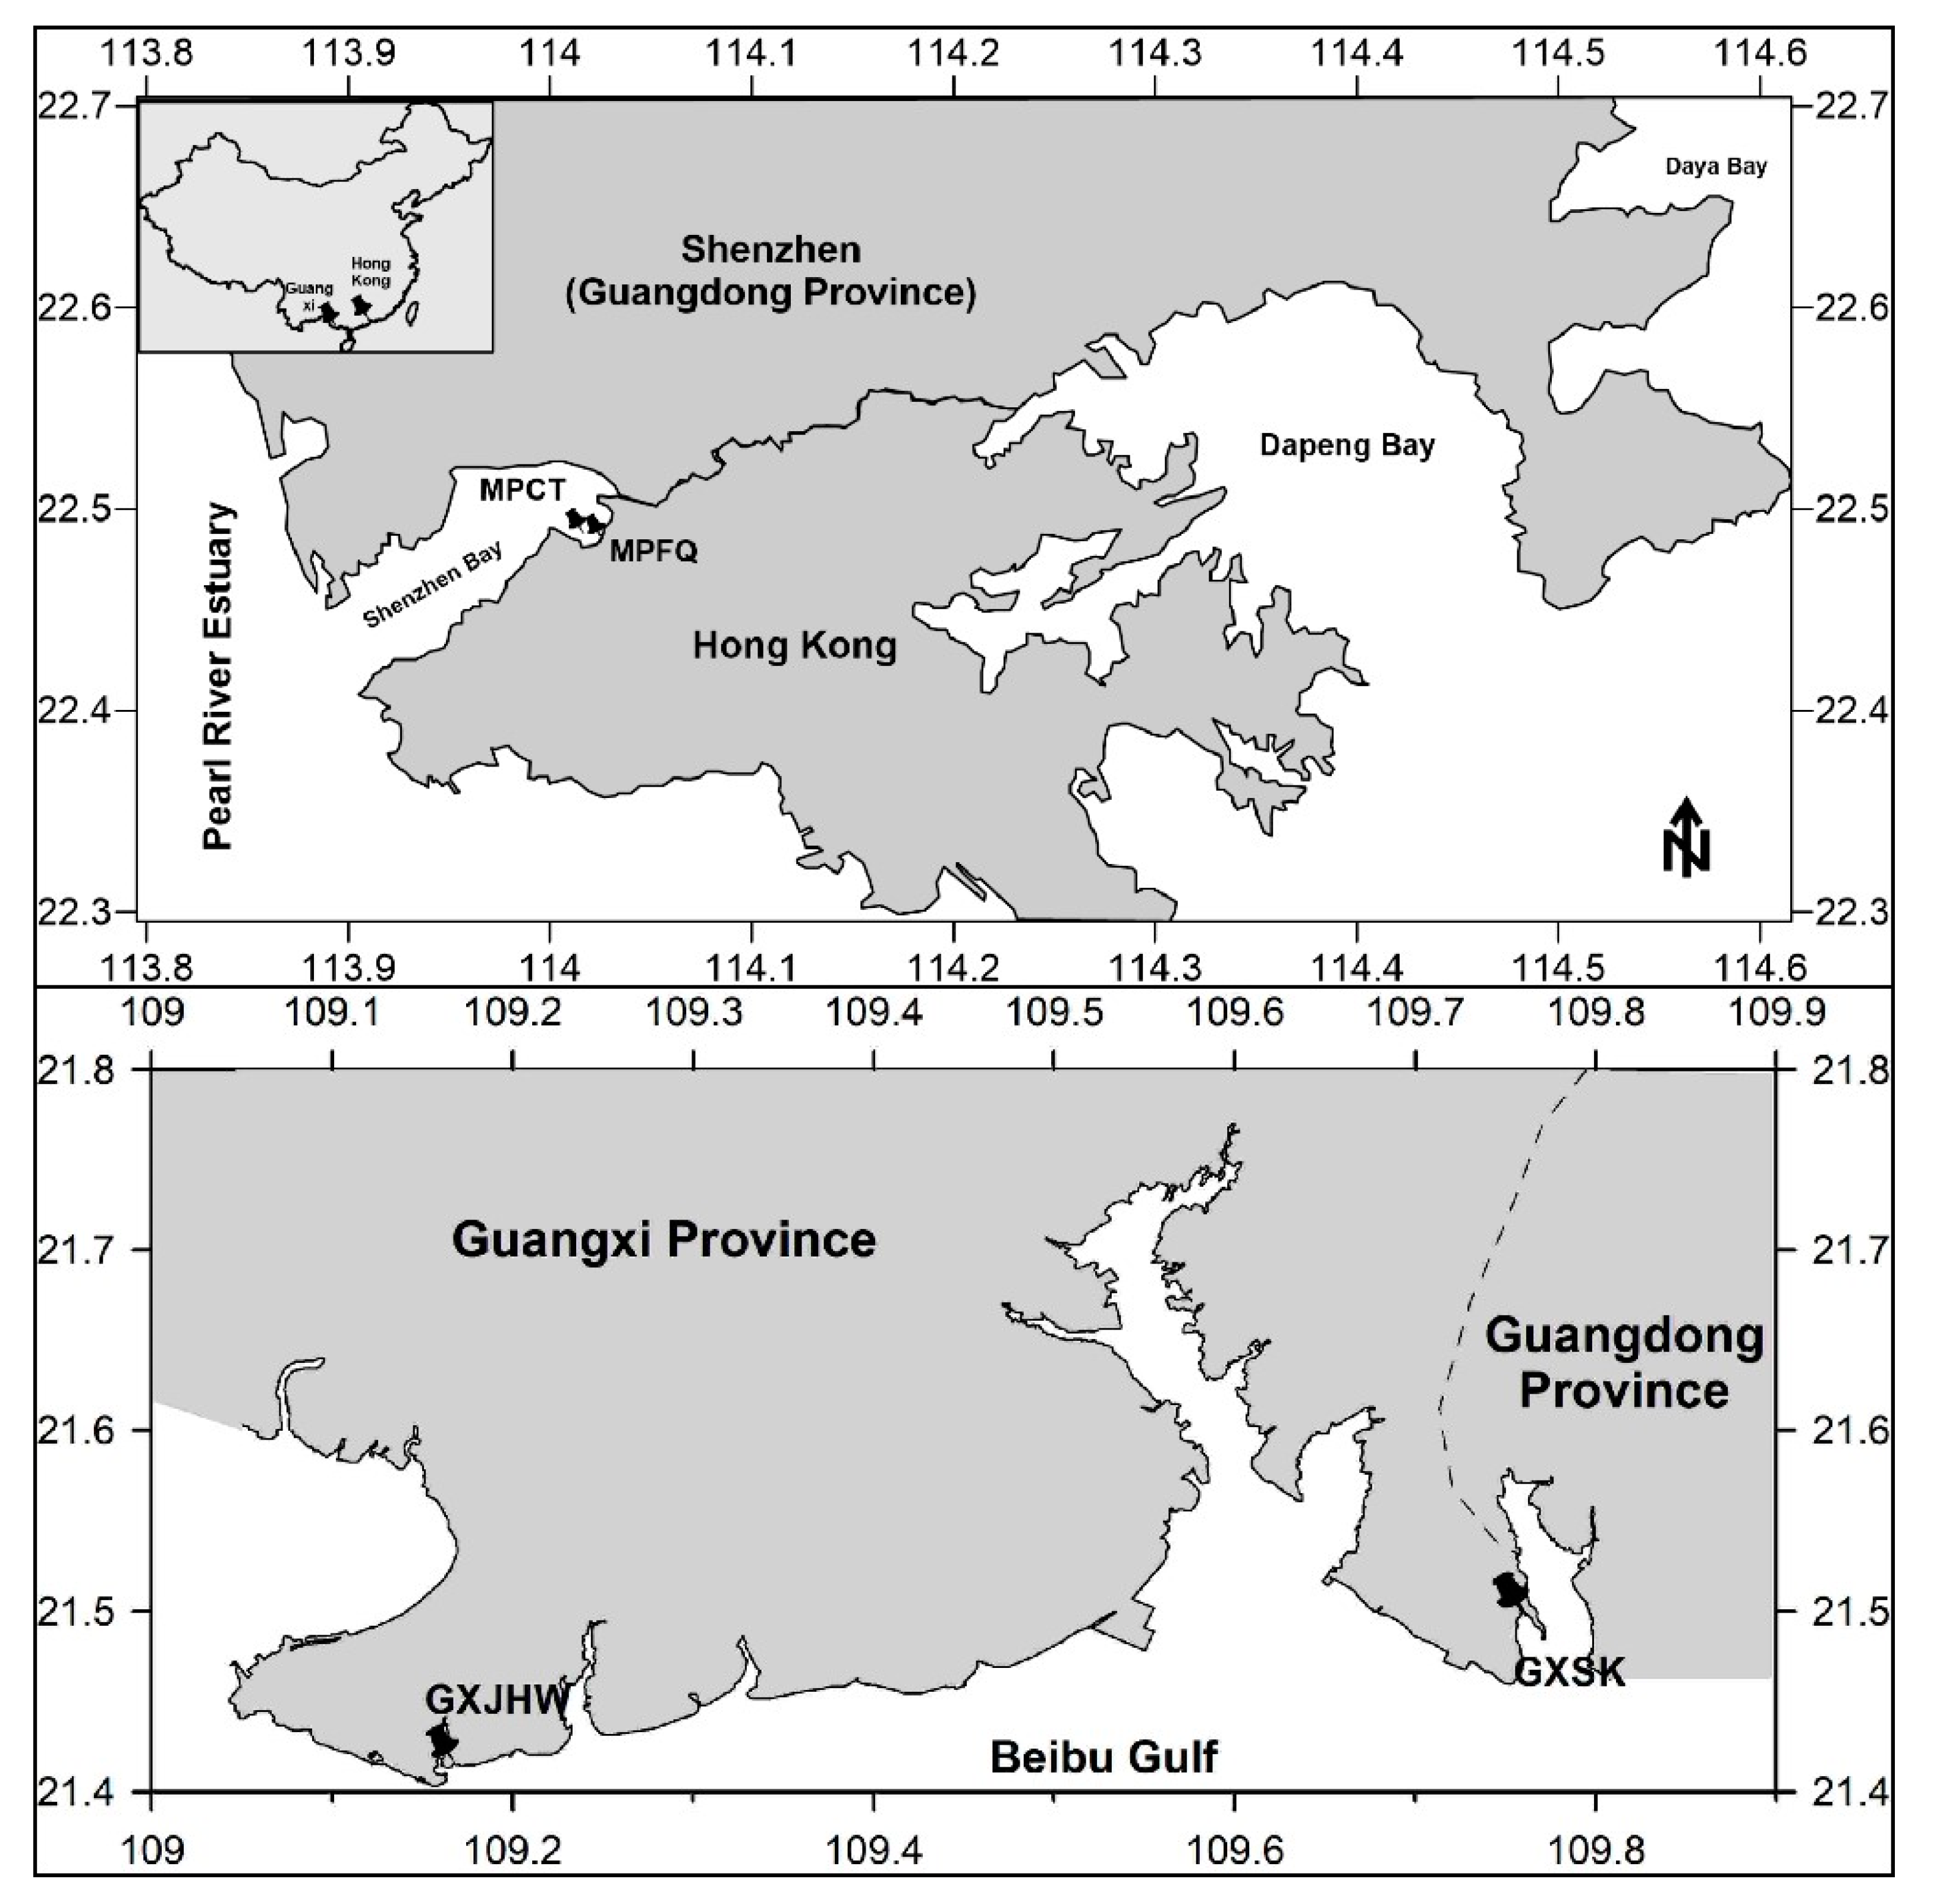
2.1. Site Description

The core samples were collected from four sites in three distinct mangrove reserves in South China (Figure A1). The four sites were Golden Bay Mangrove Reserve in Beihai, Guangxi province (denoted GXJHW, 109.22° N, 21.42° E), Shankou Mangrove Reserve in Hepu, Guangxi province (denoted GXSK, 109.77° N, 21.48° E), a mud flat in MaiPo mangrove, Hong Kong (denoted MPCT, 114.04° N, 22.50° E), and forest sediment in MaiPo mangrove, Hong Kong (denoted MPFQ, 114.04° N, 22.50° E).

2.2. Sampling

Core samples were obtained by plugging acid-washed PVC pipes with sharp edges (1 m length; 5 cm diameter) into the unvegetated mudflat/sediment, followed by manual extraction. The selection of sampling locations was based on the data of surface sediments [26]. We chose a feasible place with little change in surface sediment heavy metals to collect cores. Due to the texture of the sediment, cores were of different average lengths: 35 cm at GXJHW, 33 cm at GXSK, 78 cm at MPCT, and 48 cm at MPFQ. Two duplicate cores were obtained at each sampling site. All core sediments were immediately transported to the lab, arriving within two hours of sampling, and then were sliced into sections at 1 cm intervals using a semi-automatic plastic splitter (CORER by UWITEC®, Mondsee, Austria). The lengths of the cores were compared before and after the transportation, and only minimal changes were observed. After tree roots and leaves were removed from each sample, samples were sealed in plastic bags and stored at 4 °C until further analysis. Samples for 16S rDNA analysis were taken within two hours of sampling and stored at −80 °C until further analysis.

2.3. Analytical Methods

2.3.1. Sedimentary Physicochemical Properties

A particle size analyzer (LS 13 320, Beckman Coulter, Miami, FL, USA) was used to determine the grain size of sediment samples. A grain size of ≤4 μm was clay, 4–63 μm was silt, and ≥63 μm was sand.
The core samples were oven-dried and ground for the analysis of salinity, pH, total carbon (TC), and total nitrogen (TN). To measure salinity and pH, samples were mixed with Milli-Q water at a ratio (sediment/water) of 1:5. Then, samples were shaken for 30 min at 250 rpm at room temperature. After settling overnight, the supernatants were collected and measurements were taken with a salinity meter (VZ8371BZ, AZ Instrument Corp., Taipei, China) and a pH meter (PHS-3C, INESA Scientific Instrument Co., Nanjing, China). After desiccation, TC and TN were determined using a PE 2400 II elemental analyzer (Perkin-Elmer, Waltham, MA, USA); TP was determined using an automatic discrete analyzer (Cleverchem 380; Dechem-Tech, Hamburg, Germany).

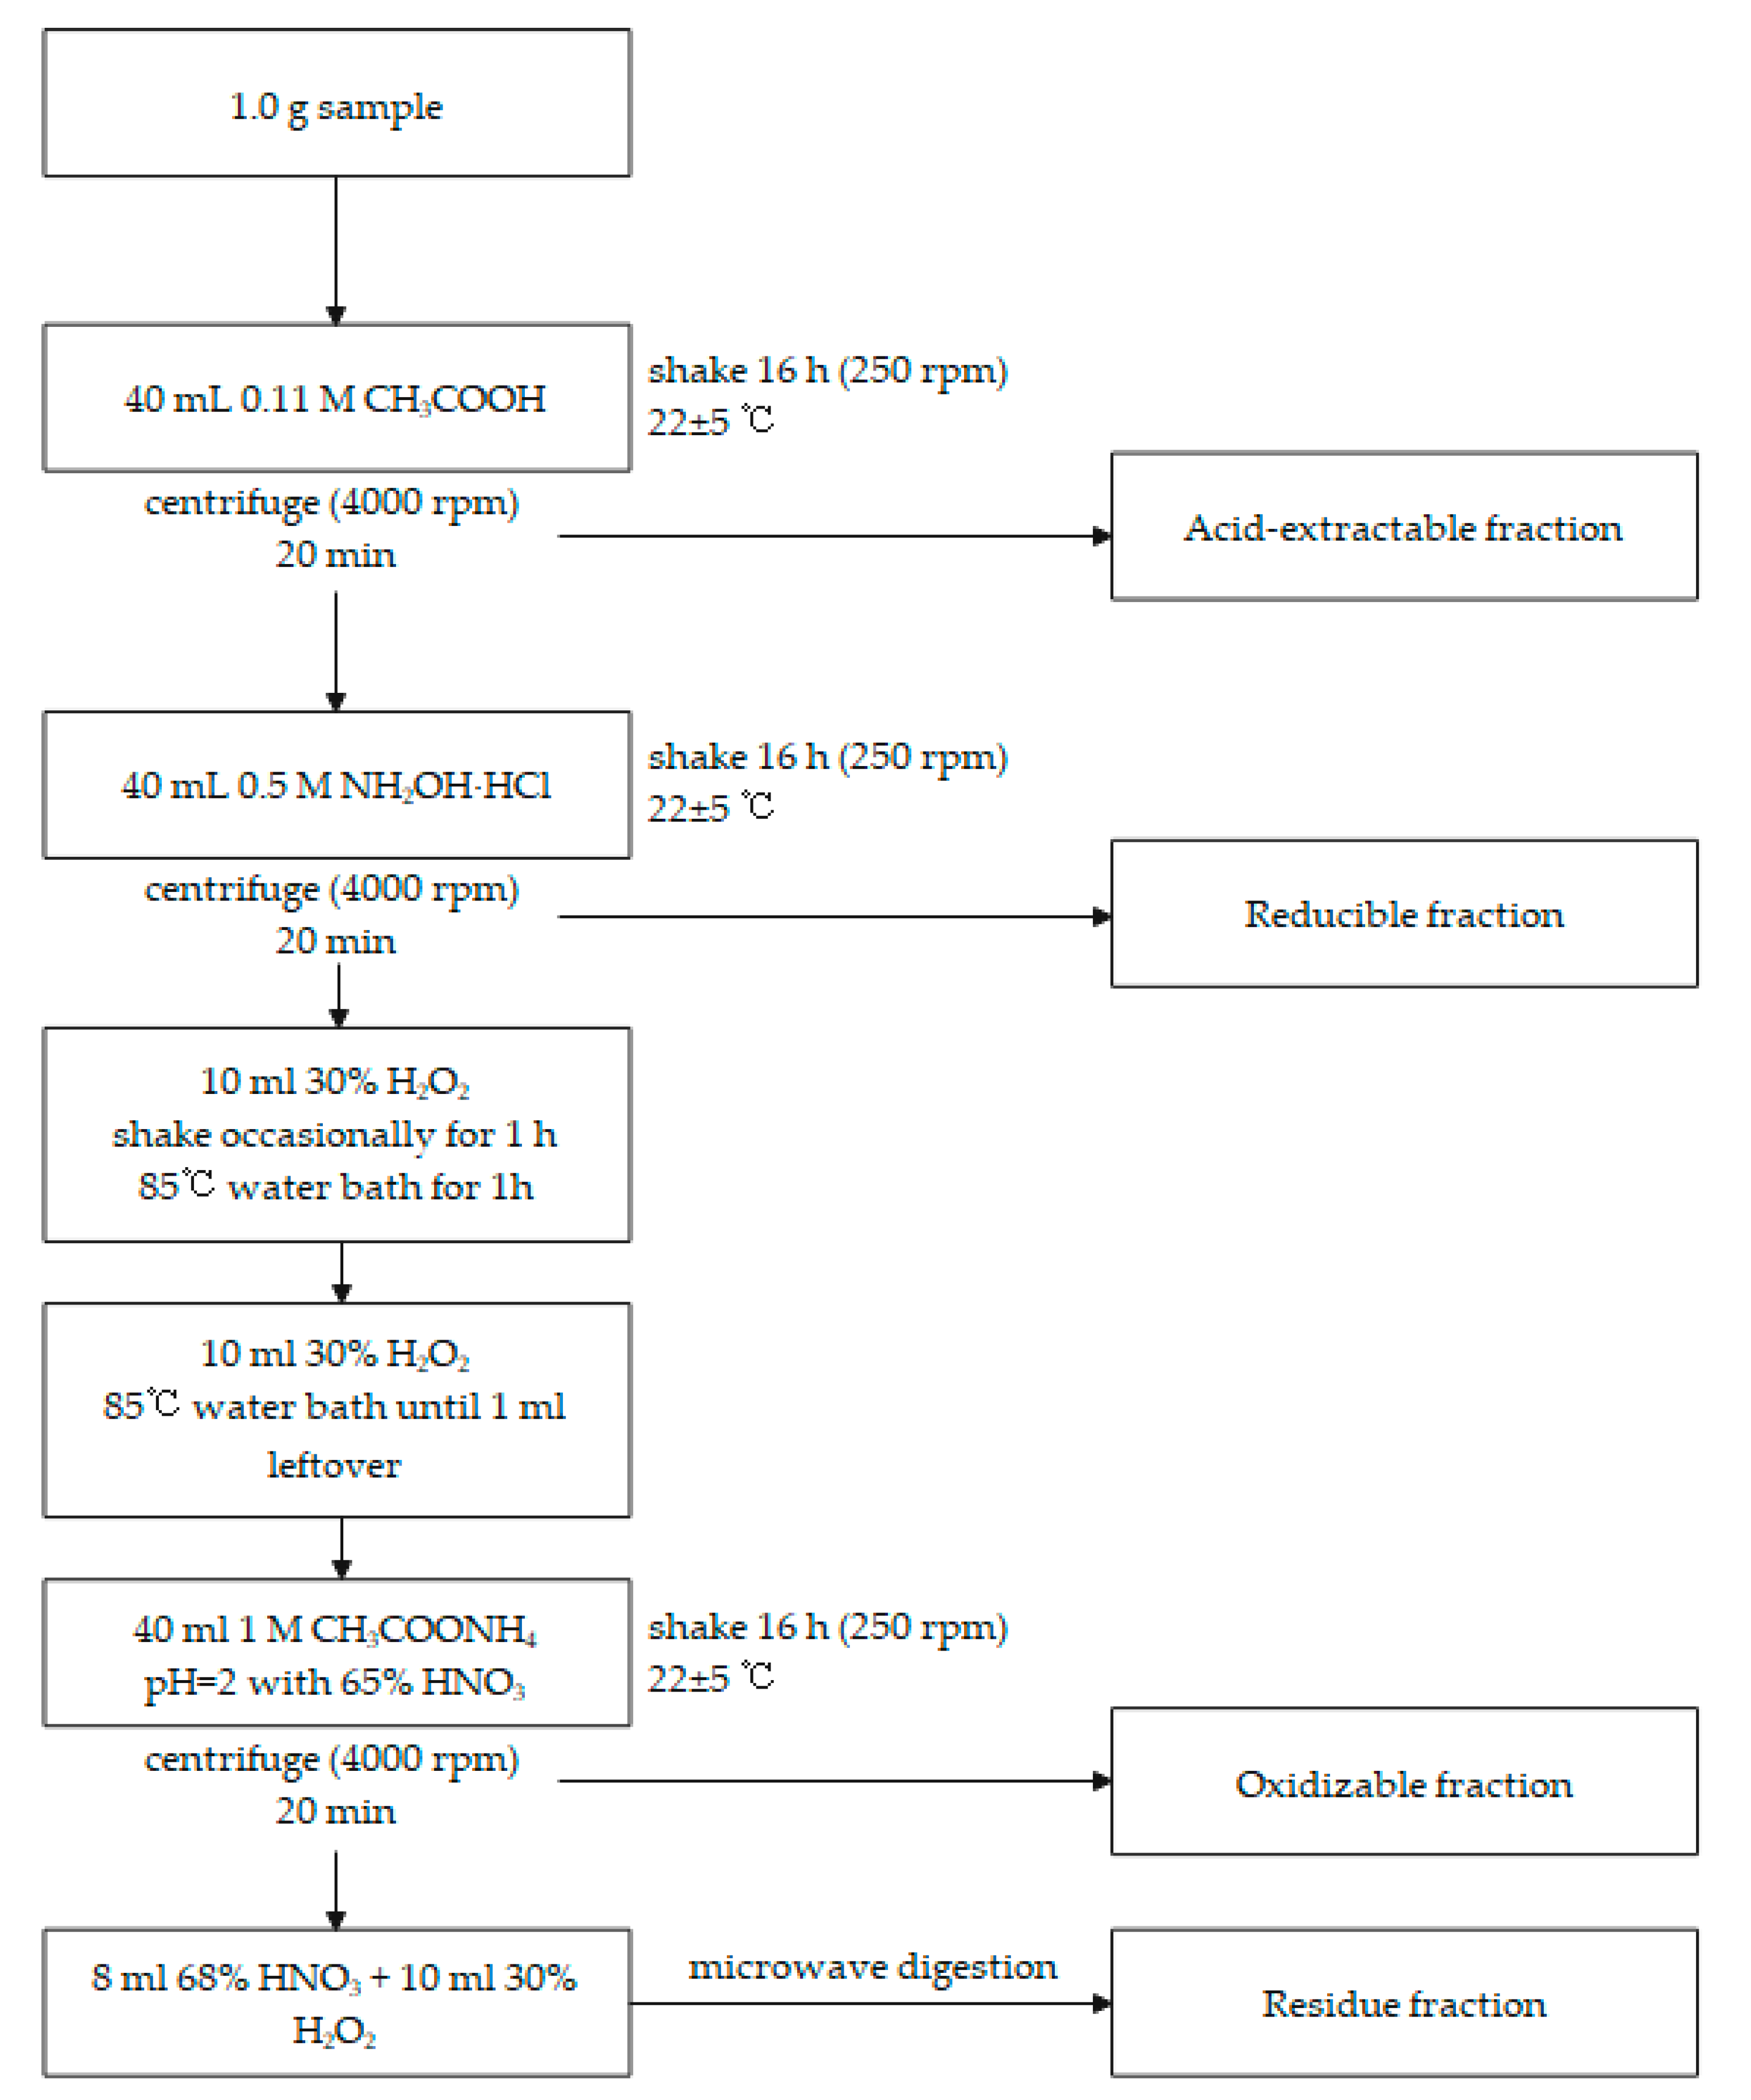
2.3.2. Metal Speciation

Five heavy metals (Cr, Ni, Cu, Zn, and Pb) were analyzed in this study, along with their vertical distribution in sample cores. They were selected based on their toxicity and spatiotemporal concentrations reported in previous studies by Chen et al. [26]. Approximately 0.2 g of the sediment sample was digested in a microwave digestion system (Ethos One, Milestone, Italy) with a mixture of 7 mL 65% HNO3 and 1 mL 20% H2O2 [27]. All reagents were transferred, made up to 50 mL with Milli-Q water, and then used for the determination of the total concentration of heavy metals. Next, the speciation of heavy metals in sediments was characterized by the BCR sequential extraction method [28,29,30,31]. The heavy metals were classified as an acid-extractable fraction, a reducible fraction, an oxidizable fraction, and a residue fraction (Table A1 shows abbreviations; Figure A2 shows the detailed analytical procedure). All heavy metal solutions were tested by inductively coupled plasma optical emission spectroscopy (ICP-OES; Optima 7000DV, Perkin-Elmer, Waltham, MA, USA).

2.3.3. DNA Extraction and Illumina HiSeq Sequencing

The total DNA of each sediment sample was extracted using a FastDNA® spin kit (MP bio, Santa Ana, CA, USA) following the manufacturer’s instructions. The V4 regions of the 16S rDNA genes were amplified with a specific bacterial primer set, 515F (5′-GTGCCAGCMGCCGCGGTAA-3′) and 806R (5′-GGACTACHVGGGTWTCTAAT-3′). A 6 bp error-correcting barcode was included in the reverse primer to characterize each sample. PCR reactions were carried out with Phusion® High-Fidelity PCR Master Mix with GC buffer (New England Biolabs). Sequencing library analysis was performed on an Illumina MiSeq platform at Novogene Bioinformatics Technology Co., Ltd., Beijing, China.

2.3.4. Sedimentation Rate Measurement

Sedimentation rates were measured in the State Key Laboratory of Estuarine and Coastal Research, East China Normal University following IAEA-recommended procedures [32] using the activities of 7Be, 137Cs, 210Pb, and 226Ra in sediments. Dry sediment powders were sealed in a plastic box (70 mm × 70 mm × 70 mm) for three weeks. The radioactivity of 210Pb, 226Ra, 7Be, and 137Cs was measured using a HPGe γ-ray detector (Canberra Be3830) with 35% counting efficiency and an energy resolution of 1.8 keV (at 1332 keV) using multilayer shielding (ultralow background system, 777 lead shield). The activities of 7Be and 137Cs were determined from the γ-ray peak at 477.6 keV (10.5%) and 661.6 k eV (85%), respectively. Results of both 210Pb and 137Cs showed that the sedimentation rate at GXJHW was 0.58 ± 0.02 cm/year, at GXSK was 0.35 ± 0.03 cm/year, at MPCT was 1.43 ± 0.15 cm/year, and at MPFQ was 1.09 ± 0.06 cm/year.

2.4. Quality Assurance and Quality Control

Plastic utensils were mainly used for sampling, and metal utensils were avoided as much as possible to avoid contamination of core sediments. All sampling instruments were cleaned with 5% nitric acid solution before use. All samples were determined in triplicate to check for reproducibility, resulting in a relative deviation of less than 7%. Procedural blanks were measured, and the concentration obtained was subtracted from experimental samples. Standard reference materials (SRM 1646a, Estuarine Sediment, NIST) were digested using the same protocol. The recovery rates for metals in SRM 1646a were greater than 85%.

2.5. Methods to Evaluate Heavy Metal Pollution

The ecological risk index proposed by Håkanson [33] was calculated to assess the heavy metal pollution of the sediments. This method used both measured total concentrations and background concentrations of metals, hence considering the sensitivity of biological communities and toxicity [34]. The metal contamination coefficient C was calculated using Equation (1):
C r i = C i B i
where C i is the measure content of metal i in sediment, and B i is the metal’s concentration in background sediment. We used pre-industrial metal contents as the background values (Cr = 60 mg/kg, Ni = 30 mg/kg, Cu = 30 mg/kg, Zn = 80 mg/kg, Pb = 25 mg/kg) [33]. Then, the potential ecological risk factor of individual metals was calculated using Equation (2):
E r i = T r i × C r i
where T r i is thetoxicity response coefficient of an individual metal, which was determined for Cr = 2, Ni = 2, Cu = 5, Zn = 1, Pb = 5, respectively) [33]. Finally, the comprehensive potential ecological risk index (RI) was calculated using Equation (3).
R I = i = 1 n E r i
Moreover, it is generally believed that results based on heavy metal speciation much more accurately reflect the true level of heavy metal pollution [35]. Risk assessment methods based on heavy metal speciation mainly use the risk assessment coding method (RAC) and the ratio method of secondary phase to primary phase (RSP) [36]. RAC evaluates the environmental pollution risk of heavy metals based on the ratio of the heavy metal active speciation to the sum of the four individual speciations [37]. The formula for RAC is as follows:
RAC = 100 %   × ( EXC + CAR ) ( EXC + CAR + OM + OX + RES )
where EXC + CAR represents the acid-extractable fraction, OM represents the reducible fraction, OX represents the oxidizable fraction, and RES represents the residue fraction. RAC < 1% represents no risk, 1% ≤ RAC ≤ 10% is low risk, 11% ≤ RAC ≤ 30% is a moderate risk, 31% ≤ RAC ≤ 50% represents a high risk, and RAC > 50% shows an extremely high risk.
RSP is generally used to distinguish natural and man-made sources of heavy metals [38]. The formula for RSP is as follows:
RSP = M sec M prim
where Msec represents the content of heavy metals in the secondary phase of soil, which is calculated from the sum of the acid-extractable fraction, reducible fraction, and oxidizable fraction; and Mprim represents the heavy metal content in the primary phase and is calculated from the residue fraction. When RSP ≤ 1, there is no pollution; 1 < RSP ≤ 2 means mild pollution, 2 < RSP ≤ 3 means moderate pollution, and RSP > 3 represents heavy pollution.

2.6. Statistical Analysis

Statistical analyses were performed using SPSS version 16.0 (SPSS Inc., Chicago, IL, USA). Parameters were analyzed by single/multivariate analysis of variance, Spearman analysis, Mantel test, variance partitioning analysis, and principle component analysis. Single analysis of variance was used to study whether a certain factor has a significant impact on the experimental results. Multivariate analysis of variance can analyze two or more variables and can usually test for the significance of each variable. Spearman analysis can reveal the correlation between the measured indicators, which is significant when the p-value is less than 0.05 and extremely significant when the p-value is less than 0.01. The Mantel test is different from other correlation analysis: it can directly analyze the correlation between two types of variables (such as the physicochemical properties of sediment and bacterial diversity). Variance partitioning analysis (VPA) was performed to calculate the proportion of the explanation of different types of environmental factors on the change of bacterial community structure. Principal component analysis (PCA) obtains new variables through linear transformation, by which process the new variables cluster several original, closely related variables into one group.

3. Results and Discussion

3.1. Physicochemical Properties and Metal Speciation Profiles in Cores from Mangrove Sediments

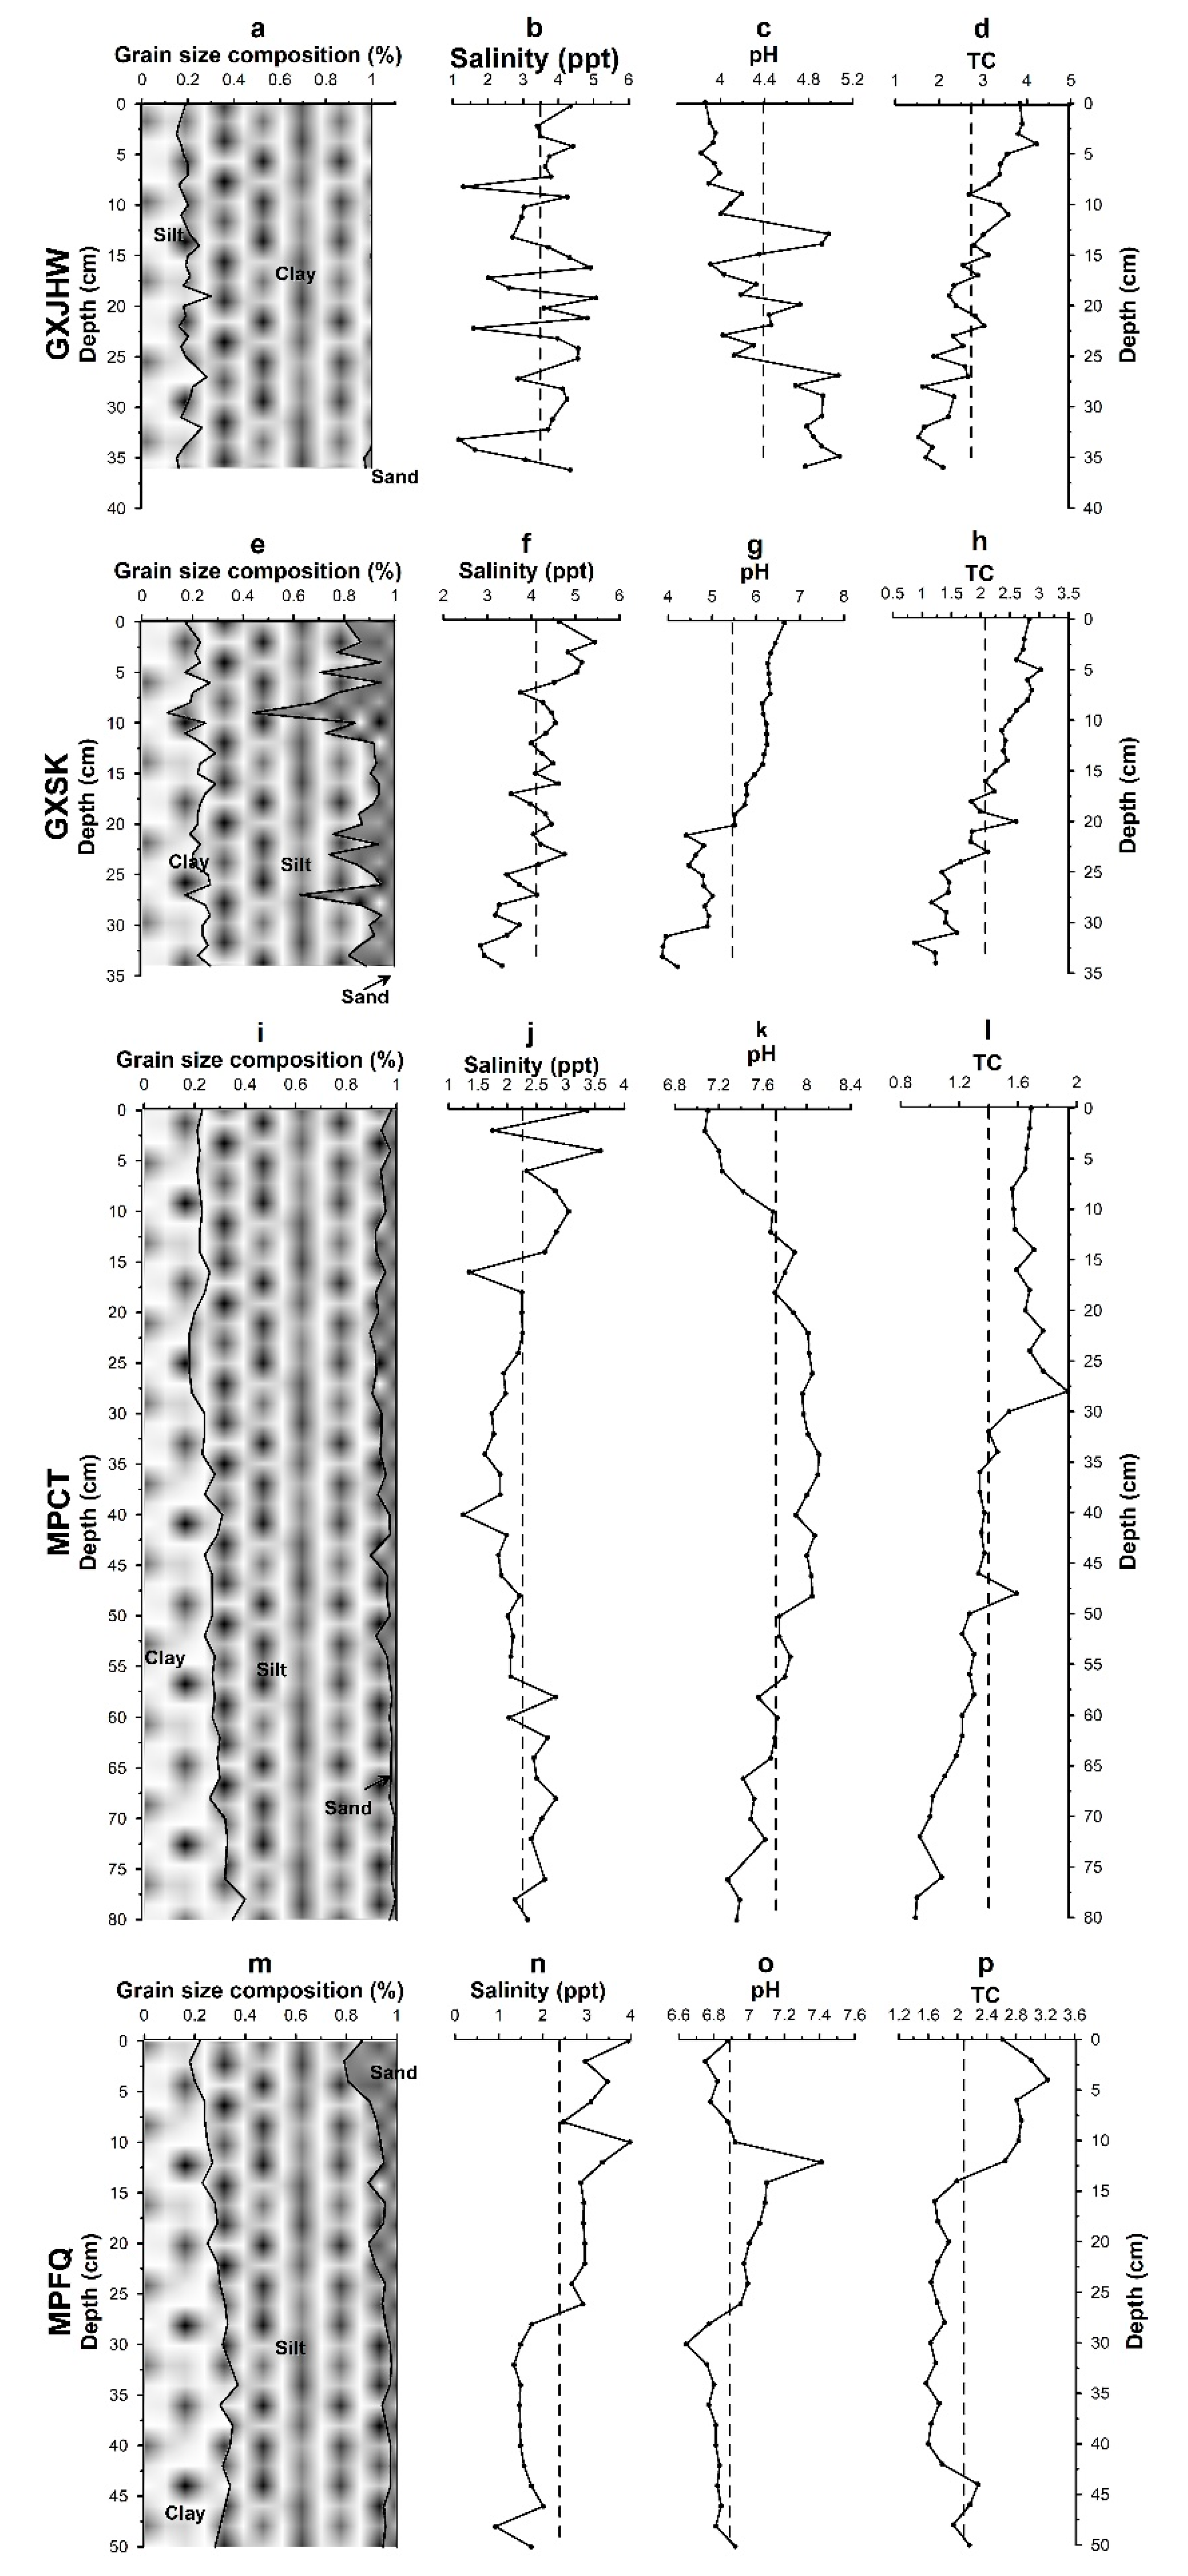
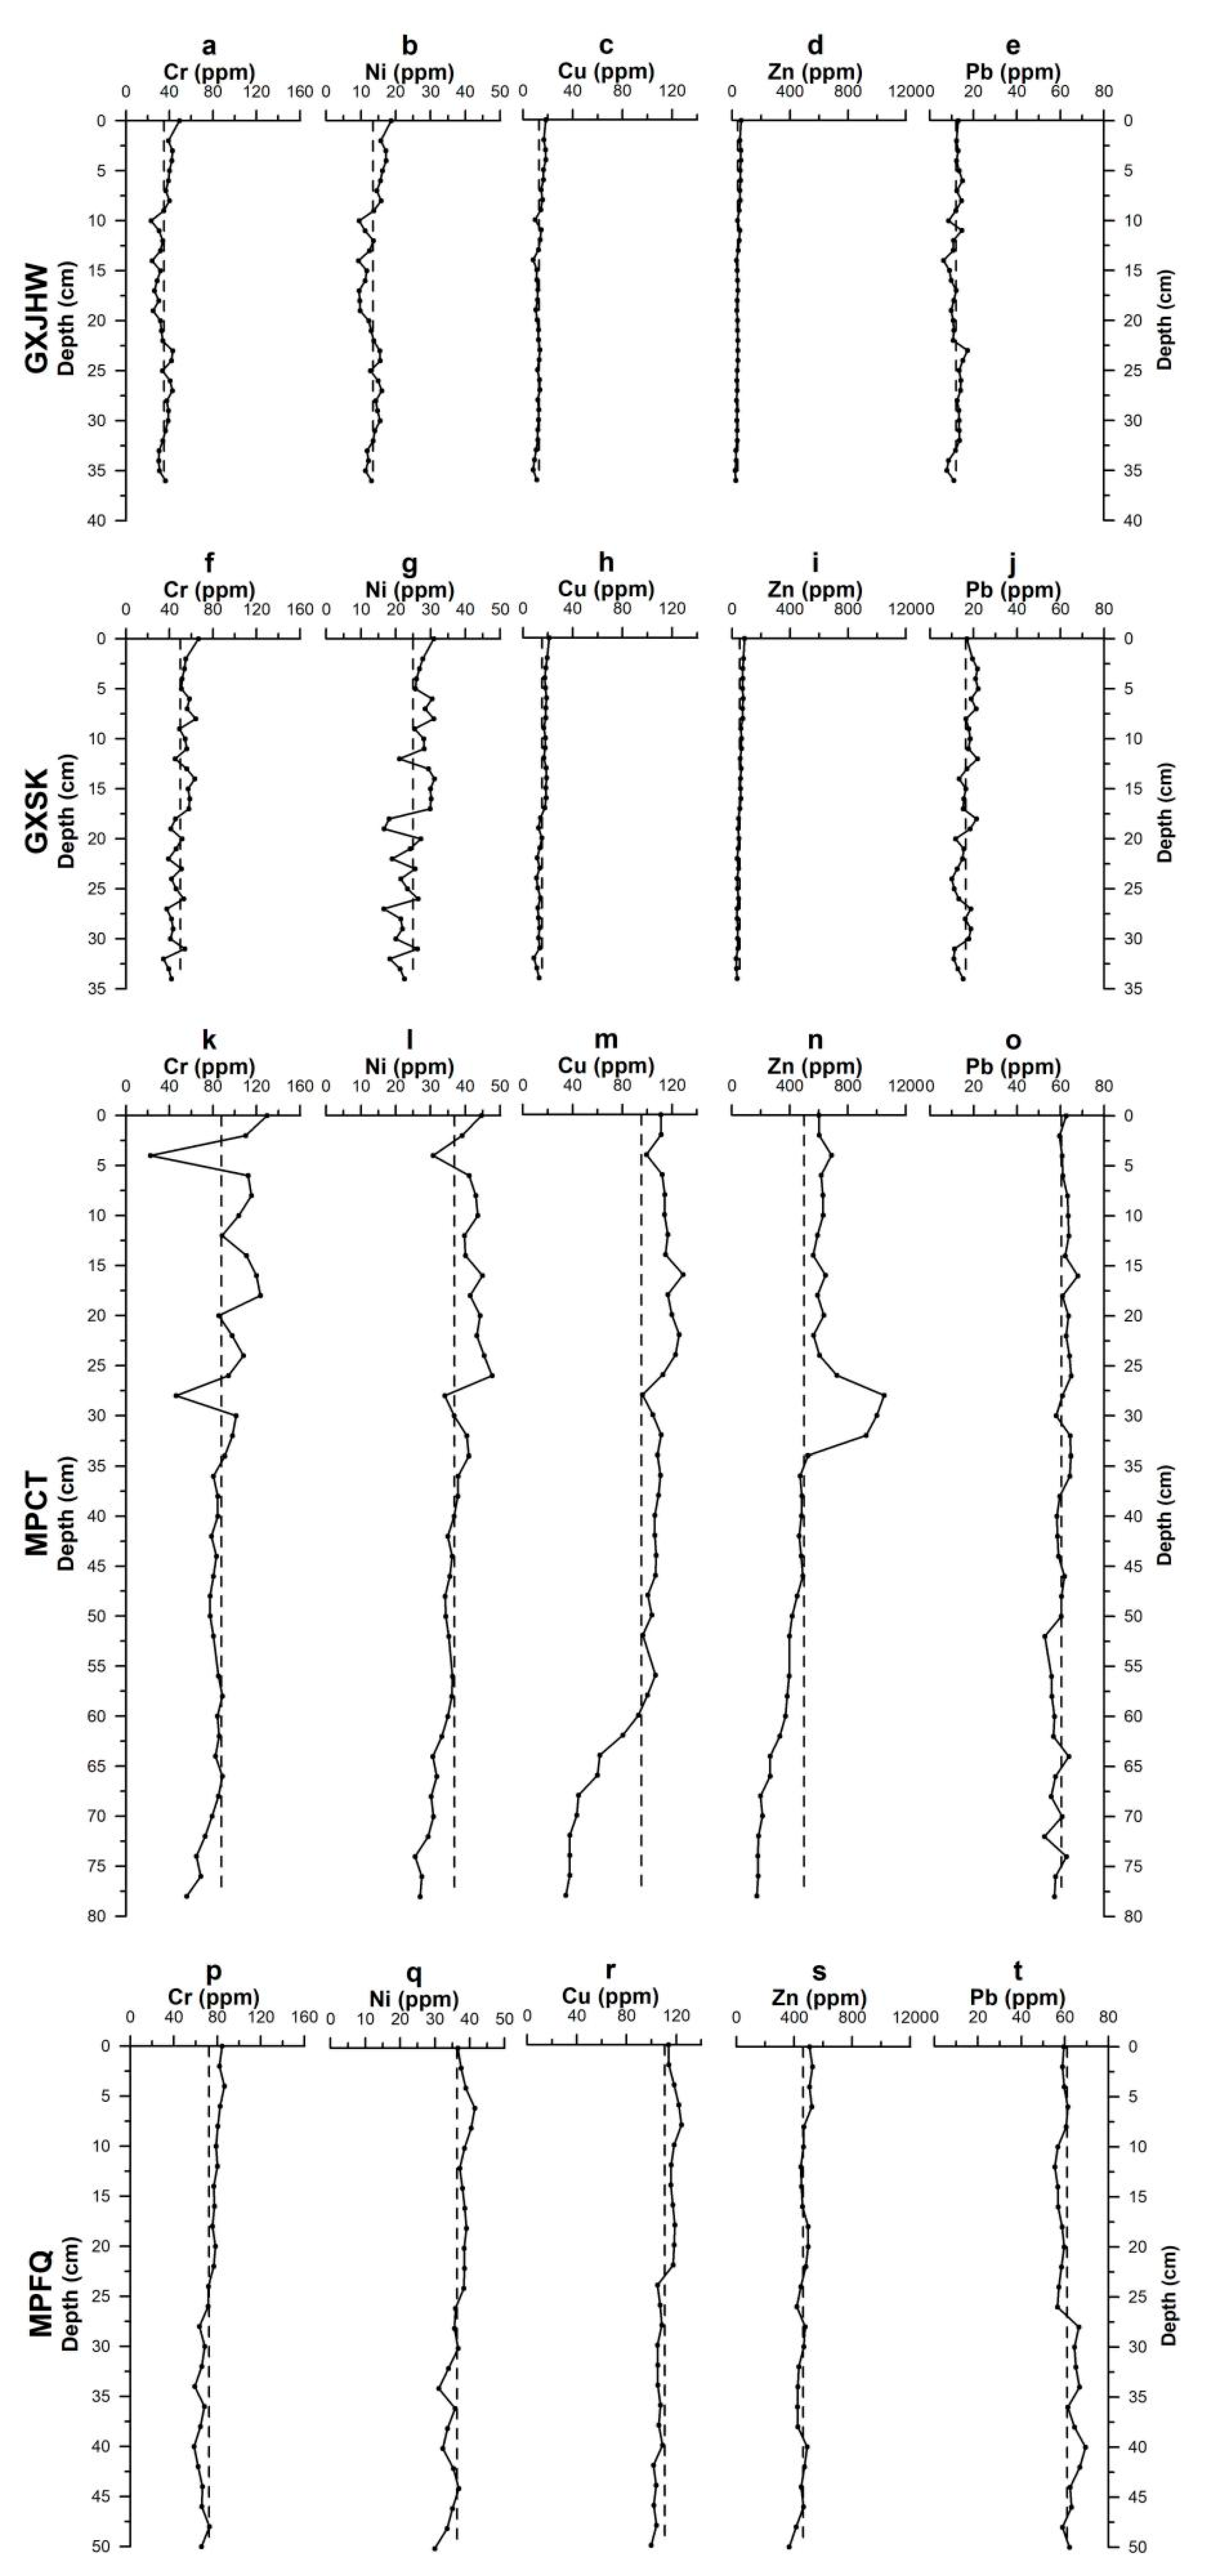
3.1.1. Vertical Profiles of Physicochemical Properties of Sediment Cores

Studies have shown that the heavy metal content in mangrove sediments is closely related to vegetation type, organic matter content, and physicochemical properties [39,40]. The grain size is correlated with the sorption capacity of the sediment, and generally the metal content increases as the grain size decreases [41,42]. For example, Soto-jimenez and Paez-Osuna [43] found that heavy metal content positively correlated with clay and silt, and negatively correlated with sand in the mangroves of the Mazatlan Harbor. This was reflected in the variation in heavy metal content across most of our sampling sites (Table 1; Figure 1). For example, the proportion of sand in MPCT and MPFQ cores was lower than that in GXSK samples, while the latter had lower levels of heavy metals (Figure 1a,f,k,p). However, GXJHW proved to be an exception: there was no sand in GXJHW sediments, yet this site showed the lowest heavy metal content, indicating that heavy metal content is not only related to grain size, but must also depend on other factors [44].
Moreover, Murray et al. [42] found that the smaller the particle size of the sediment, the higher the heavy metal content in the oxidizable and residue fractions; on the other hand, the larger the sediment particle size, the lower the heavy metal content of the acid-soluble fraction. We made similar observations with vertical depth of the MPCT and MPFQ cores, where the proportions of Cr, Ni, Cu, and Zn in the oxidizable and residue fractions increased as the clay content decreased (Figure 1a,f,k,p and Figure 2k–t).
pH also influences heavy metal availability. Studies have shown that when the pH of sediments increases, the acid-extractable fraction of heavy metals decreases and promotes the conversion of the metals present to other forms [50,51]. This is consistent with our observations that as pH increased with the depth of the core sample, the acid-extractable fraction of Zn and Pb decreased and was transformed into other chemical species (Figure 1d,i,n,s and Figure 2d,i,n,s,e,j,o,t).
TC is also a key factor affecting heavy metal content and speciation. Tam and Yao [52] found that Cr and Cu are significantly positively correlated with TC in Hong Kong mangrove sediments. However, our data showed the opposite results for MPCT and MPFQ samples, which had relatively high metal content yet low levels of TC compared to sites in Guangxi province. In sediments with naturally occurring metals, TC is normally positively correlated with metal content; on the other hand, highly polluted areas such as the Mai Po wetland in Hong Kong have likely received anthropogenic metals and hence show no correlation between metal content and TC. Moreover, other studies have shown that the oxidizable fraction of heavy metals in sediments is positively correlated with TC [53]. We found that GXSK and GXJHW samples had higher TC content and a higher oxidizable fraction of heavy metals than did the other two sites (Figure 1e,j,o,t and Figure 2), which is consistent with the findings of Li and Liu [53] and indicates that the accumulation of TC can increase the proportion of heavy metals in the oxidizable fraction and thereby reduce biological toxicity.

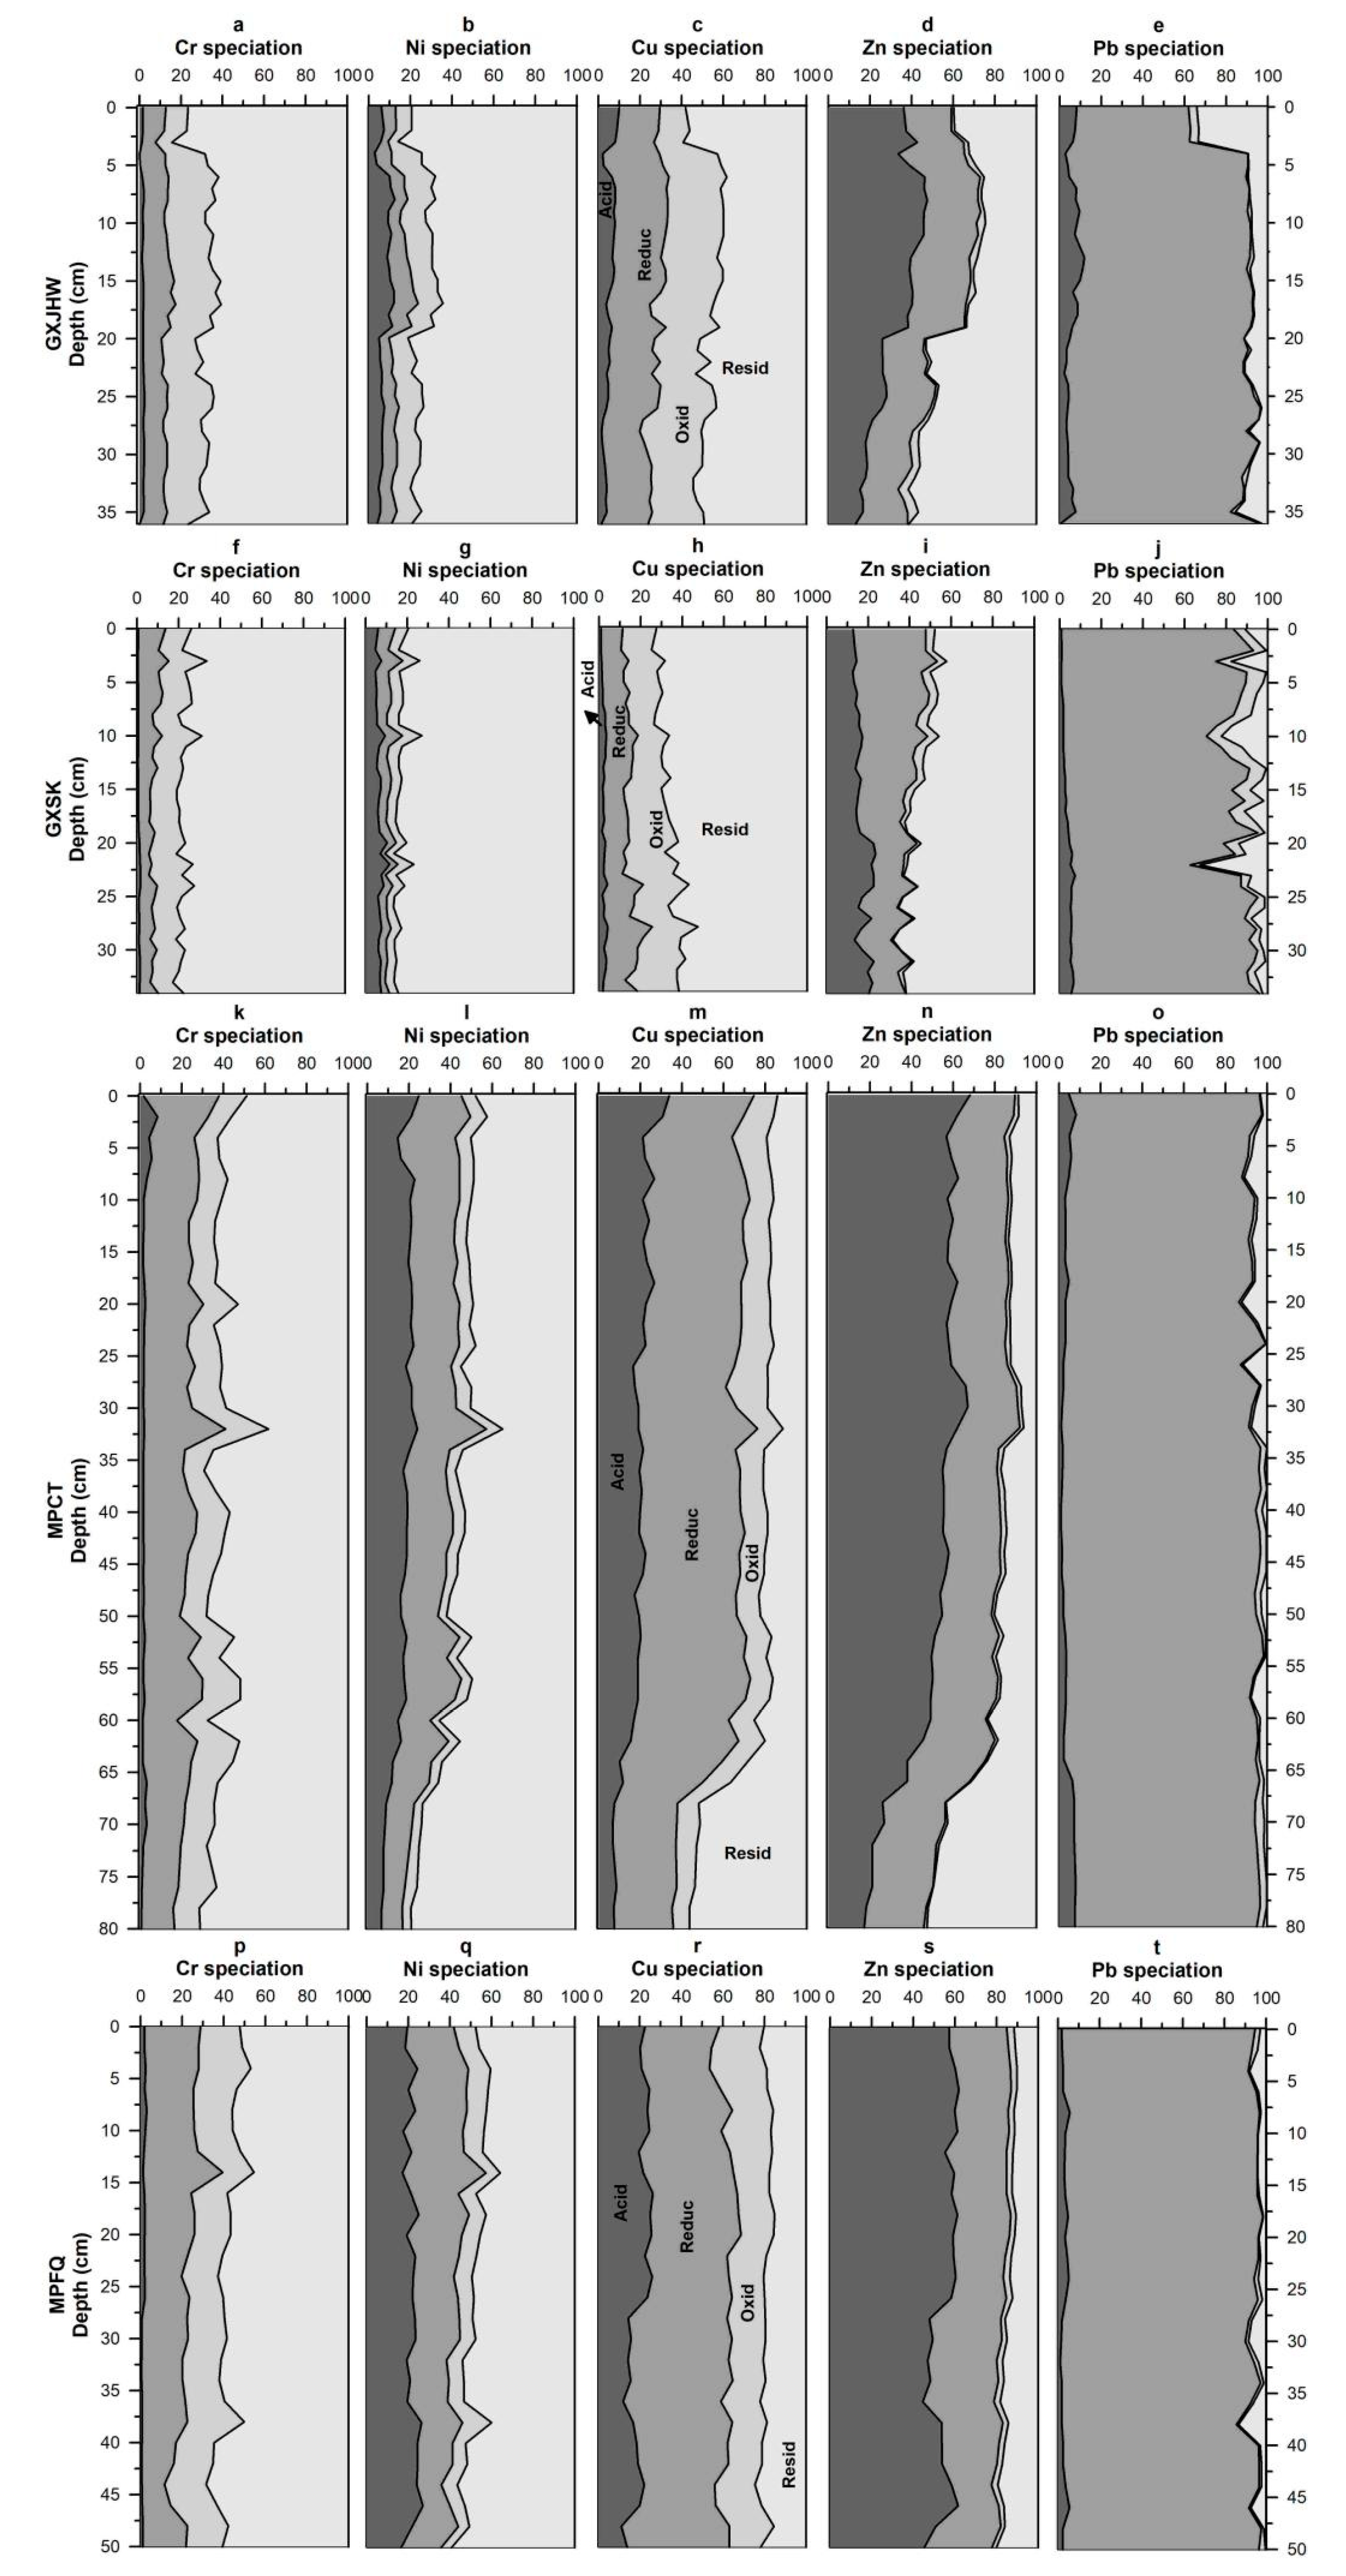
3.1.2. Vertical Profiles of Metal Speciation in Sediment Cores

The heavy metals in mangrove sediments mainly come from industrial waste, urban runoff, municipal refuse, effluent from sewage-treatment plants, shipbuilding, chemical dumping, and leakage from mineral operations [54,55,56]. To study the changes in the availability of anthropogenic heavy metals after deposition in mangrove sediments, we measured the total amount and chemical form of Cr, Ni, Cu, Zn, and Pb in core sediments. The average vertical content of the five metals and their ecological risk index are listed in Table 1. Previous studies suggested that E r i < 40 and RI < 150 were consideried low ecological risk [33]. Therefore, sedimentary Cr, Ni, Cu, Zn, and Pb of all four wetlands had low ecological risk. Nevertheless, statistically significant differences were observed in both total metal concentrations and E r i among four sites (performed by single factor analysis of variance followed with R-E-G-W F test). For example, the order of Cr in the four sampling sites was MPFQ > MPCT > GXSK > GXJHW (F = 86.753; p < 0.001); the order of Ni was MPFQ ≈ MPCT > GXSK > GXJHW (F = 182.561; p < 0.001); the order of Cu was MPFQ > MPCT > GXSK ≈ GXJHW (F = 355.194; p < 0.001); the order of Zn was MPFQ ≈ MPCT > GXSK ≈ GXJHW (F = 158.614; p < 0.001), and the order of Pb was MPFQ ≈ MPCT > GXSK > GXJHW (F = 1759.817; p < 0.001) (“>” indicated statistically significantly higher, “<” indicated statistically significantly lower, “≈” indicated no statistically significant difference).
Moreover, compared to other mangroves around the South China Sea (Table 1), heavy metal content in Guangxi Province had similar values while heavy metal content in Hong Kong presented much higher pollution status. This observation corresponds with the surrounding environmental conditions. Mai Po mangrove is located on the north side of Hong Kong, facing Shenzhen Bay. It is affected by human activities from Hong Kong as well as Shenzhen, both of which are highly developed cities with large populations. The contamination of Mai Po mangrove sediments by heavy metals from human activities has been well documented [57,58,59]. The overall sediment content of the five heavy metals was in consonance with the respective grain size, consistent with previous studies [42,59,60,61]. In contrast, the two mangrove sites in Guangxi province are surrounded by less-developed cities with markedly smaller populations and industries. The sediment at GXJHW had a larger grain size than that of the other three sites, making it less likely to retain metals; indeed, a low metal content was observed in core samples from GXJHW.
Based on the sedimentation rates, the ages of cores collected from GXJWH, GXSK, MPCT, and MPFQ were 60 years, 114 years, 55 years, and 45 years, respectively. These time scales spanned both undeveloped period and the fast-developing period of Guangxi Province and Hong Kong, resulting in higher total concentrations of heavy metals in the upper layers than in the lower layers (Figure A3). A previous study presented similar results and suggested that the higher metal pollution on the top was due to the elevated metal pollution from the development of South China since the reform and opening-up [62]. The vertical profiles of metal speciation at the various sampling sites are shown in Figure 2. Generally, heavy metals exist in nature in different chemical forms, which have different levels of toxicity, bioavailability, and mobility [63,64,65]. Thus, the ability of organisms to absorb heavy metals from sediments depends on the chemical species present [65,66]. For example, Dell’Anno et al. [25] found that only bioavailable heavy metals have a significant impact on the function of the benthic microbial loop: at higher concentrations, bioavailable metal species can significantly inhibit the metabolic turnover of benthic microorganisms. The acid-extractable fraction is generally recognized as the fraction with the greatest bioavailability, while the reducible fraction and oxidizable fraction could potentially be bioavailable when the physicochemical characteristics (especially the Eh) of the environment change [67].

Acid-Extractable Fraction

Across all four sites, there was a significant total amount of chromium, although mainly in the residue fraction, which is not easily released into the environment (Figure 2a,f,k,p). The acid-extractable fraction contained very little Cr, indicating that this metal mainly derives from natural sources and would be difficult for organisms to use directly; hence, it poses a low ecological risk. This is consistent with the report of Li et al. [68], who found that in the mangrove surface sediments of the Yangtze estuary and coastal areas, Cr was predominantly located in the reducible fraction, followed by the oxidizable fraction and the Fe-Mn oxide-binding fraction. On the other hand, the content of chromium in the upper layer of the MPCT core was higher than that in lower sediments, indicating that chromium deposition in recent years has increased. The main sources of Cr are electroplating, mining, smelting, and industrial wastewater [54,69]. The increasing trend in Cr deposition recently is probably caused by the rapid development of Shenzhen’s electronics industry [70] and reflects the close proximity of Mai Po mangrove to Shenzhen and Hong Kong. While Hong Kong’s economic growth has slowed in recent years, Shenzhen’s high-tech electronic technology industry has developed rapidly and become a pillar of Shenzhen’s economic development [62].
The acid-extractable fractions of Ni and Cu were much higher in MPCT and MPFQ samples than in those from GXJHW and GXSK. The main sources of Ni and Cu are coal burning and wastewater discharge from factories [54,69,71]. As for Cr, the acid fractions from MPCT showed a marked increase in Cu and Ni in the upper levels of the sample cores, consistent with an intensification of human activities in recent years. Zhou et al. [72] also found that, due to human activity, the acid-extractable fraction of Cu and Ni in mudflat sediments was enriched at the surface.
The acid-extractable Zn fraction was the highest in MPCT samples, followed by MPFQ, GXJHW, and GXSK (Figure 2d,i,n,s), and the total amount of Zn was also the highest in MPCT cores, suggesting a high level of Zn contamination at the MPCT site. Noronha-D’Mello and Nayak [73] also found that the acid-extractable Zn fraction accounted for the largest proportion of heavy metal contamination at a site on the west coast of India, where Zn levels gradually increased from the bottom layer to the surface layer. The main sources of Zn are roasting, smelting, and wear of rubber tires [56]. Noronha-D’Mello and Nayak [73] believe that the popularity of automobiles and the development of shipping may be the cause of the zinc pollution they observed.

Reducible Fraction

Although there was relatively little Cr and Pb in acid-extractable fractions, both metals were present in significantly greater proportions in the reducible fractions across all samples (Figure 2a,e,f,j,k,o,p,t). The reducible Cu fraction also counted for a relatively large proportion of heavy metal contamination at all four sites (Figure 2c,h,m,r). This shows that the main chemical species of Pb and Cu in core sediments are in the reducible fraction, which can be re-released under certain conditions and therefore cannot be ignored as an ecological risk. This is consistent with previous research [74] demonstrating that Pb was mainly present in the reducible fraction in the early 1990s, probably as a result of the rapid economic development and the use of leaded gasoline at that time. The main sources of Pb are leaded gasoline, lead ore smelting, and batteries [56,75,76]. Due to the focus of international attention on environmental pollution, the Pb pollution caused by human activities decreased from the late 1990s to the early 21st century, and the proportion of Pb in the reducible fraction also decreased. However, this was not found at our GXJHW, MPCT, and MPFQ sampling sites, where the proportion of Pb in the reducible fraction was not significantly reduced, indicating that the human source of Pb has not reduced over time. In GXSK cores, the reducible fraction of Pb varied irregularly, which may be related to local economic development and human activities.

Oxidizable and Residue Fractions

Compared to the reducible fraction, there was less of all five metals in the oxidizable fractions, especially for Zn and Pb (Figure 2d,i,n,s,k,o,p,t). The residue fraction is generally considered to have no bioavailability. Among the five metals, lead was present at the lowest level in the residue fraction, with chromium and nickel relatively high. In general, the residue fractions of all five metals were larger at GXJHW and GXSK than at MPCT and MPFQ, which indicates a higher metal bioavailablity at GXJHW and GXSK than at MPCT and MPFQ.

3.2. Bacterial Community Structures in Sediment Cores

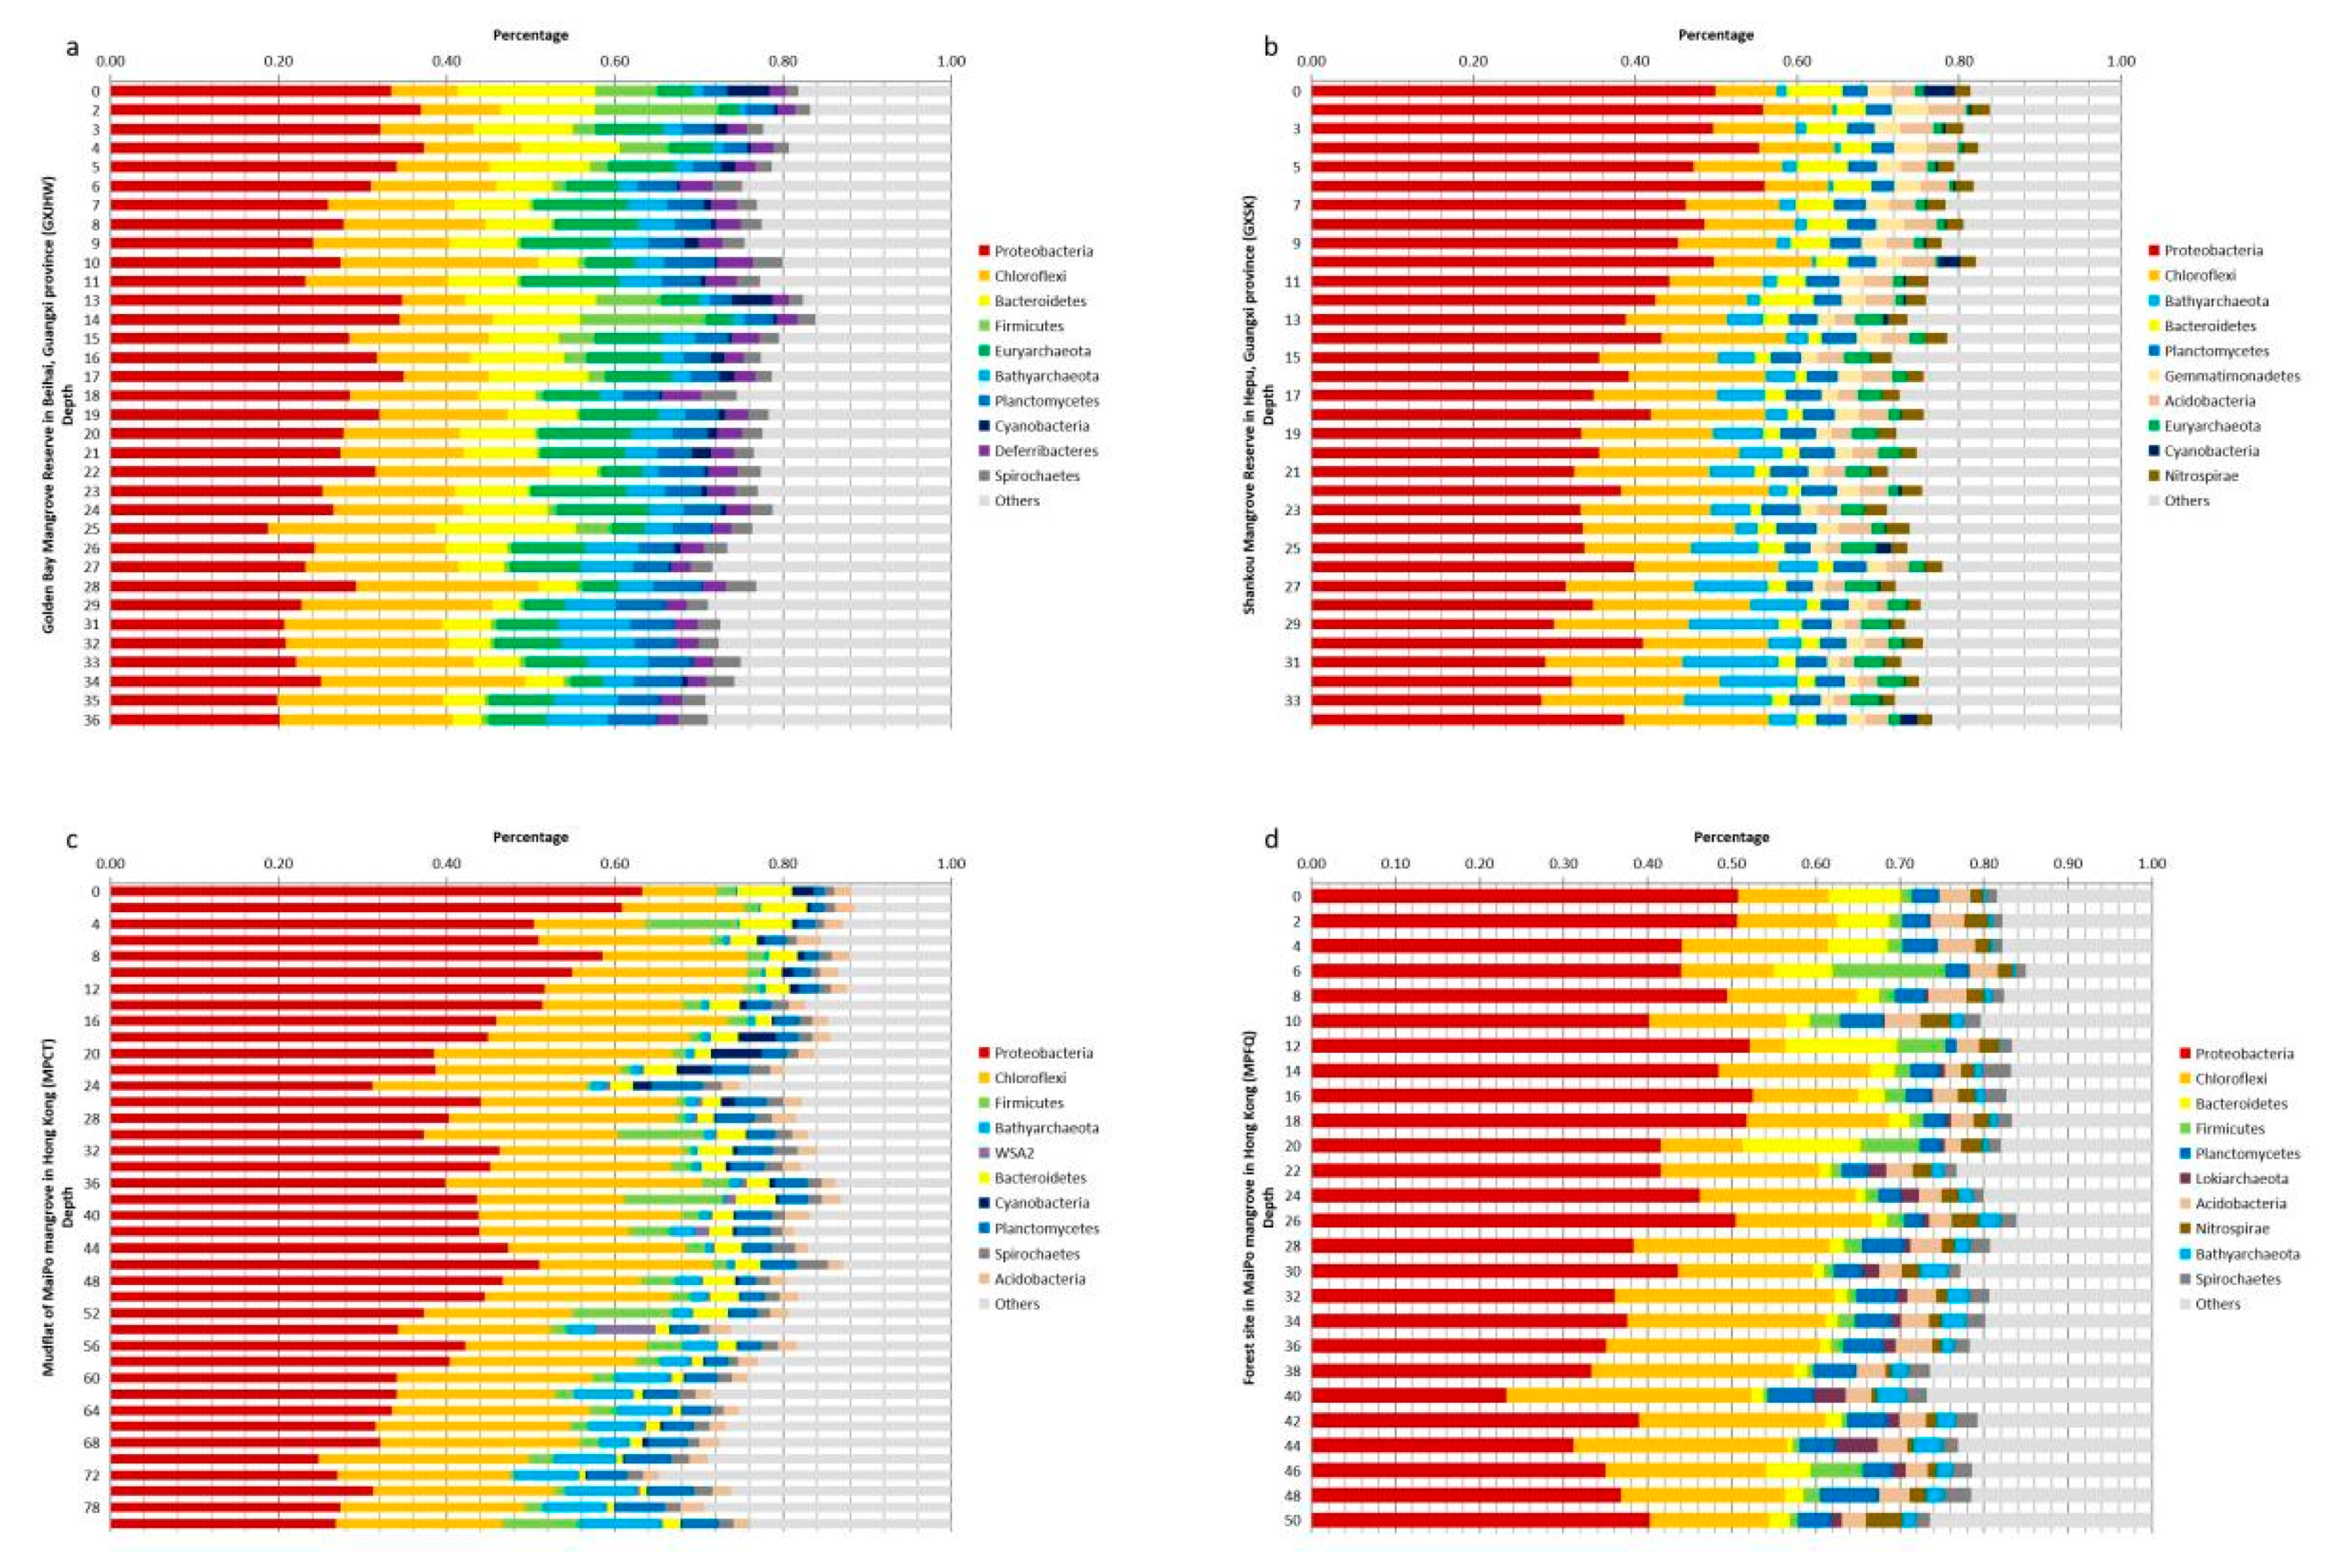
3.2.1. Vertical Profiles of Top 10 Phyla in Sediment Cores

The vertical profiles of the top 10 bacterial phyla in mangrove sediments are presented in Figure 3. In terms of bacterial abundance, Proteobacteria was the dominant phylum, followed by Chloroflexi, across all four sampling sites. Differences among the four sites became apparent from the third-most-abundant phylum. At GXJHW, Bacteroidetes was the third-largest phylum, although its representation decreased with sample depth, while Firmicutes bacteria were only present at low levels beyond a depth of 18 cm. In contrast, the abundance of Bathyarchaeota increased with depth. At GXSK, Bathyarchaeota was the third-largest phylum, followed by Bacteroidetes, Planctomycetes, and Gemmatimonadetes. The abundance of species belonging to Proteobacteria and Bacteroidetes generally decreased with depth, while Chloroflexi and Bathyarchaeota increased. At MPCT, Firmicutes was the third-largest phylum, followed by Bathyarchaeota, WSA2, and Bacteroidetes. At the same time, the abundance of Proteobacteria, Bacteroidetes, and Cyanobacteria generally decreased, and Planctomycetes increased as depth increased. At MPFQ, Bacteroidetes was the third-largest phylum, but its abundance generally decreased, while Lokiarchaeota and Bathyarchaeota increased with depth. Deferribacteres was listed among the top 10 phyla only at site GXJHW, WSA2 only at MPCT, and Lokiarchaeota only at MPFQ.
Heavy metals may have a significant impact on the bacterial diversity of some phyla. The relative abundance of Chloroflexi increased at sites with higher Cu (Figure 3). Shao et al. [77] also found such an association between the abundance of Chloroflexi and Cu level, indicating that Chloroflexi bacteria have a strong resistance to copper. Schneider et al. [78] found that the relative abundance of Proteobacteria was elevated at sites with higher Pb levels, consistent with our finding of the high relative abundance of Proteobacteria in the Mai Po wetland, which contains high levels of Pb. In addition, several studies have demonstrated that Proteobacteria, Bacteroides, and Acidobacter, which are usually the dominant taxa in the sedimentary environment, are consistently important contributors to biogeochemical processes, such as ammoniation and sulphate reduction [16,79]. This indicates that the response of microorganisms to heavy metals may be related to their physiological capabilities, and also to other environmental factors such as depth, pH, salinity, and organic matter content of the sediment [80].

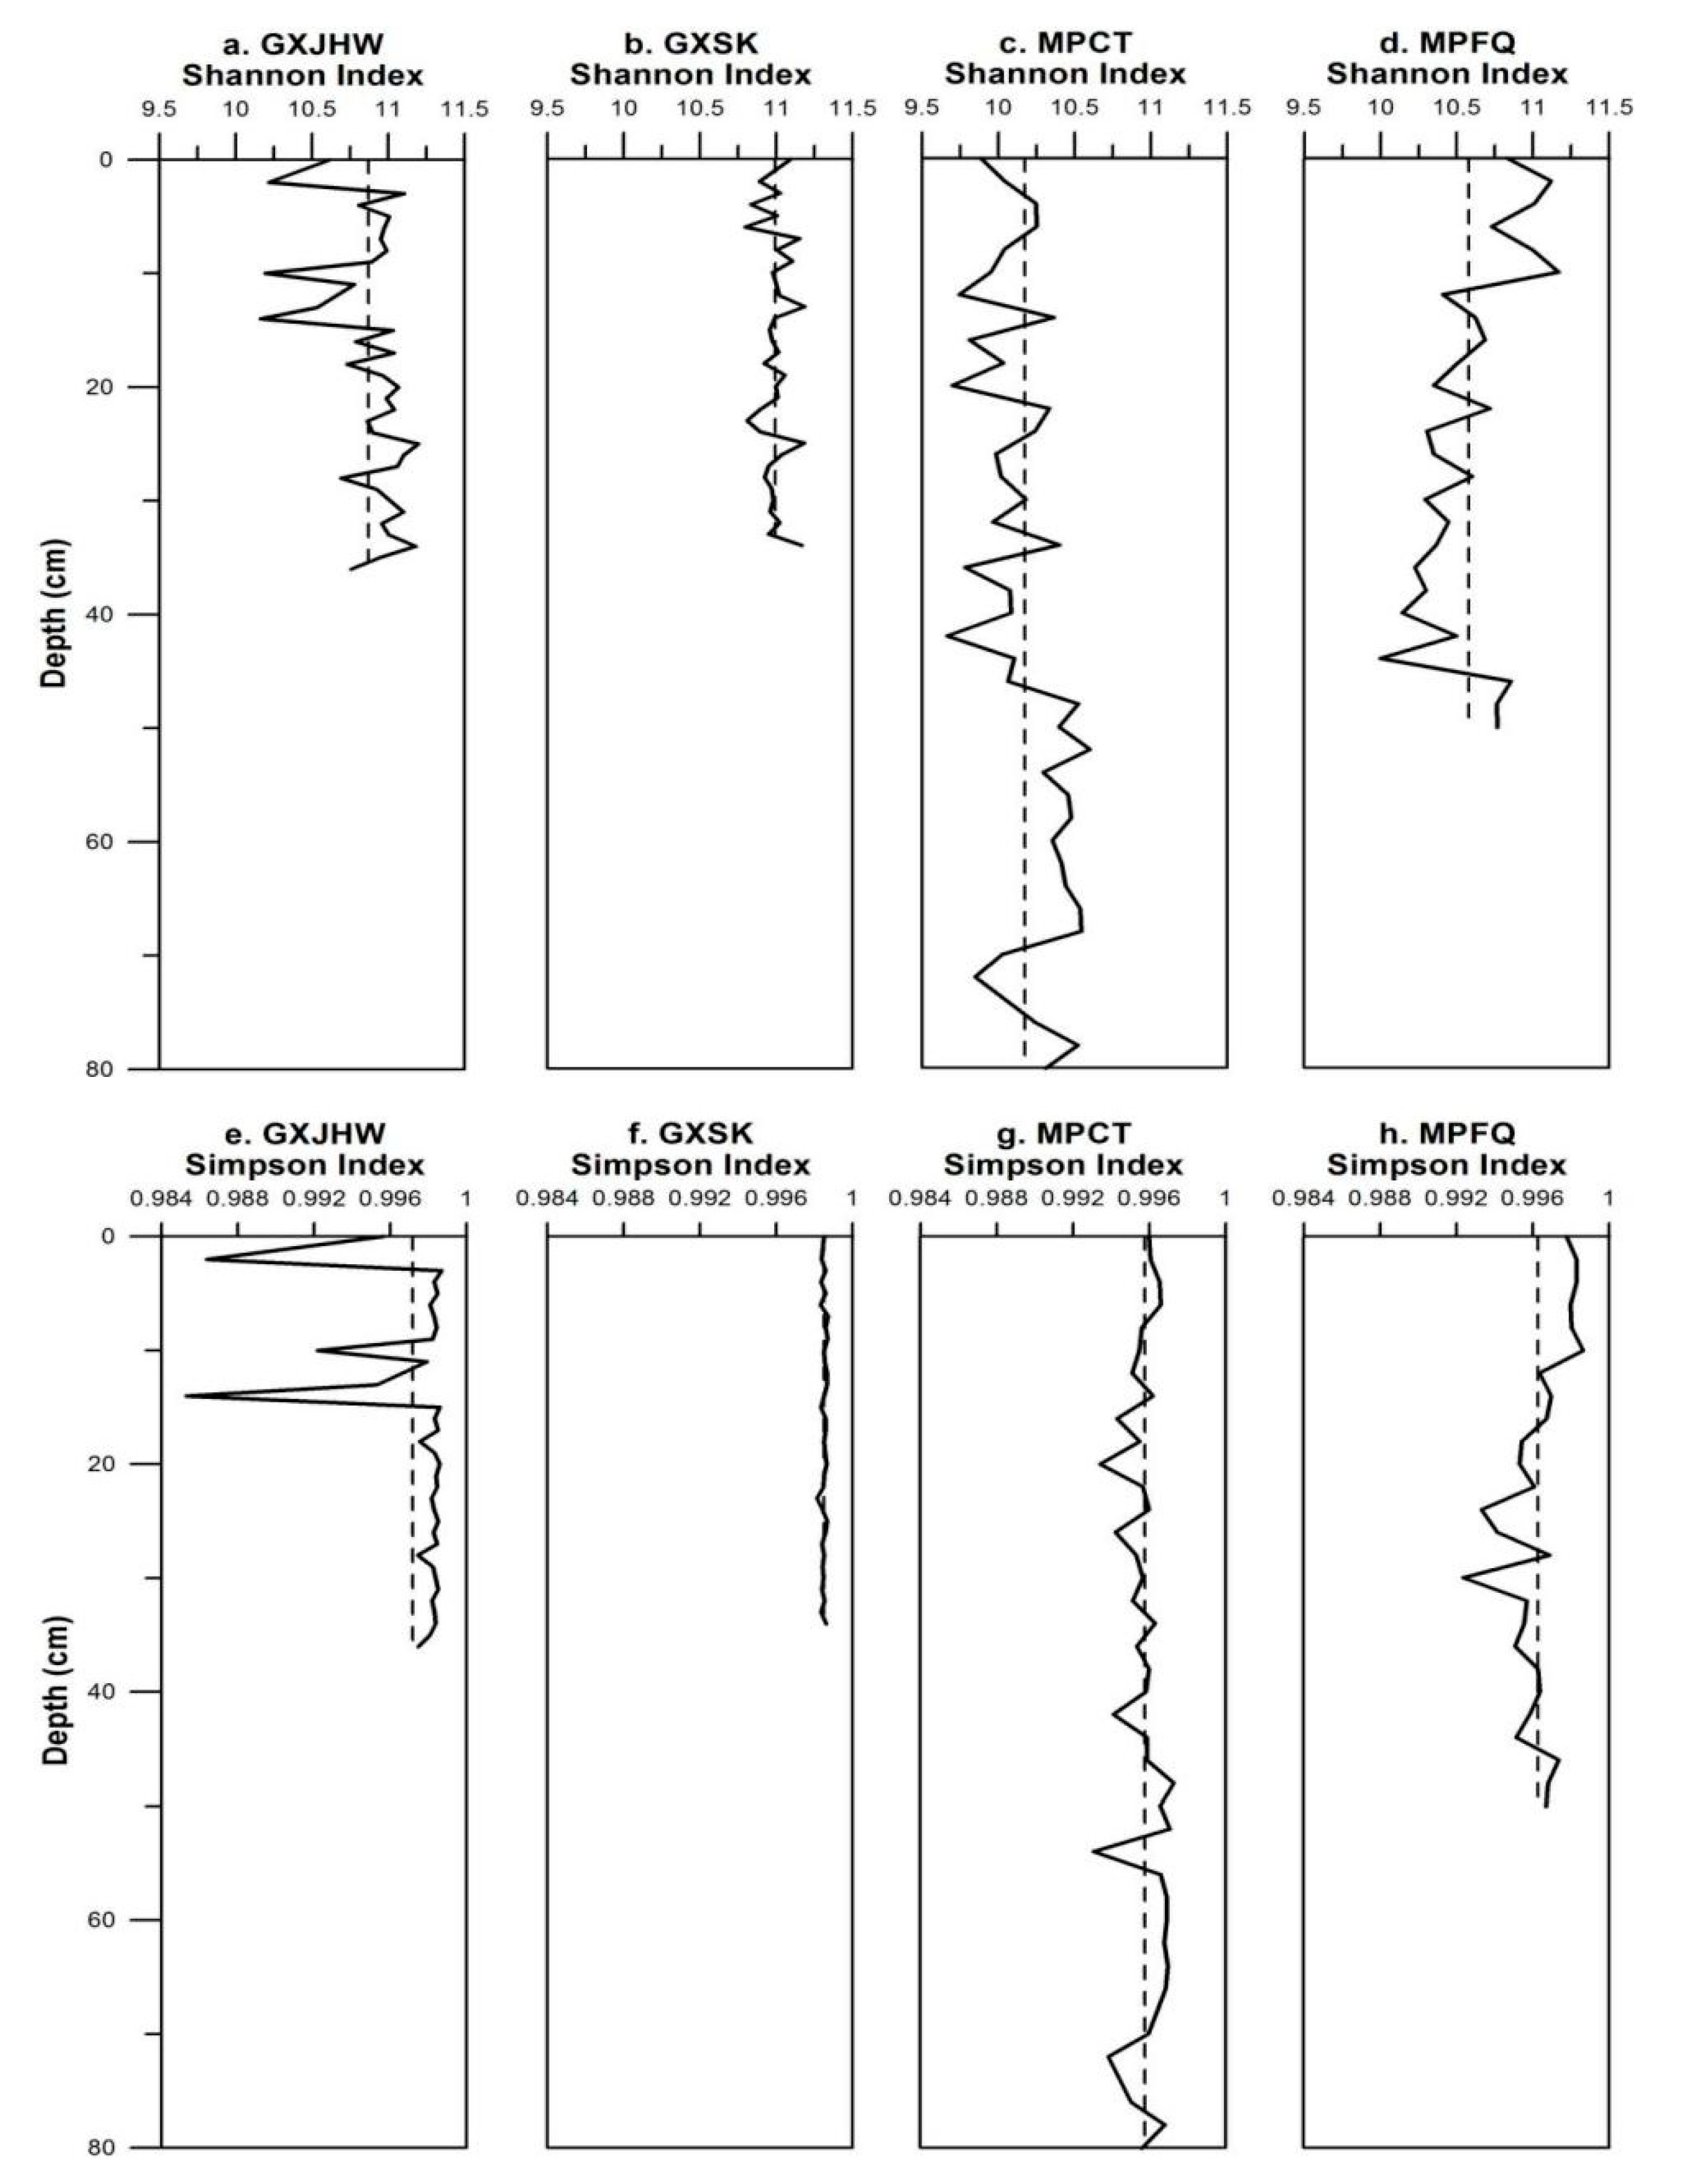
3.2.2. Vertical Variations in Alpha Diversity

Sample biodiversity was measured using two diversity indices, the Shannon index and the Simpson index (Figure 4). The order of average vertical alpha diversity given by the two indices was GXSK > GXJHW > MPFQ > MPCT. The vertical species diversity distribution at the four sites varied depending on the index. Thus, while the vertical biodiversity in GXSK and MPCT samples did not vary a great deal with depth using either index, the community diversity of GXJHW cores became greater as depth increased according to the Shannon index but decreased when the Simpson index was used. For MPFQ, the vertical biodiversity decreased with depth using both indices. In GXSK core samples, both Shannon and Simpson indices returned relatively high values, while the Shannon index for MPCT and the Simpson index for GXJHW were relatively low.
It is recognized that the Shannon index is greatly affected by community richness, while the Simpson index can reflect the most common species in the community [81]. Our results showed that, as sample depth increased, the diversity of the bacterial community was in a dynamic state of change without discernible rules. Peng et al. [82] also found that the species composition and abundance of dominant microorganisms at different depths in the intertidal sediments of Bohai Bay varied with no apparent regularity. Furthermore, there seemed to be no correlation between the trends in heavy metal representation and bacterial alpha diversity. In other words, increased heavy metal content had no apparent effect on the bacterial diversity of the sediments, perhaps due to variable metal bioavailability and the adaptability of microorganisms to polluted environments [77]. Gomes et al. [14] also emphasized that human activity did not necessarily affect the predominant community of bacteria in sediments.

3.3. The Influence of Environmental Factors on Bacterial Community Structures in Sediment Cores

Previous sections indicate that bacterial diversity is affected by a variety of environmental factors. Since we investigated more than 20 environmental factors in this study, we used factor analysis to extract the significant variables that best explain the overall variations in the environmental factors and hence determine which factors have the greatest effect on bacterial community structure (Table A2). Factors with absolute values greater than 0.5 were considered to have significant impacts on the structure of bacterial communities. Five factors, i.e., NiOxid, Cu_RSP, Zn_RSP, Zn_RAC, and TC, were found to significantly influence bacterial community structure at all four sites. A number of factors only influenced a single sampling site: Silt and CuReduc at MPCT; pH, CuResid, PbAcid, and Pb_RAC at GXSK; CrOxid at GXJHW; Cr_RSP, TNi, NiResid, CuAcid, and Cu_RAC at MPFQ.
The environmental factors selected after the factor analysis were used in a Spearmen correlation analysis with Shannon and Simpson index values to evaluate their influence on alpha diversity (Table 2). For the two sites from Guangxi province, the correlations between environmental factors and bacterial structure were both very weak using either index. For example, only two factors (CrReduc and ZnReduc) were significantly negatively correlated (Shannon index) with bacterial community structure at GXJHW. No significant correlation was observed for GXSK. In contrast, strong correlations were obtained for both Hong Kong sites. For MPCT, almost all environmental factors, including TC and several metal fractions, were negatively correlated with bacterial abundance, while for MPFQ, some environmental factors were negatively correlated with bacterial abundance while others were positively correlated. We also found that when total heavy metal content was significantly correlated with bacterial diversity index, the speciation of the same heavy metal was also significantly correlated with bacterial diversity index, and the r-value of the latter was mostly higher than that of the former. This accords with the findings of Suhadolc et al. [83], who observed that while total Cu and Zn were correlated with the bacterial diversity index, some forms of Cu and Zn were also correlated with the bacterial diversity index. Hiroki [84] obtained the same result by studying the relationship between heavy metals and the quantitative characteristics of community microorganisms. At the same time, their study also found that when total heavy metal content and bacterial diversity index are not significantly correlated, some heavy metal species do correlate with the bacterial diversity index, which further indicates that, to evaluate the heavy metal pollution status of a given site, heavy metal speciation is better than total heavy metal content for comparison with bacterial community diversity.
The average content of Cr, Ni, Cu, Zn, and Pb in the core sediments of MPCT and MPFQ was much higher than that of GXJHW and GXSK (Table 1). Correspondingly, both GXJH and GXSK had high Shannon index values and thus a greater diversity of bacterial species; in contrast, the Shannon indices of MPCT and MPFQ were low, indicating a smaller number of species (Figure 4); this is consistent with an effect of heavy metal pollution on the diversity of the respective bacterial communities [85]. At MPCT, which has the highest heavy metal content, almost all environmental factors were negatively correlated with both the Shannon index and the Simpson index, indicating inhibition of bacterial diversity. At GXJHW, which had a lower heavy metal content, bioavailable heavy metal species such as NiAcid and ZnAcid were positively correlated with bacterial diversity (Table 2). Since the level of bioavailable metal species is much smaller than the total amount of heavy metals, this is consistent with a low content of heavy metals stimulating the growth of microorganisms, and a high content of heavy metals inhibiting growth [86]. Moreover, there was a significant correlation between bacterial diversity and the proportion of some heavy metals in the acid-extractable, oxidizable, and reduced fractions, but no correlation with the residue fraction. Therefore, when the deposition environment changes, the bioavailable fraction of heavy metals can be transformed and utilized, while heavy metals in the residue fraction can only be released into the environment with difficulty [50]. Although it was reported in Section 3.2.2 above that there was no significant correlation between the vertical variation in alpha diversity at each sampling site and heavy metal content, further analysis showed that heavy metals and their various chemical forms had a significant impact on bacterial community structure. A possible explanation for this apparent contradiction is that heavy metals might affect the abundance of specific phyla or classes of bacteria to different extents, causing changes in the relative proportions of the various taxa. For example, Oliveira and Pampulha [87] found that an increase in heavy metal concentration can lead to a decrease in the number of microorganisms such as peanut rhizobia, Bacillus subtilis, and Bacillus megaterium, or even the disappearance of some species from the community, ultimately leading to a reduction in bacterial diversity. On the other hand, Basak et al. [16] found that heavy metals can increase the richness of certain bacterial communities, such as phylum BRC1 and Epsilonproteobacteria. The vertical variation in alpha diversity emphasizes the effect of spatial variation on bacterial diversity, rather than the effect on specific bacterial species, which further demonstrates that bacterial diversity is influenced by multiple environmental factors.
We next used the Mantel test to ask whether a selected environmental factor has a significant effect on the structure of bacteria (Table A3). We found that the physicochemical properties of sediments have varying degrees of influence on bacterial communities. Thus, the pH value had a significant impact on the bacterial community at GXSK, while the Eh value and salinity had a significant impact on the bacterial community at both GXSK and MPFQ. Grain size also affected the bacterial structure at Mai Po, as did clay and silt at MPCT, and clay at MPFQ. TC was the only factor that influenced bacterial community structure at all four sampling sites, which is consistent with previous research [88]. It is possible that a large volume of plant litter and animal residues are decomposed by microorganisms in mangrove sediments, releasing a variety of nutrients through coagulation adsorption of heavy metal ions [89].
The chemical forms of the five metals had various effects on the sampling sites. For GXJHW, several fractions of the five metals influenced the bacterial community, including the oxidizable fraction of chromium, nickel, and copper, the acid-extractable and easily reducible fractions of zinc, and the easily reducible fraction of lead. For GXSK, the speciation of zinc and lead influenced the bacterial structure more than the speciation of other metals did. For MPCT, the speciation of Ni, Cu, and Zn influenced the bacterial structure more than the speciation of Cr and Pb did, while for MPFQ, the speciation of Cr and Zn was more important than that of other metals. Cu had an extremely significant impact on the bacterial community structure at all sites except GXJHW. This may be due to Cu readily forming CuS and a stable organic Cu compound with organic matter in the sediment [90,91].
In general, we can conclude that when heavy metals have a significant impact on the bacterial community structure, certain chemical species of these heavy metals also impact bacterial community structure. Furthermore, even when heavy metals (i.e., total metal content) have no apparent effect on the bacterial community structure, certain chemical forms of the heavy metals can still significantly impact bacterial community structure. We suggest, therefore, that heavy metal chemical speciation should be used to evaluate the effect of heavy metal pollution on bacterial community structure, rather than the total amount of heavy metals present in the environment [92].
Variance partitioning canonical correspondence analysis (VPA) was used to show that the physicochemical properties of the sediments together with metal speciation could explain most of the changes in bacterial diversity (Table 3). Indeed, at MPFQ, physicochemical properties and metal speciation could explain 100% of the bacterial diversity observed. Physicochemical properties alone could explain 43.7%, 50.9%, 27.3%, and 43.7% of the bacterial diversity at GXJHW, GXSK, MPCT, and MPFQ, respectively, while metal speciation alone could explain 61.5%, 79.9%, 71.8%, and 91% of the bacterial diversity at GXJHW, GXSK, MPCT, and MPFQ, respectively. Thus, metal speciation was a more important factor than physicochemical properties in explaining bacterial diversity at all four sites.
In summary, metal speciation is the key factor affecting bacterial diversity at all sites, especially MPFQ. At MPCT and MPFQ, which have high heavy metal levels, the influence of heavy metal speciation on bacterial diversity was much stronger than that of the physicochemical properties of the sediments. Wasilkowski et al. [85] found that the soil bacterial community structure in some lead-zinc-silver tailing areas changed in line with increasing heavy metal content, and the influence of heavy metal speciation on bacterial community structure was much greater than that of soil physicochemical properties. Bisessar [86] found that the number of microorganisms in soil polluted by industrial wastewater over a long period was much lower than that in normal soil, and the PCA results showed that this phenomenon was caused by the high content of heavy metals in the soil. At GXJHW and GXSK, which contained lower levels of heavy metals than the Hong Kong mangroves did, both the physicochemical properties of sediments and metal speciation affected bacterial diversity. Taking the results of factor analysis and VPA analysis into account, we conclude that bacterial diversity is affected by the combined action of physicochemical properties and heavy metal speciation at those sites with low heavy metal content. At the same time, 25% of the changes in the MPCT sediments, which had the highest heavy metal load of the four sites, could not be explained, suggesting that bacterial diversity may be affected by variables other than environmental factors.
Despite the environmental factors and metal concentrations mentioned in the manuscript, there are many other factors influencing sedimentary bacterial community structure changes. For example, bio-irrigation and sediment reworking by microbe-fauna interactions were suggested to be important to sedimentary microbial community [93]. Feces or pseudofeces from fauna can result in local hotspots of biodiversity and microbial activity in sediment [94,95]. Rice and Rhoads [96] showed that sediment reworking by macrofauna will increase the organic matter flux into the sediment, therefore introducing particle mixing and pore-water flows vertically and resulting in changes in microbial community structures vertically. Viruses caused loss of sedimentary microbes, and viral abundances and production presented positive correlation with bacterial abundances [97]. Moreover, redox condition regulates the speciation of heavy metals directly by biodegradation or indirectly by biotransformation, illustrating the complexity of heavy metal cycles in mangroves [98,99]. The key message of this manuscript is the impact of heavy metals and their speciation on the microbial community structure in sediments, and we are fully aware that there is indeed a lack of comprehensive discussion on the impact of redox condition and fauna activities, which certainly deserve further investigations in future studies on the bacterial community in mangrove sediments. Despite this, the results reported here can contribute to expand our knowledge about the patterns of bacterial diversity in mangrove sediments and provide new cues for future investigations in these ecosystems.

4. Conclusions

In this study, we explored relationships between sedimentary bacterial communities and environmental factors in core samples of four mangroves in South China. The phylum-level diversity of major bacterial communities varied greatly among different sampling sites and also vertically in each individual core. Single environmental factors that significantly influenced bacterial diversity included TC and various chemical forms of heavy metals. The correlations between environmental factors and bacterial structure were weak for the two sites in Guangxi province, but were strong for the two sites in Hong Kong. At MPCT, almost all environmental factors were negatively correlated with bacterial diversity, while at MPFQ some were negatively, and some positively correlated. VPA analysis revealed that physicochemical properties and metal speciation could explain most of the changes in bacterial diversity, and metal speciation could explain bacterial diversity better than physiochemical properties could at all four sites. This suggests that the chemical forms of heavy metals play a more important role in influencing bacterial diversity in mangrove sediments than total metal content does.

Author Contributions

Conceptualization, B.H., J.L. and S.C.; methodology, J.L., Q.Z., S.D., M.H., Y.Q., Z.Z. and C.S.; software, C.S.; validation, B.H., J.L. and S.C.; formal analysis, B.H., J.L. and S.C.; investigation, B.H., J.L., S.C. and Q.Z.; resources, C.S. and S.C.; data curation, S.C.; writing—original draft preparation, B.H. and J.L.; writing—review and editing, S.C.; visualization, S.C.; supervision, S.C.; project administration, S.C.; funding acquisition, S.C. All authors have read and agreed to the published version of the manuscript.

Funding

This research was funded by the Guangdong Basic and Applied Basic Research Foundation (2019A1515012047), the National Natural Science Foundation of China (Grant 41406095 and 41706137), the Natural Science Foundation of SZU Grant 201427, and the Shenzhen Scientific Project (JCYJ20190808114216058).

Institutional Review Board Statement

Not applicable.

Informed Consent Statement

Not applicable.

Data Availability Statement

All data are included in the manuscript.

Acknowledgments

We would like to thank the stuff of Guangdong Neilingding Futian National Natural Reserve for their support in sampling. We are also grateful for the support from the public service platform of instruments and equipment of College of Life Sciences and Oceanography in Shenzhen University.

Conflicts of Interest

The authors declare no conflict of interest.

Appendix A

Figure A1. Site map. (Upper panel) mudflat in MaiPo mangrove, Hong Kong (MPCT), and forest sediment in MaiPo mangrove, Hong Kong (MPFQ); (Lower panel) Golden Bay Mangrove Reserve in Beihai, Guangxi province (GXJHW), Shankou Mangrove Reserve in Hepu, Guangxi province (GXSK).
Water 14 00971 g0a1
Figure A2. Schematic diagram of the sequential extraction procedure as used in this study.
Water 14 00971 g0a2
Figure A3. The vertical profiles of Cr, Ni, Cu, Zn, Pb total content of cores in GXJHW (ae), GXSK (fj), MPCT (ko), and MPFQ (pt). The dashed lines represented average values of individual cores.
Water 14 00971 g0a3
Table A1. The meaning of each abbreviation.
AbbreviationMeaning
TCrTotal amount of Cr
CrAcidAcid extractable fraction of Cr
CrReducReducible fraction of Cr
CrOxidOxidizable fraction of Cr
CrResidResidue fraction of Cr
Cr_RSPRSP of Cr
Cr_RACRAC of Cr
TNiTotal amount of Ni
NiAcidAcid extractable fraction of Ni
NiReducReducible fraction of Ni
NiOxidOxidizable fraction of Ni
NiResidResidue fraction of Ni
Ni_RSPRSP of Ni
Ni_RACRAC of Ni
TCuTotal amount of Cu
CuAcidAcid extractable fraction of Cu
CuReducReducible fraction of Cu
CuOxidOxidizable fraction of Cu
CuResidResidue fraction of Cu
Cu_RSPRSP of Cu
Cu_RACRAC of Cu
TZnTotal amount of Zn
ZnAcidAcid extractable fraction of Zn
ZnReducReducible fraction of Zn
ZnOxidOxidizable fraction of Zn
ZnResidResidue fraction of Zn
Zn_RSPRSP of Zn
Zn_RACRAC of Zn
TPbTotal amount of Pb
PbAcidAcid extractable fraction of Pb
PbReducReducible fraction of Pb
PbOxidOxidizable fraction of Pb
PbResidResidue fraction of Pb
Pb_RSPRSP of Pb
Pb_RACRAC of Pb
Table A2. Factor analysis of the effect of environmental factors on bacterial community.
GXJHWGXSKMPCTMPFQ
Clay0.09−0.17−0.84−0.79
Silt0.07−0.060.680.22
pH−0.470.950.240.47
Eh0.46−0.84−0.16−0.91
Salinity0.060.68−0.110.88
TCr−0.220.690.140.91
CrAcid−0.04−0.930.360.90
CrReduc0.460.840.380.53
CrOxid0.920.260.00−0.01
CrResid0.420.100.10−0.50
Cr_RSP0.350.350.190.66
Cr_RAC0.15−0.910.150.87
TNi−0.170.590.480.83
NiAcid0.61−0.380.77−0.12
NiReduc0.240.950.720.60
NiOxid0.950.760.870.63
NiResid0.410.23−0.28−0.70
Ni_RSP0.420.340.710.77
Ni_RAC0.58−0.630.34−0.51
TCu0.220.910.700.89
CuAcid0.400.020.650.81
CuReduc0.880.540.56−0.19
CuOxid0.970.440.890.76
CuResid0.390.89−0.34−0.24
Cu_RSP0.71−0.770.680.57
Cu_RAC0.43−0.430.570.71
TZn0.410.950.940.58
ZnAcid0.800.420.890.87
ZnReduc0.940.960.830.08
ZnOxid0.320.830.880.68
ZnResid−0.340.67−0.41−0.93
Zn_RSP0.820.790.830.96
Zn_RAC0.76−0.870.700.89
TPb−0.010.740.34−0.73
PbAcid0.54−0.92−0.430.53
PbReduc0.960.80−0.140.26
PbOxid−0.330.78−0.56−0.38
PbResid−0.140.130.360.05
Pb_RSP0.070.23−0.15−0.32
Pb_RAC0.43−0.94−0.450.58
OC0.500.860.890.58
Nitrogen0.070.19−0.18−0.47
Table A3. Mantel test of the influence of single environmental factors on bacterial community.
LocationVariablerp
GXJHWCrOxid0.30070.002**
NiOxid0.13520.036*
CuOxid0.15710.008**
ZnAcid0.19560.002**
ZnReduc0.15470.025*
PbReduc0.17370.003**
OC0.26860.001**
GXSKpH0.40950.001**
Eh0.26460.002**
Salinity0.19420.008**
CrAcid0.34280.001**
CrReduc0.3460.002**
Cr_RAC0.28040.001**
NiReduc0.34360.001**
NiOxid0.39350.001**
Ni_RAC0.13860.033*
TCu0.34460.001**
CuResid0.36290.001**
Cu_RSP0.3050.001**
TZn0.50630.001**
ZnReduc0.57040.001**
ZnOxid0.51440.001**
ZnResid0.18830.002**
Zn_RSP0.4610.001**
Zn_RAC0.20470.011*
TPb0.31450.001**
PbAcid0.44320.001**
PbReduc0.34590.001**
PbOxid0.34650.001**
OC0.41440.001**
MPCTClay0.4010.001**
Silt0.30960.001**
NiAcid0.41250.001**
NiReduc0.27780.002**
NiOxid0.40140.001**
Ni_RSP0.2230.008**
TCu0.35460.002**
CuReduc0.17130.022*
CuOxid0.37080.001**
Cu_RSP0.23310.004**
TZn0.44780.001**
ZnAcid0.41210.001**
ZnReduc0.27240.002**
ZnOxid0.3290.001**
Zn_RSP0.39610.001**
Zn_RAC0.33370.002**
PbOxid0.15040.01**
OC0.48640.001**
MPFQClay0.44820.001**
Eh0.31350.001**
Salinity0.37160.001**
TCr0.38190.001**
CrAcid0.27510.003**
Cr_RSP0.29240.008**
Cr_RAC0.20080.014*
NiReduc0.3140.012*
TCu0.33080.001**
CuOxid0.44240.002**
ZnAcid0.21660.018*
ZnOxid0.23340.039*
ZnResid0.19620.008**
Zn_RSP0.34190.001**
OC0.53210.001**
** represent p < 0.01, extremely significant correlation; * represent p < 0.05, significant correlation.

References

  1. Duke, N.C.; Meynecke, J.O.; Dittmann, S.; Ellison, A.M.; Anger, K.; Berger, U.; Cannicci, S.; Diele, K.; Ewel, K.C.; Field, C.D.; et al. A World Without Mangroves? Science 2007, 317, 41–43. [Google Scholar] [CrossRef] [PubMed] [Green Version]
  2. Lee, S.Y.; Primavera, J.H.; Dahdouh-Guebas, F.; McKee, K.; Bosire, J.O.; Cannicci, S.; Diele, K.; Fromard, F.; Koedam, N.; Marchand, C.; et al. Ecological role and services of tropical mangrove ecosystems: A reassessment. Glob. Ecol. Biogeogr. 2014, 23, 726–743. [Google Scholar] [CrossRef]
  3. Mille, G.; Guiliano, M.; Asia, L.; Malleret, L.; Jalaluddin, N. Sources of hydrocarbons in sediments of the Bay of Fort de France (Martinique). Chemosphere 2006, 64, 1062–1073. [Google Scholar] [CrossRef] [PubMed]
  4. Alongi, D.M.; Christoffersen, P.; Tirendi, F. The influence of forest type on microbial-nutrient relationships in tropical mangrove sediments. J. Exp. Mar. Biol. Ecol. 1993, 171, 201–223. [Google Scholar] [CrossRef]
  5. Kathiresan, K.; Selvam, M.M. Evaluation of beneficial bacteria from mangrove soil. Bot. Mar. 2006, 49, 86–88. [Google Scholar] [CrossRef]
  6. Piccini, C.; Garcíaalonso, J. Bacterial diversity patterns of the intertidal biofilm in urban beaches of Rio de la Plata. Mar. Pollut. Bull. 2015, 91, 476–482. [Google Scholar] [CrossRef]
  7. Holguin, G.; Vazquez, P.; Bashan, Y. The role of sediment microorganisms in the productivity, conservation, and rehabilitation of mangrove ecosystems: An overview. Biol. Fert. Soils 2001, 33, 265–278. [Google Scholar] [CrossRef]
  8. Hou, L.J.; Liu, M.; Xu, S.Y.; Ou, D.N.; Yu, J.; Cheng, S.B.; Liu, X.; Yang, Y. The effects of semi-lunar spring and neap tidal change on nitrification, denitrification, and N2O vertical distribution in the intertidal sediments of the Yangtze Estuary, China. Estuar. Coast. Shelf Sci. 2007, 73, 607–616. [Google Scholar] [CrossRef]
  9. Abraham, T.J.; Ghosh, S.; Nagesh, T.S.; Sasmal, D. Distribution of bacteria involved in nitrogen and sulphur cycles in shrimp culture systems of west bengal, india. Aquaculture 2004, 239, 275–288. [Google Scholar] [CrossRef]
  10. Angela, M.G.; Mendonça-Hagler, L.C.S.; Andrew, M. Microbial diversity in Brazilian mangrove sediments: A mini review. Braz. J. Microbiol. 2012, 43, 1242–1254. [Google Scholar]
  11. Alongi, D.M. Carbon cycling and storage in mangrove forests. Annu. Rev. Mar. Sci. 2014, 6, 195–219. [Google Scholar] [CrossRef] [PubMed]
  12. Campbell, B.J.; Krichman, D.L. Bacterial diversity, community structure and potential growth rates along an estuarine salinity gradient. ISME J. 2013, 7, 210–220. [Google Scholar] [CrossRef] [PubMed] [Green Version]
  13. Ford, T.; Sorci, J.; Ika, R. Interactions between metals and microbial communities in New Bedford Harbor, Massachusetts. Environ. Health Perspect. Suppl. 1998, 106, 1033–1039. [Google Scholar]
  14. Gomes, N.C.M.; Borges, L.R.; Paranhos, R.; Pinto, N.F.; Leda, C.S.; Smalla, K. Exploring the diversity of bacterial communities in sediments of urban mangrove forests. FEMS Microbiol. Ecol. 2008, 66, 96–109. [Google Scholar] [CrossRef] [PubMed]
  15. LaMontagne, M.G.; Leifer, I.; Bergmann, S.; Van, D.W.L.C.; Holden, P.A. Bacterial diversity in marine hydrocarbon seep sediments. Environ. Microbiol. 2004, 6, 799–808. [Google Scholar] [CrossRef]
  16. Basak, P.; Pramanik, A.; Sengupta, S.; Nag, S.; Bhattacharyya, M. Bacterial diversity assessment of pristine mangrove microbial community from Dhulibhashani, Sundarbans using 16S rRNA gene tag sequencing. Genom. Data 2016, 7, 76–78. [Google Scholar] [CrossRef] [Green Version]
  17. Dudani, S.N.; Lakhmapurkar, J.; Gavali, D.; Patel, T. Heavy metal accumulation in the mangrove ecosystem of south gujarat coast, India. Turk. J. Fish. Aquat. Sci. 2017, 17, 755–766. [Google Scholar]
  18. Bernard, D.; Pascaline, H.; Jeremie, J.J. Distribution and origin of hydrocarbons in sediments from lagoons with fringing mangrove communities. J. Mar. Pollut. Bull. 1996, 32, 734–739. [Google Scholar] [CrossRef]
  19. Kleskowski, E.J.; Corredor, J.E.; Morell, J.M.; Del Castillo, C.A. Petroleum pollution and mutation in mangroves. J. Mar. Pollut. Bull. 1994, 28, 166–169. [Google Scholar] [CrossRef]
  20. Olaniran, A.O.; Balgobind, A.; Pillay, B. Bioavailability of heavy metals in soil: Impact on microbial biodegradation of organic compounds and possible improvement strategies. Int. J. Mol. Sci. 2013, 14, 10197–10228. [Google Scholar] [CrossRef] [Green Version]
  21. Aoyama, M.; Nagumo, T. Effects of heavy metal accumulation in apple orchard soils on microbial biomass and microbial activities. Soil Sci. Plant Nutr. 1997, 43, 601–612. [Google Scholar] [CrossRef] [Green Version]
  22. Brookes, P.C.; McGrath, S.P. Effects of metal toxicity on the size of the soil microbial biomass. Soil Sci. 1984, 35, 341–346. [Google Scholar] [CrossRef]
  23. Ni, D.; Horton, D.J.; Rui, J.; Henson, M.W.; Jiang, W.; Huang, X.; Learman, D.R. High concentrations of bioavailable heavy metals impact freshwater sediment microbial communities. Ann. Microbiol. 2016, 66, 1003–1012. [Google Scholar] [CrossRef]
  24. Thavamani, P.; Malik, S.; Beer, M.; Megharaj, M.; Naidu, R. Microbial activity and diversity in long-term mixed contaminated soils with respect to polyaromatic hydrocarbons and heavy metals. J. Environ. Manag. 2012, 99, 10–17. [Google Scholar] [CrossRef]
  25. Dell’Anno, A.; Mei, M.L.; Ianni, C.; Danovaro, R. Impact of bioavailable heavy metals on bacterial activities in coastal marine sediments. World J. Microbiol. Biotechnol. 2003, 19, 93–100. [Google Scholar] [CrossRef]
  26. Chen, S.; Liao, J.; Zhang, Q.; Ding, S.; He, M.; Huang, D. Spatial Variability and Influencing Factors of Cr, Ni, Cu, Zn and Pb in Five Mangroves Reserves of South China. IOP Conf. Ser. Earth Environ. Sci. 2021, 690, 012017. [Google Scholar] [CrossRef]
  27. Feng, J.X.; Zhu, X.S.; Wu, H.; Ning, C.X.; Lin, G.H. Distribution and ecological risk assessment of heavy metals in surface sediments of a typical restored mangrove–aquaculture wetland in Shenzhen, China. Mar. Pollut. Bull. 2017, 124, 1033–1039. [Google Scholar] [CrossRef]
  28. Tessier, A.; Campbell, P.; Bisson, M. Sequential extraction procedure for the speciation of pareticulate trace-metrals. Anal. Chem. 1979, 51, 844–851. [Google Scholar] [CrossRef]
  29. Hall, G.; Vaive, J.E.; Beer, R.; Hoashi, M. Selective leaches revisited, with emphasis on the amorphous Fe oxyhydroxide phase extraction. J. Geochem. Explor. 1996, 56, 59–78. [Google Scholar] [CrossRef]
  30. Hall, G.E.M.; Pelchat, P. Comparibility of results obtained by the use of different selective extraction schemer for the determination of element forms in soils. Water Air Soil Pollut. 1999, 112, 41–53. [Google Scholar] [CrossRef]
  31. Rauret, G.; Lopez-Sanchez, J.; Sahuquillo, A.; Rubio, R.; Davidson, C.; Ure, A. Improvement of the BCR three step sequential extraction procedure prior to the certification of new sediment and soil reference materials. J. Environ. Monit. 1999, 1, 57–61. [Google Scholar] [CrossRef] [PubMed]
  32. IAEA. Measurement of Radionuclides in Food and Environment; Technical Reports Series, no. 295; IAEA: Vienna, Austria, 1989. [Google Scholar]
  33. Hakanson, L. An ecological risk index for aquatic pollution-control—A sedimentological approach. Water Res. 1980, 14, 975–1001. [Google Scholar] [CrossRef]
  34. Zhang, H.; Walker, T.; Davis, E.; Ma, G. Ecological risk assessment of metals in small craft harbour sediments in Nova Scotia, Canada. Mar. Pollut. Bull. 2019, 146, 466–475. [Google Scholar] [CrossRef] [PubMed]
  35. Micó, C.; Recatalá, L.; Peris, M.; Sánchez, J. Assessing heavy metal sources in agricultural soils of an European Mediterranean area by multivariate analysis. Chemosphere 2006, 65, 863–872. [Google Scholar] [CrossRef]
  36. Akcay, H.; Oguz, A.; Karapire, C. Study of heavy metal pollution and speciation in Buyak Menderes and Gediz river sediments. Water Res. 2003, 37, 813–822. [Google Scholar] [CrossRef]
  37. Gusiatin, Z.M.; Kulikowska, D. The usability of the IR, RAC and MRI indices of heavy metal distribution to assess the environmental quality of sewage sludge composts. Waste Manag. 2014, 34, 1227–1236. [Google Scholar] [CrossRef]
  38. Wang, L.; Wang, Y.P.; Xu, C.X.; An, Z.Y.; Wang, S.M. Analysis and evaluation of the source of heavy metals in water of the River Changjiang. Environ. Monit. Assess. 2011, 173, 301–313. [Google Scholar] [CrossRef]
  39. Harikumar, P.S.; Nasir, R.P. Ecotoxicological impact assessment of heavy metals in core sediments of a tropical estuary. Ecotoxicol. Environ. Saf. 2010, 73, 1742–1747. [Google Scholar] [CrossRef]
  40. Islam, M.S.; Ahmed, M.K.; Raknuzzaman, M.; Habibullah-Al-Mamun, M.; Islam, M.K. Heavy metal pollution in surface water and sediment: A preliminary assessment of an urban river in a developing country. Ecol. Indic. 2015, 48, 282–291. [Google Scholar] [CrossRef]
  41. Maslennikova, S.; Larina, N.; Larin, S. The effect of sediment grain size on heavy metal content. Solid State Phenom. 2012, 6, 43–54. [Google Scholar]
  42. Murray, K.S.; Cauvet, D.; Lybeer, M.; Thomas, J.C. Particle size and chemical control of heavy metals in bed sediment from the Rouge River, Southeast Michigan. Environ. Sci. Technol. 1999, 33, 987–992. [Google Scholar] [CrossRef]
  43. Soto-Jimenez, M.F.; Paez-Osuna, F. Distribution and normalization of heavy metal concentrations in mangrove and lagoonal sediments from Mazatlan Harbor (SE Gulf of California). Estuar. Coast. Shelf Sci. 2001, 53, 259–274. [Google Scholar] [CrossRef]
  44. Horowitz, A.J.; Elrick, K.A. The relation of stream sediment surface area, grain size and composition to trace element chemistry. Appl. Geochem. 1987, 2, 437–451. [Google Scholar] [CrossRef]
  45. Ray, A.; Tripathy, S.; Patra, S.; Sanna, V. Assessment of Godavari estuarine mangrove ecosystem through trace metal studies. Environ. Int. 2006, 32, 219–223. [Google Scholar] [CrossRef] [PubMed]
  46. Defew, L.H.; Mair, J.M.; Guzman, H.M. An assessment of metal contamination in mangrove sediments and leaves from Punta Mala Bay, Pacific Panama. Mar. Pollut. Bull. 2005, 50, 547–552. [Google Scholar] [CrossRef] [PubMed]
  47. Zulkifli, S.Z.; Mohamat-Yusuff, F.; Arai, T.; Ismail, A.; Miyazaki, N. An assessment of selected trace elements in intertidal surface sediments collected from the Peninsular Malaysia. Environ. Monit. Assess. 2010, 169, 457–472. [Google Scholar] [CrossRef]
  48. Cheng, W.H.; Yap, C.K. Potential human health risks from toxic metals via mangrove snail consumption and their ecological risk assessments in the habitat sediment from Peninsular Malaysia. Chemosphere 2015, 135, 156–165. [Google Scholar] [CrossRef]
  49. Amin, B.; Ismail, A.; Arshad, A.; Yap, C.K.; Kamarudin, M.S. Anthropogenic impacts on heavy metal concentrations in the coastal sediments of Dumai, Indonesia. Environ. Monit. Assess. 2009, 148, 291–305. [Google Scholar] [CrossRef]
  50. Jayachandran, S.; Chakraborty, P.; Ramteke, D.; Chennuri, K.; Chakraborty, S. Effect of pH on transport and transformation of Cu-sediment complexes in mangrove systems. Mar. Pollut. Bull. 2018, 133, 920–929. [Google Scholar] [CrossRef]
  51. Ramos, L.; González, M.J.; Hernández, L.M. Sequential extraction of copper, lead, cadmium, and zinc in sediments from Ebro River (Spain): Relationship with levels detected in earthworms. Bull. Environ. Contam. Toxicol. 1999, 62, 301–308. [Google Scholar] [CrossRef]
  52. Tam, N.F.Y.; Yao, M.W.Y. Normalisation and heavy metal contamination in mangrove sediments. Sci. Total Environ. 1998, 216, 33–39. [Google Scholar] [CrossRef]
  53. Li, X.; Poon, C.; Liu, P.S. Heavy metal contamination of urban soils and street dusts in Hong Kong. Appl. Geochem. 2001, 16, 1361–1368. [Google Scholar] [CrossRef]
  54. Caregnato, F.F.; Koller, C.E.; MacFarlane, G.R.; Moreira, J. The glutathione antioxidant system as a biomarker suite for the assessment of heavy metal exposure and effect in the grey mangrove, Avicennia marina (Forsk.) Vierh. Mar. Pollut. Bull. 2008, 56, 1119–1127. [Google Scholar] [CrossRef] [PubMed]
  55. MacFarlane, G.R.; Burchett, M.D. Photosynthetic pigments and peroxidase activity as indicators of heavy metal stress in the grey mangrove, Avicennia marina (Forsk.) Vierh. Mar. Pollut. Bull. 2001, 42, 233–240. [Google Scholar] [CrossRef]
  56. Power, A.E.; Peters, C.E.; Firman, C.J.; Gassman, J.N.; Richmond, H.R. Ecotoxicology of tropical marine ecosystems. Environ. Toxicol. Chem. 1997, 16, 12–40. [Google Scholar]
  57. Gu, Y.G.; Wang, Z.H.; Lu, S.H.; Jiang, S.J.; Mu, D.H.; Shu, Y.H. Multivariate statistical and GIS-based approach to identify source of anthropogenic impacts on metallic elements in sediments from the mid Guangdong coasts, China. Environ. Pollut. 2012, 163, 248–255. [Google Scholar] [CrossRef]
  58. Zhou, F.; Guo, H.; Hao, Z. Spatial distribution of heavy metals in Hong Kong’s marine sediments and their human impacts: A GIS-based chemometric approach. Mar. Pollut. Bull. 2007, 54, 1372–1384. [Google Scholar] [CrossRef]
  59. Tam, N.F.; Wong, Y.S. Spatial variation of heavy metals in surface sediments of Hong Kong mangrove swamps. Environ. Pollut. 2000, 110, 195–205. [Google Scholar] [CrossRef]
  60. Liu, J.; Ma, K.; Qu, L. Ecological risk assessments and context-dependence analysis of heavy metal contamination in the sediments of mangrove swamp in Leizhou Peninsula, China. Mar. Pollut. Bull. 2015, 100, 224–230. [Google Scholar] [CrossRef]
  61. Vane, C.H.; Harrison, I.; Kim, A.W.; Moss-Hayes, V.; Vickers, B.P.; Hong, K. Organic and metal contamination in surface mangrove sediments of South China. Mar. Pollut. Bull. 2009, 58, 134–144. [Google Scholar] [CrossRef] [Green Version]
  62. Chen, S.; Zhou, G.W.; Ding, S.L.; Zhang, Q.J.; Huang, D.D.; Shang, C.J. A thirty-year record of PTE pollution in mangrove sediments: Implications for human activities in two major chinese metropolises, Shenzhen and Hong Kong. Sustain. Cities Soc. 2021, 68, 102766. [Google Scholar] [CrossRef]
  63. Almeida, C.M.R.; Mucha, A.P.; Vasconcelos, M.T.S.D. The role of a salt marsh plant on trace metal bioavailability in sediments estimation by different chemical approaches. Environ. Sci. Pollut. Res. 2005, 12, 271–277. [Google Scholar] [CrossRef] [PubMed]
  64. Jones, B.; Turki, A. Distribution and speciation of heavy metals in surficial sediments from the Estuary, north-east England. Mar. Pollut. Bull. 1997, 34, 768–779. [Google Scholar] [CrossRef]
  65. Tessier, A.; Campbell, P.; Auclair, J.C.; Bisson, M. Relationship between the partitioning of the trace metals in sediments and their accumulations in the tissue of the freshwater mollusk elliptio complanata in a mining area. Can. J. Fish. Quat. Sci. 1984, 41, 1463–1472. [Google Scholar]
  66. Whitall, D.; Mason, A.; Pait, A.; Brune, L.; Fulton, M.; Wirth, E.; Vandiver, L. Organic and metal contamination in marine surface sediments of Guánica Bay, Puerto Rico. Mar. Pollut. Bull. 2014, 80, 293–301. [Google Scholar] [CrossRef]
  67. Astruc, T.M. Fractionation studies of trace elements in contaminated soils and sediments: A review of sequential extraction procedures. TrAC Trends Anal. Chem. 2002, 21, 451–467. [Google Scholar]
  68. Li, X.; Wang, Y.; Li, B.H.; Feng, C.H.; Chen, Y.X.; Shen, Z.Y. Distribution and speciation of heavy metals in surface sediments from the yangtze estuary and coastal areas. Environ. Earth Sci. 2012, 69, 1537–1547. [Google Scholar] [CrossRef]
  69. Chaoui, A.; Mazhoudi, S.; Ghorbal, M.H.; Ferjani, E.E. Cadmium and zinc induction of lipid peroxidation and effects on antioxidant enzyme activities in bean (Phaseolus vulgaris L.). Plant Sci. 1997, 127, 139–147. [Google Scholar] [CrossRef]
  70. Chen, Y.Q.; Wang, W.P. Research on key service factors’ identification of producer service value network of China’s high-end manufacturing based on grey relational analysis. Adv. Mater. Res. 2014, 933, 807–812. [Google Scholar] [CrossRef]
  71. Li, Y.; Wen, H.; Chen, L.; Yin, T. Succession of bacterial community structure and diversity in soil along a chronosequence of reclamation and re-vegetation on coal mine spoils in China. PLoS ONE 2014, 9, e115024. [Google Scholar] [CrossRef]
  72. Zhou, Y.W.; Zhao, B.; Peng, Y.S.; Chen, G.Z. Influence of mangrove reforestation on heavy metal accumulation and speciation in intertidal sediments. Mar. Pollut. Bull. 2010, 60, 1319–1324. [Google Scholar] [CrossRef] [PubMed]
  73. Noronha-D’Mello, C.A.; Nayak, G.N. Geochemical characterization of mangrove sediments of the Zuari estuarine system, West coast of India. Estuar. Coast. Shelf Sci. 2015, 167, 313–325. [Google Scholar] [CrossRef]
  74. Zhang, L.; Xin, Y.; Feng, H.; Jing, Y.; Tong, O.; Yu, X.; Liang, R.; Gao, C.; Chen, W. Heavy metal contamination in western Xiamen Bay sediments and its vicinity, China. Mar. Pollut. Bull. 2007, 54, 974–982. [Google Scholar] [CrossRef] [PubMed]
  75. Guo, Y.W.; Yang, S.Y. Heavy metal enrichments in the Changjiang (Yangtze River) catchment and on the inner shelf of the East China Sea over the last 150 years. Sci. Total Environ. 2016, 543, 105–115. [Google Scholar] [CrossRef] [PubMed]
  76. Prosi, F. Factors controlling biological availability and toxic effects of lead in aquatic organisms. Sci. Total Environ. 1989, 79, 157–169. [Google Scholar] [CrossRef]
  77. Shao, Z.Y.; Wang, Y.; Zhang, J.; Yang, C.; Zhou, G.; Yang, R.Y. The bacterial community structure associated with a copper-tolerant plant, Artemisia capillaries Thunb., and its influencing factors. Acta Ecol. Sin. 2017, 37, 7679–7688. [Google Scholar]
  78. Schneider, A.R.; Gommeaux, M.; Duclercq, J.; Fanin, N.; Conreux, A.; Alahmad, A.; Lacoux, J.; Roger, D.; Spicher, F.; Ponthieu, M.; et al. Response of bacterial communities to Pb smelter pollution in contrasting soils. Sci. Total Environ. 2017, 605, 436–444. [Google Scholar] [CrossRef]
  79. Xia, N.; Xia, X.; Zhu, B.; Zheng, S.; Zhuang, J. Bacterial diversity and community structure in the sediment of the middle and lower reaches of the Yellow River, the largest turbid river in the world. Aquat. Microb. Ecol. 2013, 71, 43–55. [Google Scholar] [CrossRef]
  80. Ghosh, A.; Dey, N.; Bera, A.; Tiwari, A.; Sathyaniranjan, K.B.; Chakrabarti, K.; Chattopadhyay, D. Culture independent molecular analysis of bacterial communities in the mangrove sediment of Sundarban, India. Saline Syst. 2010, 6, 1. [Google Scholar] [CrossRef] [Green Version]
  81. Magurran, A.E. Ecological Diversity and Its Measurement; Princeton University Press: Princeton, NJ, USA, 1988; Volume 46, pp. 7–45. [Google Scholar]
  82. Peng, Z.; Song, J.; Yuan, H. Persistent organic pollutant residues in the sediments and mollusks from the bohai sea coastal areas, north china: An overview. Environ. Int. 2009, 35, 632–646. [Google Scholar]
  83. Suhadolc, M.; Schroll, R.; Gattinger, A.; Schloter, M.; Munch, J.C.; Lestan, D. Effects of modified pb-, zn-, and cd- availability on the microbial communities and on the degradation of isoproturon in a heavy metal contaminated soil. Soil Biol. Biochem. 2004, 36, 1943–1954. [Google Scholar] [CrossRef]
  84. Hiroki, M. Effects of heavy metal contamination on soil microbial population. Soil Sci. Plant Nutr. 1992, 38, 141–147. [Google Scholar] [CrossRef] [Green Version]
  85. Wasilkowski, D.; Mrozik, A.; Piotrowska-Seget, Z.; Krzyżak, J.; Pogrzeba, M.; Płaza, G. Changes in enzyme activities and microbial community structure in heavy metal-contaminated soil underin situaided phytostabilization. CLEAN Soil Air Water 2014, 42, 1618–1625. [Google Scholar] [CrossRef]
  86. Bisessar, S. Effect of heavy metals on microorganisms in soils near a secondary lead smelter. Water Air Soil Pollut. 1982, 17, 305–308. [Google Scholar] [CrossRef]
  87. Oliveira, A.; Pampulha, M.E. Effects of long-term heavy metal contamination on soil microbial characteristics. Biosci. Bioeng. 2006, 102, 157–161. [Google Scholar] [CrossRef] [PubMed] [Green Version]
  88. Li, Z.; Ma, Z.; Van der Kuijp, T.J.; Yuan, Z.; Huang, L. A review of soil heavy metal pollution from mines in China: Pollution and health risk assessment. Sci. Total Environ. 2014, 468, 843–853. [Google Scholar] [CrossRef]
  89. Clark, M.W.; Mcconchie, D.M.; Lewis, D.W.; Saenger, P. Redox stratification and heavy metal partitioning in Avicennia-dominated mangrove sediments: A geochemical model. Chem. Geol. 1998, 149, 147–171. [Google Scholar] [CrossRef]
  90. Fernandes, H.M. Heavy metal distribution in sediments and ecological risk assessment: The role of diagenetic processes in reducing metal toxicity in bottom sediments. Environ. Pollut. 1997, 97, 317–325. [Google Scholar] [CrossRef]
  91. Zhou, H.Y.; Cheung, R.Y.H.; Chan, K.M.; Wong, M.H. Metal concentrations in sediments and Tilapia collected from inland water of Hong Kong. Water Res. 1998, 32, 3331–3340. [Google Scholar] [CrossRef]
  92. Yang, Z.; Wang, Y.; Shen, Z.; Niu, J.; Tang, Z. Distribution and speciation of heavy metals in sediments from the mainstream, tributaries, and lakes of the yangtze river catchment of wuhan, china. J. Hazard. Mater. 2009, 166, 1186–1194. [Google Scholar] [CrossRef] [PubMed]
  93. Middelburg, J.J. Reviews and syntheses: To the bottom of carbon processing at the seafloor. Biogeosciences 2018, 15, 413–427. [Google Scholar] [CrossRef] [Green Version]
  94. Gutierrez, J.L.; Jones, C.G.; Strayer, D.L.; Iribarne, O.O. Mollusks as ecosystem engineers: The role of shell production in aquatic habitats. Oikos 2003, 101, 79–90. [Google Scholar] [CrossRef]
  95. Cathalot, C.; Van Oevelen, D.; Cox, T.J.S.; Kutti, T.; Lavaleye, M.; Duineveld, G. Cold-water coral reefs and adjacent sponge grounds: Hotspots of benthic respiration and organic carbon cycling in the deep sea. Front. Mar. Sci. 2015, 2, 12. [Google Scholar] [CrossRef] [Green Version]
  96. Rice, D.; Rhoads, D. Early Diagenesis of Organic Matter and the Nutritional Value of Sediment. In Ecology of Marine Deposit Feeders; Springer: New York, NY, USA, 1989; Volume 31. [Google Scholar]
  97. Rastelli, E.; Corinaldesi, C.; Dell’Anno, A.; Tangherlini, M.; Lo Martire, M.; Nishizawa, M. Drivers of Bacterial alpha- and beta-Diversity Patterns and Functioning in Subsurface Hadal Sediments. Front. Microbiol. 2019, 10, 13. [Google Scholar] [CrossRef] [PubMed]
  98. Marchand, C.; Allenbach, M.; Lallier-Verges, E. Relationships between heavy metals distribution and organic matter cycling in mangrove sediments (Conception Bay, New Caledonia). Geoderma 2011, 160, 444–456. [Google Scholar] [CrossRef] [Green Version]
  99. Bayen, S. Occurrence, bioavailability and toxic effects of trace metals and organic contaminants in mangrove ecosystems: A review. Environ. Int. 2012, 48, 84–101. [Google Scholar] [CrossRef]
Figure 1. The vertical profiles of grain size composition, salinity, pH, and TC of cores in GXJHW (ad), GXSK (eh), MPCT (il), and MPFQ (mp). The dashed lines represented average values of individual cores.
Water 14 00971 g001
Figure 2. The vertical profiles of the relative abundances of different fractions of Cr, Ni, Cu, Zn, and Pb of cores in GXJHW (ae), GXSK (fj), MPCT (ko), and MPFQ (pt). Dark gray represents the acid-extractable fraction, gray represents the reducible fraction, light gray represents the oxidization fraction, and lightest gray represents the residue fraction.
Water 14 00971 g002
Figure 3. Vertical profiles of top 10 Phylum in different cores: (a) GXJHW; (b) GXSK; (c) MPCT; (d) MPFQ.
Water 14 00971 g003
Figure 4. The vertical profiles of Shannon index (ad) and Simpson index (eh) of cores in the four sampling sites. The dashed lines represented average values of individual cores.
Water 14 00971 g004
Table 1. The content of five metals and their ecological risk assessment information in the four sampling sites and other mangroves around the South China Sea.
Sites CrNiCuZnPbRI
GXJHWcontent (μg/g)35.02 ± 6.0513.49 ± 2.4212.86 ± 2.6440.87 ± 11.2111.98 ± 2.317.12 ± 1.41
E r i 1.17 ± 0.200.90 ± 0.162.14 ± 0.440.51 ± 0.142.40 ± 0.46
GXSKcontent (μg/g)49.99 ± 8.2224.97 ± 4.4415.40 ± 3.1953.09 ± 16.4716.51 ± 3.499.86 ± 2.01
E r i 1.67 ± 0.271.66 ± 0.302.57 ± 0.530.66 ± 0.213.30 ± 0.70
MPCTcontent (μg/g)85.68 ± 24.4636.17 ± 7.0294.73 ± 27.97497.99 ± 211.9259.90 ± 4.7339.26 ± 9.54
E r i 2.86 ± 0.822.41 ± 0.4715.79 ± 4.666.22 ± 2.6511.98 ± 0.95
MPFQcontent (μg/g)72.39 ± 8.0836.40 ± 2.79110.80 ± 7.09459.87 ± 37.4261.04 ± 3.7841.26 ± 2.86
E r i 2.41 ± 0.272.43 ± 0.1918.47 ± 1.185.75 ± 0.4712.21 ± 0.76
Singapore [45]content (μg/g)16.61–32.077.44–11.657.06–32.0051.24–120.2312.28–30.98
Punta Mala Bay, Panama [46]content (μg/g)23.327.356.310578.2
Peninsular Malaysia [47,48]content (μg/g)0.71–6.532.41–36.291.63–150.8123.70–607.207.97–93.11
Dumai coast Indonesia [49]content (μg/g)-7.26–19.971.61–13.8431.49–87.1114.63–84.90
Table 2. Correlations between environmental factors and Shannon and Simpson indices.
SiteVariableShannonSimpson
rprp
GXJHWCrReduc−0.4150.006 *−0.1900.134
CrOxid−0.2070.112−0.0330.425
NiAcid0.3030.036 *−0.1590.178
NiOxid0.3110.033 *−0.1000.280
Ni_RAC−0.2770.051−0.1450.199
CuOxid0.3160.03 *−0.1010.278
Cu_RSP−0.1240.235−0.1360.214
ZnAcid0.3050.035 *−0.0780.326
ZnReduc−0.3660.014 *−0.1120.257
PbReduc−0.2290.090−0.0020.496
OC−0.2390.080−0.0530.379
GXSKpH0.0930.3000.0180.148
Eh−0.1710.166−0.3170.034 *
Salinity−0.2040.124−0.1030.281
TCr0.1070.2730.1170.254
CrAcid−0.1980.130−0.3230.031
CrReduc0.2500.0770.2340.091
Cr_RAC−0.1750.161−0.2500.077
NiReduc0.2230.1020.2440.082
NiOxid0.0320.4280.1930.137
Ni_RAC−0.1520.195−0.1080.271
TCu0.0710.3450.1190.252
CuResid0.1980.1310.2510.076
Cu_RSP−0.1750.161−0.1850.147
TZn0.0780.3300.1370.220
ZnReduc0.1460.2050.2230.102
ZnOxid0.1290.2330.1950.135
ZnResid0.0770.3330.1490.199
Zn_RSP0.0480.3930.0950.296
Zn_RAC−0.1680.172−0.1790.156
TPb−0.0150.4650.0680.351
PbAcid−0.2250.101−0.2350.090
PbReduc0.0500.3900.1380.218
PbOxid−0.0020.4960.1650.176
Pb_RAC−0.1410.213−0.1590.184
OC0.0760.3350.1710.167
MPCTClay0.2480.0610.1270.217
Silt−0.1520.1750.0190.454
NiAcid−0.4790.001 **−0.4170.007 *
NiReduc−0.2730.088−0.2000.108
NiOxid−0.4320.005 *−0.2840.076
Ni_RSP−0.3230.021 *−0.1130.244
TCu−0.4740.002 *−0.3040.056
CuReduc−0.1860.125−0.2110.096
CuOxid−0.3720.009 *−0.3020.058
Cu_RSP−0.3320.018 *−0.1660.153
TZn−0.5100.001 **−0.3820.015 *
ZnAcid−0.5380.0001 **−0.3550.024 *
ZnReduc−0.4090.009 *−0.3310.037 *
ZnOxid−0.4170.007 *−0.2600.053
Zn_RSP−0.5230.001 **−0.3100.052
Zn_RAC−0.3110.052−0.1030.264
PbOxid0.0420.398−0.0180.456
OC−0.3970.011 *−0.2420.066
MPFQClay−0.6630.0001 **−0.5820.002 *
Eh−0.6060.001 **−0.5900.002 *
Salinity0.5270.006 *0.4660.016 *
TCr0.5660.003 *0.4790.013 *
CrAcid0.5490.004 *0.4100.038 *
CrReduc0.4430.023 *0.4200.033 *
Cr_RSP0.4390.025 *0.5250.006 *
Cr_RAC0.5020.009 *0.3290.101
TNi0.3310.0990.2460.226
NiReduc0.3640.0670.3400.089
NiOxid0.2550.2090.3260.104
NiResid−0.5230.006 *−0.5500.004 *
Ni_RSP0.3300.1000.4120.037 *
TCu0.3570.0730.4220.032 *
CuAcid0.1950.3400.1320.521
CuOxid0.6940.0001 **0.7040.0001 **
Cu_RSP0.2250.2680.1740.395
Cu_RAC0.1360.5090.0320.875
TZn0.3500.0800.4150.035 *
ZnAcid0.4060.04 *0.3680.065
ZnOxid0.2330.2530.2300.259
ZnResid−0.5100.008 *−0.4420.024 *
Zn_RSP0.4500.021 *0.4260.03 *
Zn_RAC0.2470.2230.1630.426
TPb−0.3080.1250.1400.495
OC0.7020.0001 **0.7140.0001 **
** represent p < 0.01, extremely significant correlation; * represent p < 0.05, significant correlation.
Table 3. Result of Variance partitioning canonical correspondence analysis.
SiteEnv 1Env 2Explained %
Env 1Env 2Unexplained
GXJHWClay, Eh, Salinity, OCTCr CrAcid CrReduc Cr_RSP Cr_RAC TNi NiReduc NiOxid NiResid Ni_RSP TCu CuAcid CuOxid Cu_RSP Cu_RAC TZn ZnAcid ZnOxid ZnResid Zn_RSP Zn_RAC TPb43.761.519.4
GXSKpH, Eh, Salinity, OCTCr CrAcid CrReduc Cr_RAC NiReduc NiOxid Ni_RAC TCu CuResid Cu_RSP TZn ZnReduc ZnOxid ZnResid Zn_RSP Zn_RAC TPb PbAcid PbReduc PbOxid50.979.912.6
MPCTClay, Silt, OCNiAcid NiReduc NiOxid Ni_RSP TCu CuReduc CuOxid Cu_RSP TZn ZnAcid ZnReduc ZnOxid Zn_RSP Zn_RAC PbOxid27.371.825.0
MPFQClay, Eh, Salinity, OCTCr CrAcid CrReduc Cr_RSP Cr_RAC TNi NiReduc NiOxid NiResid Ni_RSP TCu CuAcid CuOxid Cu_RSP Cu_RAC TZn ZnAcid ZnOxid ZnResid Zn_RSP Zn_RAC TPb43.791.00.0
Publisher’s Note: MDPI stays neutral with regard to jurisdictional claims in published maps and institutional affiliations.

