Review

Greenhouse Gases Trade-Off from Ponds: An Overview of Emission Process and Their Driving Factors

1
Research Management & Outreach Division, National Institute of Hydrology, Roorkee 247667, India
2
School of Hydrology and Water Resources, Nanjing University of Information Science and Technology, Nanjing 210044, China
3
Department of Physics, University of Petroleum and Energy Studies, Dehradun 248007, India
4
Environmental Hydrology Division, National Institute of Hydrology, Roorkee 247667, India
5
Division of Soil and Crop Management, ICAR-Central Soil Salinity Research Institute, Karnal 132001, India
6
Central Muga Eri Research and Training Institute, Central Silk Board, Jorhat 785000, India
*
Author to whom correspondence should be addressed.
Water 2022, 14(6), 970; https://doi.org/10.3390/w14060970
Submission received: 18 February 2022 / Revised: 16 March 2022 / Accepted: 17 March 2022 / Published: 19 March 2022
(This article belongs to the Special Issue Greenhouse Gas Emission from Freshwater Ecosystem)

Abstract

:
Inland water bodies (particularly ponds) emit a significant amount of greenhouse gases (GHGs), particularly methane (CH4), carbon dioxide (CO2), and a comparatively low amount of nitrous oxide (N2O) to the atmosphere. In recent decades, ponds (<10,000 m2) probably account for about 1/3rd of the global lake perimeter and are considered a hotspot of GHG emissions. High nutrients and waterlogged conditions provide an ideal environment for CH4 production and emission. The rate of emissions differs according to climatic regions and is influenced by several biotic and abiotic factors, such as temperature, nutrients (C, N, & P), pH, dissolved oxygen, sediments, water depth, etc. Moreover, micro and macro planktons play a significant role in CO2 and CH4 emissions from ponds systems. Generally, in freshwater bodies, the produced N2O diffuses in the water and is converted into N2 gas through different biological processes. There are several other factors and mechanisms which significantly affect the CH4 and CO2 emission rate from ponds and need a comprehensive evaluation. This study aims to develop a decisive understanding of GHG emissions mechanisms, processes, and methods of measurement from ponds. Key factors affecting the emissions rate will also be discussed. This review will be highly useful for the environmentalists, policymakers, and water resources planners and managers to take suitable mitigation measures in advance so that the climatic impact could be reduced in the future.

1. Introduction

Inland freshwater ecosystems (e.g., ponds and lakes) cover only 3% of the Earth’s surface and provide numerous ecosystem services [1]. Generally, shallow ponds (depth < 3 m) and sizes less than 2 hectares [1] provide essential resources for both aquatic and terrestrial organisms [1]. Globally, artificially constructed impoundments, particularly ponds, are mainly used for irrigation, domestic, flood control, livestock, etc., [1,2]. Kumar and Padhy [3] quoted that there are 277 million ponds with a size of less than one hectare. The water quality of inland ponds is significantly affected by anthropogenic activity in the catchment resulting in a significant amount of nutrient (nitrogen, carbon, and phosphorus) inputs and a disturbing of the biogeochemical cycling. Nutrient concentration significantly affects the water chemistry and carbon dynamics (source and/or sink) in the ponds. The chemical and biological properties [4] of the pond also influence greenhouse gas (GHG) production and emission [4,5,6]. Methane (CH4) and carbon dioxide (CO2) are the most important GHG effluxes from the ponds, but the efflux of nitrous oxide (N2O) depends on the nitrogen loading. Gorsky [5] quoted that the small size pond (0.001 km2) covers 8.6% of the total lentic ecosystem but accounts for 40% of CH4 and 15% CO2 of the total emission. The sediments in the influent to the pond, vegetation, and other dead organisms mainly contribute to organic matter and are merely available to the bacteria for degradation, resulting in a significant amount of GHG from the water–air interface [5,7]. Organic matter (OM) decomposes and results in reduced oxygen content in water, which creates an anaerobic condition in the bottom of a pond. Under an anaerobic environment, methanogenic bacteria consume the OM and lead to CH4 production through the methanogenesis process [8,9]. The CH4 production in the anaerobic zone of the pond is oxidized by methanotrophic bacteria in the upper aerobic zone and converted into CO2 [10,11,12]. Mineralization of OM also emits CO2 from the pond. N2O is the third important GHG, which is generally emitted from ponds under nitrogen-rich conditions through the denitrification process [13] under an anaerobic environment. The water of both urban and rural ponds has a high load of nutrients, such as nitrogen and phosphorus. A high nutrient load enhances the rate of GHG production and emission to the atmosphere. The potential of GHG production and/or emission depends on numerous biotic and abiotic factors [12,13,14,15,16], and their understanding is urgently required to diminish its emission potential in the future, which directly impacts future climate change and global warming. In this study, we review the methods of measurement, the process of emissions, and factors governing GHG production and emissions from small inland water bodies, such as ponds. Key factors impacting GHG emissions are also discussed. Besides, the future direction has been suggested to mitigate the medium and long-term impact on global warming.

2. Methodology Adopted

The study assembles and presents information and data that represents proper accountability of GHG emissions, GHG trade-off from ponds, emissions processes, and their driving factors in the freshwater ecosystem, particularly ponds. The information is gathered from reliable sources (e.g., Scopus, Science Direct, Springer, Willy, MDPI, etc.) from different research papers published in reputed journals, followed by tabulation and analysis. Besides this, there are also other data sources, such as Open Citations, CrossRef, Microsoft Academic, ResearchGate, etc. Many of them are freely available, but their validity is still questionable; therefore, they are discarded from tabulation to avoid the wrong interpretation of data. In the review, we have collected 134 pieces of literature, and the relevant studies (Nos. 82 in total) are being used for tabulation, interpretation, and analysis.

3. Ponds in the Landscape

Ponds are small, heterotrophic water bodies (representing 30% of surface standing water on Earth) that make a significant contribution in global metabolic active aquatic sites, as well as global ecological systems with the high intensity of carbon processing. The small size of the ponds and their intense metabolic activities have high dynamics compared to the large standing surface water bodies due to the high inflow rate of nutrients, generation of the GHG, succession rate, and tradeoffs of the toxic substances, such as metals [3]. Ponds can serve as sustainable units to address the issue at global levels, such as water management, especially groundwater recharge, retention of the nutrients, aquatic floral and faunal biodiversity conservation, and sequestration of the carbon through phytoplanktons. However, due to changing environmental scenarios, as well as the pace of modern life, ponds are also vulnerable and need special attention to address climate change, flood relief, biodiversity conservation, and pollution alleviation. Ponds are comparatively economic, easily constructed, manageable, and available in the proximity of almost every rural settlement and can be protected easily with local participation. Ponds need significant support to achieve the United Nations Sustainable Development Goals (UN-SDGs), as sustainable water management of the pond can support the climate change impact abetment, recreations works, livelihood protection, irrigation support, livestock watering, flood management, restrict the agricultural and settlement related pollution, microclimate regulation at the local and regional scale, and recharge groundwater.

4. Mechanism of Greenhouse Gas Emission from Ponds

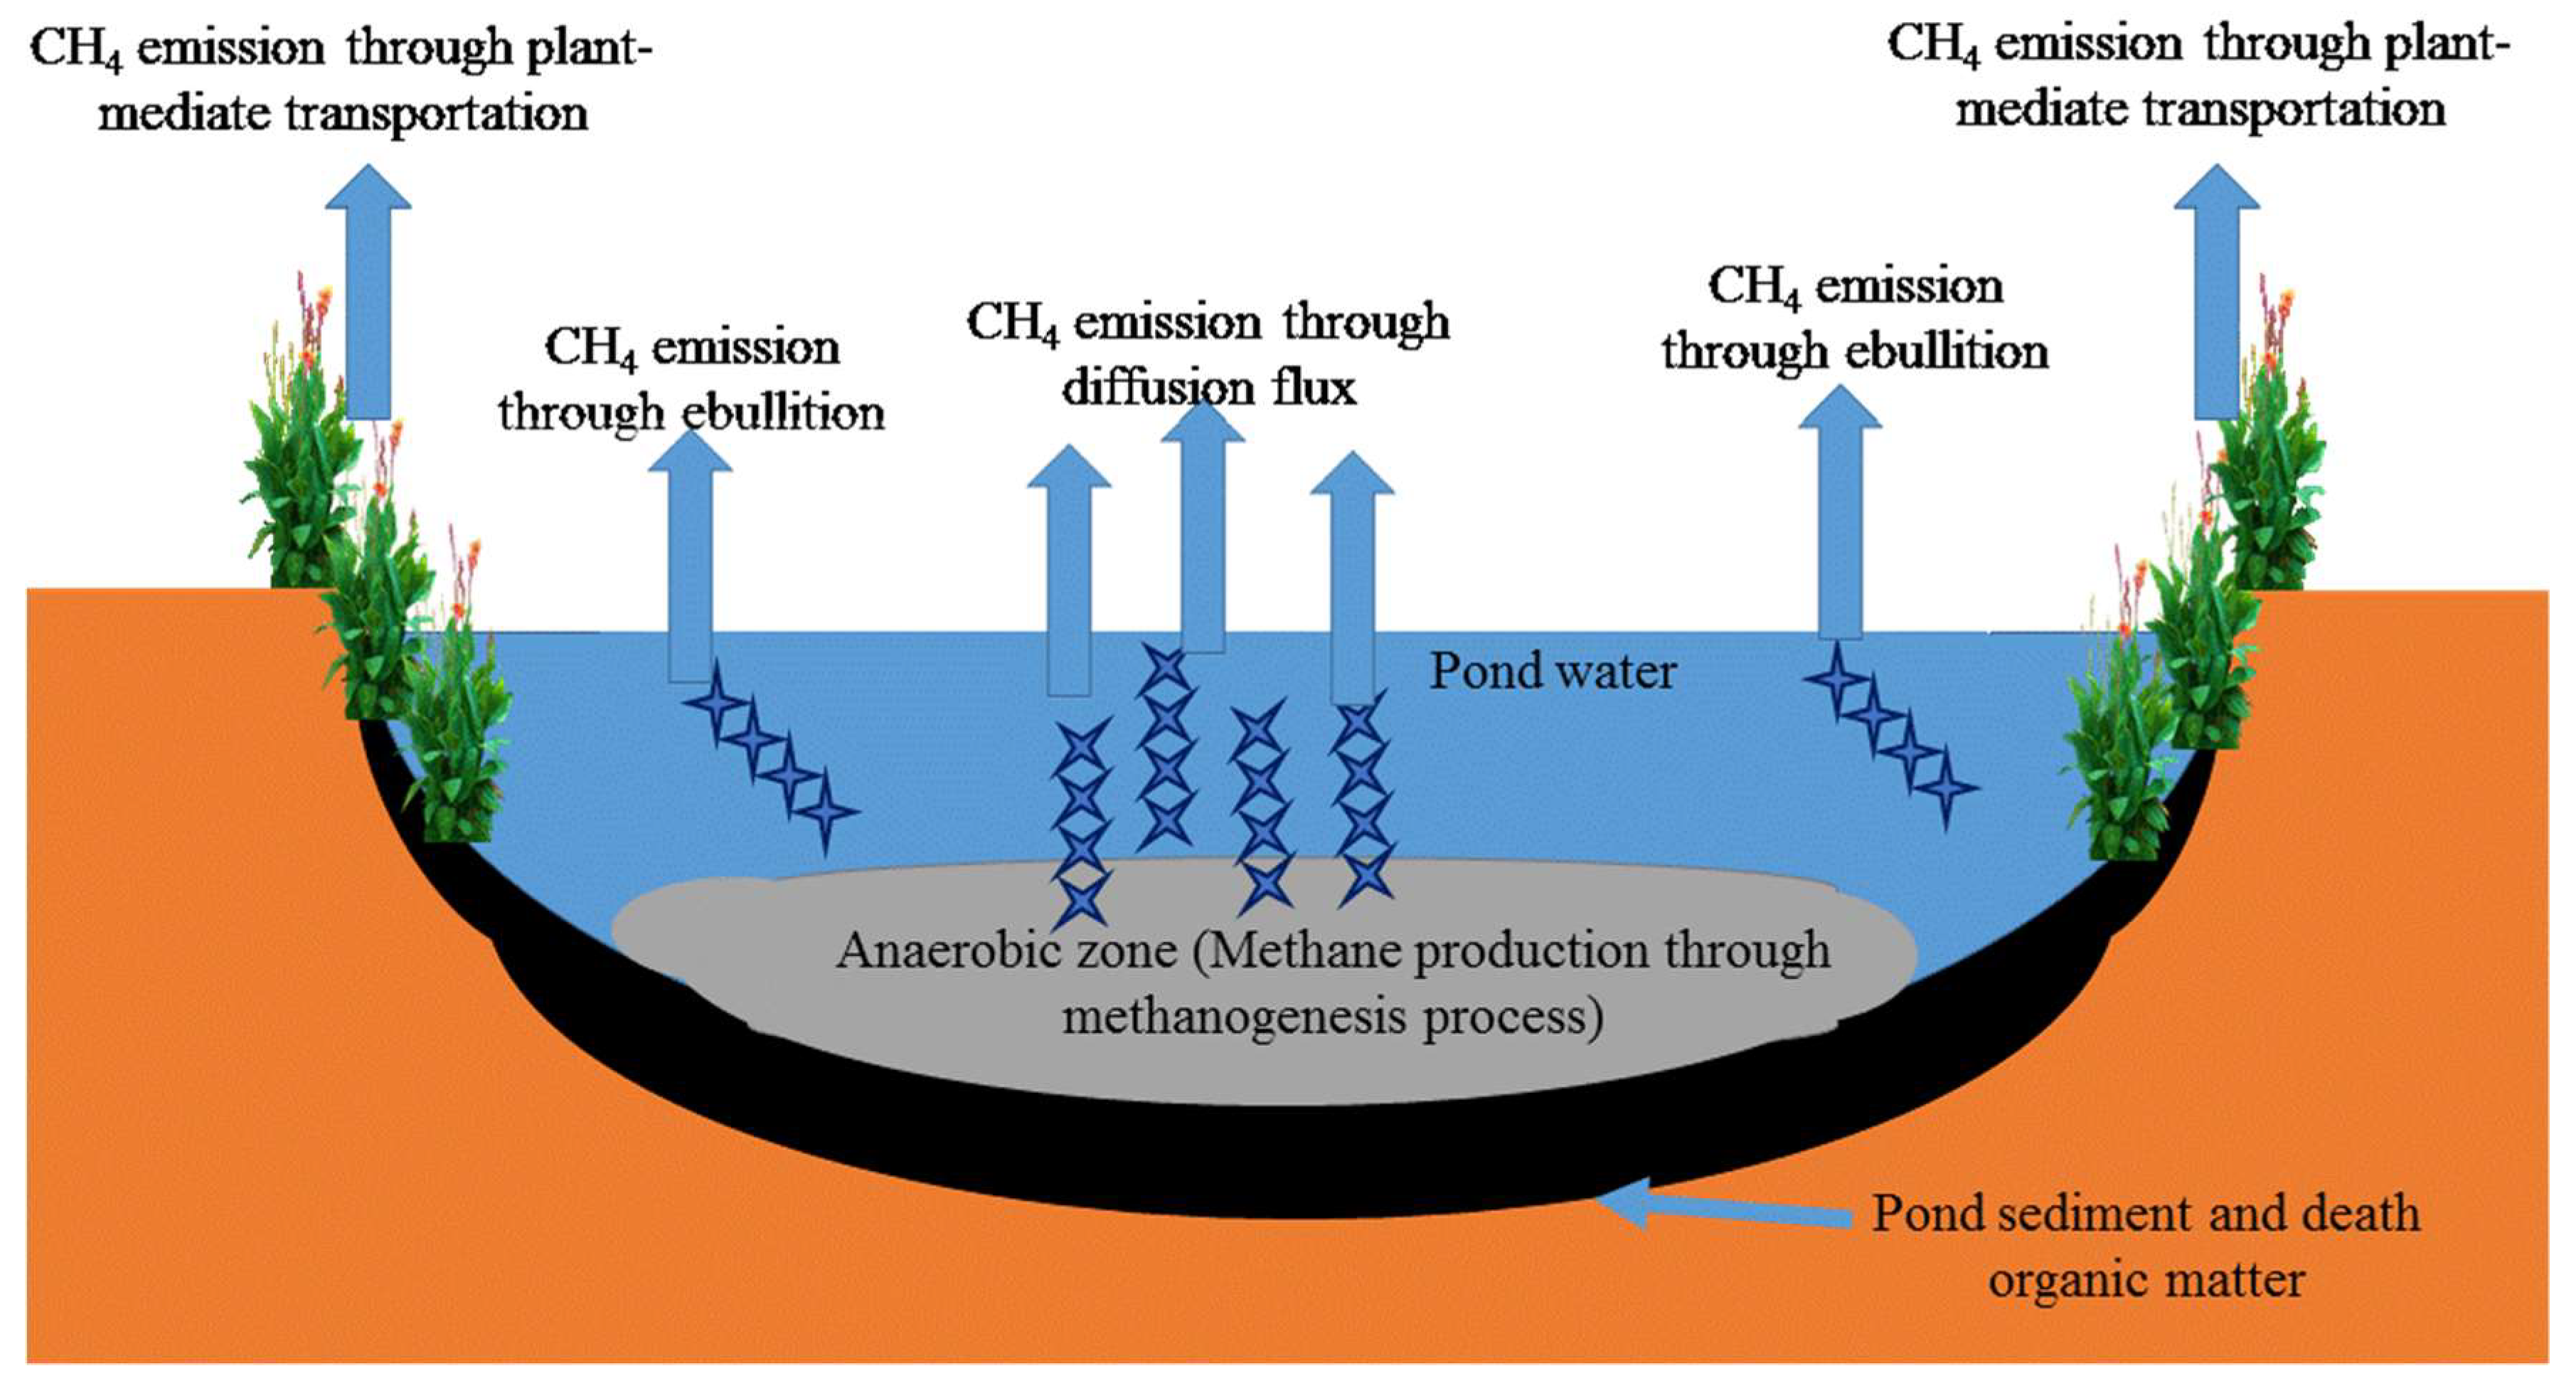
4.1. Methane Emission from Ponds

Diffusion, ebullition, and plant-mediate transportation are three major pathways (Figure 1) of CH4 emission in the ponds [14,15,16]. Gorky et al. [5] reported that the contribution of CH4, CO2, and N2O were 94%, ≈6%, and <1%, respectively, to the total GHG emissions from small ponds. In general, CH4 significantly contribute to total GHG emissions from inland water bodies. Ebullition and diffusion are dominant pathway (Figure 1) processes through which CH4 emits from pond water to the atmosphere [4,5,16]. Depending on water chemistry and environmental variables, ebullition contribution may range from 50 to 90% of total CH4 fluxes [12,14,15,16]. The percentage contribution of the diffusion process to total CH4 emissions from inland water varies from 10 to 25%, and it is mainly governed by both abiotic and biotic factors [12,14,15,16]. Selvam [15] estimated the CH4 emissions from 45 different inland water bodies of India (see Section 4.3.) and reported that CH4 emissions from the pond through a diffusion pathway (16.76% of total CH4 fluxes) was 3.1 mmol m−2 d−1, while the total CH4 flux was 18.5 mmol m−2 d−1. Constructed freshwater ponds are utilized for fish farming and other beneficial activities globally [17,18,19]. Yuan et al. [19] investigated the CH4 emission pathway from freshwater aquaculture ponds and observed that ebullition contributes from 79.1 to 83.5% of the total CH4 flux, which indicates that it is the main CH4 emission pathway in freshwater aquaculture ponds. Similar findings were also reported by Zhao et al. [17]. Zhao et al. [17] measured CH4 emissions from freshwater constructed aquaculture ponds and found that the ebullition CH4 emissions account for 70% of the total CH4 emissions. Yang et al. [18] found a slightly higher (90% of the total CH4 flux) contribution of the ebullition pathway to total emissions.
Grinham et al. [16] investigated the CH4 emissions from the pond and other small inland water bodies of Queensland, Australia, and found that ebullition is the dominant pathway of CH4 emissions. In one study, Holgerson and Raymond [20] investigated the contribution of CH4 and CO2 emissions from very small ponds (0.001 km2) and found that diffusive pathways involve 40.6% of the total CH4 flux. Ortega et al. [21] estimated the CH4 emissions from freshwater inland water bodies of the city of Berlin, Germany, and observed that ponds (2.11 km2) emit 300 mg CH4 m−2 day−1 (71.43% of the total CH4 flux) and 120 mg CH4 m−2 day−1 (28.57% of the total CH4 flux) through ebullition and the diffusion pathway, respectively [21]. The flux of CH4 through ebullition increased with nutrient enrichment of the pond and lakes, while CH4 emissions through the diffusion pathway did not show a positive correlation with nutrient enrichment of the water [22]. Nutrient enrichment in the pond resulted in phytoplankton blooms on the surface, resulting in reduced sunlight penetration, leading to the extinction of the submerged plant and reduced dissolved oxygen. This led to an enhanced population of methanogens, which increased the CH4 emissions [22]. The abundance of submerged macrophytes significantly affected the CH4 emission pathways. Ebullition and diffusion have negative and positive correlations, respectively, with submerged macrophytes [22].

4.2. Carbon Dioxide Emissions from Ponds

Generally, there are two direct (soil respiration processes and degradation of dissolved OM) and one indirect (CH4 oxidation by methanotrophs) pathways or processes involved in CO2 emissions from water bodies [23,24]. Firstly, the release of CO2 from the soil respiration increases the total CO2 in the water and the excess CO2 above the saturation limit is released into the atmosphere. Secondly, aquatic microbes actively perform in-situ degradation of dissolved OM in the water bodies and release CO2 gas to the atmosphere in this process. Thirdly, CH4 gas is produced in the anaerobic zone and this produced CH4 is trapped by methanotrophic bacteria in the aerobic zone. The trapped CH4 is utilized by methanotrophic bacteria as the sole source of carbon (especially labile organic carbon) and finally converted to CO2, which is emitted to the atmosphere [23,24,25].

4.3. Nitrous Oxide Emissions from Ponds

Nitrous oxide is an ozone-depleting GHG, and it is long-lived and considered as having a higher global warming potential compared to CO2 and CH4 [13,26]. Therefore, environmentalists pay more attention to its quantification in this modern era of urbanization and industrialization. Nitrous oxide concentration has significantly increased after industrialization, and its combat is crucially required to fight enhanced global warming. The contribution of the anthropogenic flux of N2O to the atmosphere from ponds, streams, rivers, etc. is negligible to the total GHG emissions [22]. Xiao et al. [27] investigated the N2O emissions from different inland water bodies of the agricultural watershed and reported that pond systems emit 19 nmol L−1 annually. Nitrogen-based fertilizer runoff reaching nearby ponds, streams, and rivers is the main source of anthropogenic N2O emissions [27]. The N2O produced in freshwater ponds generally moves downwards and is consumed in benthic sediment, and, therefore, ponds are considered a weak source of N2O emissions [19]. The GHG efflux, especially CH4, CO2, and N2O from the ponds located in different parts of the world, is listed in Table 1 and further the detailed sampling methods has been discussed in the Section 5 below.

5. Methods for Greenhouse Gas Emissions Measurement from Ponds

In general, measurement of the GHG emissions from the pond is achieved through frequently used methods called “floating chambers, headspace, and funnels”. Eddy covariance (EC) towers are used rarely by the scientific fraternity because of the high cost and the need for a technician for handing and installing the EC tower (see details below in sub-sections) [17,39,40]. These techniques have their advantages and limitations for measuring the spatial and temporal coverage, along with the accuracy to capture the GHG flux (diffusive and ebullition). GHG measurements from small size ponds using the EC are generally not recommended due to difficulty in the determination of the accurate fetch and economics.

5.1. Floating Chamber Method

The floating chamber method is widely used for the GHG measurement from ponds and other water bodies (Table 1). It should be constructed in different sizes and shapes (depending on the lake size and requirements) by using chemically inert materials, such as polyacrylic sheets etc. The chamber should be open at one end and attached with the float (floating sheet) in such a way that the chamber can be sufficiently submerged in the water to avoid air penetration [17,41]. The floating sheet makes it an enclosed system. The floating chamber should be connected with a sampling pump and Tedlar bag via a three-way stopcock. The sampling is done at different time intervals based on the temporal trends of GHG emissions from the pond. The effective mixing of the air before collecting the sample should be ensured. The collected samples should be transported to the laboratory in ice-cool bags and analyzed immediately through gas chromatography (GC) using desired detectors (FID, TCD).

5.2. Headspace Sampling

GHG partial pressure measurements can also be achieved with the headspace gas chromatography (HS-GC) procedure. The water samples should be collected into tight containers, such as glass vials/borosilicate glass bottles, to avoid the change of methane adsorption on the container walls [42,43]. The precaution to restrict the gas exchange should be taken at the time of the water sampling through water samplers. In this procedure, the headspace (gas phase) lies above the liquid phase (sample phase) containing the dissolved greenhouse gases. The glass vials are to be sealed after the introduction of the liquid phase into them. The diffusion of the volatile component continues till the headspace achieves equilibrium [43]. The gas sample is collected from the headspace and analyzed by gas chromatography. The septum is baked for 2–3 h at 60 °C to remove traces of GHG-producing chemicals. The precaution related to the calculation of the headspace volume calculation should be taken by using a minimum of 30 bottles, and the average mean should be used. A preservative such as KCl should be used to restrict the biological activity between sampling and analysis, especially in the case of CO2. The water temperature and atmospheric pressure should be recorded and used in the calculations for the partitioning of gas between the water and gas phases.

5.3. Bubbles Trapped Using Inverted Funnels

Bubble fluxes (ebullition) from the pond can be measured through inverted funnels coupled to gas collectors initially filled with water. Bubble fluxes mainly occur in shallow ponds. The shallowness part of the ponds bears the low hydrostatic pressure, and dissolution of the GHG is not possible in the interstitial water. The bubble collectors should be installed below the wind–wave influence. This method can be used to know the integrated flux over different periods. This technique is comparatively cheap and easy to perform for the GHG estimation from the ponds. The size of the inverted funnel should be decided based on the bubble emission [44,45]. The funnel should be submerged, and all the pre-existed air needs to be removed before the commencement of sampling. Before performing GHG sampling and analysis through this method, it should be confirmed that the water flow is zero and the bottom slope of the pond is <20 degrees. Both of these conditions ensure the stability of the sampling system for a long duration and also minimize procedural errors. The sampling interval should be less than 20 h to avoid diffusion of the GHG.

6. Factors Affecting Greenhouse Gas Emissions from Ponds

GHG emissions from ponds are affected by several factors, such as water quality [46], temperature [47], water depth, eutrophication, micro-macro flora-fauna, etc. [48,49] (Table 2). Some of the important factors which govern the GHG emissions from the pond are discussed briefly in this section.

6.1. Effect of Water pH on GHG Emissions

6.1.1. Methane

Hao et al. [46] reported that water pH has a non-significant correlation with CH4 emissions from inland water bodies, such as ponds (Table 2). A similar finding was also reported by Yang et al. [40] in Northern Taiwan (Table 2). Methane-producing bacteria are pH sensitive, and they produce CH4 in a narrow range (pH, 6–8). The pH of some of the ponds around the globe at different geographical locations has been summarized in Table 3. Based on Table 3, it can be concluded that the pH of freshwater bodies, especially inland ponds, was within or around this narrow pH range (from 6–8) and, therefore, the pH of pond water was not having any significant correlation with CH4 emissions.

6.1.2. Carbon Dioxide

Carbon dioxide emissions from water are usually low as it is dissolved in the water and produces carbonic acid [74]. The pH of the pond water has both positive and negative correlations with CO2 flux from the pond (Table 2). Peacock et al. [29] reported a negative correlation between water pH and CO2 emissions from pond water (Table 2). Similarly, a negative correlation between pH and CO2 emissions is also reported by Hao et al. [46] in China. Hao et al. [46] investigated the GHG emissions from 18 field campaigns, including ponds, lakes, wastewater, swamps, etc., and found the CO2 from ponds ranged from 0.02 to 4.81 mol m−2 d−1 and had a negative correlation (r = −0.804, p < 0.01) with water pH.

6.1.3. Nitrous Oxide

Hao et al. [46] reported that water pH has no correlation with N2O emissions from the inland water bodies such as ponds (Table 2). Singh et al. [52] investigated the N2O emissions from urban pond water and reported that the correlation between the water pH and N2O flux is very complex. Generally, when water pH decreases, N2O emissions from water bodies increase, and denitrification plays an important role in this flux [52]. The highest N2O flux through denitrification is in the narrow range of pH 7–8 [13,52]. At a higher water pH, microbial activities are suppressed, which retards the denitrification and nitrification processes, resulting in lower N2O emissions [56,75].

6.2. Effect of Temperature on GHG

6.2.1. Methane

In the pond ecosystem, sediment and water temperature significantly affect the CH4 emissions [12,48,50]. DelSontro et al. [48] observed that the rate of CH4 diffusion from ponds shows a positive correlation on increasing sediment temperature from 10 to 25°C. Peacock et al. [29] conducted an extensive study on GHG emissions from small artificial water bodies such as ponds and found that the CH4 emissions were highest at higher temperatures (summer season) while the rate of CH4 emissions was lower during winter (Table 2). Peacock et al. [29] observed that the mean annual CH4 emissions from water bodies ranged from 0.1 to 44.3 g CH4 m−2 year−1.
Boron et al. [12] reported that CH4 fluxes increased exponentially with temperature. The rate of CH4 emissions through ebullition increased by 11% on a 1°C rise in water temperature, while with a 10 °C rise in temperature, CH4 emissions enhanced up to 2.8 times through the ebullition process [35]. Organic matter present in the soil is the substrate for methanogenic bacteria. The water temperature increase enhanced the decomposition rate of sediment OM which is an oxygen demanding process. Decomposition of OM depletes water oxygen which results in an anaerobic environment and favors CH4 production through methanogenesis. The rate of CH4 emissions through the ebullition process increased exponentially over 17°C, and the water temperature had a non-significant correlation on CH4 emissions through the diffusion pathway [35]. However, Hao et al. [46] found no significant correlation between the CH4 emissions and water temperature. Hao et al. [46] found that the CH4 emissions concentrations decrease with a water temperature increase due to the enhanced activity of methane-oxidizing bacteria (MOB). At a higher temperature, MOB consume more CH4 and convert it into CO2, which results in a lower emission of CH4 [46].

6.2.2. Carbon Dioxide

There are controversial findings regarding the relationship between CO2 emissions from ponds and temperature (Table 2). The water temperature of pond ecosystems does not show any correlation with CO2 diffusion [48]. DelSontro et al. [48] found that the CO2 diffusion did not change with the increase in sediment temperature from 10 to 25 °C. Audet et al. [28] reported seven major CO2 emission influencing factors such as vegetation, pH, sulfate, DO, ammonium, temperature, and water temperature. The water temperature influences the contribution to around 7%, in comparison with the total 100% influence.

6.2.3. Nitrous Oxide

Generally, pond freshwater bodies emit negligible or no N2O, as a majority of N2O produced is diffused back and converted to N2 gas through biological processes. Water temperature has a strong and positive correlation with the denitrification pathway which finally enhances the N2O flux [50,51]. Higher water temperature enhances the oxygen demanding metabolic pathways, which depletes the DO of the water and creates an anaerobic environment, resulting in a higher denitrification process [13,50]. In one incubation study, Samarkin et al. [76] found that the rate of N2O production positively correlated with temperature. The N2O production starts at −20 °C and exponentially increases with temperature [76]. However, contradictory findings were also reported by Paudel et al. [55]. Paudel et al. observed that the N2O emissions from freshwater aquaculture systems significantly decreased with increased water temperature.

6.3. Effect of Nutrients Concentration on GHG Emissions

6.3.1. Methane

Nitrate and phosphate in the water have a negative and positive correlation with CH4 emissions from pond water, respectively (Table 2). Nitrate acts as an electrons acceptor and inhibitor for the methanogenesis processes and, therefore, results in lower CH4 production [57]. Phosphate in water causes eutrophication which may enhance more liable organic matter in the system and the generation of CH4 by methanogenic bacteria [4,28,57]. The nutrient load, such as nitrate, total organic carbon, TN, etc., has a significant positive correlation with CH4 production in small ponds (Table 2). Organic matter (OM) has a positive correlation with CH4 production and emission from ponds. In general, OM decomposes in the anaerobic zone of ponds and significantly contributes to CH4 emissions (Table 2). Recently, Gorsky et al. [5] investigated the CH4, N2O, and CO2 emissions from 15 stormwater ponds of Virginia, USA, and found that OM has a positive correlation with CH4 emissions. CH4 emissions contribute 94% of the total GHG, and the mean CH4 flux was 15.1 mg m−2 h−1. Organic carbon contributes roughly 6% and 20% to total C emissions from ponds and reservoirs [47,77]. Peacock et al. [30] observed that the rate of CH4 emissions from the urban pond was positively correlated with the total organic carbon and total phosphorus. Water sulfate also has a negative correlation with CH4 production and emission [12]. Higher sulfate concentration in water enhances the population of sulfate reduction bacteria [78], and these sulfate reducing bacteria compete with methanogenic bacteria for OM. The higher sulfate reducing bacteria reduced CH4 production by suppressing methanogenic activity as they both utilized the same carbon source as labile organic carbon [7].

6.3.2. Carbon Dioxide

Carbon dioxide flux from the freshwater system is a biological process and has a positive correlation with nitrogen [13]. The high nitrogen in water enhances the algal growth, and this high algal biomass settles down in the benthic region of the pond and degrades through the biological processes, resulting in emissions from the air–water surface [32]. The high nitrogen favors the nitrification and denitrification process, as a result of which CO2 is released into the atmosphere [32]. Constructed wetlands are widely used to reduce the nutrient load from the water stream [9]. Badiou et al. [79] investigated the GHG emissions from both untreated and constructed wetlands treated stormwater. Their results reveal that total cumulative CO2 flux from untreated and constructed wetland treated water was 12,631 g ha−1 day−1 and 6447 g ha−1 day−1 [79]. The nutrient load, such as total nitrogen, phosphorus, nitrate, etc., is lower in treated water, and this supports that the CO2 emission from water is generally positively correlated with the nutrient load.

6.3.3. Nitrous Oxide

Nitrous oxide emissions from freshwater have a positive correlation with the inorganic N components (Table 2). N2O in freshwater is mainly produced through the denitrification process, and N components, such as nitrate (NO3-N) and ammonium (NH4+-N), are the substrate for this complex process [56,59]. The emission of N2O from pond water has a positive correlation with nitrate and sulfate [50]. Nitrate present in water acts as a primary raw source for the denitrification pathway and emits N2O to the atmosphere [9,50,80]. Audet et al. [28] quoted that higher sulfate produced sulfide in water, and this sulfide inhibited the conversion of N2O to N2 gas, and, therefore, higher N2O is emitted under more water sulfate concentration.

6.4. Effect of Eutrophication on CH4, CO2, and N2O Emission

Eutrophication results in the depletion of the DO concentration in pond water, and eutrophication processes have a positive correlation with CH4 and CO2 emissions [49,57,62]. Eutrophication enhanced the labile organic carbon (LOC) in the pond ecosystem, and this LOC is rapidly consumed by methanogenesis bacteria in anaerobic conditions, liberating CH4 as a by-product GHG gas. Beaulieu et al. [49] reported in a recent simulation that, over the next century, eutrophication may enhance from 30 to 90% CH4 emissions from impoundments bodies. Freshwater eutrophication results in high biomass production [81] and is decomposed under low DO. After decomposition, this biomass is mineralized under a reduced environment and liberates CH4 and CO2 as a by-product [62].

7. Conclusions

Inland freshwater bodies, such as ponds, ditches, etc., are either less monitored or completely ignored for their role in greenhouse gas (GHG) emissions to the atmosphere. Freshwater ponds and urban ponds significantly emit methane (CH4) and carbon dioxide (CO2). Water temperature and dissolved organic matter have a positive correlation with CH4, CO2, and N2O emissions from the pond. Water pH ranging from 6.5 to 8.5 is considered most favorable for the biological activity and the production and emission of CO2 and N2O in the atmosphere. Eutrophication increases the biomass of the pond, which later settles down at the benthic region and degradation of the same under an anaerobic environment significantly enhances CH4 emissions. Further, water, phosphorus, and nitrogen have a positive correlation with CO2 and N2O production. Dissolved oxygen concentration (DO) has a negative correlation with CH4 and CO2 emissions, while contradictory findings were reported for N2O emissions. The nutrient load and DO are two key factors affecting the GHG emissions from the pond system. Therefore, the appropriate design of constructed wetlands could reduce nutrient load and enhanced DO in the ponds and have a significant prospect for the mitigation of GHG in pond systems and other inland water bodies.

Author Contributions

Conceptualization, S.K.M., A.K. (Amit Kumar, [email protected]), O.S. and A.K. (Amit Kumar, [email protected]); methodology, S.K.M. and A.K. (Amit Kumar, [email protected]); software, S.K.M.; validation, S.K.M. and A.K. (Amit Kumar, [email protected]); formal analysis, S.K.M. and A.K. (Amit Kumar, [email protected]); investigation, S.K.M. and A.K. (Amit Kumar, [email protected]); resources, S.K.M. and A.K. (Amit Kumar, [email protected]); data curation, S.K.M. and A.K. (Amit Kumar, [email protected]); writing-original draft preparation, S.K.M., A.K. (Amit Kumar, [email protected]), A.K. (Amit Kumar, [email protected]), O.S. and R.S.; writing-review and editing, S.K.M., A.K. (Amit Kumar, [email protected]), A.K. (Amit Kumar, [email protected]), O.S., R.S., G.A., S.S., Z.Y., J.K. and R.K.F. visualization, S.K.M. and A.K. (Amit Kumar, [email protected]); supervision, S.K.M. and A.K. (Amit Kumar, [email protected]); project administration, S.K.M. and A.K. (Amit Kumar, [email protected]); funding acquisition, S.K.M. and A.K. (Amit Kumar, [email protected]) All authors have read and agreed to the published version of the manuscript.

Funding

The article is partially supported by the National Science Foundation of China (NSFC)-International Young Scientist Project (Grant no: 52150410400).

Institutional Review Board Statement

Not applicable.

Informed Consent Statement

Not applicable.

Data Availability Statement

Not applicable as all data has been given in tables.

Acknowledgments

Authors (S.K.M., O.S., R.S. and S.S.) gratefully acknowledge the National Institute of Hydrology, Roorkee, Uttarakhand-2477667, India, for all the necessary support. Author G.A. acknowledges the University of Petroleum and Energy Studies, Dehradun-Uttarkhand-248007, India.

Conflicts of Interest

The authors declare no conflict of interest.

References

  1. Hoverman, J.T.; Johnson, P.T.J. Ponds and Lakes: A Journey Through the Life Aquatic. Nat. Educ. Knowl. 2012, 3, 17. [Google Scholar]
  2. Downing, J.A.; Duarte, C.M. Abundance and Size Distribution of Lakes, Ponds and Impoundments. Encycl. Inl. Waters 2009, 51, 469–478. [Google Scholar] [CrossRef]
  3. Kumar, M.; Padhy, P. Environmental Perspectives of Pond Ecosystems: Global Issues, Services and Indian Scenarios. Curr. World Environ. 2015, 10, 848–867. [Google Scholar] [CrossRef] [Green Version]
  4. Kumar, A.; Sharma, M.P. Assessment of risk of GHG emissions from Tehri hydropower reservoir, India. Hum. Ecol. Risk Assess Int. J. 2015, 22, 71–85. [Google Scholar] [CrossRef]
  5. Gorsky, A.L.; Racanelli, G.A.; Belvin, A.C.; Chambers, R.M. Greenhouse gas flux from stormwater ponds in southeastern Virginia (USA). Anthropocene 2019, 28, 100218. [Google Scholar] [CrossRef]
  6. Kumar, A.; Yu, Z.G.; Klemeš, J.J.; Bokhari, A. A state-of-the-art review of greenhouse gas emissions from Indian hydropower reservoirs. J. Clean. Prod. 2021, 320, 128806. [Google Scholar] [CrossRef]
  7. Malyan, S.K.; Bhatia, A.; Kumar, A.; Gupta, D.K.; Singh, R.; Kumar, S.S.; Tomer, R.; Kumar, O.; Jain, N. Methane production, oxidation and mitigation: A mechanistic understanding and comprehensive evaluation of influencing factors. Sci. Total Environ. 2016, 572, 874–896. [Google Scholar] [CrossRef]
  8. Malyan, S.K.; Bhatia, A.; Fagodiya, R.K.; Kumar, S.S.; Kumar, A.; Gupta, D.K.; Tomer, R.; Harit, R.C.; Kumar, V.; Jain, N.; et al. Plummeting global warming potential by chemicals interventions in irrigated rice: A lab to field assessment. Agric. Ecosyst. Environ. 2021, 319, 107545. [Google Scholar] [CrossRef]
  9. Malyan, S.K.; Yadav, S.; Sonkar, V.; Goyal, V.C.; Singh, O.; Singh, R. Mechanistic understanding of the pollutant removal and transformation processes in the constructed wetland system. Water Environ. Res. 2021, 93, 1882–1909. [Google Scholar] [CrossRef]
  10. Kumar, A.; Kumar, M.; Pandey, R.; Yu, Z.; Cabral-Pinto, M. Forest soil nutrient stocks along with an altitudinal range of Uttarakhand Himalayas: An aid to Nature Based Climate Solutions. Catena 2021, 207, 105667. [Google Scholar] [CrossRef]
  11. Kumar, A.; Tomer, R.; Bhatia, A.; Jain, N.; Pathak, H. Greenhouse gas mitigation technologies in Indian Agriculture. In Climate Change and Agriculture Technologies for Enhancing Resilience; ICARIARI: New Delhi, India, 2016; pp. 137–149. [Google Scholar]
  12. Baron, A.A.P.; Dyck, L.T.; Amjad, H.; Bragg, J.; Kroft, E.; Newson, J.; Oleson, K.; Casson, N.J.; North, R.L.; Venkiteswaran, J.J.; et al. Differences in ebullitive methane release from small, shallow ponds present challenges for scaling. Sci. Total Environ. 2022, 802, 149685. [Google Scholar] [CrossRef] [PubMed]
  13. Kumar, A.; Yang, T.; Sharma, M.P. Greenhouse Gas Measurement from Chinese Freshwater Bodies: A Review. J. Cleaner Prod. 2019, 233, 368–378. [Google Scholar] [CrossRef]
  14. Bastviken, D.; Cole, J.; Pace, M.; Tranvik, L. Methane emissions from lakes: Dependence of lake characteristics, two regional assessments, and a global estimate. Global Biogeochem. Cycles 2004, 18, 1–12. [Google Scholar] [CrossRef]
  15. Panneer Selvam, B.; Natchimuthu, S.; Arunachalam, L.; Bastviken, D. Methane and carbon dioxide emissions from inland waters in India–implications for large scale greenhouse gas balances. Glob. Chang. Biol. 2014, 20, 3397–3407. [Google Scholar] [CrossRef] [PubMed] [Green Version]
  16. Grinham, A.; Albert, S.; Deering, N.; Dunbabin, M.; Bastviken, D.; Sherman, B.; Lovelock, C.; Evans, C. The importance of small artificial water bodies as sources of methane emissions in Queensland, Australia. Hydrol. Earth Syst. Sci. 2018, 22, 5281–5298. [Google Scholar] [CrossRef] [Green Version]
  17. Zhao, J.; Zhang, M.; Xiao, W.; Jia, L.; Zhang, X.; Wang, J.; Zhang, Z.; Xie, Y.; Pu, Y.; Liu, S.; et al. Large methane emission from freshwater aquaculture ponds revealed by long-term eddy covariance observation. Agric. For. Meteorol. 2021, 308–309, 108600. [Google Scholar] [CrossRef]
  18. Yang, P.; Zhang, Y.; Yang, H.; Guo, Q.; Lai, D.Y.F.; Zhao, G.; Li, L.; Tong, C. Ebullition was a major pathway of methane emissions from the aquaculture ponds in southeast China. Water Res. 2020, 184, 116176. [Google Scholar] [CrossRef] [PubMed]
  19. Yuan, J.; Liu, D.; Xiang, J.; He, T.; Kang, H.; Ding, W. Methane and nitrous oxide have separated production zones and distinct emission pathways in freshwater aquaculture ponds. Water Res. 2021, 190, 116739. [Google Scholar] [CrossRef]
  20. Holgerson, M.A.; Raymond, P.A. Large contribution to inland water CO2 and CH4 emissions from very small ponds. Nat. Geosci. 2016, 9, 222–226. [Google Scholar] [CrossRef]
  21. Herrero Ortega, S.; Romero González-Quijano, C.; Casper, P.; Singer, G.A.; Gessner, M.O. Methane emissions from contrasting urban freshwaters: Rates, drivers, and a whole-city footprint. Glob. Chang. Biol. 2019, 25, 4234–4243. [Google Scholar] [CrossRef] [PubMed] [Green Version]
  22. Davidson, T.A.; Audet, J.; Jeppesen, E.; Landkildehus, F.; Lauridsen, T.L.; Søndergaard, M.; Syväranta, J. Synergy between nutrients and warming enhances methane ebullition from experimental lakes. Nat. Clim. Chang. 2018, 8, 156–160. [Google Scholar] [CrossRef]
  23. Prairie, Y.T.; Alm, J.; Beaulieu, J.; Barros, N.; Battin, T.; Cole, J.; del Giorgio, P.; DelSontro, T.; Guérin, F.; Harby, A.; et al. Greenhouse Gas Emissions from Freshwater Reservoirs: What Does the Atmosphere See? Ecosystems 2018, 21, 1058–1071. [Google Scholar] [CrossRef] [PubMed]
  24. Vachon, D.; Solomon, C.T.; del Giorgio, P.A. Reconstructing the seasonal dynamics and relative contribution of the major processes sustaining CO2 emissions in northern lakes. Limnol. Oceanogr. 2017, 62, 706–722. [Google Scholar] [CrossRef]
  25. Thottathil, S.D.; Reis, P.C.J.; Prairie, Y.T. Methane oxidation kinetics in northern freshwater lakes. Biogeochemistry 2019, 143, 105–116. [Google Scholar] [CrossRef]
  26. Fagodiya, R.K.; Pathak, H.; Bhatia, A.; Jain, N.; Gupta, D.K.; Kumar, A.; Malyan, S.K.; Dubey, R.; Radhakrishanan, S.; Tomer, R. Nitrous oxide emission and mitigation from maize–wheat rotation in the upper Indo-Gangetic Plains. Carbon Manag. 2019, 10, 489–499. [Google Scholar] [CrossRef]
  27. Xiao, Q.; Hu, Z.; Fu, C.; Bian, H.; Lee, X.; Chen, S.; Shang, D. Surface nitrous oxide concentrations and fluxes from water bodies of the agricultural watershed in Eastern China. Environ. Pollut. 2019, 251, 185–192. [Google Scholar] [CrossRef]
  28. Audet, J.; Carstensen, M.V.; Hoffmann, C.C.; Lavaux, L.; Thiemer, K.; Davidson, T.A. Greenhouse gas emissions from urban ponds in Denmark. Inl. Waters 2020, 10, 373–385. [Google Scholar] [CrossRef]
  29. Peacock, M.; Audet, J.; Bastviken, D.; Cook, S.; Evans, C.D.; Grinham, A.; Holgerson, M.A.; Högbom, L.; Pickard, A.E.; Zieliński, P.; et al. Small artificial waterbodies are widespread and persistent emitters of methane and carbon dioxide. Glob. Chang. Biol. 2021, 27, 5109–5123. [Google Scholar] [CrossRef] [PubMed]
  30. Peacock, M.; Audet, J.; Jordan, S.; Smeds, J.; Wallin, M.B. Greenhouse gas emissions from urban ponds are driven by nutrient status and hydrology. Ecosphere 2019, 10, e02643. [Google Scholar] [CrossRef]
  31. Pickard, A.; White, S.; Bhattacharyya, S.; Carvalho, L.; Dobel, A.; Drewer, J.; Jamwal, P.; Helfter, C. Greenhouse gas budgets of severely polluted urban lakes in India. Sci. Total Environ. 2021, 798, 149019. [Google Scholar] [CrossRef] [PubMed]
  32. Webb, J.R.; Leavitt, P.R.; Simpson, G.L.; Baulch, H.M.; Haig, H.A.; Hodder, K.R.; Finlay, K. Regulation of carbon dioxide and methane in small agricultural reservoirs: Optimizing potential for greenhouse gas uptake. Biogeosciences 2019, 16, 4211–4227. [Google Scholar] [CrossRef] [Green Version]
  33. Natchimuthu, S.; Panneer Selvam, B.; Bastviken, D. Influence of weather variables on methane and carbon dioxide flux from a shallow pond. Biogeochemistry 2014, 119, 403–413. [Google Scholar] [CrossRef]
  34. Singh, V.P.; Dass, P.; Kaur, K.; Billore, S.K.; Gupta, P.K.; Parashar, D.C. Nitrous oxide fluxes in a tropical shallow urban pond under influencing factors. Curr. Sci. 2005, 88, 478–483. [Google Scholar]
  35. Wang, G.; Xia, X.; Liu, S.; Zhang, L.; Zhang, S.; Wang, J.; Xi, N.; Zhang, Q. Intense methane ebullition from urban inland waters and its significant contribution to greenhouse gas emissions. Water Res. 2021, 189, 116654. [Google Scholar] [CrossRef]
  36. Schrier-Uijl, A.P.; Veraart, A.J.; Leffelaar, P.A.; Berendse, F.; Veenendaal, E.M. Release of CO2 and CH4 from lakes and drainage ditches in temperate wetlands. Biogeochemistry 2011, 102, 265–279. [Google Scholar] [CrossRef] [Green Version]
  37. Wik, M.; Varner, R.K.; Anthony, K.W.; MacIntyre, S.; Bastviken, D. Climate-sensitive northern lakes and ponds are critical components of methane release. Nat. Geosci. 2016, 9, 99–105. [Google Scholar] [CrossRef]
  38. Zhao, J.; Zhang, M.; Xiao, W.; Wang, W.; Zhang, Z.; Yu, Z.; Xiao, Q.; Cao, Z.; Xu, J.; Zhang, X.; et al. An evaluation of the flux-gradient and the eddy covariance method to measure CH4, CO2, and H2O fluxes from small ponds. Agric. For. Meteorol. 2019, 275, 255–264. [Google Scholar] [CrossRef]
  39. Kumar, A.; Bhatia, A.; Sehgal, V.K.; Tomer, R.; Jain, N.; Pathak, H. Net Ecosystem Exchange of Carbon Dioxide in Rice-Spring Wheat System of Northwestern Indo-Gangetic Plains. Land 2021, 10, 701. [Google Scholar] [CrossRef]
  40. Yang, S.S.; Chen, I.C.; Liu, C.P.; Liu, L.Y.; Chang, C.H. Carbon dioxide and methane emissions from Tanswei River in Northern Taiwan. Atmos. Pollut. Res. 2015, 6, 52–61. [Google Scholar] [CrossRef] [Green Version]
  41. Protocol, G.H.G. Required Greenhouse Gases in Inventories: Accounting and reporting standard amendment. Greenh. Gas Protoc. 2013, 8, 1–9. [Google Scholar]
  42. Halbedel, S. Protocol for CO2 sampling in waters by the use of the headspace equilibration technique, based on the simple gas equation; second update. Protocol Exch. 2015, 10, 1709–1727. [Google Scholar] [CrossRef] [Green Version]
  43. Koschorreck, M.; Prairie, Y.T.; Kim, J.; Marcé, R. Technical note: CO2 is not like CH4- Limits of and corrections to the headspace method to analyse pCO2 in fresh water. Biogeosciences 2021, 18, 1619–1627. [Google Scholar] [CrossRef]
  44. Egorov, A.V.; Nigmatulin, R.I.; Rimskii-Korsakov, N.A.; Rozhkov, A.N.; Sagalevich, A.M.; Chernyaev, E.S. Breakup of deep-water methane bubbles. Oceanology 2010, 50, 469–478. [Google Scholar] [CrossRef]
  45. McClure, R.P.; Lofton, M.E.; Chen, S.; Krueger, K.M.; Little, J.C.; Carey, C.C. The Magnitude and Drivers of Methane Ebullition and Diffusion Vary on a Longitudinal Gradient in a Small Freshwater Reservoir. J. Geophys. Res. Biogeosci. 2020, 125, e2019JG005205. [Google Scholar] [CrossRef]
  46. Hao, X.; Yu, R.; Zhang, Z.; Qi, Z.; Lu, X.; Liu, T.; Gao, R. Greenhouse gas emissions from the water–air interface of a grassland river: A case study of the Xilin River. Sci. Rep. 2021, 11, 2659. [Google Scholar] [CrossRef]
  47. van Bergen, T.J.H.M.; Barros, N.; Mendonça, R.; Aben, R.C.H.; Althuizen, I.H.J.; Huszar, V.; Lamers, L.P.M.; Lürling, M.; Roland, F.; Kosten, S. Seasonal and diel variation in greenhouse gas emissions from an urban pond and its major drivers. Limnol. Oceanogr. 2019, 64, 2129–2139. [Google Scholar] [CrossRef]
  48. DelSontro, T.; Boutet, L.; St-Pierre, A.; del Giorgio, P.A.; Prairie, Y.T. Methane ebullition and diffusion from northern ponds and lakes regulated by the interaction between temperature and system productivity. Limnol. Oceanogr. 2016, 61, S62–S77. [Google Scholar] [CrossRef]
  49. Beaulieu, J.J.; DelSontro, T.; Downing, J.A. Eutrophication will increase methane emissions from lakes and impoundments during the 21st century. Nat. Commun. 2019, 10, 3–7. [Google Scholar] [CrossRef] [PubMed] [Green Version]
  50. Marotta, H.; Pinho, L.; Gudasz, C.; Bastviken, D.; Tranvik, L.J.; Enrich-Prast, A. Greenhouse gas production in low-latitude lake sediments responds strongly to warming. Nat. Clim. Chang. 2014, 4, 467–470. [Google Scholar] [CrossRef]
  51. Stadmark, J.; Leonardson, L. Greenhouse gas production in a pond sediment: Effects of temperature, nitrate, acetate and season. Sci. Total Environ. 2007, 387, 194–205. [Google Scholar] [CrossRef] [PubMed]
  52. Khoiyangbam, R.S.; Chingangbam, S.S. Assessing seasonal variation of diffusive nitrous oxide emission from freshwater wetland in Keibul Lamjao National Park, Manipur Northeast India. Atmos. Environ. X 2022, 13, 100147. [Google Scholar] [CrossRef]
  53. Borges, A.V.; Darchambeau, F.; Teodoru, C.R.; Marwick, T.R.; Tamooh, F.; Geeraert, N.; Omengo, F.O.; Guérin, F.; Lambert, T.; Morana, C.; et al. Globally significant greenhouse-gas emissions from African inland waters. Nat. Geosci. 2015, 8, 637–642. [Google Scholar] [CrossRef] [Green Version]
  54. Paudel, S.R.; Choi, O.; Khanal, S.K.; Chandran, K.; Kim, S.; Lee, J.W. Effects of temperature on nitrous oxide (N2O) emission from intensive aquaculture system. Sci. Total Environ. 2015, 518–519, 16–23. [Google Scholar] [CrossRef] [PubMed]
  55. Stadmark, J.; Leonardson, L. Emissions of greenhouse gases from ponds constructed for nitrogen removal. Ecol. Eng. 2005, 25, 542–551. [Google Scholar] [CrossRef]
  56. Zheng, Y.; Yu, K.; Freeman, C. Global methane and nitrous oxide emissions from terrestrial ecosystems due to multiple environmental changes. Ecosyst. Health Sustain. 2007, 1, 1–20. [Google Scholar] [CrossRef]
  57. Köhn, D.; Welpelo, C.; Günther, A.; Jurasinski, G. Drainage Ditches Contribute Considerably to the CH4 Budget of a Drained and a Rewetted Temperate Fen. Wetlands 2021, 41, 71. [Google Scholar] [CrossRef]
  58. Obrador, B.; Von Schiller, D.; Marcé, R.; Gómez-Gener, L.; Koschorreck, M.; Borrego, C.; Catalán, N. Dry habitats sustain high CO2 emissions from temporary ponds across seasons. Sci. Rep. 2018, 8, 3015. [Google Scholar] [CrossRef] [Green Version]
  59. Ma, L.; Tong, W.; Chen, H.; Sun, J.; Wu, Z.; He, F. Quantification of N2O and NO emissions from a small-scale pond-ditch circulation system for rural polluted water treatment. Sci. Total Environ. 2018, 619–620, 946–956. [Google Scholar] [CrossRef] [PubMed]
  60. Kumar, A.; Sharma, M.P. Impact of water quality on GHG emissions from Hydropower Reservoir. J. Mater. Environ. Sci. 2014, 5, 95–100. [Google Scholar]
  61. DelSontro, T.; Beaulieu, J.J.; Downing, J.A. Greenhouse gas emissions from lakes and impoundments: Upscaling in the face of global change. Limnol. Oceanogr. Lett. 2018, 3, 64–75. [Google Scholar] [CrossRef] [PubMed]
  62. Li, Y.; Shang, J.; Zhang, C.; Zhang, W.; Niu, L.; Wang, L.; Zhang, H. The role of freshwater eutrophication in greenhouse gas emissions: A review. Sci. Total Environ. 2021, 768, 144582. [Google Scholar] [CrossRef] [PubMed]
  63. Sun, H.; Lu, X.; Yu, R.; Yang, J.; Liu, X.; Cao, Z.; Zhang, Z.; Li, M.; Geng, Y. Eutrophication decreased CO2 but increased CH4 emissions from lake: A case study of a shallow Lake Ulansuhai. Water Res. 2021, 201, 117363. [Google Scholar] [CrossRef] [PubMed]
  64. Goyal, V.C.; Singh, O.; Singh, R.; Chhoden, K.; Kumar, J.; Yadav, S.; Singh, N.; Shrivastava, N.G.; Carvalho, L. Ecological health and water quality of village ponds in the subtropics limiting their use for water supply and groundwater recharge. J. Environ. Manag. 2021, 277, 111450. [Google Scholar] [CrossRef] [PubMed]
  65. Shrivastava, S.; Kanungo, V.K. Physico-Chemical Analysis of Pond Water of Surguja District, Chhattishgarh, India. Int. J. Herb. Med. 2013, 1, 35–43. [Google Scholar]
  66. Pandit, D.N.; Kumari, R.; Shitanshu, S.K. A comparative assessment of the status of Surajkund and Rani Pond, Aurangabad, Bihar, India using overall Index of Pollution and Water Quality Index. Acta Ecol. Sin. 2022, 18, 1–7. [Google Scholar] [CrossRef]
  67. Meenakshi, P.; Sriram, G. Water Quality Index and Correlation Study of Temple Ponds in Kanchipuram, Tamil Nadu, India. In Advances in Materials and Manufacturing Engineering; Springer Proceedings in Materials; Rajmohan, T., Palanikumar, K., Davim, J.P., Eds.; Springer: Singapore, 2021; Volume 7. [Google Scholar] [CrossRef]
  68. Sarkar, R.; Ghosh, A.R.; Mondal, N.K. Comparative study on physicochemical status and diversity of macrophytes and zooplanktons of two urban ponds of Chandannagar, WB, India. Appl. Water Sci. 2020, 10, 63. [Google Scholar] [CrossRef] [Green Version]
  69. Majeed, A.; Mandokhail, B.M.; Masood, Z.; Rehman, A.H.; Ullah, N.G. Assessment study about the water quality criteria and heavy metals concentrations in different fish ponds of four districts of Balochistan Province, Pakistan. Glob. Vet. 2015, 14, 351–357. [Google Scholar] [CrossRef]
  70. Ashraf, M.; Oweis, T.Y.; Razzaq, A.; Hussain, B.; Majid, A. Spatial and Temporal Analyses of Water Quality in the Dhrabi Watershed of Pakistan: Issues and Options. J. Environ. Sci. Eng. A 2012, 1, 329–340. [Google Scholar]
  71. Perron, M.A.C.; Pick, F.R. Water quality effects on dragonfly and damselfly nymph communities: A comparison of urban and natural ponds. Environ. Pollut. 2020, 263, 114472. [Google Scholar] [CrossRef] [PubMed]
  72. Perron, M.A.C.; Richmond, I.C.; Pick, F.R. Plants, water quality and land cover as drivers of Odonata assemblages in urban ponds. Sci. Total Environ. 2021, 773, 145467. [Google Scholar] [CrossRef] [PubMed]
  73. Serder, M.F.; Islam, M.S.; Hasan, M.R.; Yeasmin, M.S.; Mostafa, M.G. Assessment of coastal surface water quality for irrigation purpose. Water Pract. Technol. 2020, 15, 960–972. [Google Scholar] [CrossRef]
  74. Wurts, W.A.; Durborow, R.M. Interactions of pH, Carbon Dioxide, Alkalinity and Hardness in Fish Ponds; Publication ID SRAC 464; KSU State Extension Specialist for Aquaculture: Paducah, Kentucky, 1992; pp. 1–4. [Google Scholar]
  75. Malyan, S.K.; Bhatia, A.; Tomer, R.; Harit, R.C.; Jain, N.; Bhowmik, A.; Kaushik, R. Mitigation of yield-scaled greenhouse gas emissions from irrigated rice through Azolla, Blue-green algae, and plant growth–promoting bacteria. Environ. Sci. Pollut. Res. 2021, 28, 51425–51439. [Google Scholar] [CrossRef] [PubMed]
  76. Samarkin, V.A.; Madigan, M.T.; Bowles, M.W.; Casciotti, K.L.; Priscu, J.C.; McKay, C.P.; Joye, S.B. Abiotic nitrous oxide emission from the hypersaline Don Juan Pond in Antarctica. Nat. Geosci. 2010, 3, 341–344. [Google Scholar] [CrossRef]
  77. Mendonça, R.; Müller, R.A.; Clow, D.; Verpoorter, C.; Raymond, P.; Tranvik, L.J.; Sobek, S. Organic carbon burial in global lakes and reservoirs. Nat. Commun. 2017, 8, 1694. [Google Scholar] [CrossRef] [PubMed] [Green Version]
  78. Kumar, S.S.; Malyan, S.K.; Basu, S.; Bishnoi, N.R. Syntrophic association and performance of Clostridium, Desulfovibrio, Aeromonas and Tetrathiobacter as anodic biocatalysts for bioelectricity generation in dual chamber microbial fuel cell. Environ. Sci. Pollut. Res. 2017, 24, 16019–16030. [Google Scholar] [CrossRef] [PubMed]
  79. Badiou, P.; Page, B.; Ross, L. A comparison of water quality and greenhouse gas emissions in constructed wetlands and conventional retention basins with and without submerged macrophyte management for storm water regulation. Ecol. Eng. 2019, 127, 292–301. [Google Scholar] [CrossRef]
  80. Malyan, S.K.; Kumar, S.S.; Fagodiya, R.K.; Ghosh, P.; Kumar, A.; Singh, R.; Singh, L. Biochar for environmental sustainability in the energy-water-agroecosystem nexus. Renew. Sustain. Energy Rev. 2021, 149, 111379. [Google Scholar] [CrossRef]
  81. Bao, Q.; Liu, Z.; Zhao, M.; Hu, Y.; Li, D.; Han, C.; Zeng, C.; Chen, B.; Wei, Y.; Ma, S.; et al. Role of carbon and nutrient exports from different land uses in the aquatic carbon sequestration and eutrophication process. Sci. Total Environ. 2022, 813, 151917. [Google Scholar] [CrossRef] [PubMed]
Figure 1. Pathway of methane emissions from a pond.
Water 14 00970 g001
Table 1. Methane, carbon dioxide, and nitrous oxide flux ranges reported globally in different studies.
ReferenceLocation DetailSampling MethodologyMethaneCarbon DioxideNitrous OxideRemarks
Selvam et al. [15]Different water bodies of Tamil Nadu, Andhra Pradesh, and KeralaFloating chamber 0.1–52.1 mmol m−2 day−1−28.2 to 262.4 mmol m−2 day−1-In this study, 45 different water bodies, such as ponds, open wells, lakes, and channels were studied
Audet et al. [28]Silkeborg,
Denmark
Headspace sampling 44 µg L−11938 µg L−10.8 µg L−1In this study, authors reported the mean concentration of GHG emissions from urban ponds
Peacock et al. [29]Uppsala, SwedenFloating chamber 0.1–44.3 g CH4 m−2 year−1−36 to 4421 g CO2 m−2 year−1-Small constructed ponds and ditches
Peacock et al. [30]Uppsala, SwedenHeadspace method 0.4–174 mg CH4 m−2 year−1−187 to 3449 mg CH4 m−2 year−1-Small urban ponds
Pickard et al. [31]Bengaluru, India Headspace sampling 0.33–3413 ton CH4-C evasion year−124–5711 CO2-C
evasion tone year−1
-Inland polluted urban lakes near industrial areas
Webb et al. [32]Saskatchewan, CanadaHeadspace method 0.14–92 mmol m−2 day−121–466 mmol m−2 d−1-Small agricultural farm reservoir
Natchimthu et al. [33]Linkoping
University, Sweden
Floating chamber 3.3–15.1 mmol m−2 day−1−9.8 to 16.0 mmol m−2 day−1-Freshwater shallow pond
Singh et al. [34]Ujjain City, India Floating chamber --0.00–0.51 mg m−2 day−1Urban pond receiving domestic and
agricultural runoff
Wang et al. [35]Beijing, China Headspace sampling0.08–8.3 mmol m−2 day−1−24.2 to 37.9 mmol m−2 day−1-Urban inland water bodies such as lakes
Schrier-Uijl et al. [36]Different peats drainage ditches of Netherlands Floating method 33.7 mg m−2 h−1129.1 mg m−2 h−1-In this study, mean CH4 and CO2 emissions were reported from shallow freshwater bodies
Ortega et al. [21]Berlin, GermanyFloating chamber 385 Mg CH4 year−1--Emissions from urban ponds
Grinham et al. [16]Queensland,
Australia
Floating chamber 1.6 Mt CO2 eq. year-1 --Small artificial ponds, lakes, etc., were investigated
Wik et al. [37]733 lakes and ponds of Northern regional -1.0 Tg CH4 year−1--Findings for Beaver ponds
3.1 Tg CH4 year−1--Results of peatland ponds
16.5 Tg CH4 year−1--Total CH4 emissions from Beaver ponds, Peatland ponds, Glacial/post-glacial lakes, and Thermokarst bodies
Zhao et al. [38]Anhui Province, China Eddy covariance 1.05–1.66 µg m−2 s−10.011–0.024 mg m−2 s−1-Two small fish ponds
Table 2. Impact of different factors on greenhouse flux from water bodies.
Factors Correlation with CH4 Flux
(References)
Correlation with CO2 Flux (References)Correlation with N2O Flux (References)
Water temperature Increased exponentially up to certain limit [22,28,29,33,35,47,48,50,51]Positive [28,29,35]Positive [28,50,52]
No correlation [12,53]No correlation [47,48]-
-Negative [33]Negative [54]
Nitrate concentration No impact [51]Positive [55]Positive [51,55,56]
Negative [28,57]--
Dissolved organic matter (DOM)Positive [5,30,35,40,56,58]Positive [5,53,58]Positive correlation [5,59]
Water pH-Positive [5,60]Positive [59]
Non-significant correlation [40,46]-Non-clear correlation [52]
-Negative [4,5,30,40,46]Negative [56]
Dissolved oxygen (DO) --Positive [46,59]
No correlation [46]- -
Negative [28,29,40,56]Negative [40,46]Negative [56]
Surface area of pondNegative [5,29]-Positive [61]
Total nitrogen (TN)-Positive [46]Positive [52,56]
Total phosphorus (TP) Positive [29,30,46,57]Positive [46]Positive [46]
Sulphate Negative [12,28]--
Eutrophication Enhanced CH4 flux [22,49,62,63]Positive [62]-
-Negative [63]Negative [62]
Table 3. pH range of the water bodies at the global level.
Location of the Study/Reference Range of Water pH Remarks
Uttar Pradesh, India [64]7.2–8.2Out of 12 studied ponds, only at 1 location, the pond water pH was 9.2 (No GHG)
Chhattisgarh, India [65]6.93–7.55The authors investigated the water quality of 10 ponds (No GHG)
Bihar, India [66]6.35–7.57Pond water quality of two districts was investigated in this study. (No GHG)
Tamil Nadu, India [67]7.25–8.85Out of a total of 17 investigated temple ponds, only 2 ponds (pH 9.07 and 8.42) had a pH above 8. (No GHG)
West Bengal, India [68]7.5–7.9In this study, water quality of both rural and urban ponds was conducted. (No GHG)
Balochistan province, Pakistan [69]7.11–7.96This study conducted the assessment of the water quality of fish farming ponds of four districts of Balochistan province, Pakistan. (No GHG)
Dhrabi Watershed, Pakistan [70]7.2The study was conducted in Dhrabi reservoir of Pakistan.
Ontario, Canada [71]5.77–7.74In this study, water quality of 51 natural ponds was investigated.
National Capital Region of Canada, Canada [72]5.77–9.23In this study, water quality of 10 natural ponds and 40 stormwater constructed ponds was investigated. The pH of all-natural ponds was below 8 while higher pH was observed in stormwater constructed ponds.
Patuakhali district, coastal watershed, Bangladesh [73]7.6–7.9Water quality of coastal ponds during pre-monsoon, monsoon, and post-monsoon was reported.
Silkeborg, Denmark [28]7.5–8.0The water quality of four urban ponds was reported in this study.
Publisher’s Note: MDPI stays neutral with regard to jurisdictional claims in published maps and institutional affiliations.

