
Hydrogeochemical Characteristics Refine the Conceptual Model of Groundwater Flow in Wood Buffalo National Park, Canada


1
Department of Geology, József and Erzsébet Tóth Endowed Hydrogeology Chair, Eötvös Loránd University, Pázmány P. sétány 1/C, 1117 Budapest, Hungary
2
Department of Earth and Atmospheric Sciences, University of Alberta, 1-26 Earth Sciences Building, Edmonton, AB T6G 2E3, Canada
*
Author to whom correspondence should be addressed.
Water 2022, 14(6), 965; https://doi.org/10.3390/w14060965
Submission received: 14 February 2022
/
Revised: 11 March 2022
/
Accepted: 11 March 2022
/
Published: 18 March 2022
(This article belongs to the Special Issue From Groundwater Flow System Understanding toward Sustainable Water Management)
Abstract
:Wood Buffalo National Park (WBNP), the largest national park of Canada, has unique and complex ecosystems that depend on specific water quantity and quality. We characterize groundwaters and surface waters in WBNP by determining their chemical compositions and water types, the dominant hydrochemical processes affecting their compositions, and their hydrochemical characteristics in relation to interpreted groundwater flow systems. Total Dissolved Solid concentrations in groundwaters and surface waters range from ≤10 mg/L to ≥300,000 mg/L. Four distinct water type groups are found: (1) Ca-SO4-type waters occur in multiple clusters across the area in outcrop areas of Devonian evaporites; (2) Na-Cl-type waters predominantly occur in the Salt plains region along the central eastern boundary, overlapping evaporite and carbonate-dominated bedrock formations; (3) Ca-HCO3-type waters dominate the Peace-Athabasca Delta-region in the south and most of the central region; and (4) “mixed” waters. Solutes in the waters originate from three main processes: dissolution of halite, dissolution of sulphate minerals, and dissolution of carbonates. The spatial occurrence of hydrochemical characteristics correlate with hypothesized groundwater flow systems, i.e., Ca-SO4 and Na-Cl-type waters coincide with discharge areas of intermediate to regional groundwater flow paths, and Ca-HCO3-type waters overlap with recharge areas. The findings of this study contribute to advancing knowledge on the hydrochemical characteristics of this remote and highly protected region of Alberta, Canada, and are important components of any further, comprehensive assessment of the natural water conditions.
1. Introduction
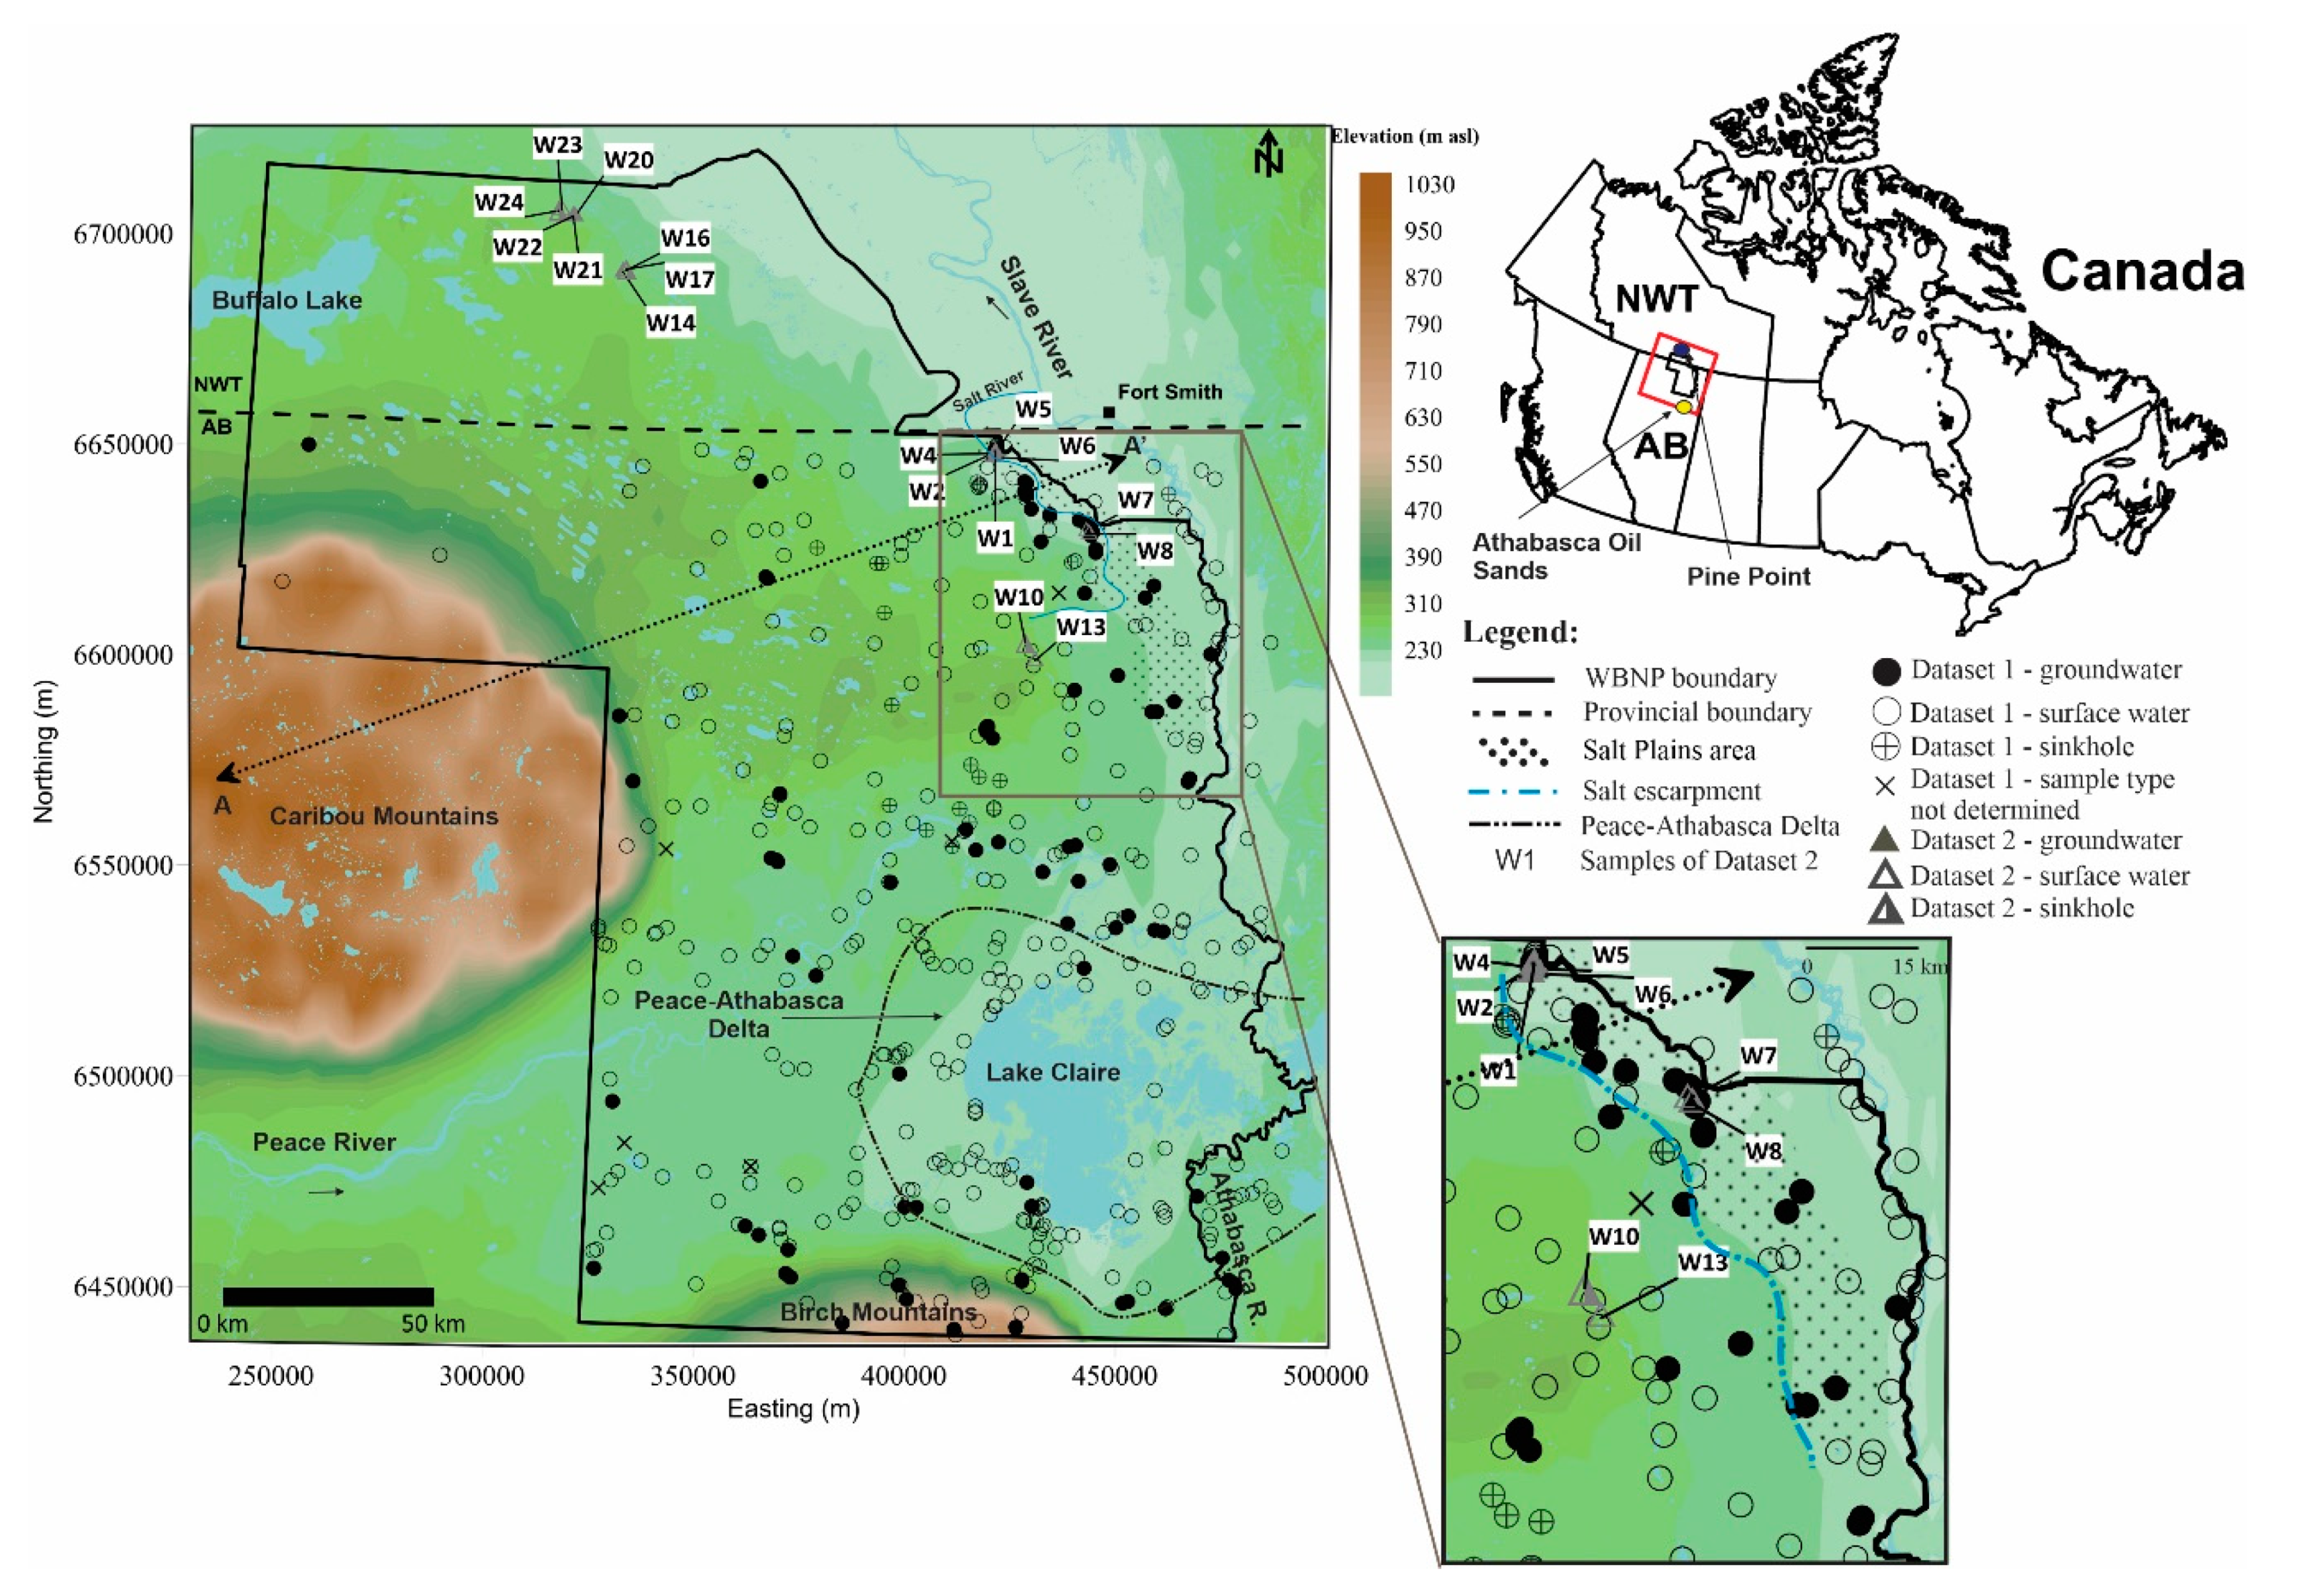
Wood Buffalo National Park (WBNP), located in Alberta (AB) and Northwest Territories (NWT), is Canada’s largest national park with an area of 44,807 km2 (Figure 1). It is a remote and hard-to-access area covered by boreal forests, extensive wetlands and prairie, with only one main road providing access to the national park. The pristine landscape exhibits some of the finest examples of gypsum karst topography of North America, extended salt plains unique in Canada, and other rare ecosystems [1]. It sustains the world’s largest free-roaming and self-regulating herd of bison and is the only remaining natural nesting area of the highly endangered whooping cranes [2]. The park also contains one of the world’s largest inland deltas, Peace-Athabasca Delta (PAD), and is a UNESCO World Heritage site [1]. Both PAD and the nesting area of the whooping cranes are declared Wetlands of International Importance under the Ramsar Convention [3]. Understanding the processes governing and maintaining its natural conditions is critical to protecting its fragile ecological and cultural integrity.
Despite its international recognition, there is currently no comprehensive, spatially broad hydrogeological compilation or assessment published for WBNP. Consequently, advancing our scientific knowledge on the natural processes has become a growing priority. It is one of the few areas in Alberta that was not mapped in its entirety by the Alberta Research Council (ARC) in their province-wide hydrogeological mapping program conducted in the 1970s and 1980s [4]. Hydrogeological characterization by the ARC, with an accompanying map, exists only for the northern Caribou Mountains in the western region of WBNP covering only a minimal portion of the park [5].
Disturbances such as oil-sand mining in the Athabasca Oil Sands (AOS) region immediately south of WBNP (Figure 1), upstream development of three (including one under construction) hydroelectric dams on the Peace River west of WBNP, and the impact of climate change are three significant factors that may affect the national park’s fragile ecosystem [6]. So that natural conditions are thoroughly characterized, and the potential impact of these activities assessed, the World Heritage Committee (WHC) [6] released a list of international recommendations recognizing water as one of the most essential and vulnerable contributors to the park’s unique ecosystems. Consequently, a comprehensive assessment of natural water conditions is required to provide a fundamental basis for future mitigations of external environmental effects and for the protection of water dependent ecosystems in WBNP.
Several local studies have reported on groundwater flow dynamics and hydrochemistry in the region; however, these studies included only small parts of WBNP either as a local study or as a peripheral region to a larger study site [5,7,8,9,10,11,12,13].
The earliest hydrogeologic study in WBNP appears to be by Drake [7] who proposed three “hydrologic zones”: (1) the Caribou Mountains with good surface drainage (zone 1); (2) waterlogged muskeg zone between the Caribou Mountains and the escarpment with poor surface drainage (zone 2); (3) and a drier drift zone in the vicinity of the escarpment with a proposed discharge area of local and regional/intermediate groundwater flow systems at the base of the escarpment (zone 3).
Tsui [9] and Tsui and Cruden [11] concluded that the fresh and salt springs discharging near the salt escarpment are controlled by local, intermediate, and regional flow systems recharging zone 1, zone 2 and zone 3. They also proposed that groundwater recharge in Caribou Mountains flows through the halite in Cold Lake Formation, where it evolves to brine and discharges between the escarpment and the Slave River.
Weyer and colleagues [10,14] studied local and regional groundwater flow in the Pine Point region, immediately north of WBNP (Figure 1), and argued that the Caribou Mountains (zone 1) act as a regional recharge area where water penetrates the Devonian strata and discharges at regional discharge areas, such as Salt River and the Slave River along the eastern edge of WBNP. They concluded that the chemistry of discharging groundwater between Hay River (not shown in Figure 1) and Slave River could be derived from three types of water: calcium-bicarbonate, calcium-sulphate-bicarbonate, and sodium-chloride [14].
Stein studied the central portion of WBNP and delineated focused and diffuse recharge and discharge areas based on observations of natural groundwater phenomena and hydrochemistry [8]. Those preliminary results, however, remained unpublished (Stein, personal communication).
Within the scope of hydrological and ecological investigations, interaction between surface waters and groundwater, as well as possible impacts on the whooping crane resting grounds due to dewatering operations north of WBNP and climate change were studied in the northeast and in PAD in the south (e.g., [15,16,17,18]). Nobert and Barrie concluded that there is a significant influx of groundwater to ponds in the northeastern wetland area [16]. Nielsen found that PAD is dominated by local flow systems and that regional flow systems from the Caribou and Birch Mountains have little to no effect on the local flow regime at the land surface due to the presence of low-permeability shale near surface [15]. They also concluded that groundwater interaction between water bodies in the PAD region is negligible. This is supported by Peters who reported insignificant groundwater flux in perched basins in PAD [18].
The main objective of this study is to characterize the hydrochemical conditions of groundwaters and surface waters of WBNP and to understand their potential interactions with geological conditions and hydrogeological systems. An integrated dataset resulting from archive and recent field campaigns was used to characterize and define spatial distributions of total dissolved solids (TDS) and hydrochemical water types, as well as to determine water origin, and the governing processes of rock-water interactions and their effects on the chemical composition of waters. As a result, areas of enhanced interaction between surface waters and groundwater are identified and previous conceptualizations of groundwater flow patterns are updated with the dominant hydrochemical characteristics of groundwaters and surface waters observed in the region. The results indicate the composition and flowpaths of subsurface fluids, and their connection to surface waters in the region, which help to define the role of water and solutes in the ecological and hydrological integrity of WBNP.
2. Geographical, Geological and Hydrogeological Setting
2.1. Physiography and Climate
The physiography of the national park is characterized by two highland areas with topographic elevations over 1030 m above sea level (asl), the Caribou Mountains in the west and the Birch Mountains along the southern boundary (Figure 1). The Slave River flows south to north along the eastern boundary. The Peace River separates the northern areas from the mostly wetland-dominated southern part of the region and the Athabasca River enters the area from the south; both rivers empty into PAD (Figure 1). The largest lake is Lake Claire, in PAD. Topographic elevations gradually decline from the foot of the Caribou Mountains to a steep escarpment near the eastern boundary, approximately 30 km west of Fort Smith. The escarpment extends southwards from the Slave River and separates the Salt Plains and the Slave River lowlands from the upland region of WBNP.
The study area is in the Boreal Forest Natural Region [19]. The climatic conditions of the study area are characterized by long, cold winters and relatively short, cool-to-warm summers with the mean annual temperature ranging from +0.2 °C to −3.6 °C, depending on subregion. Annual total precipitation ranges from 377 mm to 512 mm. Evapotranspiration and related moisture deficit or surplus conditions are variable and depend on subregion [19]. The climate favours retention and accumulation of organic material, such that more than 75% of the area is covered by peatlands [20]. The peat plateaux are often covered by wetlands, including fens and bogs. Low temperatures and the insulating effect of peat layers contribute to discontinuous permafrost with less than 10% ice content in the upper 10 to 20 m of the ground [21].
2.2. Geology and Hydrostratigraphy
WBNP sits on the northeastern edge of the Western Canadian Sedimentary Basin (WCSB). The following summary of the geology and stratigraphy is based on regional characterizations of WCSB strata [22,23,24], regional and local studies [25,26,27], regional (1:1,000,000 scale) bedrock and surficial geology maps of Alberta [28,29,30,31], and higher resolution (1:250,000 scale) characterizations of surficial materials [32,33,34,35,36,37]. The hydrostratigraphy is based on works from Bachu and Underschultz [38] and Bachu [39].
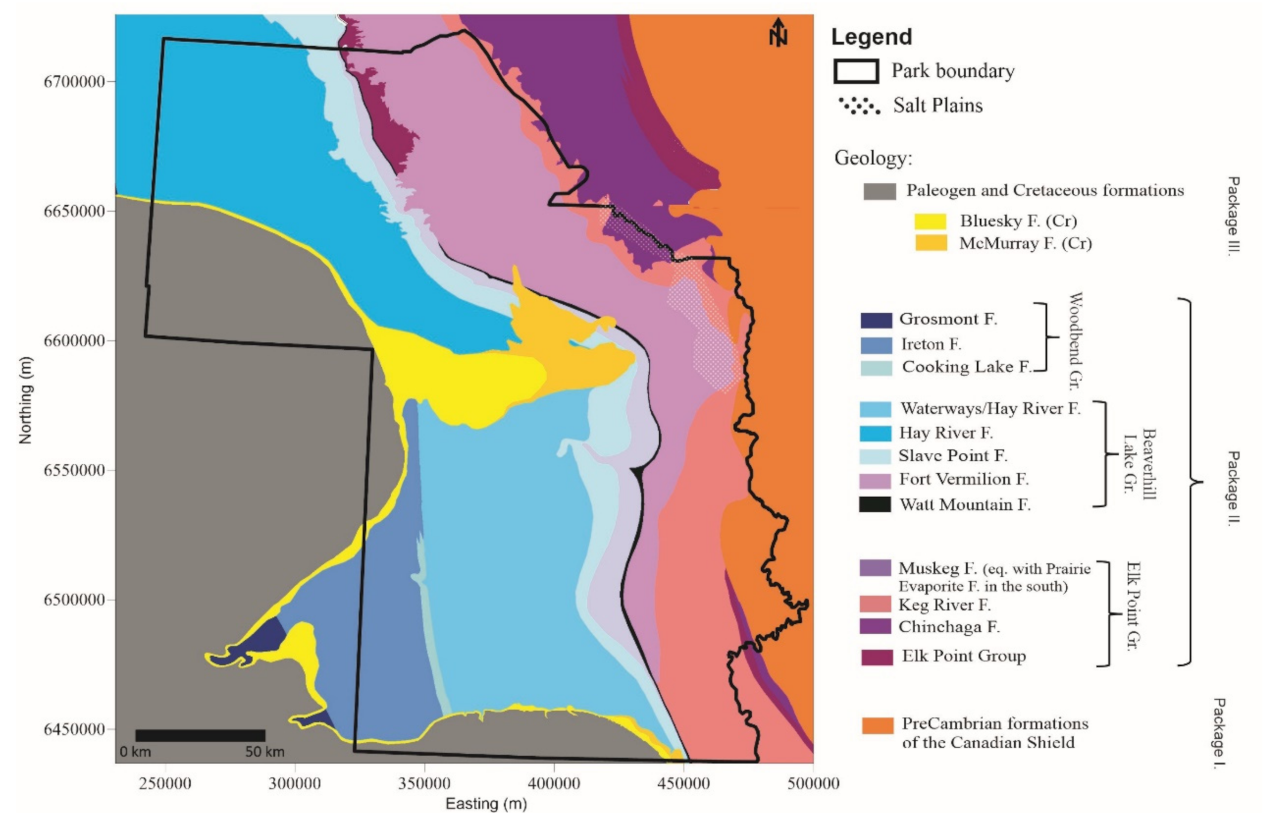
Combining the regional and local-scale mapping, the overall geology and hydrostratigraphy of the area (Figure 2 and Figure 3) can be characterized by four major geologic packages:
Package I. Crystalline Precambrian rocks of the Canadian Shield. The upper contact of these igneous and metamorphic rocks dips to the southwest. They crop out in the eastern margin of WBNP and are considered an aquiclude.
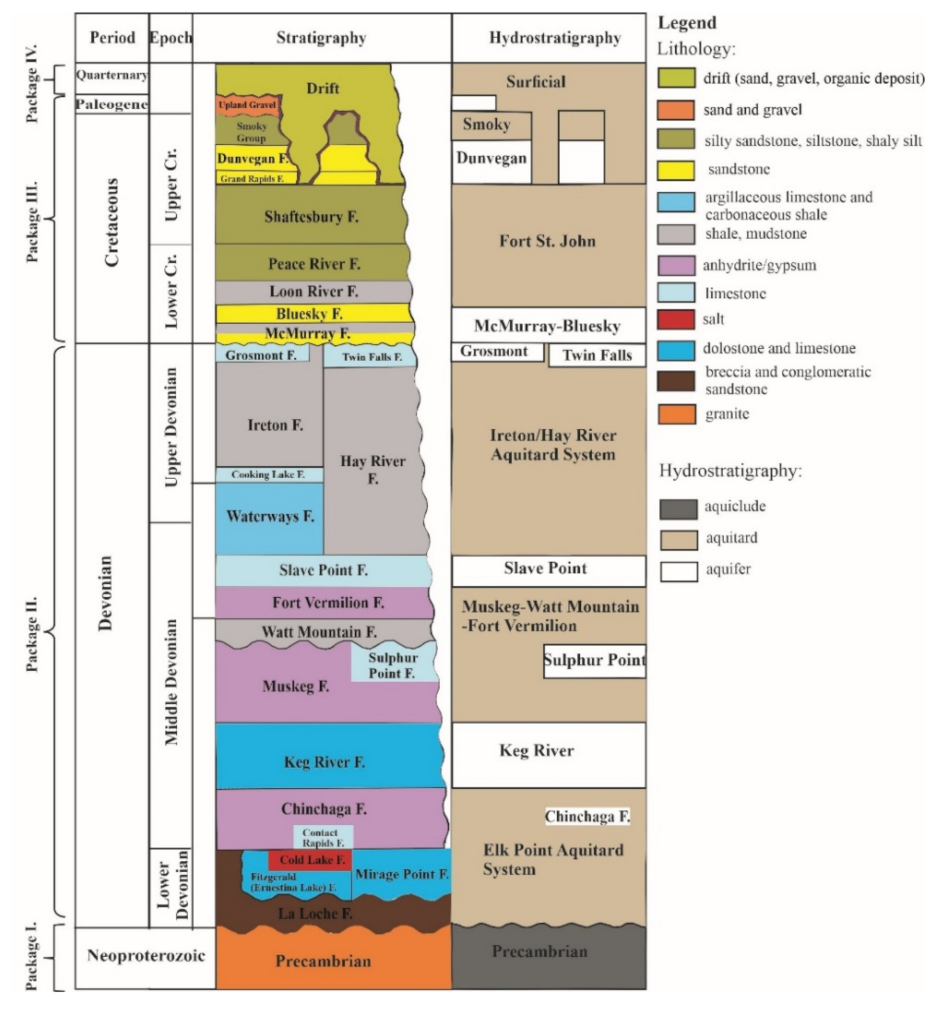
Package II. Devonian-aged strata. These sedimentary rocks dip to the southwest and are the dominant bedrock in WBNP. They are composed of carbonates, evaporites and shales, and are divided into three geological groups: Elk Point, Beaverhill Lake and Woodbend Groups. The Cold Lake Formation is part of the Elk Point Group consisting of halite and reaching up to 80 m in the Caribou Mountains area and gradually becoming thinner eastward due to subsurface dissolution [40].
Three regionally extensive evaporite strata are present (Figure 2 and Figure 3). The Chinchaga Formation, consisting of mostly anhydrite and gypsum, underlies the Salt Plains. The Muskeg Formation, composed dominantly of gypsum, is stratigraphically equivalent with the Prairie Evaporite Formation elsewhere where it is characterized by variable halite content, ranging from 5–10% in north to >40% in south Alberta [40]. The Fort Vermilion Formation consists mostly of anhydrite. Hydrostratigraphically, these strata are considered aquitards.
The Devonian package also includes two regionally extensive carbonate formations, i.e., the Keg River and Slave Point Formations, and three shale layers, i.e., Watt Mountain, Hay River and Ireton Formations (Figure 2 and Figure 3). The two regionally extensive carbonate formations are considered aquifers; the shale layers are aquitards.
Package III. Cretaceous siliciclastic deposits that unconformably overlie the Devonian strata. These sedimentary rocks only occur in the Caribou and Birch Mountains regions, in the west and south, and in a tongue-shaped remnant of Bluesky and McMurray Formations, in the central portion of WBNP (Figure 2). Hydrostratigraphically these two latter formations are considered aquifers (Figure 3).
Package IV. Unconsolidated surficial material of Quaternary and/or recent age. These deposits vary in thickness from 1 to 45 m over most of the lowlands, but locally reach 50 to 150 m in upland areas [30,41]. Quaternary/recent materials are dominantly glaciolacustrine and moraine sediments, but areas of aeolian, fluvial and lacustrine sediments are found. Fine-grained deposits are often overlain by organic material (peat) that often behave as water-retarding layers and are considered aquitards (Figure 3).
3. Data and Methods
3.1. Data
This study is based on two chemistry datasets. Sampling locations are shown on Figure 1. Dataset 1 consists of archive water chemical data collected from 1974 to 1978 by the Alberta Research Council and recently published by Alberta Geological Survey (AGS). The published digital release [44] contains chemical data for 489 samples collected from various types of sampling locations in the central and southern regions of the study area from which chemical data for 465 samples were used in this study (for details on data culling see Section 3.2). The breakdown by sample location type is outlined in Table 1, where some have been further categorized and merged into larger, more general sample type classes. Sinkhole samples are listed separately as they can represent both groundwater and surface water.
Dataset 2 consists of samples collected specifically for this study in the summer of 2013. A total of 17 samples were analyzed and designed to supplement the archive dataset. They were used to determine hydrochemical characteristics (e.g., total dissolved solids (TDS) and hydrochemical facies) of waters and were analyzed for isotopic compositions. The location type and number of the water samples in Dataset 2 are listed in Table 1. Measured and calculated chemical parameters are shown in Table 2.
Stewart [44] provided information on data collection methods for Dataset 1. For Dataset 2 samples were collected by hand, either directly or using a telescopic water sampling. Springs were sampled as close to the source as possible to minimize dilution effects from precipitation or shallow groundwater influx. Samples from surface-water bodies were sampled as far from shore as practical and safe.
Samples in Dataset 2 were split for hydrochemical analysis, filtered through 0.45 μm filters as necessary, and stored in 50 mL polypropylene centrifuge tubes with plug seal caps in cool, dark conditions until transported to the laboratory. Field parameters (i.e., pH, temperature, and electrical conductivity) were measured at the sampling sites using a portable Oakton pH/CON 300 m, which was calibrated periodically. Samples collected for analysis of major cations were acidified to pH < 2 with ultrapure nitric acid. Samples for analysis of stable isotopes were collected in 50 mL polypropylene centrifuge tubes tightly capped and stored unpreserved.
All samples (including Dataset 1 and Dataset 2) were collected for analysis of major ions (Ca2+, Mg2+, Na+, K+, Cl−, SO42−, HCO3−, and CO32−). In addition to major ions, the 17 samples in Dataset 2 were analyzed for minor elements and stable isotopes of hydrogen and oxygen. Stewart [44] provides information on analytical techniques for Dataset 1. The samples of Dataset 2 were analyzed by the Isobrine Solutions laboratory, Edmonton. They were analyzed for major dissolved metals by Inductively Coupled Plasma/Mass Spectrometry method (APHA 3125B/USEPA 200.8). Alkalinity (HCO3−) was measured by Titration Method (2320B) [45]. Concentrations of dissolved Cl−, Br− and SO42− were analyzed by a Dionex ICS-2010 Ion Chromatograph equipped with IonPack AS18 column, an AS18 guard column and AS-DV autosampler. Reproducibility for dissolved Cl−, Br−, and SO42− is better or equal to ± 5% (± 1σ). Trace dissolved metals were analyzed by Inductively Coupled Plasma (ICP) Method (3120B) [45]. Standard analytical error is equal to or better than 10% (±1σ) for the trace elements and can be higher (e.g., >20%) when close to the detection limits of the trace elements. Stable isotope compositions of hydrogen and oxygen (V-SMOW) were performed on a Cavity Ring Down Spectroscope (CRDS) Picarro L2130-i. Measurement uncertainty was ±0.15‰ for δ18O and 0.7‰ for δ2H.
3.2. Data Validation and Evaluation Methods
After charge balance error (CBE) check (acceptance criterion of ±10%), data for 466 samples from the raw data of Dataset 1 and all 17 samples from Dataset 2 were retained for interpretation. Calculated CBE values for Dataset 2 samples are shown in Table 2. One sample was removed from Dataset 1 due to an anomalous concentration value associated with one of the measured parameters, resulting in 482 samples available for further data analyses.
Data evaluation methods and workflow are shown in Figure 4. TDS concentrations were grouped into five classes, i.e., waters with TDS less than 1000 mg/L, 1000–5000 mg/L, 5000–10,000 mg/L, 10,000–100,000 mg/L, and greater than 100,000 mg/L. Water types were determined using the ratio of each main anion and cation in each sample. For Ca-HCO3, Ca-SO4, Na-Cl and Na-HCO3 type waters Ca2++Mg2+ or Na++K+ and HCO3−+CO32−, SO42− or Cl− dominate the ionic composition with ratios ≥80% relative to the remainder of the cations or anions, respectively. Waters containing less than 80% of the major cations (Ca2++Mg2+, Na++K+) and anions (HCO3−+CO32−, SO42−, Cl−) were merged into the “mixed” water type. The evolution of groundwaters within the “mixed” water type group is not examined in detail in this study. For analyzing and visualizing data, AquaChem (Waterloo Hydrogeologic) software was used.
Isotope ratios of hydrogen and oxygen are reported using delta (δ) notation and were used to characterize the origin of water (e.g., local meteoric water, formation waters), and examine the potential effect of evaporation [48,49]. Local Meteoric Water Line (LMWL) was constructed from the isotopic composition of precipitation measured for Fort Smith, NWT [50]. The average weighted δ18O and δ2H values in precipitation for Fort Smith is 19.0‰ and −148‰, respectively [51].
The nature of mechanisms that potentially affected the hydrochemistry of waters were evaluated by ion relations. Na+-Cl−-Br− log-ratios were used to elucidate the possible sources of Na and Cl in groundwaters and surface waters (i.e., halite dissolution or seawater evaporation) in the study area. The Na+-Cl-Br− log-ratios were represented by molar concentration data are converted to orthonormal (z1 and z2) coordinates [46]:
Coordinate z1 is a measure of depletion or enrichment of Na+ relative to Cl−, whereas z2 compares the ratio of Na+ and Cl− relative to Br−. Only data from Dataset 2 were used in this analysis because Br− measurements are required.
Ca-excess and Na-deficit correlations help to understand and elucidate the origin of excess Ca in the waters [47,52]. The Ca-excess and Na-deficit of samples are calculated as follows:
where meas and sw refer to concentrations measured in sample and in seawater, respectively, in mg/L [52]. Ca-excess and Na-deficit values are compared to Ca-excess and Na-deficit trends calculated for gypsum dissolution/dolomitization and albitization that both exhibit elevated Ca excess relative to seawater, and to halite dissolution and seawater evaporation trends that represent decreased Caexcess and Nadeficit [47].
The origin of solutes in Ca-HCO3 type waters was examined by correlating Ca2++Mg2+ and CO32−+HCO3− concentrations according to the dissolution reactions of carbonate minerals [53].
In the analyses of isotopic compositions and source of solutes sinkhole samples are presented together with surface waters.
4. Results
4.1. Total Dissolved Solids Content and Hydrochemical Water Types
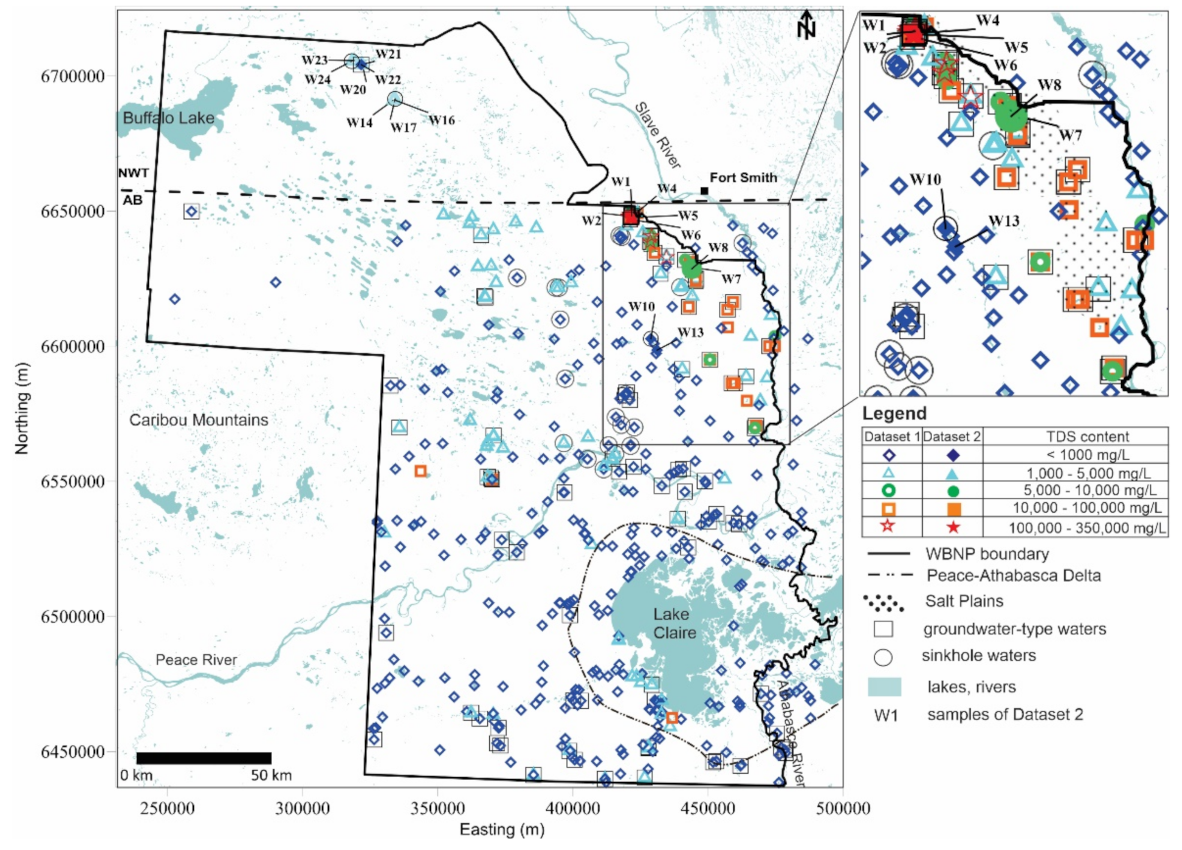
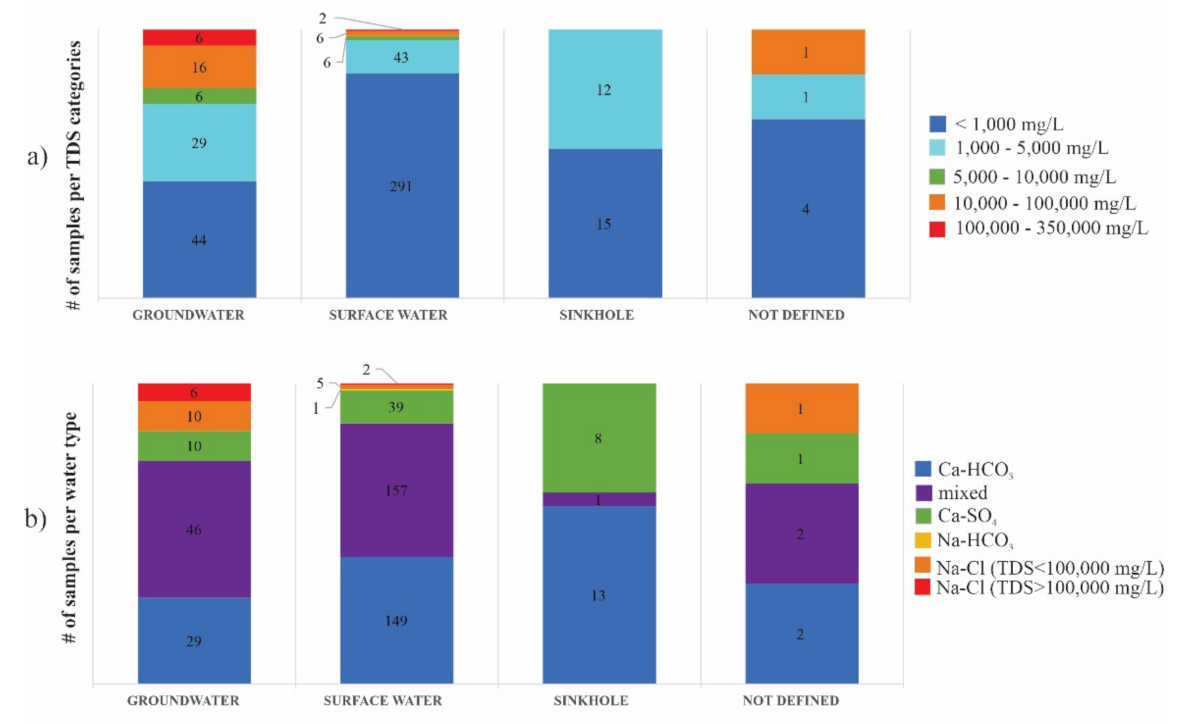
Total dissolved solids (TDS) content shows appreciable variability in WBNP. TDS of groundwater-type waters ranged from 5 mg/L to 331,000 mg/L (Figure 5). Most of the highest TDS contents (>300,000 mg/L) were found in the Salt Plains region (Figure 5 and Figure 6a). TDS of surface waters ranged from 8 mg/L to 307,000 mg/L. Most surface water samples had TDS content less than 1000 mg/L and spatially dominate much of the central region and almost the entire southern part of WBNP. Sinkhole samples group into two TDS categories; they had either <1000 mg/L or 1000–5000 mg/L TDS content (Figure 5 and Figure 6a). Clusters of waters with elevated TDS content (1000–5000 mg/L) occurred in the central part and near the AB-NWT border, as well as north of and along the southwestern shore of the Lake Claire in the south, in addition to one sample with 10,000–100,000 mg/L TDS. Spatially, the Salt Plains region showed the highest variability in TDS content exhibiting examples from each TDS categories.
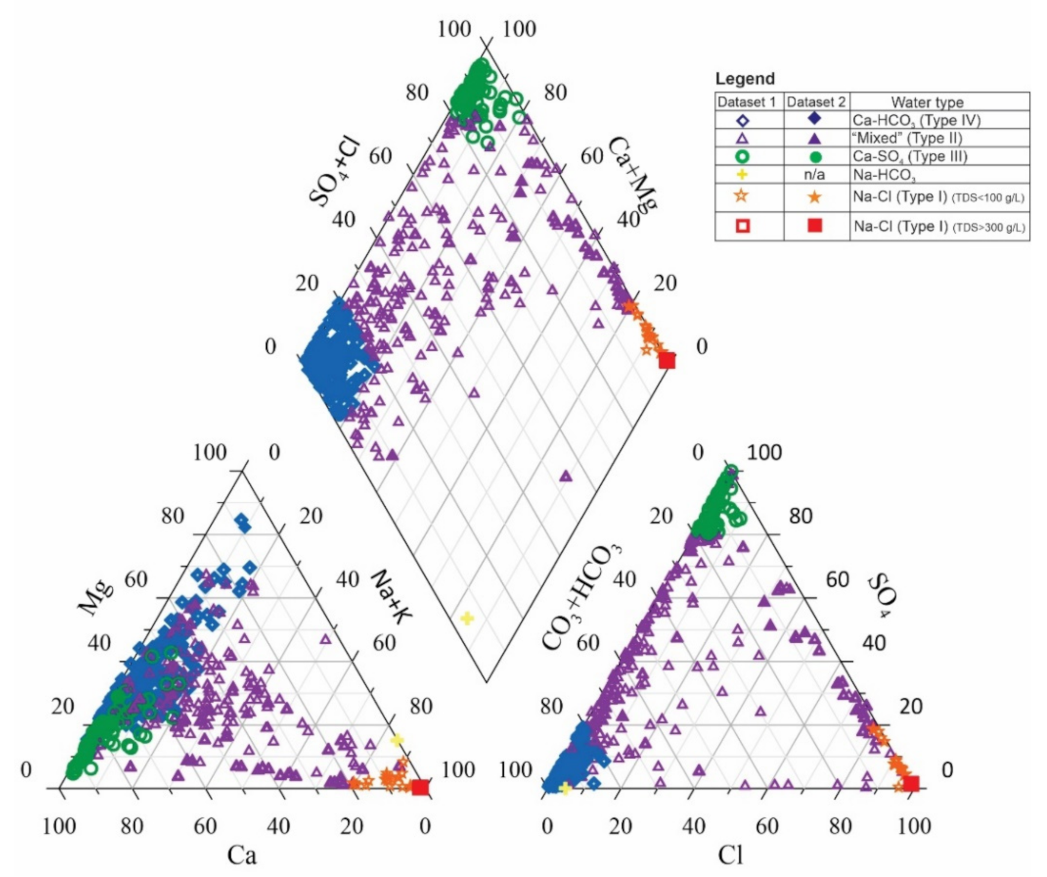
Waters in WBNP were grouped in five water type classes: Na-Cl-type (Type I) waters, “mixed” (Type II) waters, Ca-SO4-type (Type III) waters, Ca-HCO3-type (Type IV) waters, and Na-HCO3 (Type V) waters (Figure 7 and Figure 8, Table 2). The Type V waters occurred only in one archive sample and was not identified amongst the newly collected samples. Therefore, Type V group was not included in the analyses of the solute sources (Figure 6b).
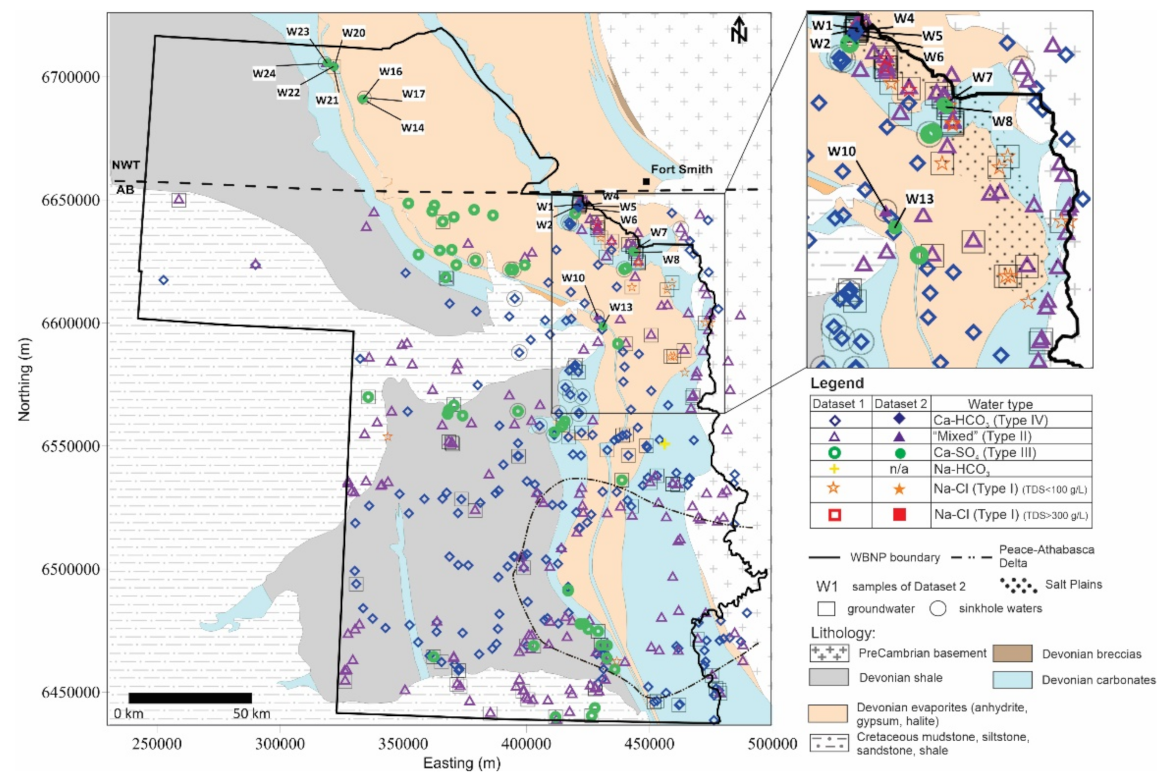
The spatial distribution of Na-Cl type waters (Type I) demonstrate they are almost exclusively found in the Salt Plains area, along the central-eastern boundary of the study region, except for one sample in west and one in the south (Figure 8). There are two distinctly separate groups of the Na-Cl type waters in the Salt Plains showing either very high (>300,000 mg/L) or considerably lower (<100,000 mg/L) TDS content with no intermediate concentrations between the two “end-members” (Figure 8). Waters with TDS < 100,000 mg/L span the entire Salt Plains with one additional data point in each of the west and south. Distinct clusters of Ca-SO4 waters (Type III) are seen at multiple locations in the northern, central and southern area. Most of the study area is dominated by Ca-HCO3 type waters (Type IV), while waters of “mixed” water type (Type II) are scattered over the entire area (Figure 8). In general, the spatial variability of the water types is highest in the Salt Plains area and vicinity, similarly to the TDS distribution, shown on the inset map.
The distribution of each water type in the different sample type categories is shown in Figure 6b. Each water type is represented by all sample type categories, except Na-Cl water type that does not occur in sinkhole samples. The Na-Cl water type is most typical in groundwaters. Most sinkhole samples represent either Ca-HCO3 or Ca-SO4 type waters, with one sample of “mixed” water type.
4.2. Isotopic Composition
Stable isotope ratios of oxygen and hydrogen in the 17 newly collected samples were examined. The measured δ18O and δ2H values of WBNP waters in comparison with the local meteoric water line (LMWL) and the local evaporation line (LEL) (after Ref. [54]) are shown in Figure 9. Sinkhole samples are presented together with surface waters. The LEL for PAD region [54] was used because there are insufficient data available for other regions of WBNP.
Isotope results showed a typical near-linear relationship between δ18O and δ2H, with overall δ18O and δ2H values ranging from −23.1‰ to −7.1‰ and from −179‰ to −102‰, respectively. The lowest values (−23.1 for δ18O and −179‰ for δ2H) were found in the northernmost groundwater (spring) sample W21, while the highest values (−7.1‰ for δ18O and −102‰ for δ2H) were found in lake sample W13 located in the central region (Figure 1, Table 2).
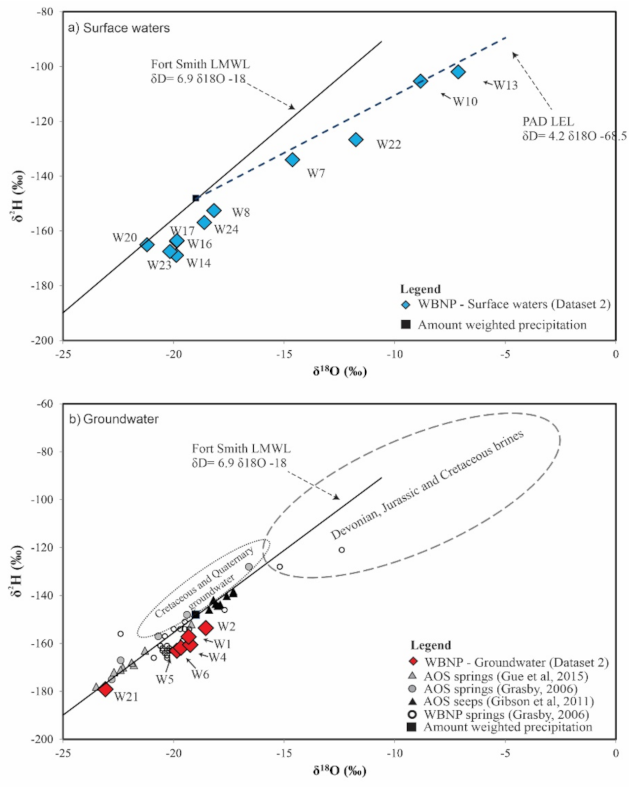
Surface waters form two distinct groups (Figure 9a). The first group, including W8, W14, W16, W17, W20 and W23, clusters near the LMWL and correlate with average isotopic composition of local precipitation. The second group, including W7, W22, W10 and W13, shows considerably higher δ18O and δ2H values than the average isotopic composition of local precipitation and follow the LEL. Sample W22 plots below the LEL.
Most groundwater samples, including W1, W2, W4, W5 and W6, cluster around the average isotopic composition of local precipitation, although they are offset slightly to the right of the LMWL (Figure 9b). Groundwater sample W21 shows considerably lower δ18O and δ2H values than the other groundwater samples. This sample is the only one collected in NWT and represents the northernmost sampling site.
4.3. Solute Ratios
In the following section the most important processes affecting the hydrochemical composition of waters is analyzed to elucidate the source of solutes in the four different water types found in the study area. Considering the lithology of the bedrock, the three possible sources of solutes in the waters in WBNP are: (a) dissolution of halite, (b) dissolution of sulphate minerals (gypsum/anhydrite), and (c) dissolution of carbonates.
4.3.1. Sodium and Chloride in Type I and Type II Waters
All Na-Cl type waters (W1, W5, W6 and W8) (Type I) exhibit elevated Na+ and Cl− ratios relative to Br− and plot along the halite dissolution trend above the halite saturation point (Figure 10). From the “mixed” type waters (Type II), the first group (W2 and W4) referred as Type IIa plots on the halite dissolution. The second (W7) (Type IIb) and third type (W13) (Type IIc) of “mixed” waters, as well as the Ca-SO4 (Type III) and Ca-HCO3-type (Type IV) waters do not follow either the halite or the seawater dissolution line.
4.3.2. Calcium in Type II and Type III Waters
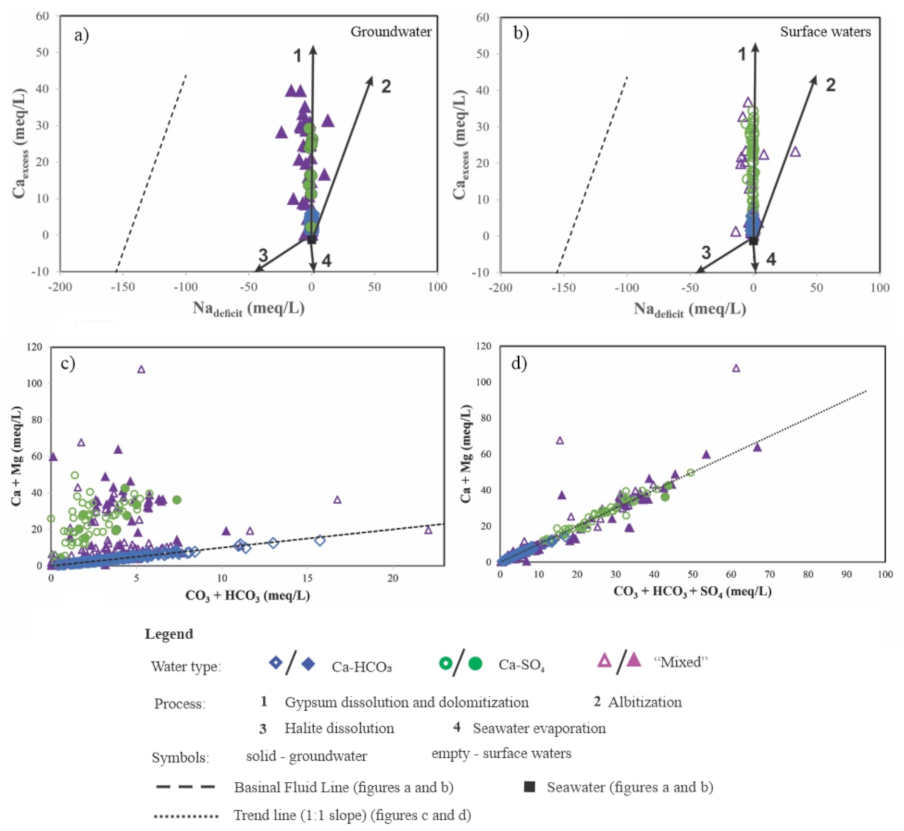
Figure 11a,b show the Ca-excess and Na-deficit of Type II (“mixed”), Type III (Ca-SO4) and Type IV (Ca-HCO3) groundwaters (a) and surface waters (b).
Ca-SO4 type and “mixed” groundwaters do not exhibit Nadeficit compared to seawater, but they do indicate increased Caexcess and plot along trend line 1. The same results are shown by surface waters, except for a few of “mixed” water samples showing slightly more or less Nadeficit than the rest of the samples in the group. In both groundwaters and surface waters, Ca-HCO3 type waters plot near seawater and show zero or close to zero Nadeficit and Caexcess.
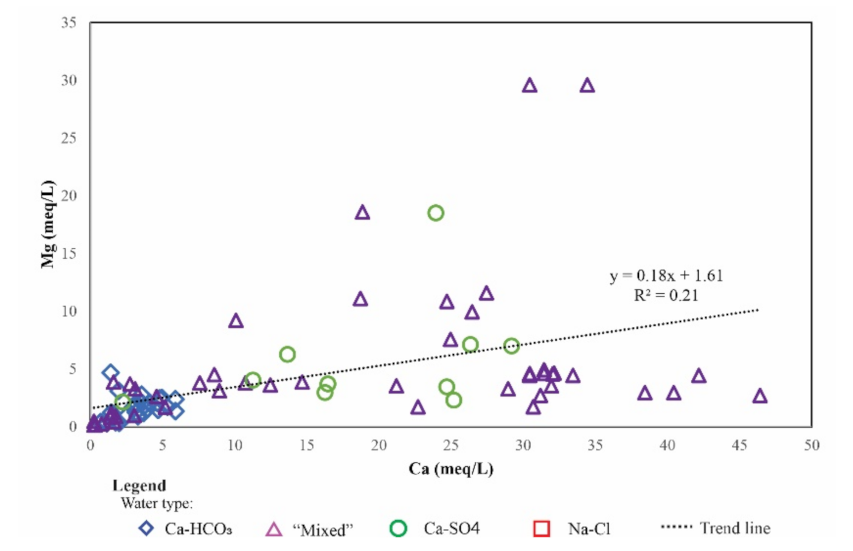
By looking at the correlation between magnesium and calcium in groundwaters in WBNP, it was found that there is a positive correlation between these ions (Figure 12).
4.3.3. Calcium and Bicarbonate in Type IV Waters
Type IV. (Ca-HCO3-type) waters did not show correlation with any of the processes presented in the diagrams of Ca-Na and Na-Br-Cl relations (Figure 10 and Figure 11). To examine carbonate minerals, such as calcite and dolomite, as potential source of solutes, correlation between Ca2++Mg2+ and CO32−+HCO3− concentrations in Type IV. (Ca-HCO3), as well as in Type III (Ca-SO4) and Type II (“mixed”) groundwaters and surface waters was analyzed (Figure 11c). Results show that Ca-HCO3 type waters fall on the 1:1 line where the total Ca2++Mg2+ concentration is balanced by that of CO32++HCO3−. In case of Ca-SO4 and “mixed” waters, data do not fall on the 1:1 trend line and exhibit elevated Ca2++Mg2+ concentrations relative to the Ca-HCO3 type waters. When gypsum dissolution is also included in the ion ratios “mixed” and Ca-SO4 waters show good correlation and fall on the 1:1 slope (Figure 11d).
5. Discussion
5.1. Total Dissolved Solids Content and Hydrochemical Water Types
The spatial distribution of clusters of Ca-SO4 type waters coincides with members of similarly distinct groups of waters with TDS concentrations between 1000 and 5000 mg/L (Figure 5). These clusters in the northern region and near the AB-NWT provincial boundary clearly overlap the Devonian evaporite outcrops. Other clusters of the Ca-SO4 type waters (e.g., one near the southern boundary of the park) do not appear to follow evaporite outcrops.
Waters with TDS > 300,000 mg/L are only present in the northern Salt Plain area. They correspond to the outcrop area of the anhydrite-dominated and, in minor amounts, halite-bearing Chinchaga Formation. Waters with TDS < 100,000 mg/L show no apparent relation to one specific formation or lithology; they correspond to the spatial distribution of the carbonate-dominated Keg River and the anhydrite/gypsum-dominated Muskeg Formations (Figure 3). The spatial distribution of Ca-HCO3 type water follows that of the waters with low TDS values (<1000 mg/L) (Figure 5). The remainder of the water types do not show apparent connections to bedrock lithology.
The spatial distribution of Ca-SO4 and Ca-HCO3 type sinkhole waters in the north-central and in the central area, respectively, overlap with outcrops of Devonian evaporites and carbonates. This agrees with Drake’s observation that sinkholes in the area overlaps with an arched “belt” following Devonian evaporite and carbonate strata [7]. The sharp separation in water types for sinkhole samples indicates these waters may originate from two different water sources and/or have different rock-water interaction histories. While sinkholes with Ca-SO4 type water are most likely fed by groundwater, the Ca-HCO3 type waters may indicate that these waters are either fed by precipitation, or they are fed by groundwater and are located in the terminal zone of short, shallow flow paths in a carbonate-dominated medium.
The spatial distribution of waters with >100,000 mg/L TDS content in the Salt Plains coincide with findings of Grasby and Grasby and Chen [12,13] The water types observed in WBNP correspond to those identified in groundwaters north of WBNP [10,14]. Weyer associated Ca and SO4-dominated and Na-Cl type waters with discharge of intermediate and regional flow systems [10]. The spatial distribution of fresh, Ca-HCO3 and brackish, Ca-SO4 type waters in the central region corresponds to the focused and diffuse recharge areas and the diffuse discharge areas identified by Stein [8]. The Na-Cl type water-dominated Salt Plains region coincide with the highly saline groundwater discharge area described previously, the source of which was thought to be more distant than that of springs with lower TDS in the same region [8].
5.2. Isotopic Composition
Surface waters plotting close to the local average weighted δ18O and δ2H values in precipitation show local meteoric origin. They belong to the same cluster as most groundwater samples suggesting that (1) these surface water bodies and groundwaters are hydraulically connected or (2) these surface waters and the isotopically similar groundwaters have similar water source (i.e., isotopically altered meteoric water). Surface water samples that follow the LEL were derived mostly from direct local precipitation that was subsequently altered by varying amount of evaporation. Samples W10 and W13 are affected by evaporation the most, while samples W22 and W7 are the least evaporated (Figure 9a).
In case of surface water sample W7, the data suggest connection to direct precipitation and evaporation. Based on its high salinity and elevated Br content (Table 2), however, it can be assumed that it is also fed by hydrochemically more evolved groundwater, in addition to direct precipitation. Sample W22 is one of the most northernmost samples; its shift from the LEL calculated for PAD region may indicate that this water lies on a different evaporation line and originates from a more isotopically depleted source. Although this is cannot be proved based on one sample.
The isotopic ratios in groundwaters and their clustering around the average isotopic composition of local precipitation suggest that the source of the groundwaters in WBNP is dominated by local meteoric water. Precipitation in colder regions will be depleted in heavy isotopes compared to relatively warmer regions resulting in more negative δ18O and δ2H values because cold air masses cannot hold as much water as they held in warmer areas [60]. Therefore, infiltration at higher latitudes may explain the lower-than-average δ18O and δ2H values in sample W21. Despite the slight shift from the LMWL in the case of samples W1, W2, W4, W5 and W6, their isotopic compositions fit the range of isotopic compositions measured in local precipitation at Fort Smith [50]. It is interesting, however, that waters with considerably high (i.e., samples W1, W5 and W6) and less elevated (i.e., W2 and W4) TDS content plot in the same cluster suggesting similar water sources, i.e., local meteoric water. An alternative explanation may be that isotopic compositions of samples W1, W5 and W6 fit a different meteoric water line and their current compositions reflect an already altered isotopic composition that evolved due to rock-water interactions along their flow paths from a potentially more depleted meteoric water.
Groundwater samples show distinct isotopic compositions compared to those of the brines in Devonian and Jurassic-Cretaceous-aged formations elsewhere in the Alberta basin [55,56]. They reflect a modern meteoric origin and are different from these formation waters (Figure 9b). The isotopic ratios in groundwater samples in WBNP fall within the range of those from springs in AOS region immediately to the south [13,49], however most AOS spring samples exhibit a lower isotopic ratio than WBNP spring samples. The proximity of the δ18O and δ2H values to the regional amount-weighted average precipitation suggests that the subglacial recharge associated with the lower-than-average isotopic composition of brine and saline springs along the eastern and northern erosional edge of the WCSB [12] and in the AOS region, did not affect the springs in WBNP [49,58]. This agrees with previous findings that water from springs in WBNP represent present-day salt dissolution processes [12].
5.3. Source of Solutes
Na-Cl type waters plotting on the halite dissolution trend indicate that Na, Cl and Br solutes in these waters originate from halite dissolution (Figure 10). Their relative location to the halite saturation point in the diagram can be explained by progressive cycles of halite dissolution followed by dilution [46]. “Mixed” type waters (Type II) are of three origins. The first group (W2 and W4) (Type IIa) indicates origin from halite dissolution. The equal dominance of Ca2+, SO42−, Na+ and Cl− in their ionic composition, however, suggests that halite is not the only source of solutes in these waters. Type IIb and Type IIc waters do not seem to relate to either halite dissolution or seawater evaporation (Figure 10). The elevated Br−/Cl− ratio in sample W7 (Type IIb) (Table 2) relative to other precipitation-fed surface waters (e.g., W10, W13 and W22) suggests that local precipitation is not the sole water source, and appears to be partially fed by groundwater with elevated Br content that is diluted by local precipitation and affected by moderate degree of evaporation.
The Na+-Cl−-Br− relations of samples W1, W5, W6 and W8 show similarities with springs in the AOS region that are also thought to be derived from halite dissolution [13,58] (Figure 10). In WBNP, halite is the main constituent of the Cold Lake Formation (Figure 3) [40]. The Muskeg/Prairie Evaporite Formation contains variable amount of halite ranging from 5–10% in central WBNP [40]. These halite-bearing formations can be sources of Na and Cl (and likely that of the Br) in Na-Cl type waters in WBNP.
Most of the Ca-SO4 type waters (Type III) and the only Ca-HCO3 type water (Type IV) do not show effect of any halite dissolution. Their hydrochemical composition indicate effects of other processes and sources of solutes.
Ca-SO4 type and “mixed” groundwaters plotting above seawater suggest that the extra calcium in these waters is related to dissolution of calcium-bearing minerals, such as gypsum or/and anhydrite (Figure 11a). The same trend can be seen in surface waters, except for a few of “mixed” water samples showing slightly more or less Nadeficit than the rest of the samples in the group (Figure 11b).
Although the extra calcium indicated in Figure 11a,b might be derived from replacive dolomitization, this process is highly unlikely in the study area. Replacive dolomitization should cause a negative correlation between Ca2+ and Mg2+ concentrations in the fluid because of ion exchange between the Mg-bearing fluid and the Ca-rich limestone [61]. Groundwaters in WBNP, however, show a positive correlation between these ions (Figure 12). Calcium-bicarbonate type groundwaters and surface waters show no evidence of effects of any of the processes presented on the diagram (Figure 11a,b).
The 1:1 correlation of Ca2++Mg2+ and CO32−+HCO3− ion concentrations in the Ca-HCO3 type waters suggests that carbonates are the main sources of solutes in this water type (Figure 11c). The elevated Ca2++Mg2+ content in “mixed” and Ca-SO4 waters reflects the Ca excess relative to the Ca-HCO3 waters due to additional dissolution of gypsum/anhydrite that previously was already shown. It is also supported by the excellent correlation between Ca2++Mg2+ and CO32−+HCO3−+SO42− concentrations in these waters (Figure 11d) suggesting that these waters have been affected by dissolution of both carbonates and sulphate minerals.
Considering that calcite and dolomite are abundant in the area, the possible source of these solutes are from the regional carbonate units of the Keg River and Slave Point formations, and in lesser amount, may be from the carbonate-bearing but evaporite-dominated units of the Chinchaga, Muskeg and Fort Vermilion formations, as well as the Waterways Formation.
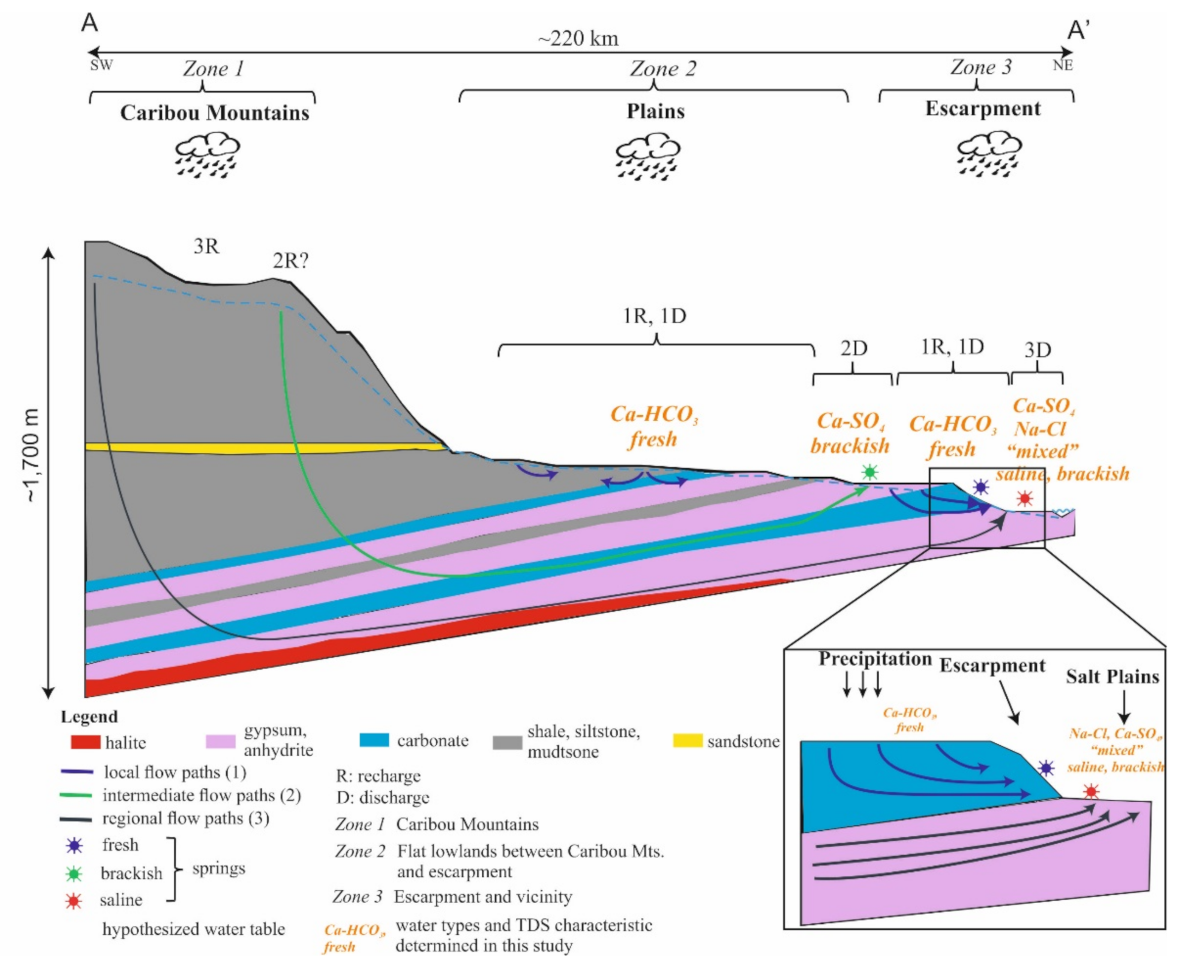
5.4. Updated Conceptual Models
Figure 13 shows the synthesis of prior conceptualizations of groundwater flow dynamics in the region. The generalized cross-section depicts the area between the Caribou Mountains in the west and the Salt Plains in the east. The cross-section shows the three “hydrologic zones” proposed by Drake [7] and the Caribou Mountains (Zone 1) as a regional recharge area [10]. The flow paths shown in the escarpment area reflect the hypotheses of regional and local flow systems in the area [9,10,11,14].
The results of this study are also superimposed on Figure 13. The observed spatial distributions of Na-Cl and Ca-HCO3 type waters correspond with the hierarchically nested flow systems postulated earlier by others. Specifically, the dominant occurrence of Na-Cl type water on the topographically lowest elevations and the abundance of fresh-water springs in the flat central region reflect a regional groundwater flow system discharging at the main topographic low and shallow local flow systems dominating the central area, respectively.
It is important to note, however, that the lithology of the area and assumed near-surface presence of halite-rich formation (i.e., Cold Lake Formation, Figure 3) in the Salt Plains may have a dominant effect on the hydrochemistry of relatively shallow groundwater flow paths causing the observed chemical composition in saline springs to be resulted more from halite dissolution rather than from a prolonged rock-water interaction on a long travel path. To reliably correlate and delineate segments and scales of groundwater flow systems in the area, further, more detailed analyses would be necessary.
6. Conclusions
In a sedimentary basin, the elevated TDS content is typical manifestation of discharge of large-scale groundwater flow systems and can indicate regional-scale flow paths along which waters reached their current chemical compositions through prolonged rock-water interactions. Although the spatial occurrence of the Na-Cl type waters in WBNP fits the conceptualized discharge area of regional flow systems, their relation to large-scale flow systems could not be confirmed with the available data. Considering the local lithology, i.e., halite-bearing strata in the area’s near-surface geology, the presence of brine and saline waters are likely to be more indicative of the lithology, rather than the scale of the flow system.
The largest cluster of Ca-SO4 waters show a clear correlation with outcrops of Devonian evaporites indicating a close relation between the water chemical composition and the local lithology. Several other groups of Ca-SO4 waters, such as those observed on Devonian shale in the central and southern region near the Birch Mountain, however, do not overlap with near-surface or surface outcrops of evaporite formations. Accompanied by elevated salinity these apparently “lithology-independent” clusters of groundwaters and surface waters may indicate upwelling from deeper flow paths, rather than local processes, and may delineate areas of enhanced groundwater and surface water interactions in the region.
It is important to note, however, that in cases of both the Na-Cl and Ca-SO4 type water further data and additional analyses are needed to confirm that the hydrochemical characteristics are indicators of terminal zones of large-scale flow systems in the study area. Such investigations were beyond the scope of this study and considered goals of future hydrogeological analyses.
The findings of this study contribute to filling the gap on the hydrochemical characterization of groundwaters and surface waters of one of the most protected and remote regions of Alberta, Canada, and are important components of any further, comprehensive assessment of the natural water conditions. In addition, this study provides further knowledge on groundwater conditions and subsurface flow dynamics and presents results in light of previous conceptualizations on the groundwater regime in the WBNP. The great range in TDS content and water types, as well as the apparent similarities in hydrochemical characteristics of groundwater and surface waters provides an indication that groundwater dynamics and groundwater-surface water interactions may play an important role in the development and sustainability of the existing ecosystems in the region. For future assessment and clarification of the vulnerability of these groundwater-dependent ecosystems to the impact of human activities as well as their resilience to natural processes, such as climate change, it is imperative to further analyze groundwater flow paths and their interactions with the shallow subsurface.
Author Contributions
Conceptualization, J.D.-T., B.J.R., C.M. and J.M.-S.; methodology, J.D.-T., B.J.R. and C.M.; software, J.D.-T.; formal analysis, J.D.-T.; investigation, J.D.-T.; writing—original draft preparation, J.D.-T.; writing—review and editing, B.J.R., C.M. and J.M.-S.; visualization, J.D.-T.; supervision, B.J.R., C.M. and J.M.-S.; funding acquisition, B.J.R., C.M. and J.M.-S. All authors have read and agreed to the published version of the manuscript.
Funding
The publication of this study was supported by the ENeRAG project that has received funding from the European Union’s Horizon 2020 research and innovation program under grant agreement No 810980.
Informed Consent Statement
Not applicable.
Data Availability Statement
Not applicable.
Acknowledgments
The authors express their sincere thanks to Alberta Geological Survey for their support in this research. Special thanks to Sheila Stewart (AGS) and Dan Palombi (AGS) for their help in retrieving details on archive data and sampling. We thank Parks Canada WBNP for supporting the project. Special thanks go to Mike Vassal, John McKinnon and László Déri for their assistance in the field. We also thank Richard Stein for introducing us to his work on WBNP. We thank Chris Schneider and Murray Gingras for their help with the geological background in the area, and Dan Alessi for his advice and constructive comments on data evaluation and interpretations. We would like to thank József Tóth for his advice and valuable insights on the topic, and his financial support provided to the first author through the “József Tóth and Erzsébet Tóth Graduate Scholarship in Hydrogeology”. We also wish to thank the support of the József and Erzsébet Tóth Endowed Hydrogeology Foundation (Eötvös Loránd University, Budapest, Hungary) through the postdoctoral fellowship provided to the first author.
Conflicts of Interest
The authors declare no conflict of interest.
References
- World Heritage Committee (WHC), United Nations Educational, Scientific and Cultural Organization (UNESCO), 1983 Report SC/83/CONF.009/8. Available online: http://whc.unesco.org/archive/1983/sc-83-conf009-2e.pdf (accessed on 2 May 2017).
- Canadian Wildlife Service and U.S. Fish and Wildlife Service. International Recovery Plan for the Whooping Crane, Ottawa: Recovery of Nationally Endangered Wildlife (RENEW); U.S. Fish and Wildlife Service: Albuquerque, Mexico, 2007; 162p.
- Ramsar List—The List of Wetlands of International Importance. Available online: https://www.ramsar.org/sites/default/files/documents/library/sitelist.pdf (accessed on 28 March 2018).
- Lemay, T.G.; Guha, S. Compilation of Alberta Groundwater Information from Existing Maps and Data Sources; ERCB/AGS Open File Report 2009-02; Energy Resources Conservation Board: Edmonton, AB, Canada, 2009; 43p. [Google Scholar]
- Ozoray, G. Hydrogeology of the Seen River—Whites and River Area, Alberta; Earth Sciences Report 80-2; Alberta Research Council: Edmonton, AB, Canada, 1980. [Google Scholar]
- World Heritage Centre (WHC)—International Union for Conservation of Nature (IUCN). Reactive Monitoring Mission to Wood Buffalo National Park, Canada. Mission Report. Available online: http://whc.unesco.org/en/documents/156893 (accessed on 5 January 2018).
- Drake, J.J. The Geomorphic Implications of the Geo-Hydrology of Gypsum-Karst Areas. Master’s Thesis, McMaster University, Hamilton, ON, USA, 1970, unpublished. [Google Scholar]
- Stein, R. Significance of Observed Field Features in the Peace Point and Fitzgerald Map Areas of Wood Buffalo National Park; Unpublished Preliminary Report; Alberta Research Council: Edmonton, AB, Canada, 1979. [Google Scholar]
- Tsui, P.C. Deformation, Ground Subsidence, and Slope Movements along the Salt River Escarpment in Wood Buffalo National Park. Master’s Thesis, University of Alberta, Edmonton, AB, Canada, 1982. [Google Scholar]
- Weyer, K.U. Salt Dissolution, Karst Geology, Glacial Events and Groundwater Flow in the Pine Point Region, NWT; Research Report on Joint Project between Cominco Ltd. and NHRI (National Hydrology Research Institute); National Hydrology Research Institute: Calgary, AB, Canada, 1983; p. 461. [Google Scholar]
- Tsui, P.C.; Cruden, D.M. Deformation associated with gypsum karst in the Salt River Escarpment, northeastern Alberta. Can. J. Earth Sci. 1984, 21, 949–959. [Google Scholar] [CrossRef]
- Grasby, S.E.; Chen, Z. Subglacial recharge into the Western Canadian Sedimentary Basin. Impact of Pleistocene glaciation on basin hydrodynamics. Geol. Soc. Am. Bull. 2005, 117, 500–514. [Google Scholar] [CrossRef]
- Grasby, S.E. Brine springs of northern Alberta. In Potential for Carbonate-Hosted Lead-Zinc Mississippi Valley-Type Mineralization in Northern Alberta and Southern Northwest Territories: Geoscience Contributions, Targeted Geoscience Initiative; Hannigan, P.K., Ed.; Geological Survey of Canada Bulletin: Ottawa, ON, Canada, 2006; Volume 591, pp. 241–254. [Google Scholar] [CrossRef]
- Weyer, K.U.; Krouse, H.R.; Horwood, W.C. Investigation of regional geohydrology south of Great Slave Lake, Canada, utilizing natural sulphur and hydrogen isotope variations. In Proceedings of the International Symposium on Isotope Hydrology, Neuherberg, Germany, 19–23 June 1978; IAEA: Vienna, Austria, 1979; pp. 251–264. [Google Scholar]
- Nielsen, G. Groundwater investigations in Peace-Athabasca Delta; Alberta Department of Environment, Water Resources Division, Soils, Geology and Groundwater Branch: Edmonton, AB, Canada, 1972. [Google Scholar]
- Nobert, M.; Barrie, W. Groundwater Conditions in Wood Buffalo National Park, NWT. Interim Report; National Hydrology Research Institute, Environment Canada: Saskatoon, SK, USA, 1986. [Google Scholar]
- McNaughton, D. Hydrological Investigations in Wood Buffalo National Park 1985–1990, Final Report; Environment Canada: Edmonton, AB, Canada, 1991. [Google Scholar]
- Peters, D.L.; Prowse, T.D.; Marsh, P.; Lafleur, P.M.; Buttle, J.M. Persistence of water within perched basins of the Peace-Athabasca Delta, Northern Canada. Wetl. Econ. Manag. 2006, 14, 221–243. [Google Scholar] [CrossRef]
- Natural Regions Committee. Natural Regions and Subregions of Alberta; Downing, D.J., Pettapiece, W.W., Eds.; Pub. No. T/85; Government of Alberta: Edmonton, AB, Canada, 2006; 264p. [Google Scholar]
- Turchenek, L.W.; Pigot, M.E. Peatland Distribution in Alberta, Map 212; Alberta Research Council: Edmonton, AB, Canada, 1988. [Google Scholar]
- Heginbottom, J.A.; Dubreuil, M.A.; Harker, P.A. Canada—Permafrost, MCR 4177. In National Atlas of Canada, 5th ed.; National Resources Canada: Ottawa, ON, Canada, 1995. [Google Scholar]
- Meijer Drees, N.C. Devonian Elk Point Group of the Western Canada Sedimentary Basin. In Mossop GD and Shetsen I (comp.): Geological Atlas of the Western Canada Sedimentary Basin; Canadian Society of Petroleum Geologists and Alberta Research Council: Calgary, AB, Canada, 1994; pp. 129–149. [Google Scholar]
- Oldale, H.S.; Munday, R.J. Devonian Beaverhill Lake Group of the Western Canada Sedimentary Basin. In Mossop GD and Shetsen I (comp): Geological Atlas of the Western Canada Sedimentary Basin; Canadian Society of Petroleum Geologists and Alberta Research Council: Calgary, AB, Canada, 1994; pp. 149–165. [Google Scholar]
- Switzer, S.B.; Holland, W.G.; Christie, D.S.; Graf, G.C.; Hedinger, A.S.; McAuley, R.J.; Wierzbicki, R.A.; Packard, J.J. Devonian Woodbend-Winterburn Strata of the Western Canada Sedimentary Basin. In Geological Atlas of the Western Canada Sedimentary Basin; Mossop, G.D., Shetsen, I., Eds.; Canadian Society of Petroleum Geologists and Alberta Research Council: Calgary, AB, Canada, 1994; pp. 165–203. [Google Scholar]
- Norris, A.W. Paleozoic (Devonian) geology of northeastern Alberta and northwestern Saskatchewan. In Guide to the Athabasca Oil Sands Area, Information Series 65; Carrigy, M.A., Ed.; Alberta Research: Edmonton, AB, Canada, 1973; pp. 15–76. [Google Scholar]
- Richmond, W.O. Paleozoic Stratigraphy and Sedimentation of the Slave Point Formation, Southern Northwest Territories and Northern Alberta. Ph.D. Thesis, Stanford University, Stanford, CA, USA, 1965. [Google Scholar]
- Park, D.G.; Jones, B. Brecciation in the Devonian Keg River Formation of northern Wood Buffalo National Park, Northeast Alberta; Bulletin of Canadian Petroleum Geology: Calgary, AB, USA, 1987; pp. 416–429. [Google Scholar]
- Okulitch, A.V. Phanerozoic Bedrock Geology, Slave River, District of Mackenzie, Northwest Territories; Open File 5281 (National Earth Science Series, Geological Atlas, Map NP-11/12-G), Scale 1:1,000,000; Geological Survey of Canada: Ottawa, ON, Canada, 2006. [Google Scholar]
- Okulitch, A.V.; Fallas, K.M. GIS Dataset of Phanerozoic Geological Features, Slave River, Peace River, and Lake Athabasca Map Areas, Northwest Territories, Alberta, and Saskatchewan; Open File 5338, scale 1:1 000 000, 1 CD-ROM; Geological Survey of Canada: Ottawa, ON, Canada, 2007. [Google Scholar]
- Fenton, M.M.; Waters, E.J.; Pawley, S.M.; Atkinson, N.; Utting, D.J.; Mckay, K. Surficial geology of Alberta; AER/AGS Map 601, Scale 1:1 000 000; Alberta Energy Regulator: Calgary, AB, Canada, 2013. [Google Scholar]
- Prior, G.J.; Hathway, B.; Glombick, P.M.; Pana, D.I.; Banks, C.J.; Hay, D.C.; Schneider, C.L.; Grobe, M.; Elgr, E.; Weiss, J.A. Bedrock Geology of Alberta; ERCB/AGS Map 600, Scale 1:1 000 000; Energy Resources Conservation Board: Edmonton, AB, Canada, 2013. [Google Scholar]
- Bayrock, L. Surficial Geology, Fort Chipewyan, NTS 74L. Map 141; Scale 1:250,000; Research Council of Alberta: Edmonton, AB, Canada, 1972. [Google Scholar]
- Bayrock, L. Surficial Geology, Lake Claire, NTS 84I. Map 144; Scale 1:250,000; Research Council of Alberta: Edmonton, AB, Canada, 1972. [Google Scholar]
- Bayrock, L. Surficial Geology, Peace Point and Fitzgerald, NTS 84P-74M. Map 145; Scale 1:250,000; Research Council of Alberta: Edmonton, AB, Canada, 1972. [Google Scholar]
- Lemmen, D.S. Surficial Geology, Klewi River, District of Mackenzie; Northwest Territories; Map 1905A, Scale 1:250,000; Geological Survey of Canada: Ottawa, ON, Canada, 1998. [Google Scholar]
- Lemmen, D.S. Surficial Geology, Buffalo Lake, District of Mackenzie; Northwest Territories; Map 1906A, Scale 1:250,000; Geological Survey of Canada: Ottawa, ON, Canada, 1998. [Google Scholar]
- Mougeot, C.; Fenton, M.M. Surficial Geology of the Whitesand River Area, Alberta (NTS 84O); ERCB/AGS Map 541, Scale 1:250 000; Energy Resources Conservation Board: Edmonton, AB, Canada, 2010. [Google Scholar]
- Bachu, S.; Underschultz, J.R. Hydrogeology of formation waters, northeastern Alberta basin. Am. Assoc. Pet. Geol. Bull. 1993, 77, 1745–1768. [Google Scholar]
- Bachu, S. Flow of formation waters, aquifer characteristics, and their relation to hydrocarbon accumulations in the northern part of the Alberta basin. Am. Assoc. Pet. Geol. Bull. 1997, 81, 712–733. [Google Scholar] [CrossRef]
- Grobe, M. Distribution and Thickness of Salt within the Devonian Elk Point Group, Western Canada Sedimentary Basin. In Alberta Energy and Utilities Board, EUB/AGS Earth Sciences Report 2000–02; Alberta Geological Survey: Edmonton, AB, Canada, 2000. [Google Scholar]
- Pawlowicz, J.P.; Fenton, M.M. Drift Thickness of Alberta, Alberta Energies and Utilities Board; Map 227, Scale 1:2,000,000; Alberta Geological Survey: Edmonton, AB, Canada, 1995. [Google Scholar]
- Alberta Energy Regulator/Alberta Geological Survey (AER/AGS). Alberta Table of Formations; Alberta Energy Regulator. 2015. Available online: http://ags.aer.ca/document/Table-of-Formations.pdf (accessed on 18 July 2016).
- Core Laboratories Petroleum Services, Stratigraphic Correlation Chart; Core Laboratories Petroleum Services, Geological Sciences Department: Calgary, AB, Canada, 2017. Available online: https://www.spec2000.net/downloads/StratChart.pdf (accessed on 1 February 2020).
- Stewart, S.A. Field Measurements and Water Chemistry Analyses of Water Samples from the Wood Buffalo National Park area, Alberta, Canada: 1974 to 1978 (Tabular Data, Tab Delimited Format), Alberta Energy Regulator/Alberta Geological Survey, AER/AGS Digital Data 2021–0002. Available online: https://ags.aer.ca/publication/dig-2021-0002 (accessed on 1 March 2021).
- APHA. Standard Methods for the Examination of Water and Waste Water, 20th ed.; American Public Health Association: Washington, DC, USA, 1999. [Google Scholar]
- Engle, M.A.; Rowan, E.L. Interpretation of Na–Cl–Br systematics in sedimentary basin brines: Comparison of concentration, element ratio, and isometric log-ratio approaches. Math. Geosci. 2013, 45, 87–101. [Google Scholar] [CrossRef]
- Davisson, M.L.; Criss, R.E. Na-Ca-Cl relations in basinal fluids. Geochim. Et Cosmochim. Acta 1996, 60, 2743. [Google Scholar] [CrossRef]
- Qian, H.; Li, P.; Wu, J. Isotopic characteristics of precipitation, surface and ground waters in the Yinchuan Plain, Northwest China. Environ. Earth Sci. 2013, 70, 57–70. [Google Scholar] [CrossRef]
- Gue, A.E.; Mayer, B.; Grasby, S.E. Origin and geochemistry of saline spring waters in the Athabasca oil sands region, Alberta, Canada. Appl. Geochem. 2015, 61, 132–145. [Google Scholar] [CrossRef]
- IAEA/WMO International Atomic Energy Agency and World Meteorological Organization, Global Network of Isotopes in Precipitation. 2006. Available online: http://www.iaea.org/water (accessed on 8 August 2015).
- Birks, S.J.; Edwards, T.W.D.; Gibson, J.J.; Drimmie, R.J.; Michel, F.A. Canadian Network for Isotopes in Precipitation. 2004. Available online: http://www.science.uwaterloo.ca/twdedwar/cnip/cniphome.html (accessed on 1 January 2017).
- Davisson, M.L.; Presser, T.S.; Criss, R.E. Geochemistry of Tectonically Expelled Fluids from the Northern Coast Ranges, Rumsey Hills, California, USA. Geochim. Et Cosmochim. Acta 1994, 58, 1687. [Google Scholar] [CrossRef]
- Ford, D.; Williams, P. Karst Hydrogeology and Geomorphology; John Wiley & Sons Ltd.: West Sussex, UK, 2007. [Google Scholar]
- Wolfe, B.B.; Karst-Riddoch, T.L.; Hall, R.I.; Edwards, T.W.D.; English, M.C.; Palmini, R.; McGowan, S.; Leawitt, P.R.; Vardy, S.R. Classification of hydrological regimes of northern floodplain basins (Peace–Athabasca Delta, Canada) from analysis of stable isotopes (δ18O, δ2H) and water chemistry. Hydrol. Processes 2007, 21, 151–168. [Google Scholar] [CrossRef]
- Connolly, C.A.; Walter, L.M.; Baadsgard, H.; Longstaffe, F.J. Origin and evolution of formation waters, Alberta Basin, Western Canada Sedimentary Basin. II. Isotope systematics and water mixing. Appl. Geochem. 1990, 5, 397–413. [Google Scholar] [CrossRef] [Green Version]
- Lemay, T. Geochemical and Isotope Data for Formation Water from Selected Wells, Cretaceous to Quaternary Succession, Athabasca Oil Sands (In Situ) Area, Alberta. EUB/AGS Geo-Note 2002–02; Alberta Energy and Utilities Board/Alberta Geological Survey: Edmonton, AB, Canada, 2002; pp. 1–71. [Google Scholar]
- Gibson, J.J.; Birks, S.J.; Moncur, M.; Yi, Y.; Tattrie, K.; Jaschecko, S.; Richardson, K.; Eby, P. Isotopic and Geochemical Tracers for Fingerprinting Process-Affected Waters in the Oil Sands Industry: A Pilot Study, Oil Sands Research and Information Network; OSRIN Report No. TR-12. 2011; University of Alberta, School of Energy and the Environment: Edmonton, AB, Canada, 2011; 109p. [Google Scholar]
- Gue, A.E. The Geochemistry of Saline Springs in the Athabasca Oil Sands Region and Their Impact on the Clearwater and Athabasca Rivers. Master’s Thesis, University of Calgary, Calgary, AB, Canada, 2012, unpublished. [Google Scholar]
- McCaffrey, M.A.; Lazar, B.; Holland, H.D. The evaporation path of seawater and the coprecipitation of Br− and K+ with halite. J. Sediment. Petrol. 1987, 57, 928–937. [Google Scholar] [CrossRef] [PubMed]
- Sharp, Z. Principles of Stable Isotope Geochemistry; Pearson Prentice Hall: Upper Saddle River, NJ, USA, 2007. [Google Scholar]
- Michael, K.; Bachu, S. Origin, chemistry and flow of formation waters in the Mississippian–Jurassic sedimentary succession in the west-central part of the Alberta Basin, Canada. J. Mar. Pet. Geol. 2002, 19, 289–306. [Google Scholar] [CrossRef]
Figure 1.
Topography of the Wood Buffalo National Park (WBNP), Alberta (AB)-Northwest Territories (NWT), Canada, and location of samples. Labels refer to samples in Dataset 2. Location of cross-section A-A’ is also shown. Inset map shows the Salt Plains and its vicinity.
Figure 1.
Topography of the Wood Buffalo National Park (WBNP), Alberta (AB)-Northwest Territories (NWT), Canada, and location of samples. Labels refer to samples in Dataset 2. Location of cross-section A-A’ is also shown. Inset map shows the Salt Plains and its vicinity.


Figure 3.
Generalized stratigraphy (based on Refs. [22,23,24,25,31,42,43]) and hydrostratigraphy of WBNP (modified after Refs. [38,39]).

Figure 4.
Workflow showing main data evaluation steps and associated data analyses methods.

Figure 5.
Spatial distribution of Total Dissolved Solids (TDS) content of water samples in WBNP. Inset map shows the Salt Plains and vicinity.
Figure 5.
Spatial distribution of Total Dissolved Solids (TDS) content of water samples in WBNP. Inset map shows the Salt Plains and vicinity.

Figure 6.
Distribution of Total Dissolved Solids content and water types per sampling location categories. Numbers on graph show sample number in each specific category. The total number of samples in each sampling location category is summarized in Table 1.
Figure 6.
Distribution of Total Dissolved Solids content and water types per sampling location categories. Numbers on graph show sample number in each specific category. The total number of samples in each sampling location category is summarized in Table 1.

Figure 7.
Piper diagram showing water types of samples in Dataset 1 and Dataset 2.

Figure 8.
Spatial distribution of water types in WBNP. Inset map shows the Salt Plains area and vicinity. Bedrock lithology is also shown (modified after Refs. [29,31]).

Figure 9.
(a) Isotopic composition of surface waters (Dataset 2, sinkholes included) (b) Isotopic composition of groundwaters (Dataset 2). Local Meteoric Water Line (LMWL) for Fort Smith and Predicted Local Evaporation Line (LEL) for PAD [54] are also shown. Isotopic composition of groundwaters elsewhere in the Alberta Basin [55,56] (indicated by circles with dashed border) as well as that of springs and seeps from the AOS region [13,49,57] are also displayed.

Figure 10.
Na+-Cl—Br− isometric log-ratio diagrams of springs and surface waters from WBNP. Springs from AOS region ([13,49,58] are shown for comparison. The solid line represents the seawater evaporation and halite dissolution trends. Data for seawater evaporation line is from Ref. [59]. The dashed line represents progressive cycles of halite dissolution by either diluted seawater or meteoric water followed by dilution. Latin numerals indicate water types.

Figure 11.
(a) Na deficit and Ca excess diagram of groundwater samples in WBNP, (b) Na deficit and Ca excess diagram of surface waters samples in WBNP (sinkholes and not determined sample types are also included here), (c) Concentrations of Ca2+ plus Mg2+ versus CO32− plus HCO3−, (d) Concentrations of Ca2+ plus Mg2+ versus SO42− plus HCO3−CO32− in waters from WBNP. In Figures slopes of 1:1 represent the trend of Ca2++Mg2+ and CO32−+HCO3−, as well as Ca2++Mg2+ and SO42−+HCO3− concentrations in meq/L and indicates dissolution of carbonates composed of calcite and dolomite, and dissolution of carbonate and gypsum dissolution, respectively.

Figure 12.
Positive correlation between calcium versus magnesium.

Figure 13.
Conceptual model of groundwater flow in WBNP showing groundwater flow paths with associated water type and TDS content (synthesized from Refs. [7,8,9,10,11]). The model also shows water types and TDS characteristics determined in this study superimposed on previous conceptualizations of groundwater flow systems (orange labels).


Table 1.
Summary of Number of Samples and Types of Samples in Dataset 1 and Dataset 2.
| Data Source | Description | Total # of Samples Before Culling | Simplified Sample Type | Type of Samples | # of Samples by Sample Type | # of Samples after Culling | Total # of Samples after Culling |
|---|---|---|---|---|---|---|---|
| Dataset 1 | Archive 1974–78 (Stewart, 2021) | 489 | Groundwater (GW) | springs | 98 | 95 | 465 |
| seeps | |||||||
| cave | |||||||
| auger | |||||||
| well | |||||||
| Surface water (SW) | stream, river, creek, ditch, channel | 365 | 345 | ||||
| lake, pond, pool, hole, wallow, slump | |||||||
| muskeg, oxbow, cutoff, slough | |||||||
| Both (GW-SW) | sinks | 20 | 19 | ||||
| not defined | 6 | 6 | |||||
| Dataset 2 | Collected 2013 | 17 | Groundwater (GW) | springs | 6 | 6 | 17 |
| Surface water (SW) | lake, pond | 8 | 8 | ||||
| Both (GW-SW) | sinks | 3 | 3 |
Table 2.
Location (nad83 UTM Zone 12), Type, Field Measurements and Results of Laboratory Analyses of Samples in Dataset 2. Derived Parameters and Water Types Are Also Listed.
Table 2.
Location (nad83 UTM Zone 12), Type, Field Measurements and Results of Laboratory Analyses of Samples in Dataset 2. Derived Parameters and Water Types Are Also Listed.
| Sample ID a | Sample Type | Northing (m) | Easting (m) | pH b | T (°C) b | Na+ (mg/L) | K+ (mg/L) | Mg2+ (mg/L) | Ca2+ (mg/L) | HCO3 (mg/L) | CO32− (mg/L) | SO42− (mg/L) |
|---|---|---|---|---|---|---|---|---|---|---|---|---|
| W1 | spring | 421,734 | 6,648,210 | 5.6 | 8.9 | 138,000 | 0 | 210 | 1400 | 198 | 0 | 3879 |
| W2 | spring | 421,632 | 6,648,028 | 6.57 | 5.3 | 373 | 0 | 57 | 644 | 385 | 0 | 1521 |
| W4 | spring | 421,580 | 6,647,737 | 7.22 | 7.1 | 399 | 0 | 56 | 642 | 399 | 0 | 1170 |
| W5 | spring | 421,450 | 6,647,575 | 5.89 | 10.6 | 133,000 | 0 | 200 | 1600 | 209 | 0 | 3712 |
| W6 | spring | 421,173 | 6,646,928 | - | 4.7 | 25,300 | 0 | 80 | 890 | 250 | 0 | 2353 |
| W7 | pond | 443,246 | 6,629,257 | 7.36 | 18 | 588 | 0 | 34 | 428 | 156 | 0 | 1129 |
| W8 | lake | 443,955 | 6,628,644 | 7.7 | 20.1 | 2900 | 0 | 30 | 599 | 175 | 0 | 1383 |
| W10 | sinkhole | 428,794 | 6,602,760 | 8.45 | 17.3 | 14 | 9 | 85 | 13.8 | 416 | 48 | 16 |
| W13 | lake | 431,103 | 6,598,556 | 8.02 | 20.1 | 5 | 8 | 34 | 33.2 | 217 | 0 | 57 |
| W14 | lake | 664,740 | 6,690,842 | 6.9 | 9.9 | 4 | 2 | 75 | 572 | 289 | 0 | 1340 |
| W16 | lake | 665,271 | 6,691,113 | 7.1 | 13.7 | 5 | 2 | 64 | 631 | 318 | 0 | 1269 |
| W17 | sinkhole | 665,526 | 6,691,534 | 7.2 | 15.9 | 5 | 2 | 83 | 654 | 297 | 0 | 1336 |
| W20 | lake | 652,280 | 6,702,992 | 6.78 | 12.1 | 8 | 2 | 86 | 562 | 261 | 0 | 1377 |
| W21 | spring | 651,832 | 6,703,002 | 6.66 | 5.5 | 10 | 2 | 86 | 528 | 306 | 0 | 1367 |
| W22 | lake | 651,847 | 6,702,985 | 7.5 | 15.3 | 4 | 2 | 43 | 169 | 122 | 0 | 486 |
| W23 | lake | 649,044 | 6,704,257 | 6.41 | 6 | 36 | 3 | 106 | 620 | 351 | 0 | 1496 |
| W24 | sinkhole | 648,260 | 6,703,939 | 7.26 | 14.6 | 2 | 1 | 45 | 477 | 221 | 0 | 1160 |
| Sample ID a | Cl− (mg/L) | Br− (mg/L) | δ18 (‰) c | δ2 (‰) c | TDS (mg/L) | CBE (%) d | Br/Cl | z1 e | z2 e | Caexcess (meq/L) f | Nadeficit (meq/L) f | Water Type |
| W1 | 188,000 | 4.0 | −19.3 | −161 | 331,000 | 6.2 | 0.00002 | 0.09 | 9.5 | −141.3 | −1410.0 | Na-Cl |
| W2 | 571 | 0.0 | −18.5 | −154 | 3550 | −1.0 | 0.00007 | 0.00 | 8.5 | 31.5 | −2.2 | “mixed” |
| W4 | 596 | 0.0 | −19.3 | −157 | 3260 | 6.2 | 0.00008 | 0.02 | 8.4 | 31.4 | −2.8 | “mixed” |
| W5 | 186,000 | 4.5 | −19.9 | −163 | 324,000 | 5.0 | 0.00002 | 0.07 | 9.4 | −129.1 | −1239.9 | Na-Cl |
| W6 | 37,900 | 0.8 | −19.7 | −162 | 66,800 | 1.2 | 0.00002 | 0.02 | 9.4 | 1.7 | −172.0 | Na-Cl |
| W7 | 778 | 3.0 | −14.6 | −134 | 3110 | 1.8 | 0.004 | 0.11 | 5.3 | 20.5 | −6.5 | “mixed” |
| W8 | 4360 | 0.1 | −18.2 | −153 | 9450 | 1.2 | 0.00003 | 0.02 | 9.2 | 25.0 | −19.4 | Na-Cl |
| W10 | 18 | 0.0 | −8.8 | −105 | 619 | −4.0 | 0.001 | 0.13 | 6.1 | 0.7 | −0.2 | Ca-HCO3 |
| W13 | 17 | 0.0 | −7.1 | −102 | 370 | −3.3 | 0.001 | −0.60 | 5.8 | 1.6 | 0.2 | “mixed” |
| W14 | 19 | 0.0 | −19.9 | −169 | 2300 | 2.5 | 0.001 | −0.81 | 5.5 | 28.5 | 0.3 | Ca-SO4 |
| W16 | 9 | 0.0 | −19.8 | −164 | 2300 | 7.5 | 0.002 | −0.11 | 5.5 | 31.5 | 0.0 | Ca-SO4 |
| W17 | 16 | 0.0 | −19.9 | −164 | 2390 | 9.0 | 0.001 | −0.55 | 5.7 | 32.6 | 0.2 | Ca-SO4 |
| W20 | 27 | 0.0 | −21.2 | −165 | 2320 | 2.6 | 0.001 | −0.59 | 5.8 | 28.0 | 0.3 | Ca-SO4 |
| W21 | 23 | 0.0 | −23.1 | −179 | 2320 | −0.3 | 0.002 | −0.27 | 5.7 | 26.3 | 0.1 | Ca-SO4 |
| W22 | 15 | 0.0 | −11.8 | −127 | 840 | −1.7 | 0.002 | −0.66 | 5.4 | 8.4 | 0.2 | Ca-SO4 |
| W23 | 51 | 0.0 | −20.2 | −167 | 2660 | 3.7 | 0.001 | 0.06 | 6.4 | 30.9 | −0.3 | Ca-SO4 |
| W24 | 17 | 0.0 | −18.6 | −157 | 1920 | −1.2 | 0.001 | −1.13 | 5.5 | 23.8 | 0.3 | Ca-SO4 |
Publisher’s Note: MDPI stays neutral with regard to jurisdictional claims in published maps and institutional affiliations. |
© 2022 by the authors. Licensee MDPI, Basel, Switzerland. This article is an open access article distributed under the terms and conditions of the Creative Commons Attribution (CC BY) license (https://creativecommons.org/licenses/by/4.0/).
Share and Cite
MDPI and ACS Style
Déri-Takács, J.; Rostron, B.J.; Mendoza, C.; Mádl-Szőnyi, J. Hydrogeochemical Characteristics Refine the Conceptual Model of Groundwater Flow in Wood Buffalo National Park, Canada. Water 2022, 14, 965. https://doi.org/10.3390/w14060965
AMA Style
Déri-Takács J, Rostron BJ, Mendoza C, Mádl-Szőnyi J. Hydrogeochemical Characteristics Refine the Conceptual Model of Groundwater Flow in Wood Buffalo National Park, Canada. Water. 2022; 14(6):965. https://doi.org/10.3390/w14060965
Chicago/Turabian StyleDéri-Takács, Judit, Benjamin J. Rostron, Carl Mendoza, and Judit Mádl-Szőnyi. 2022. "Hydrogeochemical Characteristics Refine the Conceptual Model of Groundwater Flow in Wood Buffalo National Park, Canada" Water 14, no. 6: 965. https://doi.org/10.3390/w14060965
Note that from the first issue of 2016, this journal uses article numbers instead of page numbers. See further details here.