
Following the Occurrence and Origin of Titanium Dioxide Nanoparticles in the Sava River by Single Particle ICP-MS


1
Department of Environmental Sciences, Jožef Stefan Institute, Jamova 39, 1000 Ljubljana, Slovenia
2
Jožef Stefan International Postgraduate School, Jamova 39, 1000 Ljubljana, Slovenia
*
Author to whom correspondence should be addressed.
Water 2022, 14(6), 959; https://doi.org/10.3390/w14060959
Submission received: 31 January 2022
/
Revised: 7 March 2022
/
Accepted: 16 March 2022
/
Published: 18 March 2022
(This article belongs to the Special Issue Freshwater Ecosystems under Anthropogenic Stress)
Abstract
:Titanium dioxide nanoparticles (TiO2NPs) are widely produced and used NPs in different applications. To evaluate the risk from anthropogenic TiO2NPs, more information is needed on their occurrence in the environment. For the first time, this study reports the levels of TiO2NPs in waters and sediments at selected sampling sites along the Sava River using inductively coupled plasma mass spectrometry in single particle mode (spICP-MS). The highest concentrations of TiO2NPs were determined in river water at Vrhovo (VRH), Jasenovac (JAS), and Slavonski Brod (SLB) sampling locations impacted by urban, agricultural, and/or industrial activities, suggesting that these NPs are likely of anthropogenic origin. The results further showed that hydrological conditions and sediment composition significantly influence the levels of TiO2NPs in river water at most locations. Moreover, the Ti/Al elemental concentration ratios of NPs in water and sediments at JAS were higher than the natural background ratios, further confirming their anthropogenic origin. The outcome of this study provides first information on the presence of (anthropogenic) TiO2NPs in different environmental compartments of the Sava River, contributing to more reliable risk assessments and better regulation of TiO2NPs emissions in the future.

1. Introduction
Titanium dioxide nanoparticles (TiO2NPs) are produced in large quantities annually on account of their increasing use in various applications. As a result, emissions of anthropogenically produced TiO2NPs into the environment are also increasing. Anthropogenic TiO2NPs can be released into the environment through urban runoff from exterior facades [1]; as a result of recreational activities, e.g., from sunscreen when bathing [2]; from municipal wastewater effluents containing TiO2NPs originating from personal care, food (containing food additive E171), textiles, and other consumer products [3]; from agricultural runoff containing TiO2NPs used as essential nutrients for plant growth and development; and as a result of accidental spills during their production and transport. TiO2 (nano)particles in the environment could also result from natural sources formed via biogeochemical and/or environmental processes. They can be present as Ti-bearing minerals (rutile, ilmenite, sphene, titanomagnetite, magnetite, and ilmenite) or Ti-containing particles formed after weathering of parent rocks [4]. Although much higher amounts of natural NPs are released in the environment than anthropogenic NPs [5], the occurrence of anthropogenic NPs is of concern particularly in urban areas, where increasingly more of the population will be living in the future. Due to unique properties related to their small size and increased surface area, the presence of anthropogenic TiO2NPs in the environment has raised legitimate concerns about their potential impact on human health and the environment [6].
The knowledge of TiO2NPs levels, especially in the river environment, is therefore necessary to better predict and control the pollution of the river. The Sava is a 945-km-long river that flows through Slovenia, Croatia, Bosnia, and Herzegovina and Serbia and is the primary drainage basin in South-Eastern Europe and the biggest tributary of the Danube River. The groundwater aquifers charged by the Sava are vital drinking water sources for the 9 million riparian inhabitants. The main sources of pollution are industrial and intensive agricultural activities, big cities with high population densities, and, in the lower parts of the Sava River, the discharge of non-treated municipal sewage. Regarding metals, the Sava River is considered a moderately polluted European river [7]. These pollution sources can also contribute to increased levels of anthropogenic TiO2NPs in the river, thus impairing the quality of the river ecosystem and drinking water sources.
To the best of our knowledge, there is currently no data on the occurrence and concentrations of (anthropogenic) TiO2NPs in the Sava River environment. The lack of information on the Sava River and other surface waters is related to the difficulties in quantifying NPs in environmental matrices. Most current methods for detecting NPs are challenged by their low concentrations in environmental samples (ng/L range), matrix interferences (physical or spectral), and the presence of natural NPs of a similar size, morphology, or composition. One method with the potential to overcome these limitations is single particle inductively coupled plasma mass spectrometry (spICP-MS). Since its first introduction by Degueldre’s group [8] in 2003, spICP-MS has been used to characterize and quantify metal-based NPs in different matrices [9]. The method provides information on the number-based particle size (expressed as the mass-equivalent spherical diameter) and size distribution, particle mass and number concentration, and the concentration of dissolved analyte in the sample [10]. It is a sensitive element-specific method that requires relatively simple sample pre-treatment and offers a rapid analysis of metal-containing NPs. So far, spICP-MS has been used to detectTiO2NPs in different environmental compartments, such as surface waters, treated drinking waters, rainwaters, swimming pool waters [4,11,12,13,14,15,16], sanitary sewage spills [3], and municipal sewage treatment plants [17]. Despite the relatively large number of reported spICP-MS applications for TiO2NPs analysis, improvements in the analytical performance of the method are still needed, especially concerning the reduction of particle size detection limits. Namely, its limitations are related to spectral interferences that hinder the detection of small NPs, thereby increasing particle detection limits. (Sp)ICP-MS measurements of certain elements, including the most abundant Ti isotope at a mass-to-charge (m/z) ratio of 48, can be hampered by isobaric (Ca isotope at m/z of 48) and/or polyatomic interferences (formed from P, S, Si, and C isotopes), which have the same m/z ratio as the target element. Several approaches have been used to remove or minimize spectral interference, one of them being tandem ICP-MS/MS technology, in which the instrument is equipped with an additional quadrupole located before the collision/reaction cell (CRC) to act as a mass filter [18]. For example, an ICP-MS/MS approach in single particle mode using a mixed cell reaction gas containing O2 and H2 has been proposed for the interference-free measurement of TiO2NPs in the presence of high Ca concentrations [9,19,20,21].
Identifying and quantifying the concentrations of anthropogenic TiO2 (nano)particles among the ubiquitous presence of naturally occurring Ti-containing particles in rivers is critical in assessing the potential environmental exposures and risk of anthropogenic TiO2 (nano)-particles in the environment. The distinction between the natural and anthropogenic particles is challenging because of their similarity in the elemental composition and size and the tendency of natural and anthropogenic NPs to form heteroaggregates in the natural environment [22]. Moreover, the concentration of naturally occurring Ti-bearing NPs can be several orders of magnitude above that of anthropogenic ones, overshadowing their presence. There are currently few promising approaches for quantifying and discriminating anthropogenic NPs from natural NPs in environmental samples. Natural and anthropogenic NPs can be distinguished based on a difference in their concentration in an unexposed and contaminated environment. However, this approach is only valid when information on the background levels of NPs is available and if the background levels are not in the same range as the anthropogenic NPs. A second method relies on the properties of anthropogenic NPs, e.g., chemical composition, size, and morphology, being significantly different from those of natural homologous particles. For instance, it can be assumed that natural Ti-bearing particles are part of larger mineral particles while anthropogenic TiO2NPs are, in general, smaller. However, determining the size of particles present at low concentration levels and in the presence of larger mineral particles is challenging due to the interferences affecting particle characterization. Another recently implemented approach exploits the differences in the elemental ratios in the individual particles between anthropogenic and natural NPs. Naturally occurring TiO2 particles can contain elements, such as Al, Fe, Ce, Si, Pb, Mn, etc. (also as carriers of heavy metals), whereas anthropogenic TiO2 particles are relatively pure [3,15]. Anthropogenic TiO2NPs can then be identified based on shifts in Ti’s elemental mass concentration ratio to a selected element relative to the corresponding natural background elemental ratios. This principle has been used to quantify the concentration of TiO2 anthropogenic (nano)particles in surface waters impacted by sewage spills (Ti:Al, Si, Fe, Ce, Zr, Nb, Ba, Pb) [3], bathing activities (Ti:Al, V, Ga, Y, Nb, Eu, Ho, Er, Tm, Yb) [2], urban runoff (Ti:Nb) [23], soils from stormwater green infrastructures (Ti:Nb, Ta, Al) [24], surface waters (Ti:Al, Fe, Si, Nb) [4,11], suspended particulate matter (SPM) from recreational lakes (Ti:Al, V, Mn, Fe, Pb) [15], and industrial waste streams (Ti:V, Al, Fe) [25]. The proposed approach can be therefore used to differentiate anthropogenic from naturally occurring Ti-containing NPs on a larger environmental scale.
The overall objective of this study was to evaluate whether different pollution sources previously identified by the elevated concentrations of potentially toxic elements across the Sava River can also contribute to the increased levels of anthropogenic TiO2NPs. To achieve this objective, the specific aims were to (1) quantify the concentration of TiO2 NPs in water and sediment samples at selected sampling sites along the Sava River to evaluate the influence of human activities on the levels of TiO2NPs; (2) evaluate the correlation between TiO2NPs concentrations found in river water and sediments with the amount of SPM in water and the sediment fraction <63 µm to evaluate if TiO2NPs in water are the results of sediment resuspension; (3) compare the elemental Ti/Al concentration ratios in NPs detected in water and sediment with natural background ratios to distinguish between natural and anthropogenic TiO2NPs.
2. Materials and Methods
2.1. Sample Collection
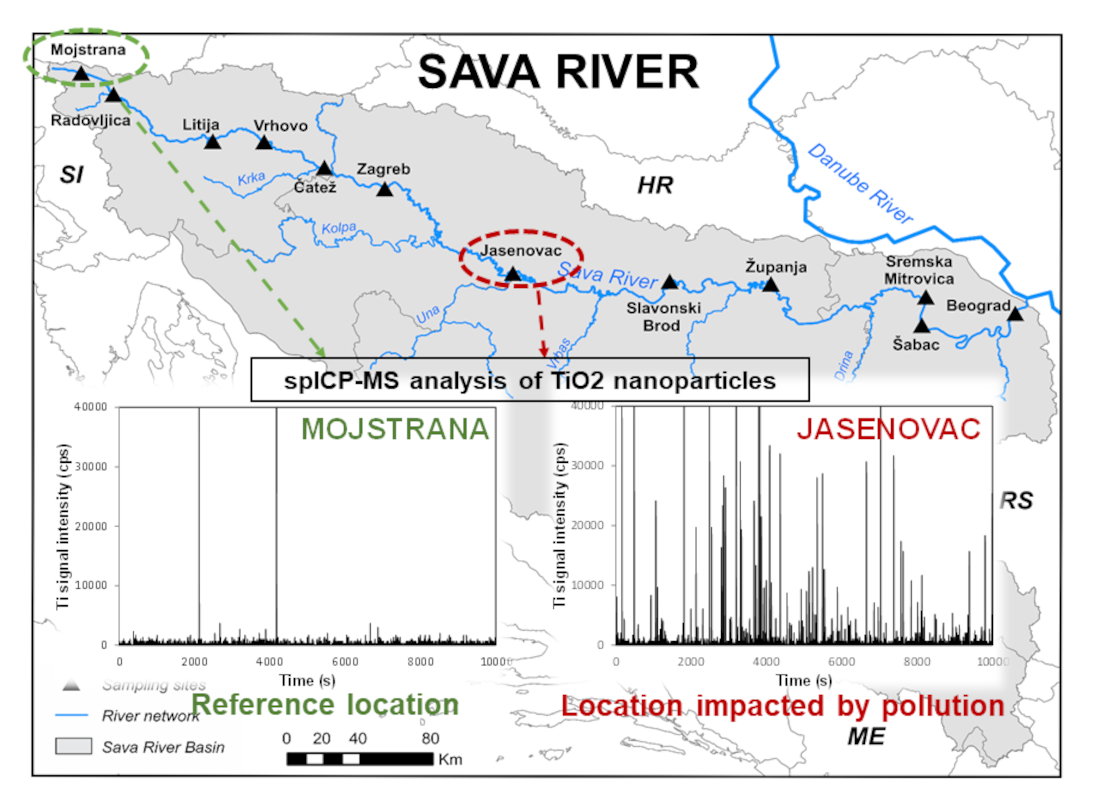
Water and sediment samples were collected along the Sava River in September 2015 under low water discharge conditions during the second sampling campaign, organized within the EU 7th FW funded GLOBAQUA project [7]. Fifteen sampling sites in Slovenia, Croatia, and Serbia were selected (Figure 1).
The main pollution sources were identified at Vrhovo (VRH), a large hydropower reservoir, receiving pollutants from the Sava tributary Boben, impacted by the chemical and glass industry and former chloro-alkali industry; Zagreb (ZAG) and Beograd (BEO), both strongly impacted by urban pollution and industrial activities; and Jasenovac (JAS), Slavonski Brod (SLB), Županja (ZUP), Sremska Mitrovica (SRM), and Šabac (SAB), impacted by agricultural activities, local oil refineries, heavy metallic industry, site mining industry, and river transport (Table S1). The unpolluted site of Mojstrana (MOJ), located in Slovenia close to the Sava Dolinka spring, one of the headwaters of the Sava River, was chosen as a reference location.
Water samples were collected following the guidance on surface water chemical monitoring given in the Water Framework Directive (WFD) [26]. At each sampling site, river water was collected in 10 L plastic buckets from which an aliquot (1 L) was transferred to a PE brown bottle and stored in a freezer at −20 °C prior to analysis. Sediment samples were collected from the river bank (grab sample, from the top 10 cm), following the recommendations for chemical monitoring of sediment [27]. Approximately 2 kg of sediment were collected at each sampling site and transferred into 2 L plastic bottles.
Water discharge, temperature, pH, and electrical conductivity were measured at each sampling location. The amount of SPM in river water, and the mass percentage of the sediment fraction <63 μm, was determined as described in Milačič et al. [7].
2.2. Sample Preparation
2.2.1. Water Samples
A Mettler AE 163 (Zürich, Switzerland) analytical balance was used for all weighing. MilliQ water (18.2 MΩ cm) from Millipore (Bedford, MA, USA) was used throughout the work.
Before analysis, the river water samples were allowed to thaw, shaken on a horizontal shaker (Edmund Bühler GmbH, Germany) for 10 min at 300 rpm, and bath sonicated (Elmasonic P 180 H, Elma, Germany) for 3 min at 100 W power and 37 Hz frequency. Sonication resulted in an increased number of detected TiO2NPs compared to a non-sonicated sample without affecting the particle size distribution of TiO2NP (Figure S1). However, samples could only be sonicated for 3 min since prolonged sonication caused sample heating. Immediately after sonication, 2 (analytical) subsamples were taken from each bottle and diluted with MilliQ water, i.e., 10 to 400 times for TiO2NPs analysis and 50 to 1000 times for Al-containing NPs analysis.
2.2.2. Sediment Samples
Sediment samples were wet-sieved through a 63 μm sieve with river water and subjected to lyophilization. The TiO2NPs were extracted from the lyophilized sediment using a modified extraction procedure, reported by Dutschke et al. [28]. A known weight (0.375 g) of lyophilized sediment (corresponding to 0.5 g wet sediment) was mixed with 10 mL of 0.1 M NaCl (99.99%, suprapur, Merck Millipore, Burlington, MA, USA) in a 1:20 solid:liquid ratio to remove any exchangeable divalent cations (predominantly Ca2+). The solution was thoroughly mixed using a vortex mixer (Vibromix 10, Tehtnica, Železniki, Slovenia) for 10 s and probe sonicated for 10 min using a Qsonica Sonicator Q125 (L.L.C, Newton, CT, USA), equipped with a 6 mm probe (model CL-18) and operated at an 80% amplitude in pulse operation mode. Since all particles were expected to be aggregated to sizes > 30 nm in 0.1 M NaCl, the mixture was centrifuged for 49 min at 8603× g using a Hettich Universal 320 centrifuge (Beverly, MA, ZDA) to remove TiO2NPs particles larger than 30 nm. The centrifugation speed and settling time were calculated assuming a particle density of 4 g/cm3. The supernatant was removed, and the step was repeated. Afterwards, any excess NaCl was carefully removed, and the sediment re-resuspended in 12 mL of MilliQ water, followed by vortex mixing for 10 s and probe sonication for 10 min. The suspension was centrifugated to a 300 nm cut-off size (centrifugation for 10 min at 425× g) and 10 mL of supernatant were carefully collected and replaced with 10 mL of MilliQ water. Two more washing steps were performed until the supernatant was substantially less turbid. Finally, the supernatant fractions (total volume: 30 mL) were combined and stored in the dark at 4 °C. The extraction of each sediment sample was performed in triplicate (N = 3). Prior to analysis, the sediment extracts were shaken on a horizontal shaker for 10 min at 300 rpm and sonicated for 3 min at 100 W power and 37 Hz frequency. In total, 2 (analytical) subsamples were taken from each extract and diluted with MilliQ water (250,000 to 500,000 times for TiO2NPs analysis and 100,000 to 500,000 times for Al-containing NPs).
The efficiency of the extraction procedure was evaluated by analyzing sediment samples spiked with a TiO2NPs standard reference material SRM 1898, obtained from NIST (Gaithersburg, MD, USA), since no reference material for TiO2NPs in sediment matrix is available. The SRM 1898 suspension for spiking was prepared as described in the Supplementary Material. An aliquot (0.1876 mL) of the SRM 1898 suspension containing 2 mg/mL of TiO2NPs was added to 0.375 g of BCR-320R (channels sediments, IRMM, Geel, Belgium) and 0.375 g of sediment collected at MOJ to give a concentration of 1000 µg TiO2NPs per g of sediment in the spiked samples. Spiked sediment samples were subjected to the same extraction procedure described above. The samples were prepared in triplicate, and from each triplicate, two (analytical) subsamples were taken for analysis.
2.3. Single Particle ICP-MS Analysis of NPs in Water and Sediment Samples
2.3.1. spICP-MS Method
spICP-MS analysis of TiO2NPs and Al-containing NPs was performed on an 8800 Triple Quadrupole ICP-MS instrument (Agilent Technologies, Santa Clara, CA, USA) equipped with 2 quadrupoles and a collision/reaction cell. Based on recommendations by the instrument supplier [29], 48Ti+ isotope was measured in MS/MS mass-shift mode using O2 and H2 reaction gases to overcome isobaric interference on 48Ca+. In this measurement mode, the first quadrupole (Q1) was set to m/z 48 (the mass of the precursor 48Ti+ ion) and the second quadrupole (Q2) was set to m/z 64 (the mass of the target product ion 48Ti16O+). O2 promotes the formation of the 48Ti16O+ product ion, and H2 helps with the formation of 48Ca16O1H+, avoiding interference of 48Ca16O+ on 48Ti16O+. In a separate batch, 27Al+ isotope was measured in single quad mode with He as the collision gas to reduce carbon- and nitrogen-based polyatomic interferences on m/z 27. The signal intensity of each isotope was recorded in time-resolved mode for 60 s using a dwell time of 3 ms. An accurate sample flow rate (at peristaltic pump speed of 0.1 rotations/s) was determined daily by pumping a known weight of MilliQ water at room temperature (N = 2). Instrument tuning was performed prior to analysis according to the manufacturer’s recommendation. Instrumental settings for the spICPMS analysis are summarized in Table S2.
For all samples, the dilution factor was adjusted in such a way that the number of detected particles during 1 acquisition was >100 to reduce the random error governed by Poisson statistics to 10% and lower than 1170 to limit relative bias due to multiple particle events to below 3%, assuming a transport efficiency of 0.06, sample flow rate of 0.33 mL/min, and a dwell time of 3 ms [30]. Another criterion for selecting the optimal dilution factor was a low baseline signal that can be increased due to spectral interferences and/or dissolved analyte. Applied dilution factors resulted in a baseline signal corresponding to a Ti mass concentration lower than 12 ng/L and an Al mass concentration lower than 300 ng/L.
Each of the two analytical subsamples for the river water were measured twice by spICP-MS, and the blank samples (MilliQ water) were treated identically to the samples. To prevent particles from sticking to the components of the ICP-MS sample introduction system, a 4% nitric acid solution (prepared from 67–70% HNO3, Carlo Erba Reagents, Val-de-Reuil, Normandie, France) was aspirated after each sample for 45 s at a flow rate of 1 mL/min, followed by rinsing with MilliQ water for another 45 s at a flow rate of 1 mL/min.
Transport efficiency was determined daily according to the “particle size” method [31] using gold nanoparticle (AuNP) reference suspensions (RM8012 and RM8013, NIST, Gaithersburg, MD, USA) with an average particle diameter of 27.6 ± 2.1 nm for RM8012 and 56.0 ± 0.5 nm for RM8013, as determined by TEM. RM8012 and RM8013 suspensions were diluted with MilliQ water to reach an AuNP concentration of 5 and 50 ng/L, respectively. For calibration, a series of dissolved Au standards (0, 0.1, 0.5, 1.0, and 2.0 ng/mL) were prepared from a stock standard solution of ionic Au (1.000 ± 0.002 g Au/L, H(AuCl4) × 3H2O in 12.7% HCl, Titrisol® from Merck, Burlington, MA, USA) in MilliQ water.
The performance of the spICP-MS method was evaluated by analyzing SRM 1898. According to the certificate of analysis provided by NIST, SRM 1898 consists of 76% anatase and 24% rutile, with TiO2 particles of a primary size < 50 nm (as observed by TEM) and a volume-weighted mean diameter of 71 nm in a water suspension as determined by laser diffraction spectrometry (LDS). A standard solution, prepared from the SRM 1898 (Supplementary Material), was analyzed with each batch of samples.
2.3.2. Data Analysis
Data processing was performed by exporting the recorded signal intensities (in cps) from ICP-MS software to an Excel spreadsheet (Microsoft Office Excel 2019, Microsoft, Redmond, WA, USA) developed for spICP-MS data processing by RIKILT (Imperial Quality Control of Agricultural and Horticultural Products, University of Wageningen, Wageningen, The Netherlands). Particle mass, number concentration, and particle size (expressed as mass-equivalent spherical diameter) were determined following the previously described procedure [32]. Quantification of the particle mass was based on calibration curves constructed from the blank (MilliQ water) and a series of dissolved Ti or Al standards (0.2 to 5.0 µg/L) prepared from the stock standard solution of ionic Ti or Al (1000 ± 4 mg/L in 2–3% HNO3, Merck). Particle mass was converted into the particle diameter by assuming particles with a spherical shape consisting of TiO2 (Ti mass fraction 0.6) in the anatase form with a density of 3.9 g/cm3 or Al-containing NPs (Al mass fraction 1.0) with a density of 2.7 g/cm3.
The threshold for distinguishing the baseline signal from the nanoparticulate signal was calculated using an iterative algorithm based on the average signal plus N times the standard deviation of the whole data set. For the analysis of TiO2 and Al-containing NPs, an iterative algorithm based on 6 and 5 times the standard deviation was applied, respectively. In the case of TiO2 NPs, the corresponding particle thresholds resulted in minimum detectable particle diameters ranging from 28 to 38 nm in river water and from 34 to 46 nm in sediment extracts, depending on the intensities of the baseline signal. For Al-containing particles, the minimum detectable particle diameters ranged from 68 to 79 nm in water samples and from 113 to 177 nm for particles in sediment extracts, again depending on the intensities of the baseline signal.
The particle number limit of quantification (LOQ) was calculated as 10 times the standard deviation of the number of particles detected in a minimum of 6 blank samples. All samples were blank corrected, and only those above LOQ were considered for quantification.
2.4. Total ICP-MS Analysis of Ti and Al in Water and Sediment Samples
The total mass concentration of Ti and Al in bulk water and sediment samples was determined by conventional ICP-MS analysis of acid-digested samples. Water and sediment samples were digested as previously described by Vidmar et al. [33]. Briefly, a 10 mL aliquot of river water sample or a 0.25 g aliquot of lyophilized sediment sample was transferred into a Teflon vessel. In total, 4 mL of nitric acid (67–70% HNO3), 1 mL of hydrochloric (30% HCl), and 2 mL of hydrofluoric acid (40% HF) were added in the first step, and 6 (for water samples) or 12.5 mL (for sediment samples) of boric acid (4% H3BO3) were added in the second step. All acids were supplied from Merck Millipore. The samples were subjected to 2-step microwave assisted digestion: ramping to T = 200 °C in 30 min, holding at T = 200 °C for 60 min (first step), ramping to T = 200 °C in 15 min, holding at T = 200 °C for 30 min (second step). A CEM MARS 6 Microwave Acceleration Reaction System (CEM Corporation, Stallings, NC, USA) was used for sample digestion. The acid digests were made up to 30 mL with MilliQ water and appropriately diluted prior to ICP-MS analysis. Quantification was performed based on external calibration by measuring Ti and Al ionic standards prepared in 1% nitric acid in the concentration range of 0.1–500 µg/L and online internal standard (25 µg/L Rh in 1% nitric acid). Each sample was digested in parallel, and at least seven blank samples were prepared for each set of experiments.
The performance of the analytical procedure for total Ti and Al determination in the acid-digested water and sediment samples was evaluated by analyzing a BCR-320R reference material (informative value for Ti: 1785 ± 15 mg/kg and for Al: 30.2 ± 0.0 mg/g) and SRM 1898 suspension, which were both digested in the same way as water and sediment samples. Briefly, a 10 mL suspension of 50 ng/mL TiO2NPs prepared from SRM 1898 standard, and a 0.20 g aliquot of BCR-320R standard were digested in triplicate and analyzed by conventional ICP-MS. Mass recovery for the determination of Ti in SRM 1898 was 94 ± 11% (N = 3). Good mass recoveries were also achieved for Ti (94 ± 2%, N = 3) and Al (105 ± 5%, N = 5) in BCR-320R.
3. Results
3.1. TiO2 Nanoparticles in River Water Samples
The performance of the spICP-MS/MS method for TiO2NPs in river water was evaluated using SRM 1898, prepared at 50 ng/L of TiO2NP in MilliQ water. The particle size distribution is shown in Figure S2. The average particle diameter, calculated as the mass-equivalent spherical diameter assuming spherical particles in anatase form, was 65 ± 2 (N = 8), which agrees with the certified value (volume-weighted mean diameter of 71 ± 4 nm, as determined by LDS). The minimum detectable particle diameter, i.e., the smallest observable particle diameter in the particle size distribution, was 36 nm. In addition to the particle size, good analytical recovery (92 ± 16%, N = 8) was achieved for the mass concentration of TiO2NPs. Repeatability was evaluated by analyzing SRM 1898 over 10 different days. Table S3 shows the particle mass recovery, particle number concentration, mean particle diameter determined on each day of analysis, and the between-day repeatability expressed as the relative standard deviation (RSD). The results show good repeatability for the mean particle diameter (RSD 4%) and satisfactory repeatability (RSD 17%) for particle mass and number concentration, similar to that reported in the literature [34].
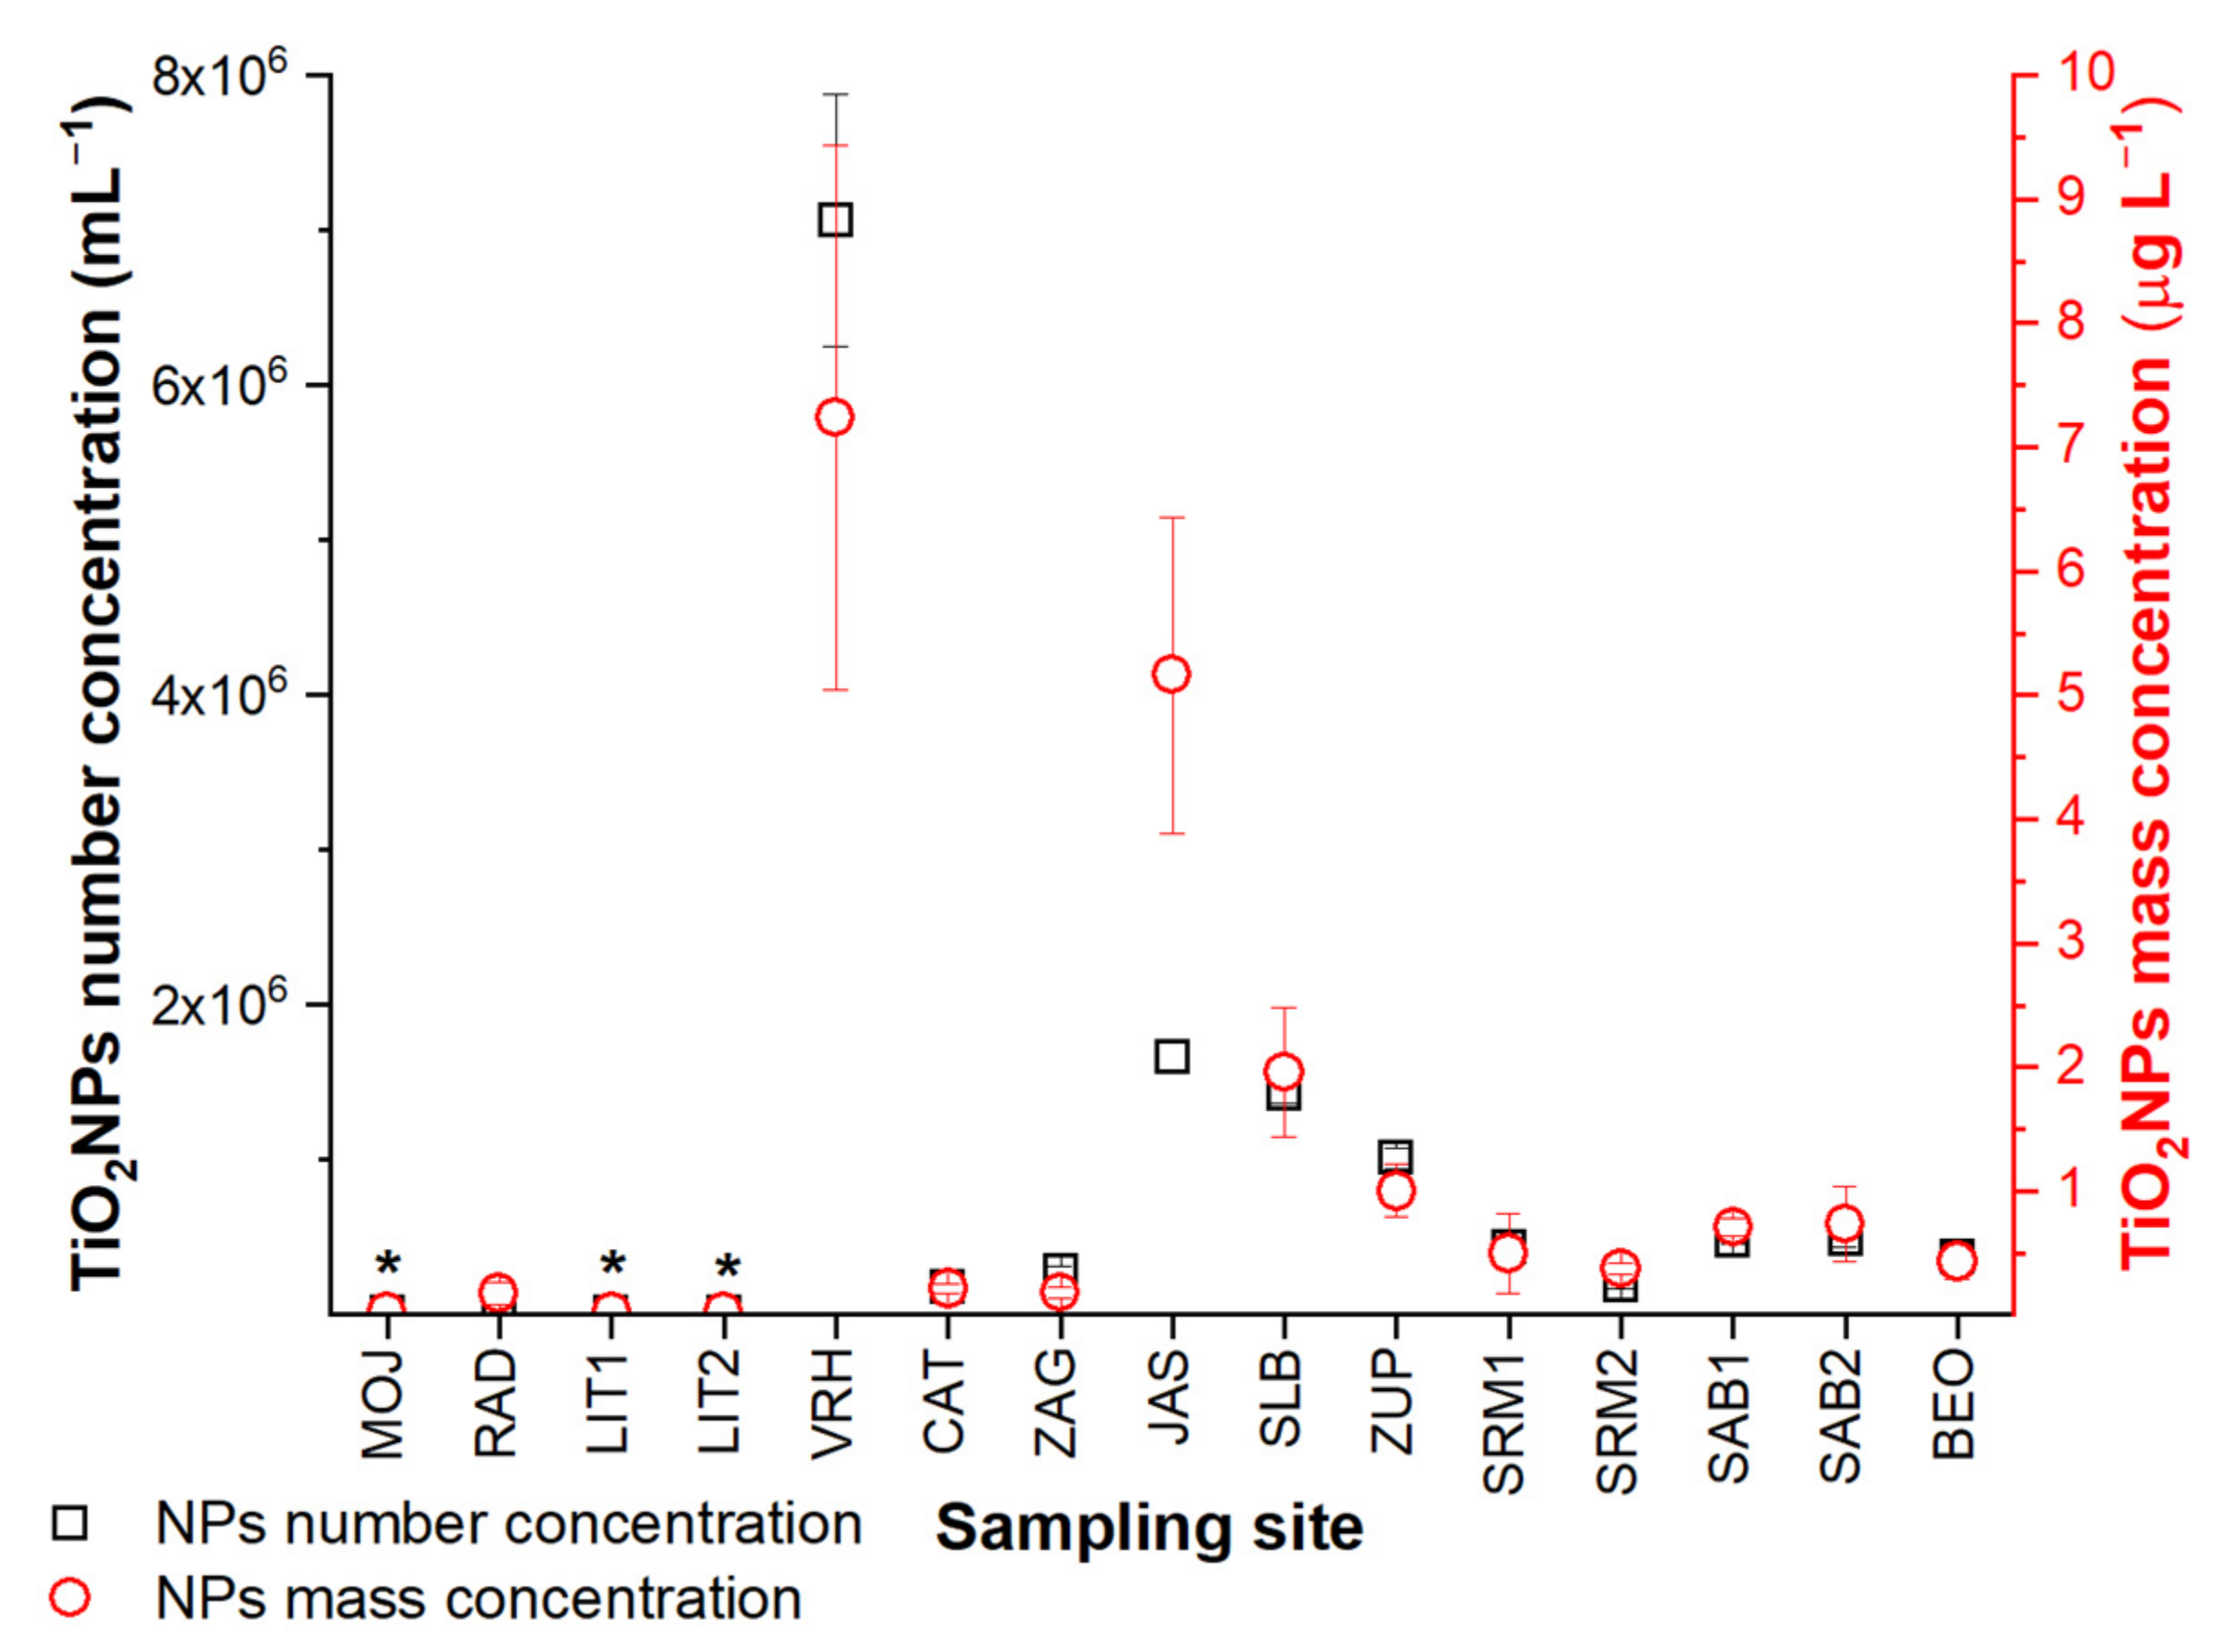
The mass and number concentration of TiO2NPs determined in the water samples of the Sava River are presented in Figure 2.
At most sampling sites, the TiO2NPs concentrations were low (<1 µg/L or 106 particles/mL). At the MOJ reference location and LIT, the TiO2NPs concentrations were <LOQ (LOQ values for TiO2NPs mass and number concentrations were 0.027 µg/L and 6.9 × 10³ particles/mL, respectively). The highest TiO2NPs concentrations were observed at VRH (7.23 ± 2.2 µg/L), JAS (5.16 ± 1.27 µg/L), and SLB (1.96 ± 0.52 µg/L), all of which are impacted by different industrial, urban, or agricultural activities (Table S1) that could contribute to the release of TiO2NPs into surface water. At LIT, SRM, and SAB, the mass and number concentrations of TiO2NPs detected at the input sources (1) were not significantly higher than those at the output (2).
As can be seen from Table S4, the sizes of detected TiO2NPs did not differ significantly among different sampling sites. The size range was between ~30(minimum detectable particle diameter) and ~400 nm (maximum detectable particle diameter), with average particle diameters ranging from 51 to 63 nm across the sampling sites.
In addition, the total Ti mass concentrations determined in acid-digested samples by conventional ICP-MS analysis were significantly higher than the total Ti concentrations determined in the diluted samples by spICP-MS (calculated as the sum of Ti-NPs and ionic Ti, Table S5). Total Ti quantified by spICP-MS represented only 0.4 to 8% of the total Ti measured in the acid-digested water samples. This difference could be explained by the inability of spICP-MS to detect large Ti-bearing particles/aggregates/agglomerates and Ti associated with natural colloids/minerals present in the river water. This observation is supported by a strong correlation (Spearman correlation coefficient of 0.74) between the TiO2NPs in water and Ti associated with the SPM (particles > 450 nm) in river water (Figure S3).
Using spICP-MS, it was also possible to distinguish the ionic form of Ti from TiO2NPs. From Table S5, it is clear that ionic Ti represented only a small percentage (around 10%) of the total Ti measured by spICP-MS, which can be explained by the low dissolution rate of TiO2NPs and/or the fact that Ti is a lithophile element and tends to form minerals.
3.2. TiO2 Nanoparticles in Sediment Samples
The performance of the extraction procedure was evaluated by analyzing sediment samples spiked with SRM 1898. Analytical recoveries were determined based on the expected particle mass (1000 µg TiO2NPs/g sediment) and number concentration (1.0 × 10¹² TiO2NPs/g sediment) in the spiked sediment samples. The results in Table S6 show that mass and number recoveries close to 100% were achieved for both sediment samples, and the extraction procedure did not alter the particle size distribution of SRM 1898 (Figure S4). This demonstrates that the applied method is efficient for the quantitative extraction of TiO2NPs from sediments while preserving their original size.
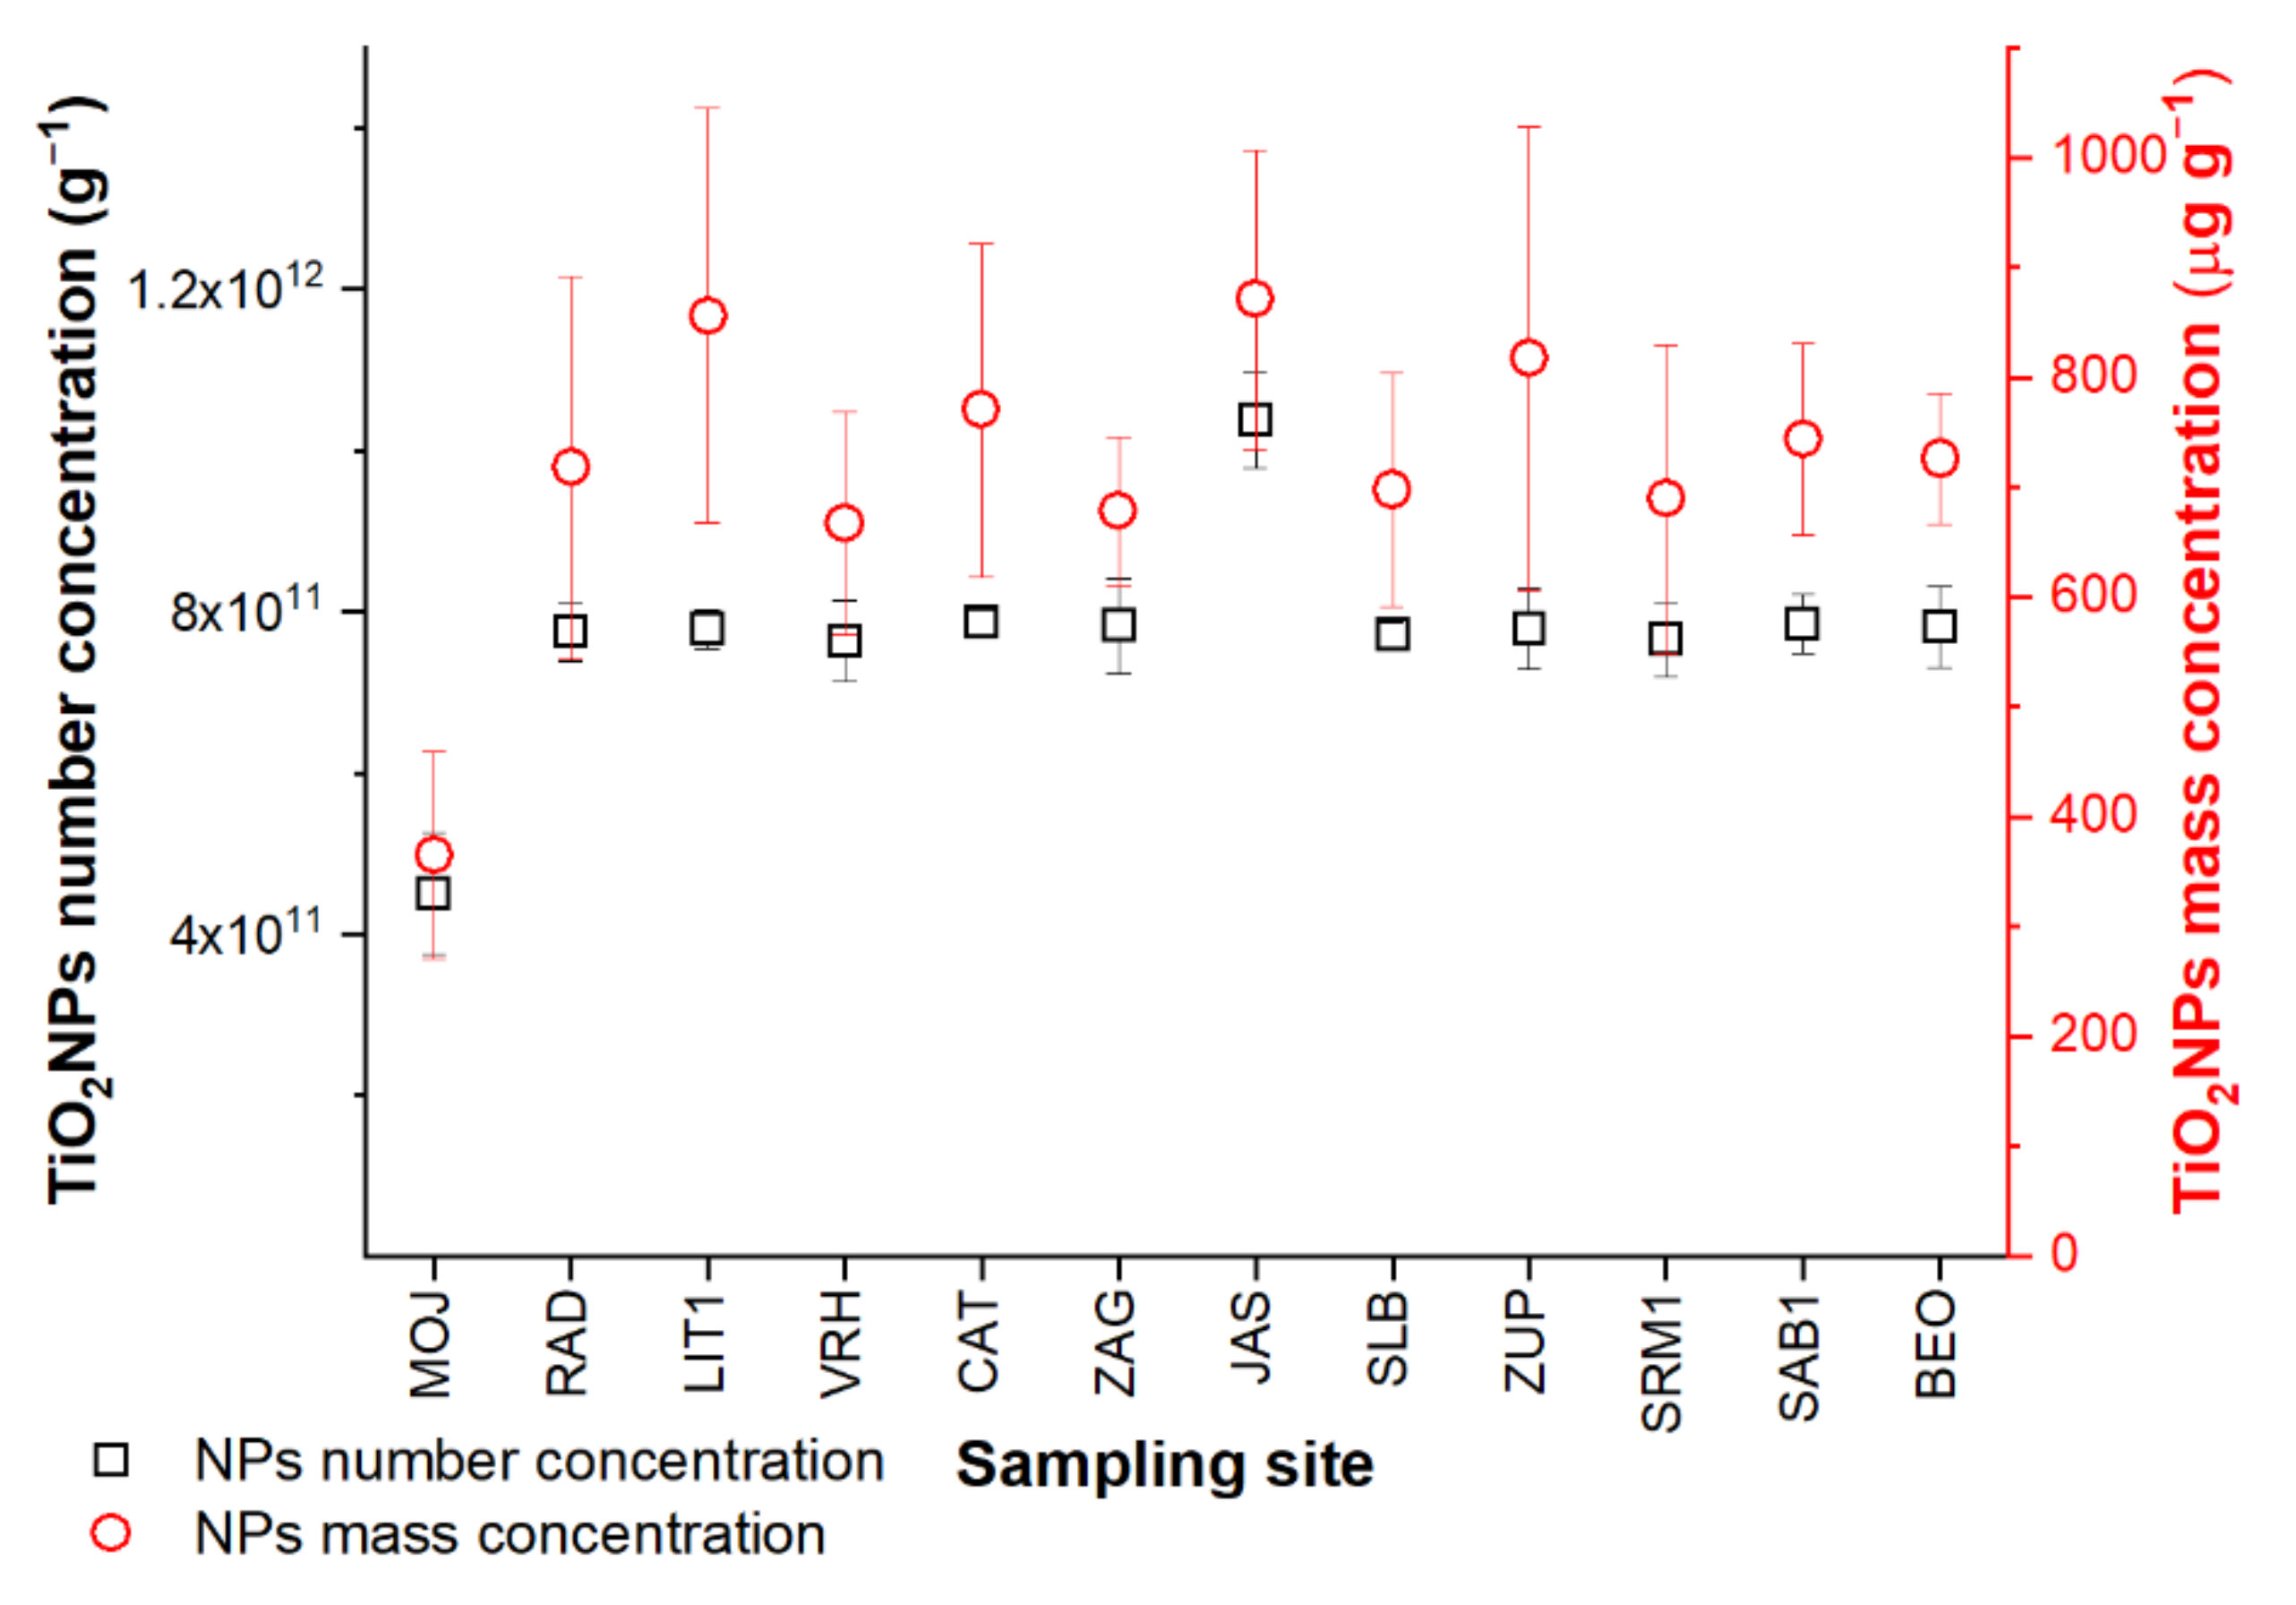
The mass and number concentrations of TiO2NPs extracted from river sediments and quantified by spICP-MS are presented in Figure 3.
The results show how the TiO2NPs concentrations did not differ among sampling locations (from 365 ± 94 µg/g at MOJ to 871 ± 136 µg/g at JAS) as much as in river water (Figure 2). Similar to the water samples, the lowest TiO2NPs concentration was observed in sediment extracts from the unpolluted MOJ site while the size of the TiO2NPs did not differ significantly among the sampling sites (Table S7). The size range of TiO2NPs detected in sediment extracts was between ~40 and ~250 nm, with average particle diameters ranging from 59 to 67 nm across all sampling sites.
A fraction of Ti-containing NPs relative to the total Ti mass concentration (calculated as the sum of Ti-NPs and ionic Ti) determined in sediment extracts by spICP-MS ranged from 60 to 94% (Table S8). The data (Table S8) show a decreasing trend in the percentage of the NP fraction along the Sava River basin, which is a consequence of an increase in ionic Ti along the Sava River basin, with Ti-NPs concentrations staying relatively constant. Notably, the “ionic Ti” fraction does not contain dissolved Ti only but also TiO2NPs < size LOD. As the minimum detectable diameter (Table S7) gradually increases from MOJ (38 nm) to BEO (44 nm), a larger proportion of particles smaller <size LOD is considered as the “ionic Ti” fraction. An increase in small TiO2NPs (<size LOD) along the Sava River basin could also be attributed to the gradual increase in the mass fraction of fine-grained sediment (<63 µm) and the content of clay particles (smaller than 2 µm) as the Sava turns from a highland into a lowland river [7].
The total Ti concentration in the sediment extracts determined by spICP-MS represented only around 50% of the total Ti measured in the acid-digested bulk (Table S8). This finding is likely related to the ability of the analytical procedure applied (extraction method + spICP-MS) to recover and detect only TiO2 particles within the size range of 36 (minimum detectable diameter) and 341 nm (maximum particle diameter detected in extracted samples). The upper size limit corresponds to the 300 nm cut-off size applied in the extraction procedure.
3.3. Studying the Origin of TiO2 Nanoparticles in the Sava River
3.3.1. Correlation of TiO2 Nanoparticles in Water and Sediment Samples
To evaluate if TiO2NPs detected in river water are correlated with their concentrations in the river sediments across all sampling sites, the Spearman correlation coefficient (SCC) between the TiO2NPs mass concentrations in water and sediment was calculated. A very weak correlation was found (SSC of 0.08) when considering all locations where TiO2NPs > LOQ were observed (Figure S5A). When VRH and SLB were excluded, the TiO2NPs concentration in sediments extracts (Figure S5B) strongly correlated with the increasing TiO2NPs content in river water (SSC of 0.68), indicating that TiO2NPs observed at VRH and SLB are not a result of sediment resuspension. Since the spICP-MS method cannot detect larger Ti-bearing particles, as discussed later, a correlation analysis of total Ti concentrations determined in the acid-digested bulk water and bulk sediment samples was also performed. A moderate correlation (Figure S6) was obtained when considering all sampling locations (SCC of 0.43), and a very strong correlation was obtained when excluding VRH and BEO (SCC of 0.85). However, following the levels of TiO2NPs in sediment samples is not a suitable tool for evaluating the extent of pollution with TiO2NPs, given that naturally present Ti-containing particles are present in sediments in much higher concentrations than anthropogenic TiO2NPs. This is also why TiO2NPs concentrations found in river water samples (Figure 2) exhibited substantially more variability across the sampling locations than those found in sediment samples (Figure 3).
Another aspect to consider when evaluating contaminants in river waters is hydrological conditions. Heavy rains, for instance, can dilute the concentrations of pollutants and/or re-suspend some of them from riverbed sediments. Milačič et al. [7] demonstrated that hydrological conditions and the composition of sediments greatly influence the amount of SPM in river water. A strong correlation exists (SCC of 0.74) between the TiO2NPs concentration in water and the Ti concentration associated with SPM in water (Figure S3), and an even stronger correlation (SCC of 0.84) is obtained when VRH is excluded, indicating that the increased level of TiO2NPs at VRH cannot be explained solely by the presence of SPM in river water.
In addition, more particles are expected to be released into river water in the lowest reaches of the Sava, given that the water discharges and the mass fraction of the fine sediment particles <63 μm gradually increased along the Sava [7]. However, a weak correlation (SCC of 0.200) between TiO2NPs in river water with sediment fraction <63 µm was observed. Again, the exclusion of VRH and JAS produces a strong correlation (SCC of 0.68), which suggests that a higher fraction of sediment <63 µm leads to an increase in the release of TiO2NPs from bottom sediments and thus a higher TiO2NPs concentration in water at most sampling sites while the elevated TiO2NPs levels in river water VRH and JAS are most likely from external contamination.
3.3.2. Determination of Ti/Al Elemental Ratios
To evaluate whether the TiO2NPs found in Sava River waters and sediments were of natural or anthropogenic origin, an approach based on the determination of elemental ratios between Ti and Al concentrations was tested. Al is an example of a conservative element since it is a major constituent of aluminosilicates and is likely to coexist with Ti in minerals, such as palygorskite, montmorillonite, illite, kaolinite, hectorite etc. [4], also in the form of naturally occurring particles. Anthropogenic TiO2NPs, on the other hand, have a relatively pure elemental composition, although TiO2NPs released from certain products (sunscreens, clothing) can contain Al as a coating agent adsorbed on their surface [35]. If the contribution of anthropogenic TiO2NPs to the Ti concentration is sufficiently high, an increase in the Ti/Al ratio above the variation of the natural background would be observed and therefore attributed to the presence of anthropogenic TiO2NPs in the sample. To determine the Ti/Al elemental ratio in NPs detected in water and sediment samples, the mass concentration of Ti-containing NPs was divided by the mass concentration of Al-containing NPs.
First, the correlation between the mass concentrations of Ti- and Al-containing NPs detected in water and sediment samples was evaluated (Figure 4).
The very strong correlation between Ti- and Al-containing NPs in river water (SCC of 0.89) and strong correlation in sediment extracts (SCC of 0.79) when excluding data from JAS suggests that Ti-containing particles in the river are associated with Al-containing particles. When the mass concentration of Ti-containing NPs was normalized to the mass concentration of Al-containing NPs to determine the Ti/Al elemental ratio of NPs at each sampling location (Figure 5), the elemental ratios of Ti/Al associated with NPs were significantly higher in sediment extracts (median: 0.250 ± 0.055) than in river waters (median: 0.051 ± 0.029).
However, it must be emphasized that the applied extraction procedure was only optimized for the quantification of TiO2NPs in sediments and not for Al-containing NPs. The performance of the Al-containing NPs extraction procedure was assessed by comparing their concentration in the extracts of BCR-320R sediment determined by spICP-MS to the total Al concentration determined in acid-digested BCR-320R sediment by conventional ICP-MS. A recovery of 29.6 ± 1.7% (N = 6) was achieved. If the mass concentrations of Al-containing NPs were corrected for the corresponding recovery, the Ti/Al ratios in sediments would be lower (median: 0.074 ± 0.016) and thus no longer significantly higher than the ratios in river water. Furthermore, the Ti/Al ratios in water and sediment samples did not significantly differ among sampling locations except at JAS, where a significant increase in the Ti/Al ratio was observed in both river and sediment samples. To identify the origin of the detected TiO2NPs at each sampling location based on the Ti/Al elemental concentration ratios, natural background information for the Ti/Al ratio values at the selected sites is required. Background Ti/Al information is likely a specific value for a given sampling site and varies, e.g., based on geographical location, and the composition of river sediments. Quartz is a prevailing mineral phase in sediment fractions <63 μm along the Sava River basin, with calcite and dolomite being the most abundant at RAD (the representative sampling site from the upper Sava). In contrast, in BEO (representative sampling site from the lower Sava), clay minerals (i.e., illite/muscovite and chlinochlore, all of them are aluminosilicates) prevailed [7].
Therefore, to confirm the presence of anthropogenic TiO2NPs in river water at JAS, the Ti/Al elemental concentration ratios of NPs in water or sediments were compared to the corresponding natural background elemental concentration ratio [24]. To determine natural background levels and to exclude potential artefacts in analyzing Al-containing NPs in sediments extracts, Ti/Al ratios were calculated in the acid-digested bulk water and bulk sediment samples, and in the SPM (Figure 6). The Ti/Al mass ratios associated with NPs in sediment extracts were corrected by applying a 30% correction factor.
Variations in the Ti/Al ratios across all sampling sites were the highest in NPs, detected either in water or sediment extracts (Figure 6a). The highest Ti/Al elemental ratios were observed for NPs in sediment extracts (0.074 ± 0.019) and bulk sediments (0.058 ± 0.019), followed by the ratios in SPM (0.053 ± 0.016), bulk water (0.046 ± 0.009), and NPs in water (0.044 ± 0.028), calculated as median values ± SD of all sampling sites. Median values determined in bulk sediments were in close agreement with the reported average sediment elemental ratio (0.0634) while median values in the SPM were similar to the average elemental ratio in river particulate (0.0596) [36]. Therefore, the natural background Ti/Al concentration ratio in water particulates was considered to be equal to the median Ti/Al ratios determined in SPM across all sampling sites. In contrast, sediments’ natural background ratio value was considered equal to the median Ti/Al ratios determined in bulk sediments. Looking at Ti/Al ratios determined at each sampling site (Figure 6b), we can see that at most sampling sites, the ratios associated with NPs in water (blue squares) follow the same trend as in bulk water (green triangles) and SPM (blue triangles). The only 2 outliers can be observed at the JAS (Ti/Al ratio of 0.124) and ZUP sampling sites (Ti/Al ratio of 0.092), where the Ti/Al ratios associated with NPs were significantly higher than the median Ti/Al ratio in SPM (0.053 ± 0.016) (Figure S8). At JAS, the Ti/Al ratio increase in water NPs followed the Ti/Al ratio increase in sediment NPs (0.120), which was significantly higher than the natural background values in sediments (0.058 ± 0.019). These observations confirm that TiO2NPs at JAS result from anthropogenic activities. Interestingly, the Ti/Al ratios at VRH and SLB, which contained one of the highest TiO2NPs concentrations in the water of all sampling sites (Figure 2), were not significantly higher than the natural background ratios.
4. Discussion
In this study, the concentration levels of TiO2NPs in water and sediment samples were determined, for the first time, at selected sampling sites along the Sava River. The TiO2NPs mass concentrations ranged between 0.177 and 7.23 µg/L in river water samples and between 365 and 871 µg/g in river sediment samples across all sampling sites. This corresponded to TiO2NPs number concentrations ranging from (0.07 to 7.0) × 106 particles/mL in river water and from (0.45 to 1.0) × 1012 particles/g in river sediments. The TiO2NPs levels found in the Sava River were comparable to the measured and modelled concentrations of (anthropogenic) TiO2NPs reported in other surface waters (3 ng/L–1.6 μg/L [37]; 104 to 107 NP/mL, corresponding to 0.332 μg/L [11]; 0.2 to 8.1 μg/L [13]; 0.55–6.48 μg/L [22]; 20–140 µg/L following rainfall events [4]). The TiO2NPs levels in the sediments of the Sava River were also within the range of TiO2NPs observed in similar sample matrices, i.e., 550–1800 µg/g in stormwater green infrastructure sediments [24]. The average values for mass-equivalent particle diameters of TiO2NPs in the Sava River ranged from 51 to 63 nm in water and 59 to 67 nm in sediments, assuming spherical anatase particles. Furthermore, the minimum and maximum detectable diameters of 28–38 and 400 nm in river water and 34–46 and 340 nm in sediment extracts were found. These findings were comparable to the reported size distributions of TiO2NPs found in different environmental compartments (~30–60 nm, reported as the mode of diameters [11]; 25–200 nm with a modal size of 50 nm [24]; 50 nm [25]).
Although TiO2NPs levels in the Sava River did not exceed predicted or measured TiO2NPs concentrations in the waters of other river basins, the presence of anthropogenic TiO2NPs could not be excluded. The highest TiO2NPs concentrations among the selected sites along the Sava River were observed at VRH, JAS, and SLB, which is not surprising as different anthropogenic activities severely impact these sampling sites: VRH in Slovenia is located near the hydropower plant and close to different chemical industries, JAS in Croatia is impacted by intense agricultural activities, while SLB in Croatia is located near an oil refinery, metal, and other industries, and a large urban area. Elevated concentrations of potentially toxic elements (Cr, Ni, Cd, Zn, Cu) were also observed in river water samples (in total or soluble fraction < 0.45 µm) that were collected at VRH, JAS, and SLB sampling sites during the same sampling campaign [7].
However, to identify the origin of detected TiO2NPs solely based on their concentration, baseline information for natural nanoparticles present in the selected sites is required. This is a specific value for a selected location and varies based on the geographical location and mineralogical composition of the river sediments, and also depends on the temporal variability due to varying hydrological and metrological conditions [4]. However, in our study, the information on the levels of natural Ti-containing particles at selected sites along the Sava River was not available. Therefore, to study the possible effects of varying river sediment composition and hydrological conditions on the presence of TiO2NPs in river water, a correlation between TiO2NPs in water and sediment extracts was made at each sampling site. In addition, a comparison of their concentrations to the amount of SPM and sediment fraction <63 µm was also made. The SPM was used as an indicator of the varying hydrological conditions, since the transport of certain pollutants in rivers is often facilitated by re-suspension of sediment particles, which are typically mobilized during high discharge events, e.g., floods [38]. For most sampling sites, TiO2NPs concentrations in river water are strongly correlated with the TiO2NPs content in sediment extracts, and with the SPM concentration in water and sediment fraction <63 µm, confirming that the hydrological conditions and sediment composition at each sampling site have a significant influence on the levels of TiO2NPs in river water. The TiO2NPs concentrations in VRH, JAS, and SLB waters did not follow the concentrations of NPs in sediment extracts, the SPM levels, and sediment fraction <63 µm, which suggests that the TiO2NPs observed at these sampling sites are not associated with sediment resuspension but are most likely the results of the external contamination. To further identify the presence of anthropogenic TiO2NPs in the Sava River, the Ti/Al elemental concentration ratios were determined in the detected particles. Like before, natural background information for the Ti/Al ratio values was first established for river water (median value of Ti/Al ratios determined in the bulk SPM samples) and sediment (median value of Ti/Al ratios determined in the bulk sediment samples). Comparing the Ti/Al mass ratios determined in NPs from water and sediment extracts revealed that TiO2NPs detected at the JAS can result from anthropogenic activities.
In this study, spICP-MS was applied as a sensitive technique, providing fast detection of TiO2NPs at low environmental concentrations (in the range of ng/L), and as an element-specific technique, being able to detect NPs of interest among other types of (nano)particles that are also present in complex matrices. To overcome spectral interferences that occur at the same m/z ratio as Ti-containing NPs, a collision/reaction cell technology in combination with tandem ICP-MS instrumentation was used, which enabled the detection of relatively small TiO2NPs (minimum detectable particle diameters of 28–38 nm in river water and 34–46 nm in sediment extracts). Comparable (26 nm [20], 40 nm [19], 37–40 nm [9]) or lower (15 nm [21]) particle size limits were reported for TiO2NPs analyzed in a water suspension by spICP-MS using a similar approach, i.e., MS/MS mode in combination with H2/O2 reaction gas. The lower TiO2NPs size limits achieved by Wojcieszek et al. [21] likely arise from using the latest triple quadrupole ICP-MS instrumentation with enhanced sensitivity and faster time-resolved analysis using microsecond dwell times. Despite its many advantages, spICP-MS still suffers from some limitations. For example, it cannot quantify Ti-carrying particles > 713 nm, i.e., the maximum detectable TiO2NPs diameter in river water (Table S4), that settle during sample dilution and/or cannot be ionized in the plasma. Consequently, the total Ti mass concentrations determined by spICP-MS in water were only 0.4 to 8% of the total Ti concentration measured in acid-digested water samples. Another reason for underestimating the Ti concentration determined by spICP-MS is the adsorption of Ti ions onto the surface of tubing or other parts of the ICP-MS introduction system due to the non-acidified water samples. On the other hand, when measuring total Ti concentrations in water, microwave-assisted digestion of the sample was applied that completely decomposes matrix constituents present in river water as large particles. Similarly, the total Ti concentration determined in sediment extracts by spICP-MS represented only around 50% of the total Ti measured in the acid-digested bulk sediments. Low recoveries can again be related to the inability of the spICP-MS method to detect larger particles and to the applied extraction procedure with a 300 nm cut-off. Low recoveries were also observed in the literature for TiO2 particles extracted from soil samples using Na4P2O7 as extractant, followed by quantification with asymmetrical flow-field flow fractionation coupled to ICP-MS (AF4-ICP-MS) [24]. However, the purpose of this study was not to detect all Ti-bearing particles within the sediment but only the exchangeable fraction that could be released from the river sediment into the water.
Another limitation of the spICP-MS is that the information on the particle chemical composition, shape, and density needs to be known to convert particle mass to particle size. In our study, the composition and shape of Ti-containing NPs observed in environmental samples were unknown and only assumed (spherical TiO2NPs particles in anatase form). For this reason, other complementary techniques (e.g., scanning electron microscopy (SEM) or transmission electron microscopy (TEM) in combination with elemental analyses, such as energy-dispersive X-ray spectroscopy, EDS) are recommended. These techniques that can determine particle chemical composition could also help to evaluate the association of TiO2NPs with other natural particles. Namely, particles with Ti/Al ratios lower than the natural background levels can also be heteroaggregates between anthropogenic TiO2NPs and natural colloids composed of aluminosilicates, which could explain the unexpectedly low Ti/Al ratios determined for NPs in water at VRH and SLB sampling sites (see Figure 6b and Figure S8). Namely, the formation of heteroaggregates between anthropogenic TiO2NPs and natural colloids is far more likely to happen in environmental waters as the concentration of colloids is generally expected to be much higher than the concentration of anthropogenic TiO2NPs [39,40]. Heteroaggregates of TiO2NPs with montmorillonite [41] and kaolin particles [42], both of which contain Al, have been reported before. However, solely based on spICPMS, it is impossible to distinguish between individual anthropogenic TiO2NPs and their aggregates with other minerals. Moreover, determination of the multi-element composition on a particle-per-particle basis, which could provide more reliable discrimination between anthropogenic and natural NPs, was impossible using the described spICP-MS method. Namely, quadrupole-based ICP-MS instruments cannot simultaneously measure 2 different isotopes (e.g., Ti and Al) in a short time (dwell time of 3 ms) as the settling time is required for peak hopping between different isotopes. With the development of improved ICP-MS instrumentation, this issue can be overcome by a time-of-flight (TOF) mass spectrometer (spICP-TOFMS) to provide a multi-elemental fingerprint of an individual NP. The spICP-TOFMS method has already been applied to study NPs origin, their transformation in natural systems, and their interaction with naturally occurring particles [3,11,15,43,44].
Summing up, the water levels of TiO2NPs that were observed along the Sava River do not yet appear to exceed the toxicity threshold for the environment. Based on probabilistic environmental risk assessment, the predicted no effect concentrations of anthropogenic TiO2NPs in freshwater are between 10.6 and 20.7 µg/L (with a median value of 15.7 µg/L) [45]. However, the TiO2NPs concentrations reported in this study only reflect the levels at the time of sampling and do not give a broad picture of TiO2NPs pollution along the Sava River. For instance, hydrological conditions can significantly influence the dilution and redistribution of contaminants between the sediment and water body. Moreover, it is also expected that anthropogenic TiO2NPs will gradually increase in the future, especially near urban areas. Therefore, monitoring their levels and fluctuations in the river water bodies will help in environmental and human health risk assessment.
5. Conclusions
The presented work provides new information on the occurrence, mass/number concentration, and particle size distribution of natural and anthropogenic TiO2NPs in water and sediment samples at 15 selected Sava River basin sampling locations. Overall, low TiO2NPs concentrations were found in river water at the sampling sites that were comparable to the reported values in other river environmental compartments, with the highest concentrations (up to 7 µg/L) detected at VRH, JAS, and SLB. With varying geographical location, hydrological conditions, and pollution stressors, the concentrations of TiO2NPs found in river water exhibited substantially more variability across the sampling locations than those found in sediment samples. Hydrological conditions and sediment composition also influence the levels of TiO2NPs in river water except in the case of VRH, JAS, and SLB, where the observed TiO2NPs are likely not associated with sediment resuspension. By identifying the increase in the Ti/Al mass elemental ratios in NPs relative to the corresponding natural background ratios, the TiO2NPs observed in river and sediment at JAS were anthropogenic in origin.
The spICP-MS/MS method also enabled the detection of relatively small TiO2NPs (the lowest detectable particle diameter was 28 nm) at low concentrations (LOQ values for TiO2NPs mass and number concentrations in river water were 0.027 µg/L and 6.9 × 10³ particles/mL, respectively). Since the composition and shape of the detected particles were unknown, spherical particles in anatase form were assumed. However, other techniques (e.g., SEM/TEM in combination with EDS) are recommended to confirm this assumption. Further work needs to be performed to improve the extraction efficiency of large Ti-containing particles/aggregates/agglomerates, Ti associated with matrix constituents, and Al-containing NPs from sediments, and to validate the relationship between different elemental ratios calculated for anthropogenic and naturally occurring Ti-containing NPs.
It is expected that the results from this study will improve our understanding of the occurrence and origin of TiO2NPs in the Sava River Basin, which will serve as a good foundation for further long-term environmental studies. Since the anthropogenic pressures, particularly in urban areas, will likely increase, and variations in hydrological conditions driven by climate change and other human factors are expected to occur, continuous monitoring of TiO2NPs in the future is recommended.
Supplementary Materials
The following supporting information can be downloaded at: https://www.mdpi.com/article/10.3390/w14060959/s1. Table S1: Information about the Sava River sampling sites [7,46]; Table S2: Instrumental parameters for spICP-MS analysis of TiO2 and Al-containing NPs; Preparation of SRM 1898 standard solution; Table S3: Mass recovery, number concentration and mean particle diameter of TiO2NPs in SRM 1898 solution, determined by spICP-MS/MS on each day of the sample analysis; Table S4: Information on particle size distribution of TiO2NPs detected in river water samples by spICP-MS; Table S5: Comparison of mass concentrations of Ti-containing NPs, ionic Ti and total Ti, determined in diluted river waters by spICP-MS, and total Ti mass concentration determined in the acid-digested river waters by conventional ICP-MS; Table S6: Particle mass and number concentration as well as mean particle diameter for TiO2NPs in non-spiked and spiked sediment samples; Table S7: Information on particle size distribution of TiO2NPs detected in sediment extracts by spICP-MS; Table S8: Comparison of mass concentrations of Ti-containing NPs, ionic Ti and total Ti, determined in sediment extracts by spICP-MS, and total Ti mass concentration determined in the acid-digested bulk sediments by conventional ICP-MS; Figure S1: Particle size distribution of TiO2NPs determined in non-treated and treated (3 min bath sonication) river water sample collected at BEO sampling site; Figure S2: Particle size distribution of TiO2NPs in 50 ng/L SRM 1898 suspension, determined by spICP-MS/MS method; Figure S3: Spearman correlation between the TiO2NPs mass concentration determined in water by spICP-MS and Ti mass concentration in water associated to SPM; Figure S4: Particle size distributions of TiO2NPs (SRM 1898) spiked to BCR-320R sediment reference material, determined by spICP-MS analysis after applying extraction procedure; Figure S5: Correlation between TiO2NPs mass concentration in water and sediment samples determined by spICP-MS; Figure S6: Correlation between total the Ti mass concentration in acid-digested water and sediment samples determined by conventional ICP-MS; Figure S7: Correlation between TiO2NPs mass concentration in water and sediment fraction <63 µm; Figure S8: Ti/Al ratios determined in NPs in water and sediment extracts at each sampling location.
Author Contributions
Conceptualization, J.V. and R.M.; methodology, data curation, J.V. and T.Z.; formal analysis, J.V. and T.Z.; funding acquisition, R.M. and J.Š.; investigation, J.V., R.M. and T.Z.; project administration; R.M. and J.Š.; resources, R.M. and J.Š.; writing—original draft preparation, J.V.; writing—review and editing, T.Z., R.M. and. J.Š.; visualization, J.V.; funding acquisition, R.M. and J.Š. All authors have read and agreed to the published version of the manuscript.
Funding
This research was supported and funded by the 7th Framework Programme of the European Commission under Grant agreement no. 603629-ENV-2013-6.2.1-GLOBAQUA and by the Ministry of Higher Education, Science and Technology of the Republic of Slovenia (Programme group P1-0143).
Institutional Review Board Statement
Not applicable.
Informed Consent Statement
Not applicable.
Data Availability Statement
Not applicable.
Acknowledgments
The authors would like to express sincere gratitude to Ana Drinčić for her assistance in sample collection and total ICP-MS analysis. The authors would likle to thank researchers from the University of Belgrade, Institute for Biological Research “Siniša Stanković”, Department of Hydroecology and Water Protection, Serbia, for technical support during the second sampling campaign within the GLOBAQUA project. Special thanks go to David Heath from the Department of Environmental Sciences, Jožef Stefan Institute, for English correction of the manuscript. The authors would also like to thank David Kocman from the Department of Environmental Sciences, Jožef Stefan Institute, for creating the figure displaying the sampling sites along the Sava River.
Conflicts of Interest
The authors declare no conflict of interest.
References
- Kaegi, R.; Ulrich, A.; Sinnet, B.; Vonbank, R.; Wichser, A.; Zuleeg, S.; Simmler, H.; Brunner, S.; Vonmont, H.; Burkhardt, M.; et al. Synthetic TiO2 Nanoparticle Emission from Exterior Facades into the Aquatic Environment. Environ. Pollut. 2008, 156, 233–239. [Google Scholar] [CrossRef] [PubMed]
- Gondikas, A.P.; Von Der Kammer, F.; Reed, R.B.; Wagner, S.; Ranville, J.F.; Hofmann, T. Release of TiO2 Nanoparticles from Sunscreens into Surface Waters: A One-Year Survey at the Old Danube Recreational Lake. Environ. Sci. Technol. 2014, 48, 5415–5422. [Google Scholar] [CrossRef] [PubMed]
- Loosli, F.; Wang, J.; Rothenberg, S.; Bizimis, M.; Winkler, C.; Borovinskaya, O.; Flamigni, L.; Baalousha, M. Sewage Spills Are a Major Source of Titanium Dioxide Engineered (Nano)-Particle Release into the Environment. Environ. Sci. Nano 2019, 6, 763–777. [Google Scholar] [CrossRef] [PubMed]
- Nabi, M.M.; Wang, J.; Baalousha, M. Episodic Surges in Titanium Dioxide Engineered Particle Concentrations in Surface Waters Following Rainfall Events. Chemosphere 2021, 263, 128261. [Google Scholar] [CrossRef] [PubMed]
- Hochella, M.F.; Madden, A.S. Earth’s Nano-Compartment for Toxic Metals. Elements 2005, 1, 199–203. [Google Scholar] [CrossRef]
- Rashid, M.M.; Tavčer, P.F.; Tomšič, B. Influence of Titanium Dioxide Nanoparticles on Human Health and the Environment. Nanomaterials 2021, 11, 2354. [Google Scholar] [CrossRef] [PubMed]
- Milačič, R.; Zuliani, T.; Vidmar, J.; Oprčkal, P.; Ščančar, J. Potentially Toxic Elements in Water and Sediments of the Sava River under Extreme Flow Events. Sci. Total Environ. 2017, 605–606, 894–905. [Google Scholar] [CrossRef] [PubMed]
- Degueldre, C.; Favarger, P.-Y. Colloid Analysis by Single Particle Inductively Coupled Plasma-Mass Spectroscopy: A Feasibility Study. Colloids Surf. A Physicochem. Eng. Asp. 2003, 217, 137–142. [Google Scholar] [CrossRef]
- Vidmar, J. Detection and Characterization of Metal-Based Nanoparticles in Environmental, Biological and Food Samples by Single Particle Inductively Coupled Plasma Mass Spectrometry. In Comprehensive Analytical Chemistry; Elsevier: Amsterdam, The Netherlands, 2021; Volume 93, pp. 345–380. [Google Scholar]
- Laborda, F.; Bolea, E.; Jiménez-Lamana, J. Single Particle Inductively Coupled Plasma Mass Spectrometry: A Powerful Tool for Nanoanalysis. Anal. Chem. 2014, 86, 2270–2278. [Google Scholar] [CrossRef] [PubMed]
- Azimzada, A.; Jreije, I.; Hadioui, M.; Shaw, P.; Farner, J.M.; Wilkinson, K.J. Quantification and Characterization of Ti-, Ce-, and Ag-Nanoparticles in Global Surface Waters and Precipitation. Environ. Sci. Technol. 2021, 55, 9836–9844. [Google Scholar] [CrossRef]
- Donovan, A.R.; Adams, C.D.; Ma, Y.; Stephan, C.; Eichholz, T.; Shi, H. Single Particle ICP-MS Characterization of Titanium Dioxide, Silver, and Gold Nanoparticles during Drinking Water Treatment. Chemosphere 2016, 144, 148–153. [Google Scholar] [CrossRef]
- Peters, R.J.B.; van Bemmel, G.; Milani, N.B.L.; den Hertog, G.C.T.; Undas, A.K.; van der Lee, M.; Bouwmeester, H. Detection of Nanoparticles in Dutch Surface Waters. Sci. Total Environ. 2018, 621, 210–218. [Google Scholar] [CrossRef]
- Weir, A.; Westerhoff, P.; Fabricius, L.; Hristovski, K.; von Goetz, N. Titanium Dioxide Nanoparticles in Food and Personal Care Products. Environ. Sci. Technol. 2012, 46, 2242–2250. [Google Scholar] [CrossRef] [Green Version]
- Gondikas, A.; Von Der Kammer, F.; Kaegi, R.; Borovinskaya, O.; Neubauer, E.; Navratilova, J.; Praetorius, A.; Cornelis, G.; Hofmann, T. Where Is the Nano? Analytical Approaches for the Detection and Quantification of TiO2 Engineered Nanoparticles in Surface Waters. Environ. Sci. Nano 2018, 5, 313–326. [Google Scholar] [CrossRef]
- Rand, L.N.; Flores, K.; Sharma, N.; Gardea-Torresdey, J.; Westerhoff, P. Quantifying Nanoparticle Associated Ti, Ce, Au, and Pd Occurrence in 35 U.S. Surface Waters. ACS EST Water 2021, 1, 2242–2250. [Google Scholar] [CrossRef]
- Bitragunta, S.P.; Palani, S.G.; Gopala, A.; Sarkar, S.K.; Kandukuri, V.R. Detection of TiO2 Nanoparticles in Municipal Sewage Treatment Plant and Their Characterization Using Single Particle ICP-MS. Bull. Environ. Contam. Toxicol. 2017, 98, 595–600. [Google Scholar] [CrossRef]
- Bolea-Fernandez, E.; Balcaen, L.; Resano, M.; Vanhaecke, F. Overcoming Spectral Overlap: Via Inductively Coupled Plasma-Tandem Mass Spectrometry (ICP-MS/MS). A Tutorial Review. J. Anal. At. Spectrom. 2017, 9, 1660–1679. [Google Scholar] [CrossRef]
- Noireaux, J.; López-Sanz, S.; Vidmar, J.; Correia, M.; Devoille, L.; Fisicaro, P.; Loeschner, K. Titanium Dioxide Nanoparticles in Food: Comparison of Detection by Triple-Quadrupole and High-Resolution ICP-MS in Single-Particle Mode. J. Nanopart. Res. 2021, 23, 102. [Google Scholar] [CrossRef]
- Candás-Zapico, S.; Kutscher, D.J.; Montes-Bayón, M.; Bettmer, J. Single Particle Analysis of TiO2 in Candy Products Using Triple Quadrupole ICP-MS. Talanta 2018, 180, 309–315. [Google Scholar] [CrossRef]
- Wojcieszek, J.; Jiménez-Lamana, J.; Ruzik, L.; Asztemborska, M.; Jarosz, M.; Szpunar, J. Characterization of TiO2 NPs in Radish (Raphanus sativus L.) by Single-Particle ICP-QQQ-MS. Front. Environ. Sci. 2020, 8, 125. [Google Scholar] [CrossRef]
- Wagner, S.; Gondikas, A.; Neubauer, E.; Hofmann, T.; Von Der Kammer, F. Spot the Difference: Engineered and Natural Nanoparticles in the Environment-Release, Behavior, and Fate. Angew. Chem.-Int. Ed. 2014, 53, 12398–12419. [Google Scholar] [CrossRef] [PubMed]
- Wang, J.; Nabi, M.M.; Mohanty, S.K.; Afrooz, A.N.; Cantando, E.; Aich, N.; Baalousha, M. Detection and Quantification of Engineered Particles in Urban Runoff. Chemosphere 2020, 248, 126070. [Google Scholar] [CrossRef] [PubMed]
- Baalousha, M.; Wang, J.; Nabi, M.M.; Loosli, F.; Valenca, R.; Mohanty, S.K.; Afrooz, N.; Cantando, E.; Aich, N. Stormwater Green Infrastructures Retain High Concentrations of TiO2 Engineered (Nano)-Particles. J. Hazard. Mater. 2020, 392, 122335. [Google Scholar] [CrossRef] [PubMed]
- Slomberg, D.L.; Auffan, M.; Guéniche, N.; Angeletti, B.; Campos, A.; Borschneck, D.; Aguerre-Chariol, O.; Rose, J. Anthropogenic Release and Distribution of Titanium Dioxide Particles in a River Downstream of a Nanomaterial Manufacturer Industrial Site. Front. Environ. Sci. 2020, 8, 76. [Google Scholar] [CrossRef]
- European Communities Technical Report 2009-025. In Common Implementation Strategy for the Water Framework Directive (2000/60/EC), Guidance Document No. 19 Guidance on Surface Water Chemical Monitoring under the Water Framework Directive; Office for Official Publications of the European Communities: Luxembourg, 2009.
- European Communities Technical Report 2010-041. In Common Implementation Strategy for the Water Framework Directive (2000/60/EC), Guidance Document No. 25 on Chemical Monitoring of Sediment and Biota under the Water Framework Directive; Office for Official Publications of the European Communities: Luxembourg, 2010.
- Dutschke, F.; Irrgeher, J.; Pröfrock, D. Optimisation of an Extraction/Leaching Procedure for the Characterisation and Quantification of Titanium Dioxide (TiO2) Nanoparticles in Aquatic Environments Using SdFFF-ICP-MS and SEM-EDX Analyses. Anal. Methods 2017, 9, 3626–3635. [Google Scholar] [CrossRef]
- Yamanaka, M.; Wilbur, S. Accurate Determination of TiO2 Nanoparticles in Complex Matrices Using the Agilent 8900 ICP-QQQ. Agilent Application Note 2017. Publication Number: 5991-8358EN. Available online: https://www.agilent.com/cs/library/applications/8900_ICP-MS_5991-8358_TiO2_nanoparticles.pdf (accessed on 30 January 2022).
- Abad-Álvaro, I.; Peña-Vázquez, E.; Bolea, E.; Bermejo-Barrera, P.; Castillo, J.R.; Laborda, F. Evaluation of Number Concentration Quantification by Single-Particle Inductively Coupled Plasma Mass Spectrometry: Microsecond vs. Millisecond Dwell Times. Anal. Bioanal. Chem. 2016, 408, 5089–5097. [Google Scholar] [CrossRef] [PubMed]
- Pace, H.E.; Rogers, N.J.; Jarolimek, C.; Coleman, V.A.; Higgins, C.P.; Ranville, J.F. Determining Transport Efficiency for the Purpose of Counting and Sizing Nanoparticles via Single Particle Inductively Coupled Plasma Mass Spectrometry. Anal. Chem. 2011, 83, 9361–9369. [Google Scholar] [CrossRef] [PubMed] [Green Version]
- Vidmar, J.; Milačič, R.; Ščančar, J. Sizing and Simultaneous Quantification of Nanoscale Titanium Dioxide and a Dissolved Titanium Form by Single Particle Inductively Coupled Plasma Mass Spectrometry. Microchem. J. 2017, 132, 391–400. [Google Scholar] [CrossRef]
- Vidmar, J.; Zuliani, T.; Novak, P.; Drinčić, A.; Ščančar, J.; Milačič, R. Elements in Water, Suspended Particulate Matter and Sediments of the Sava River. J. Soils Sediments 2017, 17, 1917–1927. [Google Scholar] [CrossRef] [Green Version]
- Geiss, O.; Bianchi, I.; Senaldi, C.; Bucher, G.; Verleysen, E.; Waegeneers, N.; Brassinne, F.; Mast, J.; Loeschner, K.; Vidmar, J.; et al. Particle Size Analysis of Pristine Food-Grade Titanium Dioxide and E 171 in Confectionery Products: Interlaboratory Testing of a Single-Particle Inductively Coupled Plasma Mass Spectrometry Screening Method and Confirmation with Transmission Electron Micr. Food Control 2021, 120, 107550. [Google Scholar] [CrossRef]
- Lehutso, R.F.; Thwala, M. Assessment of Nanopollution in Water Environments from Commercial Products. Nanomaterials 2021, 11, 2537. [Google Scholar] [CrossRef]
- McLennan, S.M.; Murray, R.W. Geochemistry of Sediments. In Geochemistry. Encyclopedia of Earth Science; Springer: Dordrecht, The Netherlands, 1998; pp. 282–292. [Google Scholar]
- Gottschalk, F.; Sun, T.; Nowack, B. Environmental Concentrations of Engineered Nanomaterials: Review of Modeling and Analytical Studies. Environ. Pollut. 2013, 181, 287–300. [Google Scholar] [CrossRef]
- Rügner, H.; Schwientek, M.; Milačič, R.; Zuliani, T.; Vidmar, J.; Paunović, M.; Laschou, S.; Kalogianni, E.; Skoulikidis, N.T.; Diamantini, E.; et al. Particle Bound Pollutants in Rivers: Results from Suspended Sediment Sampling in Globaqua River Basins. Sci. Total Environ. 2019, 647, 645–652. [Google Scholar] [CrossRef]
- Garner, K.L.; Keller, A.A. Emerging Patterns for Engineered Nanomaterials in the Environment: A Review of Fate and Toxicity Studies. J. Nanopart. Res. 2014, 16, 2503. [Google Scholar] [CrossRef]
- Wang, H.; Adeleye, A.S.; Huang, Y.; Li, F.; Keller, A.A. Heteroaggregation of Nanoparticles with Biocolloids and Geocolloids. Adv. Colloid Interface Sci. 2015, 226, 24–36. [Google Scholar] [CrossRef] [Green Version]
- Zhou, D.; Abdel-Fattah, A.I.; Keller, A.A. Clay Particles Destabilize Engineered Nanoparticles in Aqueous Environments. Environ. Sci. Technol. 2012, 46, 7520–7526. [Google Scholar] [CrossRef]
- Wang, H.; Dong, Y.; Zhu, M.; Li, X.; Keller, A.A.; Wang, T.; Li, F. Heteroaggregation of Engineered Nanoparticles and Kaolin Clays in Aqueous Environments. Water Res. 2015, 80, 130–138. [Google Scholar] [CrossRef] [Green Version]
- Borovinskaya, O.; Hattendorf, B.; Tanner, M.; Gschwind, S.; Günther, D. A Prototype of a New Inductively Coupled Plasma Time-of-Flight Mass Spectrometer Providing Temporally Resolved, Multi-Element Detection of Short Signals Generated by Single Particles and Droplets. J. Anal. At. Spectrom. 2013, 28, 226–233. [Google Scholar] [CrossRef]
- Praetorius, A.; Gundlach-Graham, A.; Goldberg, E.; Fabienke, W.; Navratilova, J.; Gondikas, A.; Kaegi, R.; Günther, D.; Hofmann, T.; von der Kammer, F. Single-Particle Multi-Element Fingerprinting (SpMEF) Using Inductively-Coupled Plasma Time-of-Flight Mass Spectrometry (ICP-TOFMS) to Identify Engineered Nanoparticles against the Elevated Natural Background in Soils. Environ. Sci. Nano 2017, 4, 307–314. [Google Scholar] [CrossRef]
- Coll, C.; Notter, D.; Gottschalk, F.; Sun, T.; Som, C.; Nowack, B. Probabilistic Environmental Risk Assessment of Five Nanomaterials (Nano-TiO2, Nano-Ag, Nano-ZnO, CNT, and Fullerenes). Nanotoxicology 2016, 10, 436–444. [Google Scholar] [CrossRef]
- Sanchís, J.; Milačič, R.; Zuliani, T.; Vidmar, J.; Abad, E.; Farré, M.; Barceló, D. Occurrence of C60 and Related Fullerenes in the Sava River under Different Hydrologic Conditions. Sci. Total Environ. 2018, 643, 1108–1116. [Google Scholar] [CrossRef] [PubMed]
Figure 1.
Location of the Sava River sampling sites.

Figure 2.
Mass and number concentration of TiO2NPs determined in water samples from 15 different locations of the Sava River. Data represent the mean ± STD of four replicates (N = 4). Asterisk (*) denotes sampling sites with TiO2NPs concentrations below LOQ.
Figure 2.
Mass and number concentration of TiO2NPs determined in water samples from 15 different locations of the Sava River. Data represent the mean ± STD of four replicates (N = 4). Asterisk (*) denotes sampling sites with TiO2NPs concentrations below LOQ.

Figure 3.
Mass and number concentration of TiO2NPs determined in sediment extracts from 12 different locations of the Sava River. Data represent the mean ± STD of six replicates (N = 6).
Figure 3.
Mass and number concentration of TiO2NPs determined in sediment extracts from 12 different locations of the Sava River. Data represent the mean ± STD of six replicates (N = 6).

Figure 4.
Correlation between mass concentrations of Ti- and Al-containing NPs determined by spICP-MS in (a) river water and (b) sediment samples (when excluding data from JAS). Log-log plot in graph (a). Spearman correlation coefficients (SCCs) are presented in graph (a,b).
Figure 4.
Correlation between mass concentrations of Ti- and Al-containing NPs determined by spICP-MS in (a) river water and (b) sediment samples (when excluding data from JAS). Log-log plot in graph (a). Spearman correlation coefficients (SCCs) are presented in graph (a,b).

Figure 5.
Ti/Al ratios determined in NPs detected in water (blue squares) and sediment extracts (red circles), collected along the Sava River. Each data represents the mean ± STD of N replicates (N = 4 for water and N = 6 for sediment samples). The median value ± std for each sample type was calculated by considering all sampling sites, and its lower (median − std) and upper limit (median + std) are shown as dotted lines.

Figure 6.
Ti/Al mass ratios determined in NPs in water, NPs in sediment extracts, bulk water, bulk sediment, and SPM: (a) Boxplots of Ti/Al values for each sample matrix determined by considering data from all sampling sites. Limits of the boxes and whiskers represent 25–75% percentiles and range within the 1st quartile, respectively, while the solid line and empty circle represent the median and mean ratios, respectively, observed within each sample matrix. (b) Ti/Al ratios of NPs in water, NPs in sediment extracts, bulk water, bulk sediment, and SPM at each sampling site. Each data represents the mean ± STD of N replicates (N = 4 for NPs in water, N = 6 for NPs in sediment samples, N = 4 for bulk water, N = 2 for bulk sediment and SPM).

Publisher’s Note: MDPI stays neutral with regard to jurisdictional claims in published maps and institutional affiliations. |
© 2022 by the authors. Licensee MDPI, Basel, Switzerland. This article is an open access article distributed under the terms and conditions of the Creative Commons Attribution (CC BY) license (https://creativecommons.org/licenses/by/4.0/).
Share and Cite
MDPI and ACS Style
Vidmar, J.; Zuliani, T.; Milačič, R.; Ščančar, J. Following the Occurrence and Origin of Titanium Dioxide Nanoparticles in the Sava River by Single Particle ICP-MS. Water 2022, 14, 959. https://doi.org/10.3390/w14060959
AMA Style
Vidmar J, Zuliani T, Milačič R, Ščančar J. Following the Occurrence and Origin of Titanium Dioxide Nanoparticles in the Sava River by Single Particle ICP-MS. Water. 2022; 14(6):959. https://doi.org/10.3390/w14060959
Chicago/Turabian StyleVidmar, Janja, Tea Zuliani, Radmila Milačič, and Janez Ščančar. 2022. "Following the Occurrence and Origin of Titanium Dioxide Nanoparticles in the Sava River by Single Particle ICP-MS" Water 14, no. 6: 959. https://doi.org/10.3390/w14060959
Note that from the first issue of 2016, this journal uses article numbers instead of page numbers. See further details here.