
Soil Water Use Strategies of Dominant Tree Species Based on Stable Isotopes in Subtropical Regions, Central China

School of Soil and Water Conservation, Beijing Forestry University, Beijing 100083, China
*
Author to whom correspondence should be addressed.
Water 2022, 14(6), 954; https://doi.org/10.3390/w14060954
Submission received: 17 January 2022
/
Revised: 1 March 2022
/
Accepted: 16 March 2022
/
Published: 18 March 2022
(This article belongs to the Section Soil and Water)
Abstract
:Water is a crucial factor affecting plant growth and ecosystem processes. In the subtropical region, global climate change leads to frequent seasonal droughts. How plant water strategies and the adaptability of forest ecosystems change is an urgent issue to be discussed. In this study, four sample plots (P. massoniana for Plot 1, C. lanceolata for Plot 2, Q. acutissima for Plot 3, C. funebris and I. corallina for Plot 4) were selected in the Taizishan Mountain area of Hubei, China, including three forest types (coniferous forest, broad-leaved forest and coniferous broad-leaved mixed forest) and five dominant tree species. The δD and δ18O isotope compositions in plant and soil water were analysed, and the water use strategies of dominant species were predicted by using the MixSIAR model. The water absorption depth and proportion of the five species were significantly different in different seasons. In plot 4, I. corallina and C. funebris derived (58.8 ± 14.0% and 55.7 ± 23.4%, respectively) water from 10–40 cm soil in wet season, but C. funebris shifted to derive water from deep soil in dry season. This result indicates that the mixing of C. funebris and I. corallina can effectively prevent water competition in dry season with water deficit. From wet season to dry season, the depth of water utilisation of the P. massoniana, C. lanceolata, Q. acutissima and C. funebris with deep roots converted from shallow to deep soil, suggesting that the four species had significant dimorphic root systems and strong ecological plasticity.
1. Introduction
Water is an important factor affecting plant growth, and plant water use is one of the most basic processes of terrestrial ecosystem hydrological cycles. In ecologically fragile areas, the available water in plants plays a decisive role in plant growth and distribution [1,2,3]. However, water use and response vary among different vegetation types [4], which also depend on plant growth forms and environmental conditions [5,6,7]. In recent years, global climate change and human disturbance have led to drastic changes in hydrological variables such as rainfall, evaporation, runoff, soil water and groundwater level [8,9]. The change in hydrological patterns leads to the increase of uncertainty of vegetation succession [10,11,12]. Under this complex environmental background, the adaptability of forest ecosystem has attracted the attention of many scholars. The study of plant adaptability to water is of great significance to understand how forest ecosystems respond to the hydrological process of soil vegetation atmosphere interface [5,13,14].
Previous scholars used a variety of methods to determine the water source of plants, such as sap flow technology [15], root system excavation [16,17] and judgment through plant physiological indicators [18,19]. Quantifying the proportional contributions of various water sources to plants is significant in advancing our knowledge of absolute contributions of root water uptake across multiple plant water sources given the complex hydrological systems of soil as well as the spatial and temporal variability in the plant water uptake process [14]. However, root system excavation not only causes damage to the environment, but also takes a long time, which is not conducive to dynamic observation [20]. Neither the method of sap flow technology nor judgment through plant physiological indicators can accurately quantify the proportion of water uptake by plants [16,21]. Since the 1980s, a growing number of scholars have begun to use stable isotope technology to explore water sources of plants and successfully solved many problems between plants and ecological environment research [17,22,23,24,25,26], provides an efficient, accurate and low-destructive method for studying different potential plant water sources [27]. Previous studies have shown that, with the exception of a few halophytes [28], isotope composition will not be fractionated when a plant absorbs water through the root system and the water is transported in the plant [29,30]. This finding shows that stable isotopic composition in plant tissue is a comprehensive reflection of different water sources. Therefore, by comparing the isotopic composition of plant xylem water and various water sources, we can effectively identify and distinguish the source of plant water use [31].
Several methods can be used to determine water sources of plants by using stable isotopes D and 18O: direct observation method [32], two-or-three-compartment linear model-N-CLM [33,34], a model to determine mean depth of water uptake [35], IsoSource model [34], the Bayesian-mixing model MixSIR, SIAR and MixSIAR [36,37,38]. Direct observation method assumes that plants only use soil water at a certain depth, but in fact, plant water is composed of multiple sources [29,39]. It is usually a mixture of soil water at multiple depths [40]. Two-or-three-compartment linear model-N-CLM is limited to calculating the contribution proportion of three or less water sources to plant water [41]. Iso-source model can estimate the contribution proportion range of multiple water sources to plant water [42] but ignores the uncertainty of water source, and its contribution proportion range cannot be expressed by a single probability. Bayesian mixing models improve upon simpler linear mixing models by explicitly taking into account uncertainty in source values, categorical and continuous covariates and prior information. The latest MixSIAR model combines the advantages of MixSIR and SIAR models and adds modules such as the input form of multivariate isotope raw data source of contribution source, random effect classification variables and residual + process error, which significantly improves the accuracy of quantitative calculation of plant water source and its contribution proportion [38].
To date, the study of water utilisation sources of plants based on stable isotope technology has many achievements. Numerous studies have shown that plants will adopt different water use strategies under water stress [40,43], and soil water content is highly consistent with plant water use depth [23]. White et al. [44] studied the water source of white pine (Pinus strobus L.) in the northeast of the United States by using stable isotope technology, and found that white pine makes efficient use of summer precipitation, but turns to use deep soil water and groundwater in the dry season. McCole et al. [41] reported that Juniperus ashei in Texas had different seasonal water use sources; it preferentially uses deep soil water sources in summer and shallow soil water in winter. Nippert [45] found that plants have seasonal water use strategies; when the surface water is rich enough, some deep-rooted plants will turn to absorbing and utilising surface soil water. In a Northern Mongolian tribe, Larix sibirica Ledeb. is known to absorb and use 0–30 cm soil water mainly in the wet season, whereas deep soil water becomes its chief water source in the dry season [46]. Similar results were also found in plants such as Pinus massoniana Lamb., Pinus elliotti and Cunninghamia lanceolata (Lamb.) Hook. [40]. Research on plant water uptake by using stable isotope technology and related mathematical models mainly focused on arid and semi-arid areas [14,47,48,49,50]. However, only a few studies have been conducted on plant water use in subtropical humid areas. Moreover, a comprehensive comparison about water use status of different plant types is generally lacking throughout existing studies. In the subtropical monsoon climate region, although precipitation is rich, seasonal differences result in serious seasonal drought [51,52,53,54]. The analysis of plant water sources in subtropical monsoon climate region under different water conditions is helpful to understand plant growth characteristics and water cycle process of regional forest system [55].
The Taizishan area of Hubei Province belongs to the middle and upper reaches of the Yangtze River, and it is located in the low mountains and hilly area of Central China. It is the key area of the Yangtze River water conservation belt and the southern management and restoration area. In order to relieve the pressure of timber demand, plantation forests such as Pinus massoniana Lamb., Cunninghamia lanceolata (Lamb.) Hook. had been planted on a large scale, leading to ecological problems such as reduced biodiversity, decreased productivity and serious pests and diseases. Moreover, in the subtropical monsoon climate, although precipitation is abundant, seasonal differences, uneven distribution of precipitation and serious seasonal drought are evident. Faced with the dual constraints of fragile forest ecosystems due to plantation management patterns and severe seasonal droughts due to climatic characteristics, how the water use strategy of plants and the adaptability of forest ecosystem will change are uncertain. In this paper, we take the typical plantation (coniferous forest, broad-leaved forest and coniferous broad-leaved mixed forest) in Taizishan mountain area as the research objects, attempt to analyse the hydrogen and oxygen stable isotopic compositions of plant stem water and soil water of the dominant species Pinus massoniana Lamb., Cunninghamia lanceolata (Lamb.) Hook., Quercus acutissima Carr., Cupressus funebris Endl. and Ilex corallina Franch. We also determine plant water sources and quantify the proportion of plant water uptake from the soil water by using MixSIAR mixing models. Moreover, we aim to discuss the adaptability of different plant water use strategies to seasons and water changes, and provide insights into tree species selection for reasonable mixing for Taizishan mountain area.
2. Materials and Methods
2.1. Study Site
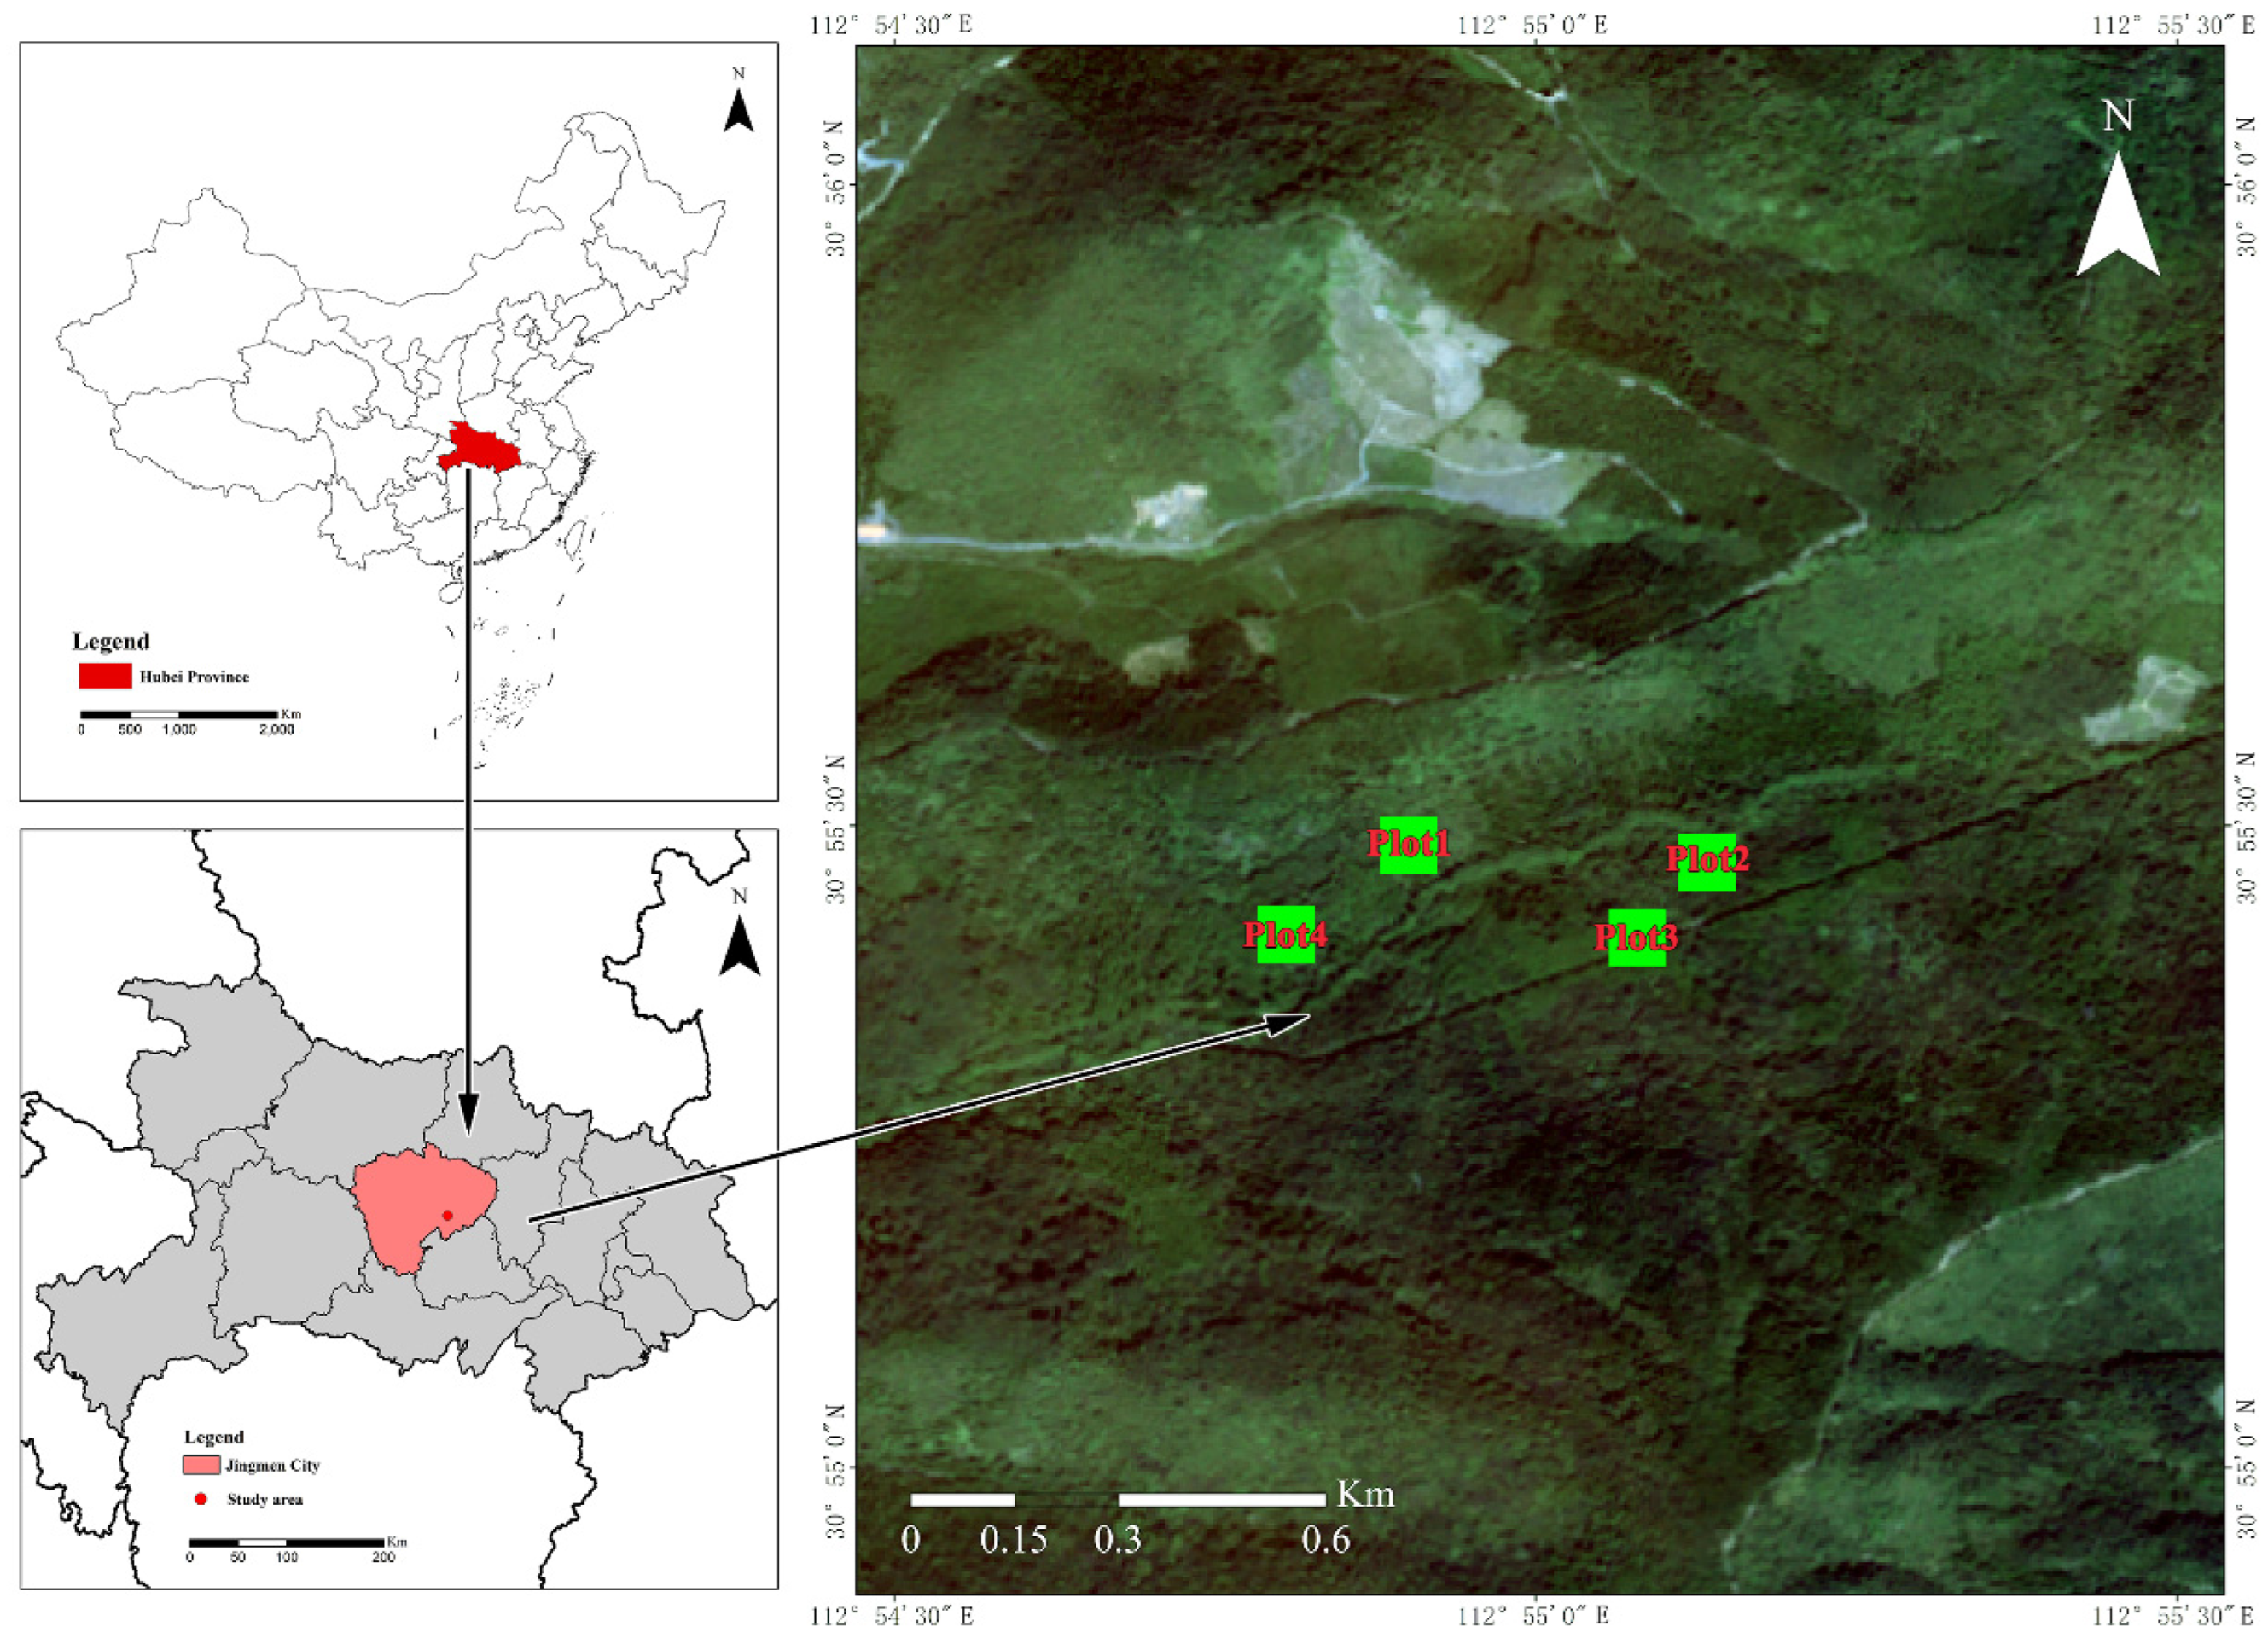
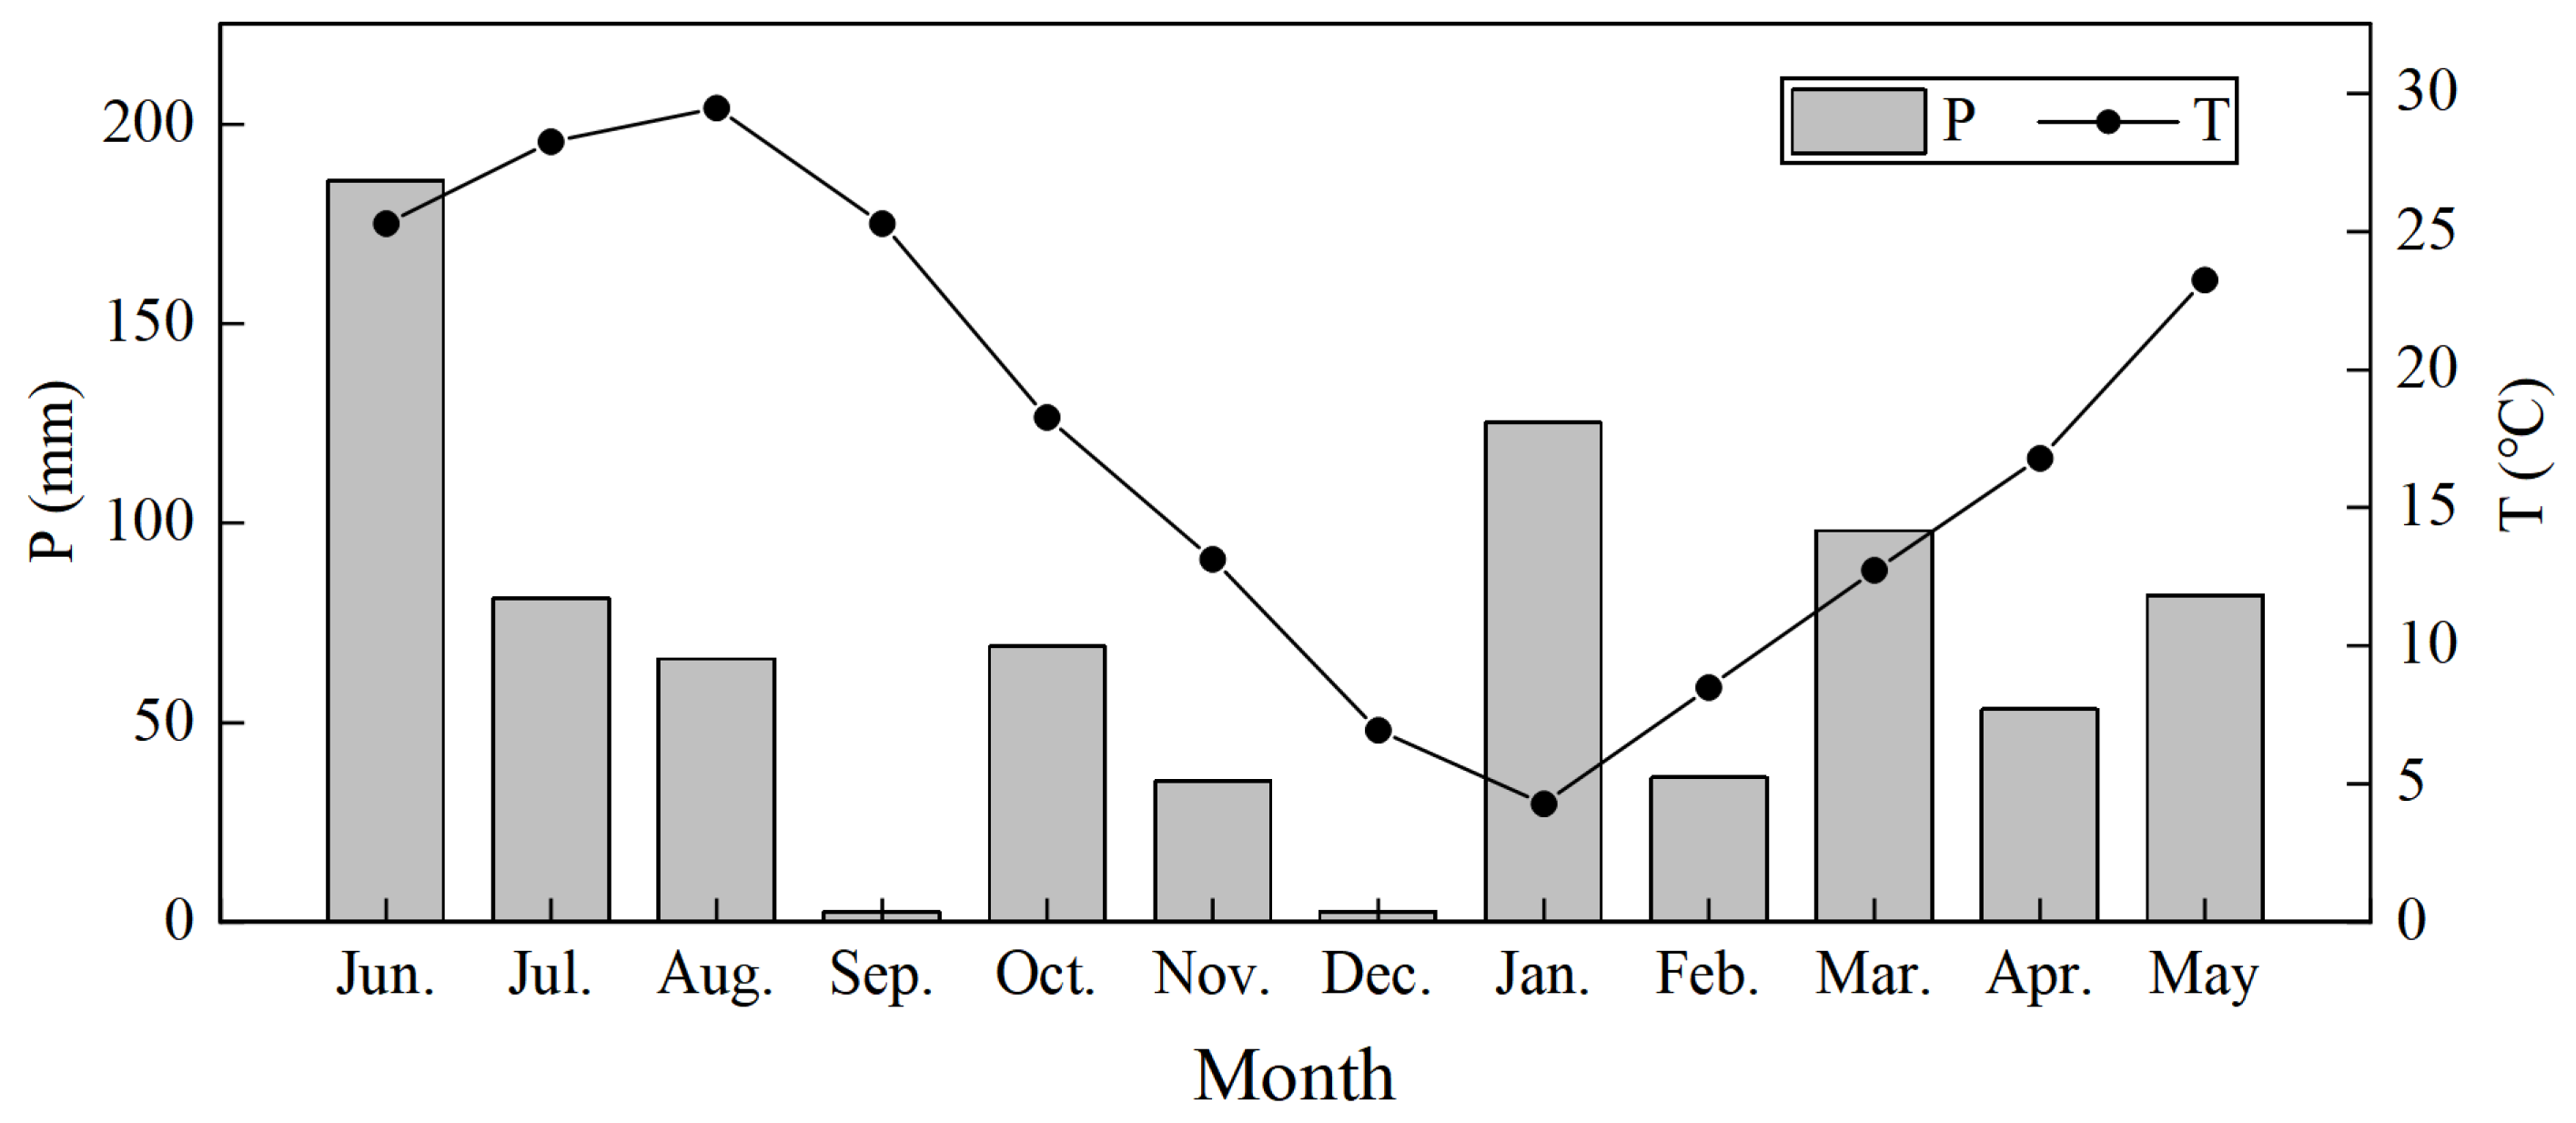
The study area is located in Jingshan County, Jingmen City, Central Hubei Province, at 30°56′23”–30°54′15” N, 112°53′12”–112°56′21” E, with an altitude of 40.3–467.4 m (Figure 1). This region is affected by subtropical monsoon humid climate, with an average annual precipitation of 1094.6 mm. Precipitation is unevenly distributed throughout the year, with obvious seasonal differences. Rainfall is mainly concentrated from January to August (Figure 2). From September to December, it enters the dry season with less precipitation (Figure 2). The relative humidity and annual average temperature is 70% and 16.4 °C, respectively, with a frost-free period of 240 days. The soil is mainly clayey yellow brown soil developed from loess parent material, and the thickness of soil layer is 50–100 cm. The pH value of located soil is between 5.5 and 6.5, which is slightly acidic. Natural vegetation is dominated by Quercus L., mostly distributed in areas with poor site conditions such as bare rocks and barren soil layers. Artificial vegetation mainly includes Chinese fir (Cunninghamia lanceolata (Lamb.) Hook.) forest, Pinus massoniana (Pinus massoniana Lamb.) forest, cypress forest (Cupressus funebris Endl.) and a variety of broad-leaved forests. The main herbs are ferns (Pteridophyta) and Bambusa (Miscanthus floridulus (Labill. Warb.). We selected June 2019 to May 2020 as the observation period. See Table 1 for the basic conditions of the study site.
2.2. Observation of Meteorological Factor
A Vantage Pro2 Type Automatic Weather Station was installed in the open area near the experimental plots to monitor the temperature, rainfall, rainfall intensity, air humidity, wind speed and other meteorological factors in real time. In this study, it was mainly used to record the time of rainfall to ensure that no rainfall event occurs before the experiment.
2.3. Litter Collection and Root Characteristics Investigation
Three small plots that measure 40 cm × 40 cm were set to collect litter in each plot. Five points were selected randomly to measure the thickness of litter. The litter collected in the field was dried in an oven at 70 °C and weighed. The volume of litter per unit area in each forest land was calculated. The litter was soaked for 24 h to determine its maximum water-holding capacity [56].
In each plot, three trees with good growth were selected for root investigation. At 0.5–1 m away from the base of the trunk, soil was excavated step by step on a layer of 10 cm according to the area of 30 cm × 30 cm. The excavating depth of five species was within 100 cm. Soil was broken through sieving and roots were picked out. The roots were classified according to diameter: coarse root (>5 mm), medium root (2–5 mm) and fine root (<2 mm). The roots were dried in an oven at 70 °C and weighed to calculate the proportion of roots of different diameters in each soil layer.
2.4. Stable Isotope Sample Collection and Determination
The samples of each rainfall greater than 1 mm were collected during the observation period. In order to avoid the influence of rainfall, plant and soil collection were carried out 3–10 days after rainfall. Three representative standard plants with good growth were selected from each dominant tree species, and three xylem branches were collected from each plant as plant tissue samples. In addition, the phloem tissue of plants was removed to avoid isotopic fractionation of xylem water and contamination by isotopic enriched water [57]. Soil samples were collected simultaneously with plant tissue sampling. The collection of soil samples was carried out at a thickness of 10 cm each layer within a radius of 1 m, centred on the trunk of the standard plant from which the plant samples were collected. Three replicate samples were taken from each soil layer. Soil samples were divided into two: one portion was stored in a freezer for isotopic analysis and the other was used to obtain gravimetric soil water content (SWC, %) as determined by drying at 105 °C until the weight did not change anymore. All stable isotope samples required prompt loading into sampling vials, sealing with parafilm film and storage in a holding oven at 0–5 °C, with prompt freezing to −20 °C after being brought back to the laboratory until isotope determination. Water in plant and soil samples was extracted by using cryogenic vacuum distillation system (LI-2100, LICA, Beijing, China). An isotope ratio mass spectrometer (Finnigan Delta V Advantage, Thermo Fisher Scientific, Inc., Waltham, MA, USA) and an elemental analyser (Flash 2000HT, Thermo Fisher Scientific, Inc., Waltham, MA, USA) were used to determine the extracted water samples and analyse the stable isotope composition of hydrogen and oxygen in each sample. The measurement precision was consistently ±2‰ for δD and ±0.2‰ for δ18O. Isotopic ratios are expressed in thousands of differences from the Vienna Standard Mean Ocean Water (V-SMOW):
where Rsample and Rstandard represent the molar abundance ratios of the sample and V-SMOW (D/H, 18O/16O), respectively.
2.5. Data Analysis
This study first used a direct comparison method [32] based on δD and δ18O of soil water and xylem water to discriminate the root water absorption depth of five plant species in different seasons, with an assumption that plant roots give priority to the use of a specific layer of soil water at any time, that is, by comparing the soil water isotope and the corresponding plant xylem water isotope value in the same period (δD and δ18O are compared respectively). When the δD and δ18O value of soil water and xylem water has a common and unique intersection, the depth corresponding to this point could be determined as the water absorption depth of the plant. When there are two or more common intersections, the root water absorption depth is not unique. If there is no common intersection, the main water absorption depth is difficult to determine [40].
Meanwhile, the Bayesian model MixSIAR was used to determine the water sources of five plants and calculate their contribution proportion. Considering the water content of soil profile, soil water isotopic composition and root distribution characteristics, the soil profile was divided into four layers for water source analysis, namely, the surface layer 0–10 cm, the shallow layer 10–40 cm, the middle layer 40–70 cm and the deep layer 70–100 cm. When quantifying the water source, the soil water isotope values of four soil layers were taken as the average values of soil water isotopes at all depths in the layer. Trees absorb water from roots and roots absorb water from soil without fractionation in this process. [29], Therefore, soil water can be regarded as the water source of trees (source data), and the isotopic value of xylem water is the “mixture data” of multiple soil water isotopes, which was input into the MixSIAR model. “Short” was specified as the run length of Markov chain Monte Carlo, error structure was set to “residual only” in the model, and the contribution ratio of corresponding median values (50% quartiles) of each water source calculated is the contribution rate of the water source to plant water.
To understand the differences among plant water and soil water of different tree species, analysis of variance is needed for the isotopic values of plant water and soil water [3]. Firstly, Kolmogorov–Smirnov (K–S) test was carried out on the isotopic values of plant water and soil water. The K–S test showed that the isotopic ratio of plant tissue and soil water accorded with normal distribution. Two-way analysis of variance (ANOVA) was used to explore the differences of plant water isotope values in different seasons and different species, and one-way ANOVA was used to analyse the differences of soil water isotope values at different depths in each sample plot. The above data analyses were conducted in SPSS 24.0.
3. Results
3.1. Characteristics of Litter and Soil Water Content in Different Stand Types
Litter is an important layer in forest hydrological process [56,58]. It plays an important role in intercepting precipitation, inhibiting soil water evaporation [59], increasing soil water infiltration [60] and preventing soil erosion [61]. Table 2 shows that the litter thickness of the four plots were 3.66 cm for Plot 3 (Q. acutissima), 3.35 cm for Plot 4 (C. funebris and I. corallina), 2.98 cm for Plot 2 (C. lanceolata) and 1.56 cm for Plot 1 (P. massoniana), in descending order. The litter storage of four plots were 9.6 t·hm−2 for Plot 3 (Q. acutissima), 8.25 t·hm−2 for Plot 4 (C. funebris and I. corallina), 7.99 t·hm−2 for Plot 2 (C. lanceolata) and 7.45 t·hm−2 for Plot 1 (P. massoniana), in descending order. The litter thickness and storage of P. massoniana are the smallest, which may be because the leaves of P. massoniana are needle shaped, small in volume and light in weight, which are easier to decompose than other tree species. As for Maximum Moisture Capacity of Litter, the maximum was 15.49 hm−2 for Plot 3 (Q. acutissima), and the minimum was 11.43 t·hm−2 for Plot 1 (P. massoniana). This finding showed that the litter water holding capacity of broad-leaved trees was generally higher than that of coniferous trees. As for the water holding capacity of different stand types, the litter water holding capacity of broad-leaved forest was generally the highest, followed by coniferous and broad-leaved mixed forest, and finally coniferous pure forest. Given that the composition and arrangement of litter in different stands are different, the decomposition degree is also different.
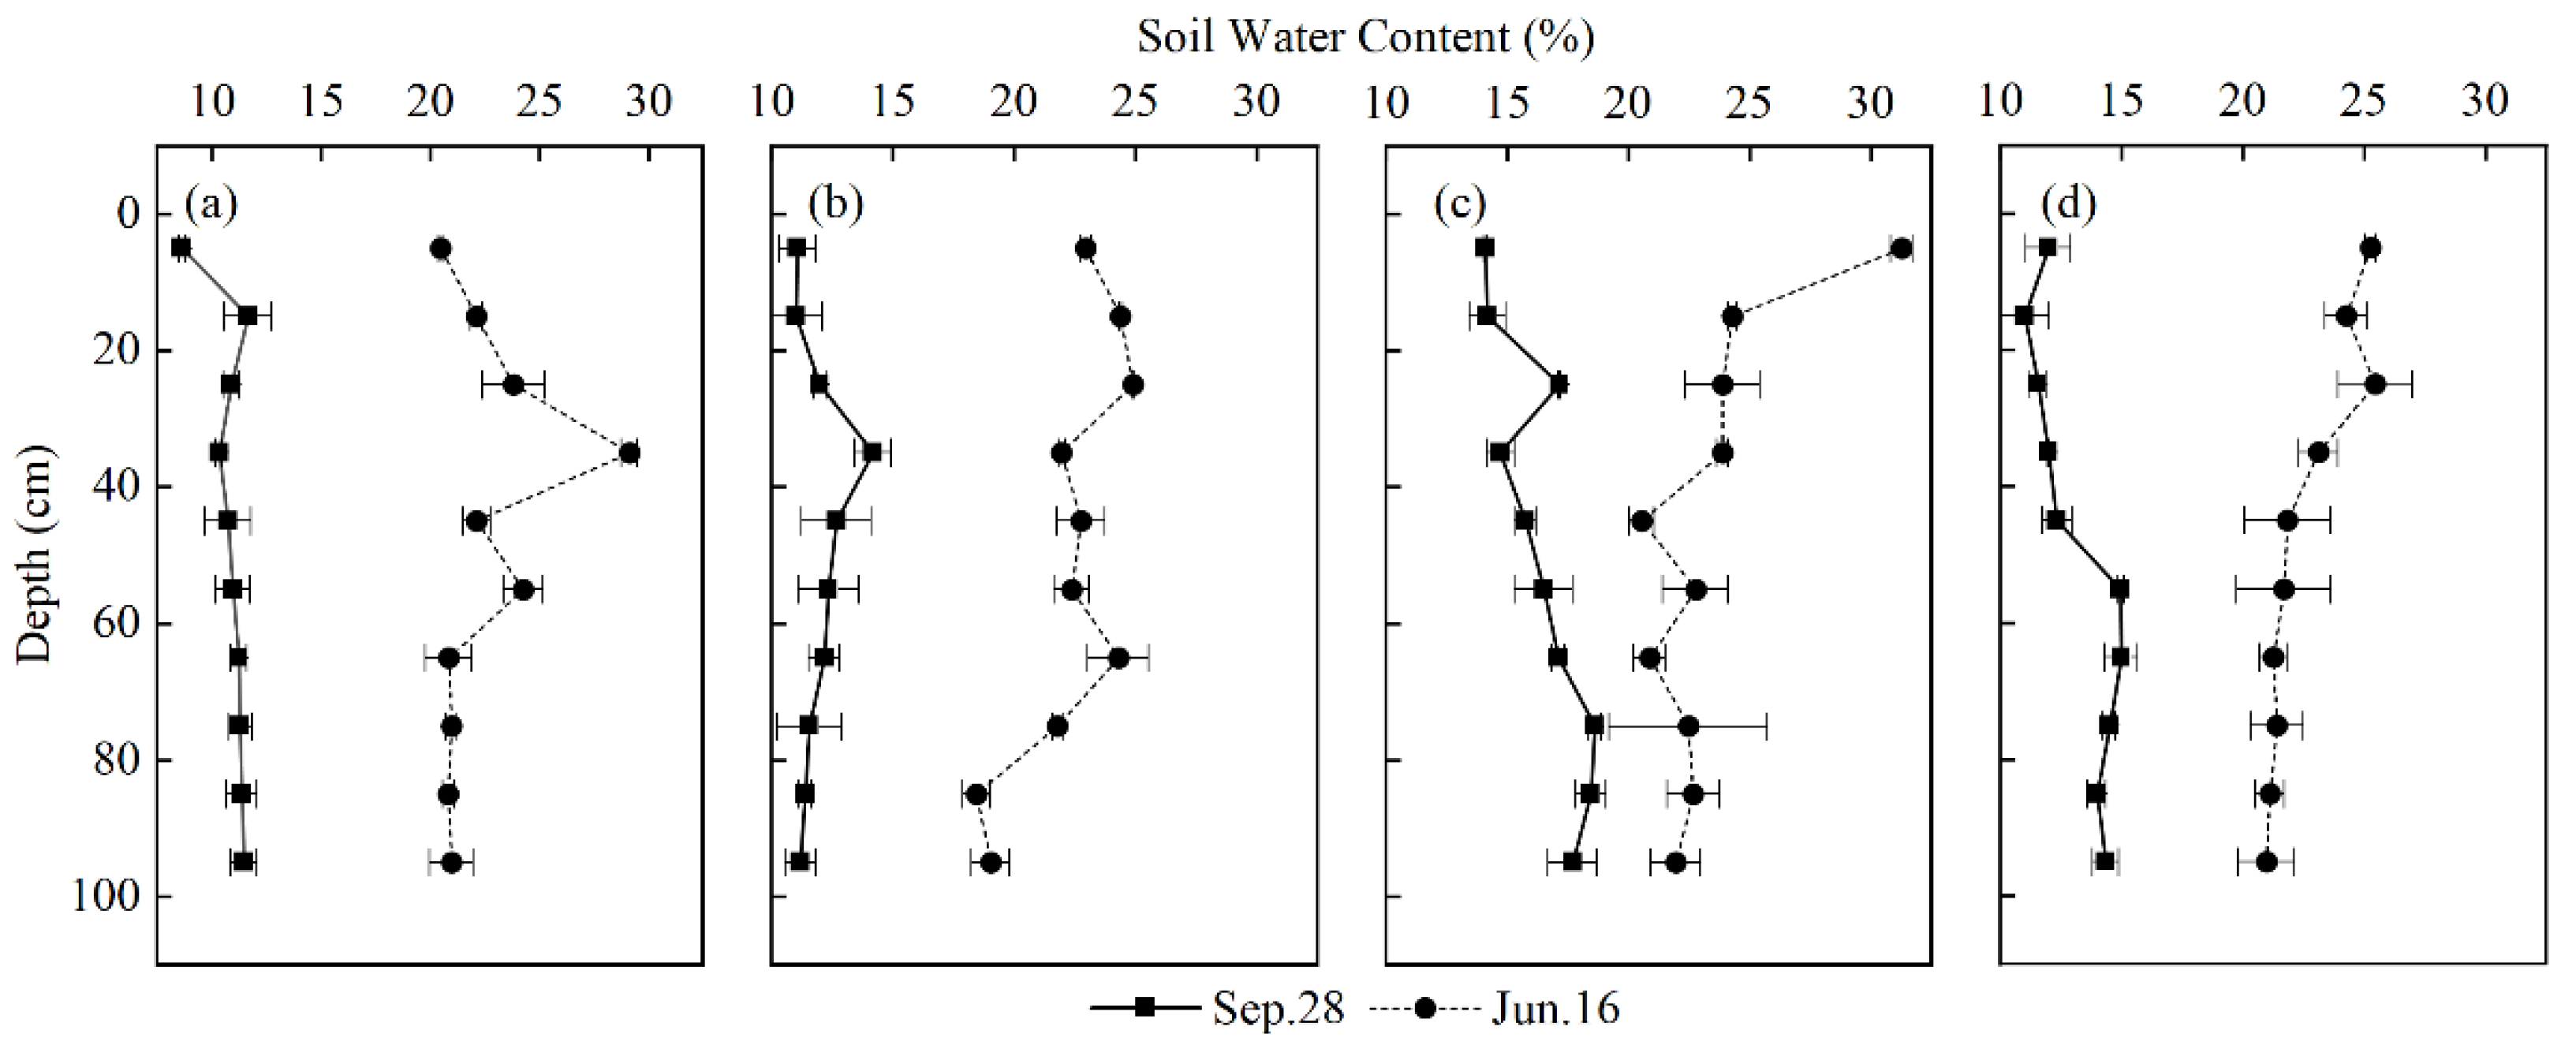
Soil water content (SWC) had significant differences among the four plots in different seasons (p < 0.05) (Figure 3). Overall, the SWC of the four plots in the wet season was greater than that in the dry season. the SWC in the dry season does not fluctuate significantly with the increase of depth, but the SWC in the wet season fluctuates relatively greatly with depth. Table 3 shows the average SWC of different soil depths. The SWC of the four plots in the dry season show that the water content of the surface and shallow soil is lower than that of the middle and deep soil. However, the variety was opposite in the rainy season, as a result of less rainfall, high temperature and evaporation during the dry season. In the wet season, the surface and shallow layers of soil were most replenished by precipitation, and the SWC was higher than that of the middle and deep layers. The highest point of SWC of Plot 1 (P. massoniana) and Plot 2 (C. lanceolata) appeared in the layer of 10–40 cm, which is 25.03% and 23.75%, respectively. This result may be due to the evaporation of surface soil water and the recharge movement of precipitation in the wet season; the highest SWC of Plot 3 (Q. acutissima) and Plot 4 (C. funebris and I. corallina) appeared at 0–10 cm, which were 31.25% and 25.25%, respectively. This result may be due to the higher litter thickness and storage of broad-leaved forest and coniferous broad-leaved mixed forest, and the less obvious evaporation of soil surface water. The average SWC of Plot 3 (Q. acutissima) was the maximum, which was 16.44%, followed by Plot 4 (C. funebris and I. corallina), which was 13.17%, then Plot 2 (C. lanceolata), which was 11.96%, and the minimum was Plot 1 (P. massoniana), which was 10.88%. The ranking law of the average SWC of the four plots was consistent with the law of their litter thickness, litter storage and the maximum water holding capacity of litter, indicating the important impact of litter layer on the water conservation function of forests.
3.2. Precipitation Distribution and Isotopic Composition
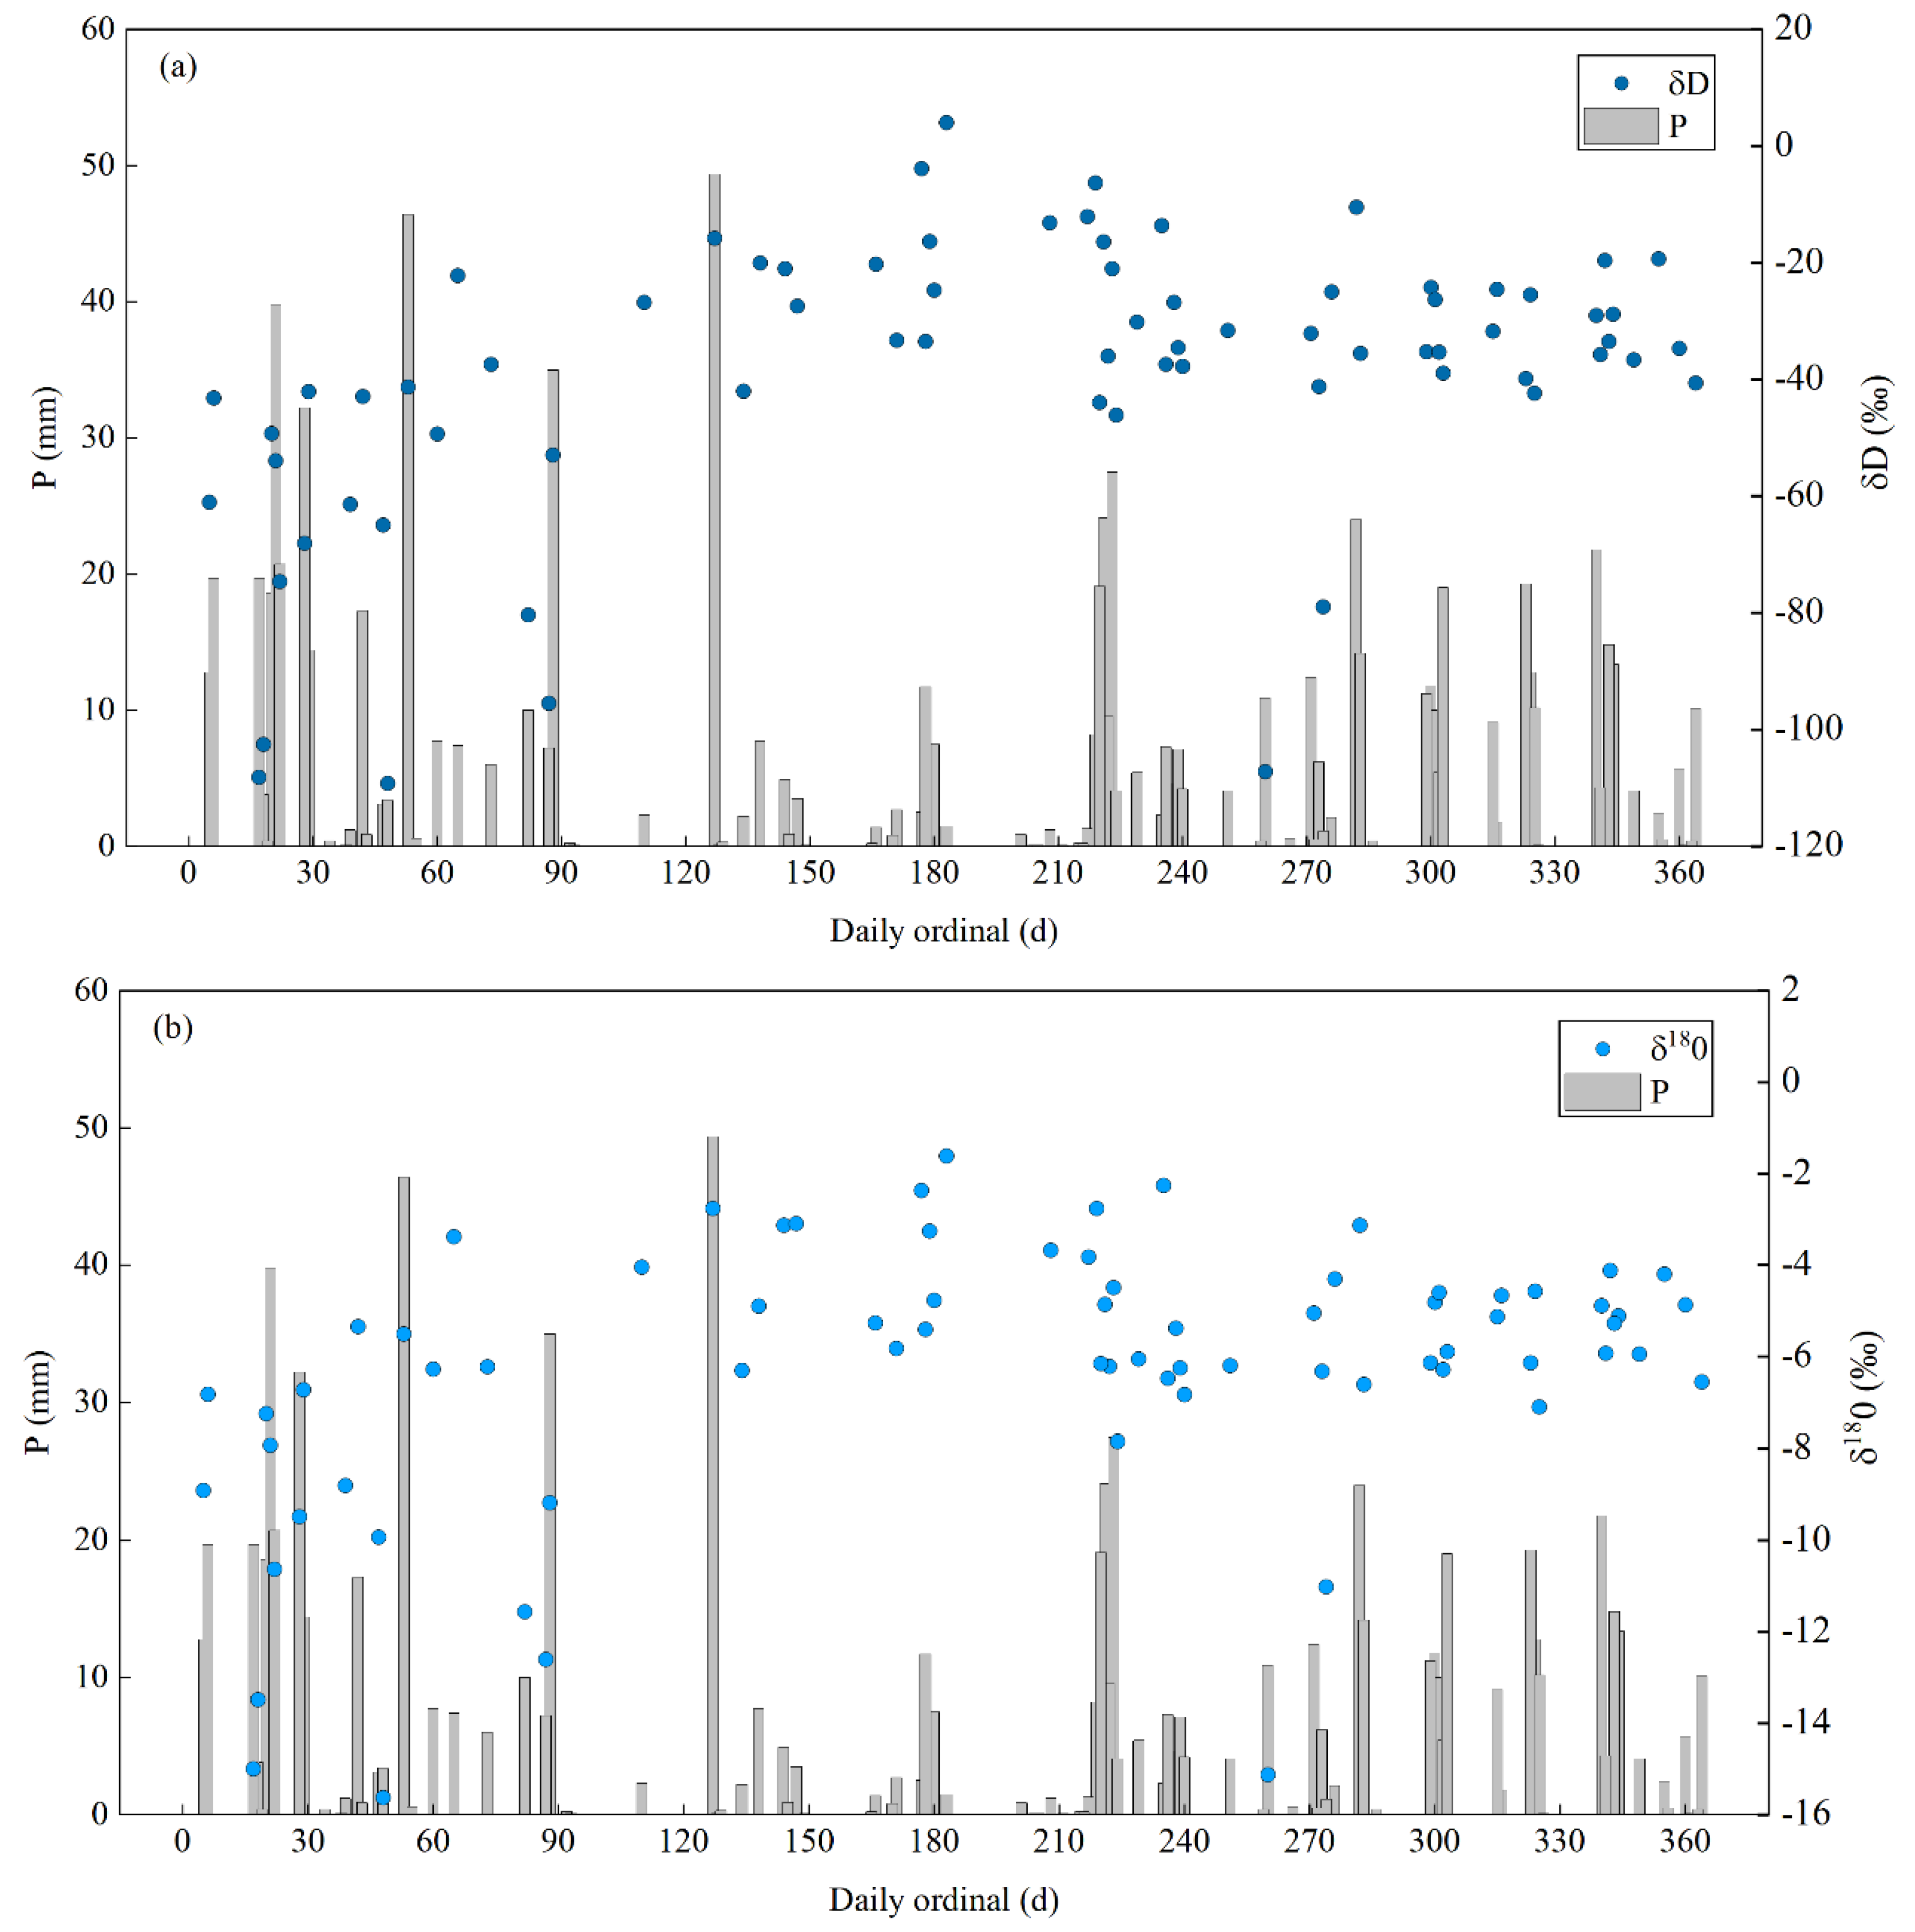
During the observation period, the total precipitation in the study area was 836.6 mm (Figure 4). Precipitation events were mainly concentrated from January to August, with a cumulative precipitation of 727.4 mm, accounting for 86.9% of the annual precipitation. September to December was the dry season, and the cumulative precipitation was 109.2 mm, accounting for only 13.1% of the annual precipitation. In September and December 2019, the precipitation was only 2.4 mm, and seasonal drought was serious. According to the characteristics of rainfall variation with time, the observation period from June 2019 to August 2019 and from January 2020 to May 2020 was considered the wet season, and September 2019 to December 2019 was considered the dry season.
During the observation period, 74 precipitation samples with rainfall greater than 1 mm were collected, and their isotopic compositions were measured. The δD values in precipitation varied in the range of −109.20 to 4.00‰. The δ18O values in precipitation varied in the range of −15.62 to −1.61‰, of which the maximum value appeared on November 30 and the minimum value appeared on July 18 (Figure 4). Seasonal differences were evident in stable isotope composition in precipitation. From June 2019 to August 2019, the average δD value in precipitation was −63.00‰, the average δ18O value in precipitation was −9.03‰; from September to December 2019, the average δD and δ18O value in precipitation was −20.98 and −4.03‰, respectively; from January to May 2020, the average δD and δ18O values in precipitation was −33.14 and −5.73‰, respectively. From June to August, the precipitation in Taizishan area was mainly affected by the warm and humid air mass in the tropical ocean area. The water vapour condensed and fell in the form of precipitation during the transportation process, and the stable isotopes in the remaining water vapour were continuously depleted. Therefore, the stable isotope values in the precipitation were negative. From September to December, low temperature, low humidity and less precipitation were recorded in Taizishan area. Stable isotopes in air mass were less depleted during transportation; therefore, stable isotopes in the precipitation were positive.
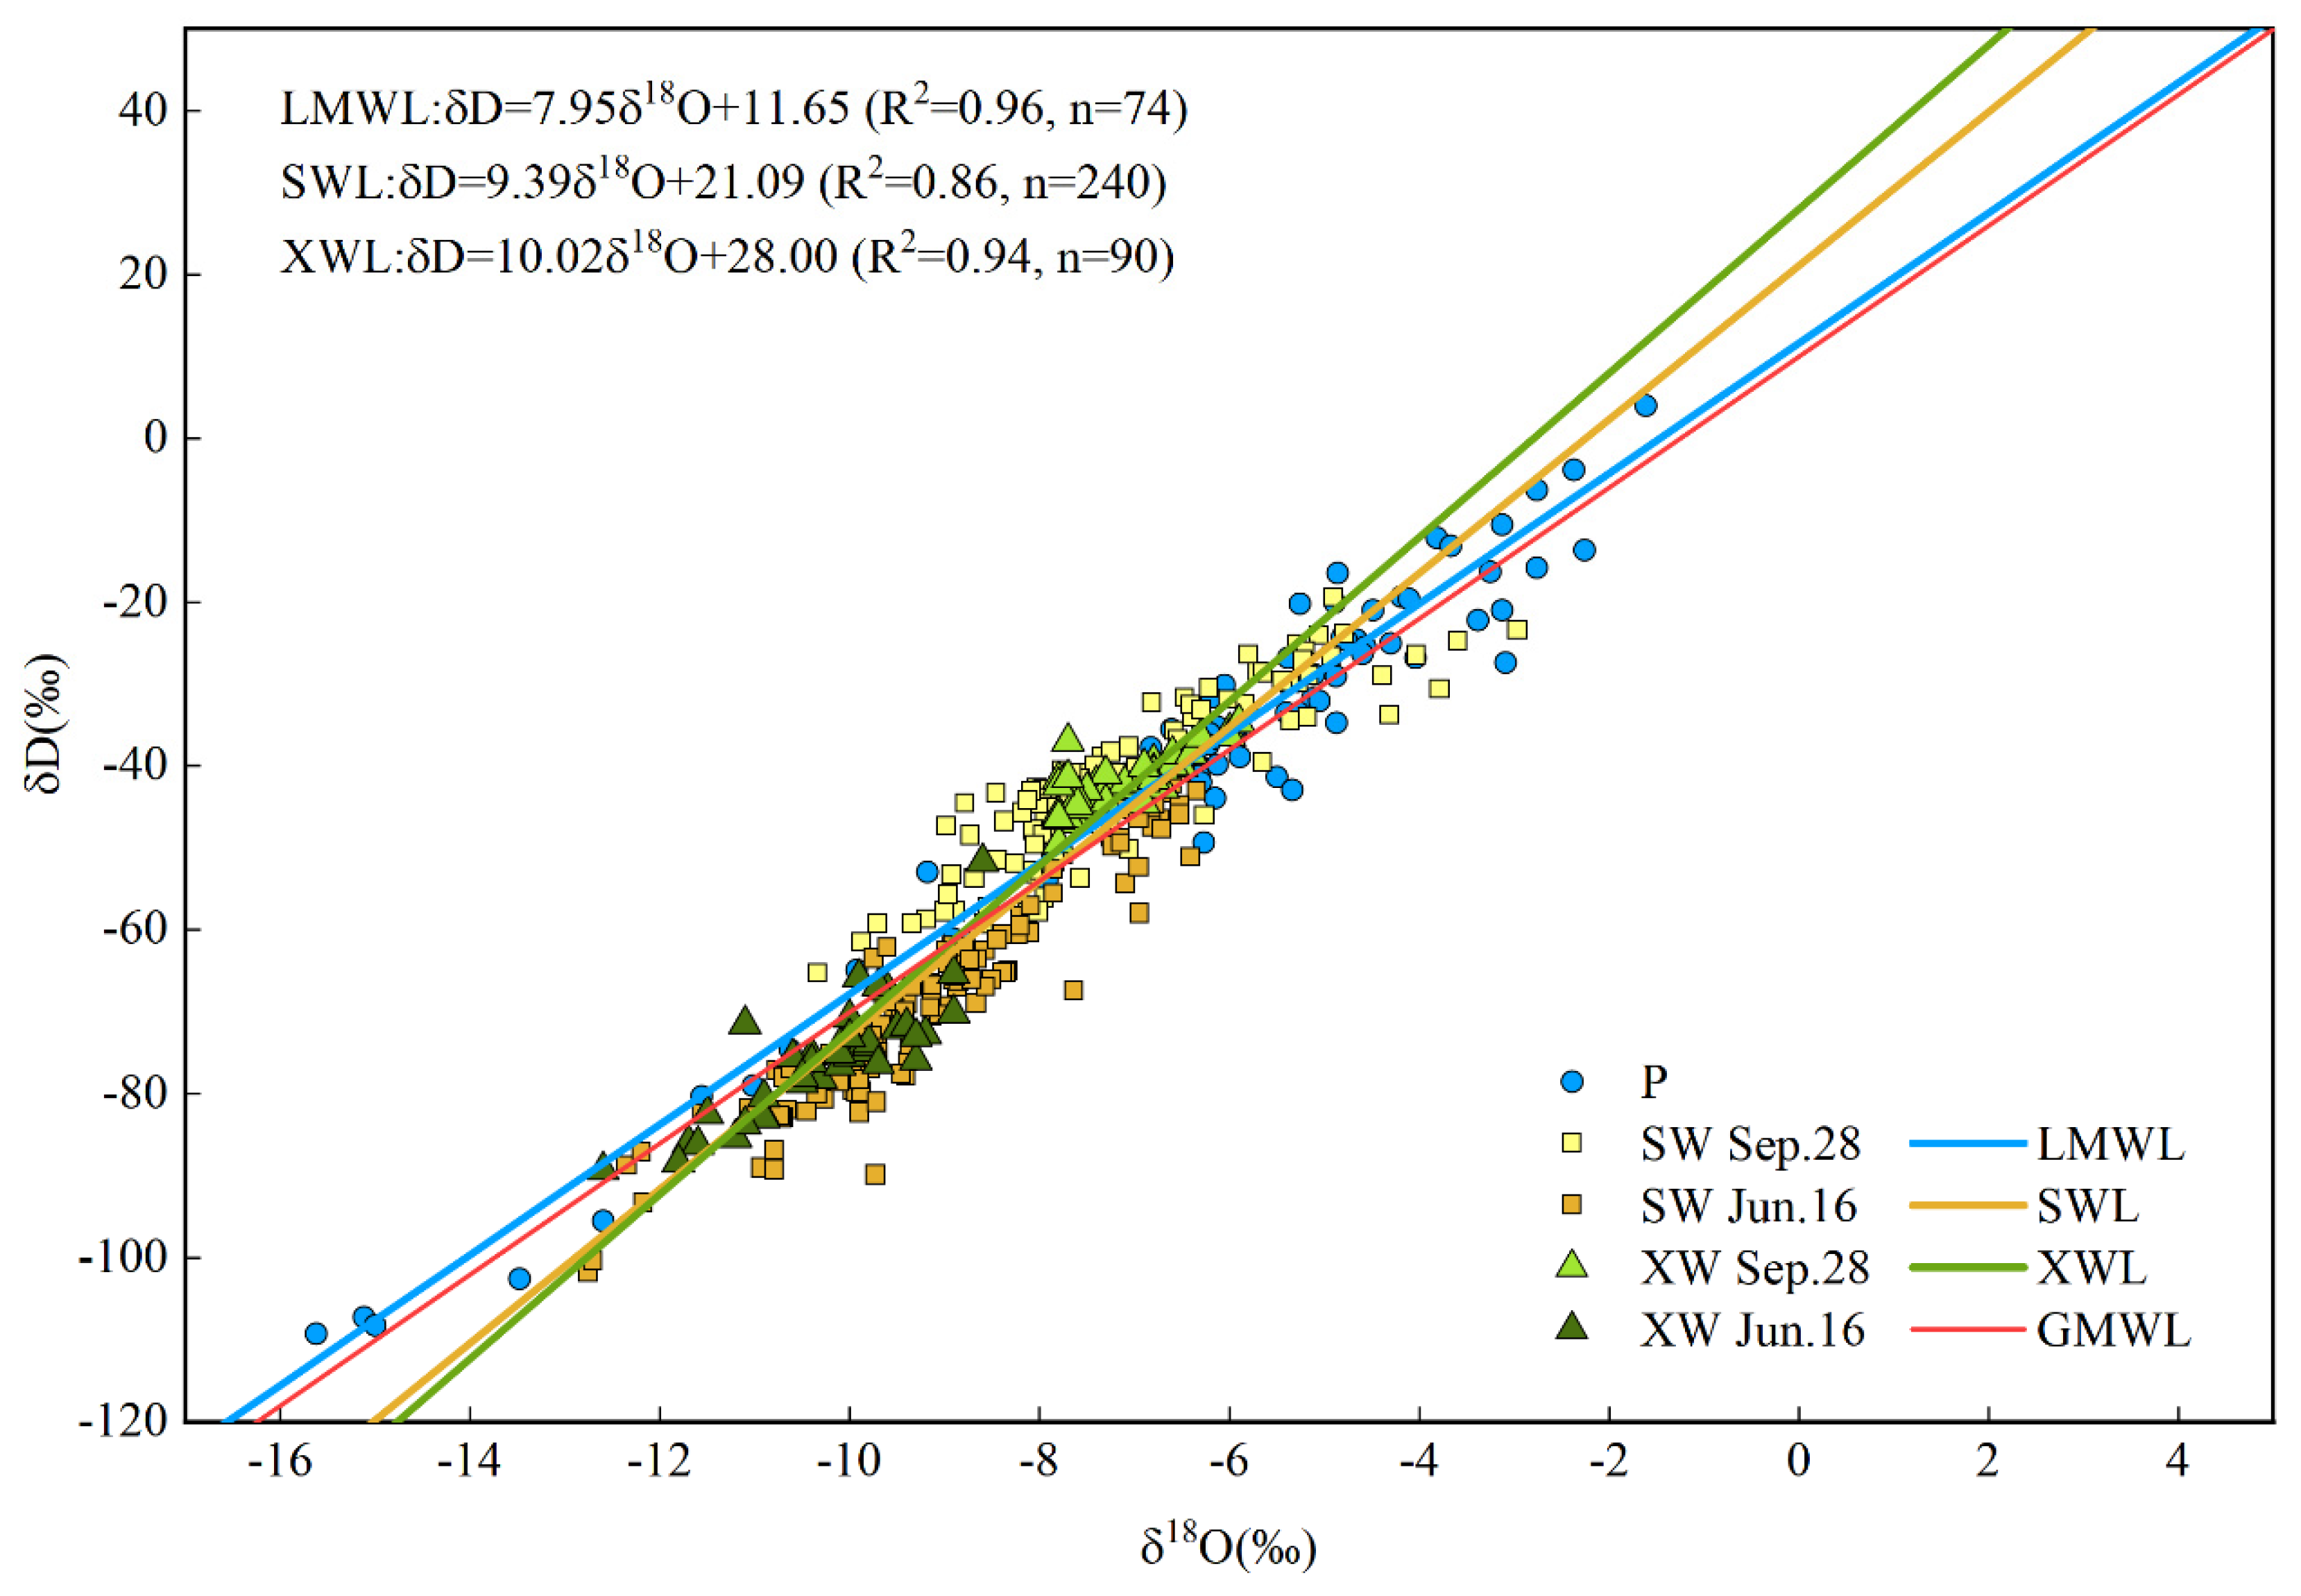
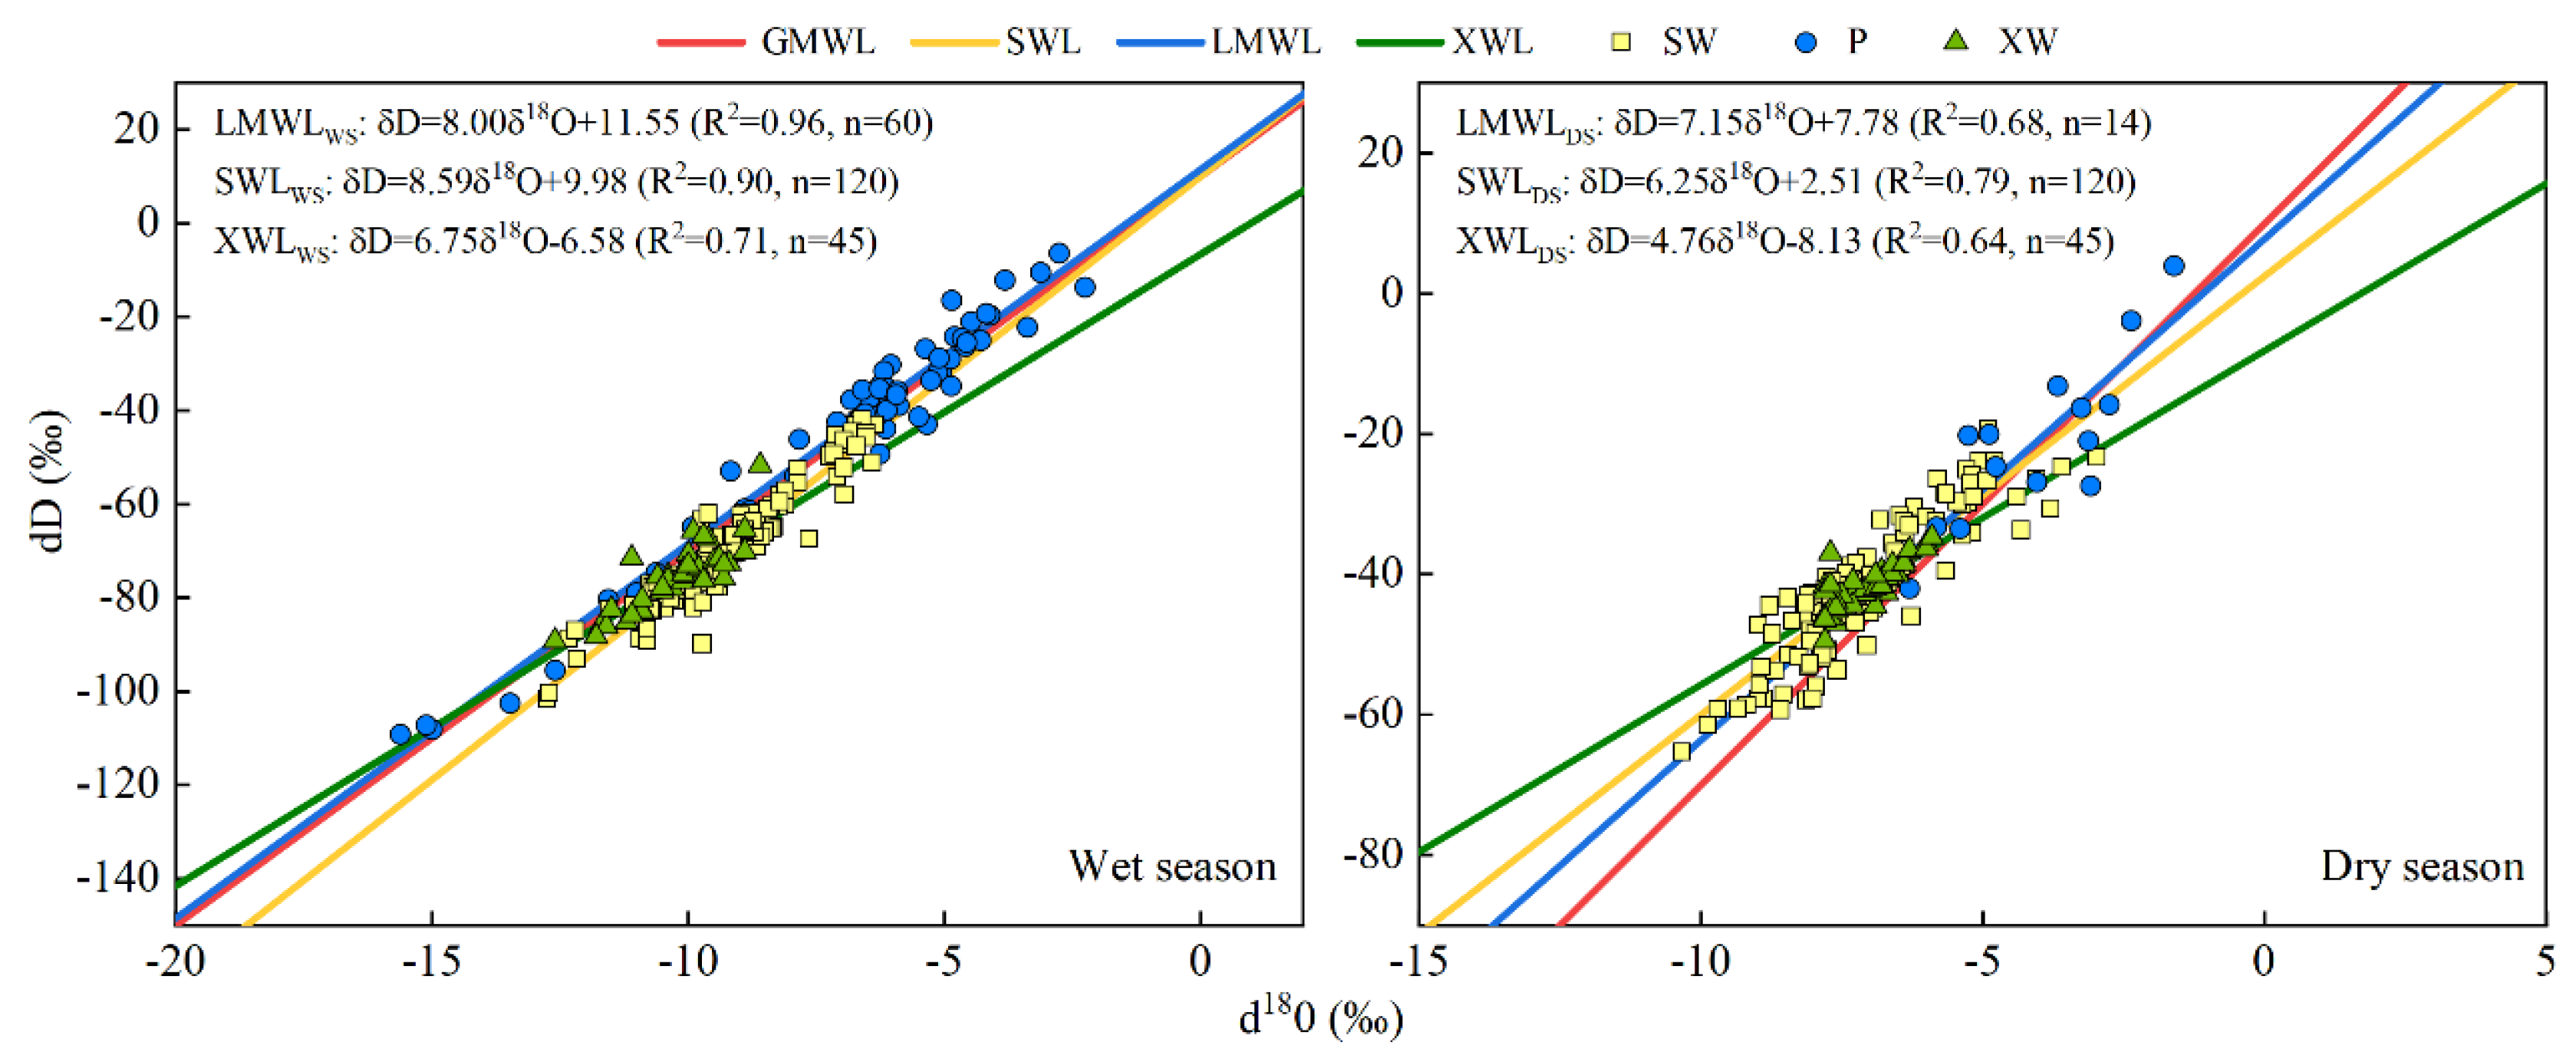
According to Craig’s definition of meteoric water line [62], the linear relationship between δD and δ18O of local meteoric precipitation, soil water and xylem water is defined as local meteoric water line (LMWL), soil water line (SWL) and xylem water line (XWL). By comparing LMWL, SWL and XWL, the regional hydrological and meteorological conditions, the contribution of different environmental factors and the transformation relationship of different water bodies can be determined [40]. Figure 5 shows the distribution of stable isotope values and waterline equation in different water bodies during the whole observation period. The LMWL was δD = 7.95 δ18O + 11.65 (R2 = 0.96, n = 74), and the slope and intercept were close to the global meteoric waterline GMWL (δD = 8 δ18O + 10). The SWL was δD = 9.39 δ18O + 21.09 (R2 = 0.86, n = 240), the slope and intercept were greater than that of LMWL, which may be related to the climate and environmental characteristics of the region. The XWL was δD = 10.15 δ18O + 29.20 (R2 = 0.96, n = 90), and the slope and intercept were greater than that of LMWL and SWL. To understand the seasonal characteristics of the interaction between water bodies under different water conditions, the isotopic distribution and linear regression relationship of δD and δ18O in rainfall, soil water, xylem water from wet season and dry season were made respectively (Figure 6).
3.3. Isotopic Composition and Variation in Xylem Water
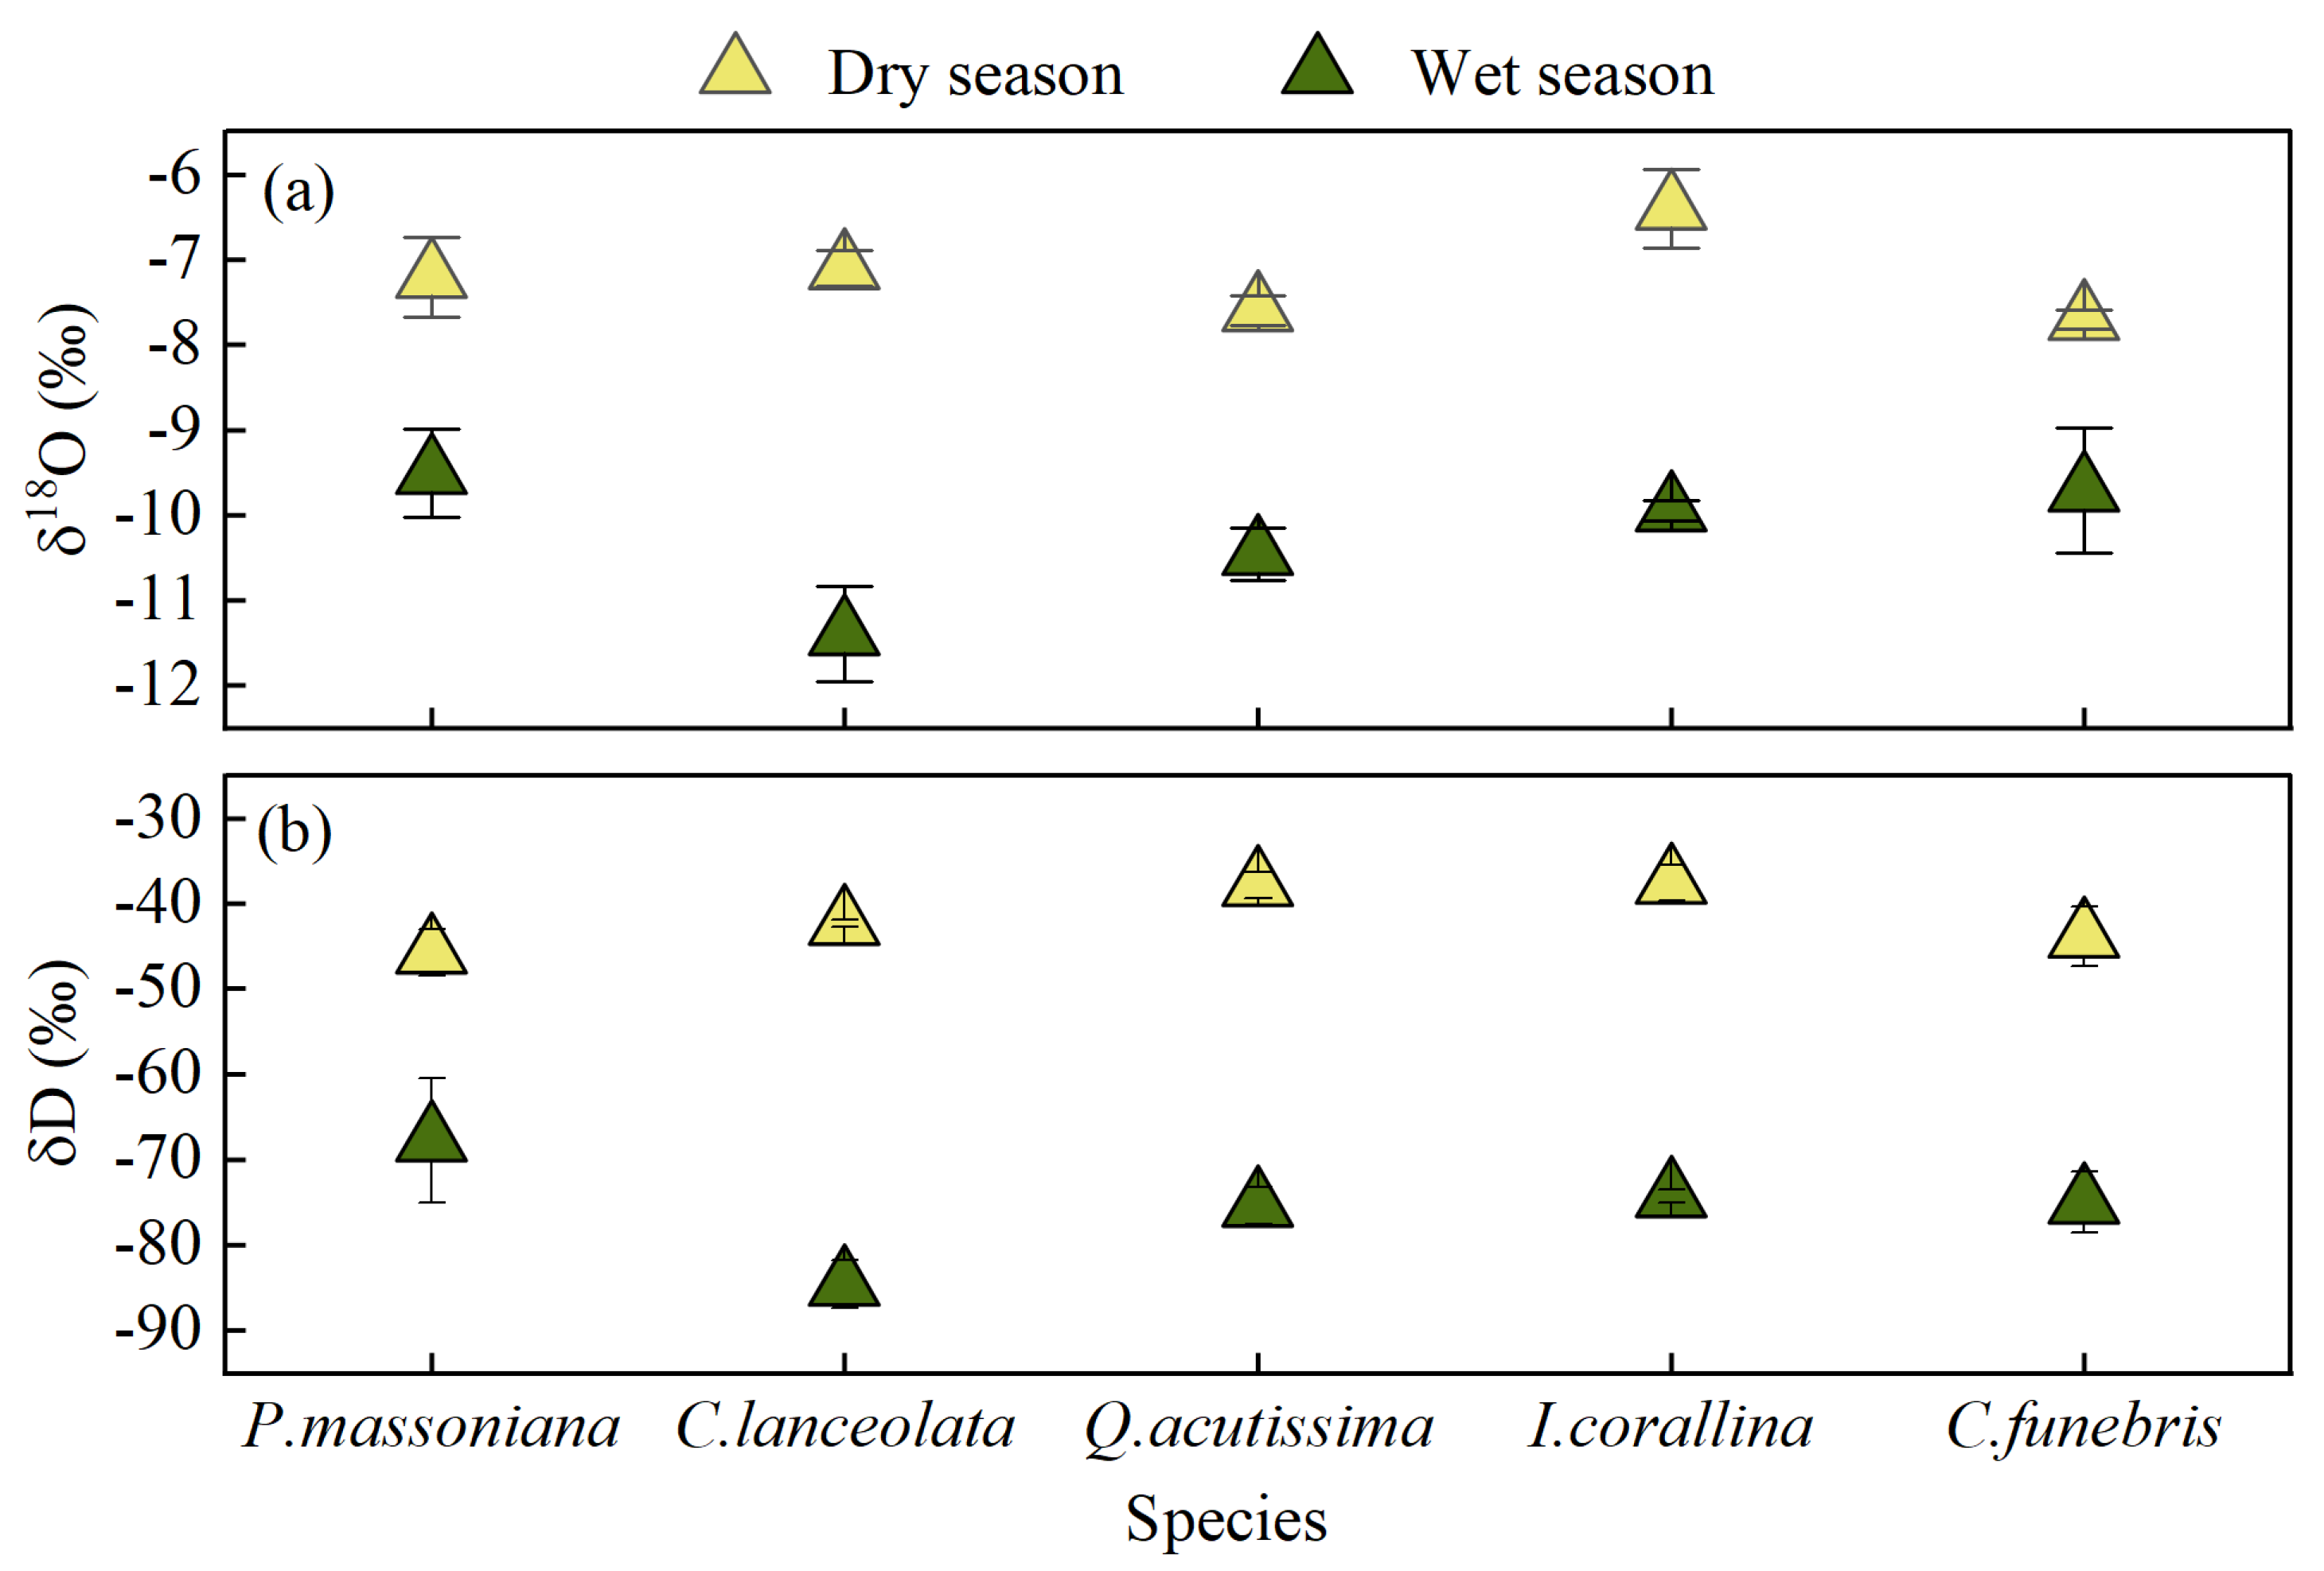
The isotopic values of xylem water varied with plant species and season (Figure 7), the δD values of xylem water in P. massoniana, C. lanceolata, Q. acutissima, I. corallina, C. funebris ranged from −78.05 to −41.72‰, −89.30 to −41.68‰, −78.70 to −41.70‰, −76.51 to −34.66‰, −82.37 to −37.01‰ respectively. The δ18O values ranged from −10.29 to −6.49‰, −12.57 to −6.76‰, −11.1 to −7.25‰, −10.12 to −5.85‰, and −11.46 to −7.49‰, respectively. Generally, the isotopic values of xylem water in the wet season were more negative than that in the dry season. The δD and δ18O values of xylem water of different seasons and different plant species were analysed by conducting two-way ANOVA. The results showed significant differences in isotopic values of different plant water whether in the wet season or the dry season (p < 0.01). This finding indicated that five plants absorb water from different soil layers at the same time. Moreover, significant differences were found in the composition of xylem water isotopic values in different seasons (p < 0.01), indicating that the water absorption of the five plants had significant time variability.
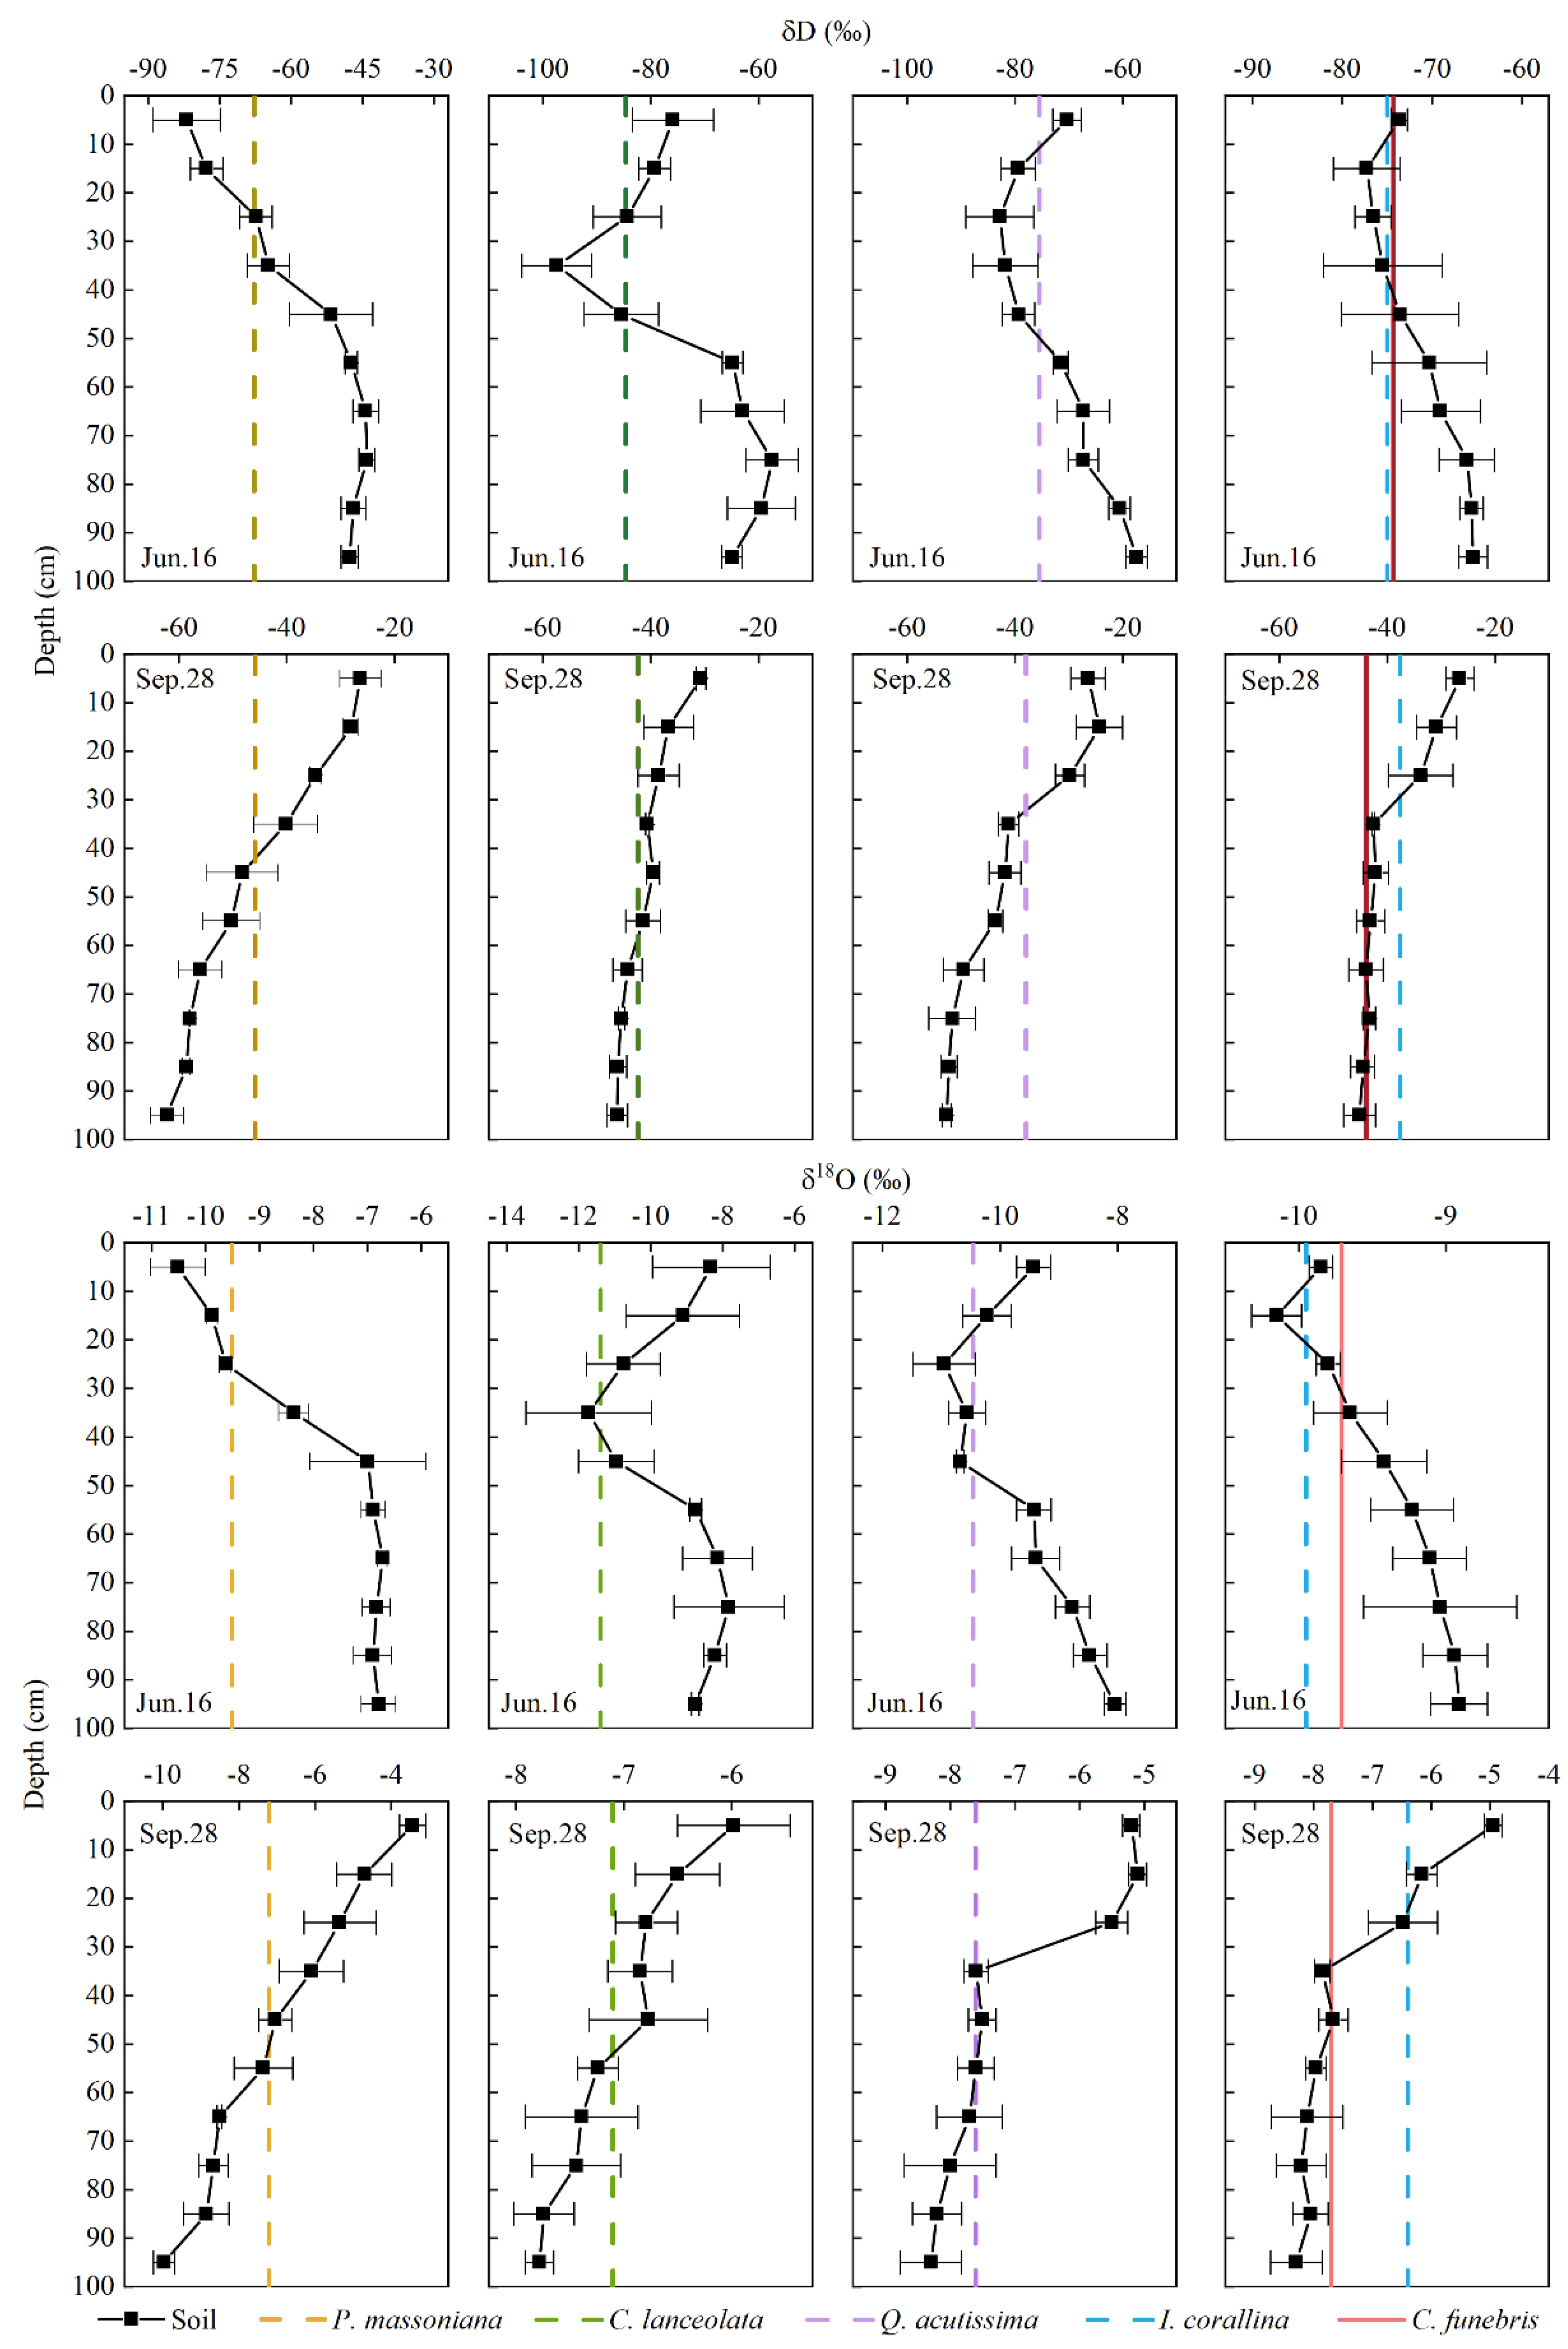
The isotopic composition of soil water varied with soil depths and plant species (Figure 8). Significant differences in soil water isotope ratios were found among the four plots (p < 0.01). The δD and δ18O values of soil water in Plot 1 (P. massoniana) plot are high, which are −51.81 ± 14.73‰ and −7.47 ± 1.87‰, respectively. The δD and δ18O values of soil water in Plot 2 (C. lanceolata) were −57.07 ± 19.21‰ and −8.15 ± 1.67‰, respectively. The δD and δ18O values of Plot 3 (Q. acutissima) were −56.52 ± 18.27‰ and −8.33 ± 1.71‰, respectively. The δD and δ18O values of Plot 4 (C. funebris and I. corallina) were −55.44% ± 17.19‰ and −8.39 ± 1.35‰, respectively. The soil water isotope ratios of the four sample plots were significantly different in different seasons (p < 0.01) and soil depths (p < 0.01). The δD values of 0–10 cm soil water ranged from −23.40 to −89.04‰, and the δ18O values ranged from −10.93 to −2.96‰. The δD values of 10–40 cm soil water ranged from −26.09 to −101.76‰, and the δ18O values ranged from −12.75 to −4.03‰. The findings show that the soil water of surface and shallow layers showed obvious seasonal differences and large fluctuations. As for the 40–70 cm soil water, δD values ranged from −38.41 to −93.3‰, and the δ18O ranged from −12.17‰ to −6.26‰. The δD values of 70–100 cm soil water ranged from −42.17‰ to −70.44‰, and the δ18O ranged from −10.33‰ to −6.52‰, which showed less seasonal differences and stable changes.
Figure 8 shows that in the wet season, the intersection of xylem water δD value and soil water δD value (10–40 cm) was consistent with the intersection of δ18O of stem water and soil water (10–40 cm) of P. massoniana; the intersection of δD in xylem water and soil water (10–40 cm, 40–70 cm) of C. lanceolata was not completely consistent with the intersection of δ18O (10–40 cm); the intersection of δD in xylem water and soil water (10–40 cm, 40–70 cm) of Q. acutissima was consistent with the intersection of δ18O (10–40 cm, 40–70 cm); the intersection of δD in xylem water and soil water (10–40 cm, 40–70 cm) of I. corallina was not completely consistent with the intersection of δ18O (0–10 cm, 10–40 cm); and the intersection of δD in xylem water and soil water (10–40 cm, 40–70 cm) of C. funebris was not completely consistent with the intersection of δ18O (10–40 cm). On the other hand, in the dry season, the intersection of δD in xylem water and soil water (10–40 cm) of P. massoniana was not completely consistent with the intersection of δ18O (40–70 cm); the intersection of δD in xylem water and soil water (40–70 cm) of C. lanceolata was consistent with the intersection of δ18O (40–70 cm); the intersection of δD in xylem water and soil water (10–40 cm) of Q. acutissima was not completely consistent with the intersection of δ18O (40–70 cm); the intersection of δD in xylem water and soil water (10–40 cm) of I. corallina was consistent with the intersection of δ18O (10–40 cm); and the intersection of δD in xylem water and soil water (70–100 cm) of C. funebris was not completely consistent with the intersection of δ18O (40–70 cm).
In summary, P. massoniana gave priority to the use of shallow soil water in the wet season, and the water source cannot be accurately determined in the dry season. The water source of C. lanceolata cannot be accurately determined in the wet season, and the middle soil water was mainly used in the dry season. Q. acutissima preferentially used shallow and middle soil water in the wet season, and the water source in the dry season cannot be accurately determined. Both of the water sources of I. corallina and C. funebris in the wet or dry seasons cannot be accurately determined. When the direct comparison method was used to determine the water sources of plants, the intersection of δD in xylem water and soil water was often not completely consistent with the intersection of δ18O in xylem water and soil water. Therefore, accurately determining the main water absorption depth of plants is difficult by using the direct comparison method.
3.4. Seasonal Variations in the Proportion of Plant Water Uptake
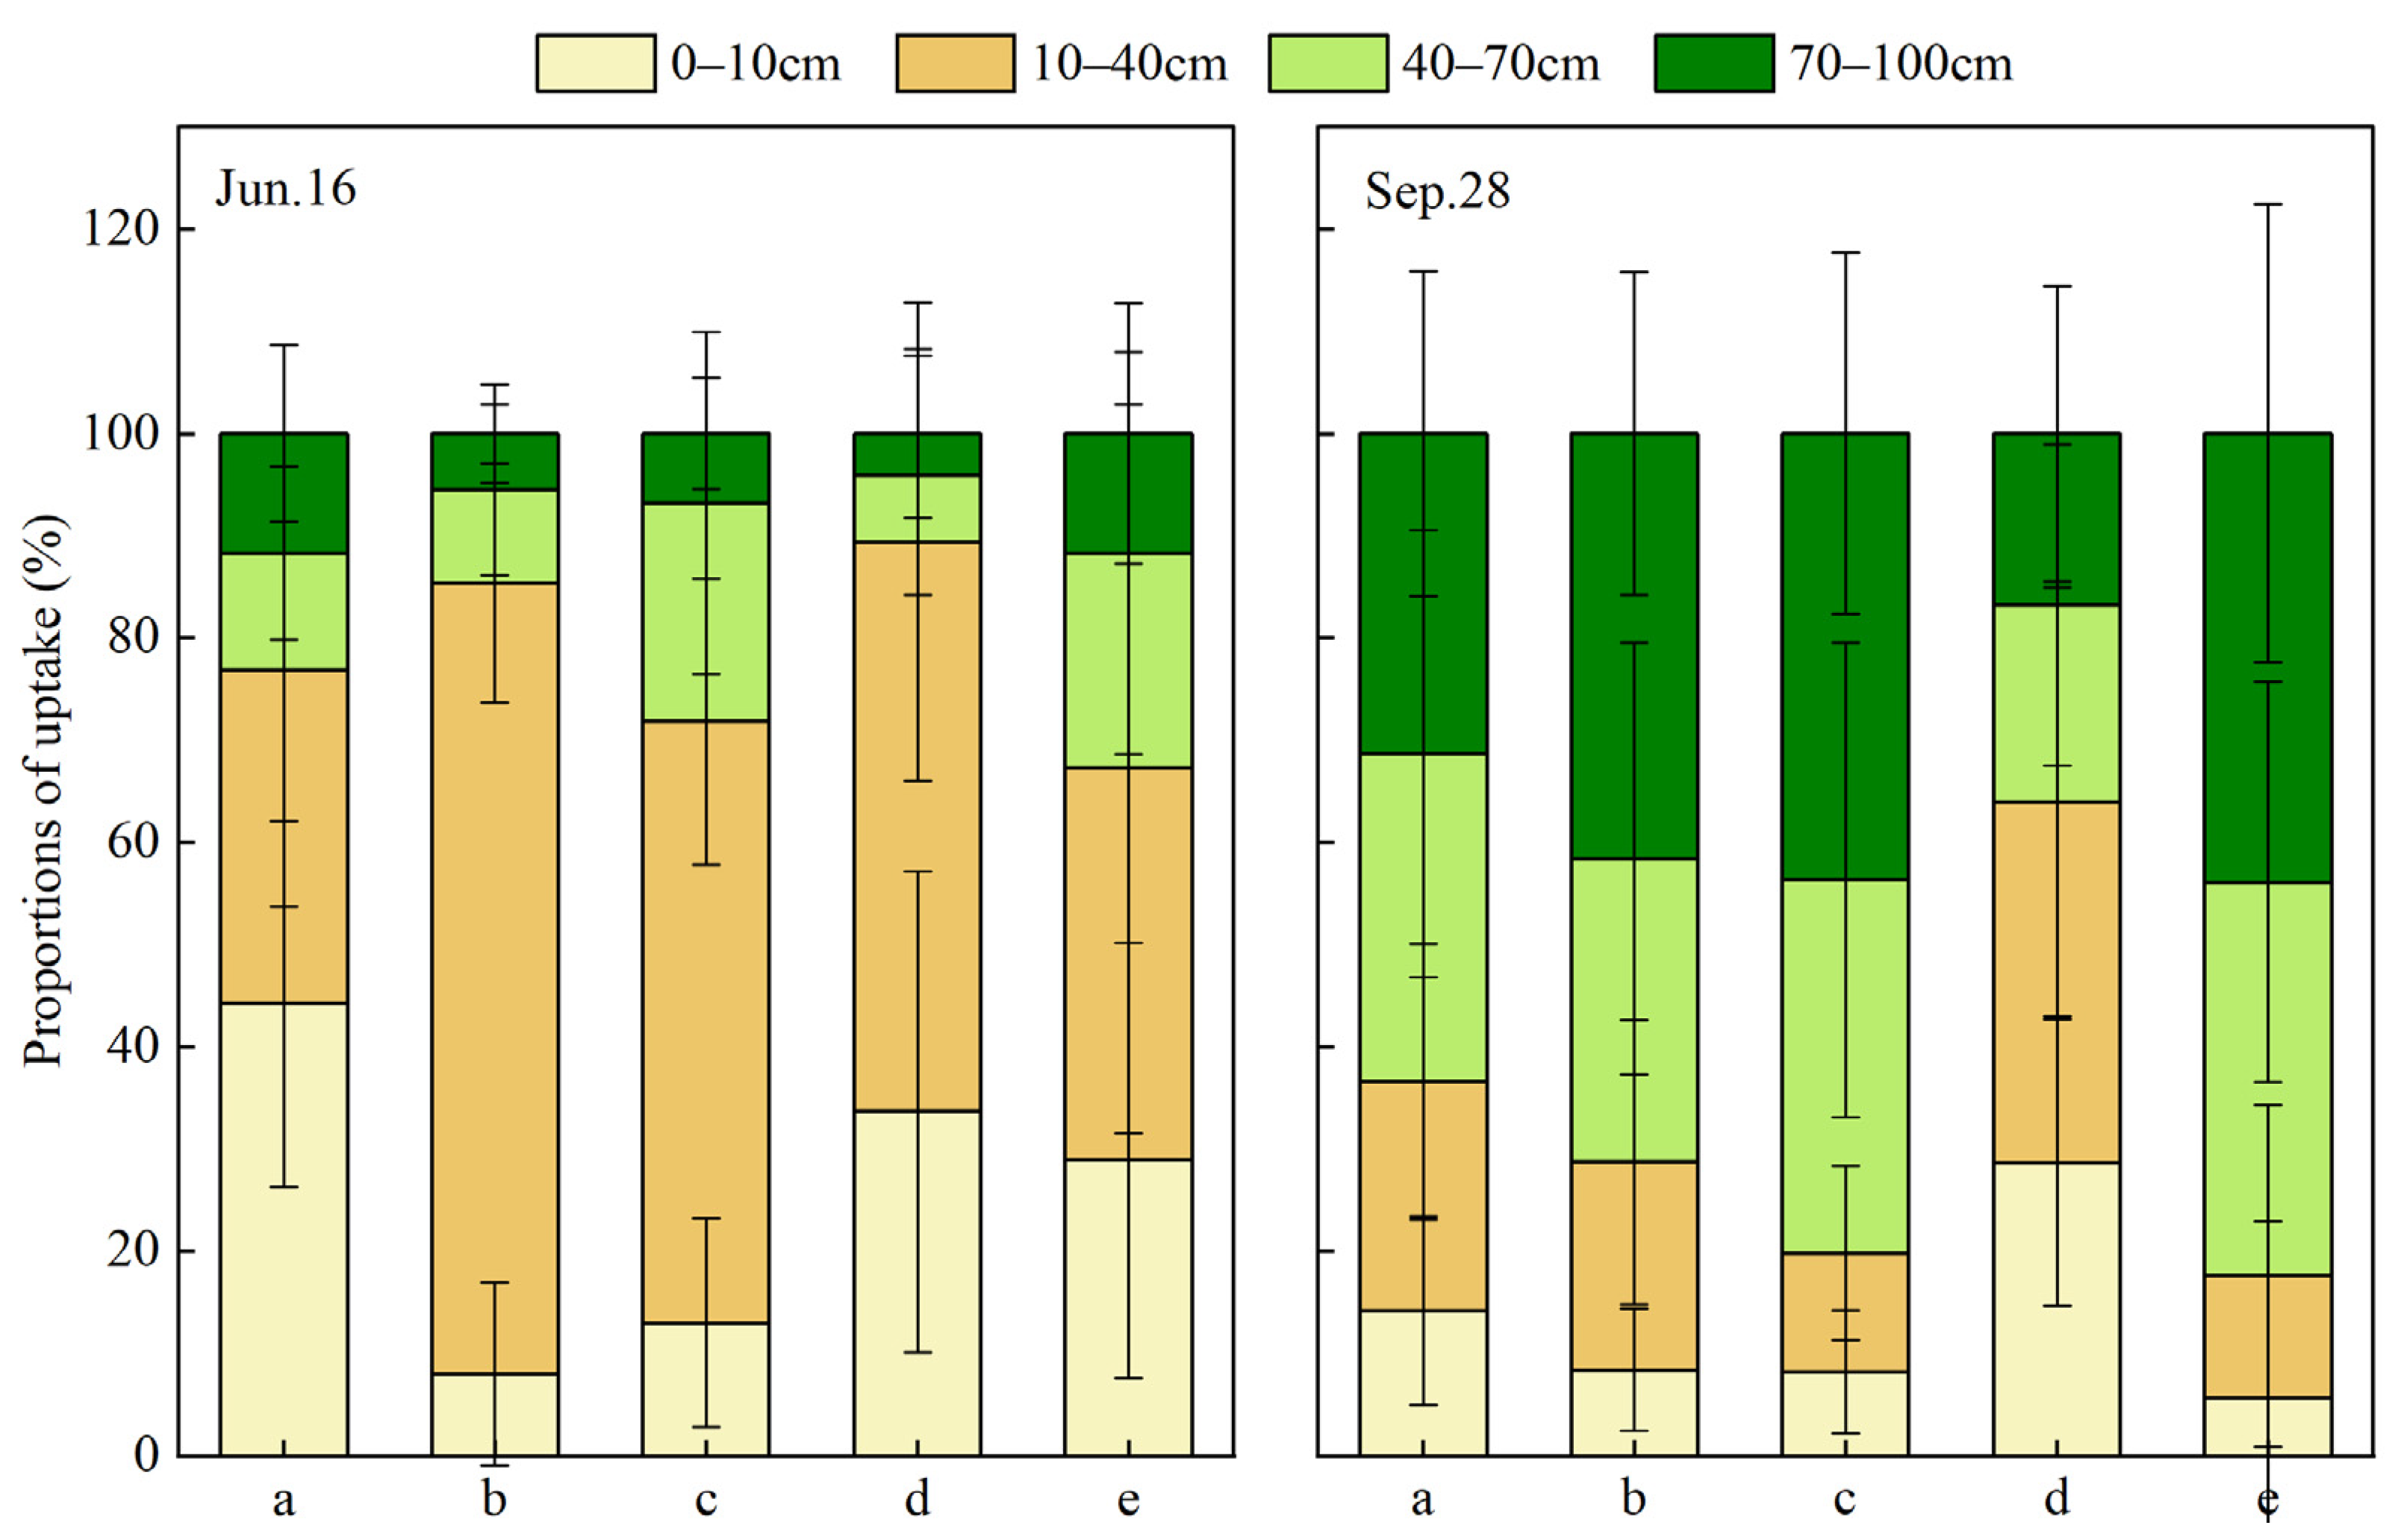
The MixSIAR Bayesian mixing model can be used to calculate quantitatively the proportion of plant water uptake in different soil depths. Figure 9 shows the average plant water uptake proportion of (a) P. massoniana, (b) C. lanceolata, (c) Q. acutissima, (d) I. corallina, and (e) C. funebris by using the MixSIAR model. Significant seasonal differences were observed in the water use characteristics of the five plants. The surface and shallow soil water were mainly used in the wet season, and the uptake proportion of middle and deep layer soil water were increased in the dry season. P. massoniana mainly used the surface and shallow layer soil water in the wet season, with proportions of 44.2% and 32.7%, respectively. This result was consistent with the highest value of SWC in the wet season. The proportions of water that P. massoniana extracted from surface, shallow, middle and deep soils during the dry season are 14.2 ± 9.2%, 22.4 ± 13.5%, 32.1 ± 21.9% and 31.4 ± 15.9%, respectively. P. massoniana used middle and deep soil water in the dry season. C. lanceolata absorbed the largest proportion of soil water from the shallow layer of soil with a percentage of 77.3 ± 11.7%. The highest value of SWC in the wet season of C. lanceolata appeared at the same layer with that of soil water mainly used. In the dry season, the water use depth of C. lanceolata shifted down significantly and changed to deep soil water, with the proportion of 41.6 ± 15.8%. Q. acutissima mainly extracted water from shallow soil layer in the wet season, and the proportion was 58.8 ± 14.0%. In the dry season, the middle and deep soil water are mainly absorbed, and the proportions are 36.5% ± 23.2 and 43.7 ± 17.7%, respectively. As for I. corallina in the wet season, the soil water of shallow layer was mainly used, with a proportion of 55.7 ± 23.4%, and the highest SWC value of Plot 4 (C. funebris and I. corallina) occurred in the shallow layer, which is consistent with the layer of soil water I. corallina mainly used. In the dry season, the water uptake fraction of I. corallina was 28.7 ± 14.0% for surface soil layer, 35.3 ± 21.0% for shallow layer, 19.3 ± 15.8% for middle layer and 16.8 ± 14.5% for deep layer, the utilisation proportion of middle and deep soil water in the dry season was higher than that in the wet season, but surface and shallow soil water were still the main water source. C. funebris mainly extracted water from surface and shallow soil layer in the wet season, and the proportion was 28.9 ± 21.3% and 38.3 ± 35.7% respectively. The proportions were similar to the main water source of I. corallina, indicating that in the wet season there was a certain degree of water competition between C. funebris and I. corallina. In the dry season, the water use depth of C. funebris significantly moved down and changed to middle and deep soil water, and the utilisation proportion was 38.5 ± 19.6% and 43.9 ± 22.4%, respectively.
4. Discussion
4.1. The Linear Regression Relationship of δD and δ18O in Rainfall, Soil Water, Xylem Water
A large number of observations [63,64,65] showed that the slope of SWL was generally lower than that of LMWL in inland areas at middle and high latitudes due to the evaporation and enrichment of stable isotopes of soil water. However, considering that the study area is located in the subtropical monsoon region, the observation in this study showed the opposite result, that is, the slope of SWL is greater than that of LMWL, which is consistent with Yang’s study in 2015 [40]. This finding may be due to the fact that soil water came more from previous precipitation, or the evaporation and fractionation of soil water isotopes was weaker than that of precipitation due to vegetation cover and soil water collection.
The waterlines of different water bodies had evident seasonal differences. The slopes and intercepts of LMWL, SWL and XWL in the wet season were greater than those of LMWL, SWL and XWL in the dry season, which reflected the climate characteristics of drought and cold in the dry season, and also reflected that soil water and plant water were more affected by evaporation in the dry season. In the wet season, due to high relative humidity and less evaporation, there was a smaller range of isotopic value point distribution in soil water than that in the dry season. Owing to the influence of negative stable isotope values in wet season rainfall, the stable isotopic value points of soil water were distributed at the lower left of LMWL, resulting in the slope of SWL being greater than that of LMWL. This result was consistent with previous studies in arid and semi-arid areas [3,49], which proved the characteristics of seasonal drought in the study area. In the dry season, the distribution range of isotopic value points of soil water was larger than that of precipitation, and the stable isotopic value points of soil water were distributed at the left side of the precipitation points. This result implies that the water in the soil sampled on 28 September may have retained the precipitation in the wet season and the dry season at the same time. Regardless of the season, the slope and intercept of XWL were less than that of SWL, indicating that the process of plant absorbing soil water was affected by evaporation. Moreover, in the wet season, the distribution range of xylem water isotopic value points was negative compared with that of soil water isotopic value points. However, in the dry season, the distribution range of xylem water isotopic value points was positive compared with that of soil water isotopic value points. This finding implies that the process of plant utilisation of soil water was significantly more affected by evaporation in the dry season than that in wet season.
4.2. Vertical Gradient of Isotopic Composition in Soil Water
Figure 5 and Figure 6 show that the δD (δ18O) values of different plant water in different seasons were within the variation range of soil water δD (δ18O), which showed that plants made effective use of soil water. Similar to the variation of stable isotopic values of precipitation, the variation of δD and δ18O of soil water with depths showed obvious seasonal characteristics. In the wet season, the δD and δ18O of soil water showed complex changes with depth. The δD (δ18O) of soil water of P. massoniana increased with the increase of depth. In the other three plots, the δD (δ18O) of soil water decreased first and then increased with the increase of depth. Generally, the δD (δ18O) of soil water increased with the increase of depth. The minimum value appeared at 10–40 cm, which may be due to replenishment of soil water by previous rainfall and the influence of negative isotope values of rainfall [3]. Plenty of precipitation events happened in the wet season, which was the main factor affecting the δD (δ18O) of soil water, whereas the dry season showed the opposite trend due to less precipitation and strong surface evaporation. In the dry season, the δD (δ18O) of soil water in the four plots decreased gradually with the increase of depth. The variation of soil water δD (δ18O) with depth was basically consistent with the variation of SWC with depth, which showed that the variation of soil water δD (δ18O) with depth was mainly the result of replenishment of soil water by precipitation. In general, the isotopic values of surface and shallow soil water showed obvious seasonal differences and large fluctuations, because the surface and shallow soil water are mainly affected by evaporation and infiltration [3,40,66,67,68]. The different composition and decomposition degree of litter covered on the soil surface further affected the evaporation and infiltration process of the soil surface and shallow layer. Deep soil water was less vulnerable to evaporation and precipitation than the surface soil water. Moreover, the δD (δ18O) of soil water tends to be stable with the increase of depth. The isotopic values of middle and deep soil water showed small seasonal differences and relatively stable changes, indicating that deep soil water was less susceptible to evaporation and precipitation [40,68,69]. The results were in line with previous studies [67,70,71]. In 2017, Wang et al. showed no significant differences in soil water isotope among the three species, indicating that vegetation type has no effect on soil water isotopic values [3]. However, in this study, significant differences in soil water isotopic values were found among the four plots, which may be due to the large differences in site conditions of the plots, such as litter and canopy density, which affect the process of soil water evaporation and rainfall infiltration. Further analysis found significant differences in SWC among the four sample plots, but there was no significant difference in SWC between P. massoniana forest and Chinese fir forest (p > 0.05). Generally, the SWC of the broad-leaved forest was the largest, followed by coniferous and broad-leaved mixed forest. The lowest SWC was found in the coniferous forest. The ranking of litter thickness, litter storage and maximum water holding capacity of the four sample plots were consistent with the ranking of SWC, which showed that the litter of different stands significantly affects the characteristics of soil water. The soil water δD values of the broad-leaved forest and coniferous and broad-leaved mixed forest were relatively poor, whereas that of the coniferous forest were relatively rich. The thick litter on the surface of broad-leaved forest and coniferous and broad-leaved mixed forest makes the soil less affected by evaporation. This result showed that forest types affect the hydrogen and oxygen isotope characteristics of soil water.
4.3. Differences in Seasonal Water Uptake Patterns among Species
A comparison of the SWC of four forest lands showed that the surface SWC of Q. acutissima was significantly higher than that of other sample plots, and the surface SWC of Q. acutissima was higher than that of other layers in the wet season. However, Q. acutissima mainly absorbed water from shallow soil in the wet season (58.8 ± 14.0%) and deep soil in the dry season (43.7 ± 17.7%), indicating that litter mostly affected the surface evaporation of soil. Except litter and soil water, other factors would more significantly affect the water source of trees, such as the distribution characteristics of plant roots. Many studies have shown that in the wet season, due to the influence of excessive precipitation, surface SWC was high and the activity of plant surface root was strong [72,73]. The potential water sources absorbed by plants ought to be derived mostly from the surface layer (0–10 cm). However, in reality, except for P. massoniana, the other four plants derived most of the water from 10–40 cm soil. It is probable that, although precipitation events of June (sampling dates in wet season) were the most abundant, there was also strong variability of precipitation, the variation range of surface SWC was also large, resulting in less stability than that of other soil layers. However, the huge consumption of plants happened during the growing season, leading to the demand of more stable water source [73]. The surface soil water was not an ideal water source. Moreover, the root biomass of the five plants reached the maximum at 10–40 cm. Consequently, 10–40 cm soil water was the main water source. In the dry season, due to the long absence of rainfall, the surface layers of soil had serious soil water deficit, and the root activity of the plant surface decreased. As a result, the main water source of the plant was downward. Although I. corallina with shallow roots mainly used 10–40 cm of soil water in the wet season, the utilisation ratio of the middle and deep soil water was increased. The other four plants maintained their growth by absorbing more abundant soil water at soil layer of 70–100 cm.
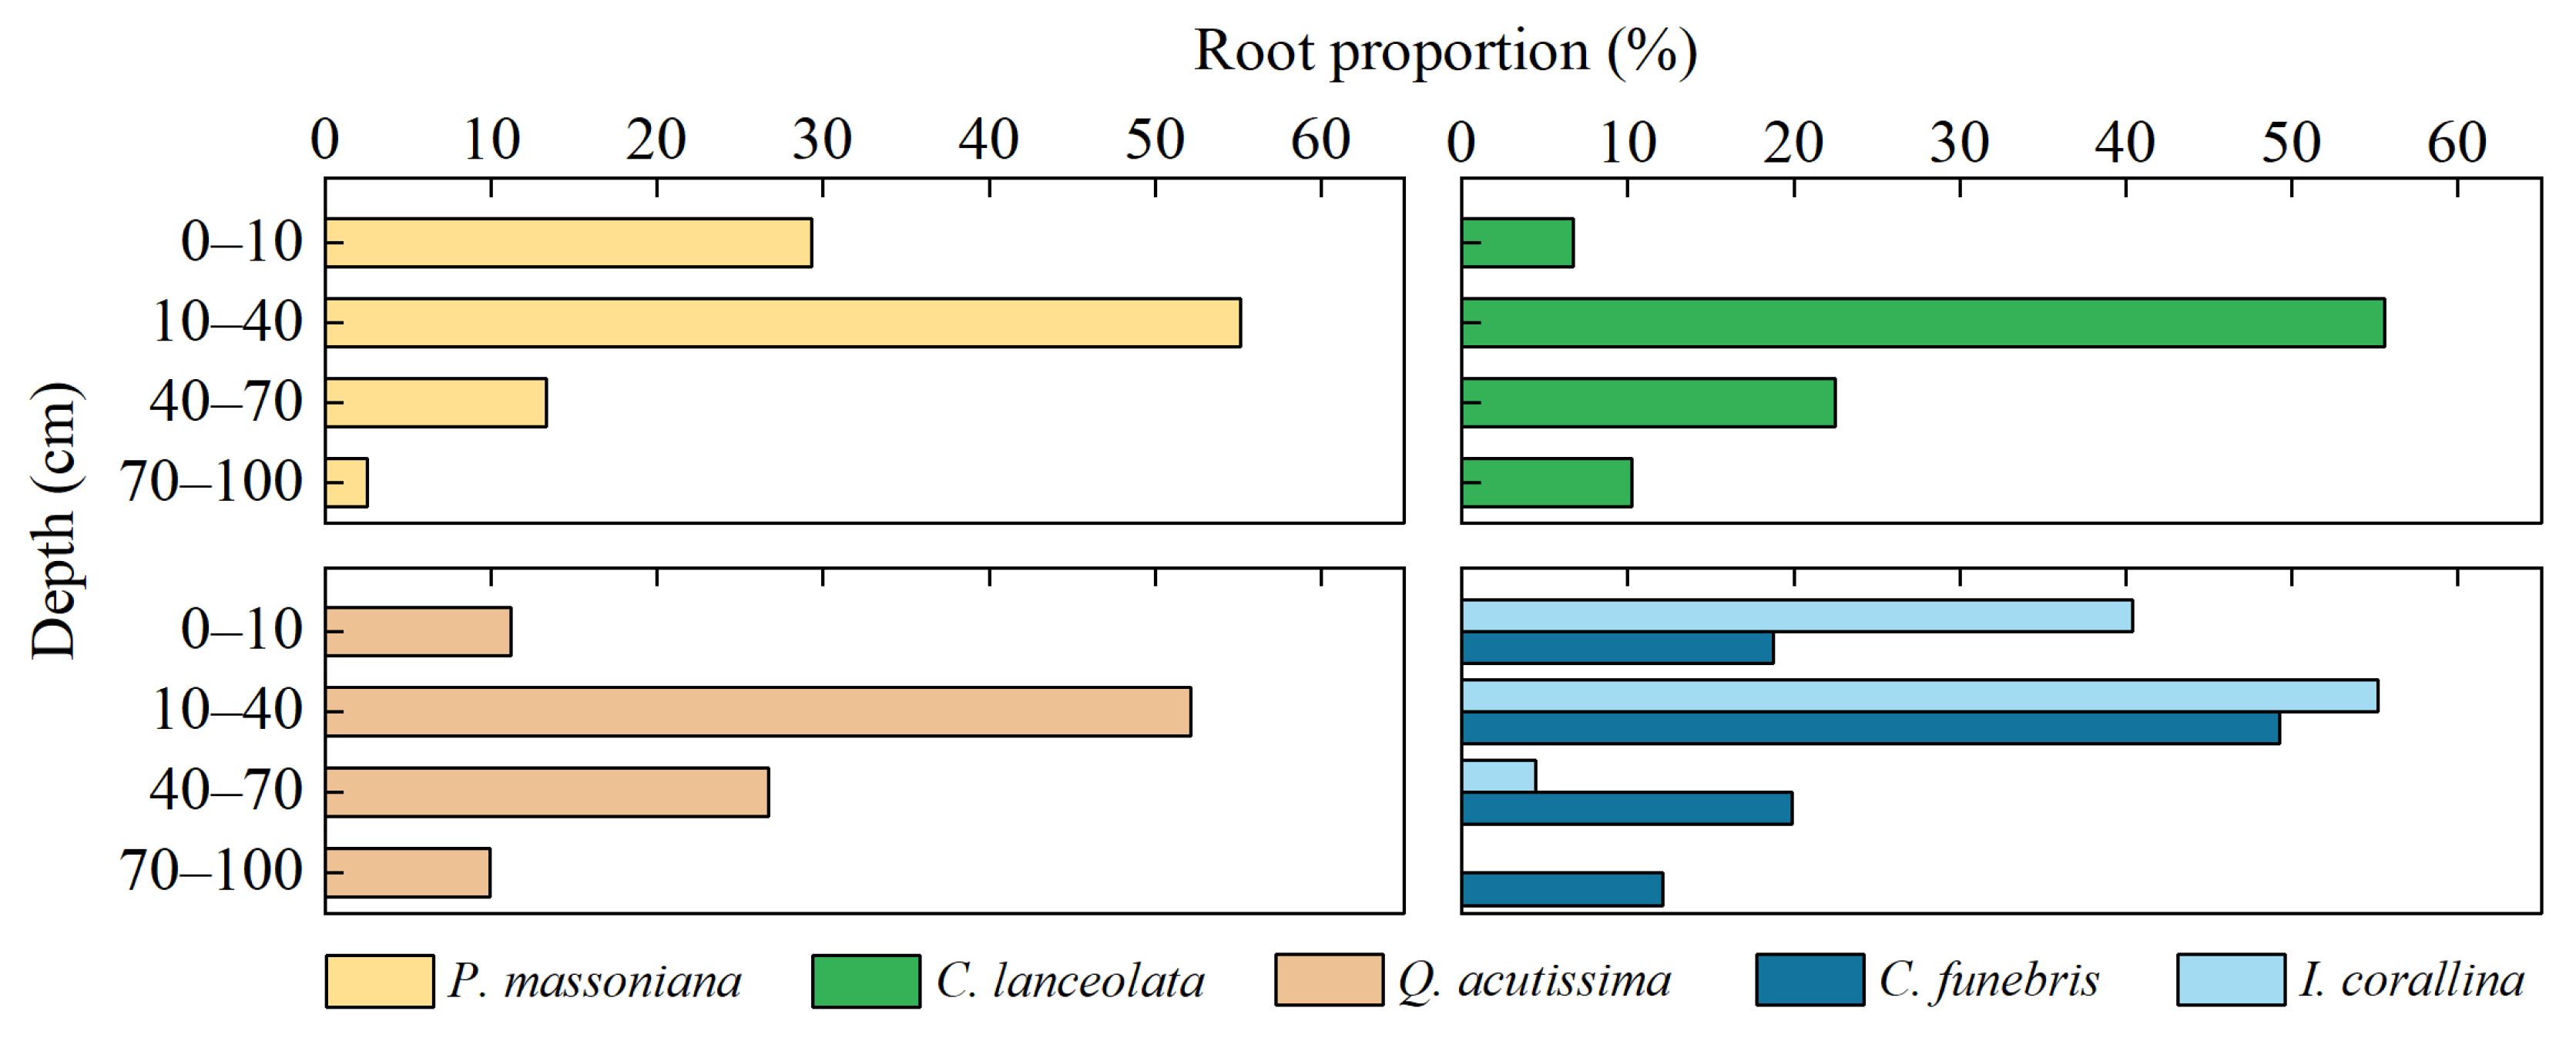
A comparison of the water utilisation strategies of different plants showed that because of the difference of root distribution, I. corallina with shallow roots tended to use shallow soil water, whereas P. massoniana, C. lanceolata, Q. acutissima and C. funebris with deeper roots tended to use deeper soil water. In Plot 4, the proportion of water utilisation of C. funebris and I. corallina in the wet season were similar; both mainly used surface and shallow water of soil. Nevertheless, there was a significant difference in dry season. C. funebris converted to extract middle and deep water of soil. This change suggested a certain degree of water competition between C. funebris and I. corallina in the wet season with sufficient water, but the water competition was less in dry season with water deficit. The mixing of C. funebris and I. corallina can effectively prevent water conflict in arid season of water deficit and is helpful to maintain the stability of regional forest ecosystem. From the wet season to the dry season, the SWC decreased, and the main water use depth of P. massoniana, C. lanceolata, Q. acutissima and C. funebris also shifted from shallow soil water to deeper soil water. Compared with the wet season, the water utilisation proportion of middle and deep soil (40–100 cm) increased by 40.4%, 56.7%, 52% and 49.6% during the dry season, respectively, for the four plants. Among them, the proportion of C. lanceolata and Q. acutissima increased significantly more than the other two species, with the most flexible strategies of water use. Yang et al. [40] also found that the water use strategies of P. massoniana and C. lanceolata are similar with this study. Such transformation might play an important role in maintaining the long-term survival of plants, especially when water competition occurred between tree species. Similar phenomena have also been shown in other previous studies [40,41,74,75]. Although the root data showed that the percentage of root biomass was not the largest in the deep layers of the above four species (Figure 10), the vertical distribution of the root system may not be a reliable indicator for studying the spatial and temporal dynamics of plant water uptake [76]. The transformation of water use strategies was due to the functional dimorphic root [40,72,76]. Numerous studies have shown that hydraulic redistribution often occurs in an ecosystem with dimorphic rooted plants, which moisten surface soil, facilitate nutrient absorption and delay soil during the drought periods [77,78,79]. The study site is located in the subtropical monsoon region, with strong precipitation variability and frequent seasonal drought. The dimorphic root characteristics of P. massoniana, C. lanceolata, Q. acutissima and C. funebris are the results of long-term adaptation to the regional environment, suggesting that the four plants have strong ecological plasticity [40]. This characteristic is of great significance to alleviate seasonal drought and improve plant water use efficiency, and to equip plants to deal with the predicted increasingly frequent drought events caused by global warming.
4.4. Limitation and Constraints
This study provided a preliminary exploration of plant water use on the basis of typical sunny days of wet and dry seasons. However, precipitation is an important source of recharging soil water; the process of plant water uptake must be influenced by precipitation. The dynamics of plant water use before as well as after rainfall can be monitored under different gradients of rainfall conditions in future work. This study obtained samples only in June and September; hence, the time series of the study can be extended in the future to develop research on multiple time scales per season or even per month.
In 2021, Rasmussen C. R. [1] showed that we can only acquire the ratio (%) of plant water uptake from isotopic compositions, but xylem water isotopic compositions do not provide information about total plant water uptake (mm): though the ratio of deep soil water uptake increases in the dry season, determining whether the quantity of deep soil water uptake does increase is not possible. Therefore, a simpler approach is to combine stable isotope techniques with quantitative measures or reliable estimates of transpiration [80].
5. Conclusions
The seasonal variation of water use strategies of P. massoniana, C. lanceolata, Q. acutissima, I. corallina and C. funebris in Taizishan Mountain area were studied by using the MixSIAR model based on double stable isotopes δD and δ18O. The LMWL of study site was δD = 7.95 δ18O + 11.65. Both of the slope and intercept were similar to those of GMWL, suggesting that the local climate characteristics were similar to the global average climate characteristics, and were global typical and representative to a certain degree. In both the dry season and wet season, the slope and intercept of XWL were smaller than those of SWL, indicating that plant utilisation of soil water was affected by evaporation in different degrees.
Compared with deep soil water, shallow soil water has richer isotopic composition and greater variation. The MixSIAR model predicted that, in the wet season, the P. massoniana predominantly derived water from the surface soil (0–10 cm), whereas C. lanceolata, Q. acutissima, I. corallina and C. funebris mainly derived water from the shallow soil (10–40 cm), among which C. lanceolata derived 77.3% water of shallow soil. In the dry season, the total proportion of water uptake of I. corallina from surface and shallow soil reached 64%. The main water use depth of P. massoniana, C. lanceolata, Q. acutissima and C. funebris shifted from shallow soil water in the wet season to deep soil water in the dry season, suggesting that the roots of the four plants had significant morphological characteristics and a greater degree of ecological plasticity may facilitate plant adaptation to global warming. In the wet season with sufficient water, both C. funebris and I. corallina predominantly derived water from surface and shallow soil. Nevertheless, C. funebris converted to extract deep soil water in the dry season. The mixing of C. funebris and I. corallina can effectively prevent water conflict in arid season of water deficit and is helpful to maintain the stability of regional forest ecosystem. In future studies, plant water use strategies should be explored on long time scales under rainfall events. In addition, monitoring of physiological mechanisms such as plant transpiration and photosynthesis can be used to understand the full process of plant water uptake.
Author Contributions
Conceptualization, Y.L. and F.Z.; methodology, Y.L. and Y.W.; software, Y.L. and Y.W.; investigation, Y.L., F.Z. and Y.W.; resources, Y.L., F.Z. and Y.W.; data curation, Y.L. and F.Z.; writing—original draft preparation, Y.L.; writing—review and editing, Y.L., F.Z., Y.W. and J.C.; visualization, Y.L.; supervision, J.C.; project administration, Y.L. and F.Z.; funding acquisition, J.C. All authors have read and agreed to the published version of the manuscript.
Funding
This research was funded by the National Natural Science Foundation of China, grant number 32071839.
Institutional Review Board Statement
Not applicable.
Informed Consent Statement
Not applicable.
Data Availability Statement
The data presented in this study are available on request from the corresponding author. The data are not publicly available due to privacy or ethical restrictions.
Acknowledgments
Many thanks to the Taizishan Forest Farm for supporting experiment. We also gratefully acknowledge the editor and reviewers.
Conflicts of Interest
The authors declare no conflict of interest.
References
- Rasmussen, C.R.; Kulmatiski, A. Improving Inferences from Hydrological Isotope Techniques. Trends Plant Sci. 2021, 26, 206–209. [Google Scholar] [CrossRef] [PubMed]
- Sprenger, M.; Leistert, H.; Gimbel, K.; Weiler, M. Illuminating hydrological processes at the soil-vegetation-atmosphere interface with water stable isotopes. Rev. Geophys. 2016, 54, 674–704. [Google Scholar] [CrossRef] [Green Version]
- Wang, J.; Fu, B.; Lu, N.; Zhang, L. Seasonal variation in water uptake patterns of three plant species based on stable isotopes in the semi-arid Loess Plateau. Sci. Total Environ. 2017, 609, 27–37. [Google Scholar] [CrossRef]
- Dodd, M.B.; Lauenroth, W.K.; Welker, J.M. Differential water resource use by herbaceous and woody plant life-forms in a shortgrass steppe community. Oecologia 1998, 117, 504–512. [Google Scholar] [CrossRef] [PubMed]
- Dawson, T.E.; Mambelli, S.; Plamboeck, A.H.; Templer, P.H.; Tu, K.P. Stable Isotopes in Plant Ecology. Annu. Rev. Ecol. Syst. 2002, 33, 507–559. [Google Scholar] [CrossRef]
- Evaristo, J.; McDonnell, J.J. Prevalence and magnitude of groundwater use by vegetation: A global stable isotope meta-analysis. Sci. Rep. 2017, 7, 44110. [Google Scholar] [CrossRef] [PubMed] [Green Version]
- Evaristo, J.; McDonnell, J.J.; Scholl, M.A.; Bruijnzeel, L.A.; Chun, K.P. Insights into plant water uptake from xylem-water isotope measurements in two tropical catchments with contrasting moisture conditions. Hydrol. Process 2016, 30, 3210–3227. [Google Scholar] [CrossRef]
- Roxy, M.K.; Ghosh, S.; Pathak, A.; Athulya, R.; Mujumdar, M.; Murtugudde, R.; Terray, P.; Rajeevan, M. A threefold rise in widespread extreme rain events over central India. Nat. Commun. 2017, 8, 708. [Google Scholar] [CrossRef] [PubMed]
- Tang, Q.; Oki, T.; Kanae, S.; Hu, H. Hydrological Cycles Change in the Yellow River Basin during the Last Half of the Twentieth Century. J. Clim. 2008, 21, 1790–1806. [Google Scholar] [CrossRef] [Green Version]
- Ge, Q.; Wang, H.; Rutishauser, T.; Dai, J. Phenological response to climate change in China: A meta-analysis. Glob. Chang. Biol. 2015, 21, 265–274. [Google Scholar] [CrossRef] [PubMed]
- Liu, S.; Zhou, T.; Wei, L.; Shu, Y. The spatial distribution of forest carbon sinks and sources in China. Chin. Sci. Bull. 2012, 57, 1699–1707. [Google Scholar] [CrossRef] [Green Version]
- Ren, W.; Tian, H.; Tao, B.; Chappelka, A.; Sun, G.; Lu, C.; Liu, M.; Chen, G.; Xu, X. Impacts of tropospheric ozone and climate change on net primary productivity and net carbon exchange of China’s forest ecosystems. Glob. Ecol. Biogeogr. 2011, 20, 391–406. [Google Scholar] [CrossRef]
- Chen, H.; Hu, K.; Nie, Y.; Wang, K. Analysis of soil water movement inside a footslope and a depression in a karst catchment, Southwest China. Sci. Rep. 2017, 7, 2544. [Google Scholar] [CrossRef] [PubMed] [Green Version]
- Wang, J.; Lu, N.; Fu, B. Inter-comparison of stable isotope mixing models for determining plant water source partitioning. Sci. Total Environ. 2019, 666, 685–693. [Google Scholar] [CrossRef] [PubMed]
- Delzon, S.; Loustau, D. Age-related decline in stand water use: Sap flow and transpiration in a pine forest chronosequence. Agric. For. Meteorol. 2005, 129, 105–119. [Google Scholar] [CrossRef]
- Xu, H.; Li, Y. Water-use strategy of three central Asian desert shrubs and their responses to rain pulse events. Plant Soil 2006, 285, 5–17. [Google Scholar] [CrossRef]
- Eggemeyer, K.D.; Awada, T.; Harvey, F.E.; Wedin, D.A.; Zhou, X.; Zanner, C.W. Seasonal changes in depth of water uptake for encroaching trees Juniperus virginiana and Pinus ponderosa and two dominant C4 grasses in a semiarid grassland. Tree Physiol. 2009, 29, 157–169. [Google Scholar] [CrossRef]
- Mares, R.; Barnard, H.R.; Mao, D.; Revil, A.; Singha, K. Examining diel patterns of soil and xylem moisture using electrical resistivity imaging. J. Hydrol. 2016, 536, 327–338. [Google Scholar] [CrossRef] [Green Version]
- Rao, S.; Lesparre, N.; Flores-Orozco, A.; Wagner, F.; Kemna, A.; Javaux, M. Imaging plant responses to water deficit using electrical resistivity tomography. Plant Soil 2020, 454, 261–281. [Google Scholar] [CrossRef]
- Meinzer, F.C.; Clearwater, M.J.; Goldstein, G. Water transport in trees: Current perspectives, new insights and some controversies. Environ. Exp. Bot. 2001, 45, 239–262. [Google Scholar] [CrossRef]
- Geris, J.; Tetzlaff, D.; McDonnell, J.J.; Soulsby, C. Spatial and temporal patterns of soil water storage and vegetation water use in humid northern catchments. Sci. Total Environ. 2017, 595, 486–493. [Google Scholar] [CrossRef] [PubMed]
- Jackson, P.C.; Meinzer, F.C.; Mercedes, B.; Guillermo, G.; Augusto, F.; Rundel, P.W.; Linda, C.; Erica, I.; Fabio, C. Partitioning of soil water among tree species in a Brazilian Cerrado ecosystem. Tree Physiol. 1999, 19, 717–724. [Google Scholar] [CrossRef] [PubMed] [Green Version]
- Prechsl, U.E.; Burri, S.; Gilgen, A.K.; Kahmen, A.; Buchmann, N. No shift to a deeper water uptake depth in response to summer drought of two lowland and sub-alpine C(3)-grasslands in Switzerland. Oecologia 2015, 177, 97–111. [Google Scholar] [CrossRef]
- Ma, Y.; Song, X. Using stable isotopes to determine seasonal variations in water uptake of summer maize under different fertilization treatments. Sci. Total Environ. 2016, 550, 471–483. [Google Scholar] [CrossRef]
- Hardanto, A.; Röll, A.; Hendrayanto, J.; Hölscher, D. Tree soil water uptake and transpiration in mono-cultural and jungle rubber stands of Sumatra. For. Ecol. Manag. 2017, 397, 67–77. [Google Scholar] [CrossRef]
- Luo, Z.; Guan, H.; Zhang, X.; Xu, X.; Dai, J.; Hua, M. Examination of the ecohydrological separation hypothesis in a humid subtropical area: Comparison of three methods. J. Hydrol. 2019, 571, 642–650. [Google Scholar] [CrossRef] [Green Version]
- Rothfuss, Y.; Javaux, M. Reviews and syntheses: Isotopic approaches to quantify root water uptake: A review and comparison of methods. Biogeosciences 2017, 14, 2199–2224. [Google Scholar] [CrossRef] [Green Version]
- Ellsworth, P.Z.; Williams, D.G. Hydrogen isotope fractionation during water uptake by woody xerophytes. Plant Soil 2007, 291, 93–107. [Google Scholar] [CrossRef]
- Dawson, T.E.; Ehleringer, J.R. Streamside trees that do not use stream water. Nature 1991, 350, 335–337. [Google Scholar] [CrossRef]
- Xiang, W.; Si, B.; Li, M.; Li, H.; Lu, Y.; Zhao, M.; Feng, H. Stable isotopes of deep soil water retain long-term evaporation loss on China’s Loess Plateau. Sci. Total Environ. 2021, 784, 147153. [Google Scholar] [CrossRef] [PubMed]
- Penna, D.; Geris, J.; Hopp, L.; Scandellari, F. Water sources for root water uptake: Using stable isotopes of hydrogen and oxygen as a research tool in agricultural and agroforestry systems. Agric. Ecosyst. Environ. 2020, 291, 106790. [Google Scholar] [CrossRef]
- Mora, G.; Jahren, A.H. Isotopic evidence for the role of plant development on transpiration in deciduous forests of southern United States. Glob. Biogeochem. Cycles 2003, 17, 1981. [Google Scholar] [CrossRef]
- Snyder, K.A.; Williams, D.G. Water sources used by riparian trees varies among stream types on the San Pedro River, Arizona. Agric. For. Meteorol. 2000, 105, 227–240. [Google Scholar] [CrossRef]
- Phillips, D.L.; Gregg, J.W. Source partitioning using stable isotopes: Coping with too many sources. Oecologia 2003, 136, 261–269. [Google Scholar] [CrossRef]
- Romero-Saltos, H.; Sternberg, L.; Moreira, M.Z.; Nepstad, D. Rainfall exclusion in an eastern Amazonian forest alters soil water movement and depth of water uptake. Am. J. Bot. 2005, 92, 443–455. [Google Scholar] [CrossRef] [PubMed] [Green Version]
- Moore, J.W.; Semmens, B.X. Incorporating uncertainty and prior information into stable isotope mixing models. Ecol. Lett. 2008, 11, 470–480. [Google Scholar] [CrossRef] [PubMed]
- Parnell, A.C.; Inger, R.; Bearhop, S.; Jackson, A.L. Source partitioning using stable isotopes: Coping with too much variation. PLoS ONE 2010, 5, e9672. [Google Scholar] [CrossRef]
- Stock, B.C.; Semmens, B.X. MixSIAR GUI User Manual, Version 3.1. 2013. Available online: http://conserver.iugocafe.org/user/brice.semmens/MixSIAR (accessed on 10 March 2016).
- Jackson, P.C.; Cavelier, J.; Goldstein, G.; Meinzer, F.C.; Holbrook, N.M. Partitioning of water resources among plants of a lowland tropical forest. Oecologia 1995, 101, 197–203. [Google Scholar] [CrossRef] [PubMed]
- Yang, B.; Wen, X.; Sun, X. Seasonal variations in depth of water uptake for a subtropical coniferous plantation subjected to drought in an East Asian monsoon region. Agric. For. Meteorol. 2015, 201, 218–228. [Google Scholar] [CrossRef]
- McCole, A.A.; Stern, L.A. Seasonal water use patterns of Juniperus ashei on the Edwards Plateau, Texas, based on stable isotopes in water. J. Hydrol. 2007, 342, 238–248. [Google Scholar] [CrossRef]
- Asbjornsen, H.; Mora, G.; Helmers, M.J. Variation in water uptake dynamics among contrasting agricultural and native plant communities in the Midwestern U.S. Agric. Ecosyst. Environ. 2007, 121, 343–356. [Google Scholar] [CrossRef]
- Zhou, H.; Zhao, W.; Zhang, G. Varying water utilization of Haloxylon ammodendron plantations in a desert-oasis ecotone. Hydrol. Process. 2017, 31, 825–835. [Google Scholar] [CrossRef]
- White, J.; Cook, E.R.; Lawrence, J.R.; Broecker, W.S. The D/H ratios of sap in trees: Implications for water sources and tree ring D/H ratios. Geochim. Cosmochimca Acta 1985, 49, 237–246. [Google Scholar] [CrossRef]
- Nippert, J.B.; Knapp, A.K. Soil water partitioning contributes to species coexistence in tallgrass prairie. Oikos 2007, 116, 1017–1029. [Google Scholar] [CrossRef]
- Li, S.-G.; Romero-Saltos, H.; Tsujimura, M.; Sugimoto, A.; Sasaki, L.; Davaa, G.; Oyunbaatar, D. Plant water sources in the cold semiarid ecosystem of the upper Kherlen River catchment in Mongolia: A stable isotope approach. J. Hydrol. 2007, 333, 109–117. [Google Scholar] [CrossRef]
- Huang, L.; Zhang, Z.S. Stable Isotopic Analysis on Water Utilization of Two Xerophytic Shrubs in a Revegetated Desert Area: Tengger Desert, China. Water 2015, 7, 1030–1045. [Google Scholar] [CrossRef] [Green Version]
- Zheng, L.J.; Ma, J.J.; Sun, X.H.; Guo, X.H.; Cheng, Q.Y.; Shi, X.K. Estimating the Root Water Uptake of Surface-Irrigated Apples Using Water Stable Isotopes and the Hydrus-1D Model. Water 2018, 10, 1624. [Google Scholar] [CrossRef] [Green Version]
- Zhang, Y.; Zhang, M.; Qu, D.; Duan, W.; Wang, J.; Su, P.; Guo, R. Water Use Strategies of Dominant Species (Caragana korshinskii and Reaumuria soongorica) in Natural Shrubs Based on Stable Isotopes in the Loess Hill, China. Water 2020, 12, 1923. [Google Scholar] [CrossRef]
- Qin, J.; Si, J.H.; Jia, B.; Zhao, C.Y.; Zhou, D.M.; He, X.H.; Wang, C.L.; Zhu, X.L. Water Use Characteristics of Two Dominant Species in the Mega-Dunes of the Badain Jaran Desert. Water 2022, 14, 53. [Google Scholar] [CrossRef]
- Wen, X.-F.; Yu, G.-R.; Sun, X.-M.; Li, Q.-K.; Liu, Y.-F.; Zhang, L.-M.; Ren, C.-Y.; Fu, Y.-L.; Li, Z.-Q. Soil moisture effect on the temperature dependence of ecosystem respiration in a subtropical Pinus plantation of southeastern China. Agric. For. Meteorol. 2006, 137, 166–175. [Google Scholar] [CrossRef]
- Wen, X.F.; Wang, H.M.; Wang, J.L.; Yu, G.R.; Sun, X.M. Ecosystem carbon exchanges of a subtropical evergreen coniferous plantation subjected to seasonal drought, 2003–2007. Biogeosciences 2010, 7, 357–369. [Google Scholar] [CrossRef] [Green Version]
- Tang, Y.; Wen, X.; Sun, X.; Wang, H. Interannual variation of the Bowen ratio in a subtropical coniferous plantation in southeast China, 2003–2012. PLoS ONE 2014, 9, e88267. [Google Scholar] [CrossRef] [Green Version]
- Tang, Y.; Wen, X.; Sun, X.; Zhang, X.; Wang, H. The limiting effect of deep soilwater on evapotranspiration of a subtropical coniferous plantation subjected to seasonal drought. Adv. Atmos. Sci. 2014, 31, 385–395. [Google Scholar] [CrossRef]
- Moreno-Gutierrez, C.; Dawson, T.E.; Nicolas, E.; Querejeta, J.I. Isotopes reveal contrasting water use strategies among coexisting plant species in a Mediterranean ecosystem. New Phytol. 2012, 196, 489–496. [Google Scholar] [CrossRef] [PubMed]
- Li, X.; Niu, J.; Xie, B. Study on hydrological functions of litter layers in North China. PLoS ONE 2013, 8, e70328. [Google Scholar] [CrossRef] [PubMed]
- Dawson, T.E.; Pate, J.S. Seasonal water uptake and movement in root systems of Australian phraeatophytic plants of dimorphic root morphology: A stable isotope investigation. Oecologia 1996, 107, 13–20. [Google Scholar] [CrossRef] [PubMed]
- Sato, Y.; Kumagai, T.O.; Kume, A.; Otsuki, K.; Ogawa, S. Experimental analysis of moisture dynamics of litter layers? The effects of rainfall conditions and leaf shapes. Hydrol. Process. 2004, 18, 3007–3018. [Google Scholar] [CrossRef]
- Bussière, F.; Cellier, P. Modification of the soil temperature and water content regimes by a crop residue mulch: Experiment and modelling. Agric. For. Meteorol. 1994, 68, 1–28. [Google Scholar] [CrossRef]
- Sayer, E.J. Using experimental manipulation to assess the roles of leaf litter in the functioning of forest ecosystems. Biol. Rev. 2010, 81, 1–31. [Google Scholar] [CrossRef]
- Geddes, N.; Dunkerley, D. The influence of organic litter on the erosive effects of raindrops and of gravity drops released from desert shrubs. CATENA 1999, 36, 303–313. [Google Scholar] [CrossRef]
- Craig, H.J.S. Isotopic Variations in Meteoric Waters. Science 1961, 133, 1702–1703. [Google Scholar] [CrossRef] [PubMed]
- Gibson, J.J.; Birks, S.J.; Edwards, T.W.D. Global prediction ofδAandδ2H-δ18O evaporation slopes for lakes and soil water accounting for seasonality. Glob. Biogeochem. Cycles 2008, 22, 2997. [Google Scholar] [CrossRef]
- Benettin, P.; Volkmann, T.H.M.; von Freyberg, J.; Frentress, J.; Penna, D.; Dawson, T.E.; Kirchner, J.W. Effects of climatic seasonality on the isotopic composition of evaporating soil waters. Hydrol. Earth Syst. Sci. 2018, 22, 2881–2890. [Google Scholar] [CrossRef] [Green Version]
- Sprenger, M.; Tetzlaff, D.; Buttle, J.; Carey, S.K.; McNamara, J.P.; Laudon, H.; Shatilla, N.J.; Soulsby, C. Storage, mixing, and fluxes of water in the critical zone across northern environments inferred by stable isotopes of soil water. Hydrol. Process 2018, 32, 1720–1737. [Google Scholar] [CrossRef] [Green Version]
- Saxena, R.K. Seasonal Variations of Oxygen-18 in Soil Moisture and Estimation of Recharge in Esker and Moraine Formations. Hydrol. Res. 1984, 15, 235–242. [Google Scholar] [CrossRef]
- Gazis, C.; Feng, X. A stable isotope study of soil water: Evidence for mixing and preferential flow paths. Geoderma 2004, 119, 97–111. [Google Scholar] [CrossRef]
- Yang, Y.; Fu, B. Soil water migration in the unsaturated zone of semiarid region in China from isotope evidence. Hydrol. Earth Syst. Sci. 2017, 21, 1757–1767. [Google Scholar] [CrossRef] [Green Version]
- Dawson, T.E.; Simonin, K.A. The Roles of Stable Isotopes in Forest Hydrology and Biogeochemistry. In Forest Hydrology and Biogeochemistry; Springer: Dordrecht, The Netherlands, 2011; pp. 137–161. [Google Scholar]
- Dai, Y.; Zheng, X.-J.; Tang, L.-S.; Li, Y. Stable oxygen isotopes reveal distinct water use patterns of two Haloxylon species in the Gurbantonggut Desert. Plant Soil 2014, 389, 73–87. [Google Scholar] [CrossRef]
- Wu, H.; Li, X.Y.; Jiang, Z.; Chen, H.; Zhang, C.; Xiao, X. Contrasting water use pattern of introduced and native plants in an alpine desert ecosystem, Northeast Qinghai-Tibet Plateau, China. Sci. Total Environ. 2016, 542 Pt A, 182–191. [Google Scholar] [CrossRef]
- Nie, Y.; Chen, H.; Wang, K.; Tan, W.; Deng, P.; Yang, J. Seasonal water use patterns of woody species growing on the continuous dolostone outcrops and nearby thin soils in subtropical China. Plant Soil 2010, 341, 399–412. [Google Scholar] [CrossRef]
- Sun, S.J.; Meng, P.; Zhang, J.S.; Wan, X. Variation in soil water uptake and its effect on plant water status in Juglans regia L. during dry and wet seasons. Tree Physiol. 2011, 31, 1378–1389. [Google Scholar] [CrossRef] [PubMed] [Green Version]
- Liu, J.; Song, X.; Yuan, G.; Sun, X.; Liu, X.; Wang, S. Characteristics of δ 18O in precipitation over Eastern Monsoon China and the water vapor sources. Chin. Sci. Bull. 2009, 55, 200–211. [Google Scholar] [CrossRef]
- Liu, W.; Liu, W.; Li, P.; Duan, W.; Li, H. Dry season water uptake by two dominant canopy tree species in a tropical seasonal rainforest of Xishuangbanna, SW China. Agric. For. Meteorol. 2010, 150, 380–388. [Google Scholar] [CrossRef]
- Ehleringer, J.R.; Dawson, T.E. Water uptake by plants: Perspectives from stable isotope composition. Plant Cell Environ. 1992, 15, 1073–1082. [Google Scholar] [CrossRef]
- Baker, J.M.; Van Bavel, C.H.M. Resistance of Plant Roots to Water Loss. Agron. J. 1986, 78, 641–644. [Google Scholar] [CrossRef]
- Bleby, T.M.; Mcelrone, A.J.; Jackson, R.B. Environment, Water uptake and hydraulic redistribution across large woody root systems to 20 m depth. Plant Cell Environ. 2010, 33, 2132–2148. [Google Scholar] [CrossRef] [PubMed]
- Neumann, R.B.; Cardon, Z.G. The magnitude of hydraulic redistribution by plant roots: A review and synthesis of empirical and modeling studies. New Phytol. 2012, 194, 337–352. [Google Scholar] [CrossRef] [PubMed]
- Iborra, J.F. Coupled Transcription and Translation within Nuclei of Mammalian Cells. Science 2001, 293, 1139–1142. [Google Scholar] [CrossRef] [PubMed] [Green Version]
Figure 1.
Geographical location of the study area.

Figure 2.
Temperature and precipitation during sampling periods.

Figure 3.
Vertical profiles (0–100 cm) of gravimetric water content of soil for Plot 1 (a), Plot 2 (b), Plot 3 (c), Plot 4 (d). Error bars represent the standard deviation (N = 3).
Figure 3.
Vertical profiles (0–100 cm) of gravimetric water content of soil for Plot 1 (a), Plot 2 (b), Plot 3 (c), Plot 4 (d). Error bars represent the standard deviation (N = 3).

Figure 4.
Precipitation and isotopic composition of rainwater during the observation period (a) Precipitation and δD composition of rainwater, (b) Precipitation and δ18O composition of rainwater. The starting point of the abscissa axis represents 1 June 2019.
Figure 4.
Precipitation and isotopic composition of rainwater during the observation period (a) Precipitation and δD composition of rainwater, (b) Precipitation and δ18O composition of rainwater. The starting point of the abscissa axis represents 1 June 2019.

Figure 5.
Linear regression relationship between δD and δ18O in rainfall, soil water and xylem water during the sampling periods.
Figure 5.
Linear regression relationship between δD and δ18O in rainfall, soil water and xylem water during the sampling periods.

Figure 6.
Linear regression relationship of δD and δ18O in rainfall, soil water and xylem water from wet season and dry season.
Figure 6.
Linear regression relationship of δD and δ18O in rainfall, soil water and xylem water from wet season and dry season.

Figure 7.
Seasonal isotopic variations of (a) δD and (b) δ18O xylem water in P. massoniana, C. lanceolata, Q. acutissima, I. corallina and C. funebris. Error bars represent the standard deviation (N = 9).
Figure 7.
Seasonal isotopic variations of (a) δD and (b) δ18O xylem water in P. massoniana, C. lanceolata, Q. acutissima, I. corallina and C. funebris. Error bars represent the standard deviation (N = 9).

Figure 8.
Seasonal δD and δ18O variations of soil and xylem water in P. massoniana, C. lanceolata, Q. acutissima, I. corallina and C. funebris. Error bars represent the standard deviation (N = 3).
Figure 8.
Seasonal δD and δ18O variations of soil and xylem water in P. massoniana, C. lanceolata, Q. acutissima, I. corallina and C. funebris. Error bars represent the standard deviation (N = 3).

Figure 9.
Seasonal variations in fraction of water uptake from different soil layers based on MixSIAR for (a) P. massoniana, (b) C. lanceolata, (c) Q. acutissima, (d) I. corallina and (e) C. funebris.
Figure 9.
Seasonal variations in fraction of water uptake from different soil layers based on MixSIAR for (a) P. massoniana, (b) C. lanceolata, (c) Q. acutissima, (d) I. corallina and (e) C. funebris.

Figure 10.
Vertical distribution of root biomass of the plant species in the four plots.


Table 1.
Basic situation of the experimental plots.
| Plots | Dominant Tree Species | Area (m2) | Slope (°) | Age (a) | Canopy Density (%) | Soil Bulk Density (g/cm3) | Soil Porosity (%) |
|---|---|---|---|---|---|---|---|
| Plot 1 | P. massoniana | 20 × 20 | 15 | 30a | 60 | 1.36 | 40.57 |
| Plot 2 | C. lanceolata | 20 × 20 | 11 | 30a | 64 | 1.45 | 42.58 |
| Plot 3 | Q. acutissima | 20 × 20 | 12 | 35a | 71 | 1.29 | 45.63 |
| Plot 4 | C. funebris and I. corallina | 20 × 20 | 13 | 30a | 69 | 1.31 | 46.1 |
Table 2.
Comparison of litter depth, storage and water holding capacity among different experimental plots.
Table 2.
Comparison of litter depth, storage and water holding capacity among different experimental plots.
| Plots | Stand Type | Average Depth of Litter (cm) | Litter Storage (t·hm−2) | Maximum Moisture Capacity of Litter (t·hm−2) |
|---|---|---|---|---|
| Plot 1 | P. massoniana | 1.56 | 7.45 | 11.43 |
| Plot 2 | C. lanceolata | 2.98 | 7.99 | 12.06 |
| Plot 3 | Q. acutissima | 3.66 | 9.6 | 15.49 |
| Plot 4 | C. funebris and I. corallina | 3.35 | 8.25 | 14.79 |
Table 3.
Average soil water content of different soil depths.
| Average Soil Water Content (%) | P. massoniana | C. lanceolata | Q. acutissima | C. funebris I. corallina | ||||
|---|---|---|---|---|---|---|---|---|
| 16 June | 28 September | 16 June | 28 September | 16 June | 28 September | 16 June | 28 September | |
| Total | 22.56 ± 2.64 | 10.88 ± 1.07 | 22.29 ± 2.14 | 11.96 ± 1.21 | 23.46 ± 3.11 | 16.44 ± 1.71 | 22.64 ± 1.95 | 13.17 ± 1.55 |
| 0–10 cm | 20.48 ± 0.09 | 8.66 ± 0.19 | 22.96 ± 0.24 | 11.06 ± 0.75 | 31.25 ± 0.44 | 14.1 ± 0.06 | 25.25 ± 0.22 | 12 ± 0.92 |
| 10–40 cm | 25.03 ± 3.26 | 10.98 ± 0.92 | 23.75 ± 1.36 | 12.4 ± 1.56 | 24.02 ± 0.8 | 15.36 ± 1.46 | 24.27 ± 1.4 | 11.53 ± 0.68 |
| 40–70 cm | 22.42 ± 1.69 | 11 ± 0.86 | 23.15 ± 1.24 | 12.41 ± 1.01 | 21.4 ± 1.32 | 16.46 ± 0.88 | 21.6 ± 1.37 | 14.1 ± 1.4 |
| 70–100 cm | 20.93 ± 0.54 | 11.41 ± 0.64 | 19.76 ± 1.62 | 11.39 ± 0.76 | 22.36 ± 1.83 | 18.27 ± 0.74 | 21.17 ± 0.88 | 14.29 ± 0.42 |
Publisher’s Note: MDPI stays neutral with regard to jurisdictional claims in published maps and institutional affiliations. |
© 2022 by the authors. Licensee MDPI, Basel, Switzerland. This article is an open access article distributed under the terms and conditions of the Creative Commons Attribution (CC BY) license (https://creativecommons.org/licenses/by/4.0/).
Share and Cite
MDPI and ACS Style
Li, Y.; Zhu, F.; Wang, Y.; Cheng, J. Soil Water Use Strategies of Dominant Tree Species Based on Stable Isotopes in Subtropical Regions, Central China. Water 2022, 14, 954. https://doi.org/10.3390/w14060954
AMA Style
Li Y, Zhu F, Wang Y, Cheng J. Soil Water Use Strategies of Dominant Tree Species Based on Stable Isotopes in Subtropical Regions, Central China. Water. 2022; 14(6):954. https://doi.org/10.3390/w14060954
Chicago/Turabian StyleLi, Yuchen, Fangfang Zhu, Yu Wang, and Jinhua Cheng. 2022. "Soil Water Use Strategies of Dominant Tree Species Based on Stable Isotopes in Subtropical Regions, Central China" Water 14, no. 6: 954. https://doi.org/10.3390/w14060954
Note that from the first issue of 2016, this journal uses article numbers instead of page numbers. See further details here.