
Numerical Simulation of Fluid Pore Pressure Diffusion and Its Mechanical Effects during Wenchuan Aftershocks


1
Shandong Provincial Key Laboratory of Depositional Mineralization & Sedimentary Minerals, College of Earth Science and Engineering, Shandong University of Science and Technology, Qingdao 266590, China
2
National Institute of Natural Hazards, Ministry of Emergency Management of China, Beijing 100085, China
*
Authors to whom correspondence should be addressed.
Water 2022, 14(6), 952; https://doi.org/10.3390/w14060952
Submission received: 17 February 2022
/
Revised: 8 March 2022
/
Accepted: 10 March 2022
/
Published: 18 March 2022
(This article belongs to the Topic Natural Hazards and Disaster Risks Reduction)
Abstract
:The Ms 8.0 Wenchuan earthquake occurred on 12 May 2008, in the Sichuan Province of China, and it was accompanied by a series of strong aftershocks. The mechanisms contributing to the triggering of the Wenchuan aftershocks have attracted international attention. In this paper, based on previous analysis of spatiotemporal distribution of aftershocks regarding pore pressure diffusion of deep fluid, we established a three-dimensional hydraulic–mechanical coupling model and investigated the influence of fluid migration and its mechanical effects in the Longmenshan fault zone by using FLAC3D software. We obtained the characteristics of the pore pressure diffusion and fault reactivation within 70 days in an area NA. The results show that the pore pressure significantly increases up to 80 MPa during fluid intrusion into the fault plane. The pore pressure increase along the fault dip is greater than that along the fault strike, with a maximum difference of 3.18 MPa. The increase in pore pressure along the fault reduces the effective stress and leads to fault reactivation. The evolution of the fault reactivation area calculated in the model is compared with the spatiotemporal characteristics of the aftershocks. This study is meaningful for furthering the understanding of the role of deep fluids in fault dynamics and aftershocks triggering.
1. Introduction
Earthquakes are often accompanied by changes in the physical properties, chemical compositions, and other aspects of deep fluids [1,2,3,4,5]. The stress changes caused by a mainshock can cause the diffusion of trapped fluids along a seismogenic fault, thereby reducing the effective stresses and leading to further rock failure and triggering aftershocks [6,7]. Geophysical inversions show that some earthquakes are located in areas containing fluids or with high pore pressures, such as the 1995 Kobe earthquake [8], the 2001 Bhuj earthquake [9] and the 1938 Kutcharo earthquake [10] in Japan, and the 2009 L’Aquila earthquake in Italy [11]. Furthermore, there is much evidence to support that the spatiotemporal distribution of some aftershocks may be driven by the migration of fluid [12], including aftershocks of the 1992 Landers earthquake in the United States [13], the 1995 Antofagasta aftershocks in northern Chile [14], the 1997 Umbra–Marche aftershocks in Italy [6], the 2004 Sumatra aftershocks [15], and the aftershocks that occurred in 2014 in the West Bohemia/Vogtland region [16].
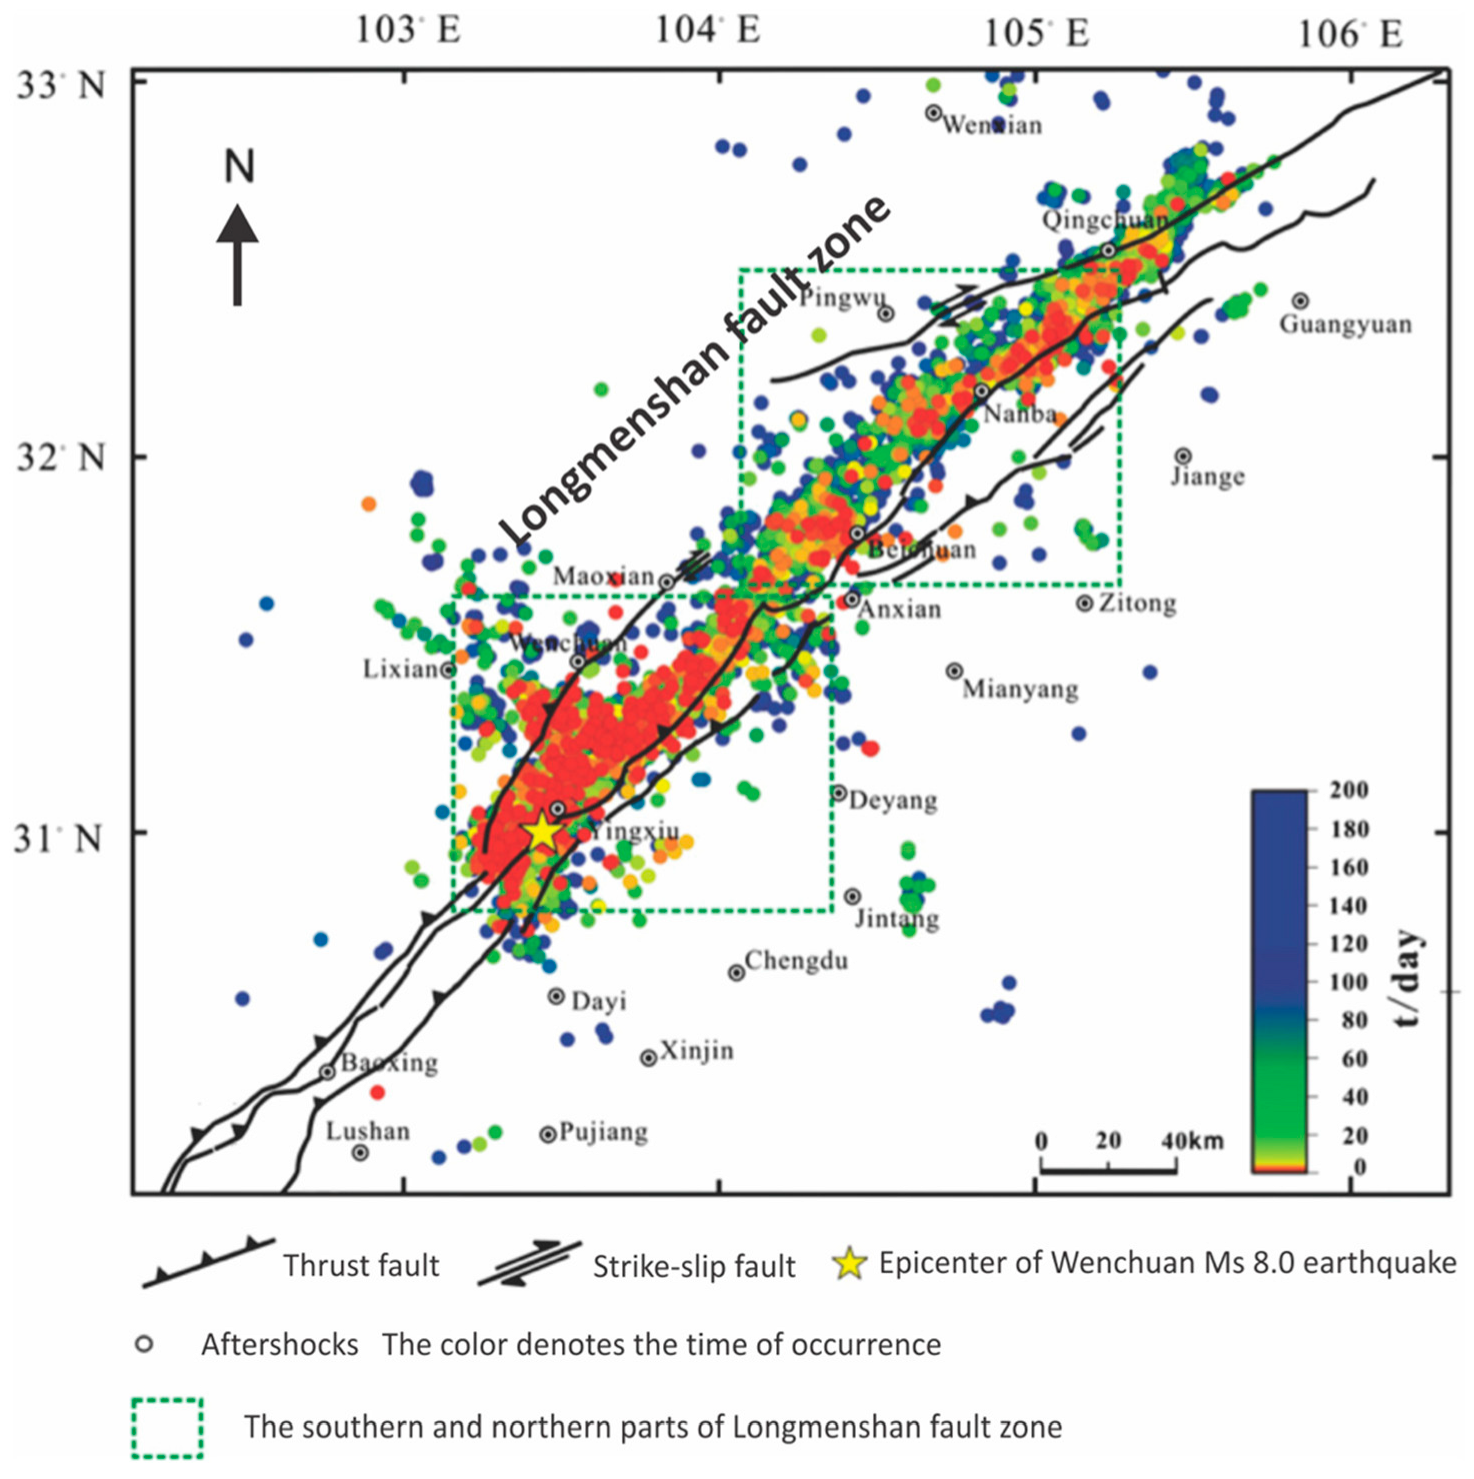
The Ms 8.0 Wenchuan earthquake is one of the largest disasters in China in recent years. The mechanisms related to its triggering have been the focus of international attention and have become an attractive field. Some scholars suggest that the occurrence of the Wenchuan earthquake is related to the filling of the Zipingpu reservoir, e.g., [17,18,19]. Ge et al. [17] calculated stress changes caused by the filling of the Zipingpu reservoir at the depth of the Wenchuan hypocenter and found that its filling could cause an earthquake to occur earlier than it otherwise would have. Lei et al. [18] analyzed the relationship between reservoir-induced stress changes and seismicity near the reservoir. They found that the filling of the Zipingpu reservoir caused Coulomb stress changes up to 0.05 MPa at 10 km depth along the central fault of the Longmenshan fault zone, which could have contributed to the Wenchuan earthquake. Sun et al. [19] used a three-dimensional porous elastic model to estimate that filling the Zipingpu reservoir increased Coulomb stresses by 1 kPa at the depth of the Wenchuan earthquake hypocenter. Although there is not yet a consensus on whether the Wenchuan earthquake was triggered by the filling of the Zipingpu reservoir [20], these studies show that even small stress changes caused by fluids can lead to the acceleration of seismicity. However, compared with surface reservoir impoundment, the stress changes caused by deep fluid migration may be greater at the depth of the earthquake hypocenter [21,22,23]. Many scholars have demonstrated the possibility that deep fluid may exist in the Longmenshan fault zone using geophysical and geochemical methods [24,25,26,27]. Liu et al. [1] analyzed the Wenchuan aftershock spatiotemporal distributions by pore pressure diffusion mechanics and suggest that the movement of deep fluid may trigger aftershocks in the Longmenshan fault zone (Figure 1). However, it was mainly studied from the point of view of hydraulic dynamics without considering the mechanical process. It is necessary to further discuss the role of deep fluid migration in the triggering of the Wenchuan aftershocks by considering a coupled hydraulic–mechanical model.
In this study, based on the analysis of spatiotemporal distribution of Wenchuan aftershocks [1], we build a three-dimensional hydraulic–mechanical coupling model for investigating the process of deep-fluid diffusion along the fault and calculated its mechanical effects on fault reactivation using FLAC3D software. The calculated fault reactivation area is compared with the spatial and temporal distribution of Wenchuan aftershocks. The results provide an insight into the role of pore pressure diffusion in triggering aftershocks and the relationship between deep fluids and the seismogenic process.
2. Study Area
Based on focal mechanisms and distribution of hypocenters of the Wenchuan aftershocks and the Longmenshan fault zone structure [28], there are some areas containing similar types of seismicity along the Longmenshan fault zone. Because the focal mechanisms of the aftershocks are similar in such areas, it is likely that they have the same triggering mechanisms [29], that is, the pore pressure diffusion of trapped deep fluid which is initiated by stress changes caused by the mainshock [6], as observed in aftershocks related to fluid migration elsewhere [11].
Pore pressure diffusion is one of the main methods of analyzing the spatiotemporal distribution of earthquakes and extracting information on fluids involved in earthquakes, e.g., [7,30,31,32]. If the first earthquake in an earthquake sequence is considered as a fluid intrusion point, then if the distance between the first earthquake and its aftershocks (r) gradually increases with time (t), these points will follow an envelope line in an r–t plot. The emergence of an envelope line demonstrates that the earthquakes are triggered mainly by the diffusion of pore pressure, which can be used to estimate hydraulic diffusivity, D [7]:
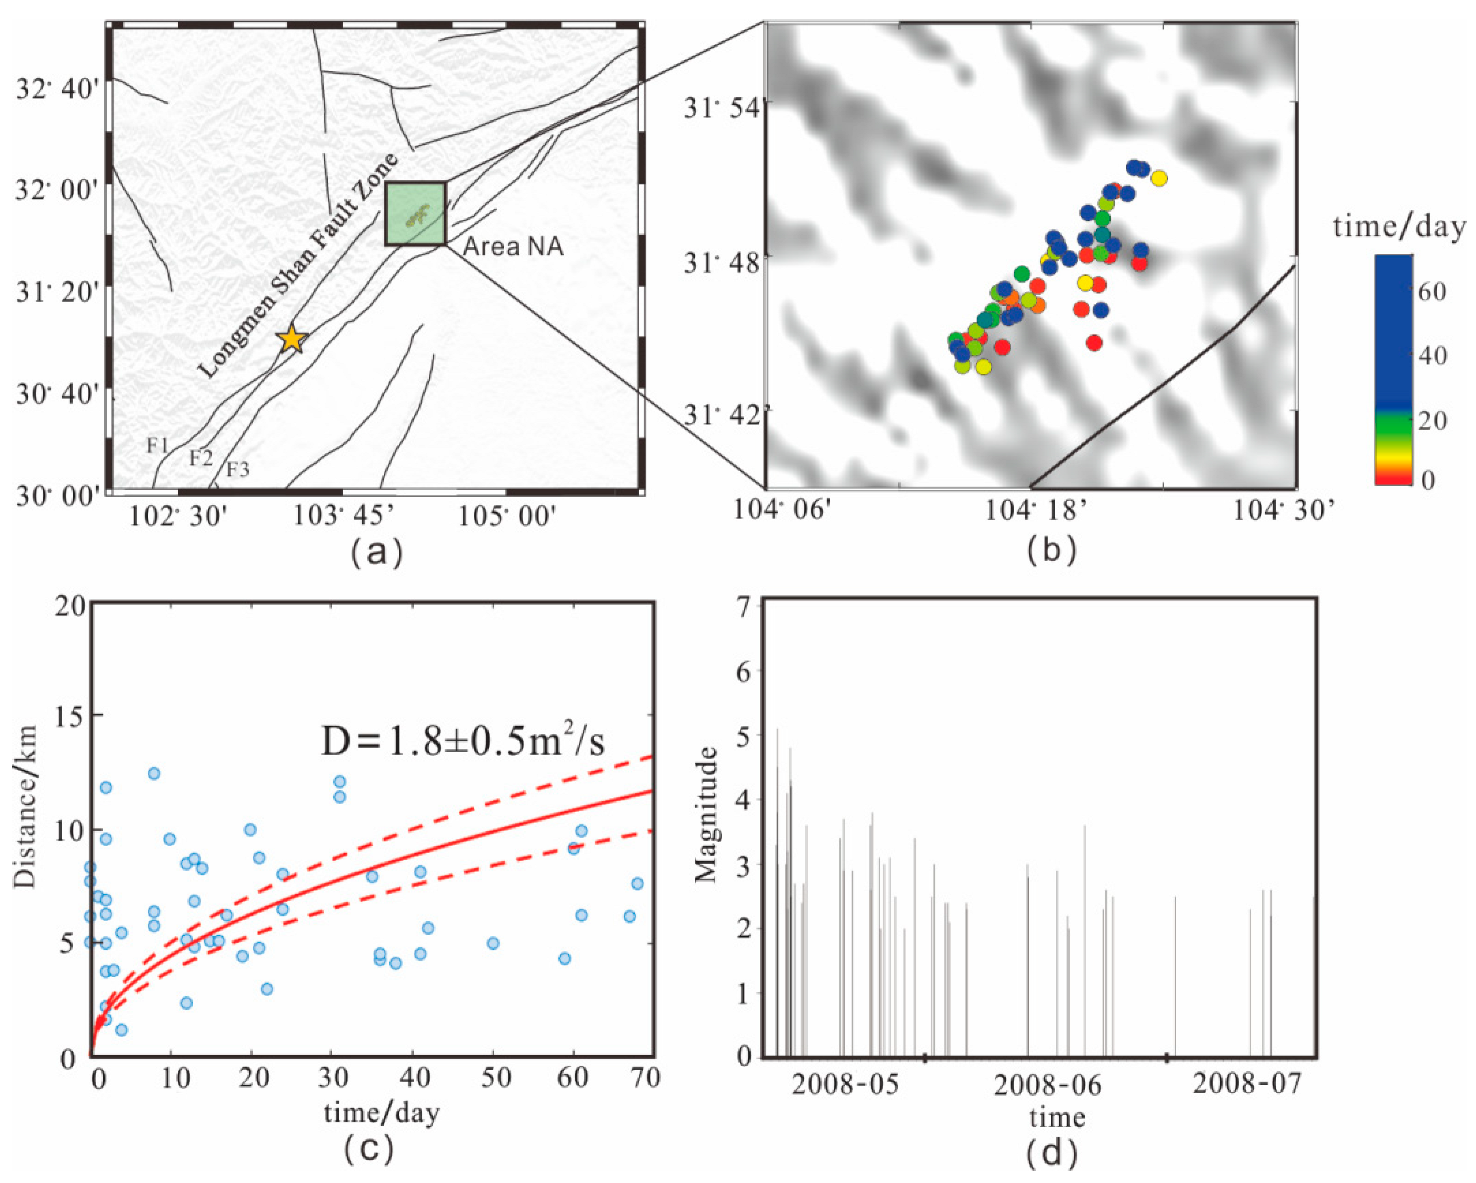
Liu et al. [1] analyzed the spatiotemporal distribution of aftershocks for the areas with the similar focal mechanisms and concentrated hypocenters and evaluated the hydraulic diffusivities for such areas along the Longmenshan fault zone. An area NA is located in the north of the Longmenshan fault zone (Figure 2a). Considering the aftershocks triggered by pore pressure diffusion may have multiple stages [1], the aftershocks within 70 days in the area NA are analyzed (Figure 2b). The spatiotemporal distribution of the aftershocks in the NA area is plotted on the r–t plot (Figure 2c) and the M–t plot (Figure 2d). The aftershocks in the area NA (Figure 2a) are more in line with an envelope shape in r–t space (Figure 2c) than other areas and suggest that the aftershocks in the area NA were mainly triggered by pore pressure diffusion. The hydraulic diffusivity D was estimated roughly to be 1.8 m2/s from the envelope line, with a corresponding permeability of k = 3.7 × 10⁻¹⁵ m2 [14]. The estimated value is reasonable compared to the seismogenic fault rock permeability [33]. Therefore, we select the area NA as the study area here and establish a three-dimensional hydraulic–mechanical coupling model based on the previous work.
3. Method
The fault rock was treated as an equivalent porous medium in the hydraulic–mechanical coupling model. The migration of fluid in a porous medium obeys Darcy’s law [34], and the rock stresses obey the Terzaghi effective stress principle [35]. The equations for calculating pore pressure and stress changes are briefly described below.
3.1. The Mathematical Model
Based on Darcy’s law and mass conservation, the fluid flow in the fault and rock matrix can be expressed by [3]:
in which is the porosity, is the fluid density, kg/m3, is the saturation, is the permeability, m2, is the pore pressure, Pa, and is the source term, m3/s.
Assuming that the rock is an isotropic elastic medium in the fault, the stress state influenced by the fluid can be represented by the Terzaghi effective stress principle:
where is the effective stress, Pa, is the total stress, Pa, and is the Biot coefficient.
Fault reactivation occurs when the difference between the maximum and minimum principal stresses is sufficiently large [36]:
where and are the maximum and minimum principal stresses, respectively, and are the maximum and minimum effective stresses, respectively, is static friction coefficient of the rock, and is the limiting stress difference. When the stress ratio exceeds , fault reactivation will occur. The mathematical model was solved with the finite difference method by using the software FLAC3D [37]. Compared to the finite element method, the finite difference method is computationally efficient for both meshing and solving the numerical model.
3.2. The Numerical Model
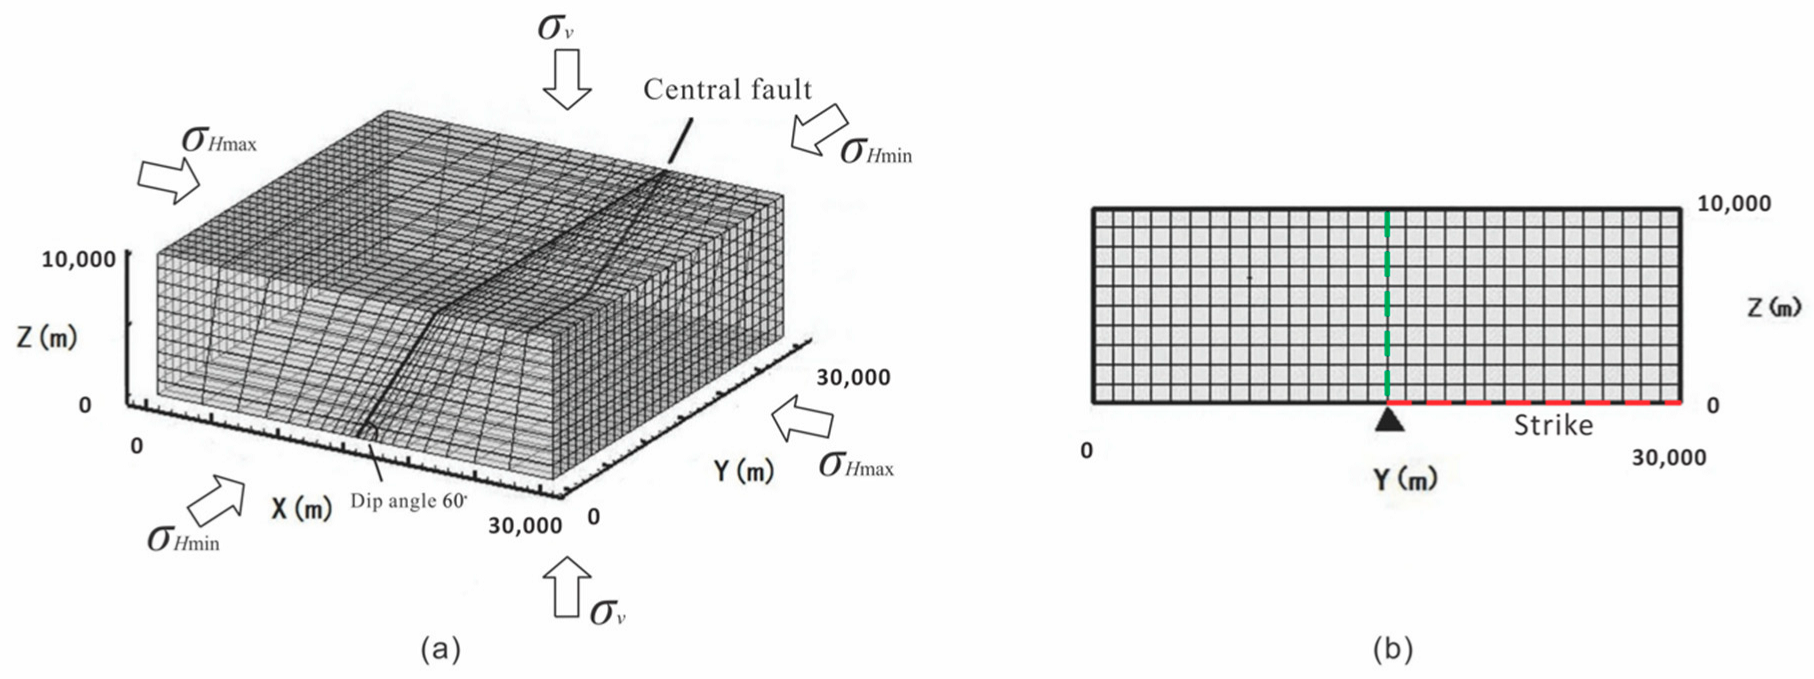
According to the location of the area NA and its fault structure [28,38], we established a 30 km × 30 km × 10 km geological model (Figure 3a). The model includes a fault with a dip of approximately 60° and a thickness of approximately 100 m, corresponding to the high-angle reverse fault of Longmenshan fault zone [25]. Considering that nearly 90% of the aftershocks are distributed shallower than 10 km depth in the area NA, it is assumed that the middle point of the fault in the Y-direction at 10 km depth is the fluid intrusion point (Figure 3b). We should note that the location of the “intrusion point” is chosen based on the mechanism of fluid-induced aftershocks (Liu et al., 2014) and the temporal–spatial distribution of aftershocks in the area NA. From the point of view of the triggering mechanism, it is assumed that there were many areas with trapped fluid along the Longmenshan fault zone before the Wenchuan earthquake, and when the main shock occurred, the changed crustal stress causes the trapped fluid in such zones to diffuse upward. Accordingly, the main shock provides the geomechanical condition of the first occurrence of aftershocks, whereas the zone of the trapped fluid, i.e., the existence of fluid, determines the location of the “intrusion point” of the area. For the studied area NA, considering the seep characteristic of deep fluid, we infer that the “intrusion point” is the middle point in the Y-direction at 10 km depth. We should note that due to the heterogeneity of the subsurface rocks, the inferred “intrusion point” may not be rigorously in the bottom middle of the area, whereas it is a proper one, regarding the above mechanism and the limited data about the geological aspect of this area. Thus, the model includes a three-dimensional rock matrix (impermeable) and fault (permeable). From the point of view of engineering geology, the rock matrix and large fractures (fault) constitute the rock mass. Properties of the rock matrix and fault for the model are presented in Table 1 [33,36].
3.3. Initial and Boundary Conditions
As Longmenshan fault zone belongs to a reverse fault, which is the result of horizontal compression, the maximum principal stress is in a direction perpendicular to the fault strike in the model. Stress measurements at some places along the Longmenshan fault zone prior to the Wenchuan earthquake show that the horizontal stress () was greater than the vertical stress () and that [39]. We set the initial stress conditions for the model based on the measured stresses and the stress characteristics for reverse faulting and assume hydrostatic pressure for the fluid. The stress and hydrostatic pressure increase linearly with depth.
The maximum principal stress is perpendicular to the fault strike in the horizontal plane, and it is also the maximum horizontal stress , MPa, which can be expressed by [39]:
The intermediate principal stress is in the strike direction of the fault, i.e., the minimum horizontal stress , MPa, can be expressed by the following [39]:
The minimum principal stress is vertical stress , MPa, which can be expressed by [39]:
and the pore pressure, MPa, is assumed as hydrostatic initially [3]:
where is the depth, m, is the rock density, kg/m3 and is the gravitational acceleration of 10 m/s2.
Considering that stress accumulates relatively slowly compared to stress changes due to pore pressure diffusion, it is assumed that the stress changes caused by tectonic activity were unchanged during the study period. Therefore, the stress boundary conditions are consistent with the initial conditions. The stresses along boundaries perpendicular to the fault were represented by Equation (5), the stresses along boundaries parallel to the fault were represented by Equation (6), and the stresses at the upper and lower boundaries were 0 MPa and 260 MPa, respectively.
Determining the source term of deep fluid and pore pressure in the fault is difficult in the study of fluid dynamics in seismic processes. Although some scholars have studied fluid migration and pore pressure in the Longmenshan fault zone [24], there is little knowledge of the physical parameters of fluids in the fault zone during the Wenchuan earthquake. For the fluid diffusion model in Equation (2), the source term should be specified, whereas, to the best of our knowledge, it is hard to measure at the depth of 10 km. The source term, Q, was 0.15 m3/s for the Matsushiro earthquake swarm [40], but the magnitude of Wenchuan earthquake was much higher than those of the Matsushiro earthquakes. Hence, the source term is assumed as 1.5 m3/s in our model.
4. Results
The intrusion of the fluid increases the pore pressure in the fault plane, which reduces the effective stress in a rock and causes failure when it is sufficiently large. Here, we first calculate the increased pore pressure in the fault plane within 70 days. Then the reduced effective stress due to the pore pressure diffusion is analyzed. Last, we estimate the fault reactivation area based on the calculated effective stress state.
4.1. Pore Pressure Increases Caused by the Fluid Intrusion
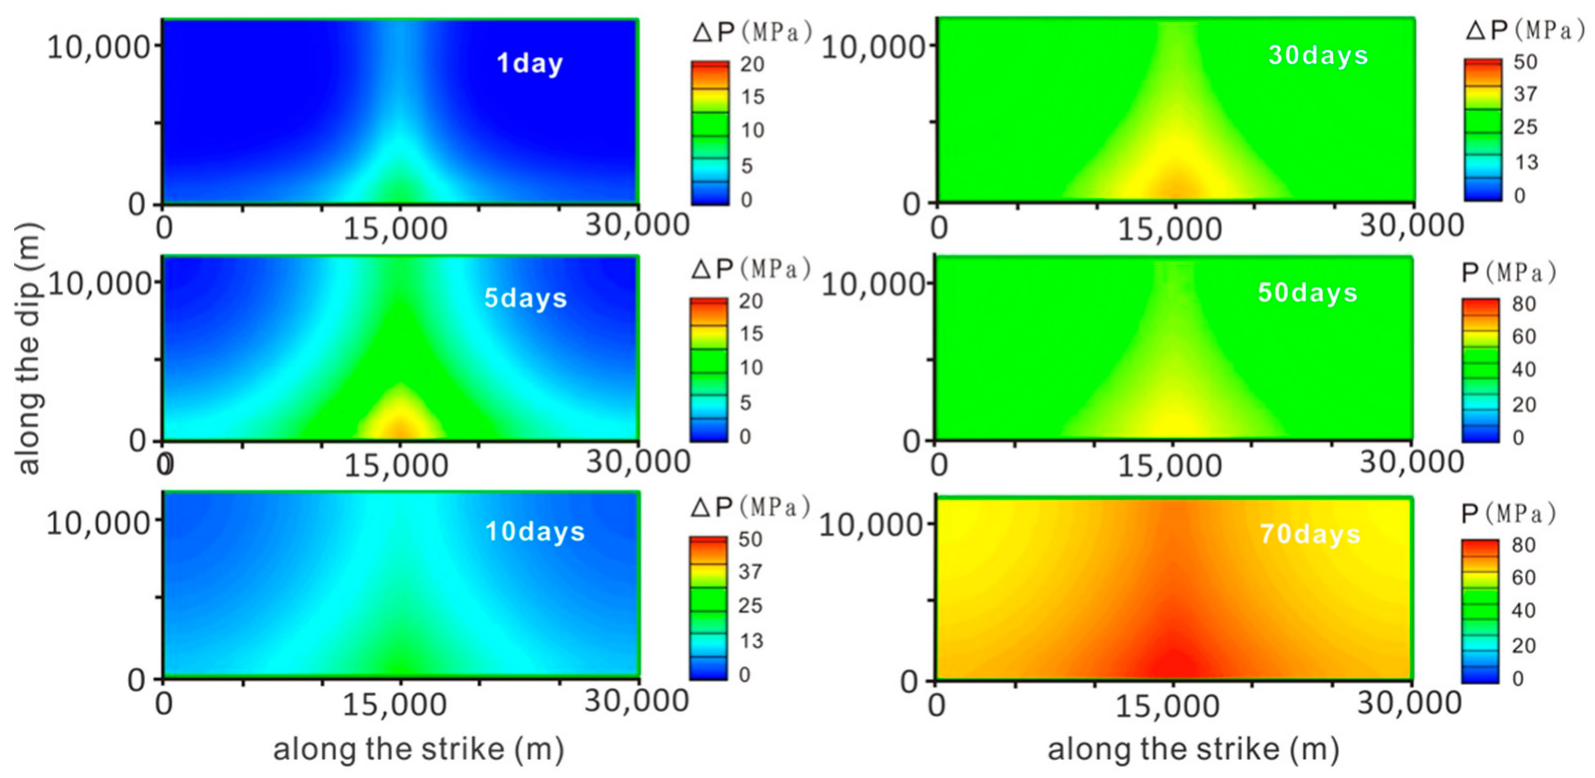
The fluid flow Equation (1) is solved numerically for investigating the characteristics of pore pressure diffusion within the fault. The gradual increase in pore pressure in the fault plane due to fluid intrusion is shown in Figure 4. The area of elevated pore pressure expands gradually along the fault dip and strike directions. The pore pressure in the fault plane increases up to 80 MPa during the fluid intrusion.
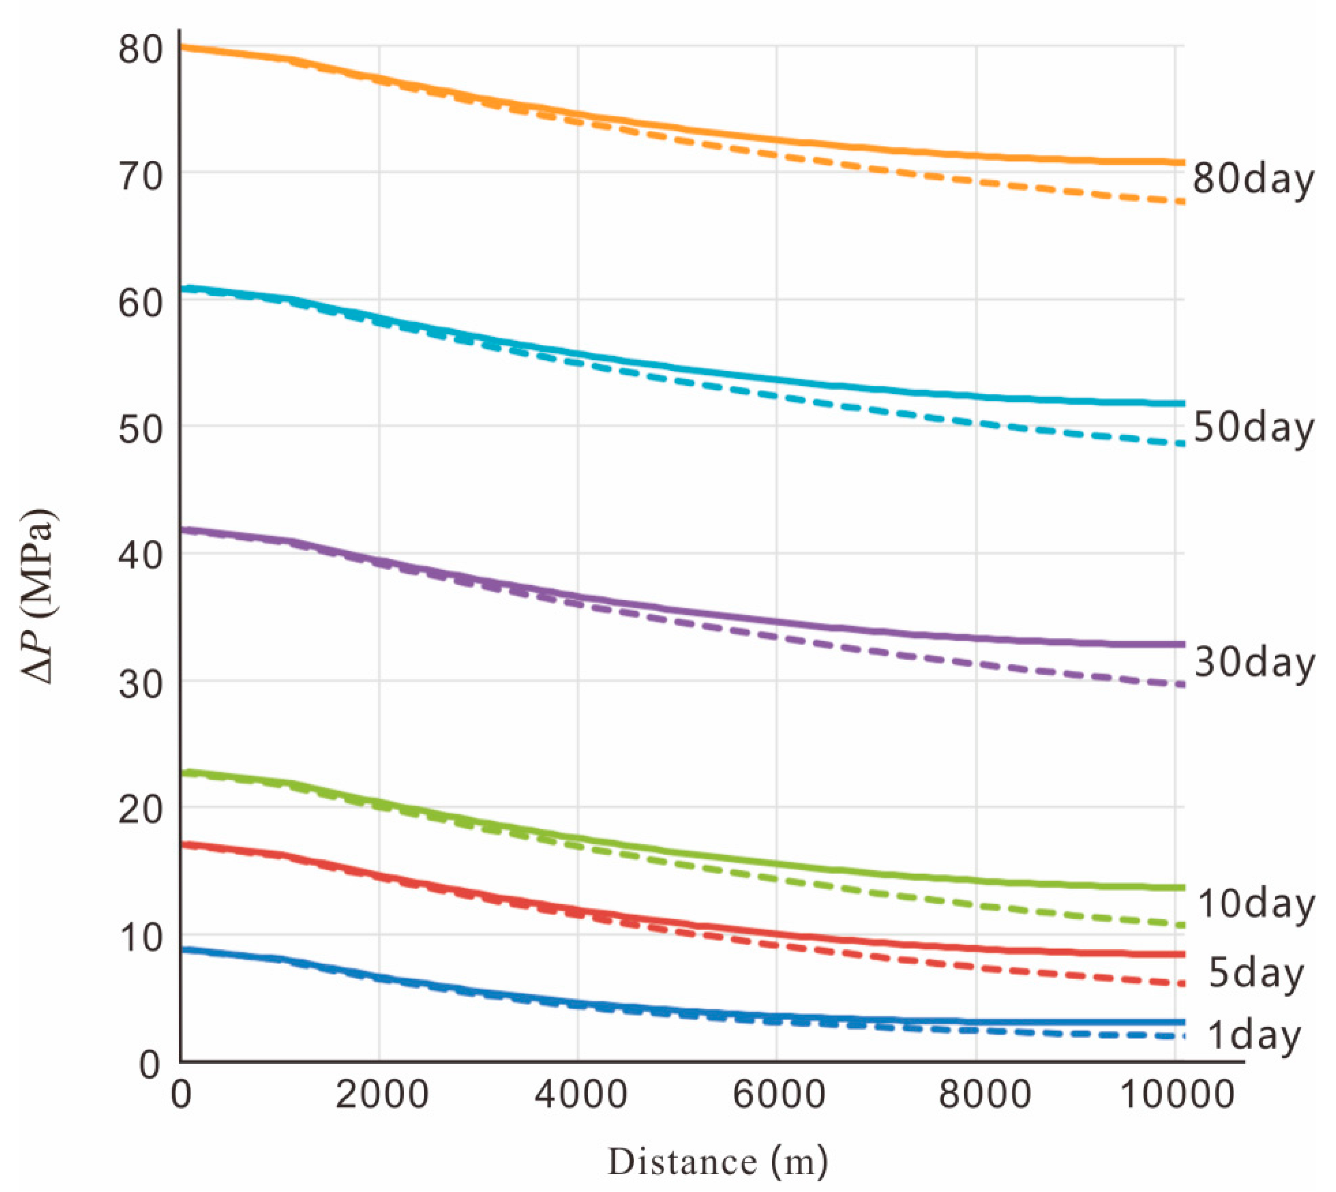
The increases in pore pressures ΔP along the strike (the red dashed line in Figure 3b) and dip (the green dashed line in Figure 3b) differ from each other (Figure 5). It shows that the increase in pore pressure along the dip is greater than along the strike, and the difference increases with distance from the intrusion point and over time, reaching a maximum of 3.18 MPa at 70 days. ΔP decays from the intrusion point over 70 days with an averaged decay gradient of 0.8 MPa/km and 1.1 MPa/km along the dip and strike direction, respectively. This suggests that the range of the increased pore pressure along the dip is bigger than along the strike regarding the fluid intrusion point in this model. According to the Terzaghi effective stress principle, the difference in the increase in pore pressure in the two directions causes stress changes correspondingly. Therefore, it is necessary to further calculate the crustal stress changes caused by the fluid intrusion.
4.2. Changes in Maximum Horizontal Stress and Vertical Stress Caused by Fluid Intrusion
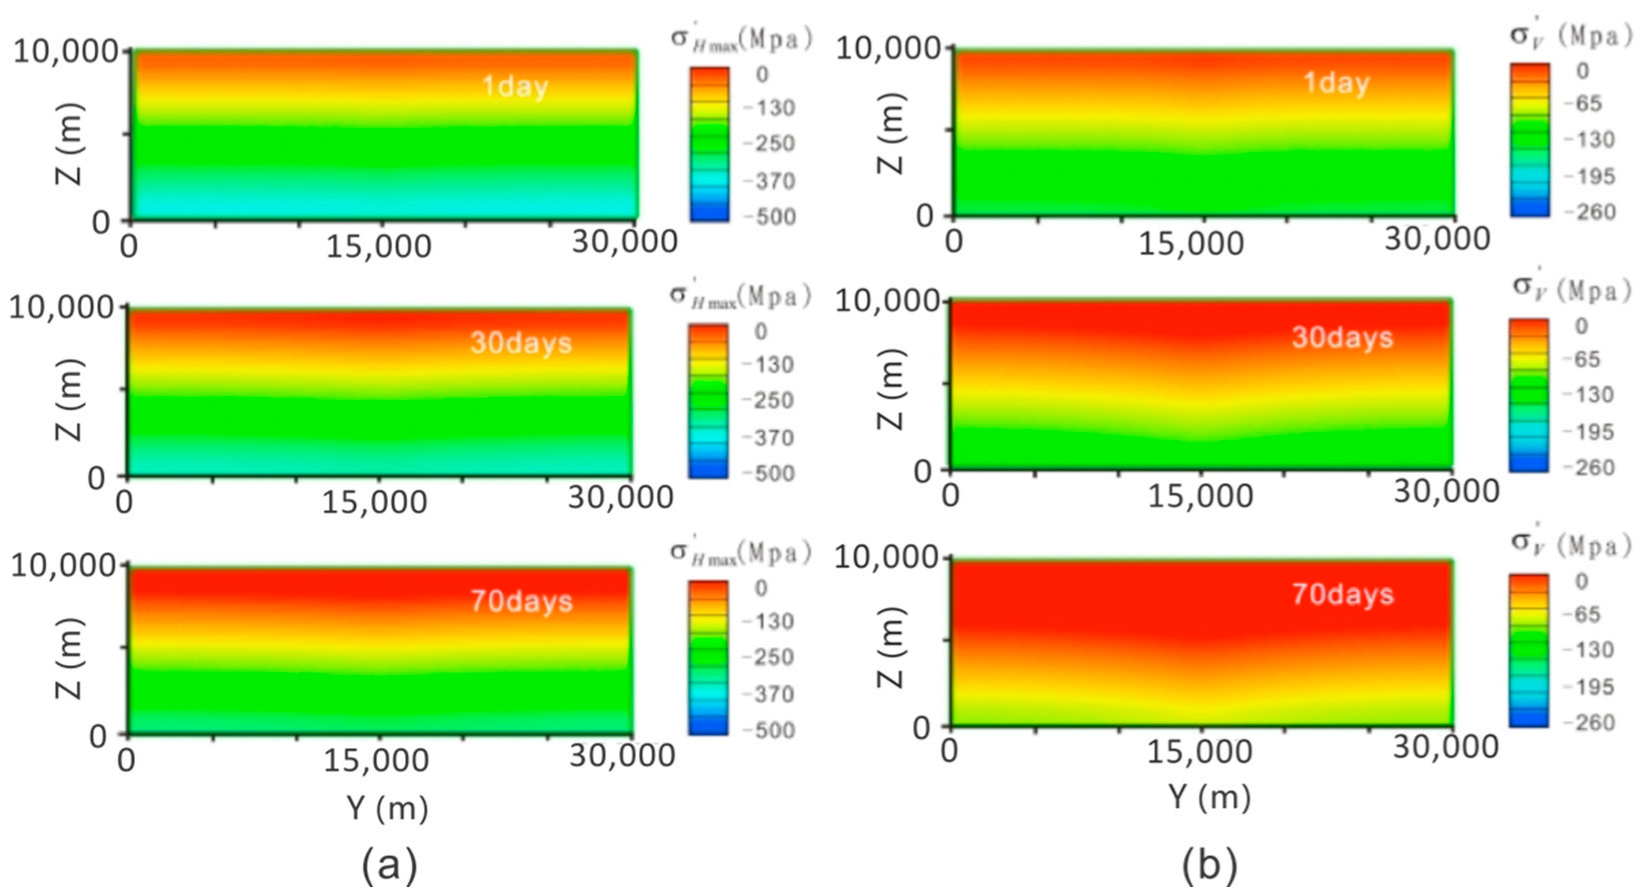
The reduction of the effective stress caused by the increase in pore pressure along the fault zone is one of the main mechanisms to explain earthquake triggering [3]. The failure of rock is related to the difference between the maximum and minimum principal stresses, as shown in Equation (4) [41]. For a reverse fault, the maximum and the minimum principal stresses correspond to the maximum horizontal stress and the vertical stress (Figure 3a), respectively. Therefore, we calculated the effective stress in the X- and Z-directions, and , considering the increased pore pressure (ΔP) using Equation (3). The effective stresses in the X- and Z-directions during fluid intrusion are shown in Figure 6a,b, respectively. It shows that the effective stress gradually decreases over time in both directions.
4.3. Fault Reactivation Caused by Fluid Intrusion
Fault reactivation occurs after rock failure, and it is then followed by earthquakes [40,41]. Calculating the fault reactivation area caused by fluid intrusion is helpful in analyzing the spatiotemporal distribution of aftershocks triggered by pore pressure diffusion. Based on the effective stresses calculated above, we can estimate the fault reactivation area using Equation (4).
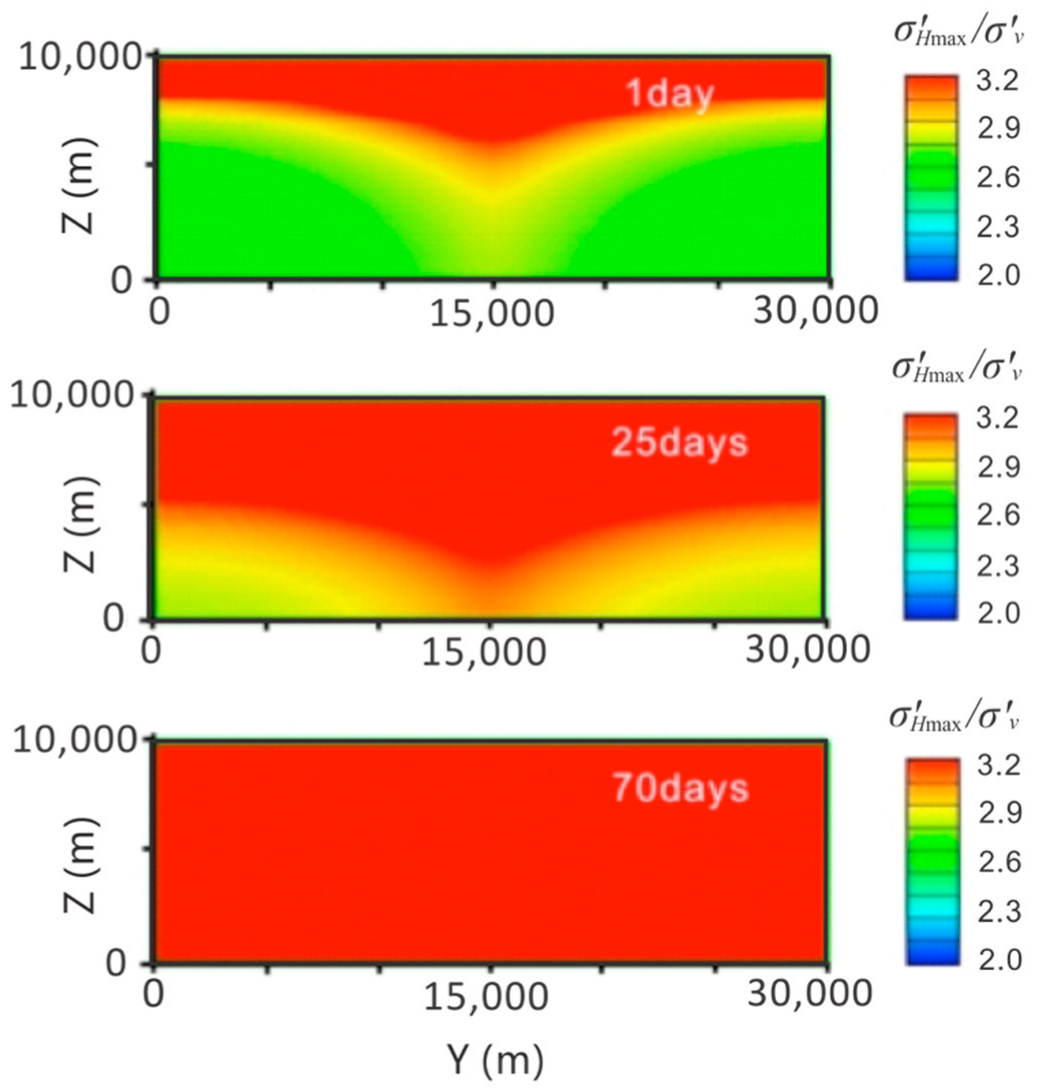
Fault reactivation will occur when the ratio of the effective stresses in the X- and Z-directions exceed the limiting stress difference shown in Equation (4), which is influenced by the static friction coefficient . For the Longmenshan fault zone, is 3.13 when is assumed to be 0.6 [39]. The ratio of the effective stress in the X- and Z-directions at 10 days, 25 days, and 70 days are shown in Figure 7, where the red area indicates where the fault may reactivate. It suggests that fault reactivation area expands gradually over time in both the X- and Z-directions.
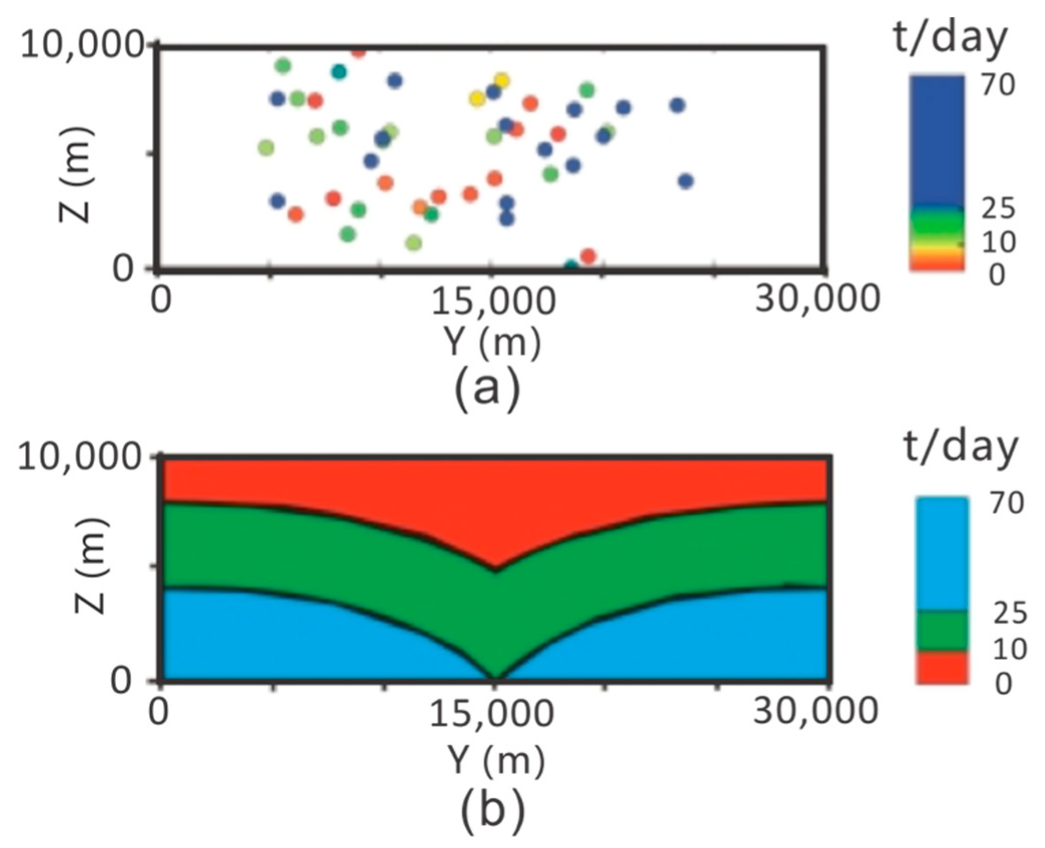
The locations of aftershocks in the area NA for 70 days are plotted in Figure 8a. The spatiotemporal distribution of aftershocks in the area NA shows that most aftershocks locate in the central area initially (red circles) and they expand gradually with time to some extent (blue circles). We should note that computer-aided algorithms would be helpful for a comprehensive analysis of such area/volume in further study. Furthermore, based on the fault reactivation area calculated above (the red area in Figure 7), we delineate the contour of fault reactivation area calculated numerically (Figure 8b). Such comparison of Figure 8a,b provides insights into the correlation between the spatiotemporal distribution of aftershocks and the fault reactivation area.
5. Discussion
5.1. Aftershock Triggering Mechanisms and Pore Pressure Diffusion
Based on the results of this study, we suggest that the aftershocks in the area NA are mainly triggered by pore pressure diffusion along the fault. The Longmenshan fault has been very tectonically active since the Cenozoic. It has been under compression due to the collision between the Indian and Eurasian Plates, and the maximum horizontal stress has been increasing until the Wenchuan earthquake, which led to a release of stress. At the same time, there are some studies indicating that deep fluids were likely to exist in the Longmenshan fault zone prior to and during the Wenchuan earthquake. Stress changes generated by the mainshock may lead to the diffusion of fluid trapped along the fault, then the increased pore pressure caused fault reactivation and triggered aftershocks where the rock stress was at the critical state.
Some aftershocks in the r–t plot (Figure 2c) did not follow the envelope line, particularly early in the aftershock sequence. Stress transfer may be the main triggering mechanism of these aftershocks. These aftershocks display burst-like characteristics in r–t space [29], but they do not gradually migrate away from the initiation point over time. Although the stress transfer caused by the mainshock may have triggered some aftershocks in the initial stage, pore pressure diffusion may predominate the aftershocks in the area NA afterwards.
Focal mechanism tomography (FMT) is one of the main methods to estimate the excess pore pressure in a source region. Excess pore pressures were in the range of 0~60 MPa for the 2009 L’Aquila earthquake in Italy [11]. In this study, the estimated range of the increase in pore pressure caused by fluid intrusion is 0~80 MPa, which is comparable with the results of the L’Aquila earthquake. In addition, the larger increase in pore pressure along the dip than along the strike is similar to the results of the Matsushiro earthquake [40]. However, in addition to the mechanical aspect, the chemical effect of fluid should also be considered in future research, which may contribute to change the composition of the fluid and rock during fluid migration and hydraulic–mechanical interactions [42].
5.2. Spatiotemporal Distribution of Aftershocks and Pore Pressure Diffusion
In the hydraulic–mechanical coupling model, the evolution of the fault reactivation area calculated is correlated with the spatiotemporal distribution of aftershocks in the area NA. Several investigations of the 1965–1967 Matsushiro earthquake swarm in Japan have also suggested that the migration of deep fluids may have strongly influenced swarm activity [40]. The spatiotemporal distribution of the Matsushiro earthquake swarm is also comparable with the evolution trend of the fault reactivation area in this study [43]. Here, we studied the area NA for analyzing the correlation between the pore pressure diffusion and the aftershocks distribution. Nevertheless, it does not mean that only the aftershocks in the area NA might be related to deep fluid intrusion along the Longmenshan fault zone. This is due to the fact that the geological structure and the focal mechanism of aftershocks are similar in the area NA [29], which indicates that the seismogenic process of the area tends to be uniform. Therefore, the influences of heterogeneous structure and complex stress state along the fault zone on the spatiotemporal distribution of aftershocks have been minimized. However, for analyzing the triggering mechanism of aftershocks and pore pressure diffusion process of fluid intrusion along the whole Longmenshan fault zone, several aspects require further study, as discussed in the following.
First, in the modeling process, we treated fluid as the main factor affecting aftershock activity. However, there may be other important factors, such as the mechanical effect of fault slip, the interaction between aftershocks, or the effect of seismic waves. Additionally, the trapped fluid intrusion area is assumed as a point in the model due to the fact that the dimension of the trapped fluid area is very small compared to the modeling area NA, e.g., [16,44]. However, in the case of the dimension of the modeling area decreasing, the source term might be depicted as a line or other shapes constrained by the geophysical data, which should be explored in the further study. Additionally, the location of the intrusion point and the flow rate of the source term is assumed as constant in this study. We should note that these critical properties may contain uncertainties due to the limitation in the insufficient observation data, which should be further explored. Second, the heterogeneity and anisotropy of rocks and a non-uniform stress distribution along the fault may also affect the spatiotemporal distribution of aftershocks. The permeability of fault rocks affects the fluid migration, which may influence the spatiotemporal distribution of aftershocks [13,45]. Thus, a model with heterogeneous permeability based on upscaling permeability for fractured rocks should be explored in a future study [46]. Furthermore, the sensitivity analysis should be further investigated for such key parameters listed in Table 1, which may have a significant impact on the coupled hydraulic–mechanical model. Third, a different initial stress state in the model may influence fault reactivation during fluid migration. Advanced methods for calculating crustal stress, e.g., [47], could help in constraining our hydraulic–mechanical model and thus may yield a better match between the real data and model results. Fourth, the model solved the pore-pressure diffusion equation numerically and fault reactivation area analytically, and we noted that recent contributions, e.g., [16,48], built models with coupled fluid–mechanical equations for analyzing the relationship between aftershock and fluid diffusion. Calculation of deformations and displacements should be further studied.
Therefore, it is necessary to further consider the heterogeneity and anisotropy of rocks, the properties of the fluid source, and the related dynamics during aftershocks. Based on the results of scientific drilling in the Wenchuan fault, further research is needed to combine seismology and geochemistry to obtain comprehensive poroelastic parameters and understand their changes along the fault during the aftershock sequence.
5.3. Numerical Aspects of the Model
Considering the Longmenshan fault zone is very large horizontally and the distance between most aftershocks and their initial point (which is located at the bottom-center of the model) is less than 10 km in the studied area (Figure 2c), a rectangle fault plane 30 km × 11.5 km (dip angle 60°, 11.5 = 10/sin(π/3)) is built for eliminating the boundary effect in the horizontal and vertical directions.
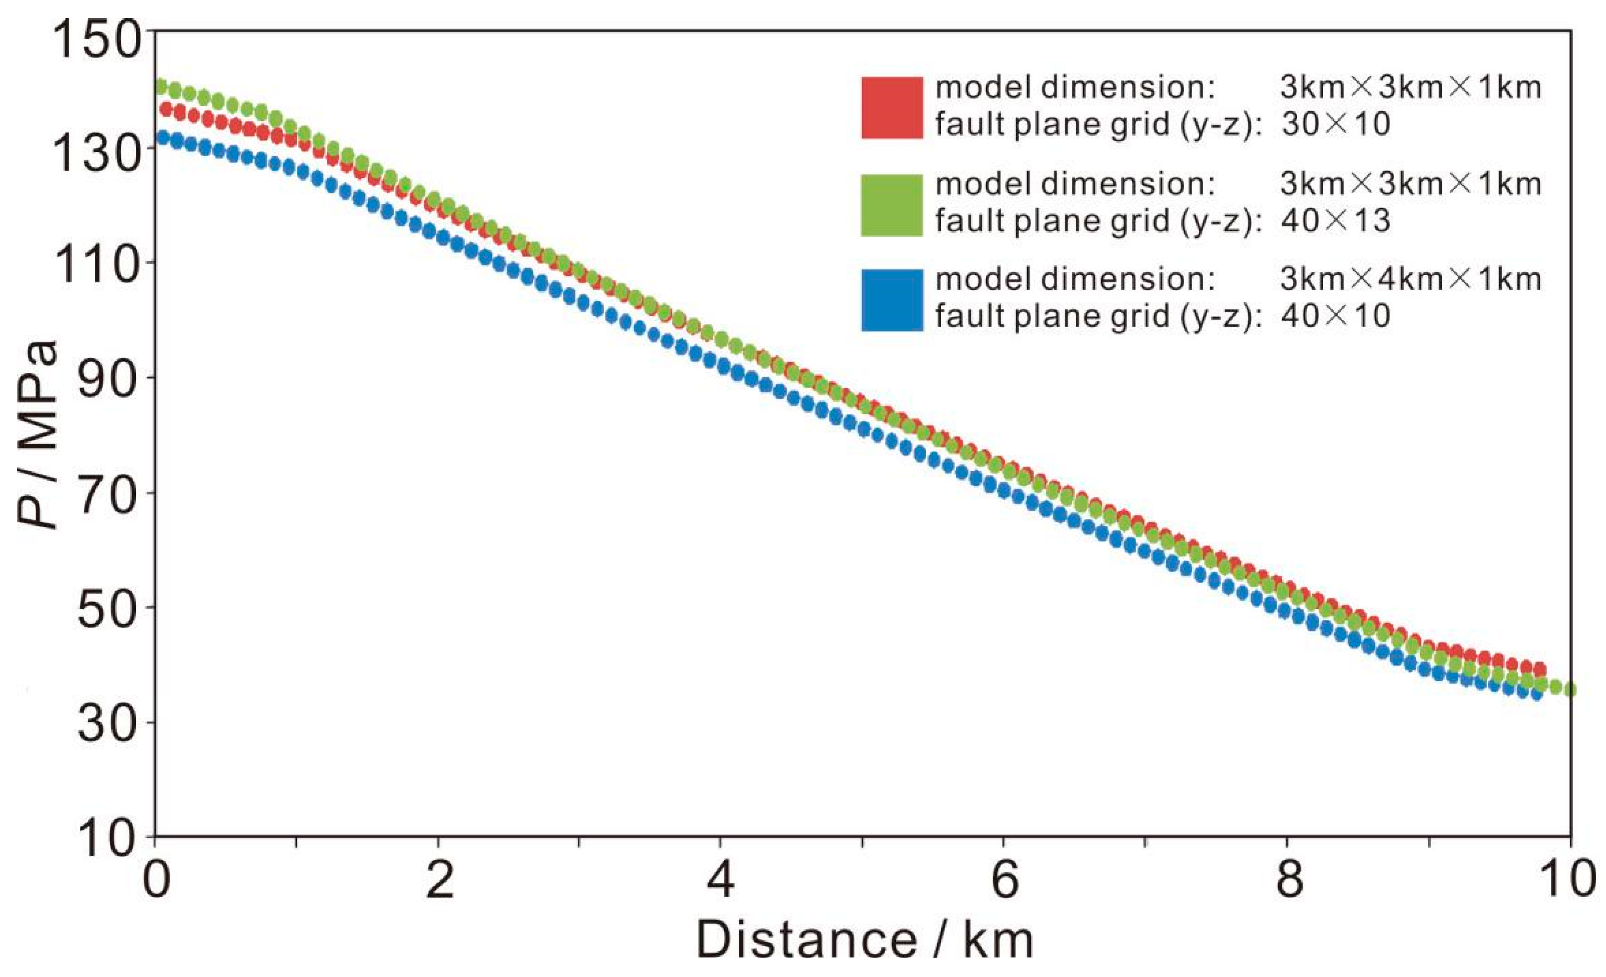
The Wenchuan aftershocks were distributed along the Longmenshan fault zone (Figure 1). Especially, the model dimension of the studied area NA is 30 km × 30 km × 10 km, which is still very large and is not feasible for computation when the meshes are very fine. Considering the assumed homogeneous hydraulic properties within the fault plane, which yields more stable results than those of the heterogeneous model, a 1 km × 1 km (30 × 10) grid is assumed. The calculated results in Figure 4 and Figure 5 demonstrate that the change of pore pressure reached the top boundary (i.e., the Earth’s surface), which may affect the distribution of pore pressure. In addition, for demonstrating the stability and reliability of the numerical models, sensitivity analyses of mesh and model size have been conducted (Figure 9). It is shown that either refining the grid block of 0.75 km × 0.77 km (40 × 13) for the fault plane (green color) or enlarging the model dimension of 30 km × 40 km × 10 km (blue color), the calculated pore pressures at 30 days are very close regarding the numerical model used in the previous study (red color). The relative errors are roughly evaluated, and are below 6%.
6. Conclusions
Based on previous studies of the Wenchuan earthquake and the spatiotemporal distribution of aftershocks with respect to pore pressure diffusion of deep fluids, we established a three-dimensional hydraulic–mechanical coupling model to investigate pore pressure diffusion and its mechanical effects in the fault plane using FLAC3D. During fluid intrusion into the fault plane, the pore pressures increase significantly by up to 80 MPa within 70 days in the study area NA. The increase in pore pressure, ΔP, along the fault dip is greater than that along fault strike on the fault plane. During 70 days, ΔP decays from the intrusion point with an averaged gradient of 0.8 MPa/km and 1.1 MPa/km along the dip and strike direction, respectively. The increase in pore pressure on the fault plane reduces the maximum and minimum effective stresses and thus can lead to fault reactivation. The evolution of the fault reactivation area calculated in the model is compared with the spatiotemporal distribution of aftershocks, taking into account the assumed input parameters and measurements of other studies. Our results provide insights for understanding the triggering mechanisms of the Wenchuan aftershocks.
Author Contributions
Conceptualization, Y.L.; methodology, T.C.; investigation, G.Z.; data curation, T.C.; writing—original draft preparation, T.C.; writing—review and editing, Y.L.; supervision, Y.L.; project administration, Y.L.; funding acquisition, Y.L. All authors have read and agreed to the published version of the manuscript.
Funding
This work was funded by the “Wenchuan Earthquake Fault Scientific Drilling” of the National Science and Technology Planning Project, grant number WFSD-10, Natural Science Foundation of Shandong Province, China (ZR2019BD028), Scientific Research Foundation of Shandong University of Science and Technology for Recruited Talents (2019RCJJ004).
Data Availability Statement
The data used to numerical simulations of this study are available from the corresponding author upon.
Acknowledgments
We would like to thank the editor and two anonymous reviewers for their efforts and constructive comments. The data for the model is available upon request from the first author. We thank Duoxing Yang, Xiaolong Sun, and Bin Zhang for fruitful discussions.
Conflicts of Interest
The authors declare no conflict of interest.
References
- Liu, Y.; Chen, T.; Xie, F.; Du, F.; Yang, D.; Zhang, L.; Xu, L. Analysis of fluid induced aftershocks following the 2008 Wenchuan Ms 8.0 earthquake. Tectonophysics 2014, 619, 149–158. [Google Scholar] [CrossRef]
- Liu, Y.W.; Shi, J. Information characteristics of ground fluid precursor on continental strong earthquakes. Acta Seismol. Sin. 2000, 22, 102–107. [Google Scholar] [CrossRef]
- Wang, C.Y.; Manga, M. Earthquakes and Water; Springer: New York, NY, USA, 2009; pp. 1–38. [Google Scholar]
- Zhang, Q.; Zeng, J.; Lou, K.; Li, S.; Yang, X.F.; Wu, Z.F.; Gao, X.Q. Seismic response of bacterial community structures at No.10 Spring in Urumqi. Acta Seismol. Sin. 2012, 34, 706–715. [Google Scholar]
- Wang, B.; Liu, Y.; Sun, X.; Ma, Y.; Zhang, L.; Ren, H.; Fang, Z. Hydrogeological and geochemical observations for earthquake prediction research in China: A brief overview. Pure Appl. Geophys. 2018, 175, 2541–2555. [Google Scholar] [CrossRef]
- Miller, S.A.; Collettini, C.; Chiaraluce, L.; Cocco, M.; Barchi, M.; Kaus, B.J. Aftershocks driven by a high-pressure CO2 source at depth. Nature 2004, 427, 724. [Google Scholar] [CrossRef]
- Parotidis, M.; Shapiro, S.A.; Rothert, E. Evidence for triggering of the Vogtland swarms 2000 by pore pressure diffusion. J. Geophys. Res. Solid Earth 2005, 110, B05S10. [Google Scholar] [CrossRef]
- Zhao, D.; Kanamori, H.; Negishi, H.; Wiens, D. Tomography of the source area of the 1995 Kobe earthquake: Evidence for fluids at the hypocenter? Science 1996, 274, 1891–1894. [Google Scholar] [CrossRef] [Green Version]
- Kayal, J.R.; Zhao, D.; Mishra, O.P.; De, R.; Singh, O.P. The 2001 Bhuj earthquake: Tomographic evidence for fluids at the hypocenter and its implications for rupture nucleation. Geophys. Res. Lett. 2002, 29, 2152. [Google Scholar] [CrossRef]
- Ichihara, H.; Mogi, T.; Hase, H.; Watanabe, T.; Yamaya, Y. Resistivity and density modelling in the 1938 Kutcharo earthquake source area along a large caldera boundary. Earth Planets Space 2009, 61, 345–356. [Google Scholar] [CrossRef] [Green Version]
- Terakawa, T.; Zoporowski, A.; Galvan, B.; Miller, S.A. High-pressure fluid at hypocentral depths in the L′Aquila region inferred from earthquake focal mechanisms. Geology 2010, 38, 995–998. [Google Scholar] [CrossRef]
- Nur, A.; Booker, J.R. Aftershocks caused by pore fluid flow? Science 1972, 175, 885–887. [Google Scholar] [CrossRef] [PubMed]
- Bosl, W.J.; Nur, A. Aftershocks and pore fluid diffusion following the 1992 Landers earthquake. J. Geophys. Res. 2002, 107, 2366. [Google Scholar] [CrossRef]
- Shapiro, S.A.; Patzig, R.; Rothert, E.; Rindschwentner, J. Triggering of seismicity by pore-pressure perturbations: Permeability-related signatures of the phenomenon. In Thermo-Hydro-Mechanical Coupling in Fractured Rock; Kümpel, H.J., Ed.; Birkhäuser: Basel, Switzerland, 2003. [Google Scholar]
- Waldhauser, F.; Schaff, D.P.; Diehl, T.; Engdahl, E.R. Splay faults imaged by fluid-driven aftershocks of the 2004 Mw 9.2 Sumatra-Andaman earthquake. Geology 2012, 40, 243–246. [Google Scholar] [CrossRef]
- Heinze, T.; Hamidi, S.; Galvan, B.; Miller, S.A. Numerical simulation of the 2008 West-Bohemian earthquake swarm. Tectonophysics 2017, 694, 436–443. [Google Scholar] [CrossRef]
- Ge, S.; Liu, M.; Lu, N.; Godt, J.W.; Luo, G. Did the Zipingpu reservoir trigger the 2008 Wenchuan earthquake? Geophys. Res. Lett. 2009, 36, L20315. [Google Scholar] [CrossRef]
- Lei, X.L.; Ma, S.L.; Wen, X.Z.; Su, J.R.; Du, F. Intergated analysis of stress and regional seismicity by surface loading-a case study of Zipingpu reservoir. Seismol. Geol. 2008, 30, 1046–1064. [Google Scholar]
- Sun, Y.J.; Zhang, H.; Dong, S.W.; Zheng, L.; Zhang, B.; Cheng, H.H.; Shi, Y.L. Study on effect of the Zipingpu reservoir on the occurrence of the 2008 Wenchuan earthquake based on a 3D-poroelastic model. Chin. J. Geophys. 2012, 55, 2353–2361. (In Chinese) [Google Scholar]
- Chen, Y. Did the reservoir impoundment trigger the Wenchuan earthquake? Sci. China Earth Sci. 2009, 52, 431–433. [Google Scholar] [CrossRef]
- Du, J.G. The Petrophysical Influenced by Deep Fluid and Its Seismic Geological Significance. Ph.D. Thesis, University of the Chinese Academy of Sciences, Guiyang, China, 2003. (In Chinese). [Google Scholar]
- Sibson, R.H. Rupturing in overpressured crust during compressional inversion-the case from NE Honshu, Japan. Tectonophysics 2009, 473, 404–416. [Google Scholar] [CrossRef]
- Du, L.T. The significance of mantle juice (ACOHNS) fluid. Geotecton. Metallog. 1989, 13, 91–99. [Google Scholar]
- Wang, G.Z.; Liu, S.G.; Xu, G.S.; Li, G.R. Characteristics of fluid inclusions in the central Longmenshan nappe. J. Chengdu Univ. Technol. 2002, 29, 394–398. (In Chinese) [Google Scholar]
- Xu, Z.Q.; Li, H.B.; Wu, Z.L. Wenchuan earthquake and scientific drilling. Acta Geol. Sin. 2008, 82, 1613–1622. (In Chinese) [Google Scholar]
- Lei, J.S.; Zhao, D.P.; Su, J.R.; Zhang, G.W.; Li, F. Fine seismic structure under the Longmenshan fault zone and the mechanism of the large Wenchuan earthquake. Chin. J. Geophys. 2009, 52, 339–345. (In Chinese) [Google Scholar] [CrossRef]
- Lin, X.; Dreger, D.; Ge, H.; Xu, P.; Wu, M.; Chiang, A.; Zhao, G.; Yuan, H. Spatial and temporal variations in the moment tensor solutions of the 2008 Wenchuan Earthquake aftershocks and their tectonic implications. Tectonics 2018, 37, 989–1005. [Google Scholar] [CrossRef]
- Tian, Q.J.; Diao, G.L.; Hao, P.; Feng, X.D.; Sun, J. Earthquake geology of the Wenchuan M8.0 mainshock and its aftershocks. Earthquake 2009, 29, 141–148. (In Chinese) [Google Scholar]
- Yukutake, Y.; Ito, H.; Honda, R.; Harada, M.; Tanada, T.; Yoshida, A. Fluid-induced swarm earthquake sequence revealed by precisely determined hypocenters and focal mechanisms in the 2009 activity at Hakone volcano, Japan. J. Geophys. Res. Solid Earth 2011, 116, B04308. [Google Scholar] [CrossRef]
- Liu, Y.W.; Xu, L.Q.; Yang, D.X. Pore pressure diffusion characteristics of Longtan reservoir-induced-earthquake. Chin. J. Geophys. 2011, 54, 1028–1037. (In Chinese) [Google Scholar]
- Chen, T.; Liu, Y.W.; Yang, D.X.; Zhang, L.; Fang, Z.; Xu, L.Q. The role of pore pressure in earthquake triggering and process of swarm earthquakes and aftershocks. Prog. Geophys. 2012, 27, 2407–2417. (In Chinese) [Google Scholar]
- Sun, X.; Yang, P.; Zhang, Z. A study of earthquakes induced by water injection in the Changning salt mine area, SW China. J. Asian Earth Sci. 2017, 136, 102–109. [Google Scholar] [CrossRef]
- Talwani, P.; Chen, L.; Gahalaut, K. Seismogenic permeability, ks. J. Geophys. Res. Solid Earth 2007, 112, B07309. [Google Scholar] [CrossRef]
- Carslaw, H.S.; Jaeger, J.C. Conduction of Heat in Solid; Oxford University Press: New York, NY, USA, 1959. [Google Scholar]
- Terzaghi, K. Erdbaumechanik auf Bodenphysikalischer Grundlage; Deuticke: Leipzig, Germany, 1925. [Google Scholar]
- Jaeger, J.C.; Cook, N.G.W. Fundamentals of Rock Mechanics; Methuen: London, UK, 1969. [Google Scholar]
- Itasca. FLAC3D Fast Lagrangian Analysis in Three Dimensions User’s Guide; Itasca Consulting Group: Minneapolis, MN, USA, 2009. [Google Scholar]
- Deng, Q.D.; Zhang, P.Z.; Rang, Y.K.; Yang, X.P.; Min, W.; Chen, L.Q. Active tectonics and earthquake activities in China. Earth Sci. Front. 2003, 10, 66–73. [Google Scholar]
- An, Q.M.; Ding, L.F.; Wang, H.Z.; Zhao, S.G. Research of property and actibity of Longmen Mountain fault zone. J. Geod. Geodyn. 2004, 24, 115–119. [Google Scholar]
- Cappa, F.; Rutqvist, J.; Yamamoto, K. Modeling crustal deformation and rupture processes related to upwelling of deep CO2-rich fluids during the 1965–1967 Matsushiro earthquake swarm in Japan. J. Geophys. Res. Solid Earth 2009, 114, B10304. [Google Scholar] [CrossRef] [Green Version]
- Zhou, Y.F.; Liu, Z.C.; Cao, L.; Zhang, S.L.; Cui, S.B. Mechanical model of tectonic stress on fault movement induced microseism incidents. Mod. Min. 2012, 4, 20–22. (In Chinese) [Google Scholar]
- Gratier, J.P.; Gueydan, F. Deformation in the presence of fluids and mineral reactions: Effect of fracturing and fluid-rocks interaction on seismic cycles. In The Dynamics of Fault Zones; Handy, M., Hirth, G., Rice, J., Hovius, N., Friedrich, A., Eds.; MIT Press: Cambridge, MA, USA, 2008; pp. 319–356. [Google Scholar]
- Hagiwara, T.; Iwata, T. Summary of the seismographic observation of Matsushiro swarm earthquakes. Bull. Earthq. Res. Inst. Univ. Tokyo 1968, 46, 485–515. [Google Scholar] [CrossRef]
- Hainzl, S.; Fischer, T.; Čermáková, H.; Bachura, M.; Vlček, J. Aftershocks triggered by fluid intrusion: Evidence for the aftershock sequence occurred 2014 in West Bohemia/Vogtland. J. Geophys. Res. Solid Earth 2016, 121, 2575–2590. [Google Scholar] [CrossRef] [Green Version]
- Shi, Z.; Wang, G. Evaluation of the permeability properties of the Xiaojiang Fault Zone using hot springs and water wells. Geophys. J. Int. 2017, 209, 1526–1533. [Google Scholar] [CrossRef]
- Chen, T.; Clauser, C.; Marquart, G.; Willbrand, K.; Hiller, T. Upscaling permeability for three-dimensional fractured porous rocks with the multiple boundary method. Hydrogeol. J. 2018, 26, 1903–1916. [Google Scholar] [CrossRef]
- Zhang, Y.; Zhang, J. Lithology-dependent minimum horizontal stress and in-situ stress estimate. Tectonophysics 2017, 703, 1–8. [Google Scholar] [CrossRef]
- Ucar, E.; Berre, I.; Keilegavlen, E. Three-dimensional numerical modeling of shear stimulation of fractured reservoirs. J. Geophys. Res. Solid Earth 2018, 123, 3891–3908. [Google Scholar] [CrossRef]
Figure 1.
Spatiotemporal distributions of aftershocks [1]. Reproduced with permission from Liu et al., Tectonophysics; published by Elsevier, 2014, with Number 5270230803519.
Figure 1.
Spatiotemporal distributions of aftershocks [1]. Reproduced with permission from Liu et al., Tectonophysics; published by Elsevier, 2014, with Number 5270230803519.

Figure 2.
(a) The area NA. The star denotes the location of the Wenchuan mainshock, the solid black lines denote faults, F1 denotes the back fault, F2 denotes the central fault, and F3 denotes the piedmont fault (Deng et al., 2003). (b) Spatiotemporal distribution of aftershocks in the area NA. The grey color represents the topography of the area. (c) The r–t plot for the area NA. The red lines are the envelope lines for different hydraulic diffusivities D and the blue circles denote aftershocks. (d) The M–t plot for the area NA.

Figure 3.
The model geometry and meshes used in the study. (a) A 3D view of the grid. (b) Plane view of the fault zone in the Y–Z plane. The triangle denotes the fluid intrusion point.
Figure 3.
The model geometry and meshes used in the study. (a) A 3D view of the grid. (b) Plane view of the fault zone in the Y–Z plane. The triangle denotes the fluid intrusion point.

Figure 4.
The distribution of increasing pore pressure at different times during the fluid intrusion.
Figure 4.
The distribution of increasing pore pressure at different times during the fluid intrusion.

Figure 5.
The increases of pore pressure along the dip (solid line) and strike (dashed line) from the intrusion point in the fault plane.
Figure 5.
The increases of pore pressure along the dip (solid line) and strike (dashed line) from the intrusion point in the fault plane.

Figure 6.
The distribution of effective stress (a) in the X-direction ; (b) in the Z-direction during the fluid intrusion.
Figure 6.
The distribution of effective stress (a) in the X-direction ; (b) in the Z-direction during the fluid intrusion.

Figure 7.
The distribution of the stress ratio / during the fluid intrusion.

Figure 8.
A comparison of the spatiotemporal distribution of aftershocks and the numerical simulation of the fault reactivation area. (a) The aftershock distribution at different times. (b) The calculated fault reactivation area at different times.
Figure 8.
A comparison of the spatiotemporal distribution of aftershocks and the numerical simulation of the fault reactivation area. (a) The aftershock distribution at different times. (b) The calculated fault reactivation area at different times.

Figure 9.
Pore pressure along the dip from the intrusion point in the fault plane for varied model and grid dimensions.
Figure 9.
Pore pressure along the dip from the intrusion point in the fault plane for varied model and grid dimensions.


Table 1.
Parameters for the rock matrix, fault, and fluid for the numerical model.
| Properties | Rock Matrix | Fault |
|---|---|---|
| Bulk modulus (Pa) | 4.667 × 10¹⁰ | 2.800 × 10¹⁰ |
| Shear modulus (Pa) | 2.890 × 10¹⁰ | 1.646 × 10¹⁰ |
| Rock density (kg/m3) | 2600 | 2600 |
| Fluid density (kg/m3) | N/A | 1000 |
| Static friction coefficient | N/A | 0.6 |
| Fluid modulus (Pa) | N/A | 2.2 × 10¹⁰ |
| Permeability (m2) | N/A | 3.7 × 10⁻¹⁵ |
| Biot coefficient | N/A | 1.00 |
| Porosity | N/A | 0.05 |
Publisher’s Note: MDPI stays neutral with regard to jurisdictional claims in published maps and institutional affiliations. |
© 2022 by the authors. Licensee MDPI, Basel, Switzerland. This article is an open access article distributed under the terms and conditions of the Creative Commons Attribution (CC BY) license (https://creativecommons.org/licenses/by/4.0/).
Share and Cite
MDPI and ACS Style
Chen, T.; Liu, Y.; Zhang, G. Numerical Simulation of Fluid Pore Pressure Diffusion and Its Mechanical Effects during Wenchuan Aftershocks. Water 2022, 14, 952. https://doi.org/10.3390/w14060952
AMA Style
Chen T, Liu Y, Zhang G. Numerical Simulation of Fluid Pore Pressure Diffusion and Its Mechanical Effects during Wenchuan Aftershocks. Water. 2022; 14(6):952. https://doi.org/10.3390/w14060952
Chicago/Turabian StyleChen, Tao, Yaowei Liu, and Guomeng Zhang. 2022. "Numerical Simulation of Fluid Pore Pressure Diffusion and Its Mechanical Effects during Wenchuan Aftershocks" Water 14, no. 6: 952. https://doi.org/10.3390/w14060952
Note that from the first issue of 2016, this journal uses article numbers instead of page numbers. See further details here.