1. Introduction
Lakes and groundwater are interconnected resources; thus, groundwater has a significant effect on the related lakes’ water and nutrient budget as well as on its ecosystem [
1,
2,
3]. Although sustainable development and management of lakes would require a thorough understanding of groundwater inflow and outflow [
4], decision makers in water management tend to consider surface water and groundwater as separate entities [
5,
6]. This is partly due to the difficulty of the determination of groundwater exchange and the invisibility of the lake water–groundwater interaction [
7]. Three fundamental forms of interaction between these two entities can occur: (1) lake receives groundwater inflow throughout their entire bed, (2) lake has seepage loss to groundwater throughout their entire bed, (3) lake receives groundwater inflow through part of the bed and has seepage loss to groundwater through other parts [
8].
The recognition and the quantification of the physical relation between lakes and groundwater have become even more important as climate change severely impacts the water budget of lakes [
9]. Since groundwater either serves as a natural buffer against climate change or can be threatened by it, its contribution to the quantity and quality of lake water should not be neglected [
10]. Climate change in Central Europe, including Hungary, will most likely result in decreasing recharge rates and increasing evaporation rates that will induce significant stress on lakes and the related ecosystems [
11].
Different approaches and methods were developed that can help to understand the nature of the relationship between lakes and groundwater. One of them being the direct measurement of groundwater inflow and outflow, but it is labor-consuming and unreliable. While on the other hand, investigation of groundwater flow dynamics is easier to carry out and can provide useful information on the exchange between the aquifer and the lake. Oliveira Ommen et al. measured the hydraulic gradient between piezometers and the lake to assess the infiltration [
12], whereas Rudnick et al. used horizontally interpolated groundwater heads combined with lake water levels to obtain vertical hydraulic gradients between the aquifer and the lake [
13]. Mádl-Szőnyi et al. applied methods of “basin hydraulics” (i.e., pressure–elevation profiles and tomographic potential maps) and chemical evaluation based on archive well data [
14].
The use of naturally occurring environmental tracers coupled with physical methods was also proven to be sufficiently applied in the characterization of groundwater–surface water interactions. Stable isotopes δ
2H and δ
18O are some of the most widely used tracers (e.g., [
15,
16]), since they are elements of water and can be applied naturally in the hydro(geo)logic system. The isotopic composition of precipitation, lake, and groundwater are continuously altering due to the natural isotopic fractionation [
17]. These modifications can help to determine the interaction between the latter two.
In precipitation that recharges both groundwater and surface water, the δ
2H and δ
18O values are strongly related and follow the global meteoric water line (GMWL) [
18]. Given as it is its main recharging agent, the isotopic composition of lake water is highly influenced by the chemical content of the precipitating water and later modified through evaporation, leading to the enrichment of lacustrine waters in δ
18O relative to the composition of the original precipitation. Shallow groundwater has similar isotopic fingerprints as the local precipitation and can be isotopically affected by fractionation during evaporation, whereas deep groundwater is possibly recharged under different climate conditions; thus, it can be relatively depleted in δ
18O and characterized by more negative isotopic composition [
17,
19].
In Hungary, groundwater contribution to the lakes’ water budget has been assumed to be irrelevant [
20,
21], although hydrogeological studies were carried out recently to prove otherwise [
14,
22,
23]. Lake Velence, the third largest natural lake in Hungary, has recently suffered from a significant lake level drop and developed water quality problems, severely affecting the lake’s ecosystem, which attracted public and scientific attention. According to the annual report of the Central Transdanubian Water Management Directorate [
21], the water budget of the lake is given by the following equation:
where P is precipitation, SW is surface water inflow from the catchment area, R is inflow from surface reservoirs, ET is evapotranspiration, O is outflow through an artificial channel, E is water extraction from the lake, and ΔS is change in storage. The equation reflects that the possible groundwater inflow and/or outflow were left out of consideration by the authority.
The aim of the present study was not only to prove that Lake Velence has an interconnection with the groundwater but also to integrate the lake into the groundwater flow system at the regional scale. To achieve this aim, methods of basin hydraulics, environmental tracers of both stable and radioactive isotopes, were applied with the utilization of results published in previous studies discussing the same research area as well. Quantification of the groundwater flux into or out from the lake, however, was not the aim of this research.
Methods of “basin hydraulics” stipulated by Tóth [
24] were applied, as these methods are suitable tools to map the vertical and horizontal component of groundwater flow using hydraulic data available in archive well documentation. Based on this mapping, either the groundwater regime types (i.e., recharge, midline, and discharge) or the order of the groundwater flow systems (i.e., local, intermediate, and regional) could be identified in specific areas (e.g., [
14,
25,
26,
27,
28]). Mapping of the vertical groundwater flow directions was already carried out by Erőss et al. in the southern foreland of Lake Velence in [
29]. During their research [
29], nine pressure–elevation profiles (p(z) profiles, hereinafter) were compiled based on which recharge and midline areas were identified. These results were included in the recent study, but the groundwater flow mapping was extended to the whole catchment area of Lake Velence.
To refine the results of the hydraulic evaluation, δ
2H and δ
18O ratios were measured as an efficient method to distinguish water with different origins [
15,
16,
17]. Radioactive isotopes of uranium (ΣU), radium (
226Ra), and radon (
222Rn) elements were also analyzed as common tools to identify the regime areas or the order of groundwater flow systems (e.g., [
30,
31,
32]). The aforementioned radionuclides were chosen in line with the results of previous studies that revealed the existence of geogenic uranium contamination in groundwater in the southern foreland of Lake Velence [
29,
33,
34].
In brief, the possible application of radionuclides as tracers is based on the redox sensitivity of their dissolution in water. Uranium tends to be highly mobile in groundwater under oxidizing conditions, especially when the pH is between 6 and 8 and the water has high carbonate alkalinity [
35,
36,
37]. Such a geochemical environment primarily occurs along local flow systems and in recharge areas. Regional flow systems and their discharge points are most likely characterized by the presence of dissolved radium, which is mobile under reducing conditions, especially in brines, in which the high dissolved solid content can enhance its mobility [
38]. Radon is chemically inert but very soluble in water; thus, groundwater can transport it further and easier than its progenitors. Dissolved radon in the groundwater can be expected at the discharge points of groundwater flow systems which are characterized by either rapid flow (i.e., karstic springs, [
30,
39]) or long residence time (i.e., thermal springs with iron and manganese oxyhydroxide precipitation [
31,
32]).
Radioisotopes, as tracers, were used to reveal what kind of groundwater flow system(s) feeds the lake, since the possible effects of groundwater-related changes on the lake’s water budget highly depend on the properties of the groundwater flow systems, i.e., local flow systems and recharge areas are more sensitive to short-term changes (e.g., decreasing recharge due to the fact of climate change, increasing water extraction) [
40].
2. Materials and Methods
2.1. Study Area
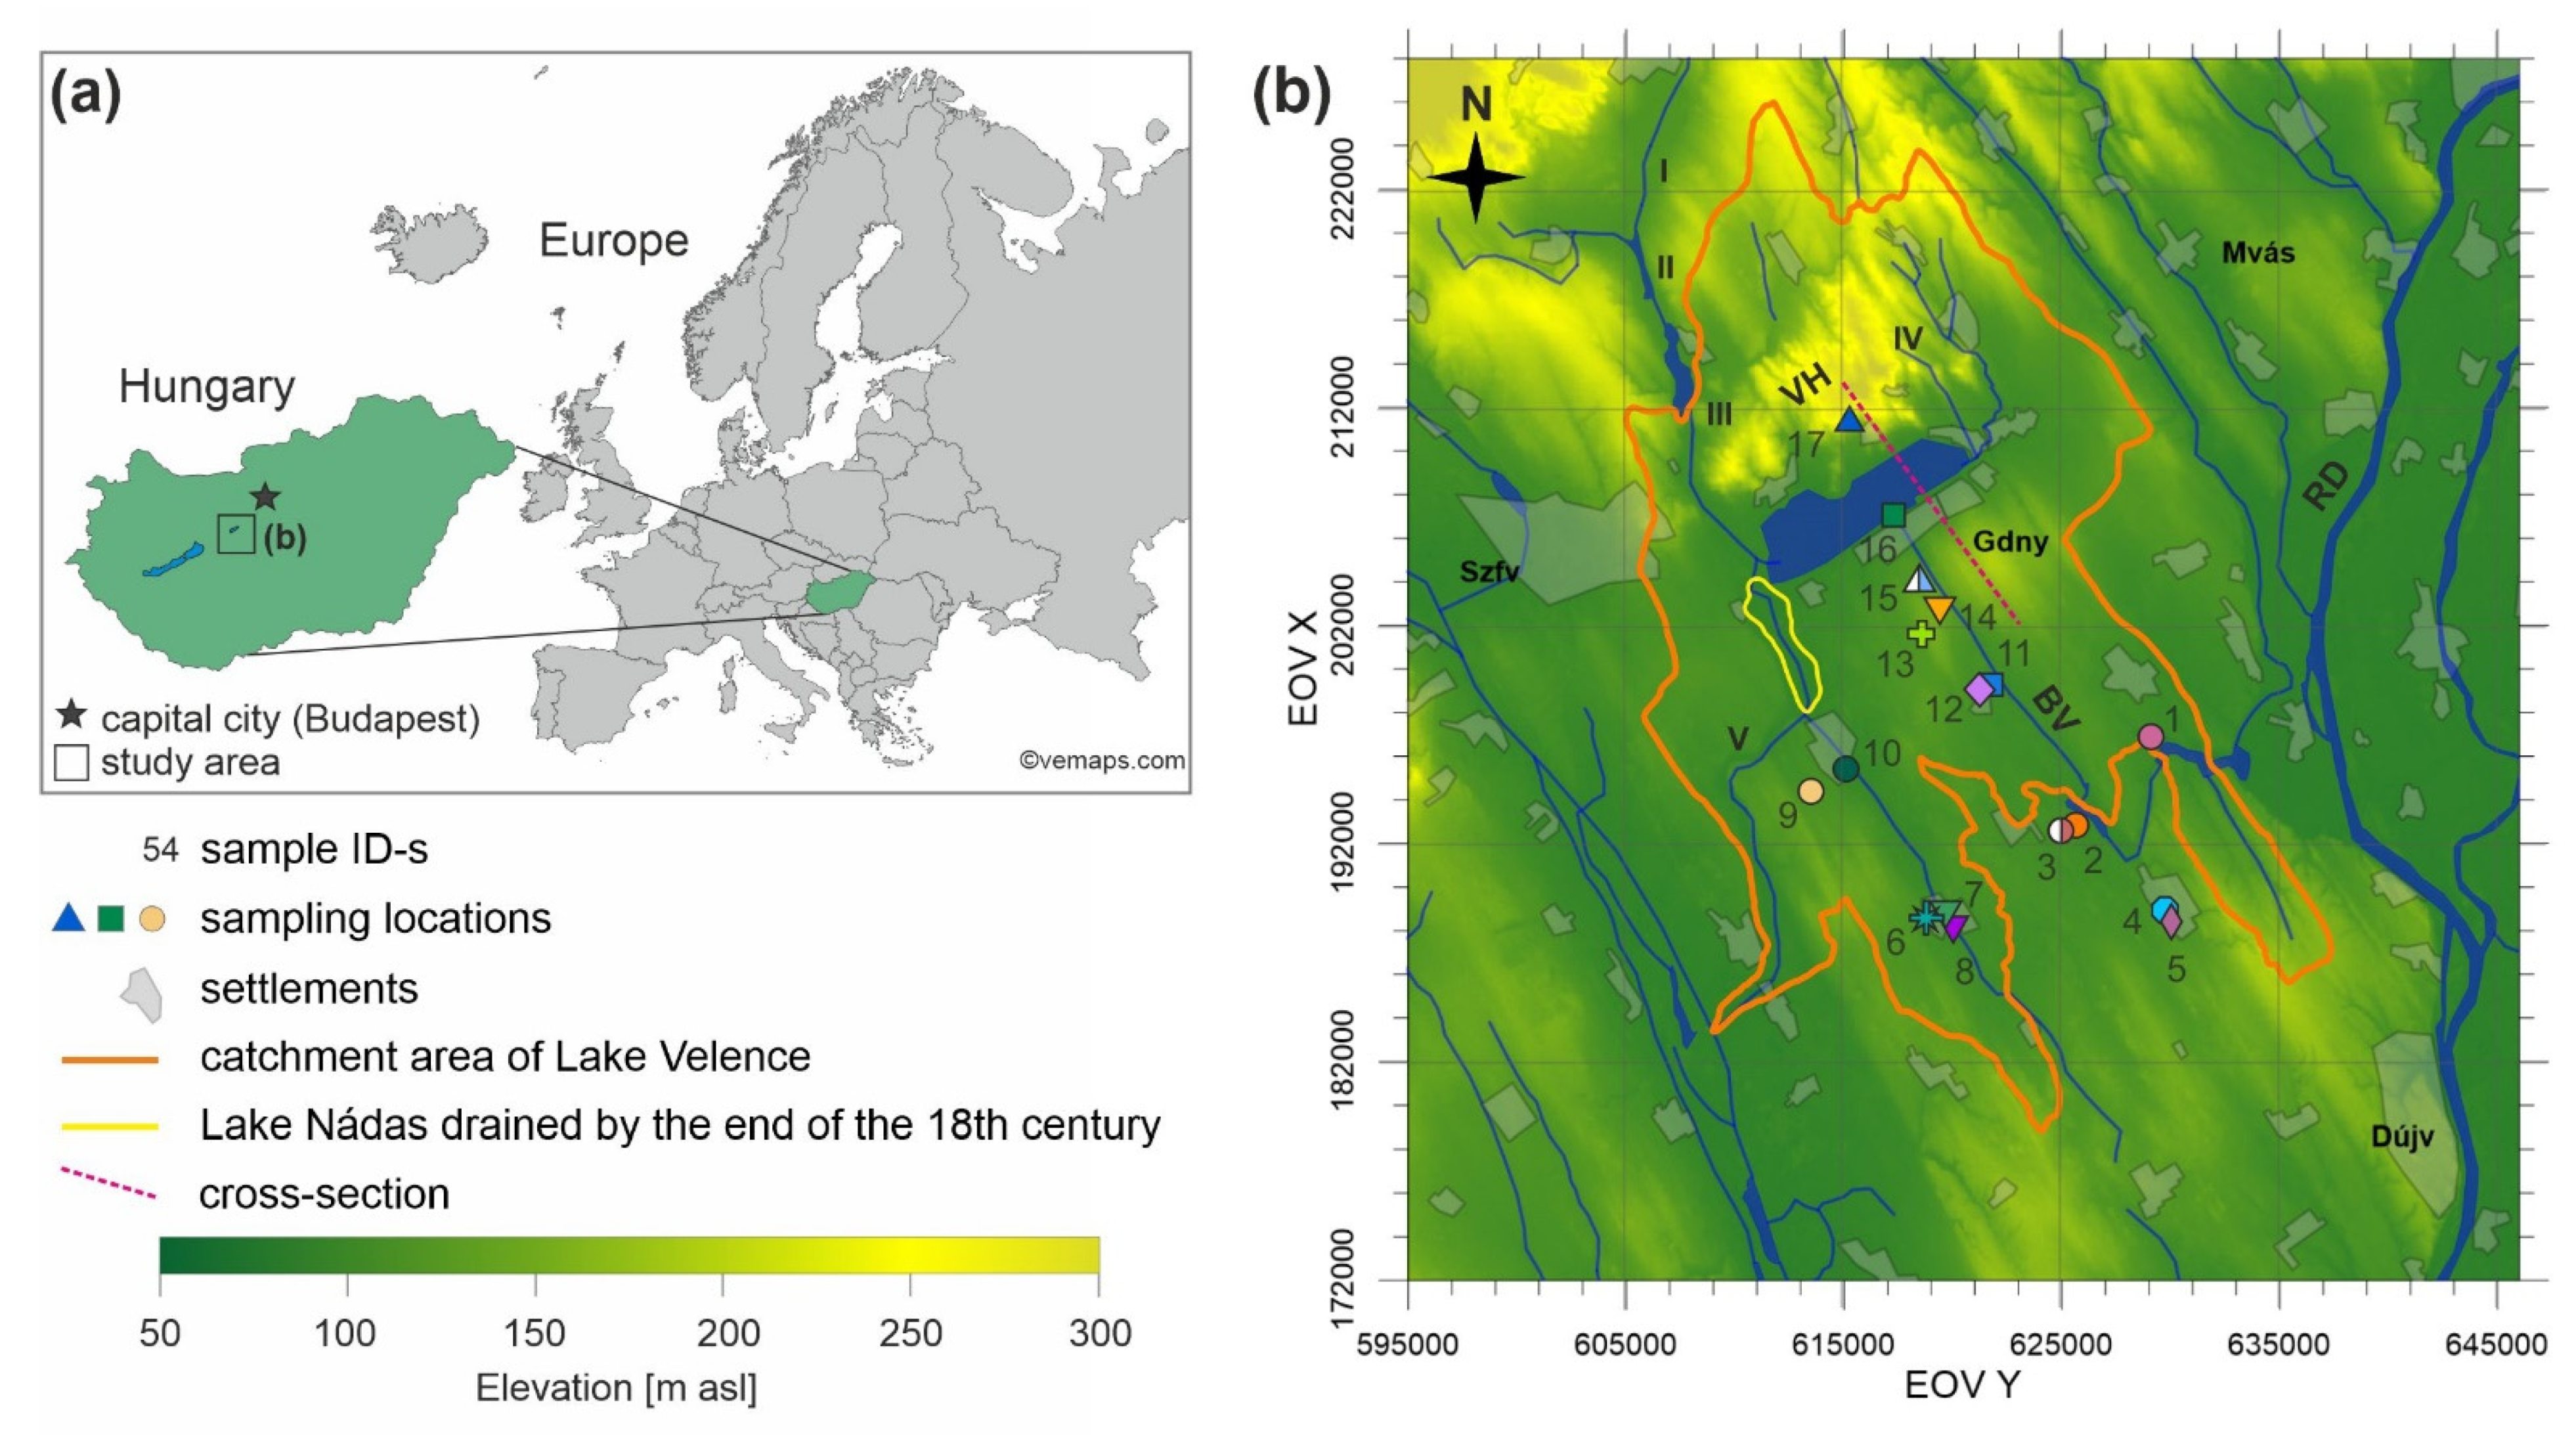
The study area is located approximately 50 km southwest from Budapest, the capital city of Hungary (
Figure 1a). It encompasses Lake Velence, its catchment area, and approximately an additional 10 km surrounding area bordered by the Vértes Mountains on the North and River Danube on the East (approximately 2800 km
2) (
Figure 1b). On maps, the Hungarian ‘EOV’ coordinate system (Uniform National Projection system) was applied, which uses the horizontal EOV Y and vertical EOV X axes to express the easting and northing distances in meters, from the system’s origin. The highest point of the area (352 m above the Baltic Sea level, hereinafter referred to as “m asl”) is located in its northern hilly part, in the Velence Hills, while the regional erosion base, River Danube has the lowest elevation (90–100 m asl) on the eastern border of the area. Since the recharge is provided by rainfall, the groundwater table can be regarded as a subdued smoothened replica of the topography. Consequently, regional topographic differences are the driving forces.
Lake Velence is the third largest natural lake in Hungary with a surface area of 24.5 km
2. It is a shallow soda lake with an average water depth of 1.2 m [
41]. The lake is located in a tectonic depression in the foreland of the granitic blocks of Velence Hills [
42]. Elevation of the water table varies between 103 and 105 m asl [
21]. The lake attained its present-day size at the end of the 18th century, when Lake Nádas, its extension toward the south, was completely drained (
Figure 1b) [
42].
The lake has two main surficial inflows, Császárvíz from the West and the Vereb-Pázmánd watercourse from the East. To prevent extreme water level changes in the lake, two reservoirs were established along the Császárvíz: the reservoirs of Zámoly and Pátka (
Figure 1b). The lake has practically no outlet because the Dinnyés-Kajtor channel running out in the southwest is locked due to the usual low water level. In addition to surface water, the lake recharges from precipitation. The groundwater flux into the lake has not yet been considered in the lake’s water balance [
41].
The catchment area of the lake is characterized by a sub-Mediterranean climate with approximately 560 mm annual precipitation, 550 mm annual evapotranspiration, and 10.9 °C average annual temperature [
21,
43]. The climate has a significant impact on the lake’s water level. During historical times, Lake Velence was been desiccated several times [
44]. The water of the lake is of an Na(Mg)–HCO
3 type, with high SO
42− and organic material contents [
41].
The geological build-up of the study area is complex. The crystalline basement is composed of Palaeozoic sediments on the north and Mesozoic sediments on the south. The Paleozoic sequence also includes low-grade metamorphics (schist), plutonic rocks (granite batholith), and terrestrial siliciclastic to shallow marine carbonate sediments (sandstone, anhydrite, and dolomite). The Mesozoic formations include shallow marine carbonate and siliciclastic sediments (limestone, marl, sandstone, and aleurite) [
42]. This pre-Cenozoic basement is covered by Miocene to Quaternary sediments and buried at a depth of 500–3000 m with only a few outcropping exceptions (e.g., Velence Hills) [
45]. The up to 350 m thick Miocene siliciclastics were deposited in lacustrine to fluvial environment (conglomerate, sand, gravelly sand, and siltstone) [
46]. In most of the study area, the older formations are overlain by a few meters thick (1–10 m) Quaternary cover consisting of sediments of various depositional systems (i.e., fluvial, lacustrine, eolic, eluvial, deluvial, and proluvial) [
42].
Table 1 includes the hydraulic properties of those formations (in accordance with [
23,
47,
48]) that have near-surface occurrence in the study area and have local interest. Pannonian Újfalu and Zagyva Formations and Quaternary sediments serve as the main groundwater reservoirs in the study area. Sampled water wells are screened in these formations. Velence Granite Formation builds up the majority of Velence Hills which is thought to be the recharge area of the groundwater resources.
2.2. Hydraulic Evaluation
To investigate if Lake Velence is an integrated part of the groundwater flow system, the vertical and horizontal groundwater flow directions were mapped using the basic regional-scale methods of “basin hydraulics” [
24]. The methods of “basin hydraulics” were developed by Tóth [
24] related to his theory of gravity-driven groundwater flow systems [
49,
50], and it is based on the hydraulic continuity approach [
51]. We followed this approach during our research. In accordance with Tóth [
24], we assumed that the concerned aquifers are hydraulically connected. The applicability of the Tothian method for mapping hydraulic conditions in a specific area has been successfully proved by previous studies [
14,
25,
28]. As a first step, a database was created which contained hydraulic data measured during or right after water well completion and hydraulic data calculated during data processing. Data on measurements were extracted from original well documentations that were available in the archives of the Supervisory Authority of Regulatory Affairs. Although well documentations do not contain methodological descriptions and determination of precision, the errors in a basin-scale study can be considered negligible [
26]. However, data filtering was necessary based on the availability of some essential basic data. Only those wells were selected where: (1) well coordinates, (2) wellhead elevation, (3) depth of the static water level, and (4) elevation of the screened interval were recorded. Any well missing any of this information was discarded. In the study area, 1116 wells were eligible and used in further analysis. All wells were screened in Pannonian or Quaternary sediments. As the next step, hydraulic head values were calculated (depth of the static water level (m) extracted from the wellhead elevation (m asl)) and then converted to pore pressure values following Equation (2), assuming a constant density of 1000 kg m
−3 of groundwater along the flow path:
where h is the calculated hydraulic head; z is the elevation of the measuring point with respect to the Baltic Sea level; p is pore pressure; (ρ × g) is the specific weight of the fluid, which is numerically equal to the hydrostatic vertical pressure gradient of that fluid (9.81 MPa km
−1). Given that no extraordinary temperature or TDS values were measured in the analyzed wells, the modifying effect of these properties on the density of water was not taken into account. The data set that included the measured hydraulic properties could not be included due to the confidentiality agreement.
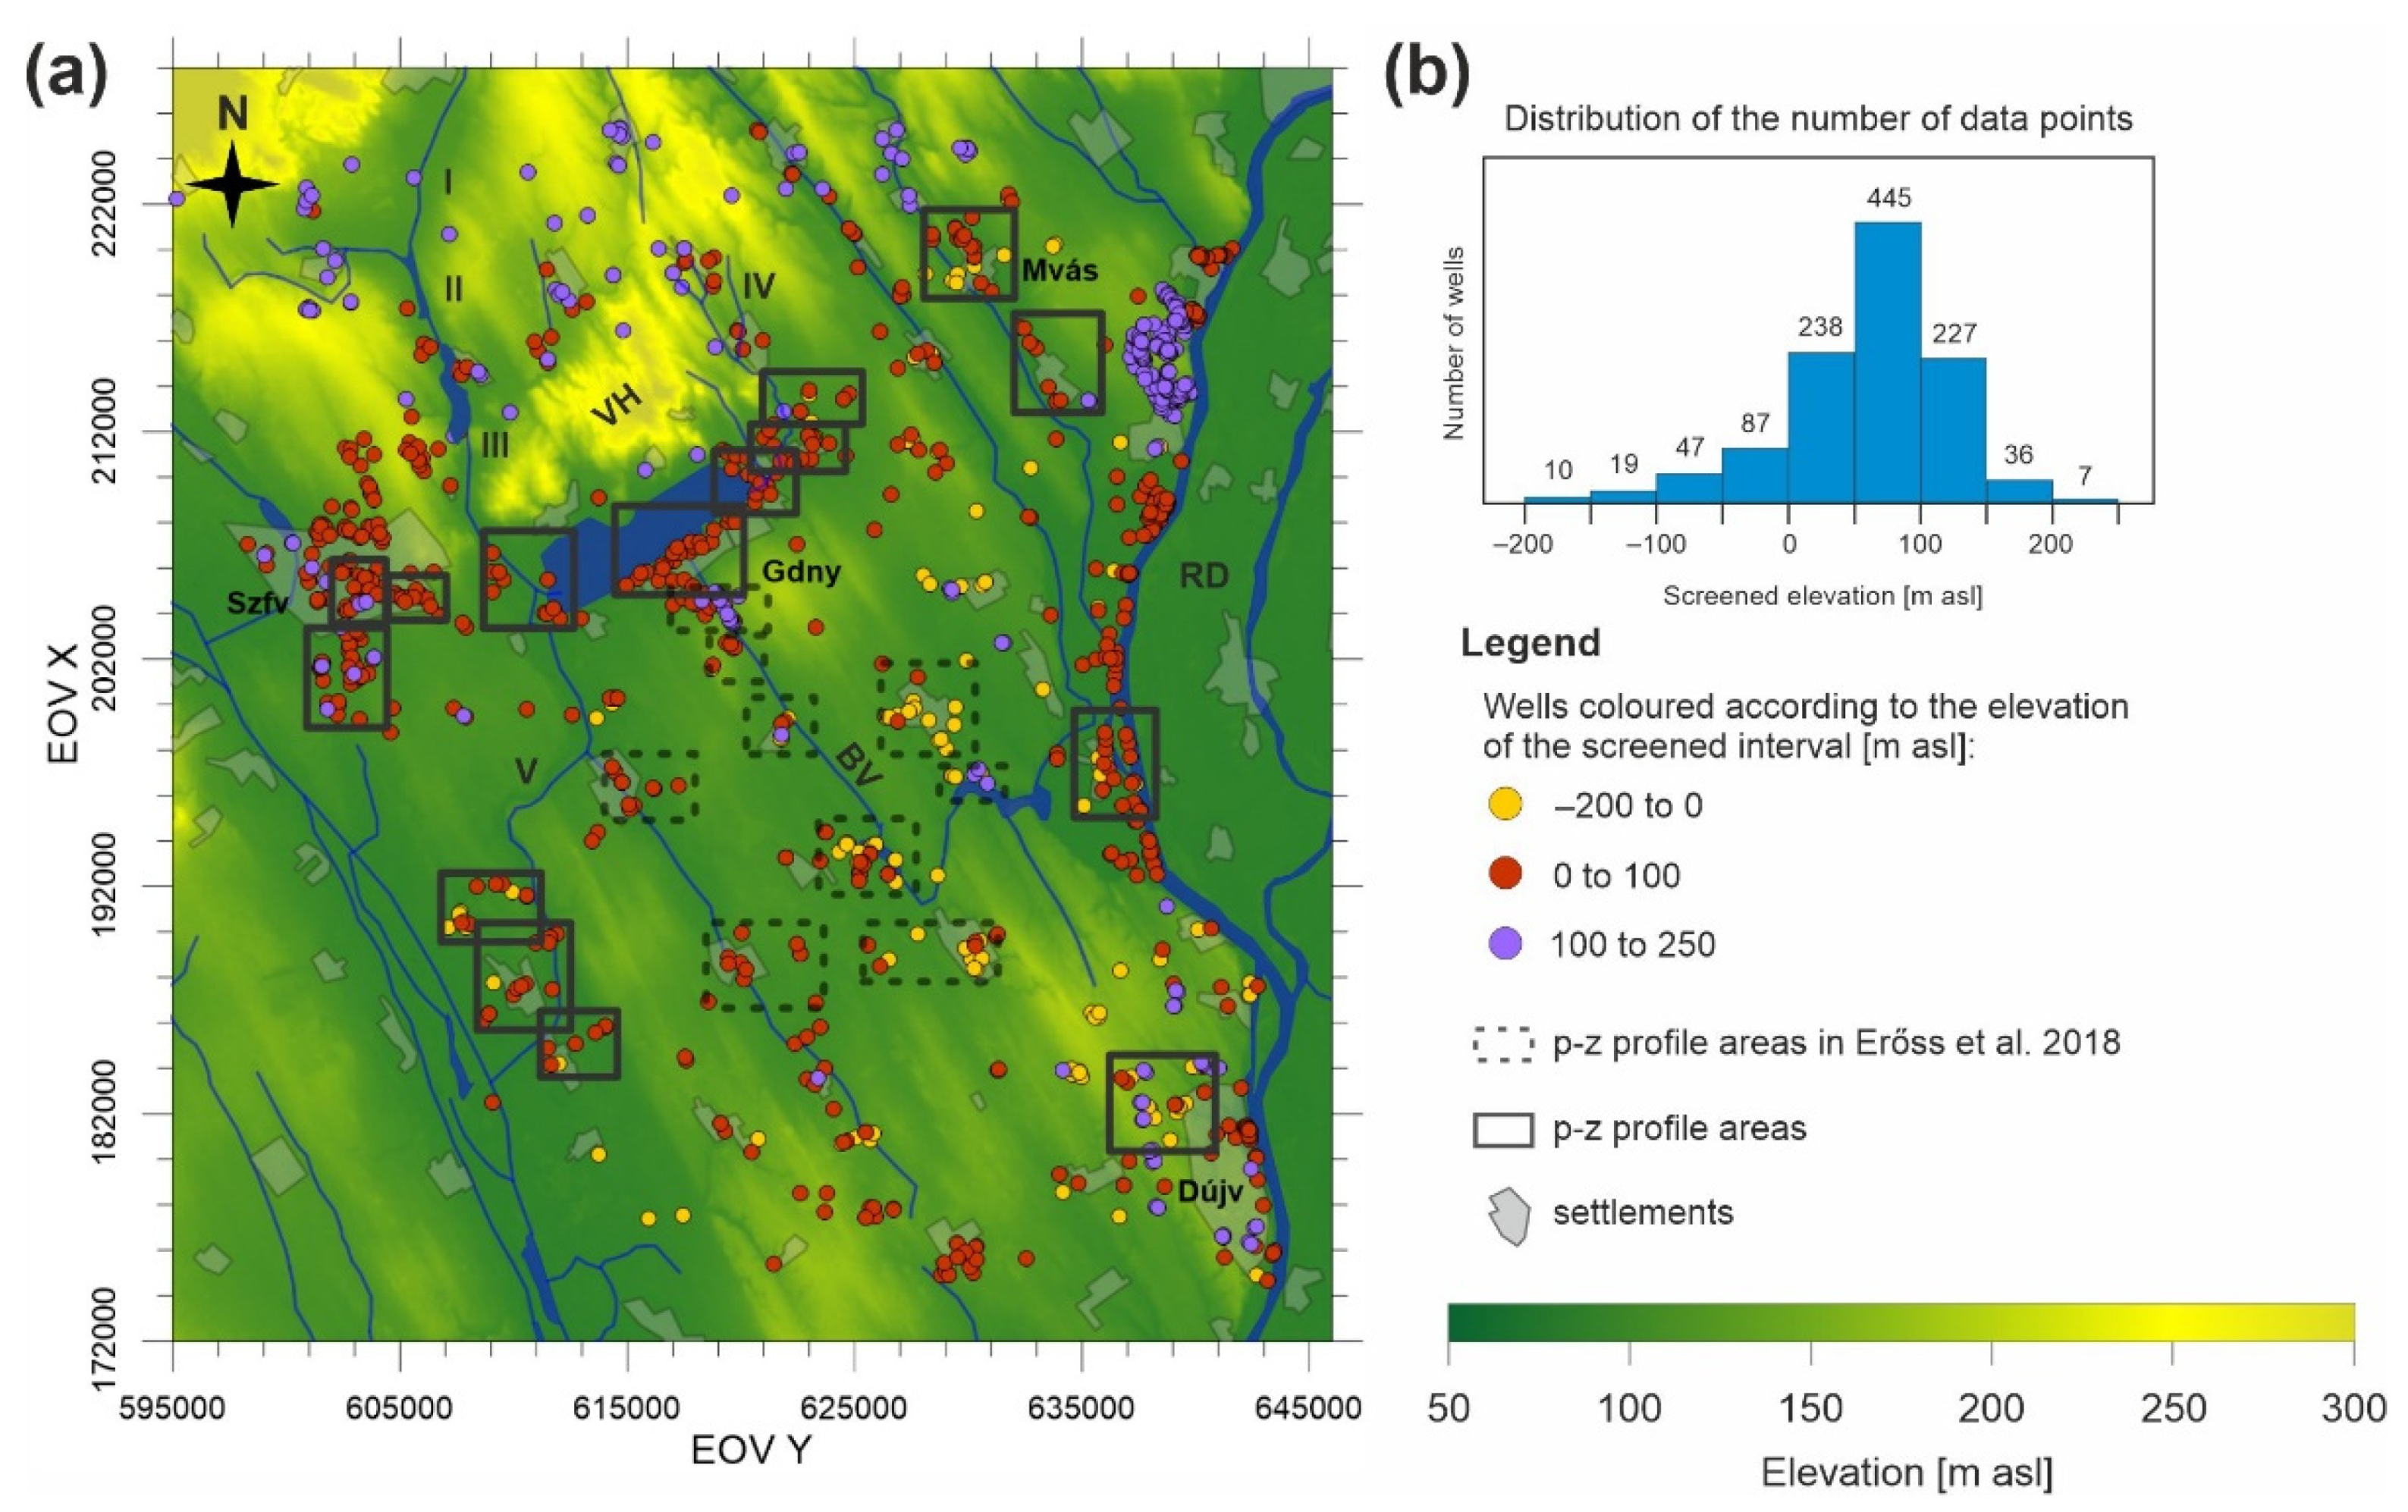
Majority of the wells in the study area were concentrated along the River Danube and in the catchment areas of the local settlements, while hilly areas had a limited number of wells with a much lower density (
Figure 2a). Within wells, the vertical location of the screens also showed a skewed distribution (
Figure 2b), most of them located between 50 and 100 m asl, and very few wells had screens either above 200 or below −150 m asl. These unequal data distributions limited the number of locations where p(z) profiles could be constructed and the number of elevation intervals for which potential maps could be generated.
After pore pressure was calculated for each well (using Equation (2)), pressure–elevation profiles were constructed to identify the vertical component of groundwater flow directions. On p(z) profiles, the vertical pressure gradient (γ), which is the change in pore pressure per unit vertical length in a flow domain, was compared to the ideal hydrostatic conditions. Ideally, under hydrostatic conditions there is no vertical fluid flow because the buoyancy and the force of gravity on water particles are in balance. In this case, the vertical pressure gradient was hydrostatic, and its average value was γ
st = 9.81 MPa km
−1, assuming a constant water density of 1000 kg m
−3. When the system was not hydrostatic (i.e., driving force exists), there was no balance between the buoyancy and the force of gravity; thus, there was a vertical flow component and the vertical pressure gradient changes to dynamic (dyn). In recharge areas γ
dyn < γ
st, meaning that there was a downward groundwater flow and γ
dyn was subhydrostatic, while in discharge areas γ
dyn > γ
st, thus there was an upward groundwater flow and γ
dyn was superhydrostatic. In midline areas, the vertical pressure gradient was hydrostatic (γ
dyn = γ
st); therefore, the fluid flow had no vertical component; nevertheless, the horizontal component could not be excluded [
24].
On p(z) profiles, the calculated pressure of the selected wells was plotted as the function of the elevation of the well screen. In addition to the hydrostatic vertical pressure gradient line (γst), the dynamic vertical pressure gradient (γdyn) fitted on the data points is also presented. The designation of the p(z) profile areas is influenced by the spatial and depth distribution of available hydraulic data. As an important prerequisite, a p(z) profile had to include wells that had approximately the same surface elevation, because surface elevation determines the position of the reference hydrostatic pressure gradient line. In our study, 10 m was allowed as the maximum difference between the lowest and the highest surface elevations of the wells considered in the same p(z) profile. The other criterion was that wells of each p(z) profile should cover as small a surface area as possible. In line with these preliminary assumptions, 15 p(z) profile areas were outlined in the study area, where the data availability met the abovementioned criteria.
To examine the horizontal groundwater flow direction, tomographic fluid-potential maps were compiled for consecutive elevation intervals. These maps plot the calculated hydraulic head in the function of the geographical coordinates and present equipotential lines, along which hydraulic head values are constant. Groundwater flow lines are perpendicular to the equipotentials. A potential map can be constructed for one horizontal aquifer by original definition; however, in areas characterized by low data density, it is worth preparing potential maps for given elevation intervals. The elevation intervals for map construction were chosen based on the depth distribution of the data (
Figure 2b) as the following: z = (−200)–0; 0–100 and 100–250 m asl. By comparing the so-called tomographic potential maps, which are constructed for successive elevation intervals, vertical flow directions could also be interpreted among them.
2.3. Sampling and Laboratory Measurements
To collect samples for laboratory measurements, a sampling campaign was carried out (9 June 2021), and 17 water samples were collected for water chemistry analysis, radionuclide, and stable isotope measurements. Sampling locations were selected after [
29] and [
34] to ensure that water samples had considerable uranium activity. Of the 17 samples, 14 were taken from groundwater wells, 2 samples were collected from surface water bodies, and 1 was taken from a spring. The sampled wells are all continuously operating water supply wells owned by either waterworks, companies or individuals. The elevation of the screened interval or measuring points for the collected groundwater samples ranges from −169 m asl to 79 m asl. The sampled surface watercourses were lakes (i.e., Lake Velence and Lake Zichy) situated in the research area at 107 and 122 m asl, respectively. The spring (Szűcs Spring) is located in Velence Hills at 180 m asl and emanates from the granitic bedrock.
Physicochemical properties of the water, such as specific electrical conductivity (EC, hereinafter) (±0.5%), temperature (±0.2 °C), pH (±0.2), oxidation reduction potential (ORP, hereinafter) (±20 mV), dissolved O2 (±2%) were recorded onsite during the sampling by a YSI Pro Plus multiparameter water quality instrument (Xylem, Rye Brook, NY, USA). The accuracy of the device for each parameter is indicated in parentheses. Water samples for elemental analysis were collected in 1.5 L PET bottles, 50 mL PP centrifuge tubes, and 0.25 L glass bottles. For ΣU and 226Ra measurements, water samples were taken in 0.25 L PP bottles. To determine radon activity concentration, liquid scintillation detection was used which requires specific sampling. On the previous day, a 10 mL organic cocktail (Opti-Fluor O, PerkinElmer Inc., Waltham, MA, USA) was added into glass cuvettes, into which 10 mL water sample was injected on-site using a syringe and cuvettes were sealed by Parafilm M tape (Heathrow Scientific, Vernon Hills, IL, USA). Water samples for stable isotope measurement were collected in 60 mL HDPE bottles. All collected samples were kept cool at 5–10 °C until delivery to the laboratories.
Hydrochemical analysis of the water samples was performed in the laboratories of the National Public Health Center of Hungary and Eötvös Loránd University. The concentration of major ions (Na+, K+, Ca2+, Mg2+, HCO3−, SO42−, Cl−, and NO3−) and trace elements (As, B, Ba, Be, Co, Fe, Li, Mn, Sr, Ti, and V) were measured by ICP-MS (iCAP RQ, Thermo Fisher Scientific, Waltham, MA, USA), ion chromatography (DIONEX ICS-5000 þ DP, Thermo Fisher Scientific, Waltham, MA, USA), and UV–Vis spectrophotometry (UV-1800, Shimadzu Co., Kyoto, Japan) in accordance with the relevant standard methods for drinking water (MSZ EN ISO 17294-2:2017; MSZ EN ISO 10304-1:2009; MSZ ISO 7150-1:1992).
ΣU,
226Ra and
222Rn activity concentration measurements were carried out from the collected water samples. For ΣU and
226Ra activity concentration measurements, alpha spectrometry using NucFilm discs was applied (SMs in [
34], for further details on this measurement method). NucFilm discs are coated by selectively adsorbing thin films. The U-discs are made of polycarbonate, which is covered with epoxy resin fixing a finely ground ion exchange resin (Diphonix) that adsorbs actinides very selectively. Ra-discs are polyamide discs stained with MnO
2. In contact with water, it works as a highly selective cation exchanger for heavy alkaline-earth ions. Some precautions are necessary, Ra-discs can be applied as long as the pH is above 4 and the barium concentration is below 0.5 mg L
−1 in the water sample [
52,
53]. All of our water samples met these two requirements (
Table S1 of the Supplementary Materials (SMs)).
For ΣU and 226Ra measurements by NucFilm discs, a 100 mL water sample is required. Twenty mg ethylenediaminetetraacetic acid (EDTA) is added to the water to avoid carbonate precipitation. An Ra-disc was inserted and the sample was stirred for 8 h for an adsorption efficiency > 90%. After the pre-treatment process, the disc was dried. The activity concentration of the 226Ra adsorbed on the disc was measured by a solid-state alpha detector with a measurement time of 24 h. The expected detection limit using a 100 mL sample for one-day measurement was approximately 5 mBq L−1. By using Ra discs, 226Ra activity concentration can be determined. As the pre-treatment was completed for 226Ra measurement, the same water sample was acidified to pH 2–3 with concentrated (85%) formic acid. This treatment guarantees that uranyl–carbonate complexes are broken up. The U discs were exposed to 100 mL acidified water with continuous stirring water for 20 h. After 20 h, 90% of the uranium activity present in the sample was adsorbed. The dried disc was subsequently measured with an alpha detector for another 24 h. The detection limit was the same as for 226Ra (5 mBq L−1). Calibration uncertainty of alpha spectrometry is ±20% compared to international standards. The alpha detector that is available in our laboratory measures the U-discs at ambient pressure. This was not only easier than in vacuum but also avoids contaminations of the detector by recoiled decay products. Thus, this method gives the sum of 234U, 235U, and 238U activity concentrations. Isotopic speciation was not considered in this study, hence we use the term “uranium activity” later on to refer to the sum of the activity of all uranium isotopes (234U + 235U + 238U).
δ
2H and δ
18O measurements were performed using PICARRO L2130-i δ
2H/δ
18O Ultra High-Precision Isotopic Water Analyzer (Picarro Inc., Santa Clara, CA, USA) in isotope laboratory of Geological Survey of Finland. The results are reported as δ units, i.e., the relative difference in isotope ratios of the sample and the standard defined by Equation (3) below [
54]:
where R
sample and R
standard stand for the isotope ratios (
18O/
16O or
2H/
1H) for the sample and the reference material (standard), respectively. The δ-values are reported as a per mil (‰) difference relative to the international VSMOW (Vienna Standard Mean Ocean Water) standard for hydrogen and oxygen [
18]. Daily-use in-house standards (calibrated against the VSMOW2-SLAP2 international standards) are used to normalize measured δ-values of standards to the VSMOW-SLAP scale. The uncertainty of the measurement is <0.1‰ for oxygen analysis and <0.3‰ for hydrogen analysis.
3. Results
3.1. Hydraulic Evaluation
3.1.1. P(z) Profiles
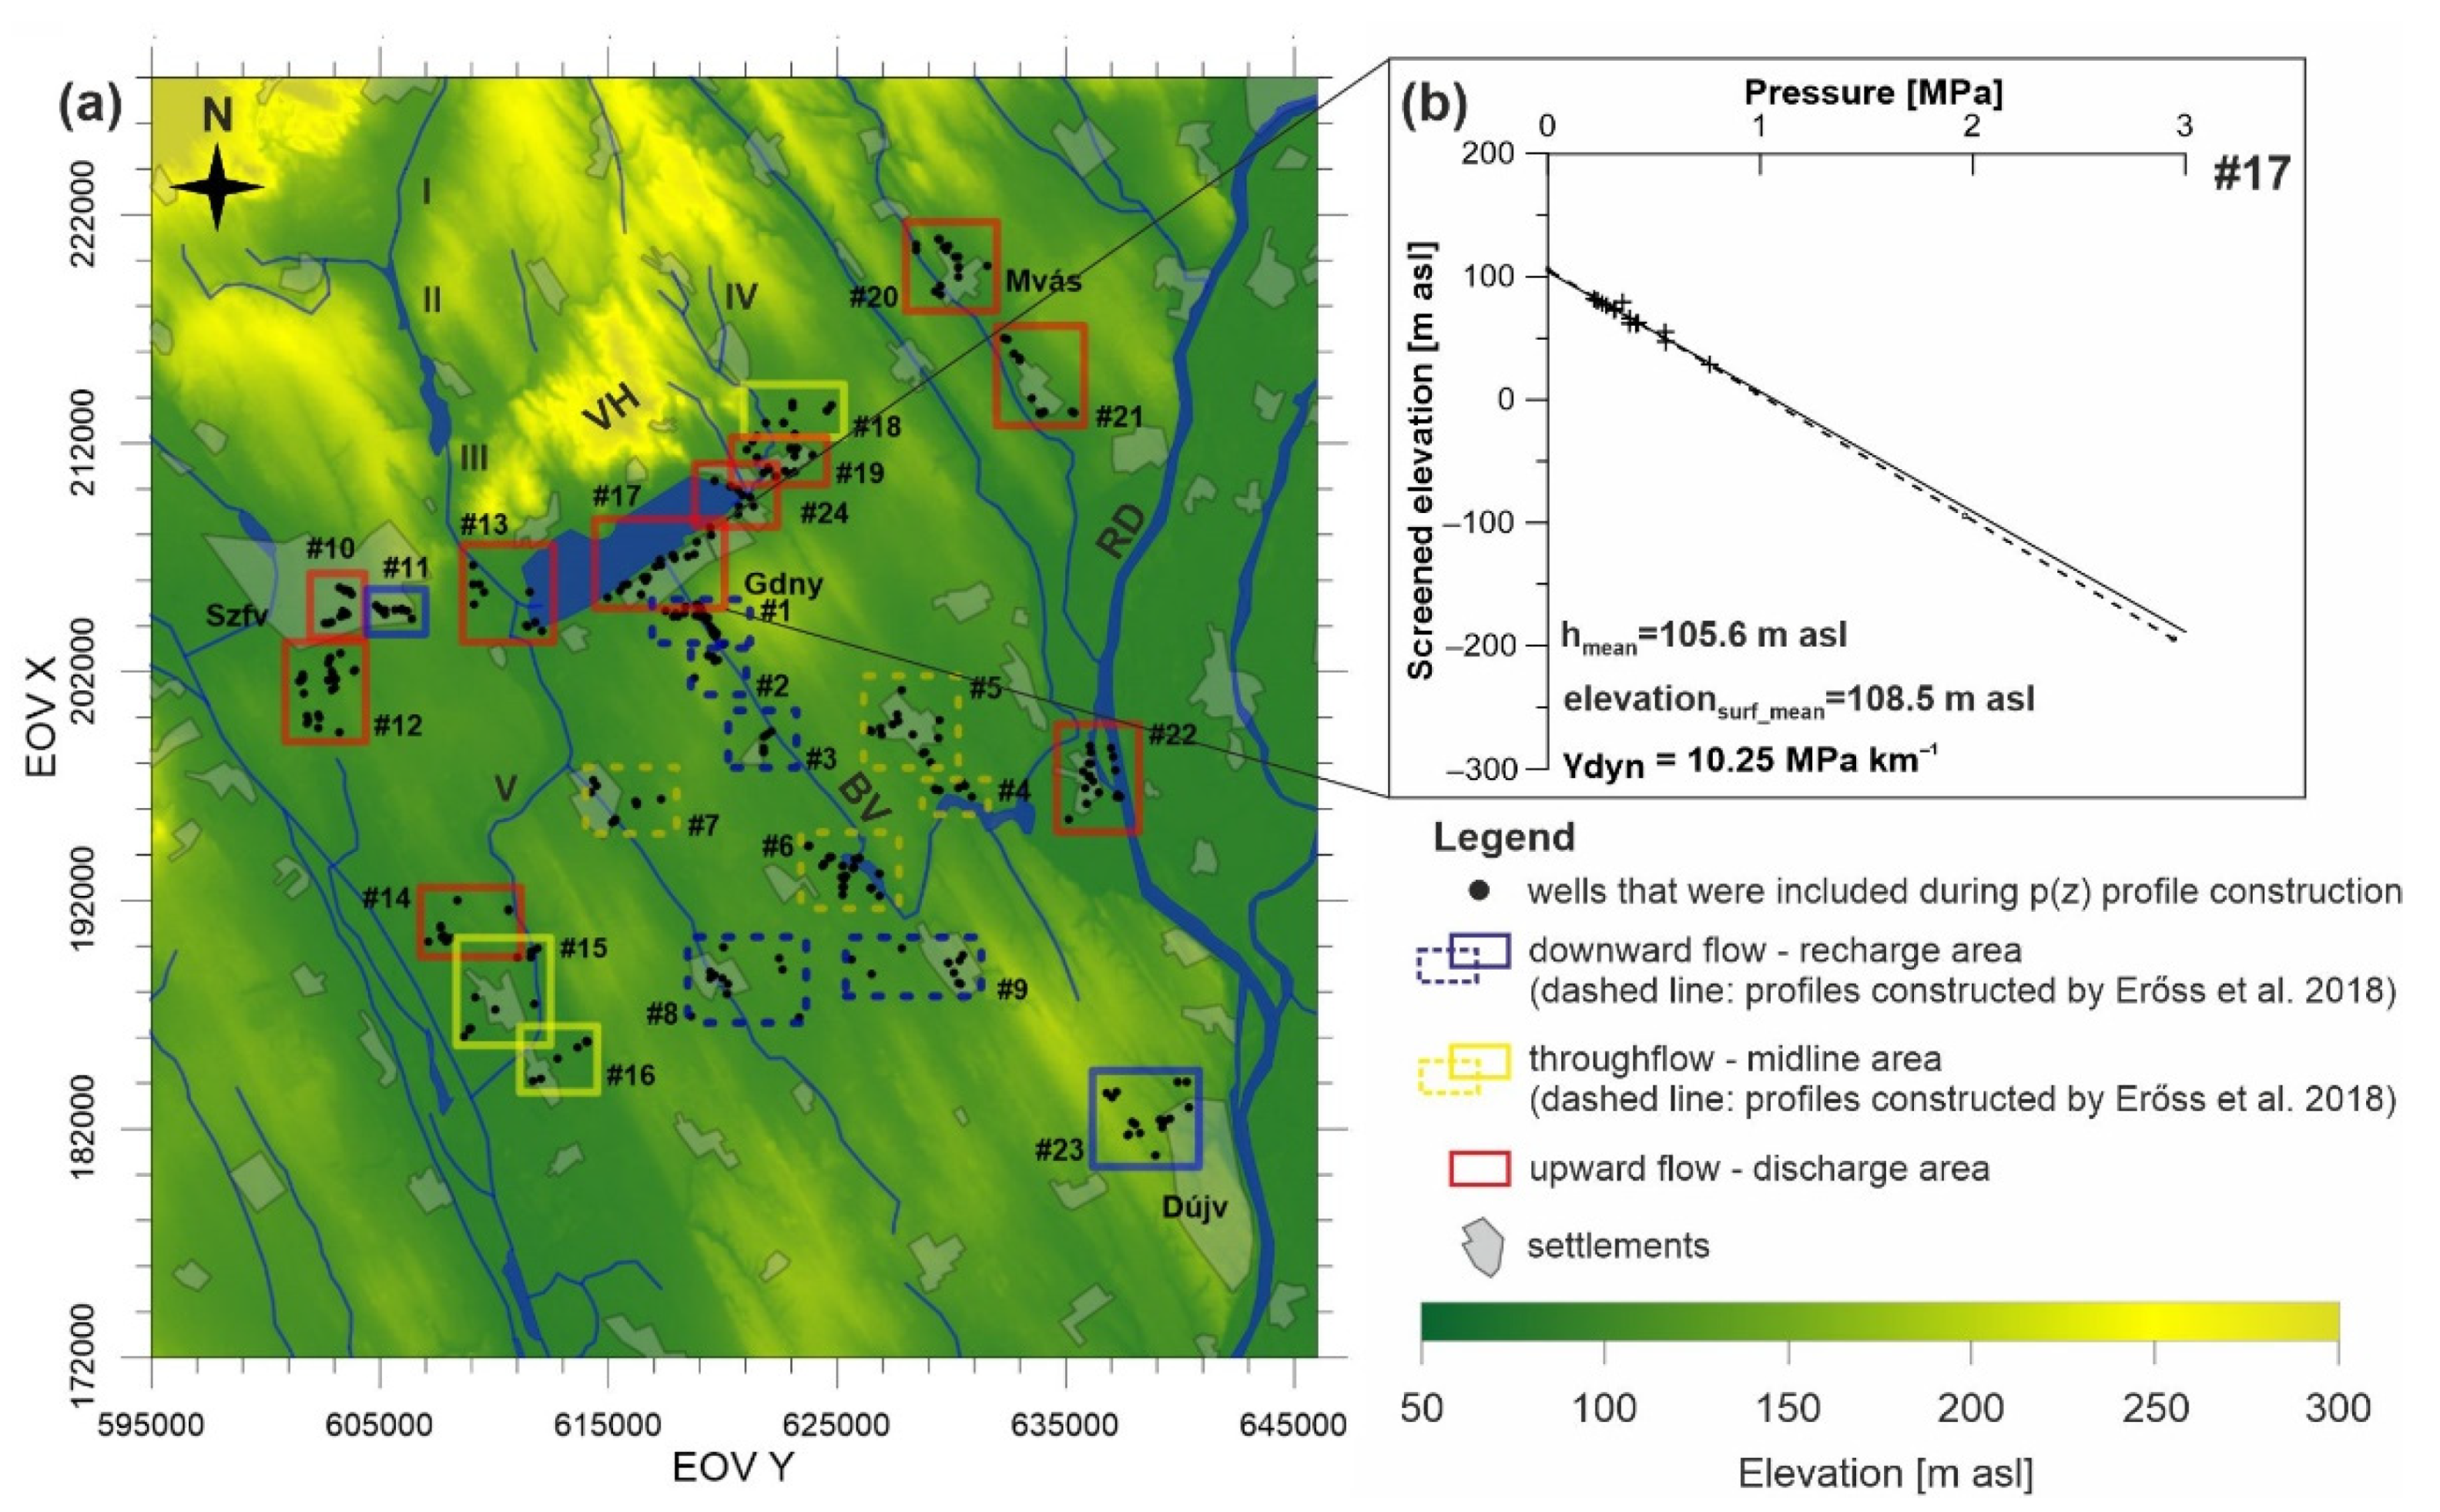
To determine the vertical groundwater flow directions, 15 p(z) profiles were constructed in the study area based on the data distribution and the areas of interest. Previously, 9 p(z) profiles were compiled by [
29] in the southern foreland of Lake Velence (#1–#9). These profiles were also incorporated in the data evaluation and interpretation (the numbering of the p(z) profiles compiled during this study starts with #10). The properties of the constructed profiles can be found in
Table S2 of the SMs and
Figure 3 summarizes their results. The vertical pressure gradient (γ
dyn) was higher than hydrostatic (9.98–10.34 MPa km
−1) in case of the 10 p(z) profiles, namely: #10, #12, #13, #14, #17, #19, #20, #21, #22, #24 meaning upward flow in their area. γ
dyn was close to hydrostatic (9.81 ± 0.5 MPa km
−1) in case of p(z) #15, #16, #18 identifying midline areas. In p(z) areas #11 and #23, γ
dyn was lower than hydrostatic (9.11 and 9.58 MPa km
−1, respectively) referring to downward flow direction (i.e., recharge areas). These latter two p(z) profiles #11 and #23 have the highest average surface elevations (127.9 and 146.5 m asl, respectively). The discharge regime areas correspond well with the areas with the lowest surface elevations (98.9–115.5 m asl) and with the surface water bodies (i.e., Lake Velence, River Danube, and small creeks).
3.1.2. Tomographic Potential Maps
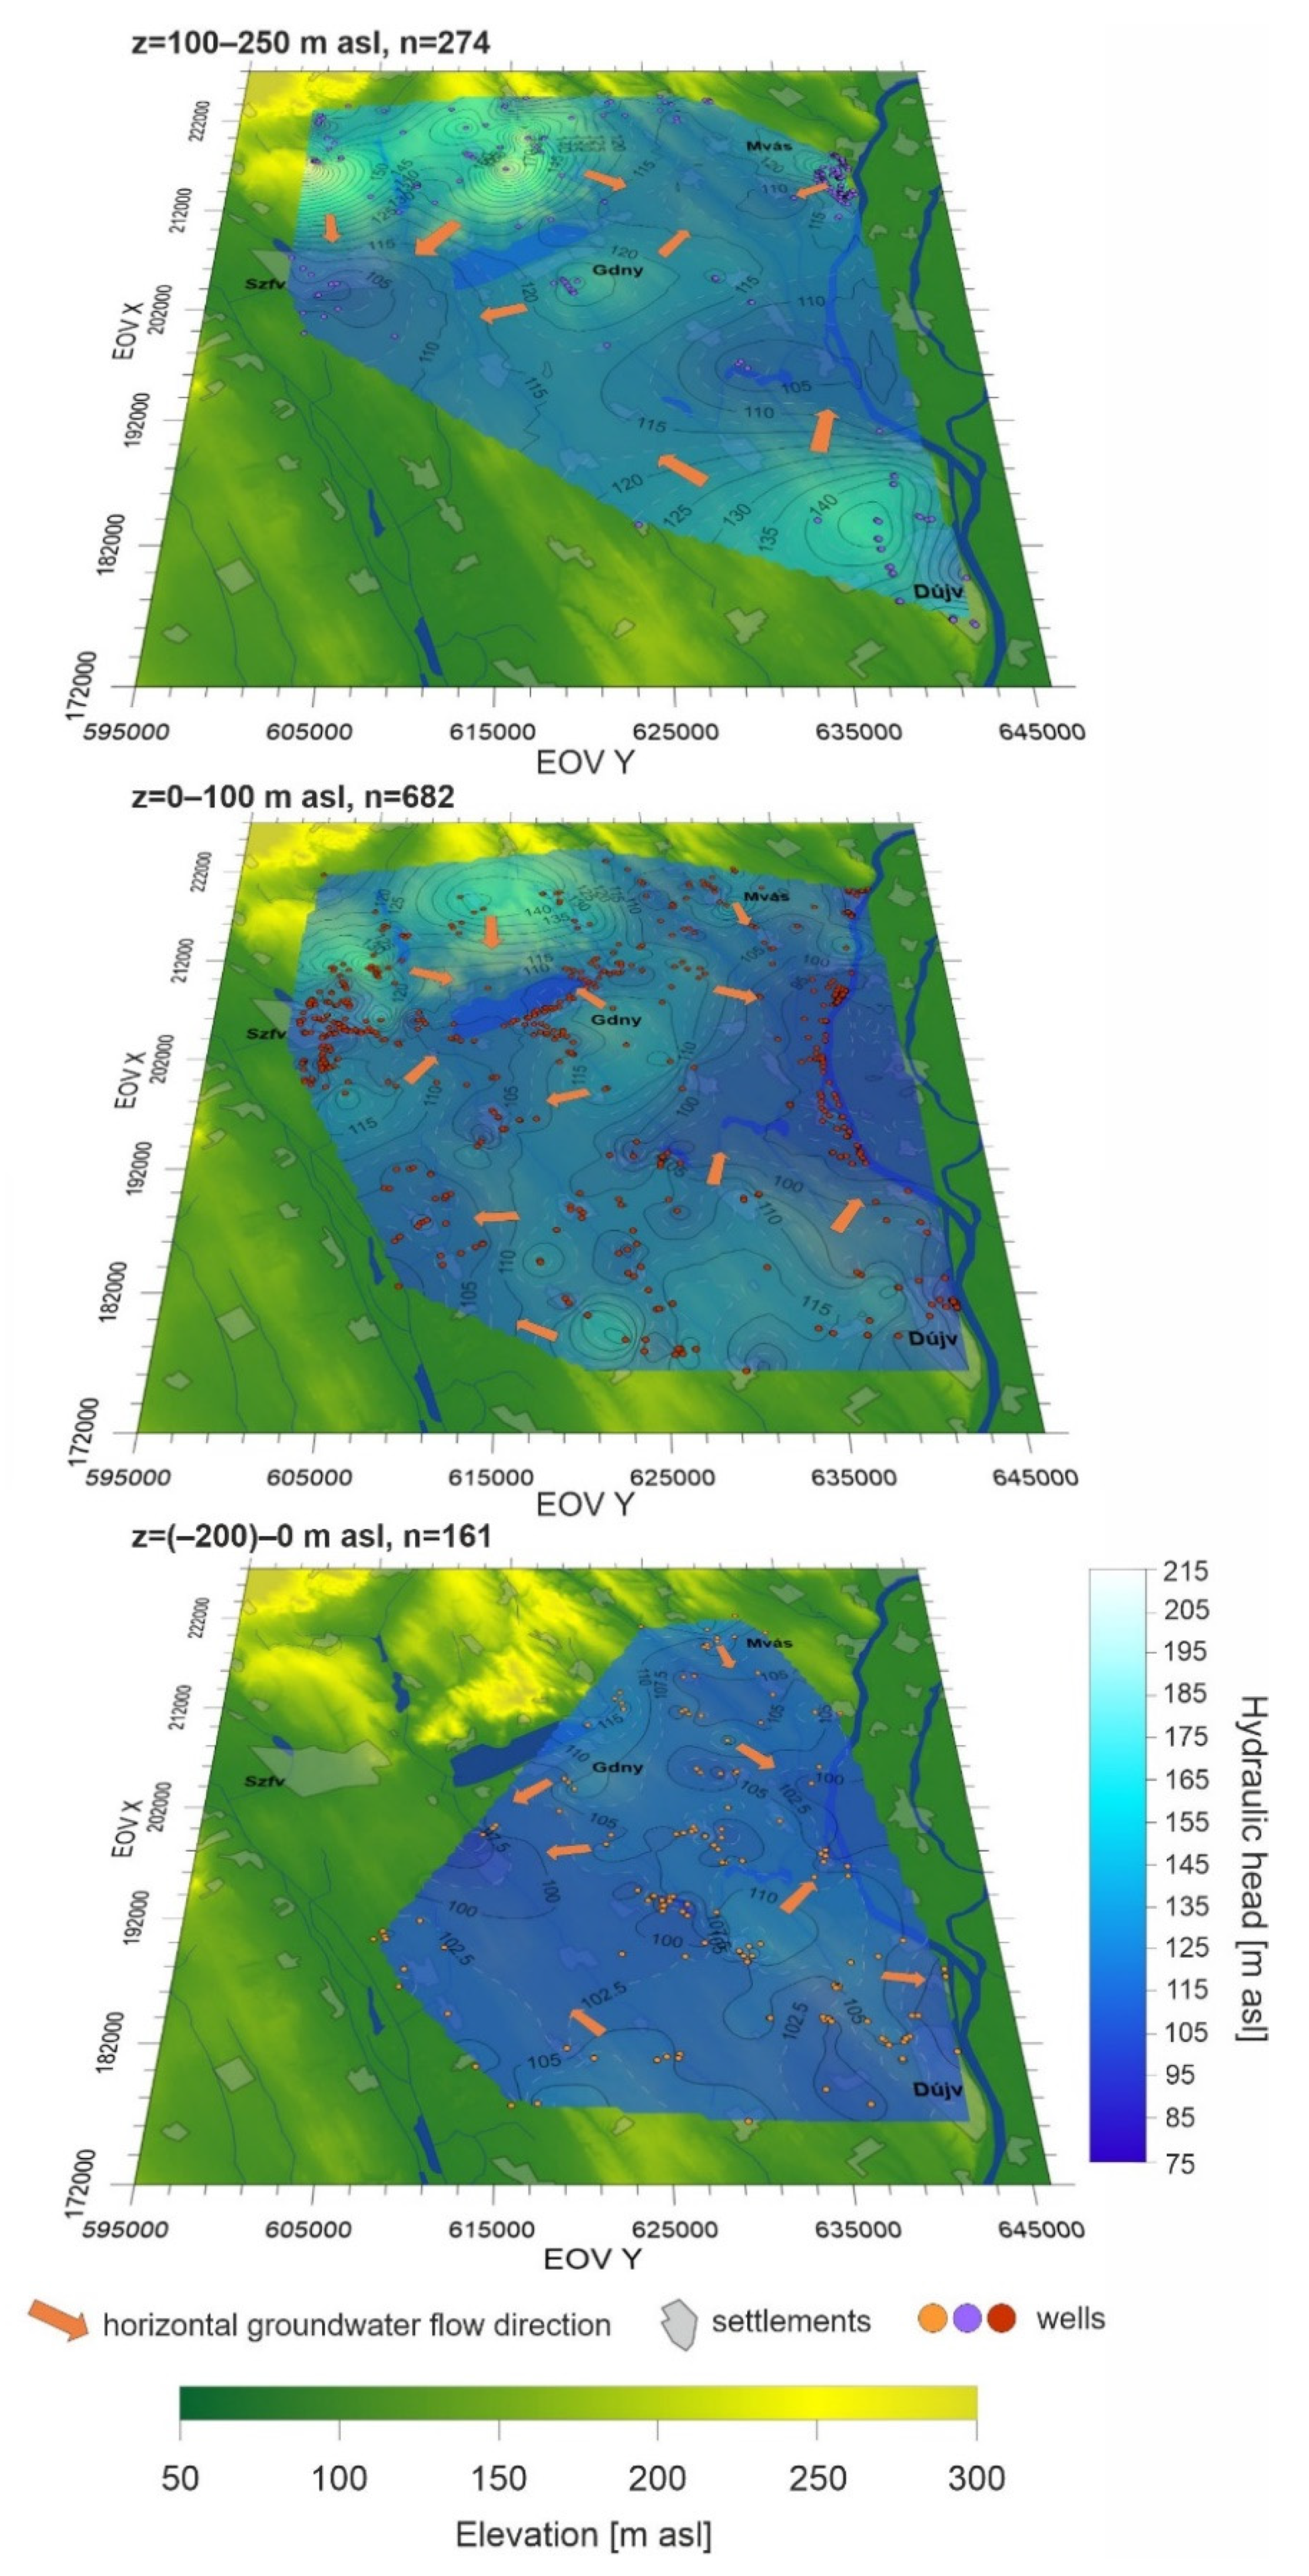
With regard to the vertical distribution of hydraulic head data (i.e., screened elevation of the wells,
Figure 2), three tomographic fluid-potential maps were compiled for the elevation intervals of z = −200–0 m asl, 0–100 m asl, and 100–250 m asl. Given the number of data points (i.e., 682 wells) and the spatial distribution of the well data, the map constructed for the z = 0–100 m asl interval gives the most detailed picture of the horizontal groundwater flow pattern. The uppermost map (
Figure 4) lacks data in the SW part of the study area, whereas no data were available from the NW part of the area on the lowermost map.
On the tomographic maps z = 0–100 m asl and z = 100–250 m asl, the fluid-potential distribution roughly follows the topography, i.e., higher hydraulic head values coincide with topographically elevated areas (e.g., Velence Hills, the vicinity of Martonvásár, Gárdony and Dunaújváros settlements), while lower hydraulic head values coincide with lower areas (vicinity of Székesfehérvár settlement, small creeks south from Székesfehérvár, Lake Velence). On both maps, the minimum fluid-potential values follow the course of the Danube. Given the well data distribution, the potential map constructed between 0 and 100 m asl may give reliable information on Lake Velence’s role in the groundwater flow system. Based on this segment the lake acts as a local potential minimum, thus the horizontal component of groundwater flow points toward the lake. On the same map, it can be observed that groundwater flows toward the former Lake Nádas. It means that this former branch of Lake Velence still receives groundwater despite it has no surface appearance anymore because it had been drained artificially at the end of the 18th century. Based on the flow pattern, the groundwater flow system has not adjusted to the modified boundary conditions. Overflowing wells observed in this area also indicate groundwater discharge.
Due to the lack of data, the lowest map (z = (−200)–0) gives information only from the E–SE part of the study area. The highest hydraulic head values can be found in the vicinity of Gárdony settlement, while the lowest hydraulic head values coincide with the settlement located a few kilometers south from the former Lake Nádas and with River Danube.
The range of hydraulic head values decreases with depth; the range of h is 83–215 m between z = 100–250 m asl, h = 79–173 m between z = 0–100 m asl and h = 89–121 m between z = −200–0 m asl. According to Darcy’s Law, hydraulic head differences per unit length give the hydraulic gradient that is positively correlated with the groundwater flux. Decreasing hydraulic head differences mean decreasing hydraulic gradient and thus decreasing groundwater flux with depth. This means slower horizontal groundwater flow in deeper regions (z = (−200)–0).
As there are more data points in the shallow region, a more detailed picture of the flow pattern was given than in greater depth. There are several areas with local fluid-potential maximum (e.g., Velence Hills, Dunaújváros, Gárdony, and Martonvásár) and minimum (e.g., Lake Velence, River Danube, and small creeks). Since gravity-driven groundwater flow flows from areas with higher fluid potential toward areas with lower fluid potential, that could indicate multiple local flow systems in the shallower region (z = 0–250 m asl). On the other hand, the lower hydraulic gradient and the greater depth interval (z = −200–0 m asl) could indicate regional groundwater flow systems that flow from NW to SE and from N to SW. In other words, the groundwater flows toward Lake Velence and the other surface water bodies on the local scale and toward the lowland in the surroundings of the former Lake Nádas and toward River Danube on the regional scale.
3.2. Hydrochemistry and Physicochemical Properties Measured On-Site
Tables S1, S3 and S4 of the SMs include the results of the water chemistry analysis and on-site measurements. Most of the collected samples are characterized by low mineralization (367–899 µS cm
−1). The highest EC values were measured in surface water samples nr. 11 and 16 (1489–5095 µS cm
−1, respectively) and in groundwater samples nr. 9 and 13 which were taken from wells located in agricultural areas (1297–1657 µS cm
−1, respectively).
Since total dissolved solid content (TDS) of the water positively correlates with the EC value measured in the water, these four samples have the highest TDS among the collected samples (960–3238 mg L
−1). Compared to the others, these four samples are characterized by anomalous chloride and sulfate concentration (up to 1000 mg L
−1). In case of lake samples, these results can be related to the high rate of evapotranspiration. Evapotranspiration may also lead to the extremely high concentrations of other major ions in Lake Velence. The high dissolved solid content of groundwater sample nr. 13 is most likely related to the agricultural activity (i.e., using fertilizers and manure), which is also reflected by its high nitrate content (200 mg L
−1). In case of sample nr. 9, the nitrate concentration is below the detection limit of 0.5 mg L
−1, though the Na
+, K
+, and Ca
2+ concentrations are relatively high and that may refer to natural causes (i.e., longer residence time of groundwater). In addition to these samples, spring water nr. 17 has a relatively high sulfate content as well (120 mg L
−1). Since the spring is located in an urban area, there might be anthropogenic causes of the high sulfate content. Measured nitrate concentration of 44 mg L
−1 can also indicate such effects. Rest of the groundwater samples have rather uniform water chemistry. Major ion concentrations (except in outliers nr. 9 and 13) are characterized by low relative standard deviation (0.19–0.69), among which SO
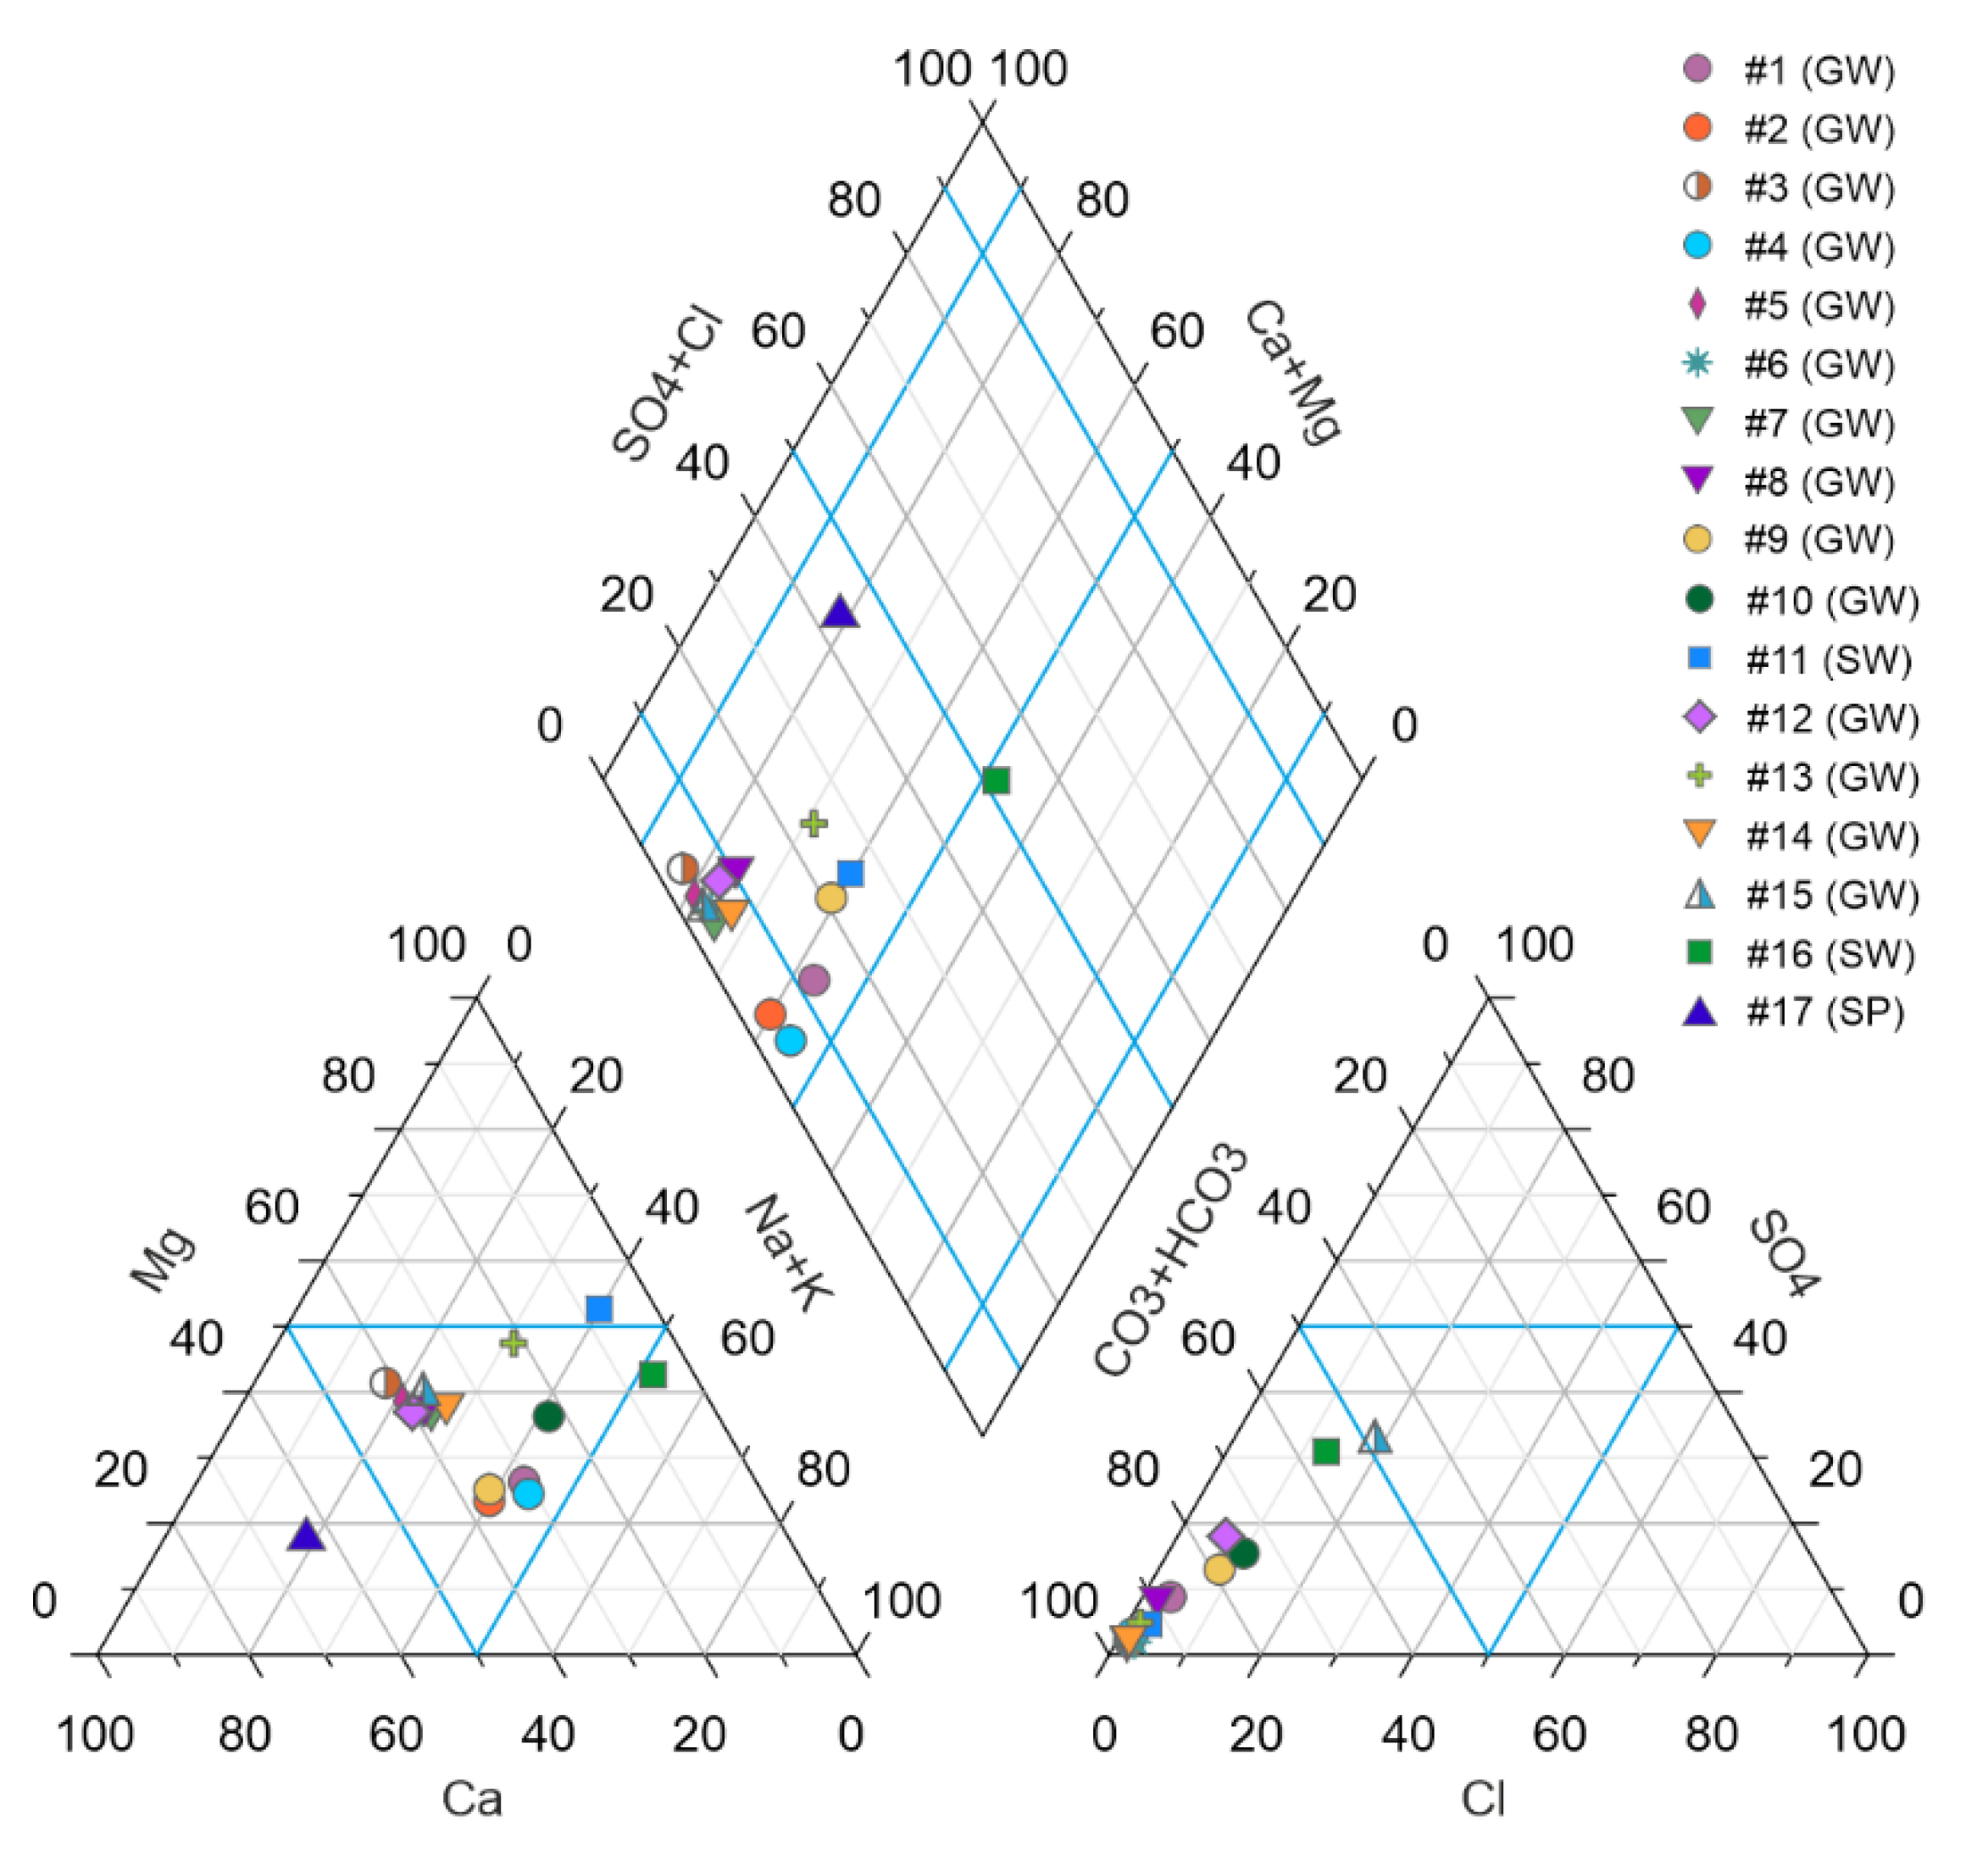
42− shows the highest variation (0.69). Relative standard deviation values indicate low variation despite the wide elevation interval of −169–79 m asl from which samples were taken. Majority of groundwater samples belong to Ca–Na–HCO
3–Cl–SO
4 and Ca–Na–HCO
3 water types and are characterized by no dominant cation and by the dominance of HCO
3− anion (
Figure 5).
Based on the measured temperature, water samples with different origins can be distinguished. Lowest temperature (11.7 °C) was measured in the spring in Velence Hills, whereas the highest temperature characterizes surface waters (24.8–28.7 °C). Groundwater samples have a similar temperature (14.0−20.1 °C), no outliers were measured.
No relationship was found between elevation and temperature (Pearson’s R = 0.023 and related P = 0.93, Spearman’s rho r = −0.107 and related p = 0.683) while elevation shows a weak correlation with EC (R = 0.270, P = 0.295, r = 0.472, p = 0.056) and TDS (R = 0.288, P = 0.263, r = −0.397, p = 0.114).
The pH of groundwater samples is semi-neutral (7.19–7.54), whereas surface waters nr. 11 and 16 are more alkaline (8.18–9.20). This is also reflected by their higher HCO3− concentration (724–1448 mg L−1).
As for the ORP values, positive ORP values were measured in 13 of the 17 samples referring to an oxidizing environment (51.4–273.5 mV). In the case of the remaining four samples (nr. 1, 2, 4 and 10), negative ORP values were recorded indicating reducing conditions (−128–(−59.8) mV).
3.3. Radionuclide Measurements
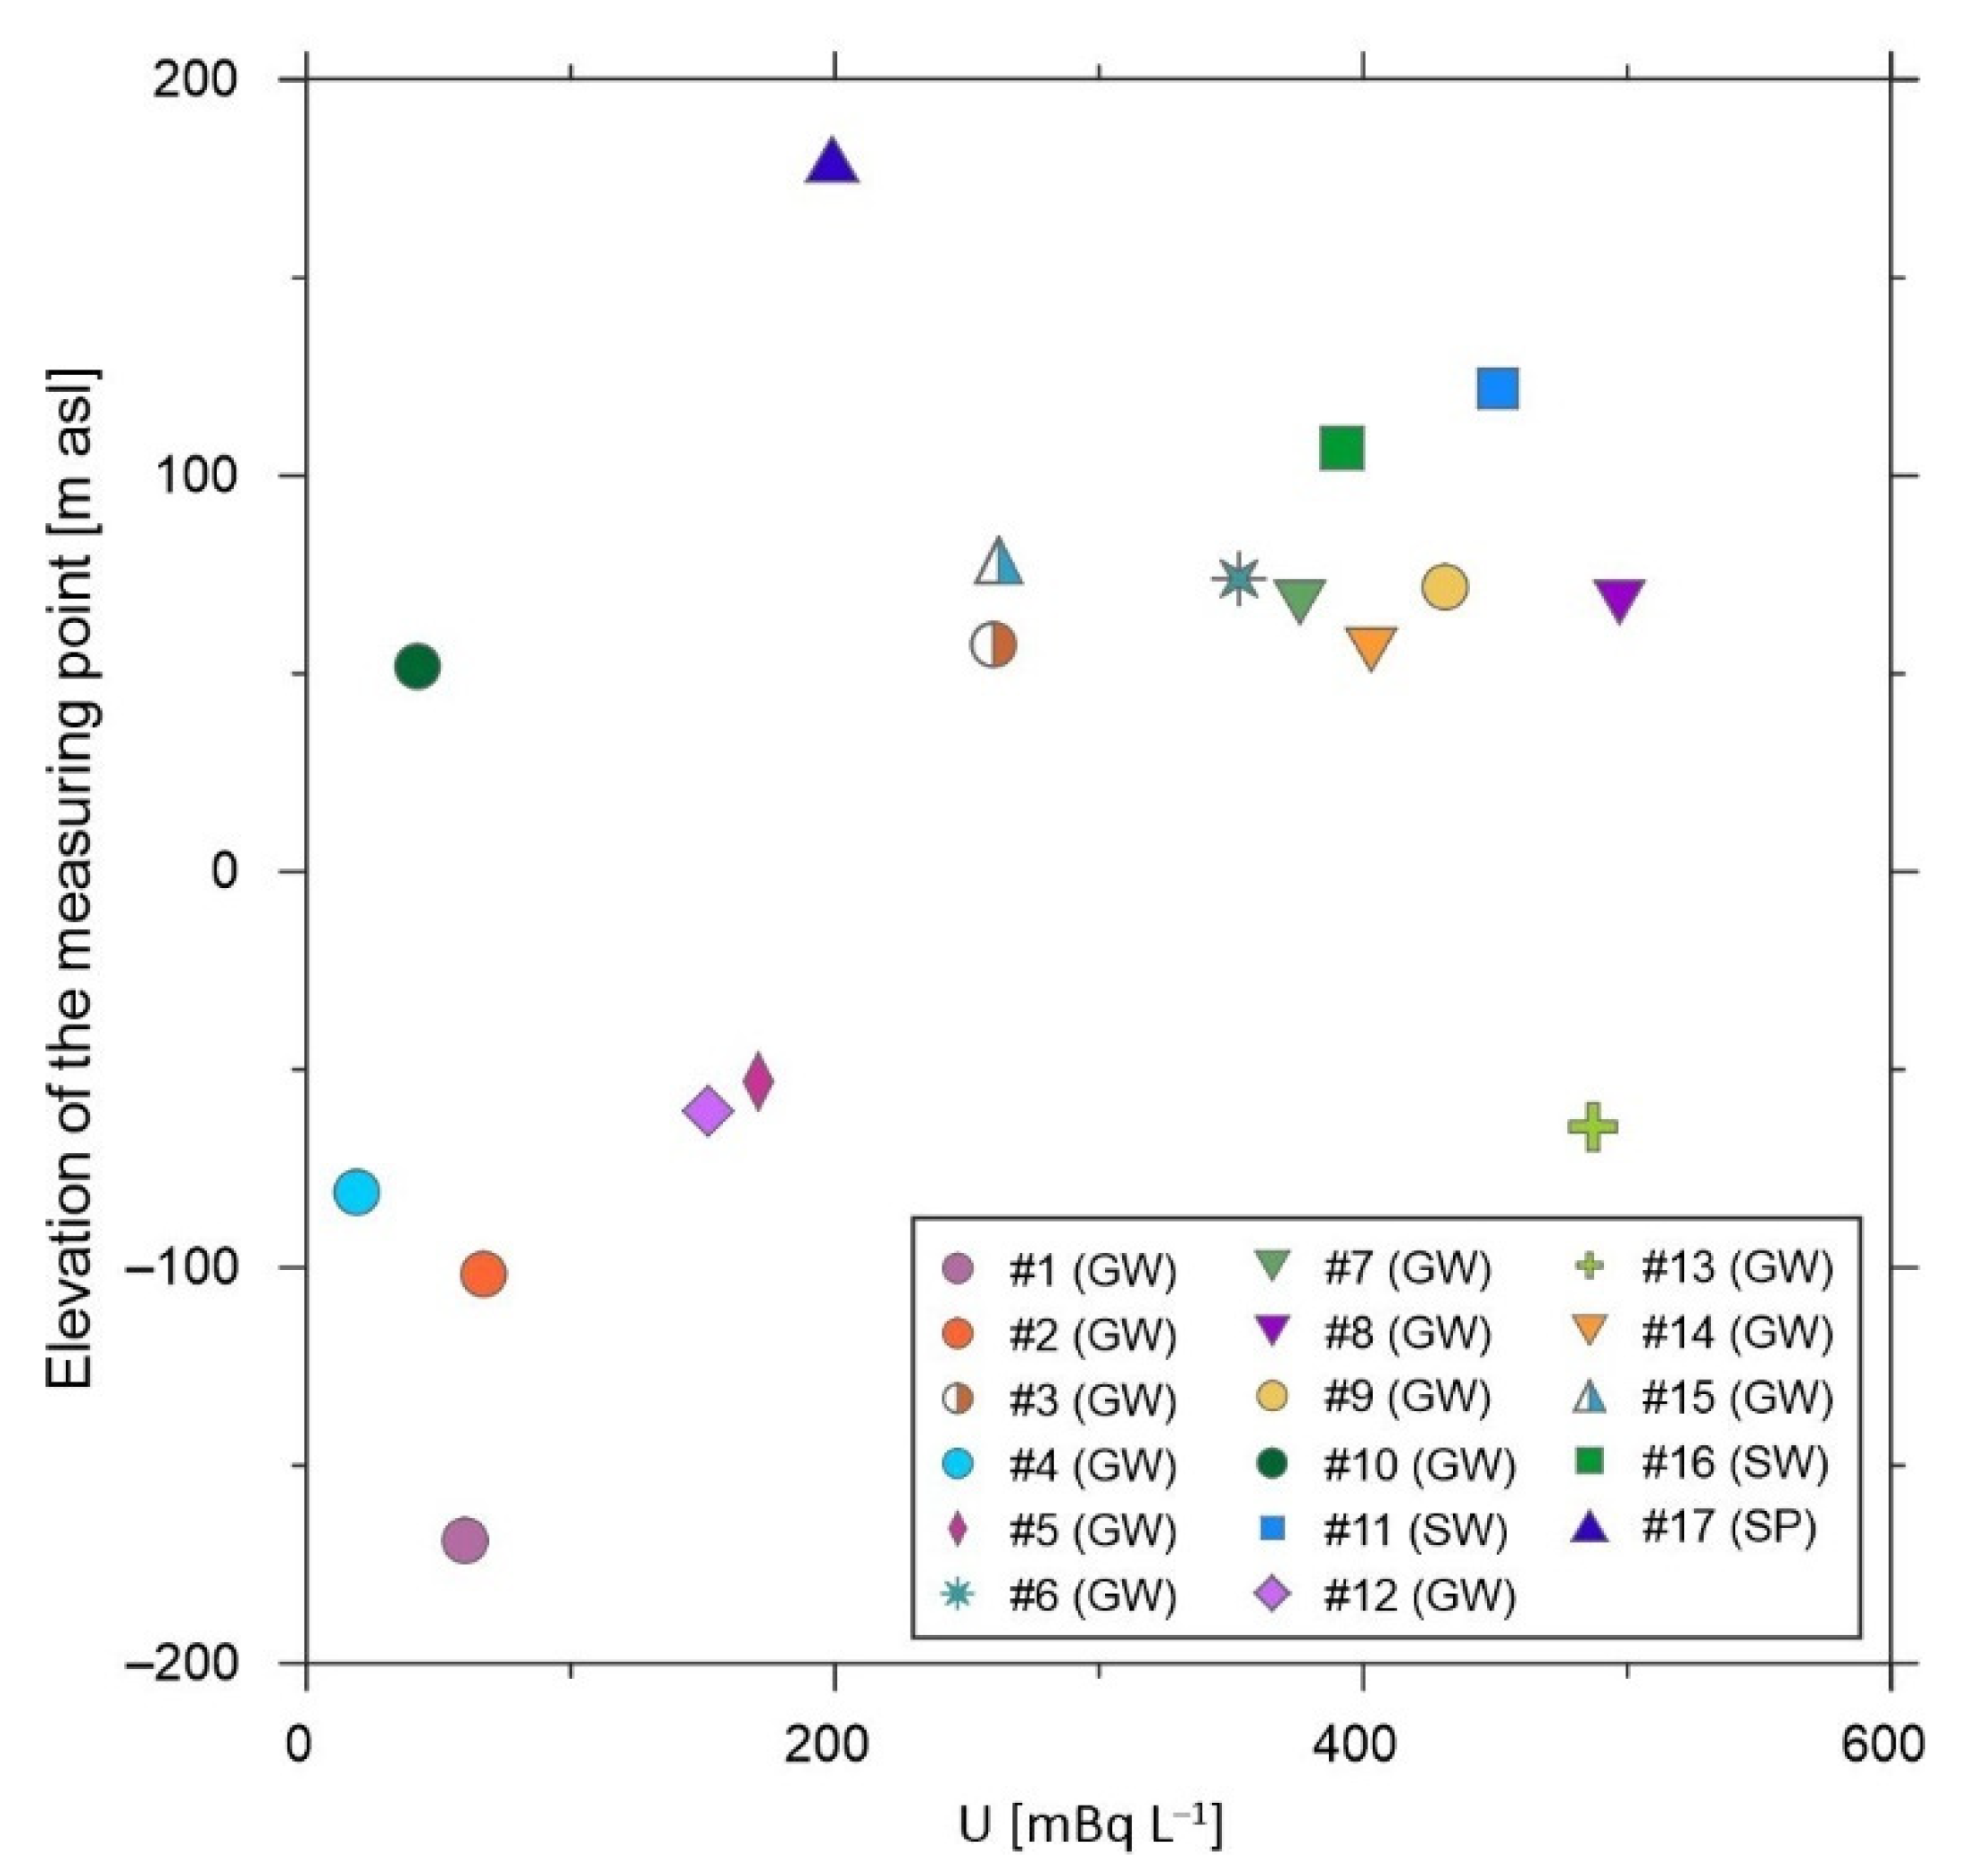
In the analyzed samples, ΣU was measured in the highest activity concentration (up to 487 mBq L
−1) in all sample types (
Tables S1 and S5 of the SMs). The highest activity was measured mostly in groundwater samples taken from 50 to 100 m asl elevation interval (
Figure 6). A weak-moderate relationship can be observed between measured uranium activity and changes in elevation (R = 0.53, P = 0.029, r = 0.513,
p = 0.035) and a similar positive relationship exists between ORP and uranium activity (R = 0.646, P = 0.005, r = 0.5,
p = 0.041), given that uranium is mobile under oxidizing conditions. Relatively high uranium activity (152–497 mBq L
−1) was measured in all samples in which positive ORP was recorded, while the other samples with negative ORP show lower activity (up to 67 mBq L
−1).
226Ra activity was around or barely higher than the detection limit of 5 mBq L
−1 in samples nr. 3–8 and 10–17. While relatively high
226Ra activity was measured in samples nr. 1, 2, 4 and 9 along with negative ORP. Among these samples, remarkably high
226Ra activity of 999 mBq L
−1 was determined in sample nr. 9, whose location is close to the former branch of Lake Velence (
Figure 1. Lake Nádas).
222Rn activity of the samples was also relatively low (below 35 Bq L
−1). Highest
222Rn activity was measured in samples nr. 9 and 17 (367 and 326 Bq L
−1, respectively). Given the measured low
226Ra and
222Rn activities, no correlation was determined between their activity concentration and the elevation.
3.4. Stable Isotope Measurements
Stable isotopic compositions in water are considered conservative and hardly affected by water-rock reactions under normal temperatures [
55]. Therefore, isotopic variations may occur within the catchment area or in the aquifer itself as a consequence of concentration variations in the recharge [
54]. Values of δ
2H and δ
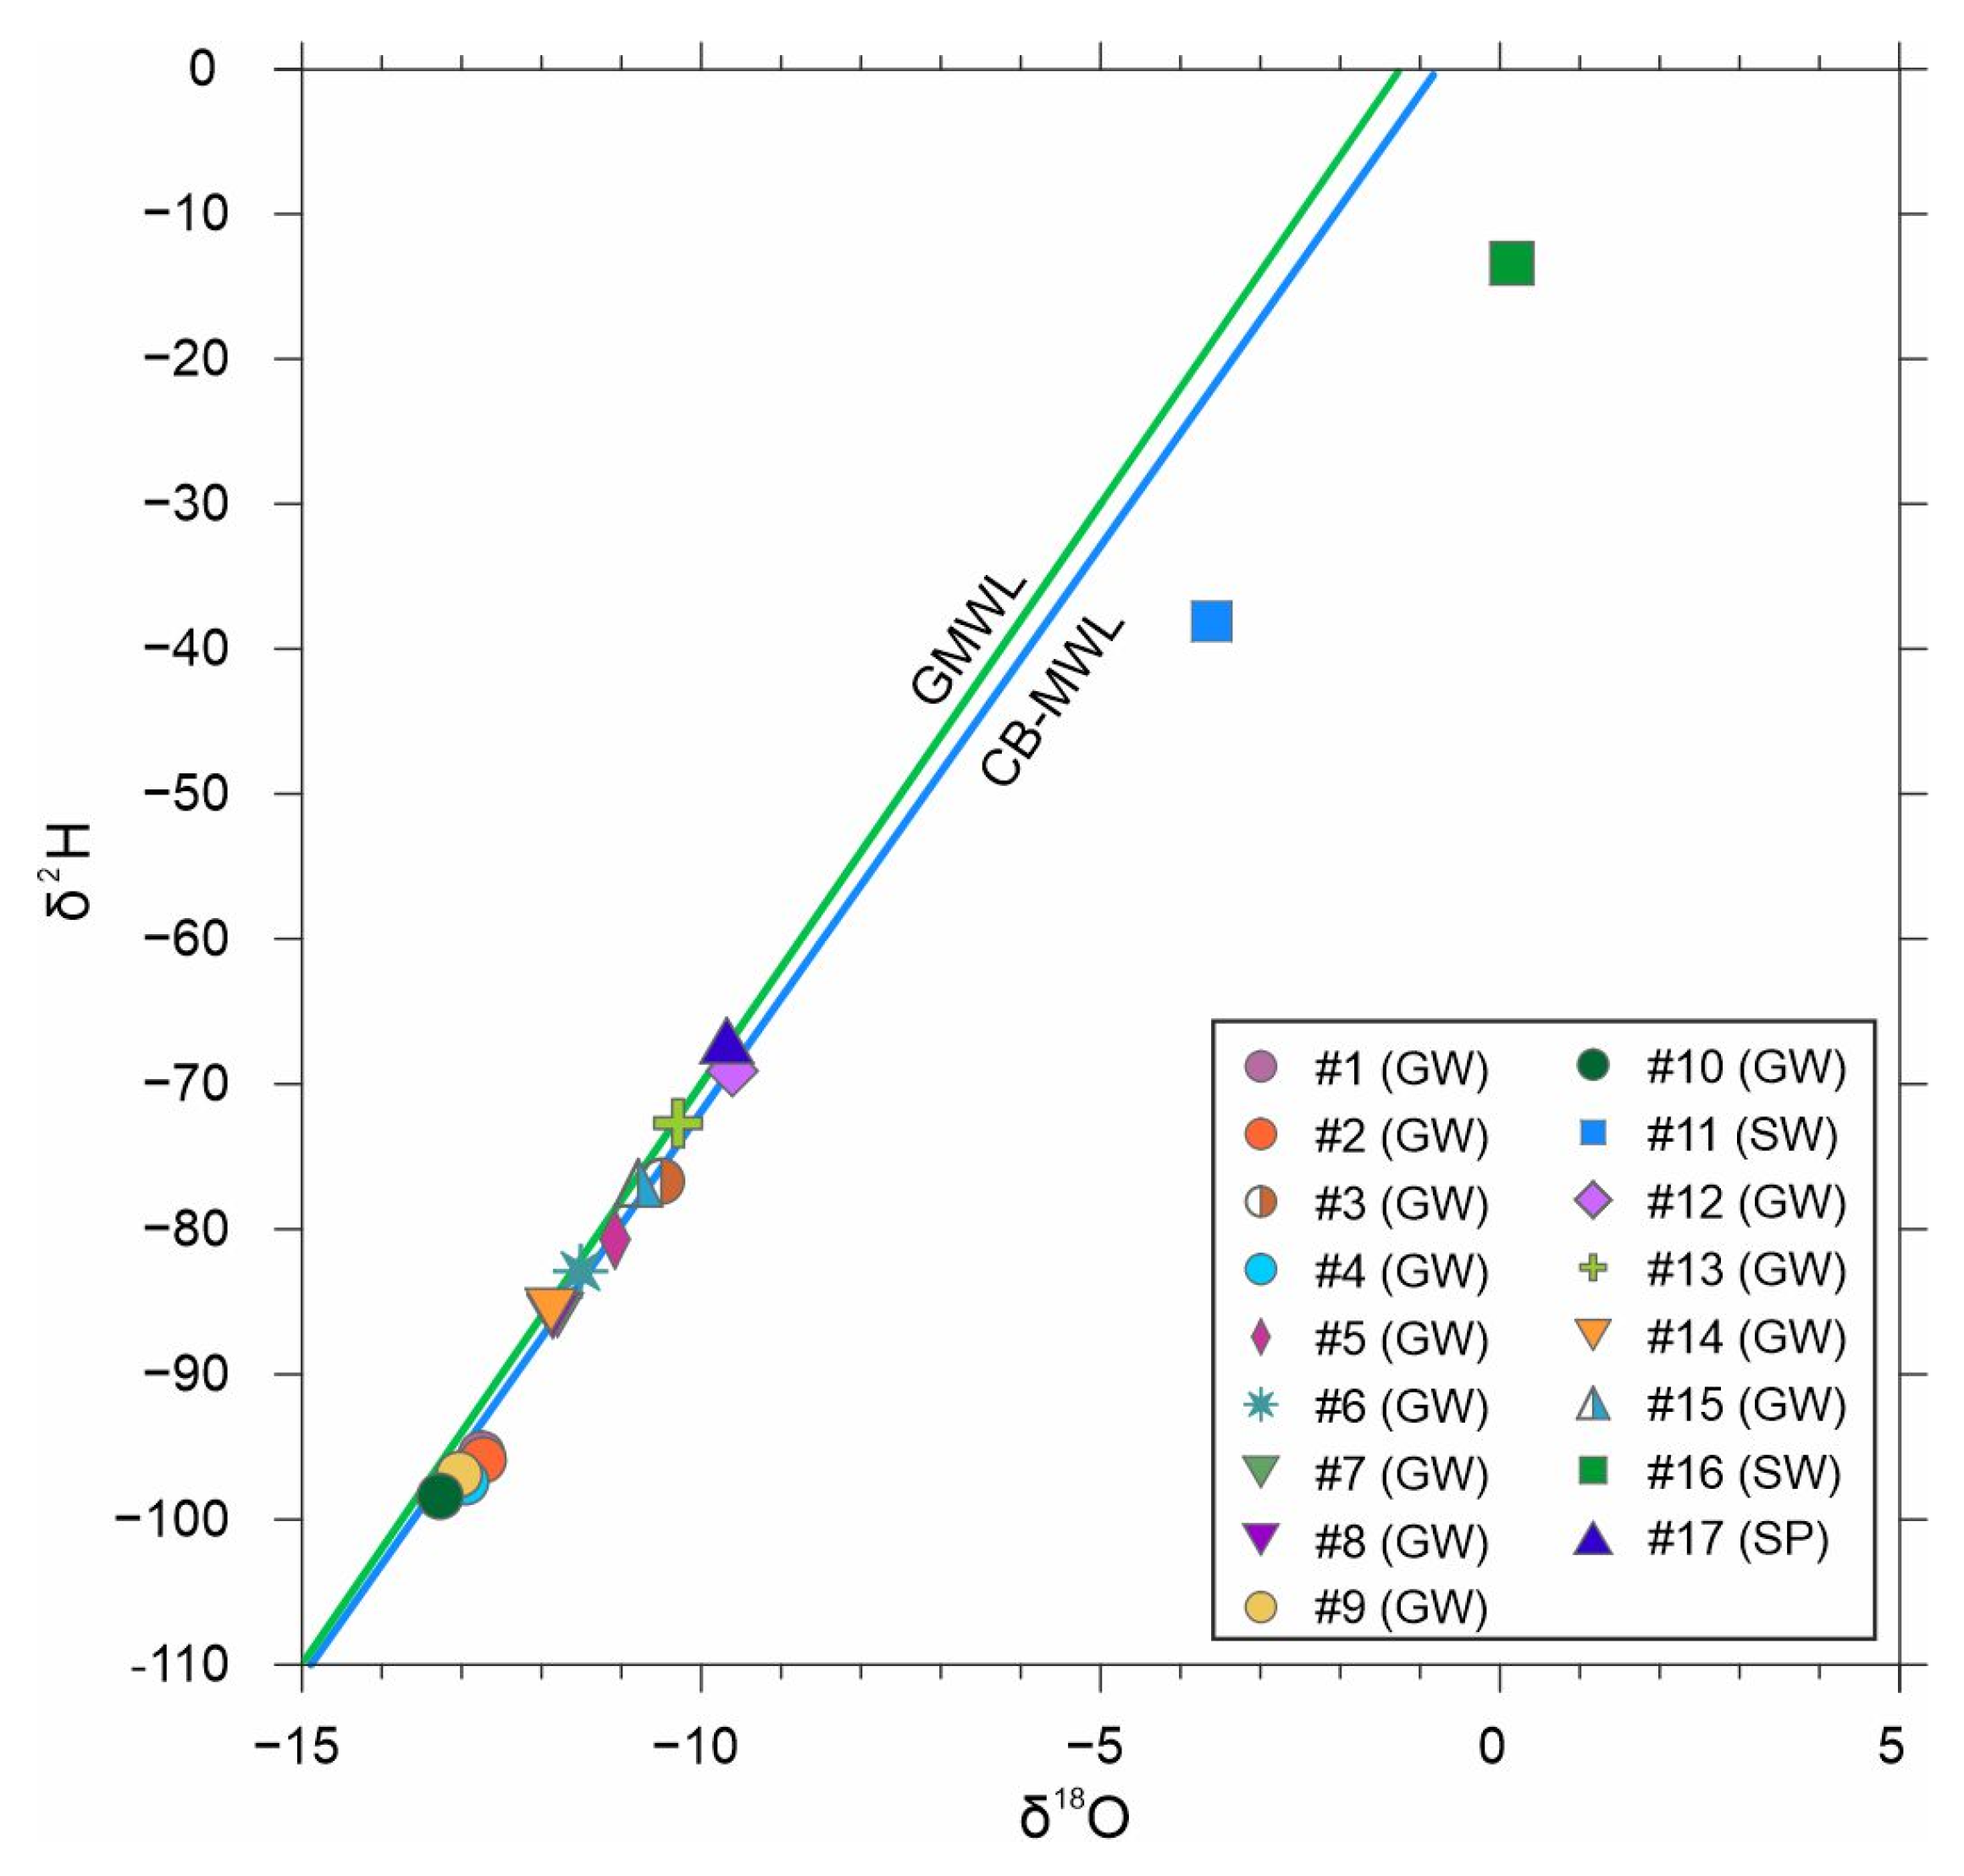
18O in the water samples were plotted in
Figure 7 with the global meteoric water line (GMWL; [
18]) and with a meteoric water line calculated for the Carpathian Basin (CB-MWL; [
56]) since there was no accessible rainwater δ
2H and δ
18O data in the vicinity of the study area to compile a local meteoric water line. CB-MWL is very similar to the GMWL. Values of δ
18O varied from −13.3 to +0.2‰, and δ
2H values had a range between −98.4 and −13.4‰ (
Table S6 of the SMs). Samples taken from the two lakes have significant differences in their isotopic compositions compared to groundwater samples. Heavier isotopes were enriched in these samples (nr. 11 and 16), which can be linked to a higher evaporation rate in surface water bodies. Negative d-excess values (−9.2 and −14.6, respectively) that were calculated from δ
18O and δ
2H values (d-excess = δ
2H − 8 × δ
18O) clearly refer to evaporated surface waters. Groundwater samples nr. 3, 5, 6, 7, 8, 12, 13, 14, and 15 are well distributed along the CB–MWL representing stable isotope values characteristic of precipitation in today’s climate in the Carpathian Basin. Variability in their isotopic composition is probably controlled by the location of the recharge area.
The samples nr. 1, 2, 4, 9, 10 are separated from the other groundwater samples, as they have the most negative values among all groundwater samples. They also present a narrower range of δ2H and δ18O values. That may refer to older groundwater age—recharge of these waters occurred from older rainfall events. The spring sample has a similar isotopic composition as the groundwater samples indicating its direct origin from groundwater (i.e., discharge point of a local flow system).
Based on the results of the stable isotope measurements, no large differences within the Pannonian-Quaternary siliciclastic aquifer system were identified. However, it can be observed that values measured in wells located closer to the local recharge areas are less depleted (nr. 3, 5, 6, 7, 8, 12, 13, 14, and 15) than those situated closer to the discharge areas (nr. 1, 2, 4, 9, 10).
4. Discussion
The results of the present study confirmed that Lake Velence is an integrated part of the groundwater flow system and it is more likely fed by local flow systems.
Construction of tomographic potential maps revealed that hydraulic head distribution in the 0–250 m asl elevation interval roughly follows the surface topography. This indicates that gravity-driven groundwater flow systems exist in the concerned Pannonian-Quaternary siliciclastic aquifer system.
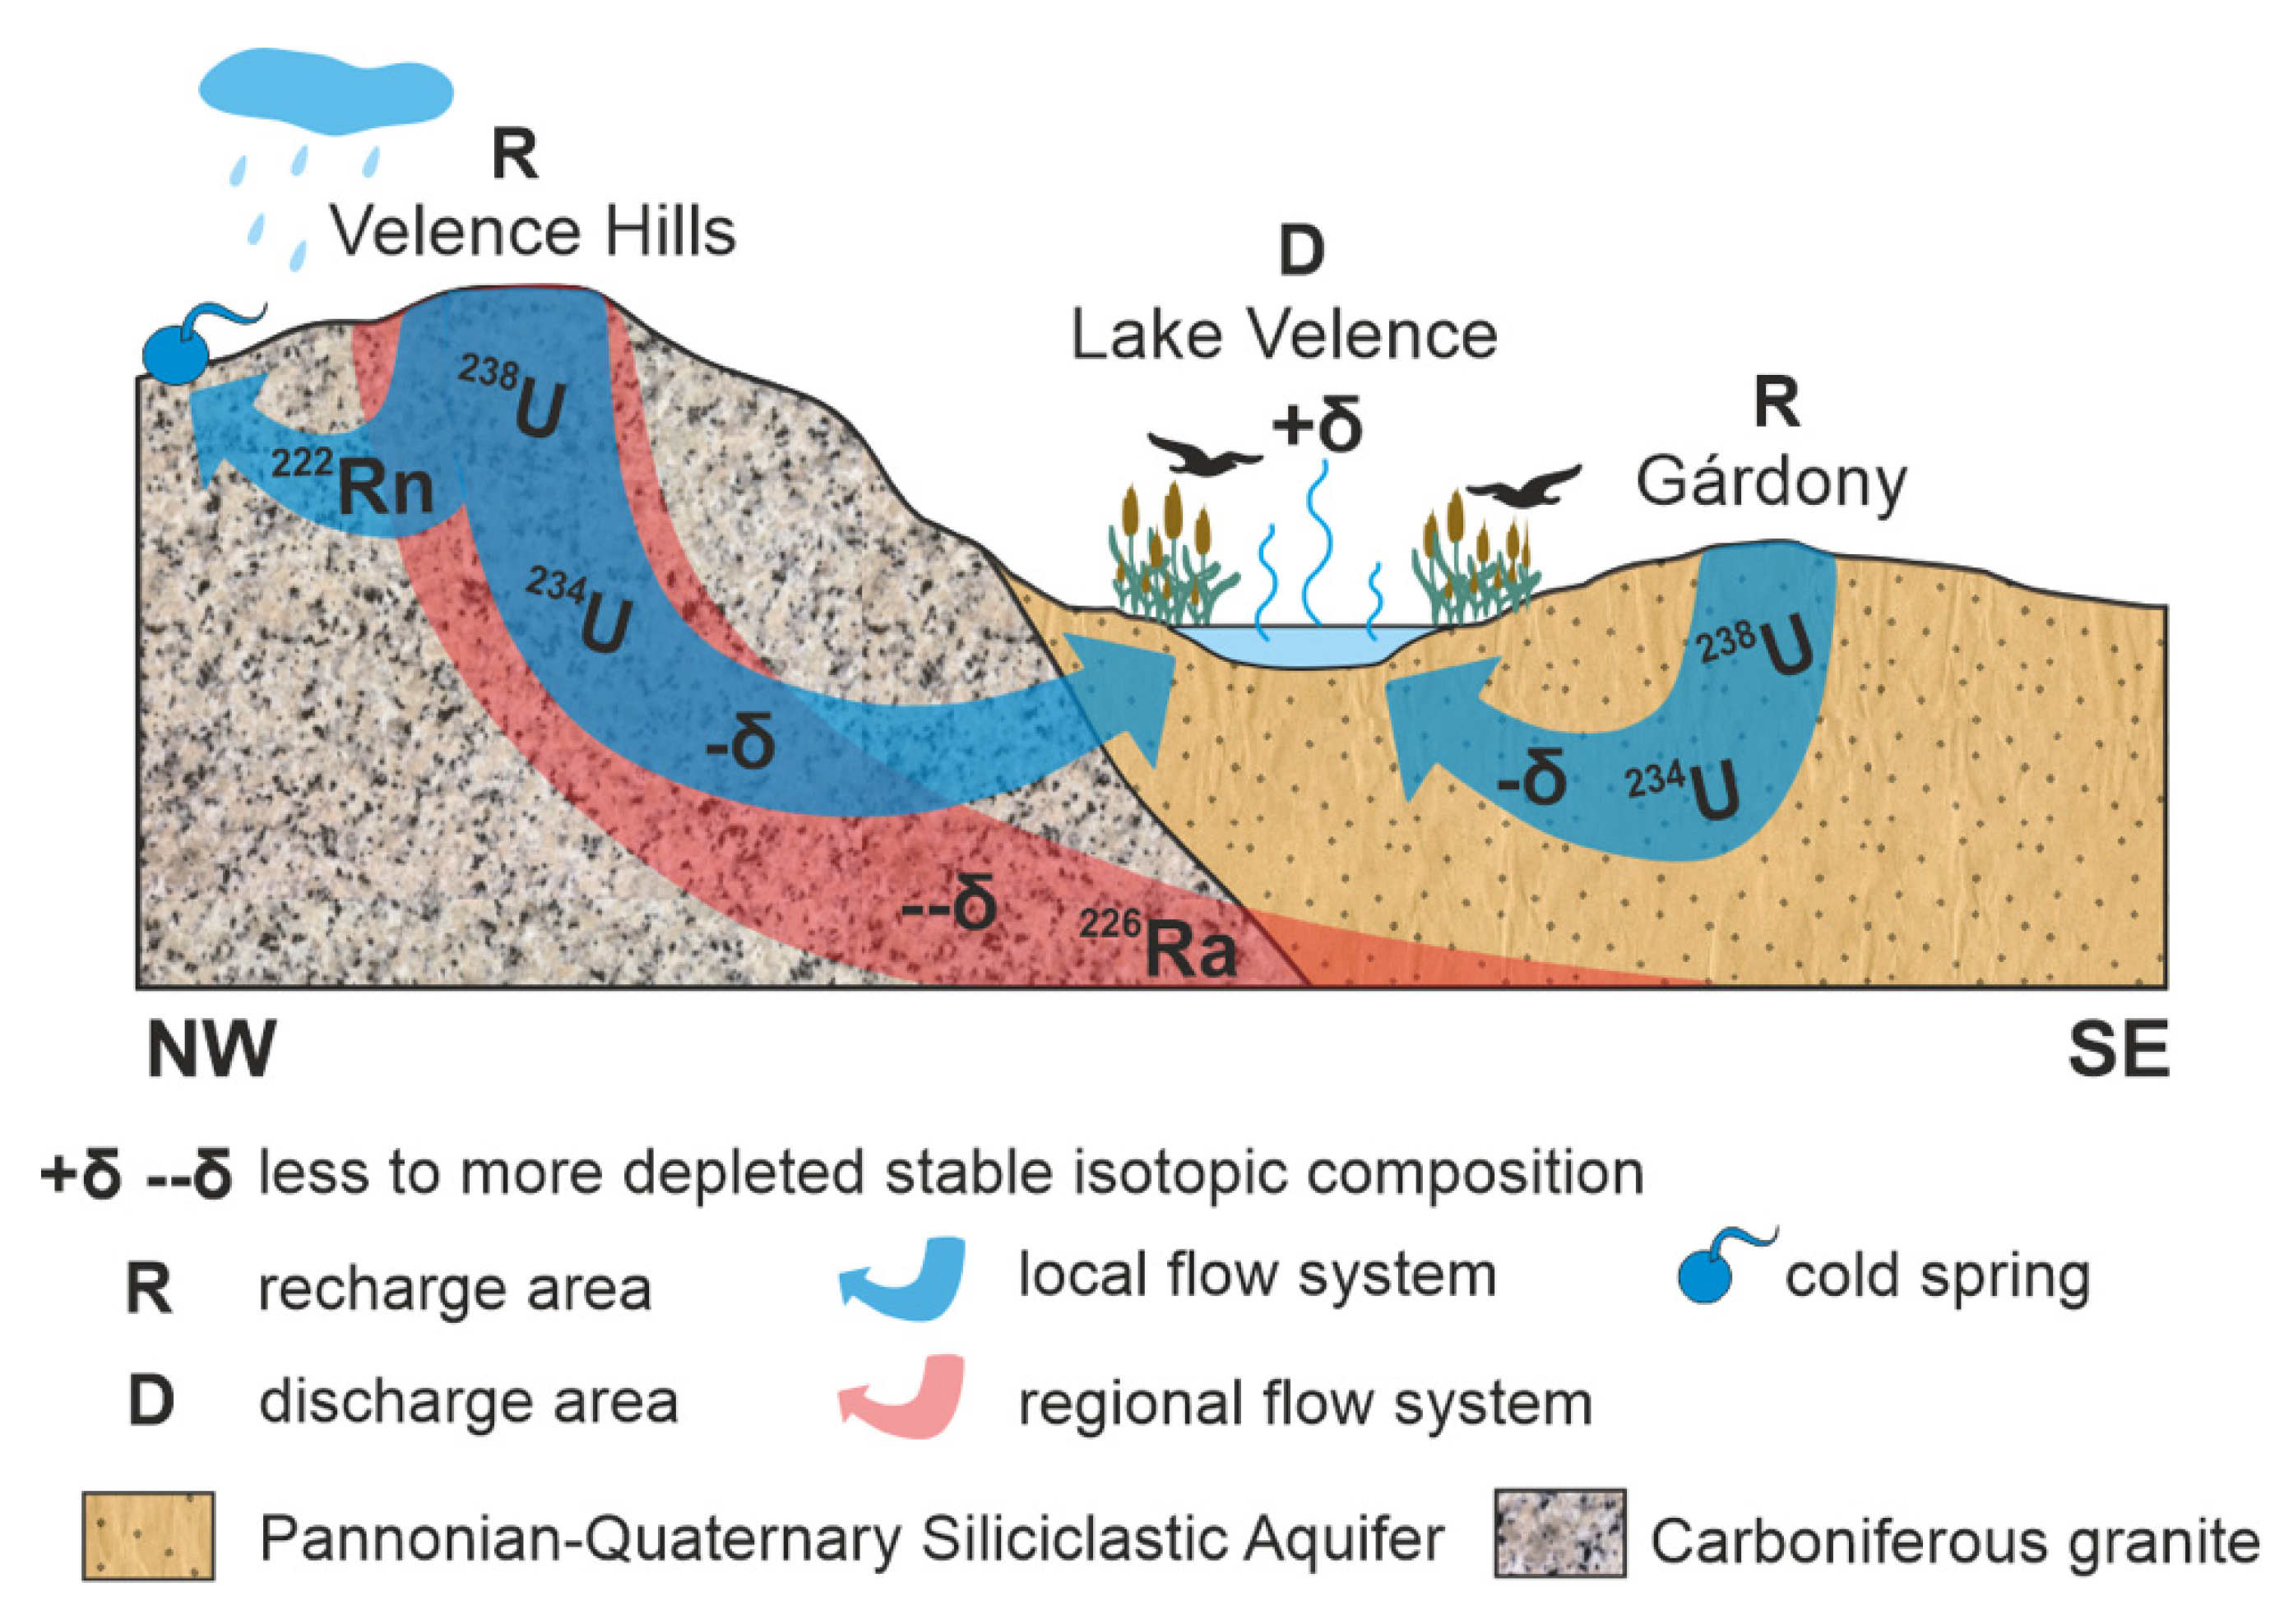
Higher hydraulic head values coincide well with elevated areas (i.e., Velence Hills, vicinity of Martonvásár, Gárdony, and Dunaújváros settlements), while lower values overlap with lowlands (i.e., River Danube, southwestern part of the study area). P(z) profiles constructed during the present study and by [
29] indicate recharge regimes in the vicinity of Székesfehérvár, Gárdony and Dunaújváros settlements and discharge regimes along surface watercourses (small creeks and River Danube) and by the shoreline of Lake Velence. Although no p(z) profiles were compiled in the northern hilly area, it can be assumed that recharge of the aquifer system occurs there as well. By original definition, local flow systems have adjacent recharge and discharge areas, while regional flow systems flow from water divides toward regional erosional bases [
49]. Thus, the results of the basin-scale hydraulic evaluation were interpreted as the following: (1) in shallow depth (0−250 m asl) local flow systems may flow from elevated areas toward adjacent lowlands e.g., from Velence Hills toward Lake Velence, from Gárdony toward Lake Velence; (2) in greater depth (below 0 m asl) regional flow system may flow from Velence Hills toward River Danube and toward the lowland in the surroundings of the former Lake Nádas (
Figure 8). According to the hydraulic head distribution between 0 and 100 m asl, Lake Velence is situated in a local depression; there is no throughflow because flow lines point toward the lake (
Figure 4). Groundwater flow modeling carried out by Smith and Townley [
57] also explained that discharge lakes are more likely to occur near the groundwater divide where regional hydraulic gradients are the weakest and can be counteracted by local forcing in and near the lake.
Based on the results of on-field measurements of physicochemical properties (i.e., temperature, pH, EC, ORP), water samples with different origins could be clearly distinguished e.g., lake waters are characterized by alkaline pH, higher temperature and EC; spring has the lowest temperature. Among the groundwater samples, no spatial or elevational trends could be determined. However, if the recorded ORP values are interpreted together with the results of the groundwater flow mapping, it can be seen that negative ORP was measured in those wells that are situated either in the proximity of the regional discharge area, River Danube (nr. 1, 2, and 4) or in the area of the former Lake Nádas (nr. 10) which is considered as the discharge area of a regional or an intermediate groundwater flow system.
Water chemistry analysis revealed that lake waters have higher K
+, SO
42−, and Cl
− concentrations compared to groundwater samples which are caused by a high evapotranspiration rate that leads to more concentrated water [
58]. Low relative standard deviation of the measured major ion concentrations of groundwater samples (except outliers nr. 9 and 13) and similar water types refer to uniform water chemistry in the Pannonian-Quaternary siliciclastic aquifer system, hence water chemistry analysis could not be used to clearly distinguish hierarchically nested groundwater flow systems (i.e., local and regional flow) or to identify any interconnection between groundwater and Lake Velence.
Groundwater flow patterns determined based on the results of the hydraulic evaluation were supported by the application of environmental tracers. Based on the stable isotope measurements, two groundwater groups can be distinguished. The more depleted δ values (nr. 1, 2, 4, 9, 10) indicate older groundwater or the proximity of the discharge area [
17]. Similar δ
18O composition (−11.95 to −13.50‰) was measured by [
59] in deep groundwater in Csepel Island, a regional discharge area and such isotope values were thought to be indicative of infiltration during the last glaciation. [
60,
61] drew similar conclusions. In accordance with [
62] δ
2H values lower than 80‰ demonstrating that these waters originate from precipitation fallen in a climate period much colder than the present one. Less negative δ
18O composition and variability of the δ values among other groundwater samples (nr. 3, 5, 6, 7, 8, 12, 13, 14, 15) indicate direct recharge from precipitation in today’s climate. According to [
59] δ
18O composition of recently infiltrated precipitation vary between −9.0 and −9.5‰, whereas δ
2H composition between −70 and −80‰ are closer to those of recent precipitation [
62].
Stable isotope composition was compared to the recorded ORP values and showed that the most negative δ values were measured in samples with negative ORP values (nr. 1, 2, 4, 9, 10). Sample nr. 9 forms an exception (ORP = 51.4 mV), but it may imply that ORP measurements are affected by uncertainties caused by mixing of waters in wells, local heterogeneities in the aquifer etc. [
63].
226Ra can be mobilized by the groundwater under reducing conditions, thus it seems reasonable that
226Ra was measured in the highest concentration in these five samples (20–999 mBq L
−1). Reducing conditions combined with the presence of dissolved radium also refer to the existence of a regional groundwater flow system and the proximity of its discharge area [
31,
32]. Samples nr. 1, 2 and 4 are situated close to River Danube, whereas nr. 9 and 10 are located close to the area of the former Lake Nádas, indicating that these two specific areas are regional discharge zones of groundwater flow systems.
In general, high uranium activity coexists with an oxidizing environment, which can be found in recharge areas and along local flow systems [
32]. Most of the highest uranium activity values (up to 487 mBq L
−1) correspond with the recharge areas in the Bika Valley south from Lake Velence. The lake itself (nr. 16) has also high uranium activity (392 mBq L
−1). Although Lake Velence receives recharge from surface watercourses (Császárvíz and Vereb-Pázmánd watercourse) running through the granitic blocks of Velence Hills, the source of uranium in the lake’s water can also be the local flow systems recharging in Velence Hills and discharging in the lake. The latter explanation supports that interconnection exists between groundwater and the lake. There might be a similar scenario to explain uranium activity measured in the sample taken from Lake Zichy (nr. 11, 451 mBq L
−1). Since overflowing wells were observed on the lake’s shore from which groundwater discharge into the lake, groundwater is the most likely source of uranium. Other studies also proved that radionuclide content measured in lake waters originates from groundwater [
64,
65].
Existence of local flow systems in Velence Hills was indicated by high uranium and radon activity that was measured in the spring in Velence Hills (199 mBq L
−1 and 326 mBq L
−1, respectively). These results suggest that uranium is leached out from the base rock (Velence Granite Formation) and then transported by groundwater along local flow systems with an oxidizing environment. Furthermore, flow velocity must be relatively fast given the short half-life of
222Rn (3.82 days). Radon activity as a suitable indicator of rapid flow and short flow path was proved in other studies [
30,
39].


 ,
, 


