
Research on Water Resources Allocation System Based on Rational Utilization of Brackish Water

1
State Key Laboratory of Simulation and Regulation of Water Cycle in River Basin, China Institute of Water Resources and Hydropower Research, Beijing 100038, China
2
Department of Water Resources, China Institute of Water Resources and Hydropower Research, Beijing 100038, China
3
Hebei Institute of Water Science, Shijiazhuang 050051, China
*
Author to whom correspondence should be addressed.
Water 2022, 14(6), 948; https://doi.org/10.3390/w14060948
Submission received: 30 December 2021
/
Revised: 4 March 2022
/
Accepted: 10 March 2022
/
Published: 17 March 2022
(This article belongs to the Special Issue River Ecological Restoration and Groundwater Artificial Recharge)
Abstract
:The rational utilization of unconventional water sources is of great significance to areas where conventional water resources are scarce, and water resource allocation is an important way to realize the rational distribution of multiple water sources. This paper constructs a water resources allocation system integrating model data parameter database, water resources supply and demand prediction module, groundwater numerical simulation module and water resources allocation module. Taking brackish water as the main research object and final goal of achieving the best comprehensive optimization of social, economic and ecological benefits. The brackish water is incorporated as an independent water source into the water resource allocation model, and the stratum structure model and groundwater numerical model are constructed to simulate the brackish water level in the planning target year. The water resources allocation system is applied to Guantao County, China. The results show that increasing the development and utilization of brackish water under the recommended scheme can significantly reduce the water supply pressure of local fresh water resources in agriculture and industry. Compared with the current year, the overall water shortage in the region will be reduced by 4.493 × 10⁶ m³ in 2030, and meanwhile, the brackish water level will be decreased by 12.69 m in 2035, which plays a positive role in improving soil salinization.
1. Introduction
Water resources are one of the important natural resources that protect people’s livelihood and promote social and economic development, especially for developing countries that have a large population and need to improve their water-saving level and practices. Since the 21st century, rapid population growth and rapid development of the economy has increased the urgent demand for the quantity and quality of water resources [1]. The increasing demand for water has gradually exceeded the supply capacity of local water resources, resulting in a large-scale water resources shortage [2,3]. Especially for agriculture, under the current situation of insufficient local surface water, it is often necessary to use large amounts of groundwater to maintain the normal growth of crops and meet the needs of agricultural production, which also causes problems such as groundwater level decline and land subsidence [4], threatening the safety of human water use and the benign operation of the natural water cycle. There is an urgent need to balance water supply and use, in order to eliminate the increasingly fierce competition of water use and deterioration of the water ecological environment [5,6].
Water resources allocation refers to the planning for macro-control of water resources according to historical water inflow data and user water demand. It is considered to be one of the most effective methods to coordinate the balance of social, economic, and ecological water use [7]. With researchers globally conducting in depth research, the water resources allocation model has been continuously developed [8,9]. Minsker, et al. [10] constructed a multi-objective allocation model of water resources based on genetic algorithm through the uncertainty of hydrological factors, and characterized the uncertain factors in the process of water resources allocation. Rosegrant, et al. [11] coupled the hydrological model with the economic development model to evaluate social and economic benefits brought by the improvement of water resources allocation and utilization efficiency. Chen, et al. [12] formulated the interval multi-level classified water resources allocation model to optimize water resources allocation to the municipal scale, and the allocation objects are industry, hydropower, and agriculture. In addition, with the development of computer technology, optimization algorithms, artificial intelligence, and space technology are increasingly used in the field of water resources allocation, such as artificial fish school algorithm [13,14], particle swarm optimization algorithm [15,16], and neuro-fuzzy reinforcement learning method [17], which greatly optimizes the scientific nature and accuracy of the water resources allocation model. In addition, it also drives the water resources allocation model to gradually transit to multi-disciplinary integration, so as to serve the solution of multi-objective problems. In the study of optimal allocation of unconventional water resources, Li, et al. [18] developed an interval number hierarchical planning model to integrate water into the water allocation system, taking into account the interests of decision-makers at different levels and the uncertainty of the water allocation system, and to guide the conventional and unconventional water supply sectors to supply water rationally and efficiently. Mooselu, et al. [19] proposed a method for optimal allocation of wastewater reuse water with the objective of minimizing the cost of water supply and regional water shortage. Gao, et al. [20] proposed an optimal allocation method for wastewater reuse water with the objective of minimizing the consumption of freshwater resources and the energy consumption of the water supply process by incorporating medium and desalinated water into the water allocation study, and used NSGA-II. The optimal water and energy-saving scheme is given on the Pareto boundary by solving this multi-objective problem using NSGA-II.
Brackish water refers to the water resources buried underground with a salinity of 2–5 g/L [21]. With the increasingly severe shortage of conventional water resources, it is urgent to bring brackish water into the optimal water resources allocation. China is rich in brackish water resources. According to statistics, the amount of brackish water resources in China is 27.7 billion m³, of which 13 billion m³ can be utilized. Underground shallow brackish water is mainly distributed in the Northern China Plain, northwest arid area and eastern coastal area, with a buried depth of about 10–100 m, which is easy to be exploited and utilized [22]. As one of the main grain production areas in China, the use of brackish water for agricultural irrigation in the Northern China Plain has very important practical significance [23]. The use of brackish water for farmland irrigation has a long history worldwide. In the southwest of the United States, the use of brackish water for irrigation of cotton, sugar beet and other crops basically does not affect the crop yields [24]. Israel, Australia, Spain, Tunisia, and other countries all have carried out practices related to brackish water irrigation and achieved good results [25]. In addition to the relevant research on the impact of brackish water irrigation on crop yield, other scholars have also carried out relevant research on the impact of brackish water salinity on soil infiltration characteristics [26], soil water and salt transport model [27], soil water and salt regulation measures [28,29,30], further expanding the depth and breadth of the research on the internal mechanism of the impact of brackish water irrigation on soil and crop growth.
In summary, this paper provides a comprehensive review of the research results on water resources allocation, non-conventional water resources allocation and brackish water utilization, etc. The limitations of the existing water resources allocation research are mainly reflected in the following two aspects: Firstly, the focus of the current research on optimal water resources allocation is to reasonably allocate the water supply from conventional water sources, medium water and desalinated water through various engineering and technical measures, so as to meet the demand of different users. Secondly, in terms of brackish water utilization, the current research mainly focuses on the impact of brackish water irrigation on crop growth, yield, and land quality by conducting irrigation experiments, while there are relatively few studies on the prediction and simulation of water level changes after the large-scale application of brackish water.
Based on the above discussion, the main objective of this study is to construct a water resources optimization allocation system, the core of which is to couple numerical groundwater simulation with water resources optimization allocation, to reasonably allocate brackish water as an independent water source, to realize the efficient utilization of brackish water resources in agricultural irrigation and industrial water use, and to input the allocation results into the numerical groundwater model to predict the changing trend of brackish water level. This study has certain reference value for reducing the water supply pressure of conventional water sources and inter-basin water transfer in agricultural irrigation and industrial water use, improving the development and utilization rate of brackish water resources, and realizing the synergistic allocation of conventional water resources and brackish water resources in water-scarce areas.
2. Material and Method
2.1. Study Area
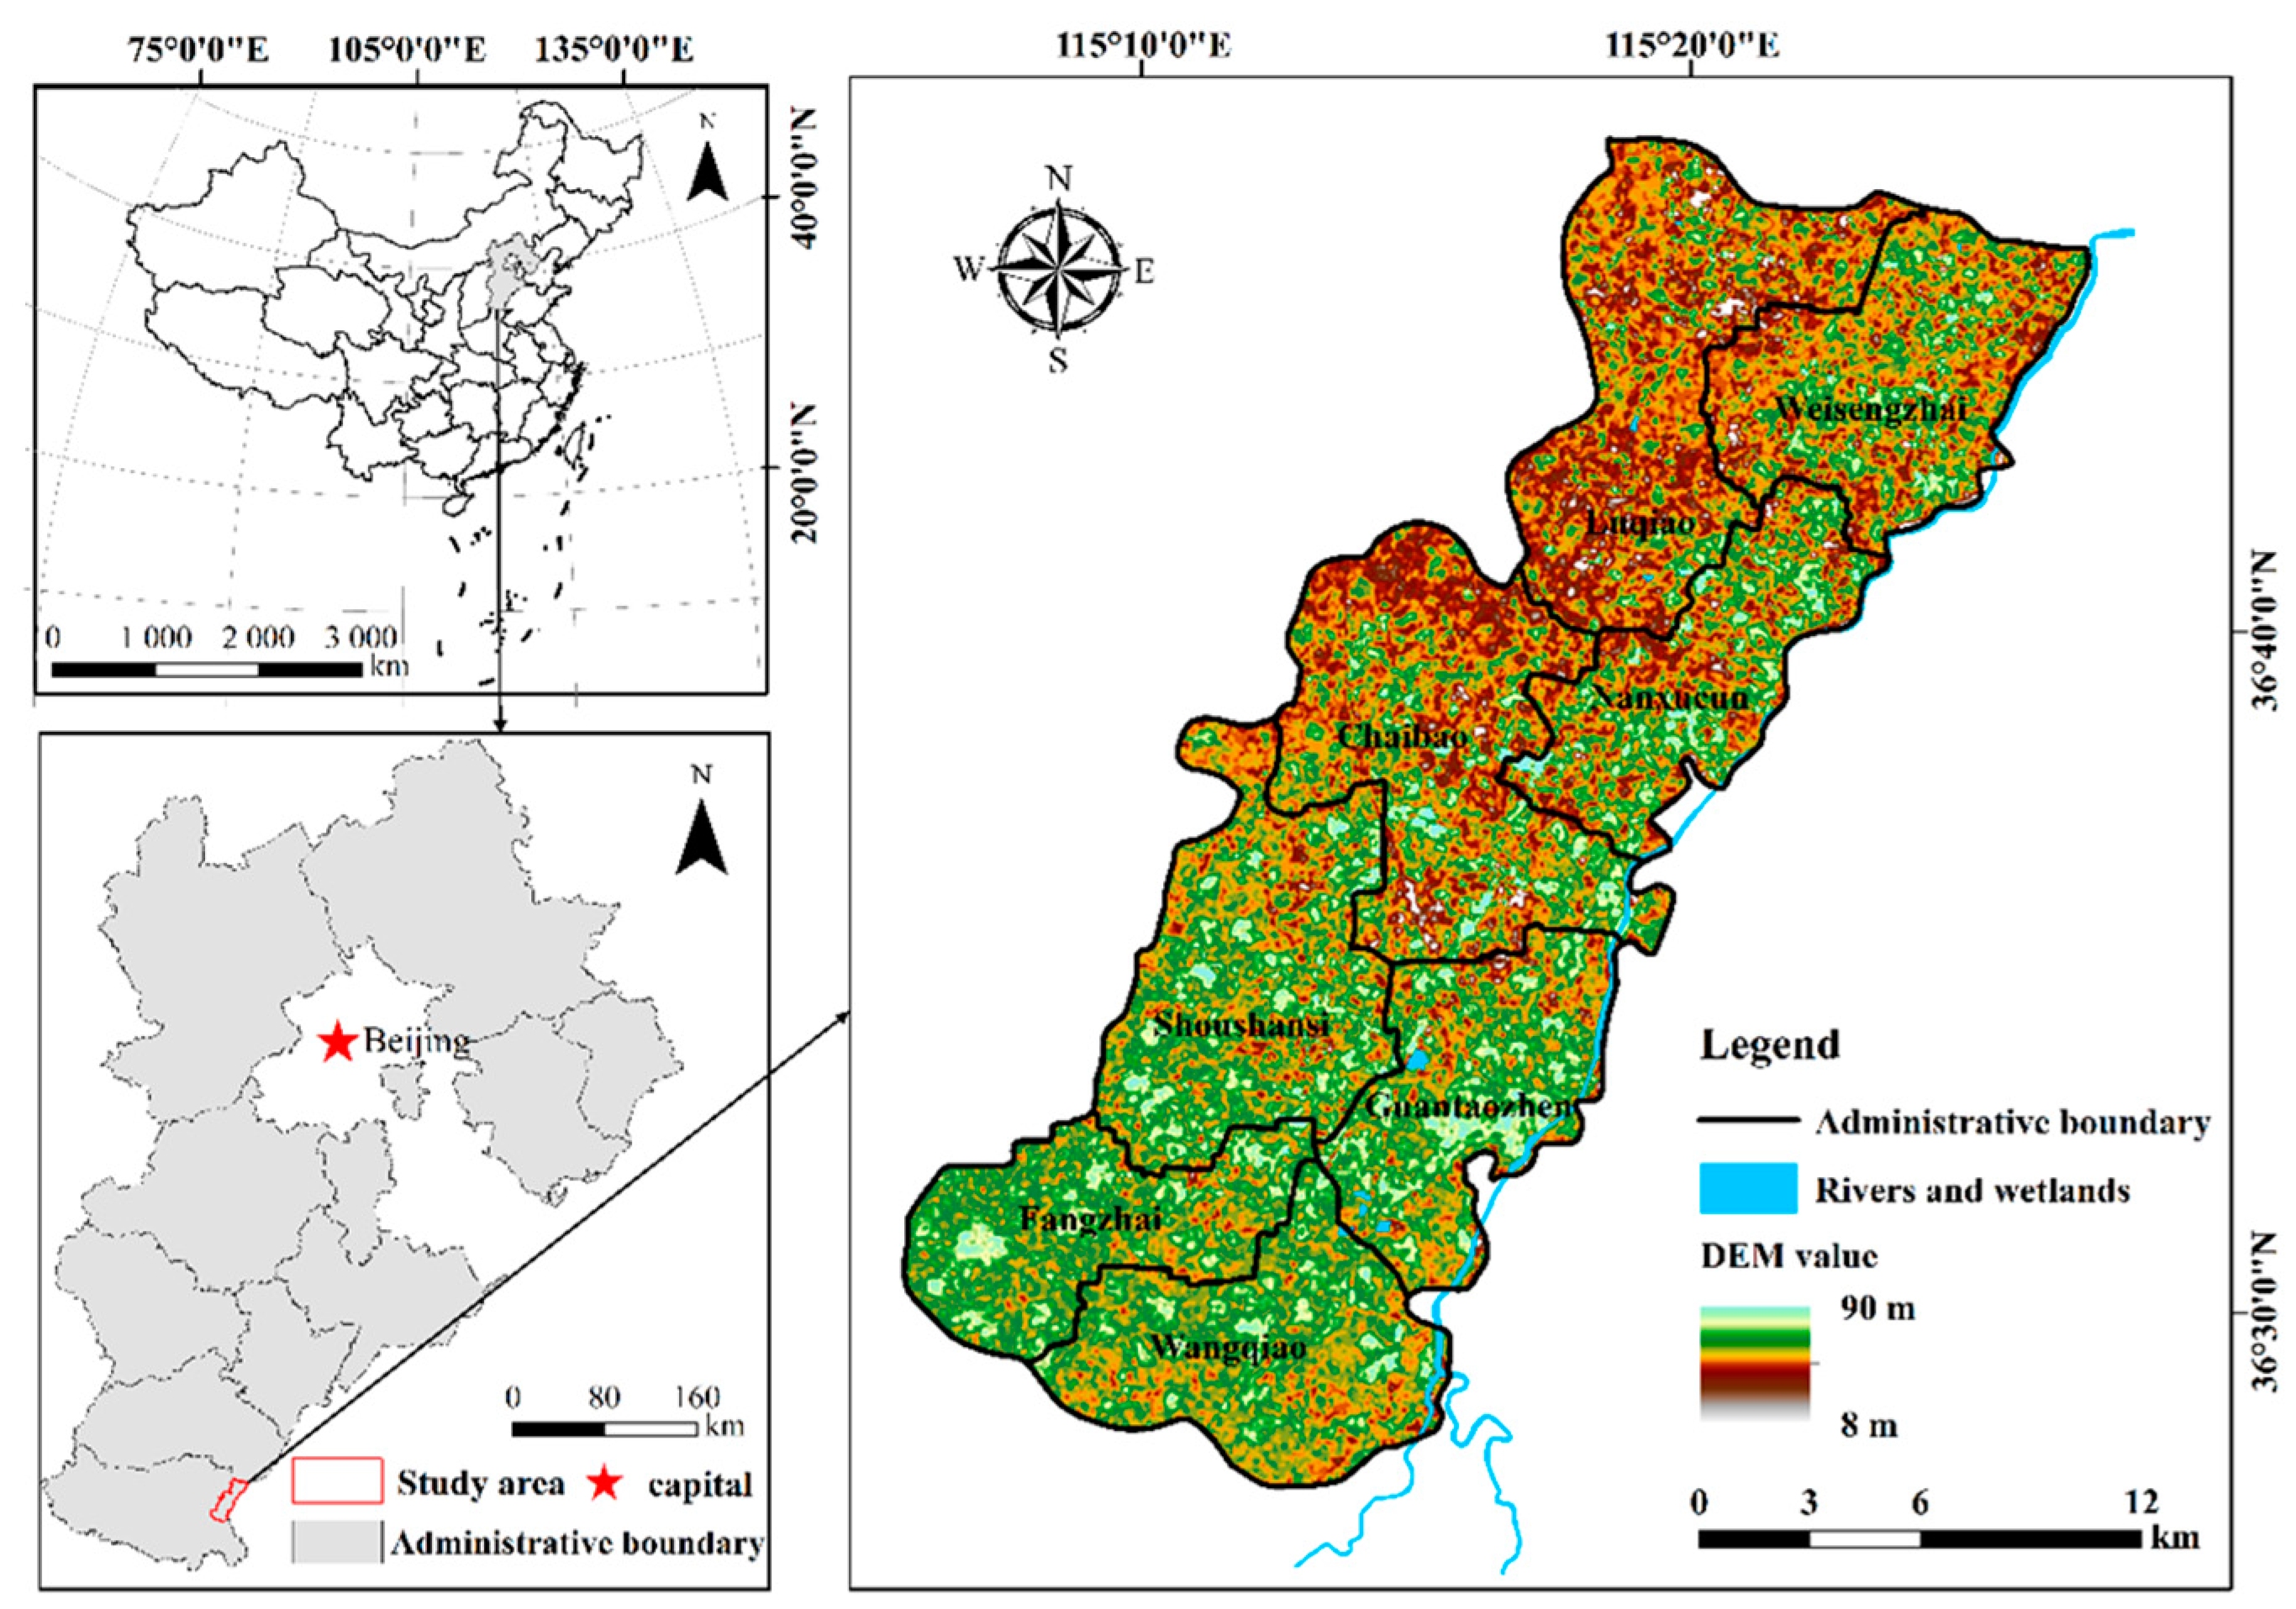
Guantao County is located in the south of the Northern China Plain (longitude 115°06′–115°40′, latitude 36°27′–36°47′), with a total area of 456.3 km2. It borders Shandong Province with Wei Canal in the east, Guangping, Quzhou and Qiu Counties in the west, Daming County in the south and Linxi County in the north. The main river in the territory is Wei Canal. Its annual average surface water resource is 4.645 million m³, its groundwater resource is 57.654 million m³, and the total amount of water resources is 62.299 million m³. By the end of 2019, the total population was 350,900, including 74,100 urban residents and 276,800 rural residents, with an urbanization rate of 21.1%. The gross national product is CNY 7.095 billion, and the proportion of the three industries is 6.2:6.3:11.1. The geographical location of Guantao County is shown in Figure 1.
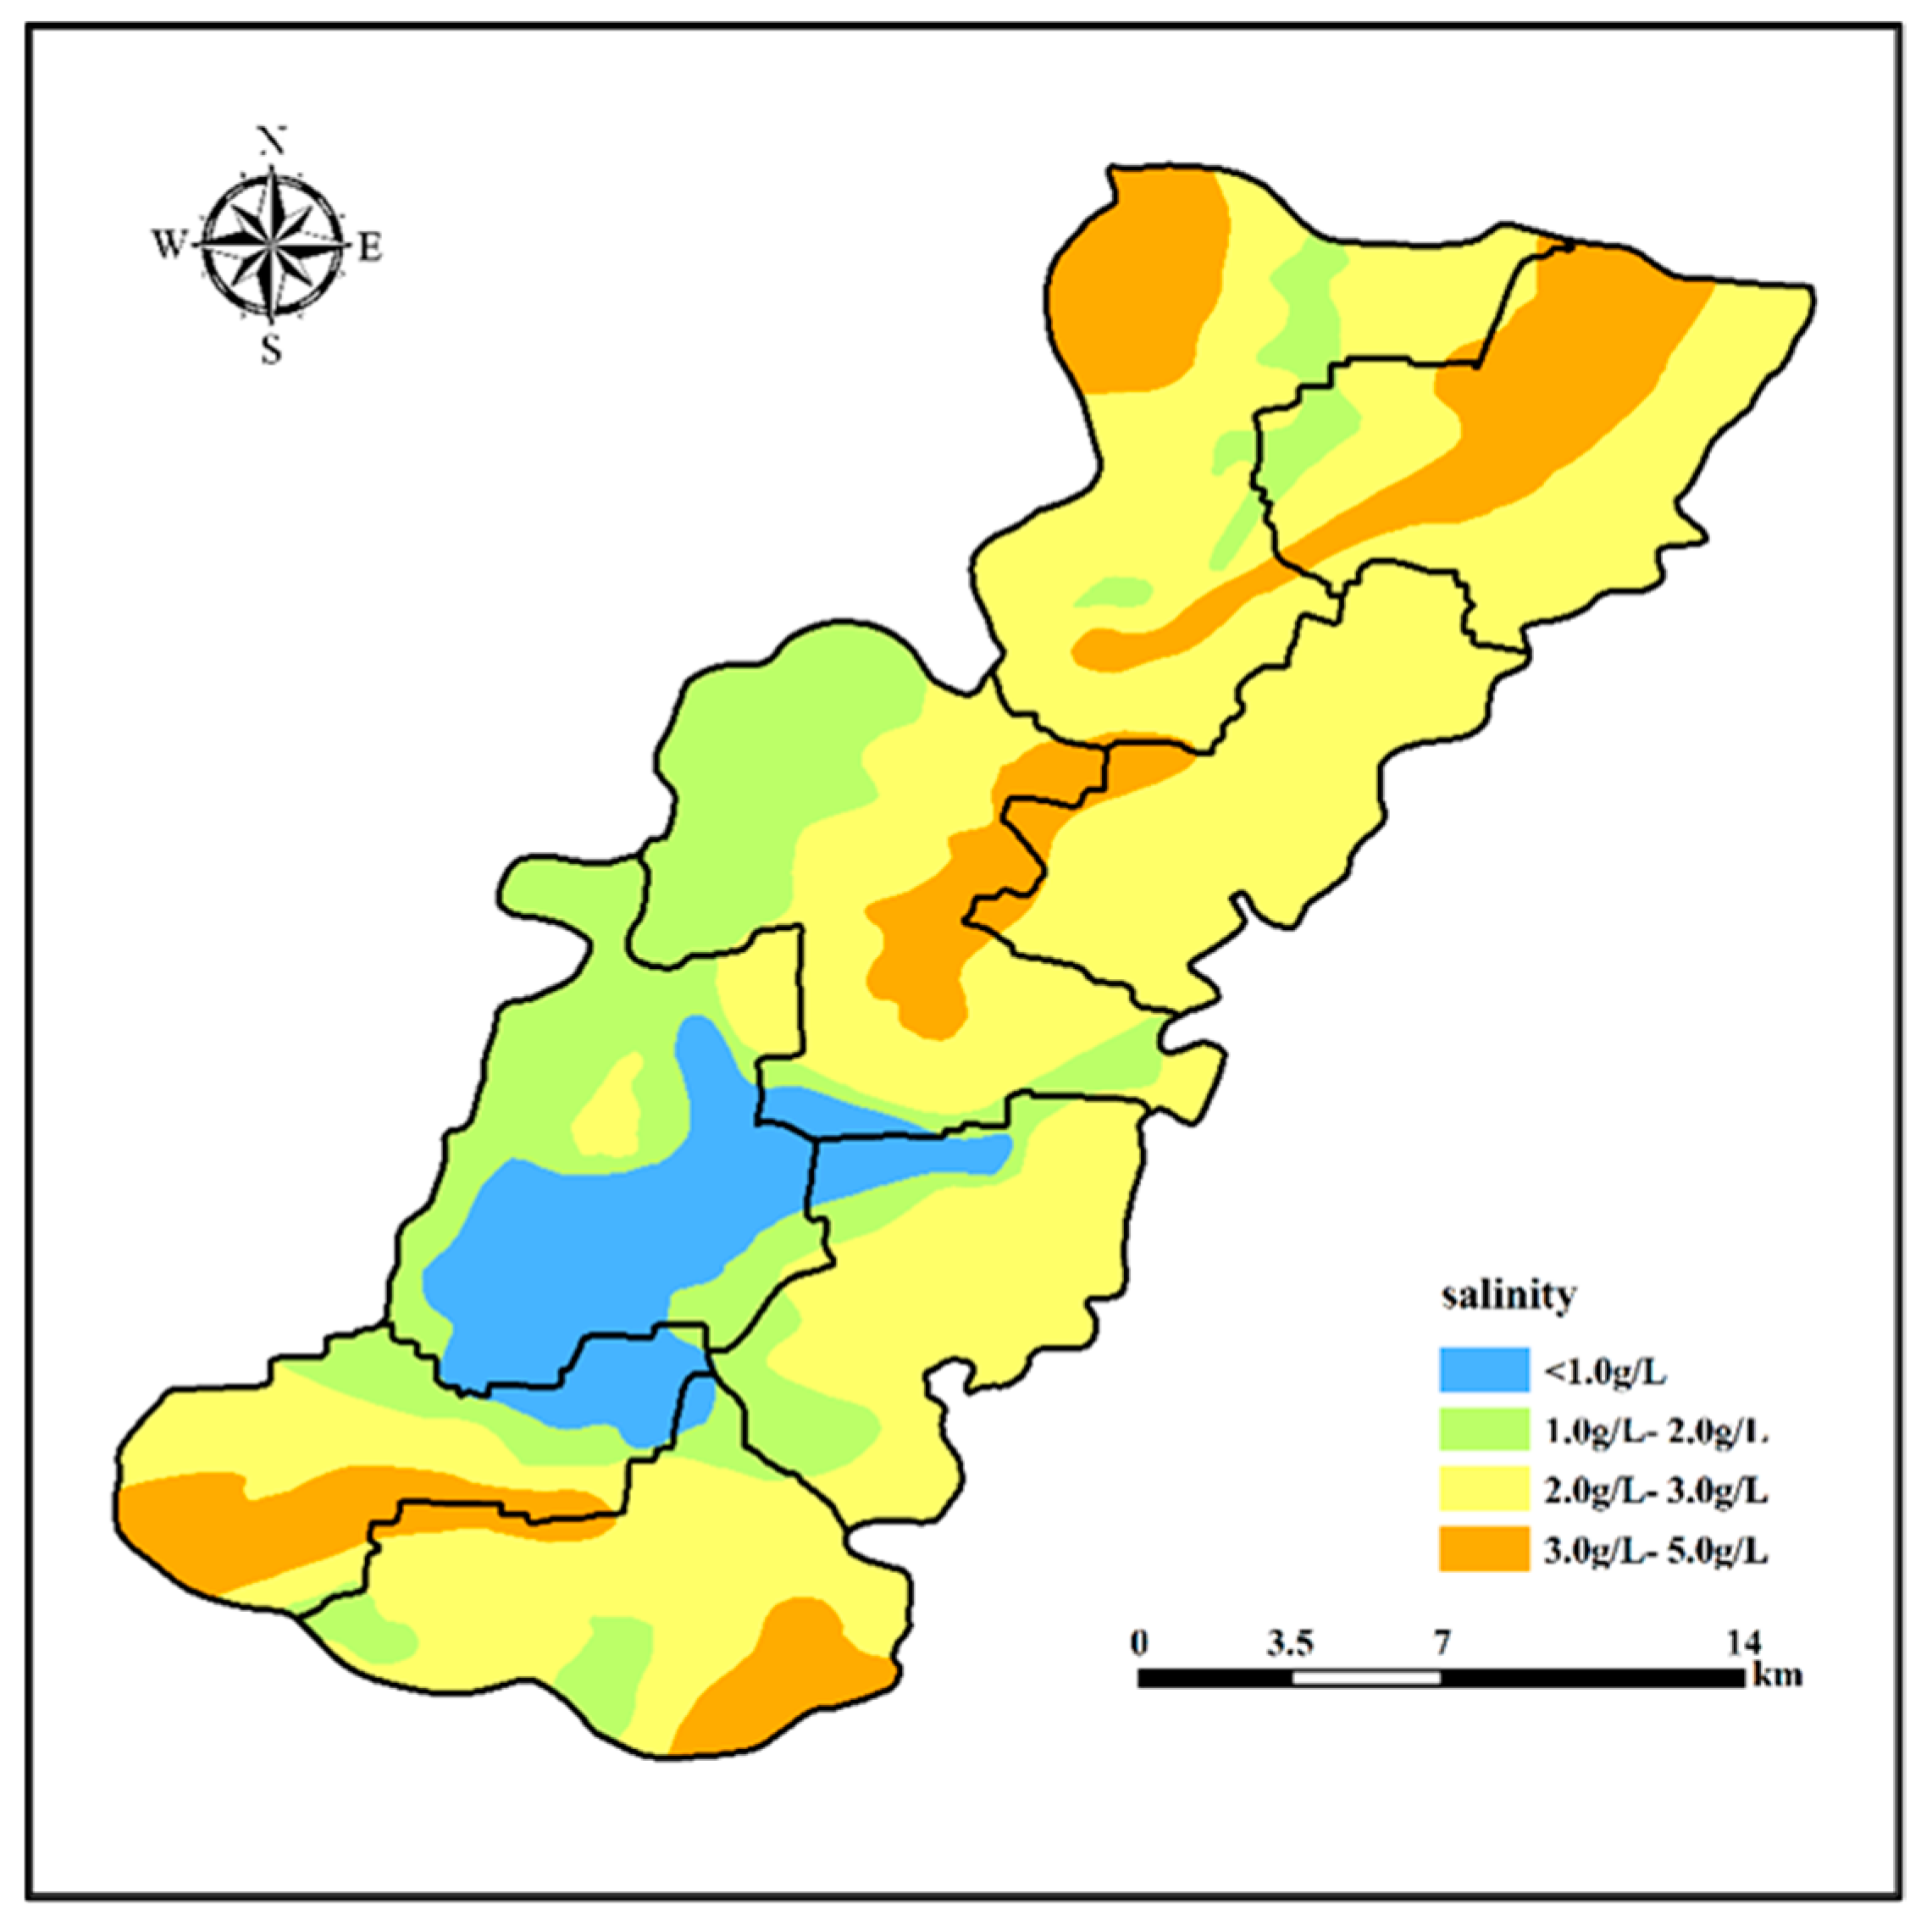
Guantao County is rich in shallow brackish water reserves. According to the relevant results of Evaluation of Water Resources of Guantao County, Hebei Province, the salinity of Guantao County is 2 g/L < M ≤ 3 g/L, and the multi-year average groundwater resources of brackish water is 15.15 million m3. The salinity is 3 g/L < M ≤ 5 g/L, and the multi-year average groundwater resources of brackish water is 4.05 million m3. The distribution of brackish water in Guantao County is shown in Figure 2. It can be seen from the figure that groundwater with salinity M ≤ 2 g/L is mainly distributed in Shoushansi Township and Chaibao Town in the south-central part of Guantao County. The groundwater with salinity 3 g/L < M ≤ 5 g/L is mainly distributed in Luqiao Township and Weisengzhai Town in the north of Guantao County, Chaibao Town in the middle and Fangzhai Town and Wangqiao Township in the south. The salinity of other areas is 2 g/L < M ≤ 3 g/L.
2.2. Optimal Water Resources Allocation System
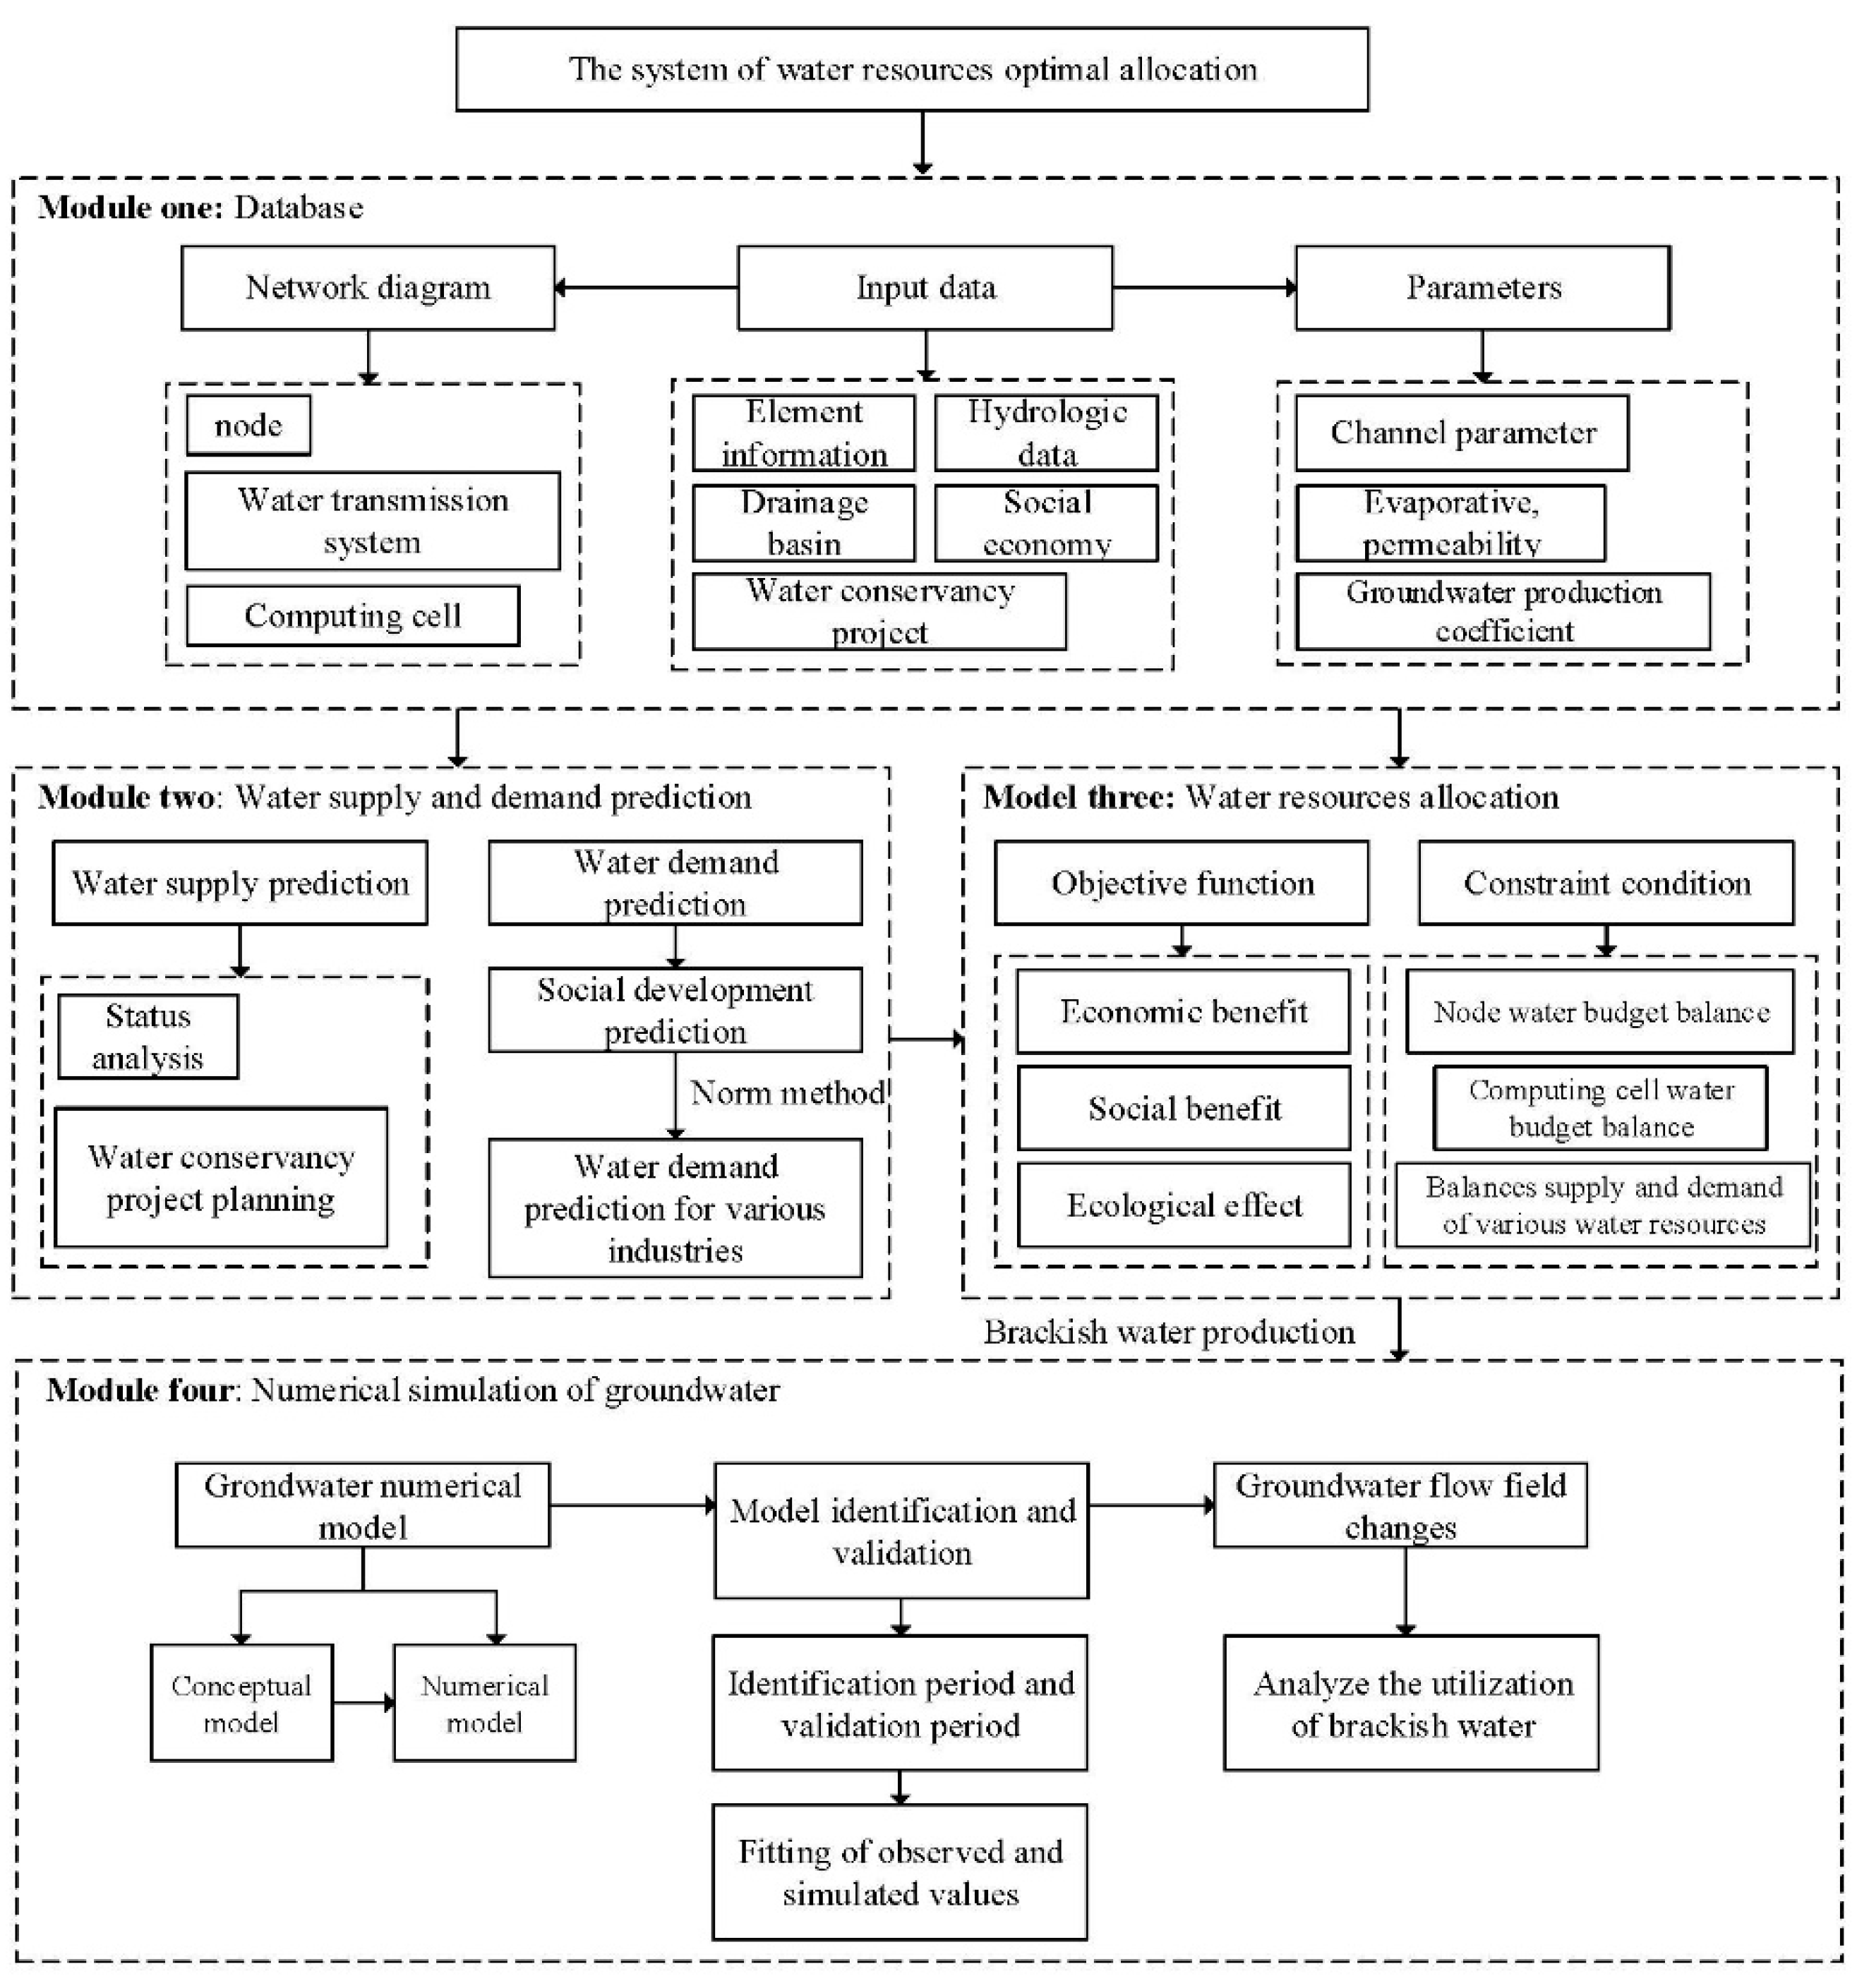
The optimal water resources allocation refers to the spatial and temporal allocation of limited water resources through various engineering or non-engineering measures in the basin or specific area, in accordance with the principle of natural sustainable development, so as to meet the water demand of each area to the maximum extent and coordinate the contradictions of water users without affecting the ecological environment. This aims to maximize the social and economic benefits of water resources, and to promote the sustainable and stable development of the river basin, regional economy, and the health and stability of ecological environment. In order to achieve the above objectives, this study constructs the optimal water resources allocation system on the premise of fully considering the water resources endowment conditions in the study area. The main work modules of the system include model data parameter database, water resources supply and demand prediction module, groundwater numerical simulation module, and water resources allocation module. The working relationship between modules is shown in Figure 3.
2.2.1. Model Data Parameter Database
The model data parameter database is the data source of the optimal water resources allocation system as well as the basis for the normal operation of other modules. It mainly includes the following three contents:
- Data input: it mainly includes hydrological data, social and economic data, river (canal) system network, river (canal) basic information, calculation unit information, basic information of hydraulic engineering, basin unit information, etc.
- Model parameters: they mainly include the discharge capacity, evaporation and leakage coefficients, etc., of river, canal system and drainage channel, sewage discharge rate and reuse rate, upper and lower limit coefficients of annual and monthly exploitation of groundwater supply, and evaporation, leakage, and into-river proportion coefficient of irrigation canal system of calculation unit.
- Water resources allocation system network diagram: its main function is to master the relationship among surface water, groundwater, external diverted water and unconventional water and urban life, rural life, agriculture, industry and tertiary industry, ecology and environment, and to clarify the supply, consumption and discharge of water resources among society, economy and ecological environment. It is an important basis for building the water resources allocation model [31]. The drawing principle of the water resources allocation network diagram is water balance principle, that is, any node on the diagram must conform to Equation (1):
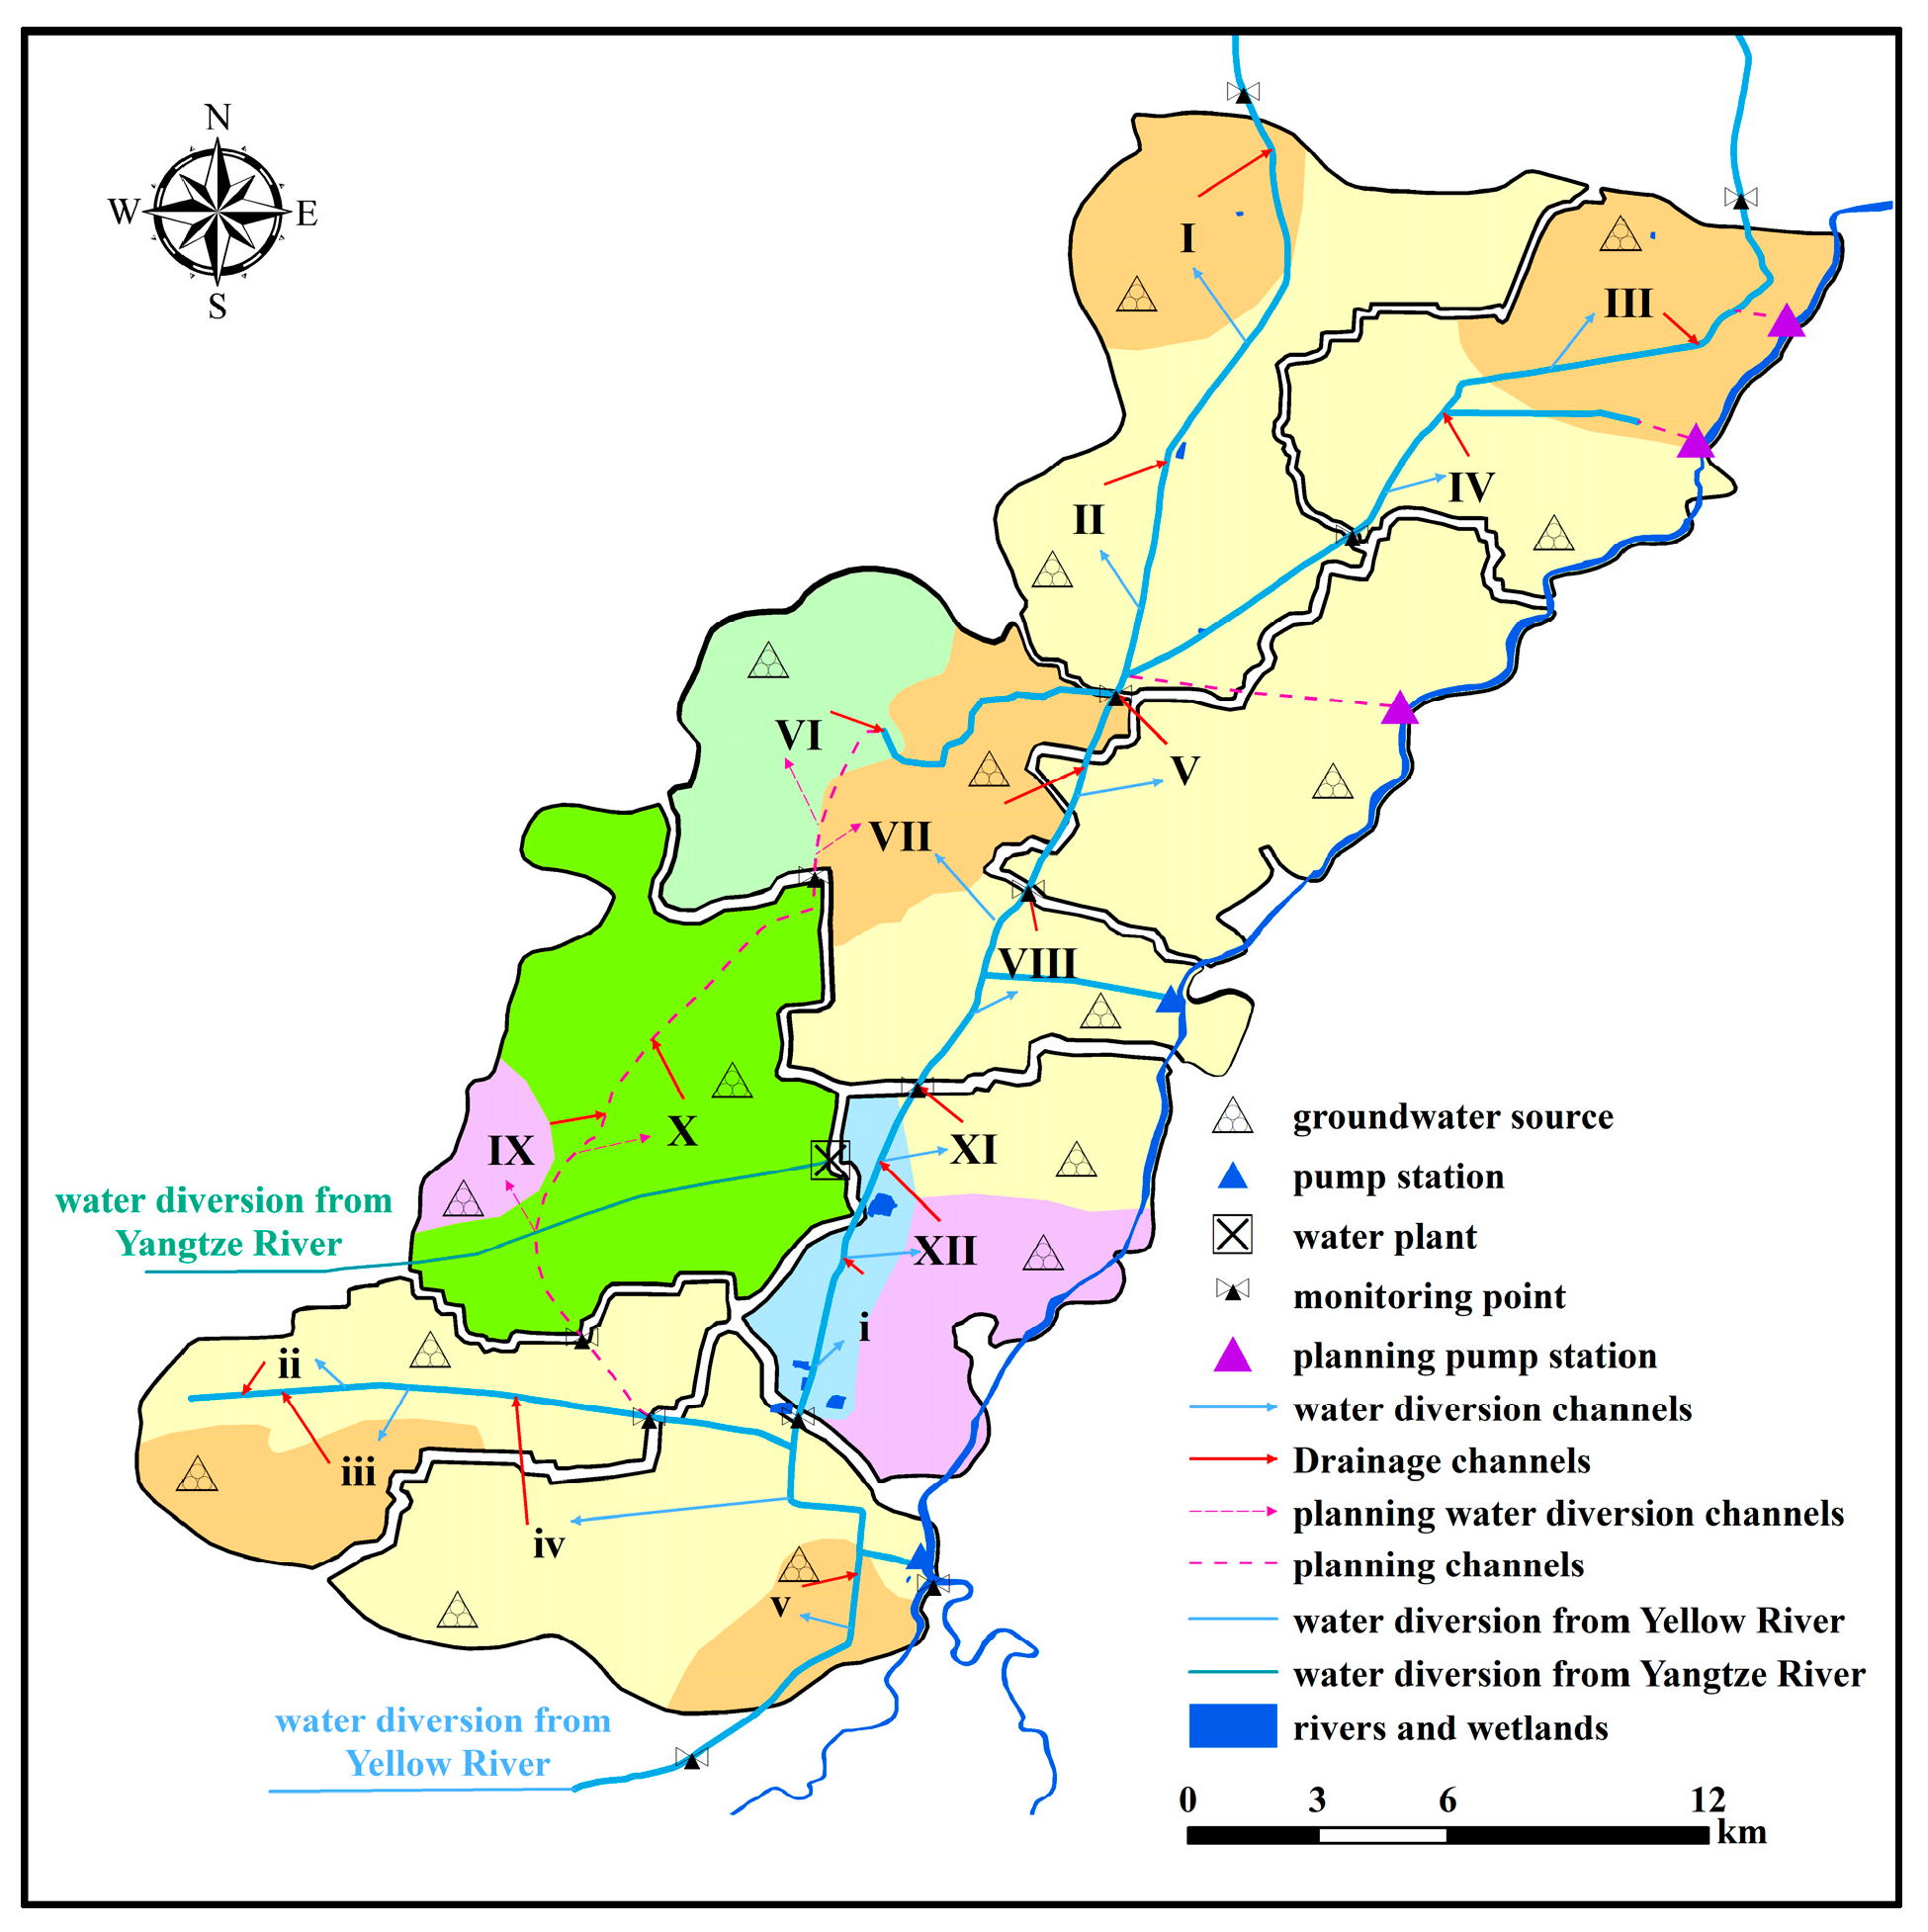
The water resources allocation system network diagram is the generalization and abstraction of water resources allocation. The river system is drawn by approximating the actual river distribution in the study area, river basin and administrative area sections, reservoir nodes, water diversion and lifting nodes, calculation units, lakes, etc., are marked in the river system. Reservoir nodes, water diversion and lifting nodes, calculation units, lakes and other nodes are used to connect local surface water sources, groundwater sources, unconventional water sources and external diverted water sources in the study area. The drainage line of the calculation unit is connected with the river to form a drainage system. The study area is partitioned to ensure that there are water transmission lines in each partition. On the basis of fully collecting the data of the study area and comprehensively considering the brackish water distribution and water use of various departments in Guantao County, Guantao County is generalized into 17 calculation units, five water lifting nodes, 12 control section nodes and one water plant node. The water resources allocation system network diagram in Guantao County is shown in Figure 4.
2.2.2. Water Resources Supply and Demand Prediction Module
The water resources supply and demand prediction module mainly includes a water demand prediction part and a water supply prediction part, wherein, the water demand prediction part adopts the combination of time series method and index quota method, and comprehensively considers the requirements of social and economic development and water conservation, so as to formulate the water demand schemes for different industries under different social development situations.
Urban and rural residents’ domestic water demand forecast is calculated by the formula:
where is the projected water demand of urban and rural residents in level t, is the projected population in level t, and is the projected water quota in level t.
Industrial water demand forecast is calculated by the formula:
where is the predicted industrial water demand at level t, is the predicted industrial value-added water consumption per million yuan at level t, and is the predicted industrial value-added at level t.
Agricultural irrigation water demand forecast is calculated by the formula:
where is the gross irrigation water demand in level t, is the planted area of the jth crop in level t, is the irrigation quota of the jth crop, m is the crop type, and is the integrated irrigation water effective utilization coefficient.
The water supply prediction part is based on the comprehensive investigation and analysis of the engineering layout, water supply capacity, operation status, development and utilization of water resources and existing problems of existing water supply facilities, and analyzes the prospect and potential of water resources development and utilization, so as to formulate water supply planning schemes for different target years, and predict the available water supply quantity of each planning scheme. The accuracy of water demand prediction and water supply prediction has a great impact on the results of water resources allocation. Therefore, it is necessary to closely combine the relevant requirements of social and economic development and water conservancy project planning in the study area so as to avoid the excessive deviation between the prediction results and development objectives.
2.2.3. Water Resources Allocation Module
The water resources allocation module is based on the binary water cycle theory, which takes the water resources system, the social economic system, and the ecological environment system as an organic whole, and efficiently promotes social and economic construction under the premise of ensuring the sustainable and sound development of the ecological environment. To promote the conservation and protection of water resources with the advancement of economy and technology, and the high-quality water resources saved can be distributed to various water users, realizing a virtuous circle of the organic whole. The water resources allocation module adopts the system analysis method based on linear programming, and establishes the balance equation and constraint equation of each control node, reservoir and calculation unit in the water resources allocation system network diagram according to the principle of water balance. It aims at the comprehensive optimization of social benefit goal, economic benefit goal and ecological environment benefit goal to construct the objective function of water resources allocation, and programs by using the general algebraic modeling system (GAMS). The optimal configuration scheme is solved by repeated iteration. The explanations of relevant variables are shown in Table 1, as the constructed objective Equations (2)–(6).
- Social benefit goal
The social benefit goal is mainly reflected by the safety level of water supply. Each water allocation department shall carry out multi-source joint water supply to meet the requirements of each water user for water quantity and quality. Therefore, in the process of allocation, the water supply weight of each water source shall be reasonably set to determine the optimal safety level of water supply.
where is surface water supply coefficient, is groundwater supply coefficient, is external diverted water supply coefficient, is brackish water supply coefficient, and is sewage disposal recycled water supply coefficient.
- 2.
- Economic benefit goal
The economic benefit goal is mainly reflected by water shortage rate. For industry and agriculture, the lower the water shortage rate is, the higher the economic benefit of water supply will be. The corresponding water shortage weight is allocated to each industry according to the industrial demand and the economic benefits generated by unilateral water, so as to minimize the regional water shortage and realize the coordinated development of the regional economy.
where is urban domestic water shortage coefficient; is industrial water shortage coefficient; is ecological environmental water shortage coefficient; is agricultural water shortage coefficient; is rural water shortage coefficient.
- 3.
- Ecological environment benefit goal
The ecological environment benefit goal is mainly reflected by lake water shortage. At present, Princess Lake in the study area has shrunk to a certain extent. Therefore, it is very necessary to protect the existing lake area and give full play to its due ecological function.
where is the water use coefficient of lake and wetland.
- 4.
- Final goal
The final goal is to achieve the optimal comprehensive benefits of water resources allocation. In the process of water resources allocation, it comprehensively considers the carrying capacity of water resources and water environment, and gives consideration to the water supply and consumption coordination between multiple water sources and multiple users, so as to meet the water requirements for the healthy development of social economy and ecological environment.
where F is the final goal of water resources allocation, and are the coefficients of social benefit goal, economic benefit goal, and ecological environment benefit goal, respectively.
- 5.
- Constraints
The constraints mainly include node water balance, supply and demand balance of calculation unit, water supply balance of various water sources (surface water, groundwater, external diverted water, brackish water, water for sewage treatment, etc.), river and canal overflow capacity, river network channel storage, return water balance of calculation unit, lake and wetland constraints, etc. Limited by the length of the article, see [32] for the specific constraint equation expression.
2.2.4. Groundwater Numerical Simulation Module
Numerical simulation is one of the most commonly used methods to solve the problem of groundwater flow. It mainly uses the approximation principle to divide the study area, and transforms the nonlinear partial differential equation into a difference equation through discretization, which can solve the complex groundwater evaluation problem on the premise of ensuring a certain accuracy. The differential equation of groundwater flow is as follows:
where H is water level, m; Z is floor elevation of the first phreatic aquifer, m; K is hydraulic conductivity of aquifer, m/d; ε is rainfall infiltration and agricultural regression intensity, m/d; μ is water yield of the first phreatic aquifer; W is overflow strength, L/d; P is mining intensity per unit volume of aquifer, L/d; S is water storage rate of confined aquifer, L/m; H0 is initial head, m; Г1 is class I head boundary; H1 is class I boundary water level, m; Г2 is class II flow boundary; and q is boundary flow, m2/d.
3. Results and Discussion
3.1. Establishment of Groundwater Numerical Model
According to the hydrogeological conditions of Guantao County, combining with the long-term observation data of groundwater and the actual exploitation of groundwater, the phreatic layer in Guantao County is generalized into a groundwater system with unified hydraulic connection by using the 3D groundwater flow numerical simulation software GMS, and the system is generalized into a heterogeneous and unstable groundwater system whose parameters change with space.
3.1.1. Stratigraphic Structure Generalization
The aquifer in the study area is a loose rock pore aquifer. Its lithology is mainly interbedded with fine sand, silty sand and silty clay, and the formation type is alluvial and lacustrine. The stratum thickness changes uniformly, and there is hydraulic connection between aquifers in the horizontal direction.
According to the spatial distribution of stratigraphic lithologic structure within the study area and combining with the horizon of existing monitoring wells in Guantao County, the strata in the study area are generalized into a three-layer structure composed of two aquifers and one aquitard which are interbedded. Referring to the deep mining depth of the groundwater mining layer in the study area, the bottom boundary depth of the model is set as 160 m.
3.1.2. Generalization of Aquifer Boundary Conditions
- Lateral boundary conditions.
The southern part of the study area is mainly recharged by lateral runoff. In terms of boundary conditions, it is regarded as class II flow inflow boundary. There is almost no water exchange between the north of the study area and the surrounding counties, and the boundary is perpendicular to the water level line, which can be generalized as a water barrier boundary. Since the overall flow direction of shallow groundwater in Guantao County is from northeast to southwest, the west and the east of the study area can be generalized as constant head boundaries.
- 2.
- Vertical boundary generalization.
The upper part of the model is the phreatic surface boundary, which is recharged by atmospheric precipitation, river leakage and agricultural irrigation return, and discharged by phreatic surface evaporation and manual mining. Therefore, the upper boundary is generalized as the water exchange boundary. The bottom of the model has relatively impermeable clay and bedrock, so it is generalized as an impermeable boundary.
3.1.3. Determination of Hydrogeological Parameter Partitions and Initial Values
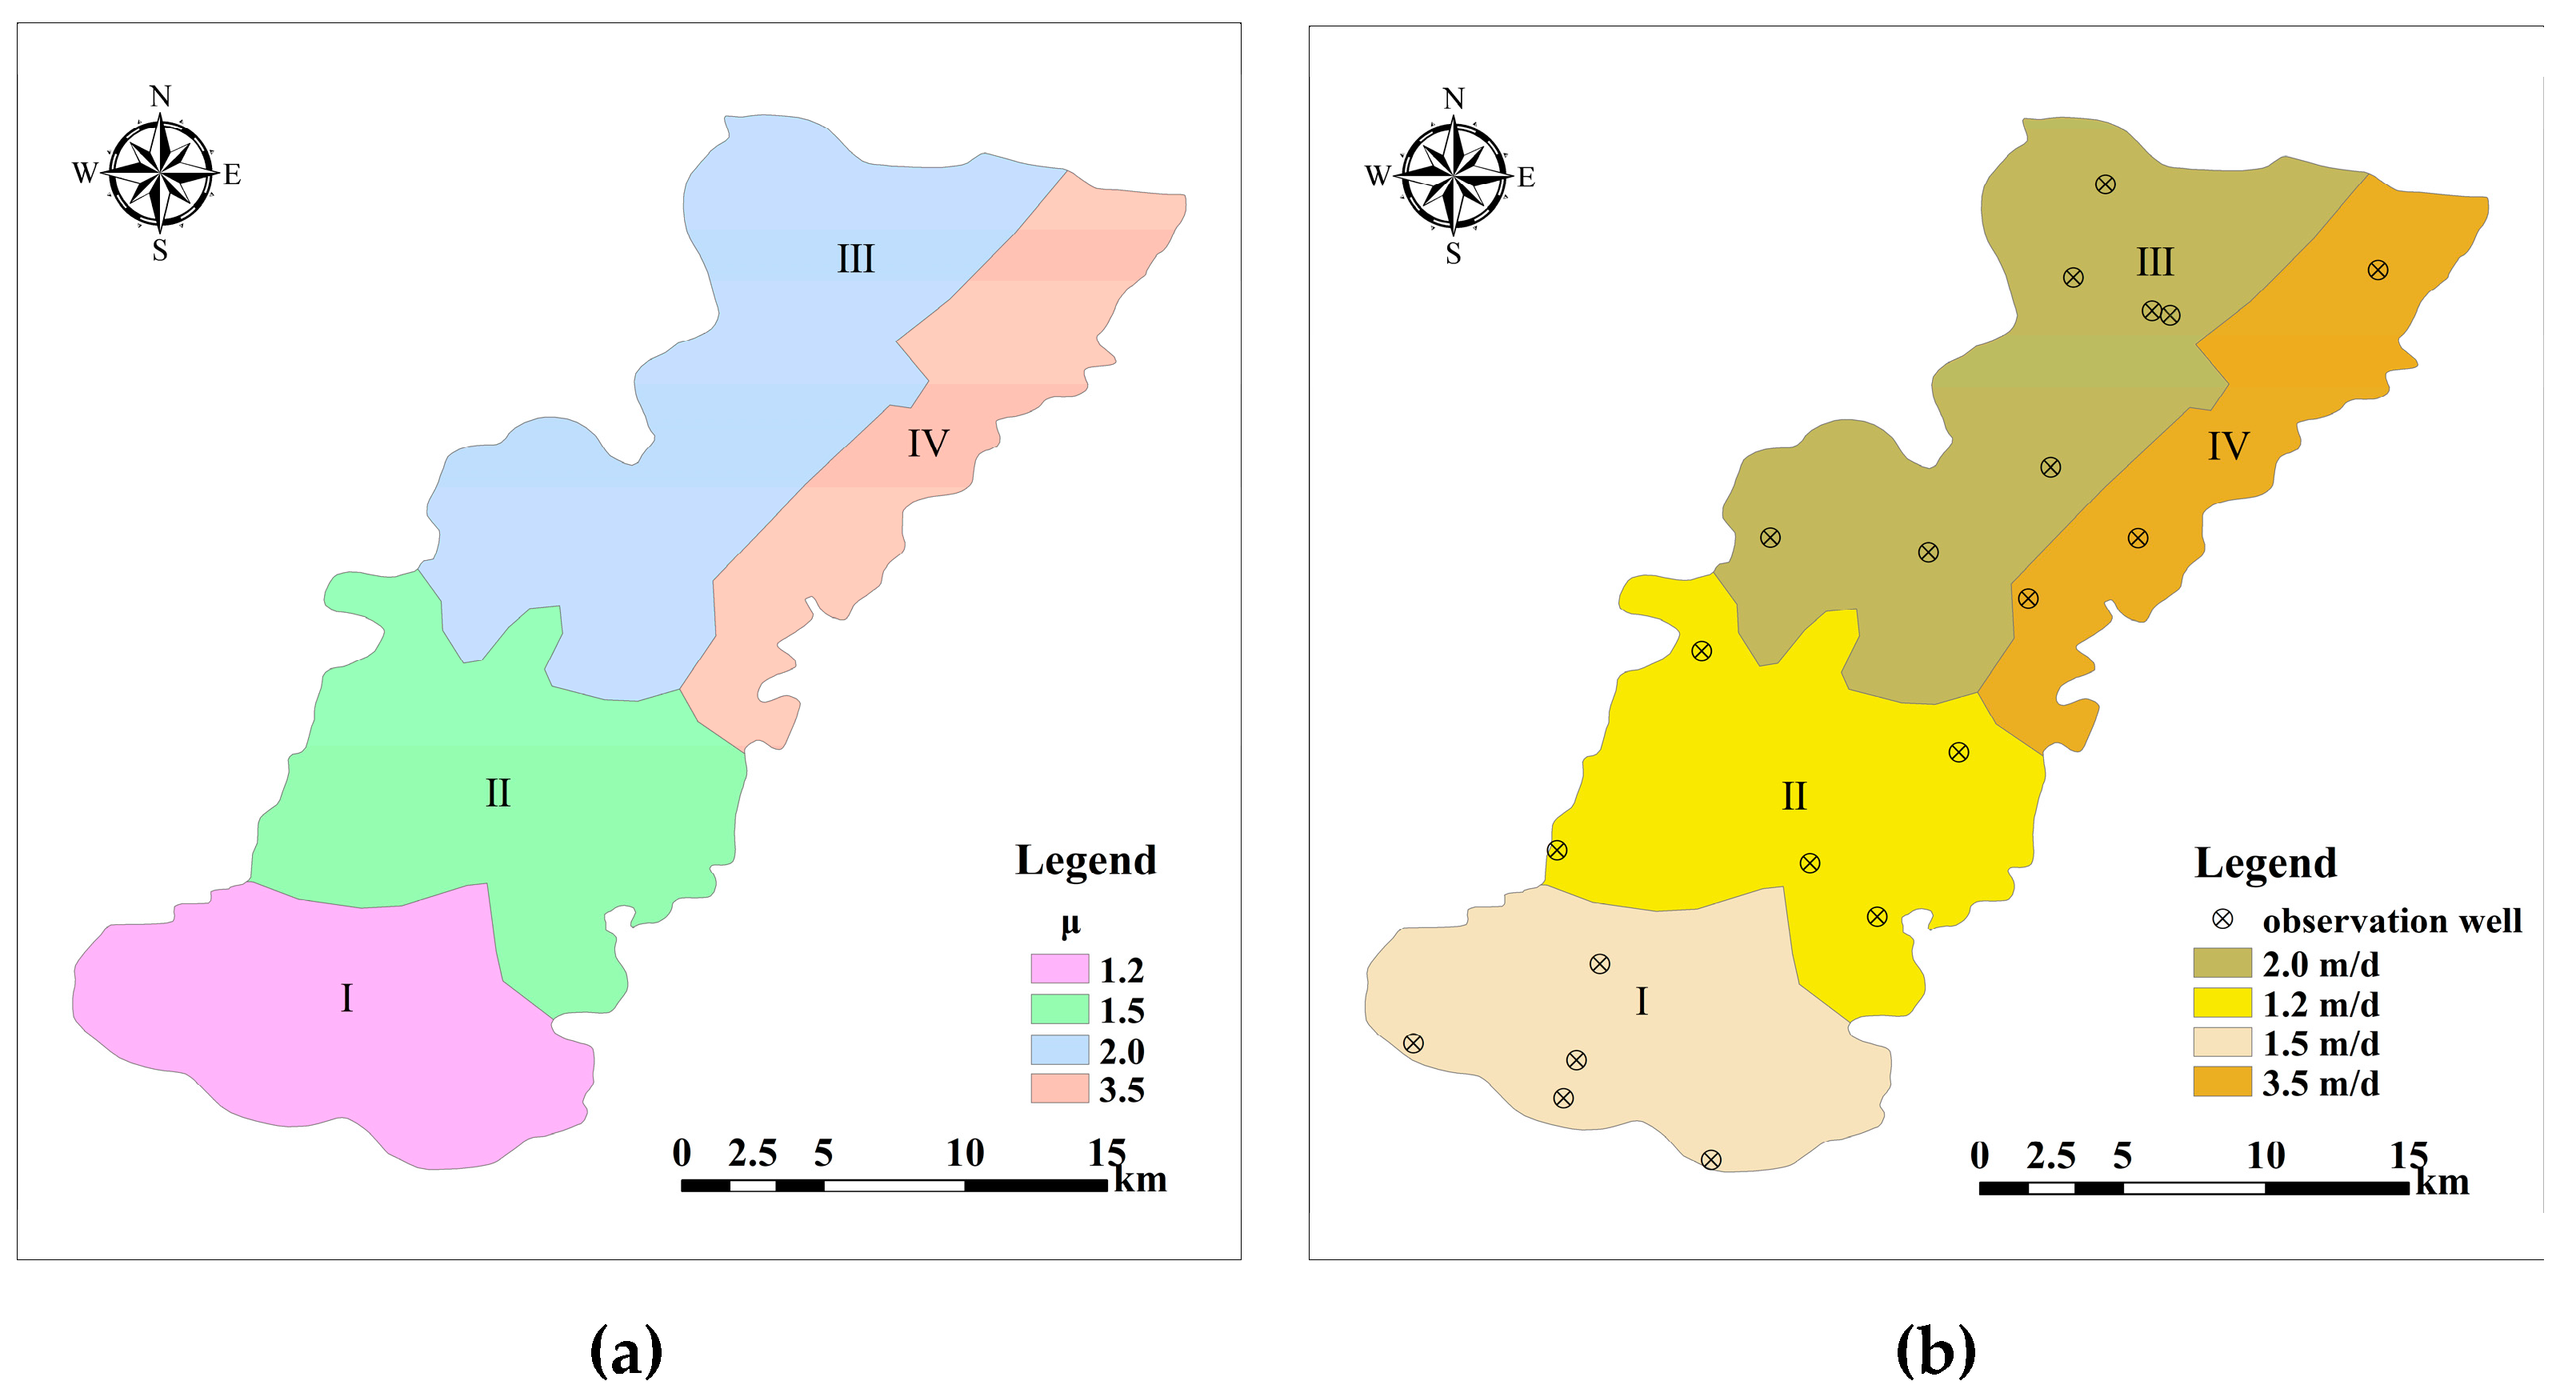
The hydrogeological parameters of Guantao County are determined according to the relevant hydrogeological maps and hydrogeological exploration data of Guantao County. The phreatic aquifer in Guantao County is a loose rock pore aquifer. Its lithology is mainly composed of fine sand, with NE trending silty sand bands scattered. The study area is divided into four areas. The initial values of hydraulic conductivity and water yields are shown in Table 2, and the hydrogeological parameter partitions are shown in Figure 5.
3.1.4. Construction and Solution of Numerical Model
- Spatial subdivision.
The study area is divided into rectangular grid elements by GMS software. After spatial subdivision, the study area is divided into rectangular grid elements, of which about 11,000 rectangular grid elements are in each layer. See Figure 6a for model element subdivision results.
- 2.
- Initial flow field.
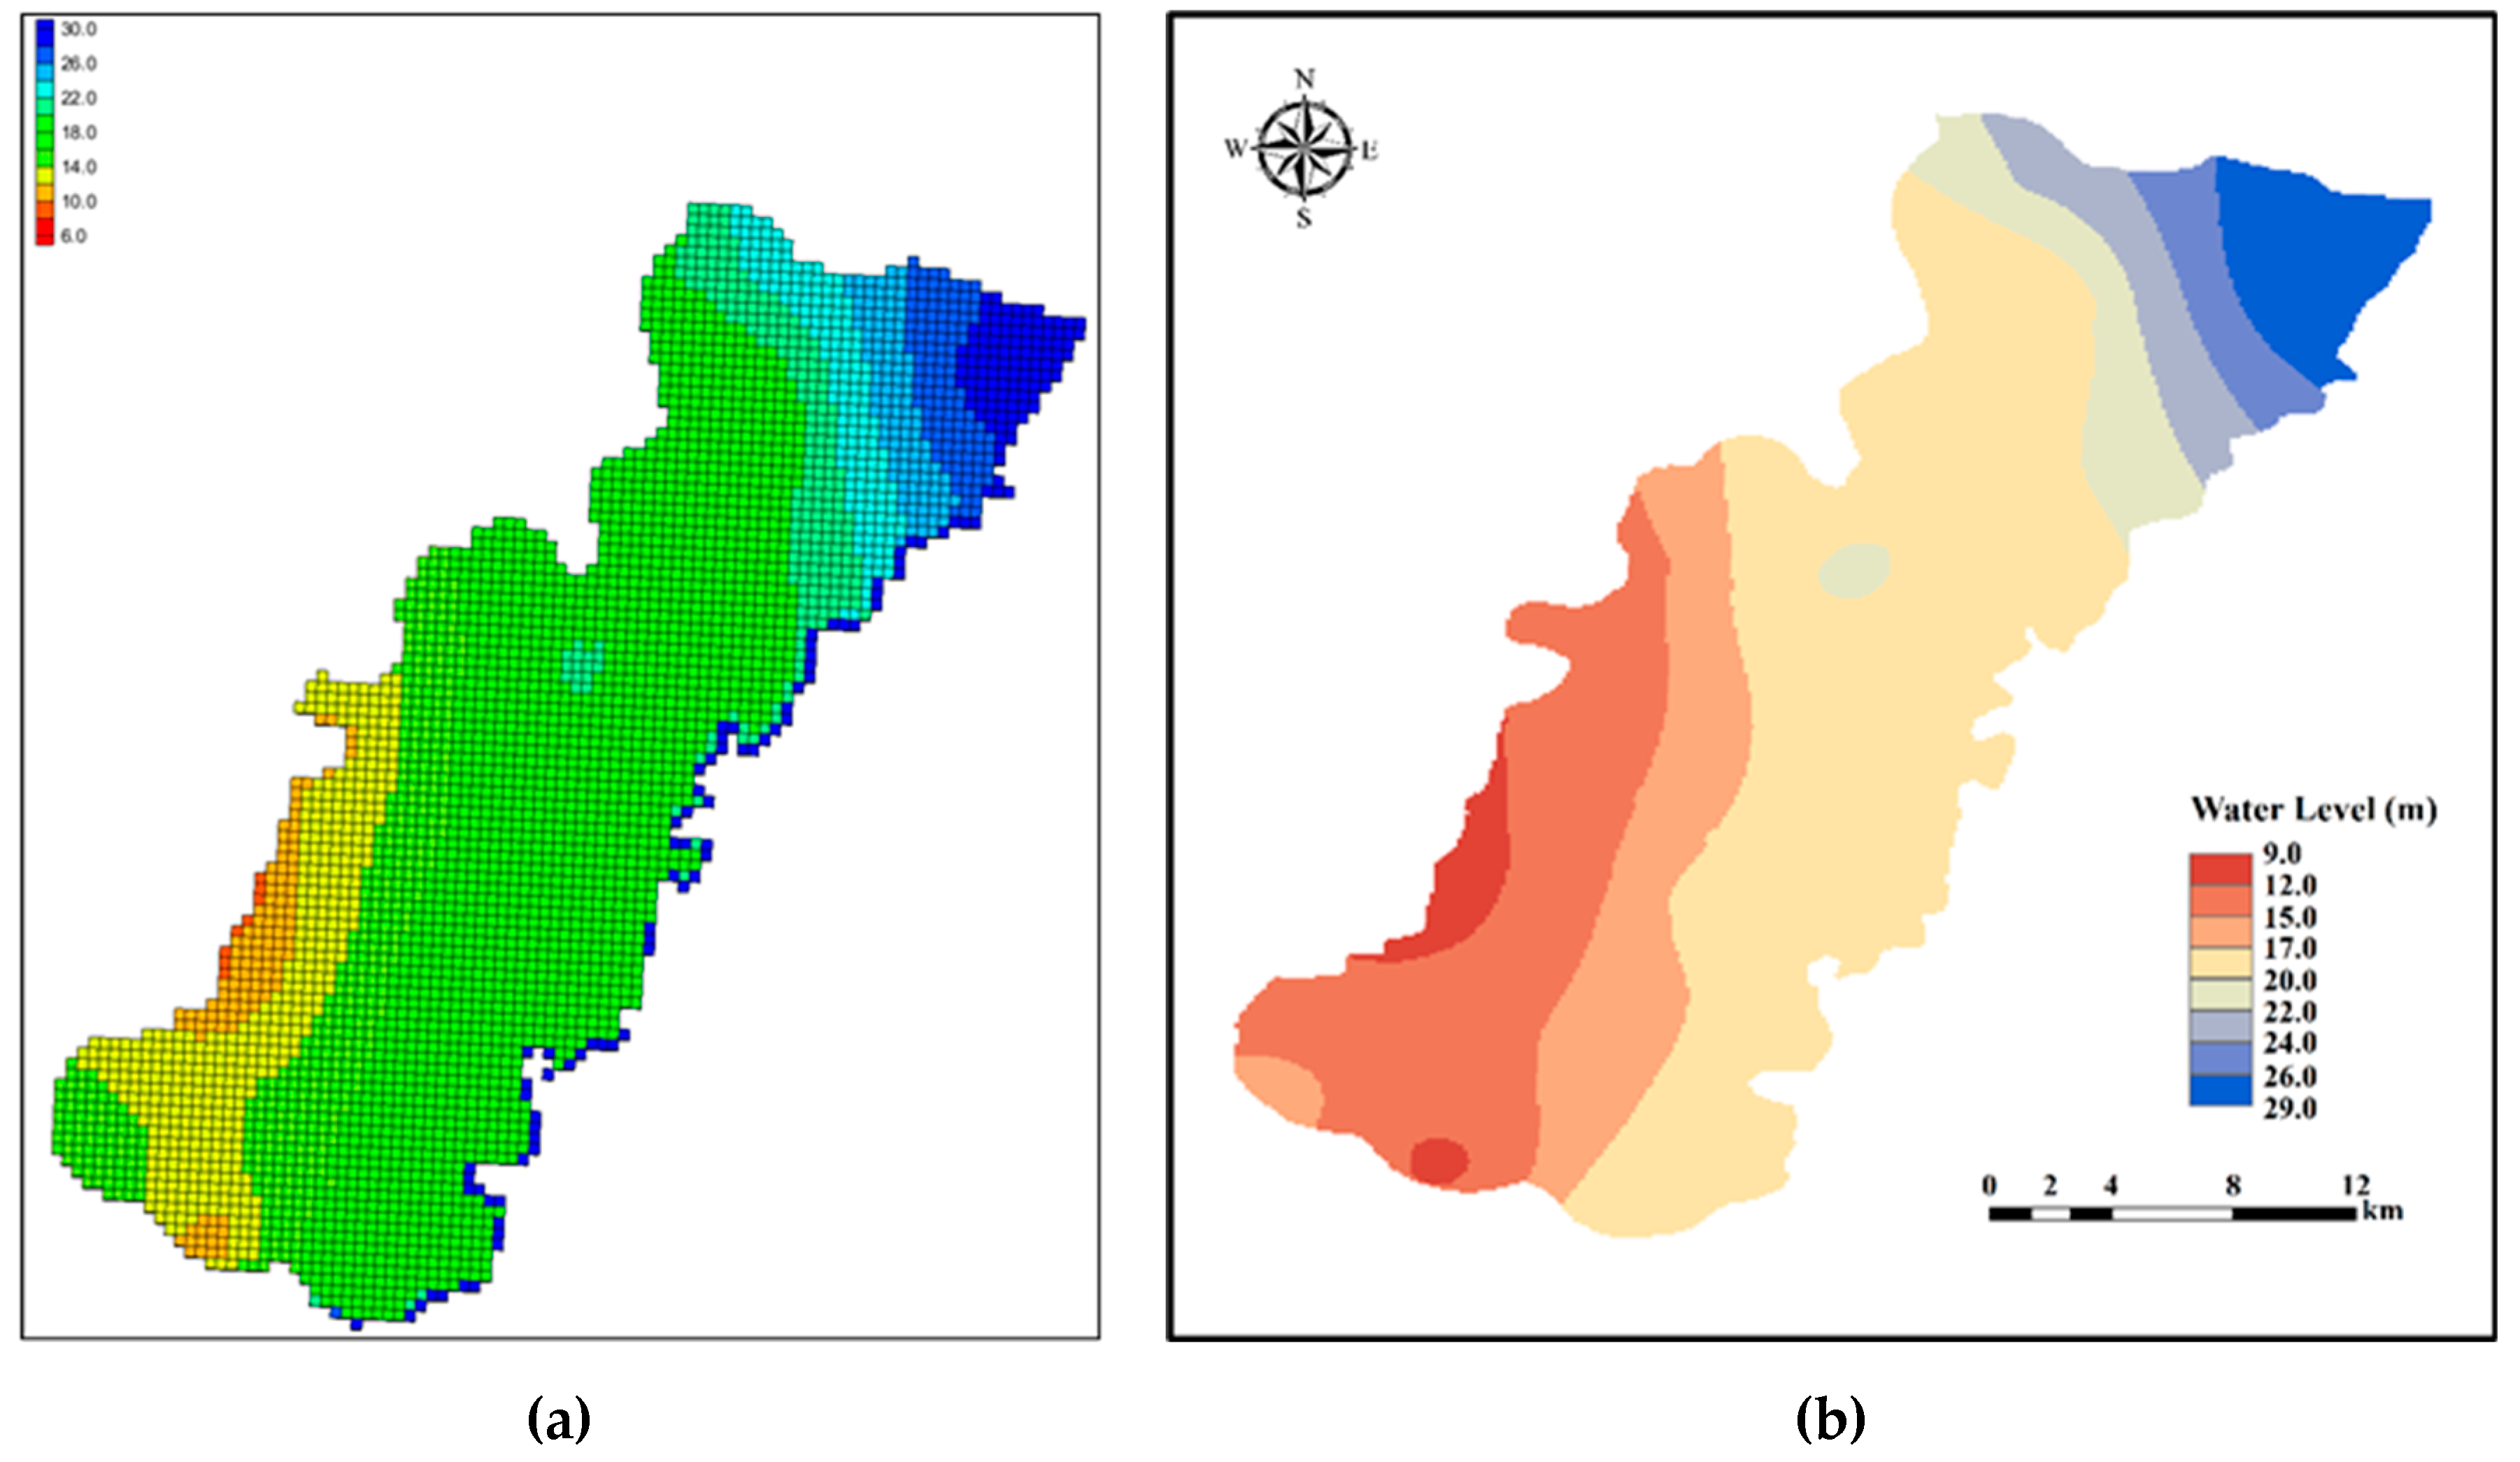
In this study, the initial time of 1 January 2018 was taken. According to the groundwater level of groundwater monitoring wells, Kriging interpolation method is used to draw the initial water level contour of the study area, as shown in Figure 6b. Indicated by Figure 6b, due to the influence of topography, the groundwater level is generally high in the southwest and low in the northeast. Due to the long-term exploitation of groundwater, an obvious depression cone has been formed in Shoushansi area in the west and Fangzhai Town in the south of the study area.
- 3.
- Processing of source and sink items.
The main recharge items include: precipitation infiltration recharge, lateral recharge, irrigation recharge, etc. The main discharge items include: artificial mining, evaporation and lateral discharge. Darcy’s Law is used to determine the lateral supply and discharge at the boundary. The precipitation is multiplied by the precipitation infiltration recharge coefficient to obtain the precipitation infiltration recharge. The determination method of irrigation infiltration recharge and evaporation discharge is the same as that of precipitation infiltration recharge. The mining yield is input into the model in a well form.
3.1.5. Model Identification and Verification
The identification period of the model is from May 2018 to May 2019. The identification period of the model is an inversion process. According to the formation lithology characteristics of each parameter partition, and combining with the obtained initial hydrogeological parameters, the calculated water level at the monitoring well is consistent with the measured water level through appropriate adjustment of hydrogeological parameters within a reasonable parameter value range, and the water level change trend is generally consistent with the measured water level change trend. The verification period of the model is from May 2019 to December 2019. The model verification period is a forward process, that is, the parameters are kept unchanged, and observe whether the calculated water level of the monitoring well and the trend are consistent. If the two are consistent and the trend is consistent, it indicates that the model can objectively reflect the actual situation of the study area.
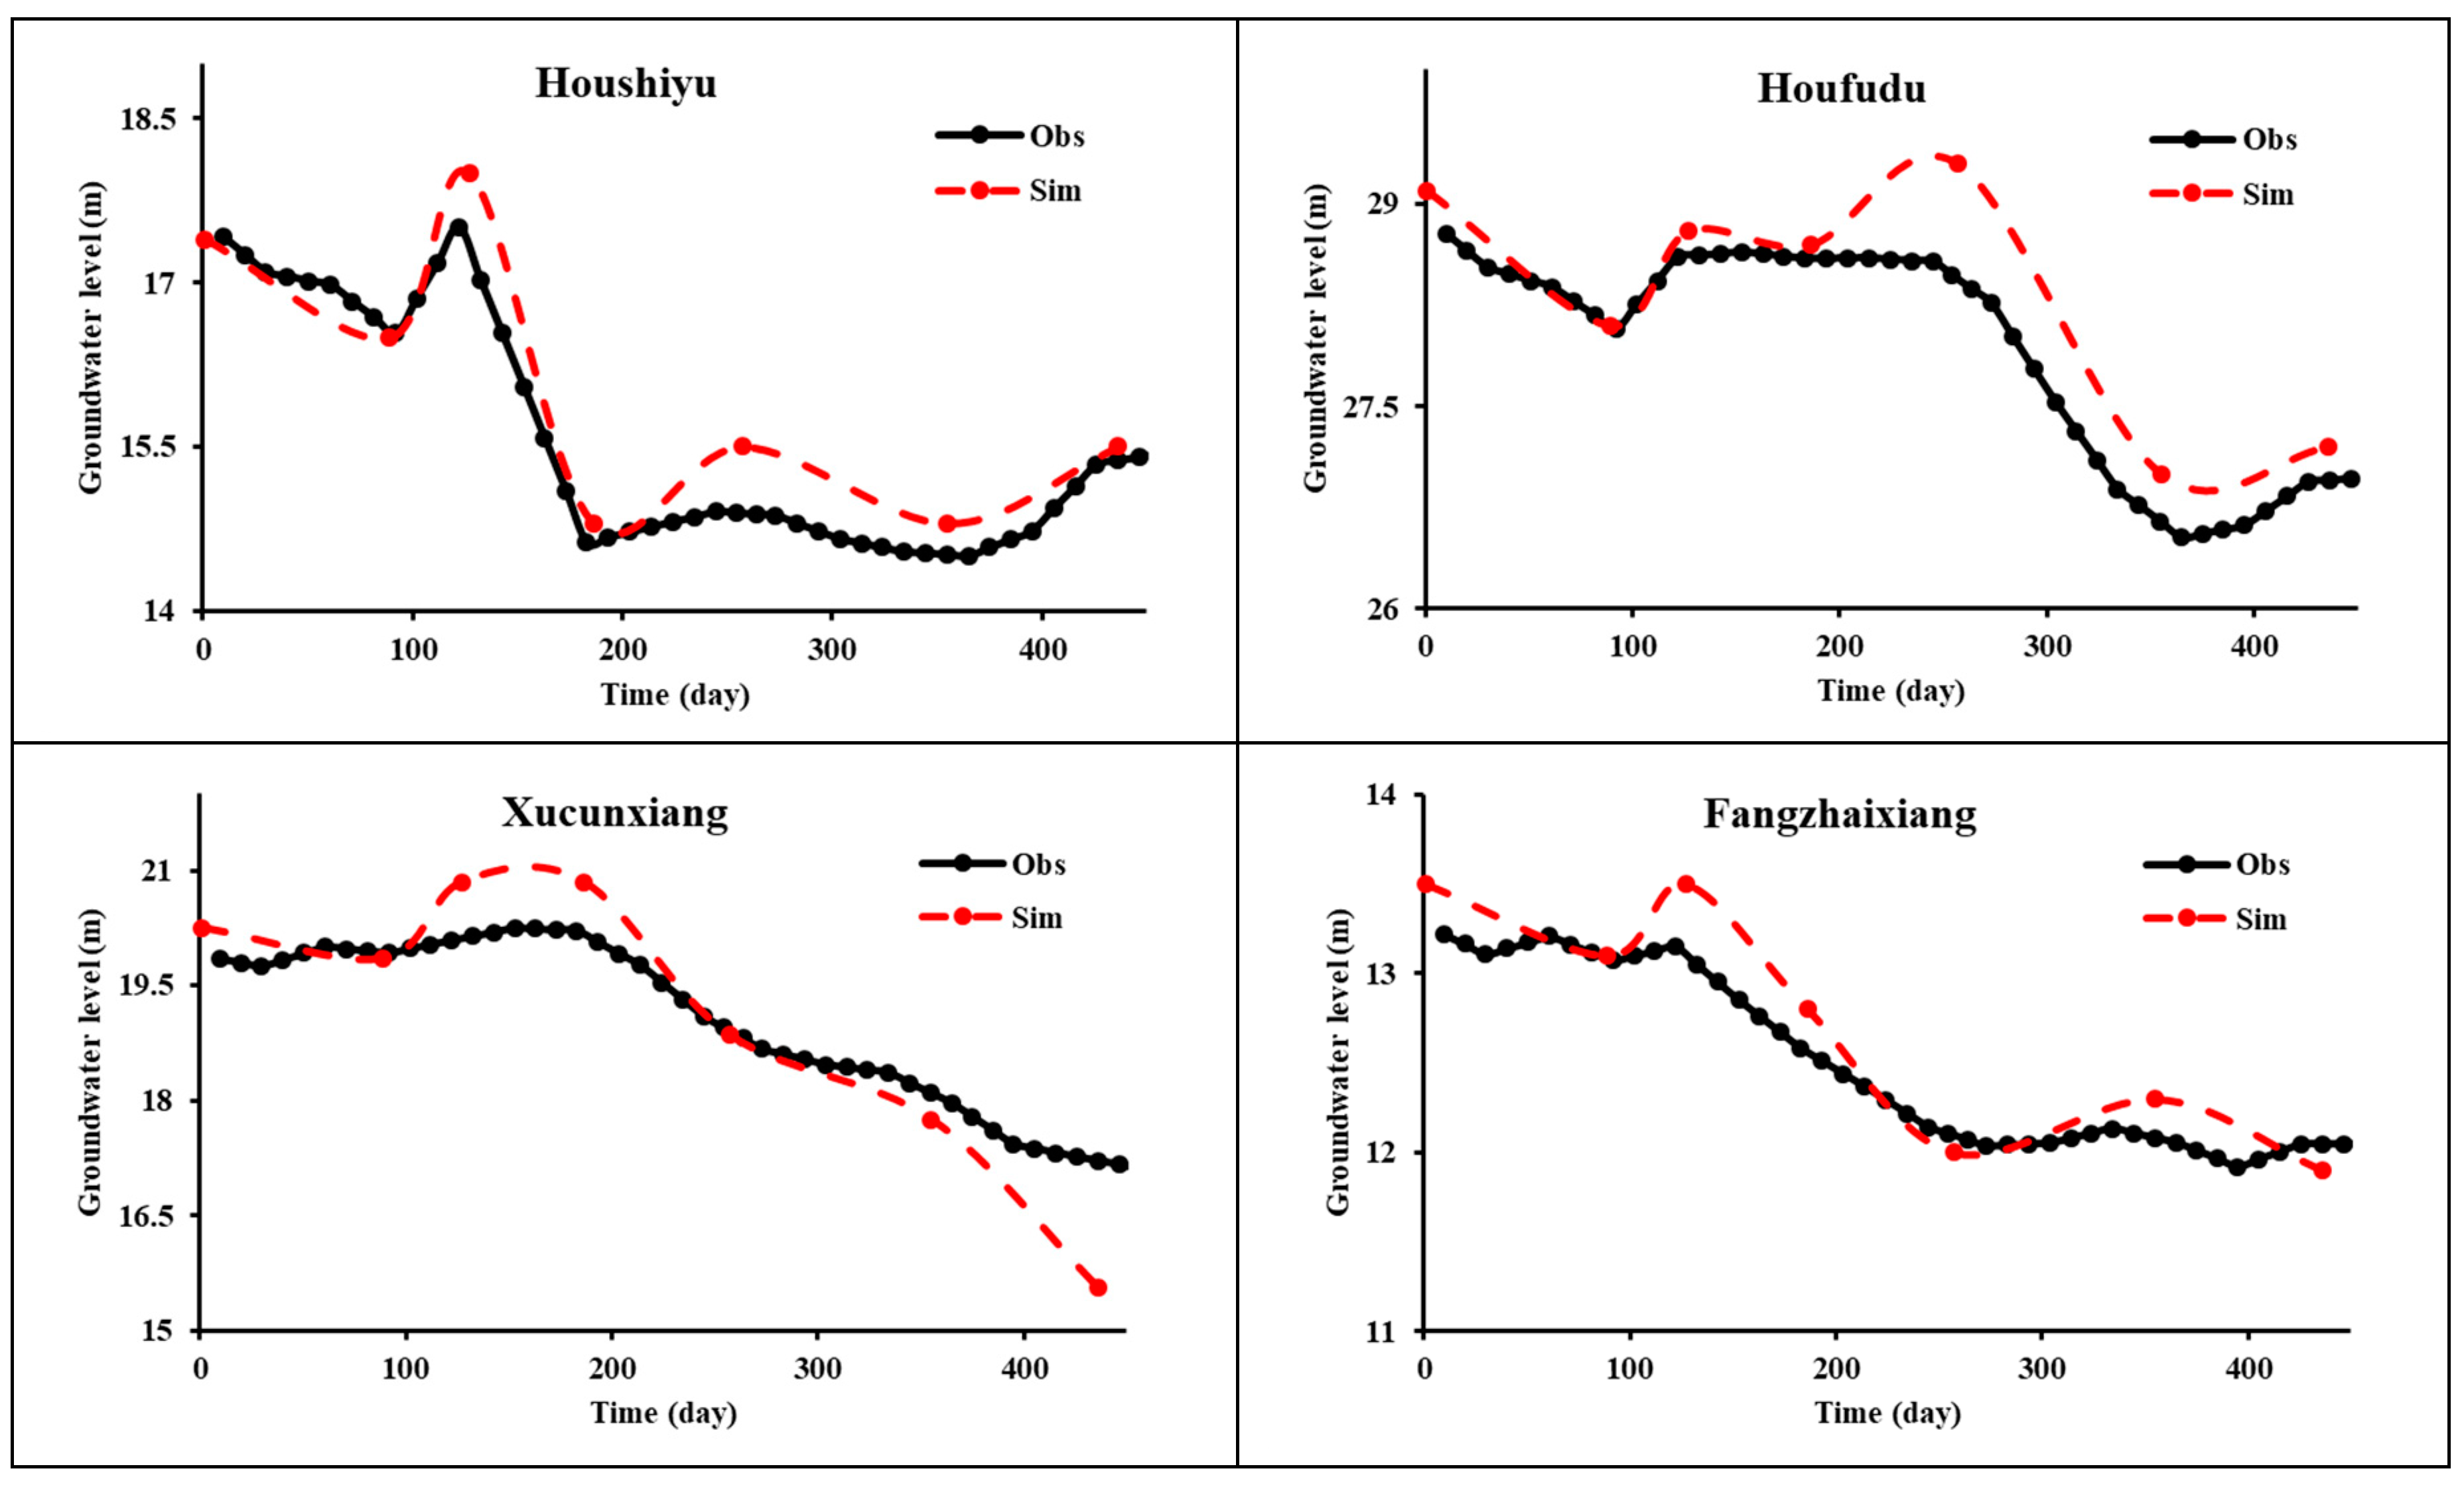
After identification and verification, the comparison of historical changes between the calculated water level and the measured water level of some groundwater monitoring wells in the study area is shown in Figure 7. It can be seen from the Figure that the calculated water level of the monitoring well is well fitted with the measured water level, and the constructed groundwater seepage numerical model can objectively reflect the actual situation of the study area. The model simulation error statistics are shown in Table 3. From Table 3, it can be seen that the model MAE and RMSE are both lower than 0.5 m, with high accuracy, and can be used to predict the groundwater level situation in this region.
3.2. Prediction Results of Social and Economic Development and Water Demands
This study analyzes the water supply source and water supply quantity of Guantao County in the base year, and predicts the water supply capacity of the study area in the planning target year according to the Surface Water Allocation and Utilization Plan of Hebei Province. Comprehensively considering the local social and economic development plan, total water consumption control index and water efficiency control index, this study adopts the scenario analysis method to formulate two schemes of high growth and moderate growth, respectively, according to the two scenarios of enhanced water saving and moderate water saving. A total of four water demand scenarios are combined to analyze and predict the social and economic development and water demands of Guantao County. See Table 4 for the setting of water demand prediction scheme.
3.2.1. Analysis and Prediction of Water Supply
Water supply quantity refers to the sum of gross water supply quantity provided by various water source projects to users, including water transmission loss. The total water supply quantity of the existing water supply facilities in Guantao County in 2019 is 84.7 million m3. Among them, the water supply quantities of surface water, groundwater, external diverted water, brackish water and reclaimed water are 38.25 million m3, 32.5 million m3, 4.95 million m3, 7 million m3, and 2 million m3, respectively, accounting for 45.16%, 38.37%, 5.84%, 8.26%, and 2.36% of the total water supply quantity, respectively. The surface water supply source mainly comes from the Wei Canal and the Yellow River Diversion Project in the east of the study area, the groundwater source comes from 9019 motor-pumped wells in the study area, the external diverted water source comes from the South-to-North Water Transfer Middle Route Project, and the reclaimed water source comes from the reclaimed water of Guantao County sewage treatment plant. The water supply capacity of the current water supply project in the study area is 103 million m³. According to the Surface Water Allocation and Utilization Plan of Hebei Province, by the end of 2025, the Weixi New Canal Connection Project and Shennong Canal Project will be added in Guantao County, and the Matou, Xiaocun and Shenjie pump stations will be started. It is estimated that the water supply capacity of 5.6 million m³ will be increased. Therefore, the estimated water supply capacity of Guantao County in the planning target year is 108.6 million m³.
3.2.2. Prediction of Social and Economic Development
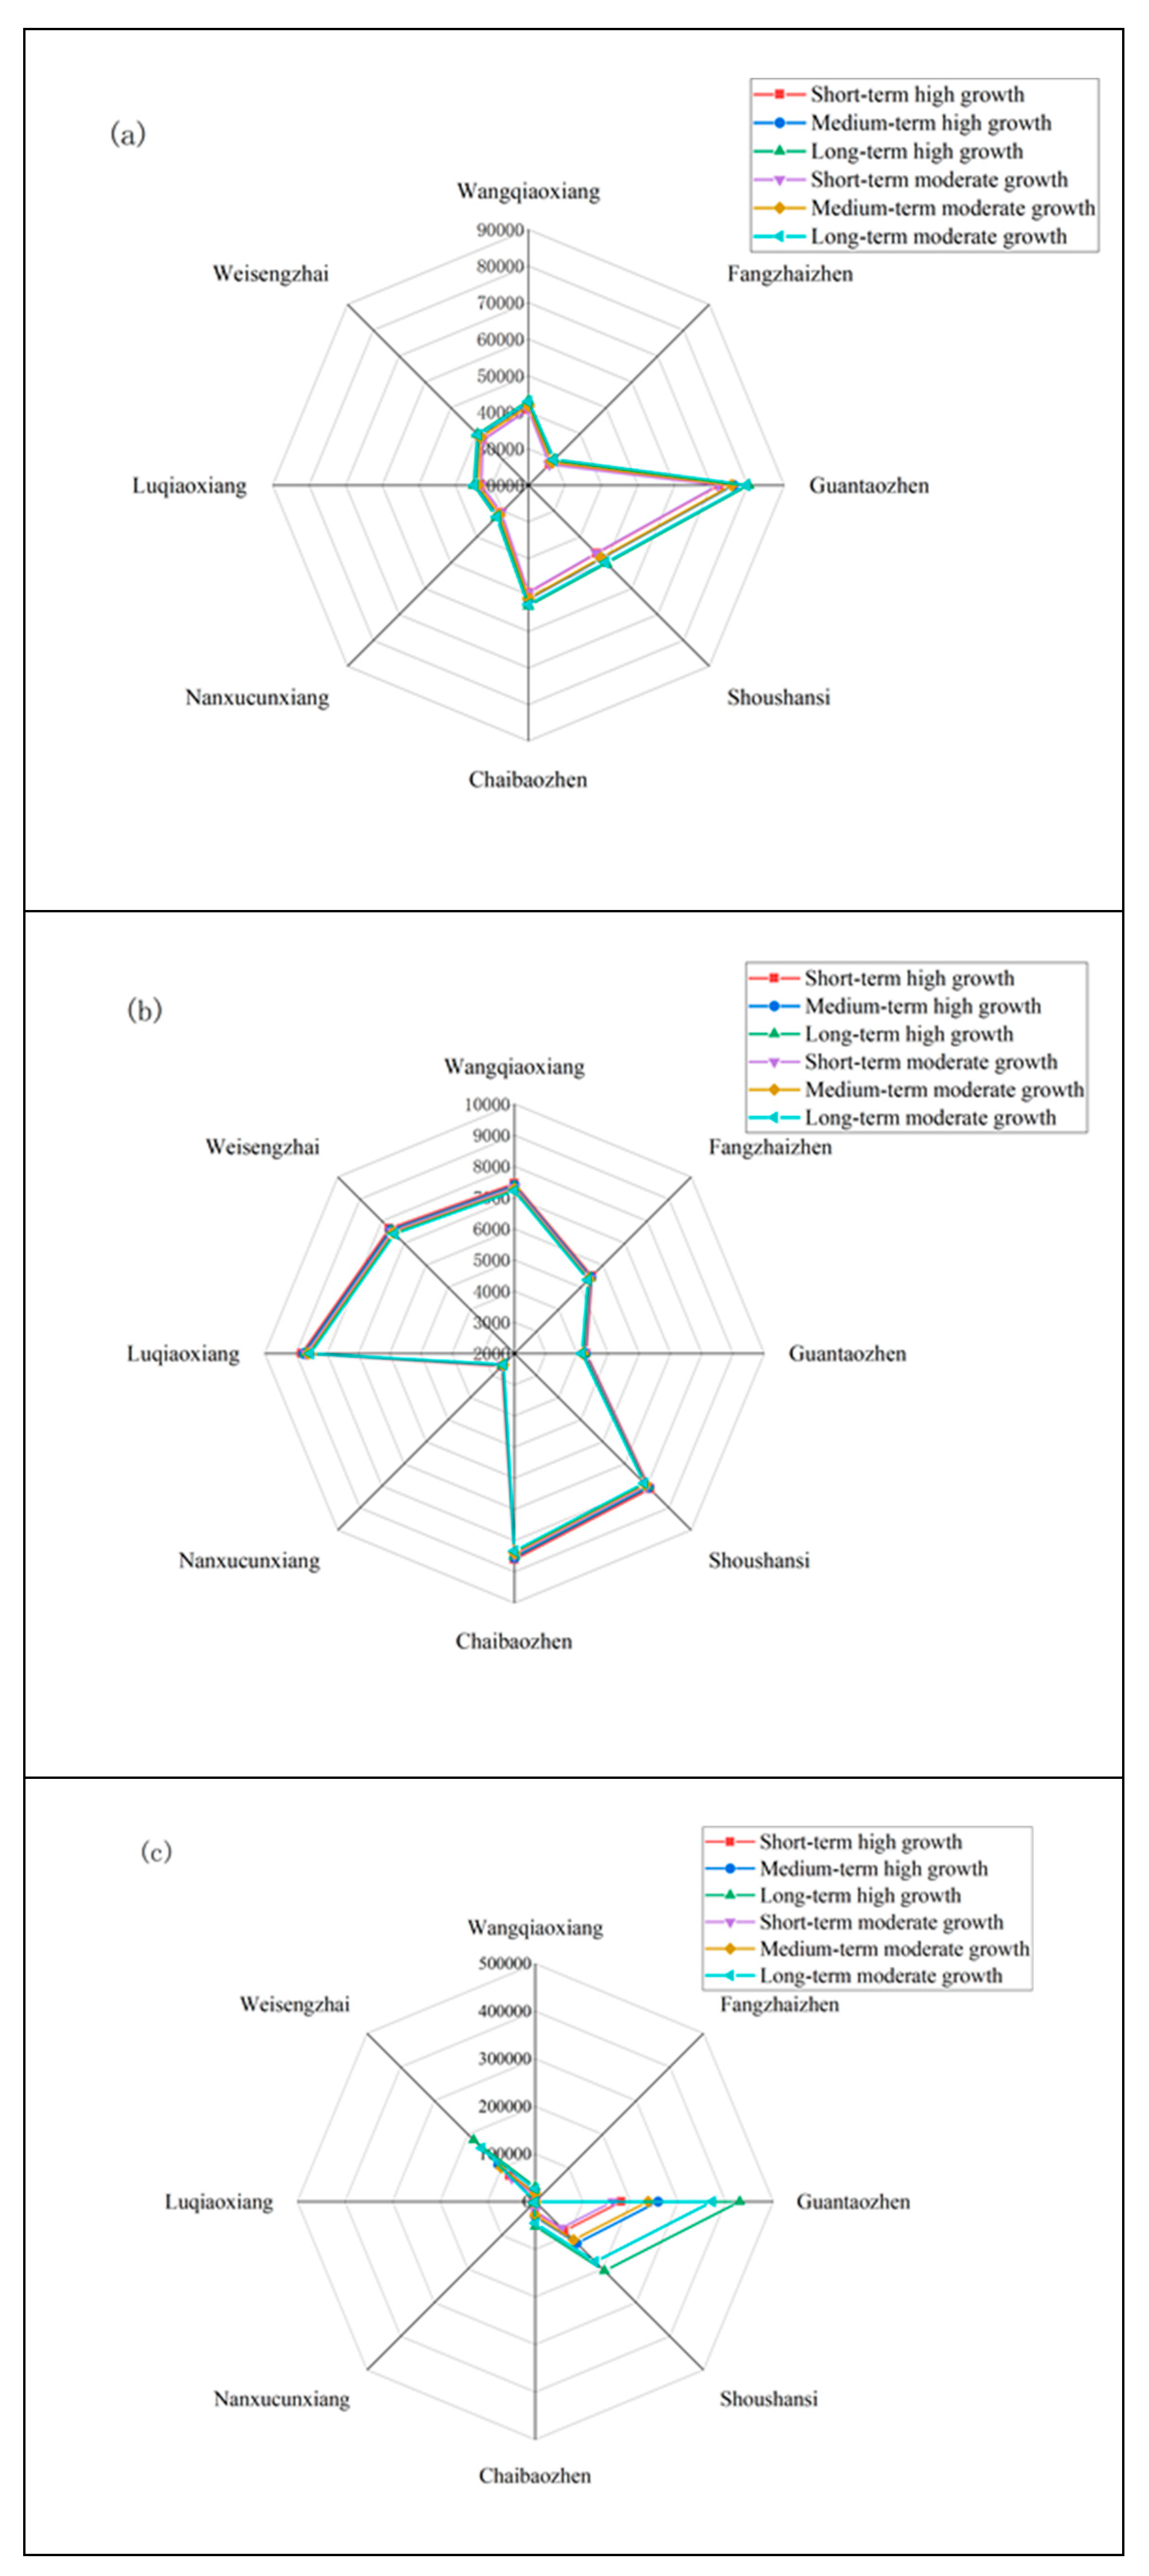
The main contents of prediction of social and economic development include population prediction, agricultural irrigation area prediction and industrial added value prediction. The short-term (2021–2025), medium-term (2026–2030), and long-term (2031–2035) social and economic development prediction results of Guantao County are shown in Figure 8 under the scenarios of high growth and moderate growth. The results show that in terms of population, Guantao Town, Shoushansi and other areas with relatively high urbanization rates have a large population and a relatively large growth rate; in terms of irrigation area, the agricultural irrigation area in Guantao County is widely distributed on both sides of the Weixi Main Canal, of which the length is long in Luqiao Township and Chaibao Town, so the irrigation area is significantly higher; and in terms of industrial added value, the main industrial enterprises in Guantao County are distributed in Guantao Town and Shoushansi, and the industrial enterprises in the other townships are relatively few.
3.2.3. Prediction of Water Demand
Based on the prediction results of social and economic development, this study adopts the quota method to predict the water demands of different industries in Guantao County. The results are shown in Figure 9, which indicates that the agricultural water demand under each scenario is significantly higher than that of other industries, followed by the urban domestic water demand. With the continuous improvement of China’s attention to the ecological environment in recent years, the proportion of water demand of ecological environment is also relatively high. With the development of urbanization and industrialization, the water demands of urban life, industry, and ecological environment are gradually increasing. At the same time, the popularization of agricultural water-saving technology makes the water demand in agriculture and rural areas gradually decline. In addition, due to the relatively small scope of the study area, the water demand in the high growth scenario increases by 2–3% compared with that of the moderate growth scenario, and the water demand in the moderate water-saving scenario increases by 2–4% compared with that of the enhanced water-saving scenario.
3.3. Analysis of Optimal Water Resource Allocation Results
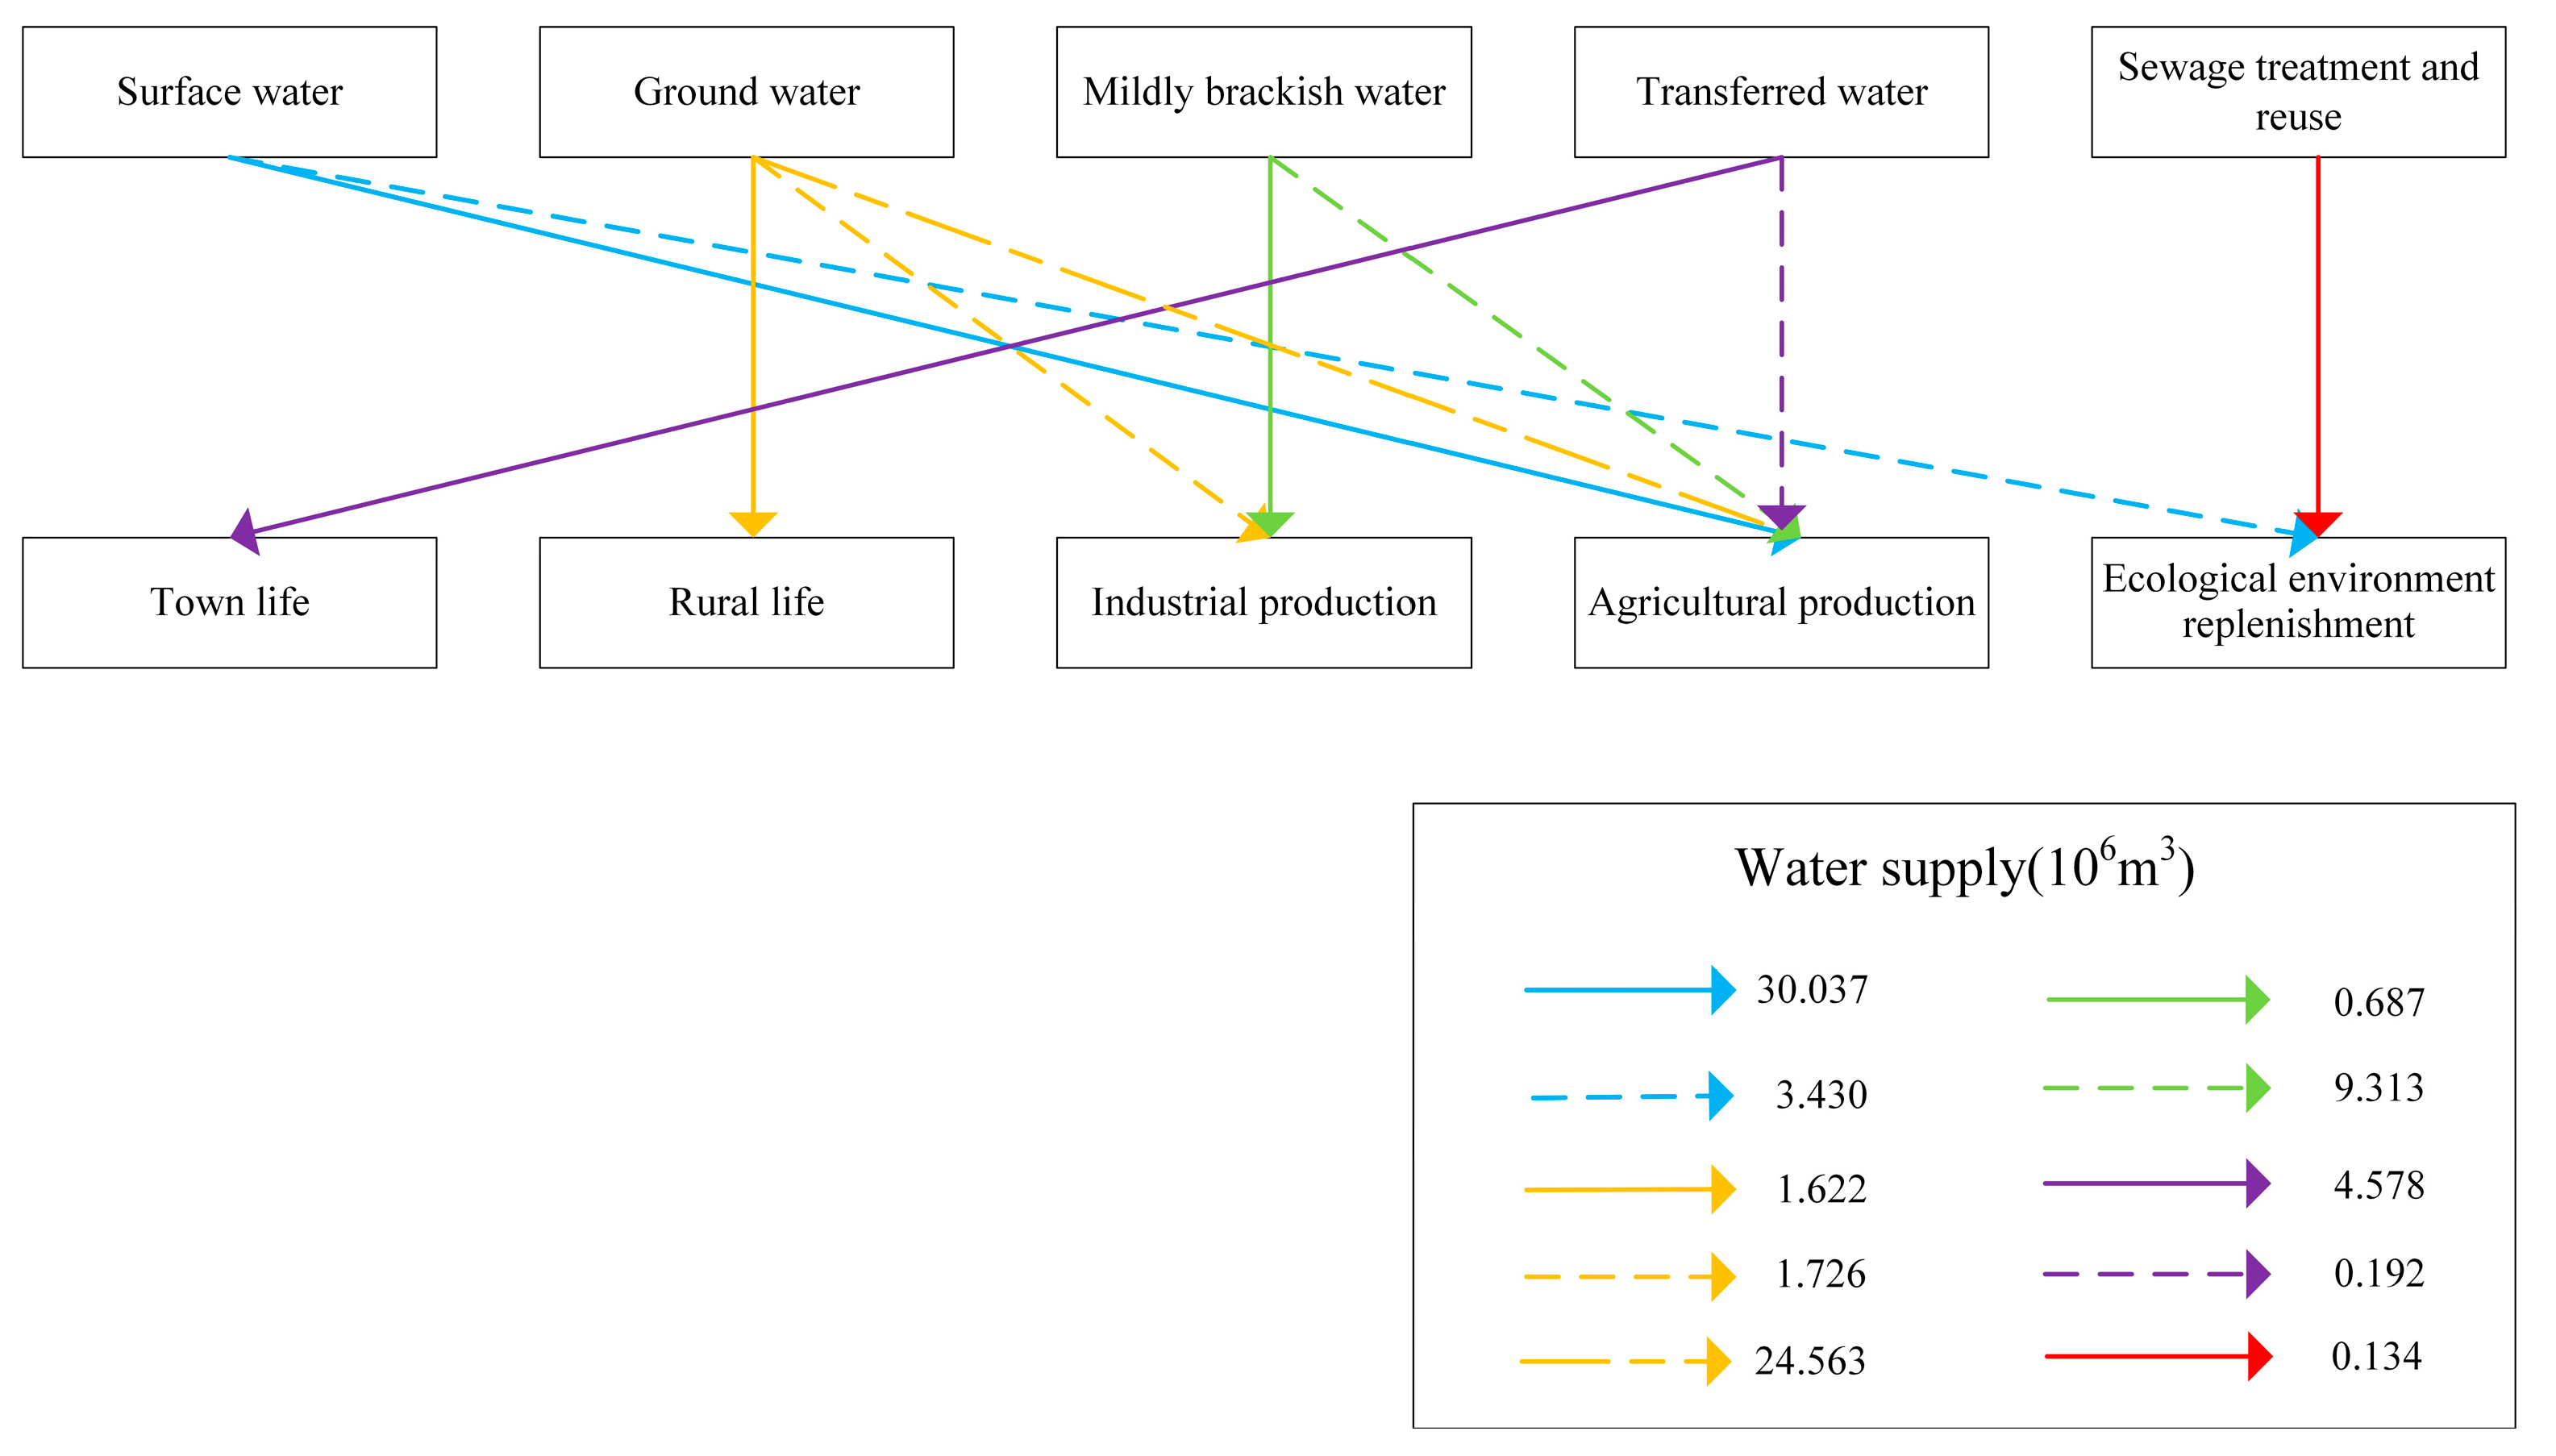
According to the proposed three water demand schemes in different planning target years, which are respectively the high scheme (high growth and moderate water saving), medium scheme (high growth and enhanced water saving) and low scheme (moderate growth and moderate water saving), the water resources allocation results of different schemes in the planning target year of the study area are obtained through the calculation with the water resources allocation module, as shown in Table 5. The relationship between water supply and demand between different water sources and different users is shown in Figure 10.
The overall supply–demand structure of the low scheme is basically reasonable through the reasonable allocation of water sources. The depth of water shortage is the least of the three schemes. It belongs to the way of “determining production by water and taking connotative development”. In the planning year, it inhibits the agricultural development of the county so as to control water shortage, and it is a better scheme from the perspective of water resource supply–demand balance. However, the scheme limits the social and economic development of Guantao County to a certain extent and hinders the development strategy of “striving to build Guantao County into a sub-central city with great radiation in the border area of Hebei, Shandong and Henan and the most influential rural tourism destination in the central south plain of Hebei”, thus, it is not the preferred allocation scheme.
The high scheme adopts the mode of “determining water consumption by production and taking epitaxial development”. Under the development goal of fully supporting social and economic development and building a sub-central city and ecotourism destination, it controls agricultural water consumption and increases industrial water consumption. Therefore, it is also the scheme with the highest water shortage. Although the quantity of water diverted from Wei Canal and the Yellow River and the water network coverage can be increased by building the water system connection project in the planning target year, considering the difficulty and complexity of the external water transfer project, there are still a lot of feasibility studies and preliminary demonstration work to be invested. Therefore, it is difficult to realize the large surface water supply quantity and scale by 2035. Thus, this scheme is not recommended as a priority scheme but a reservation scheme.
The medium scheme adopts the mode of “supply and demand coordination and steady and healthy development”. In the planning target year, it improves the water use efficiency of various industries and comprehensively realizes the balance of regional groundwater exploitation and recharge by controlling groundwater overexploitation. In this way, under the water supply conditions of the established South-to-North water transfer project, it can not only meet the new social and economic, industrial and agricultural water demands, but also save costs and make the rational use of various resources. Therefore, it can be used as a recommended scheme. The results of water resources allocation of each calculation unit in 2030 under the medium scheme are shown in Table 6. It can be seen from Table 6 that by increasing the development and utilization of brackish water, the brackish water agricultural area of Nanxu Village, the brackish water agricultural Chaibao area 2 and the industrial area of Guantao Town will achieve the balance between supply and demand of water resources. For Shoushansi water-saving agricultural area which does not have brackish water resources, the local conventional water resources cannot support the regional agricultural economic development, so it is also the area with the highest water shortage.
4. Discussion
4.1. Results of Brackish Water Allocated According to Industry under the Recommended Scheme
The water resources allocation model constructed in this paper can calculate the quantity of water supplied by different water sources to water users in various industries in different calculation units. Taking the brackish water allocation according to industry of the recommended scheme as an example, the brackish water allocation results in 2030 are shown in Figure 11 which indicate that only the brackish water in Guantao Town is supplied to industry, and the brackish water in other areas is only supplied to agricultural irrigation. The main reason is that the main industrial enterprises in Guantao County are located in Guantao Town and Shoushansi, and there are no brackish water resources in Shoushansi. Therefore, only brackish water in Guantao Town is used for industrial production. At the same time, brackish water consumption is positively correlated with crop yield in saline water areas. In areas with high crop yields (such as Luqiao Township, Weisengzhai Town, Chaibao Town, Wangqiao Township, etc.), the brackish water consumption is also high. The exploitation of brackish water not only relieves the water supply pressure of shallow groundwater and Wei Canal to a certain extent and alleviates the contradiction between supply and demand of water resources, but also reduces the water level of brackish water
4.2. Analysis on Variation Characteristics of Brackish Water Level under Recommended Scheme
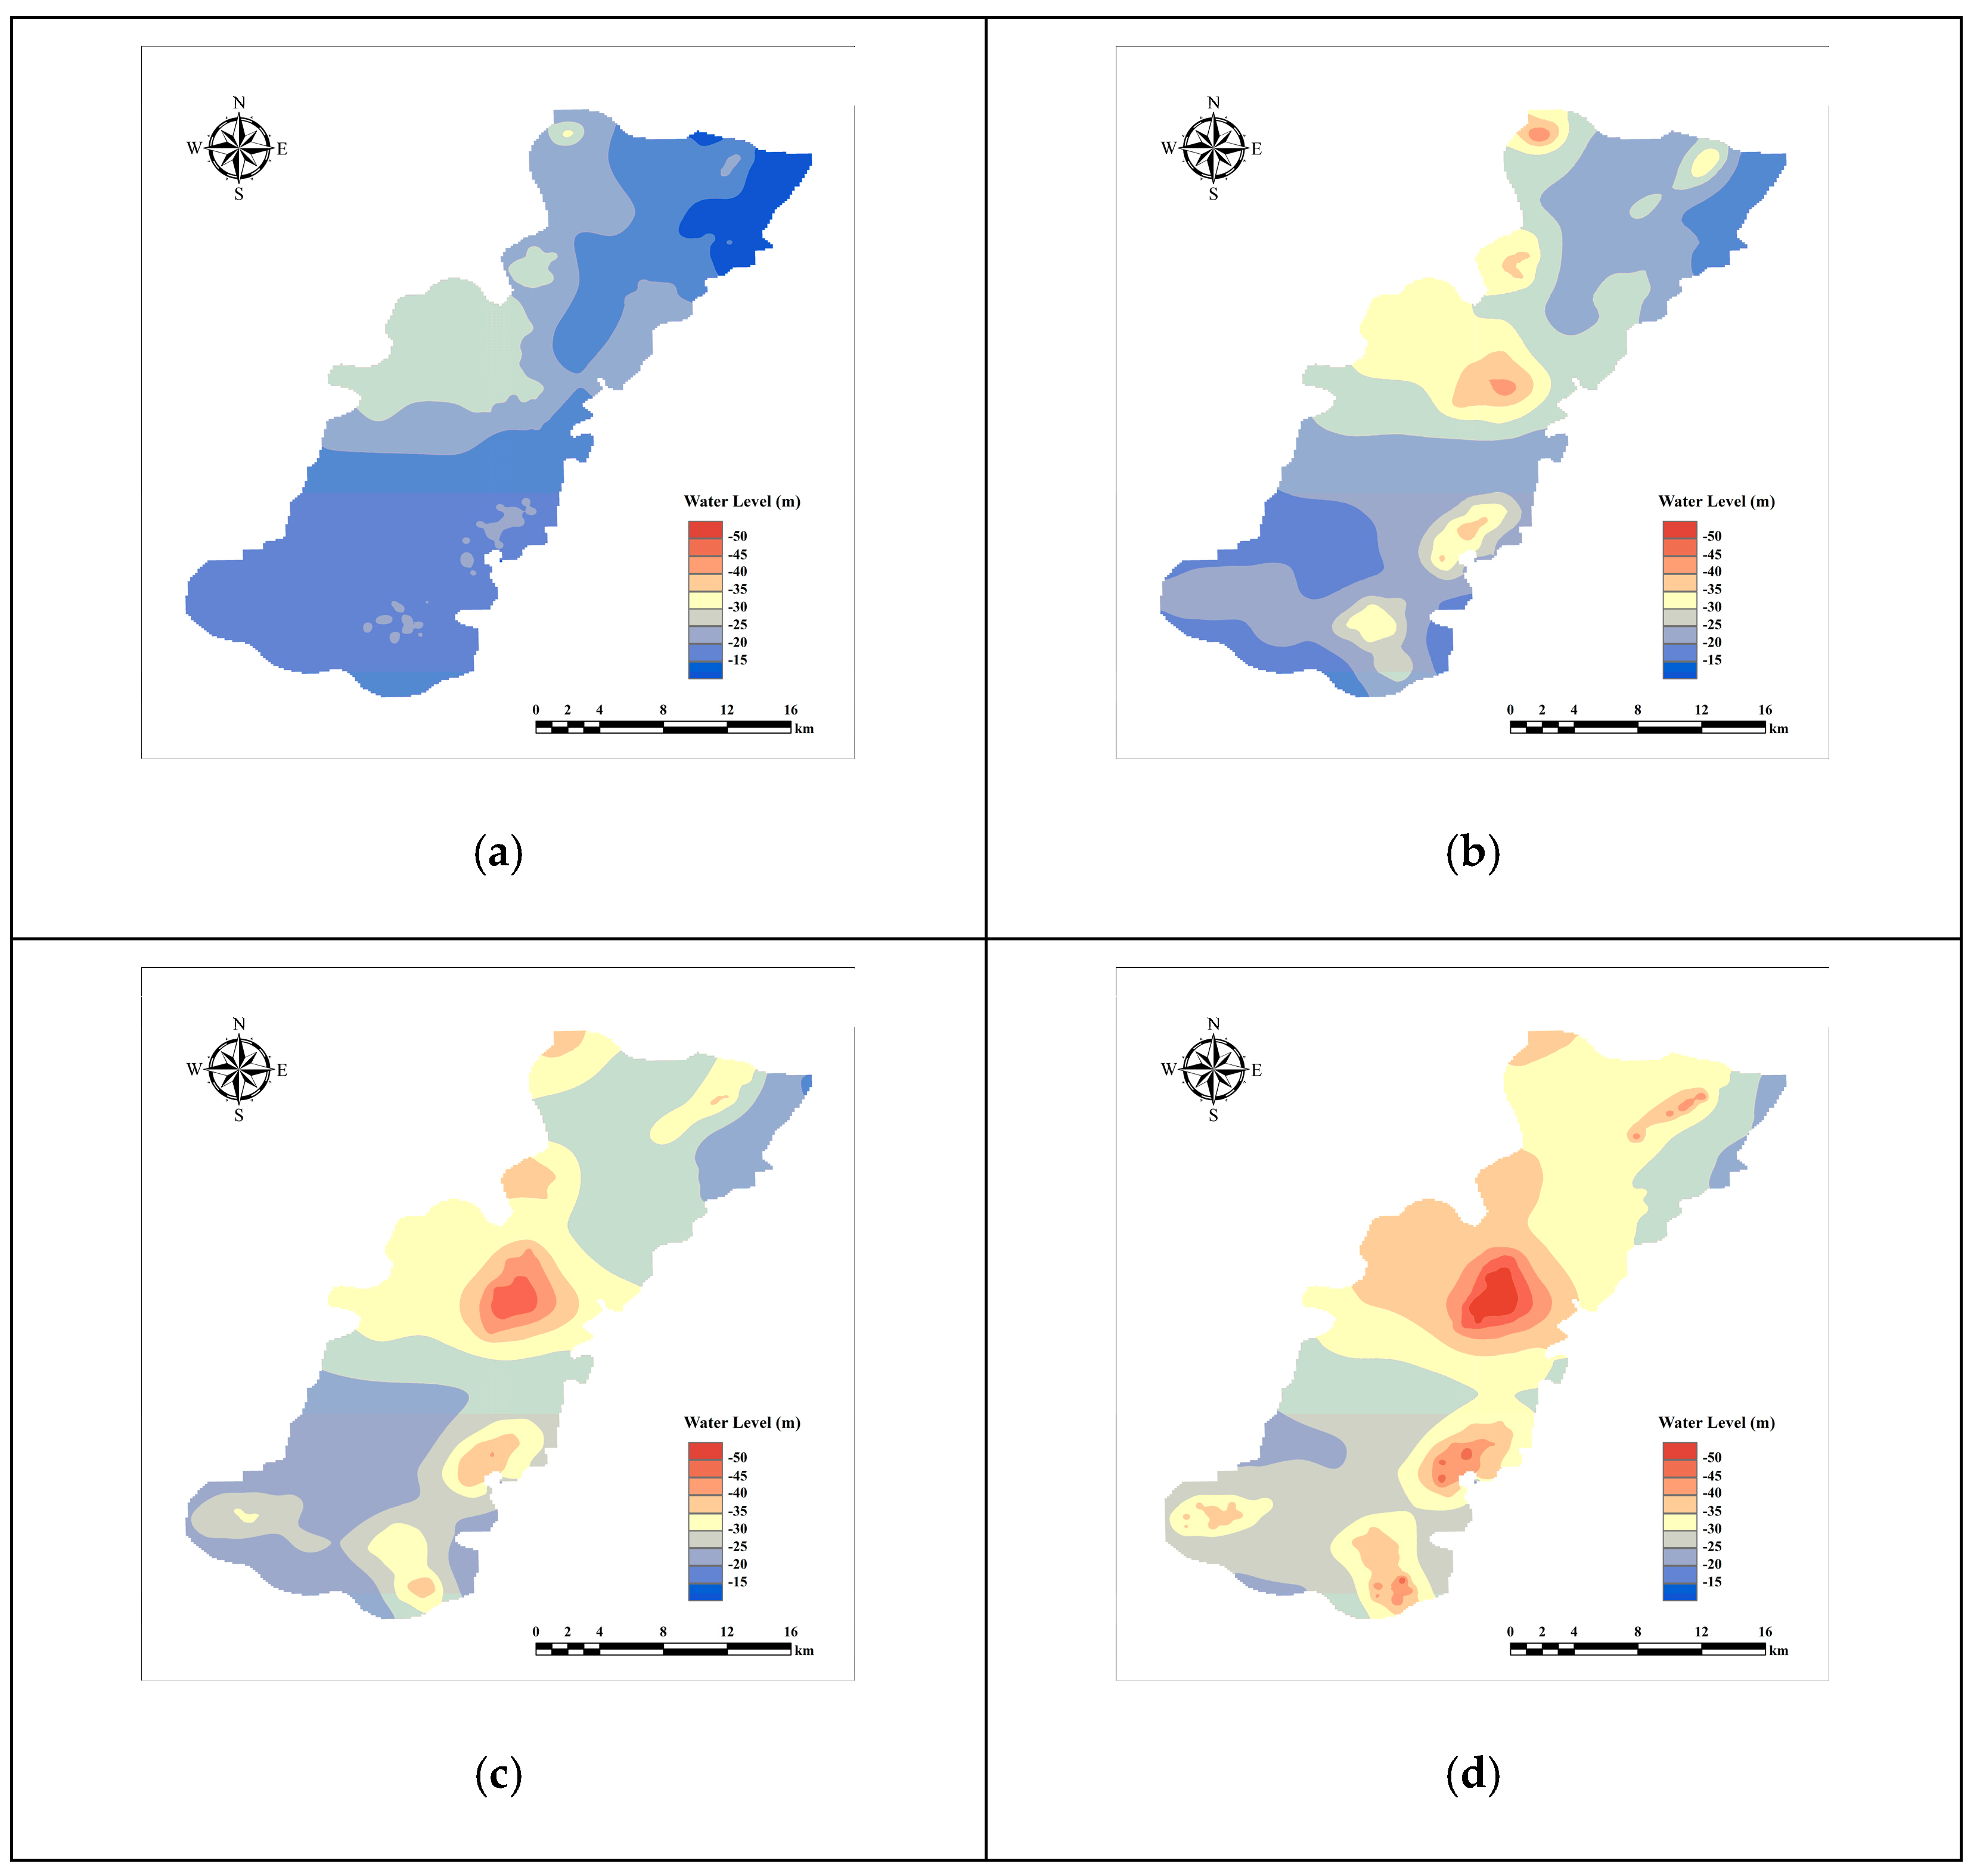
The brackish water allocation results of the medium scheme are substituted into the groundwater model for water level simulation, and the variation results of brackish water level in each planning target year are shown in Figure 12. Figure 12 shows that the brackish water level in the study area decreases from −19.57 m in 2019 to −32.26 m in 2035. In 2035, the highest brackish water level in the study area is located in Weisengzhai Town, with a water level of −24.21 m, and the lowest water level is located in Nanxu Village, with a water level of −53.36 m, forming three brackish water cone areas: Chaibao Town, Guantao Town, and Wangqiao Township. The decline of brackish water level can enhance the regulation and storage capacity of soil aeration zone, promote the vertical alternating movement with shallow groundwater, and realize the desalination of brackish water, so as to increase the quantity of fresh water resources [33]. Therefore, the development and utilization of brackish water under the recommended scheme appropriately reduces the brackish water level, which is conducive to alleviating the demand for fresh water resources for agricultural irrigation and industrial production.
5. Conclusions
- (1)
- This paper proposes an optimal water resources allocation system integrating model data parameter database, water resources supply and demand prediction module, groundwater numerical simulation module and water resources allocation module, expounds the principle of coordinated work among all modules and the relationship between data input and output, and puts forward a method for predicting the change of brackish water level under the allocation scheme by groundwater numerical simulation.
- (2)
- Taking the brackish water resources that are easy to develop and rich in reserves in unconventional water sources as the key allocation object, this paper takes the brackish water resource as the independent water source, aims to meet the comprehensive optimization of social, economic and ecological environmental benefits, and takes the water quantity balance and supply–demand balance as constraints, so as to construct the water resources allocation model based on the rational utilization of brackish water. Then it obtains the quantity of brackish water resources supplied to agricultural irrigation and industrial production of each calculation unit in the planning target year, so as to realize accurate water resources allocation.
- (3)
- This paper applies the water resources allocation system to Guantao County, Handan City. Through scheme comparison, the medium scheme is finally selected as the optimal allocation scheme. Under this scheme, in 2030, the brackish water agricultural area of Nanxu Village, the brackish water agricultural Chaibao area 2 and the industrial area of Guantao Town will achieve the balance between supply and demand of water resources. Compared with the current year, the overall water shortage in the study area is decreased by 4.493 × 10⁶ m³. Meanwhile, under the recommended scheme, the brackish water level in the study area will drop by 12.69 m in 2035. Therefore, while alleviating the tension of water supply of local conventional water sources, it also reduces soil salinization and realizes the coordinated development of society, economy, and ecology in the study area.
Author Contributions
D.Z., methodology, data curation, software; X.X., conceptualization, formal analysis, supervision; T.W., supervision, software; B.W., data curation; S.P., methodology, data curation. All authors have read and agreed to the published version of the manuscript.
Funding
This study was funded by Key R&D Program of Hebei Province (Grant No: 21374201D), National Key Research and Development Program of China (2021YFC3001005) and Hebei Province Water Conservancy Research Plan (2018-73).
Institutional Review Board Statement
Not applicable.
Informed Consent Statement
Not applicable.
Data Availability Statement
Data available upon request due to privacy and ethical restrictions.
Acknowledgments
The authors would like to express their gratitude to the editors and anonymous experts for their constructive comments.
Conflicts of Interest
The authors declare no conflict of interest.
References
- Foster, S.S.D.; Perry, C.J. Improving groundwater resource accounting in irrigated areas: A prerequisite for promoting sustainable use. Hydrogeol. J. 2010, 18, 291–294. [Google Scholar] [CrossRef]
- Cheng, B.; Li, H.; Yue, S.; Huang, K. A conceptual decision-making for the ecological base flow of rivers considering the economic value of ecosystem services of rivers in water shortage area of Northwest China. J. Hydrol. 2019, 578, 124126. [Google Scholar] [CrossRef]
- Wang, Y.; Liu, L.; Guo, P.; Zhang, C.; Zhang, F.; Guo, S. An inexact irrigation water allocation optimization model under future climate change. Stoch. Env. Res. Risk A 2019, 33, 271–285. [Google Scholar] [CrossRef]
- Pacheco-Martínez, J.; Hernandez-Marín, M.; Burbey, T.J.; González-Cervantes, N.; Ortíz-Lozano, J.Á.; Zermeño-De-Leon, M.E.; Solís-Pinto, A. Land subsidence and ground failure associated to groundwater exploitation in the Aguascalientes Valley, México. Eng. Geol. 2013, 164, 172–186. [Google Scholar] [CrossRef]
- Lu, Z.; Wei, Y.; Xiao, H.; Zou, S.; Ren, J.; Lyle, C. Trade-offs between midstream agricultural production and downstream ecological sustainability in the Heihe River basin in the past half century. Agr. Water Manag. 2015, 152, 233–242. [Google Scholar] [CrossRef]
- Kapetas, L.; Kazakis, N.; Voudouris, K.; McNicholl, D. Water allocation and governance in multi-stakeholder environments: Insight from Axios Delta, Greece. Sci. Total Environ. 2019, 695, 133831. [Google Scholar] [CrossRef] [PubMed]
- Wang, T.; Liu, Y.; Wang, Y.; Xie, X.; You, J. A Multi-Objective and Equilibrium Scheduling Model Based on Water Resources Macro Allocation Scheme. Water Resour. Manag. 2019, 33, 3355–3375. [Google Scholar] [CrossRef]
- Liu, D.; Guo, S.; Liu, P.; Zou, H.; Hong, X. Rational Function Method for Allocating Water Resources in the Coupled Natural-Human Systems. Water Resour. Manag. 2019, 33, 57–73. [Google Scholar] [CrossRef]
- Abdulbaki, D.; Al-Hindi, M.; Yassine, A.; Najm, M.A. An optimization model for the allocation of water resources. J. Clean Prod. 2017, 164, 994–1006. [Google Scholar] [CrossRef]
- Minsker., B.S.; Padera, B.; Smalley, J.B. Efficient methods for including uncertainty and multiple objectives in water resources management models using genetic algorithms. In Proceedings of the XIII International Conference on Computational Methods in Water Resources, Calgary, AB, Canada, 25–29 June 2000; pp. 567–572. [Google Scholar]
- Rosegrant, M.W.; Ringler, C.; McKinney, D.C.; Cai, X.; Keller, A.; Donoso, G. Integrated economic-hydrologic water modeling at the basin scale: The Maipo river basin. Agr. Econ. 2000, 24, 33–46. [Google Scholar]
- Chen, S.; Shao, D.; Gu, W.; Xu, B.; Li, H.; Fang, L. An interval multistage water allocation model for crop different growth stages under inputs uncertainty. Agr. Water Manag. 2017, 186, 86–97. [Google Scholar] [CrossRef]
- Zhang, Y.Q. Research on water resources allocation in irrigation area under artificial fish swarm algorithm. Water Resour. Plan. Des. 2016, 7, 42–44. [Google Scholar]
- Hou, J.; Sun, Y.; Sun, J. Optimal Allocation of Water Resources Based onthe Multi-Objective Fish-Ant Colony Algorithm. Resour. Sci. 2011, 33, 2255–2261. [Google Scholar]
- Li, Y.; Zhao, T.; Wang, P.; Gooi, H.B.; Wu, L.; Liu, Y.; Ye, J. Optimal Operation of Multimicrogrids via Cooperative Energy and Reserve Scheduling. IEEE Trans. Ind. Inform. 2018, 14, 3459–3468. [Google Scholar] [CrossRef]
- Afshar, A.; Shojaei, N.; Sagharjooghifarahani, M. Multiobjective Calibration of Reservoir Water Quality Modeling Using Multiobjective Particle Swarm Optimization (MOPSO). Water Resour. Manag. 2013, 27, 1931–1947. [Google Scholar] [CrossRef]
- Abolpour, B.; Javan, M.; Karamouz, M. Water allocation improvement in river basin using Adaptive Neural Fuzzy Reinforcement Learning approach. Appl. Soft Comput. 2007, 7, 265–285. [Google Scholar] [CrossRef] [Green Version]
- Li, J.; Song, S.; Ayantobo, O.O.; Wang, H.; Liang, J.; Zhang, B. Coordinated allocation of conventional and unconventional water resources considering uncertainty and different stakeholders. J. Hydrol. 2022, 605, 127293. [Google Scholar] [CrossRef]
- Mooselu, M.G.; Nikoo, M.R.; Latifi, M.; Sadegh, M.; Al-Wardy, M.; Al-Rawas, G.A. A multi-objective optimal allocation of treated wastewater in urban areas using leader-follower game. J. Clean. Prod. 2020, 267, 122189. [Google Scholar] [CrossRef]
- Gao, J.; Li, C.; Zhao, P.; Zhang, H.; Mao, G.; Wang, Y. Insights into water-energy cobenefits and trade-offs in water resource management. J. Clean. Prod. 2019, 213, 1188–1203. [Google Scholar] [CrossRef]
- Yang, S.Q. Prediction and Research of Water-Soil Environment Effect Under Light-Saline Water Irrigation Based on Visual MODFLOW and SWAP Coupling Model in Arid Area Inner Mongolia Agricultural University. Ph.D. Thesis, Inner Mongolia Agricultural University, Hohhot, China, 2005. [Google Scholar]
- Liu, Y.; Fu, G. Utilization of Gentle Salty Water Resource in China. Geogr. Geo-Inf. Sci. 2004, 20, 57–60. [Google Scholar]
- Shao, J. Optimization of Unconventional Water Resources in Yinchuan City Based on Comprehensive Utillization; Ningxia University: Ningxia, China, 2017. [Google Scholar]
- Dutt, R.G.; Pennington, D.A.; Turner, F. Irrigation as a Solution to Salinity Problems of River Systems. In Salinity in Watercourses and Reservoirs; Ann Arbor Science: Ann Arbor, MI, USA, 1984; pp. 465–472. [Google Scholar]
- Wang, J.; Shan, Y. Review of Research Development on Water and Soil Regulation with Brackish Water Irrigation. Trans. Chin. Soc. Agric. Mach. 2015, 46, 117–126. [Google Scholar]
- Wu, Z.; Wang, J. Effect on Both SoilI nfiltration Characteristics and Ion Mobility Features by Mineralization Degree of Infiltration Water. Trans. Chin. Soc. Agric. Mach. 2010, 41, 64–69. [Google Scholar]
- Phogat, V.; Yadav, A.K.; Malik, R.S.; Kumar, S.; Cox, J. Simulation of salt and water movement and estimation of water productivity of rice crop irrigated with saline water. Paddy Water Environ. 2010, 8, 333–346. [Google Scholar] [CrossRef]
- Chen, X.; Yang, J.; Yang, C. Irrigation-drainage management and hydro-salinity balance in Weigan River Irrigation District. Trans. Chin. Soc. Agric. Eng. 2008, 4, 59–65. [Google Scholar]
- Pang, H.C.; Li, Y.Y.; Yang, J.S.; Liang, Y.S. Effect of brackish water irrigation and straw mulching on soil salinity and crop yields under monsoonal climatic conditions. Agr. Water Manag. 2010, 97, 1971–1977. [Google Scholar] [CrossRef]
- Liu, Y.; Feng, Y.; Huang, J. Effects of modifiers on saline soil salt distribution under brackish water irrigation conditions. Agric. Res. Arid. Areas 2015, 33, 146–152. [Google Scholar]
- Wei, J.; Wang, H. Network diagram of regional water resource allocation system. J. Hydraul. Eng. 2007, 9, 1103–1108. [Google Scholar]
- Wei, C.; Han, J.; Han, S. Key Technologies and Demonstrations for Optimal Allocation of All Elements of River Basin/Regional Water Resources; China Water Power Press: Beijing, China, 2012. [Google Scholar]
- Zhang, Y.; Shen, Y.; Wang, Y. Distribution characteristics and exploitation of brackish water in hebei Plain. J. Agric. Resour. Environ. 2009, 26, 29–33. [Google Scholar]
Figure 1.
Geographical location of Guantao County.

Figure 2.
Distribution of brackish water in Guantao County.

Figure 3.
Working relationship of modules of optimal water resources allocation system.

Figure 4.
Water resources allocation system network diagram in Guantao County.

Figure 5.
Permeability coefficient partition (a); hydraulic conductivity zoning and observation well locations in the study area (b).
Figure 5.
Permeability coefficient partition (a); hydraulic conductivity zoning and observation well locations in the study area (b).

Figure 6.
Schematic diagram of network segmentation (a); the initial flow field in the study area (b).
Figure 6.
Schematic diagram of network segmentation (a); the initial flow field in the study area (b).

Figure 7.
Comparison between measured and simulated groundwater level in partial typical monitoring wells.
Figure 7.
Comparison between measured and simulated groundwater level in partial typical monitoring wells.

Figure 8.
Social and economic development prediction: (a) Population prediction; (b) Agricultural irrigation area prediction; (c) Industrial added value prediction.
Figure 8.
Social and economic development prediction: (a) Population prediction; (b) Agricultural irrigation area prediction; (c) Industrial added value prediction.

Figure 9.
Prediction results of water demand in different industries under different scenarios: (a) High growth and moderate water-saving scenario; (b) Moderate growth and moderate water-saving scenario; (c) High growth intensifies water-saving scenario; (d) Moderate growth intensifies water-saving scenario.

Figure 10.
The relationship between water supply and demand between different water sources and different users in 2030 under the second scenario.
Figure 10.
The relationship between water supply and demand between different water sources and different users in 2030 under the second scenario.

Figure 11.
Brackish water configuration in 2030 under the second scenario, reduces soil salinization and improves the soil ecological environment.
Figure 11.
Brackish water configuration in 2030 under the second scenario, reduces soil salinization and improves the soil ecological environment.

Figure 12.
Groundwater flow field under high growth and enhanced water saving scheme: (a) at the end of 2019; (b) at the end of 2025; (c) at the end of 2030; (d) at the end of 2035.
Figure 12.
Groundwater flow field under high growth and enhanced water saving scheme: (a) at the end of 2019; (b) at the end of 2025; (c) at the end of 2030; (d) at the end of 2035.


Table 1.
Variable definition.
| Number | Name | Definition | Number | Name | Definition |
|---|---|---|---|---|---|
| (5) | Local surface water supplies the urban water supply | (3) | External water supply for agricultural production | ||
| (5) | Local surface water supplies industrial production | (3) | External water supply rural water supply | ||
| (5) | Local surface water supplies water to the ecological environment | (3) | External water supply rural water supply | ||
| (5) | Local surface water supplies agricultural production | (3) | Brackish water supplies water for agriculture | ||
| (5) | Local surface water supplies rural water supply | (5) | Sewage treatment and reuse supply industrial production water | ||
| (5) | Groundwater supplies water to cities and towns | (5) | Sewage treatment and reuse supply ecological environment | ||
| (5) | Groundwater supplies water for industrial production | (6) | Urban life is short of water | ||
| (5) | Groundwater supplies water to the ecological environment | (6) | Industrial production is short of water | ||
| (5) | Groundwater supplies water for agricultural production | (6) | The ecological environment is short of water | ||
| (5) | Groundwater supplies water for rural life | (6) | Agricultural production is short of water | ||
| (5) | External water supply urban living water | (6) | Agricultural production is short of water | ||
| (5) | External water supply for industrial production | (7) | Lakes and wetlands are short of water | ||
| (5) | External water supply ecological environment water |
Table 2.
Hydrogeological parameters.
| Parameters/District | Ⅰ | Ⅱ | Ⅲ | Ⅳ |
|---|---|---|---|---|
| K (m/d) | 1.5 | 1.2 | 2.0 | 3.5 |
| μ | 0.1 | 0.08 | 0.07 | 0.12 |
Table 3.
Groundwater model simulation error statistics results.
| Monitoring Wells | MAE/m | RMSE/m |
|---|---|---|
| Houshiyu | 0.2473 | 0.3240 |
| Houfudu | 0.2974 | 0.3842 |
| Xucunxiang | 0.2836 | 0.3574 |
| Fangzhaixiang | 0.2127 | 0.2926 |
Table 4.
Setting of water demand forecasting scheme.
| Development Plan | Moderate Water -Saving Scenario | Strengthen Water-Saving Scenarios |
|---|---|---|
| High growth | Scheme Ⅰ | Scheme Ⅱ |
| Moderate growth | Scheme Ⅲ | Scheme Ⅳ |
Table 5.
Water resources allocation results under different schemes (106 m³).
| Horizontal Year | Plan | Water Supply | Water Consumption | Water Shortage | ||||||||||
|---|---|---|---|---|---|---|---|---|---|---|---|---|---|---|
| Water Demand | Surface Water | Groundwater | Brackish Water | Wastewater Reuse | Transfer Water | Total | Town Life | Rural Life | Industrial Production | Agricultural Production | Ecological Environment Replenishment | |||
| 2019 | / | 114.057 | 37.560 | 30.816 | 7.000 | 0.164 | 3.853 | 79.392 | 5.625 | 3.022 | 1.962 | 66.266 | 2.518 | 34.665 |
| 2025 | low | 106.099 | 34.917 | 28.638 | 9.000 | 0.192 | 4.727 | 77.473 | 5.122 | 2.384 | 2.512 | 63.950 | 3.505 | 28.621 |
| middle | 106.633 | 33.142 | 28.651 | 9.000 | 0.135 | 4.655 | 75.584 | 4.051 | 1.660 | 2.065 | 64.578 | 3.230 | 31.049 | |
| high | 114.874 | 38.047 | 30.482 | 9.000 | 0.256 | 4.765 | 82.549 | 5.774 | 2.603 | 2.783 | 67.766 | 3.623 | 32.313 | |
| 2030 | low | 104.886 | 34.613 | 28.330 | 10.000 | 0.224 | 4.761 | 77.927 | 5.787 | 2.242 | 3.136 | 62.841 | 3.921 | 26.954 |
| middle | 106.454 | 33.467 | 27.911 | 10.000 | 0.134 | 4.770 | 76.282 | 4.578 | 1.622 | 2.413 | 64.105 | 3.564 | 30.172 | |
| high | 113.757 | 36.520 | 29.648 | 10.000 | 0.266 | 4.808 | 81.643 | 6.672 | 2.383 | 3.675 | 64.867 | 4.047 | 32.105 | |
| 2035 | low | 105.761 | 35.807 | 27.055 | 12.000 | 0.337 | 4.761 | 79.959 | 6.373 | 2.166 | 4.546 | 62.697 | 4.177 | 25.792 |
| middle | 106.643 | 34.526 | 26.170 | 12.000 | 0.223 | 4.703 | 77.622 | 5.017 | 1.516 | 3.373 | 63.904 | 3.812 | 29.014 | |
| high | 115.291 | 38.303 | 28.907 | 12.000 | 0.431 | 4.816 | 84.457 | 7.611 | 2.110 | 5.680 | 64.696 | 4.360 | 30.837 | |
Table 6.
The water resources allocation results of each computing unit in the plan in 2030 (106 m³).
Table 6.
The water resources allocation results of each computing unit in the plan in 2030 (106 m³).
| Unit | Water Supply | Water Consumption | Water Shortage | ||||||||||
|---|---|---|---|---|---|---|---|---|---|---|---|---|---|
| Water Demand | Surface Water | Groundwater | Brackish Water | Wastewater Reuse | Transfer Water | Total | Town Life | Rural Life | Industrial Production | Agricultural Production | Ecological Environment Replenishment | ||
| Luqiao Brackish Water Agriculture Zone 1 | 4.826 | 2.711 | 0.749 | 0.661 | 0.000 | 0.166 | 4.287 | 0.042 | 0.039 | 0.000 | 4.206 | 0.000 | 0.539 |
| Luqiao Brackish Water Agriculture Second District | 11.209 | 5.359 | 3.571 | 1.306 | 0.000 | 0.368 | 10.604 | 0.114 | 0.106 | 0.000 | 9.916 | 0.468 | 0.605 |
| Weisengzhai Brackish Water Agriculture District No. 1 | 7.456 | 3.366 | 1.908 | 1.359 | 0.000 | 0.302 | 6.935 | 0.141 | 0.093 | 0.357 | 6.344 | 0.000 | 0.521 |
| Weisengzhai Brackish Water Agriculture Second District | 6.916 | 0.871 | 1.617 | 0.351 | 0.000 | 0.084 | 2.923 | 0.147 | 0.096 | 0.000 | 2.412 | 0.268 | 3.993 |
| Brackish Water Agricultural Area of Nanxu Village | 5.186 | 0.466 | 3.918 | 0.575 | 0.002 | 0.225 | 5.186 | 0.503 | 0.284 | 0.012 | 4.183 | 0.204 | 0.000 |
| Chaibao Freshwater Agricultural Area | 4.548 | 1.665 | 0.603 | 0.000 | 0.000 | 0.450 | 2.718 | 0.081 | 0.044 | 0.057 | 2.535 | 0.000 | 1.830 |
| Chaibao Brackish Water Agriculture District I | 6.150 | 2.365 | 0.468 | 0.824 | 0.000 | 0.181 | 3.838 | 0.071 | 0.039 | 0.000 | 3.729 | 0.000 | 2.312 |
| Chaibao Brackish Water Agriculture Second District | 5.296 | 3.140 | 0.852 | 1.094 | 0.000 | 0.210 | 5.296 | 0.083 | 0.045 | 0.000 | 5.096 | 0.072 | 0.000 |
| Shoushan Temple Industrial Zone | 3.297 | 0.711 | 0.304 | 0.000 | 0.000 | 0.262 | 1.277 | 0.161 | 0.006 | 0.155 | 0.955 | 0.000 | 2.020 |
| Shoushan Temple Water-saving Agricultural Area | 11.686 | 1.733 | 4.027 | 0.000 | 0.000 | 0.351 | 6.111 | 0.011 | 0.070 | 0.012 | 5.908 | 0.110 | 5.575 |
| Guantao Town Ecological Zone | 4.603 | 0.994 | 0.417 | 0.115 | 0.089 | 0.490 | 2.105 | 0.489 | 0.031 | 0.274 | 0.985 | 0.326 | 2.498 |
| Guantao Town Agricultural District | 4.834 | 3.053 | 0.698 | 0.353 | 0.015 | 0.334 | 4.453 | 0.791 | 0.044 | 0.587 | 2.438 | 0.593 | 0.381 |
| Guantao Town Industrial Zone | 4.401 | 2.677 | 0.846 | 0.472 | 0.015 | 0.391 | 4.401 | 0.896 | 0.045 | 0.823 | 1.841 | 0.796 | 0.000 |
| Fangzhai Brackish Water Agriculture Zone 1 | 4.403 | 0.992 | 1.023 | 0.585 | 0.004 | 0.165 | 2.769 | 0.155 | 0.117 | 0.000 | 2.432 | 0.065 | 1.634 |
| Fangzhai Brackish Water Agriculture Second District | 6.620 | 1.090 | 2.260 | 0.643 | 0.006 | 0.228 | 4.227 | 0.238 | 0.186 | 0.000 | 3.708 | 0.095 | 2.393 |
| Wangqiao Brackish Water Agriculture District 1 | 3.763 | 0.782 | 0.374 | 0.572 | 0.000 | 0.155 | 1.883 | 0.167 | 0.091 | 0.040 | 1.466 | 0.119 | 1.880 |
| Wangqiao Brackish Water Agriculture Second District | 11.260 | 1.492 | 4.276 | 1.090 | 0.003 | 0.408 | 7.269 | 0.488 | 0.286 | 0.096 | 5.951 | 0.448 | 3.991 |
| Total | 106.454 | 33.467 | 27.911 | 10.000 | 0.134 | 4.770 | 76.282 | 4.578 | 1.622 | 2.413 | 64.105 | 3.564 | 30.172 |
Publisher’s Note: MDPI stays neutral with regard to jurisdictional claims in published maps and institutional affiliations. |
© 2022 by the authors. Licensee MDPI, Basel, Switzerland. This article is an open access article distributed under the terms and conditions of the Creative Commons Attribution (CC BY) license (https://creativecommons.org/licenses/by/4.0/).
Share and Cite
MDPI and ACS Style
Zhang, D.; Xie, X.; Wang, T.; Wang, B.; Pei, S. Research on Water Resources Allocation System Based on Rational Utilization of Brackish Water. Water 2022, 14, 948. https://doi.org/10.3390/w14060948
AMA Style
Zhang D, Xie X, Wang T, Wang B, Pei S. Research on Water Resources Allocation System Based on Rational Utilization of Brackish Water. Water. 2022; 14(6):948. https://doi.org/10.3390/w14060948
Chicago/Turabian StyleZhang, Dasheng, Xinmin Xie, Ting Wang, Boxin Wang, and Shasha Pei. 2022. "Research on Water Resources Allocation System Based on Rational Utilization of Brackish Water" Water 14, no. 6: 948. https://doi.org/10.3390/w14060948
Note that from the first issue of 2016, this journal uses article numbers instead of page numbers. See further details here.