
Impact of Rainfall Variability and Land Use Change on River Discharge in South Cameroon
by
 , , and
Valentin Brice Ebodé
1,2,* ,
,
Jean Jacques Braun
2,3, 
Bernadette Nka Nnomo
2,4,
Gil Mahé
5,*,
Elias Nkiaka
6 and
Jean Riotte
3,7 1
Department of Geography, University of Yaounde 1, Yaounde P.O. Box 755, Cameroon
2
International Joint Laboratory DYCOFAC, IRGM-UY1-IRD, Yaounde P.O. Box 4110, Cameroon
3
Géosciences Environnement Toulouse, Université de Toulouse, CNRS, IRD, 31400 Toulouse, France
4
Institute of Mining and Geological Research (IRGM), Hydrological Research Center, Yaounde P.O. Box 4110, Cameroon
5
HydroSciences Montpellier, Université de Montpellier, CNRS, IMT, IRD, 34095 Montpellier, France
6
Department of Geography, University of Sheffield, Sheffield S10 2TN, UK
7
Indo-French Cell for Water Sciences, Joint IRD-IISc Laboratory, Indian Institute of Science, Bangalore 560012, India
*
Authors to whom correspondence should be addressed.
Water 2022, 14(6), 941; https://doi.org/10.3390/w14060941
Submission received: 27 January 2022
/
Revised: 2 March 2022
/
Accepted: 15 March 2022
/
Published: 17 March 2022
(This article belongs to the Section Water and Climate Change)
Abstract
:Climate change, variability and anthropogenic forcings such as land use change are the main forcings of river discharge variability. However, an understanding of their simultaneous impacts on river discharge remains limited in some parts of the world. To shed light on this issue, the objective of this article is to investigate the effects of rainfall variability and land use change on river discharge in the Nyong basin (at Olama and Mbalmayo gauging stations) and some of its sub-basins (So’o and Mefou) over the long period 1950–2018. To achieve this goal, hydro-meteorological data of the Nyong basin and sub-basins were analyzed using the Pettitt test. Likewise, land use changes in the basin and sub-basins were also analyzed using supervised classifications of Landsat satellite images of the basins at different periods (1973, 2000 and 2018). On the annual scale, rainfall has decreased statistically over the studied basins. In the large basins (Olama and Mbalmayo), this decrease in rainfall is synchronous with that of discharges, while it is concomitant with an increase in the Mefou (small basin). After the ruptures within time series identified in the annual modules, the extreme discharges (maximum and minimum) decreased in Olama; in Mbalmayo, the maximum discharges remained stable while the minimum discharges decreased. On the other hand, the maximum and minimum discharges have significantly increased in the Mefou. The stability of maximum discharges at Mbalmayo and the increase in extremes on the Mefou in a context where the precipitation that generates the discharge has decreased can be attributed to land use change. These changes are essentially marked by an increase in impervious areas and a reduction in forest cover. On the seasonal scale, the impact of precipitation in the dry season is visible on the flows of the rainy seasons that follow them on the large basins (Olama and Mbalmayo). Between the decades 1970–1990 and 2000–2010, there was respectively a significant increase, then a decrease in summer precipitation, which impacted the autumn discharges in the same direction. Conversely, between the same intervals, there was a significant decrease, then a slight increase in winter precipitation. The impact of winter precipitation on the spring discharge is more visible during the first period only (1970–1990). During the second period, winter precipitation seems to have more of an impact on the runoff for the same season. In the Mefou sub-basin, the precipitation plays an essentially amplifying role in the increase in discharge in the seasons during which they occur. Those having experienced an increase, or a maintenance of precipitation (summer and spring) recorded the most significant increases in discharges. These results could be useful for long-term planning on the demand and use of water, as well as flood management in the basins
1. Introduction
Changes in river discharge result from interactions between climate change and/or land use change [1,2,3,4,5], although it is also admitted that the physical characteristics of the basin (size, slope system, type of soil, etc.) increase their sensitivity to these factors [6,7]. Some authors attempt to identify climatic and land use change impacts on river regimes [8,9,10,11,12,13], but most of the research focuses on the effects of these two factors separately, as is the case with recent studies in Africa and South America [14,15,16,17,18].
In sub-Saharan Africa, the work devoted to investigating the impact of rainfall on discharge has been ongoing since the 1980s [19]. Studies correlating precipitation and discharge are based on the detection of ruptures in the hydrometeorological series. Results from those studies confirm, in the case of West Africa, that the 1970s appear to be the main period of discontinuity marking the onset of hydroclimatic drought in the region [20,21,22,23]. In Central Africa, fluctuations in river discharges and rainfall have been observed at seasonal [24] and interannual [25] time scales. Liénou et al. [26] demonstrate, in the case of three equatorial rivers (Ntem, Nyong and Kienke), that the most significant climatic variations leading to changes in river discharge result from variations in rainfall during the dry season. The authors explain the sensitivity of the studied basins to rainfall variability by the fact that their reduction induces a significant deficit in soil moisture and groundwater storage resulting in a decrease in river discharge. Conversely, an increase in soil moisture during the dry season therefore enhances discharge at the start of the rainy season. It appears that the variability of discharge regimes of equatorial rivers can be better appreciated when rainfall of these seasons is considered. Concerning the impact of land use change on river discharge, previous studies have used supervised classifications of satellite images, using at least two dates, to assess the dynamics of land use and its impact on river discharge [27,28,29]. Their results confirm an increase in discharges following an increase in impervious surfaces (buildings, roads and cultivated areas).
We anticipate that the series of nested basins in our study areas are likely to undergo similar changes. These basins are forested, but since the early 1970s, climatic fluctuations have been observed there as in the rest of sub-Saharan Africa. In addition, the population in these basins is increasing rapidly [30]. This demographic growth may likely lead to an increase in impervious areas, with serious implications on the hydrological dynamics of these hydro systems. However, unlike the West African basins, the Nyong basin and its sub-basins have received substantially less attention from the research community due to the absence of observational data, while in some cases, the existing data in the region are riddled with gaps [31]. Furthermore, acquiring satellite images of sufficient quality over large areas (no haze and cloud) remains a big challenge. Previous studies focusing on the impact of rainfall variability and land use change in sub-Saharan Africa have focused on other sub-regions while only few studies exist in the Central Africa sub-region. This study focuses on the Nyong river basin, and its sub-basins located in south Cameroon, because it is the main source of water supply to the city of Yaoundé which is the political capital of Cameroon. In addition, the Nyong river is rich in halieutic resources, and as such, it serves as a source of employment for many fishermen who supply their fish catch to markets in Yaoundé. The Nyong river basin therefore plays two important roles including water and food security in Cameroon.
The main objective of this study is to investigate the impact of precipitation variability and land use change on the hydrological dynamics of the Nyong river and its tributaries. Considering that few studies have attempted to investigate the impact of rainfall variability and land use change on river regimes in Central Africa, this paper contributes to this debate by focusing our analysis on the Nyong River basin in Cameroon, which is representative of Central African basins under the sub-equatorial Atlantic climate.
2. Data and Methods
2.1. Study Area
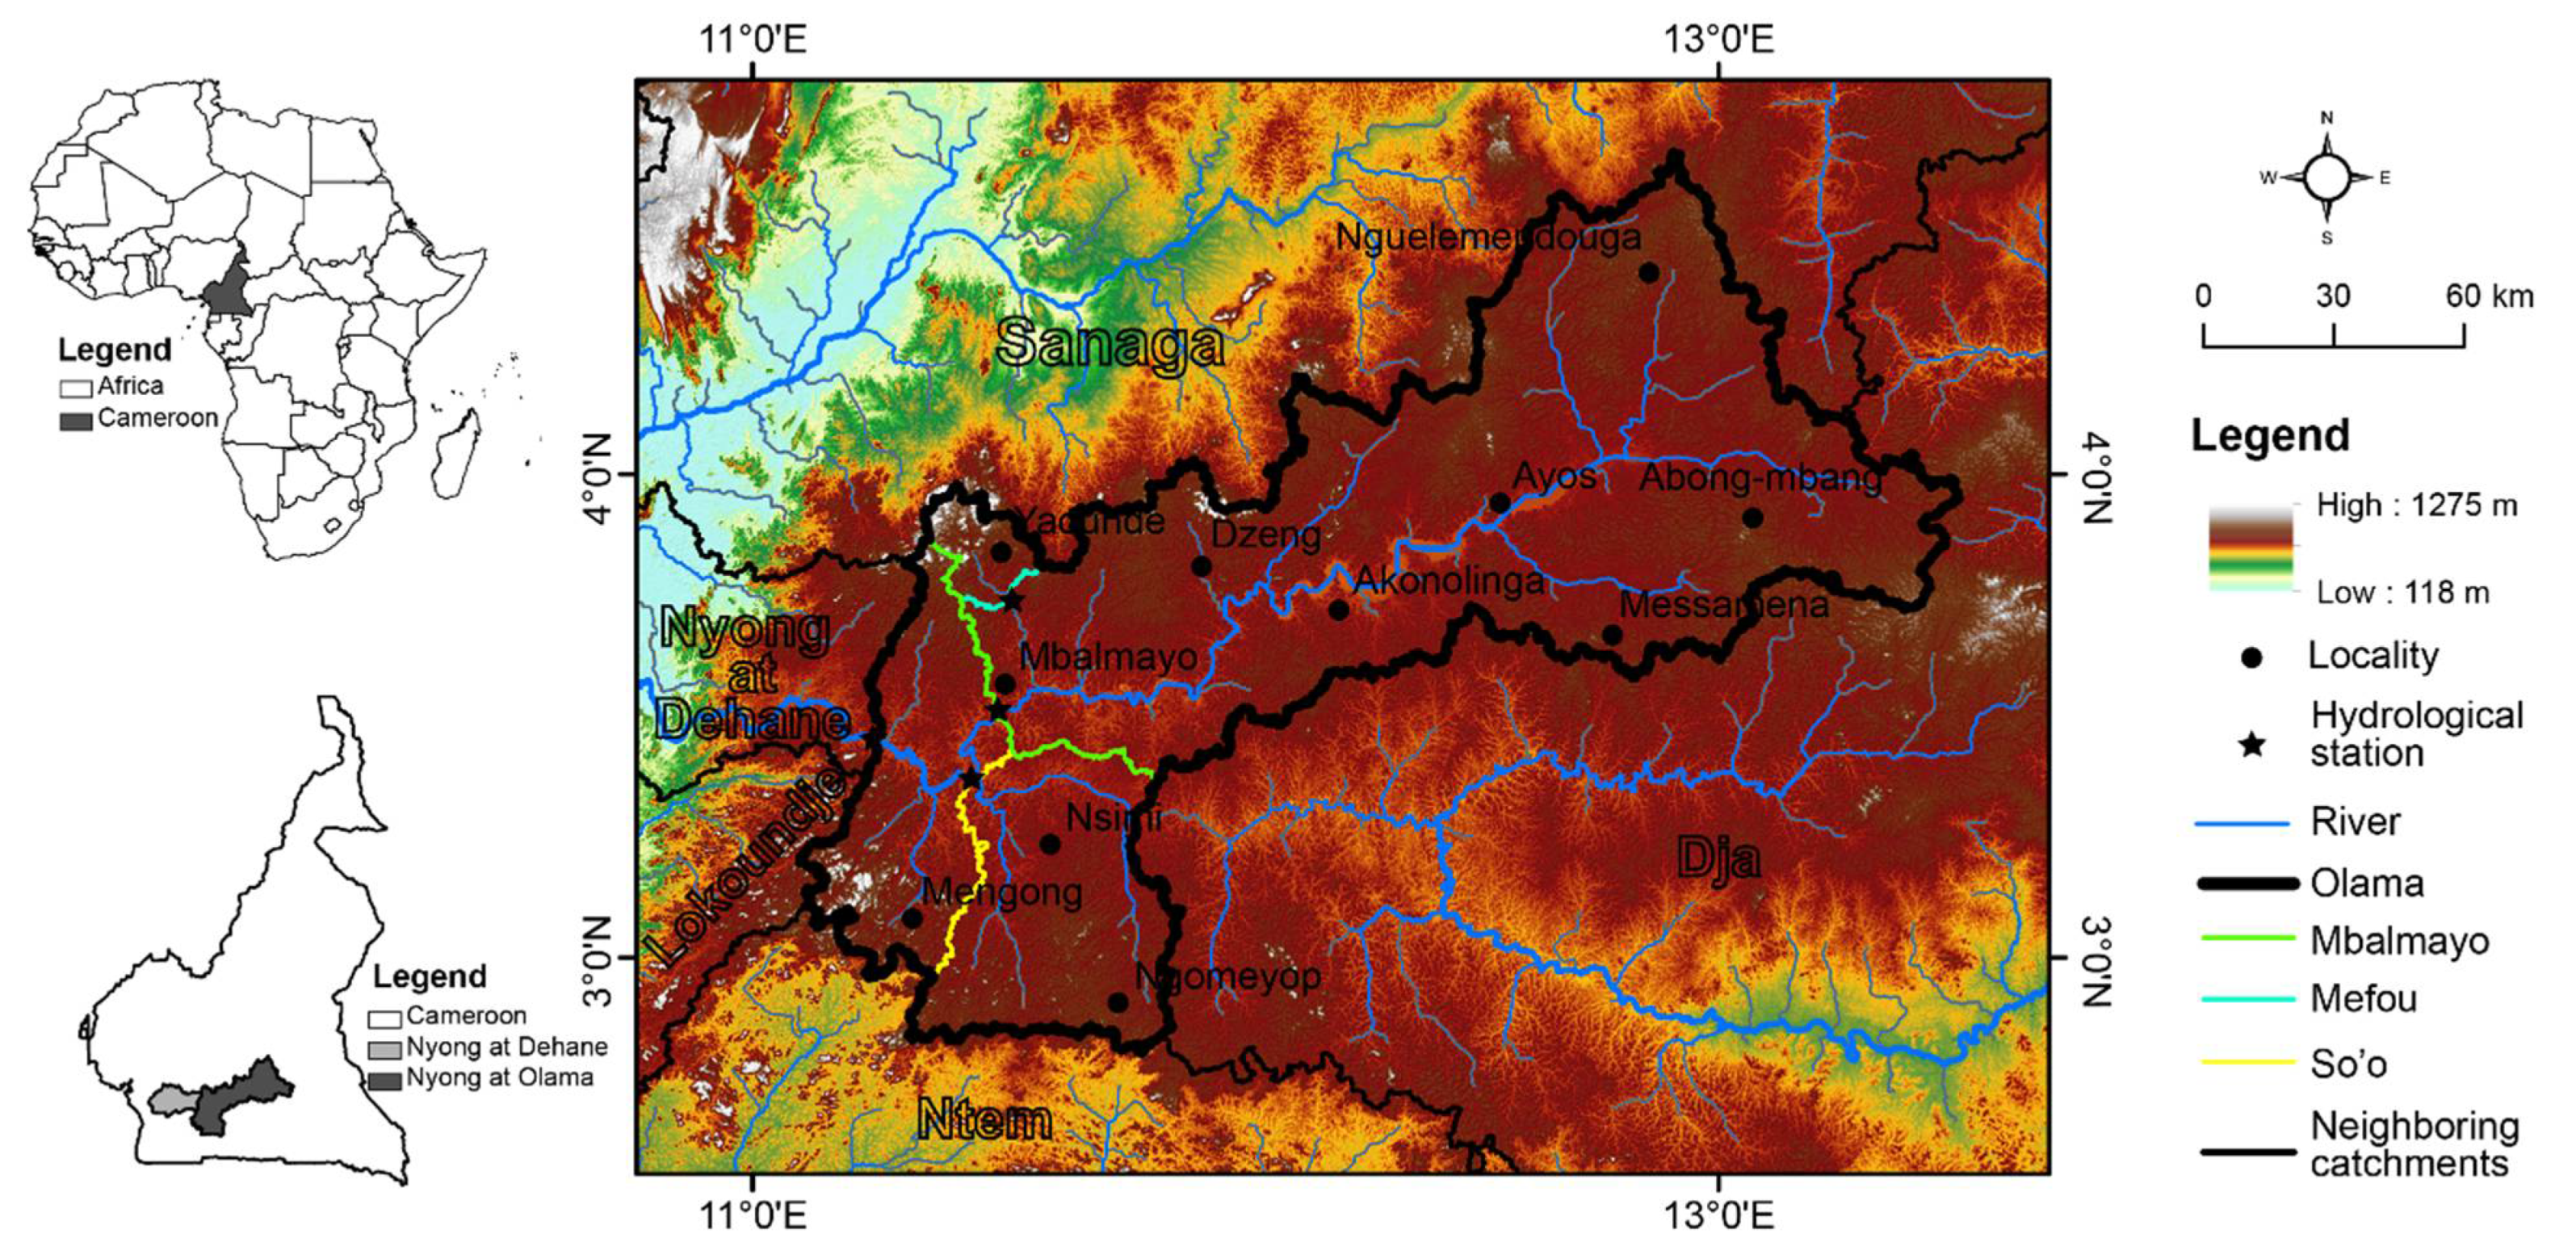
The study focuses on a series of nested basins which are the Nyong (at Olama and Mbalmayo, respectively 19,755 km2 and 14,438 km2) and two of its sub-basins (So’o at So’o bridge and Mefou at Nsimalen, 2383 km2 and 428 km2, respectively). These basins are located in south Cameroon, within the Central African sub-region, between latitudes 2°50′ N and 4°40′ N, and longitudes 11°5′ E and 13°30′ E (Figure 1). They belong to the sub-equatorial domain, with abundant annual precipitation (around 1600 mm/year), spread over four seasons of unequal importance. Two of them are dry (summer and winter) and two are rainy (spring and autumn) (Table 1). The studied basins are dissected by deep gullies cut into hills with convex slopes and wide marshy valleys [32]. Their geological substratum is made up of a granito–gneissic base on which ferralitic soils (on the summits and slopes) and hydromorphic soils (in the shallows) develop. The vegetation in the area is a dense semi-deciduous forest, with Sterculiaceae and Ulmaceae, which is subject to anthropogenic pressure [33].
2.2. Data Sources
2.2.1. Hydroclimatic Data
The river discharges of the Nyong (Olama and Mbalmayo) were obtained from two sources. The point of measurement, as well as the methods used for reading water levels and calculating discharges, however, remained the same for the sources. The series obtained from the Hydrological Research Center covers the period 1965–1987 (Olama) and 1951–1987 (Mbalmayo). This center manages a hydrometric database, mostly on a daily time step, which contains almost all the measurements carried out on Cameroonian territory since the beginning of the 1950s, for most of the stations. No observation data were available on this watercourse between 1988 and 1997. Indeed, after 1987, due to budgetary constraints, the hydrological service could no longer sustain the continuity of observations. This led to the abandonment of several hydrometric stations, including those of Nyong at Olama and Mbalmayo. Over the period 1998–2016, the river discharge series used (for the Nyong and the So’o) were obtained from ORE-BVET (Observatory for Research in the Environment/Tropical Experimental Watersheds) and funded by the French Ministry of Research and New Technologies, the National Institute of Sciences of the Universe, the Research Institute for Development and the Midi-Pyrénées Observatory. The complete series of flows of the Mefou came from the Hydrological Research Center and covers the period 1963–2018, but with gaps during the decades 1970, 1980 and 1990. There were no data on this watercourse between the 1978–1983 and 1989–2000 intervals. All the hydrological data used in this work were collected on a daily time step. The monthly, seasonal and annual modules were calculated subsequently.
The rainfall data used in this work came from the Climate Research Unit (CRU) of the University of East Anglia in the United Kingdom. These data have been available since 1901, via the site https://climexp.knmi.nl/selectfield_obs2.cgi?id=2833fad3fef1bedc6761d5cba64775f0/ (accessed on 26 January 2022) in NetCDF format, on a monthly time step and at a spatial resolution of 0.25° × 0.25°.
Six climatic indices (SOI: Southern Oscillation Index; DMI: Dipole Mode Index; NATL: North Tropical Atlantic sea surface temperature indices; SATL: South Tropical Atlantic sea surface temperature indices; MEI: Multivariate ENSO Index; NAO: North Atlantic Oscillation) representative of certain sources of large-scale variability (Pacific Ocean, Indian Ocean and Atlantic Ocean) likely to influence the climate of the region [34] were used in this study (Figure 2). These indices were collected at a monthly time step on the National Oceanic and Atmospheric Administration website (https://psl.noaa.gov/data/climateindices/list/ accessed on 26 January 2022). SOI, DMI and NAO were collected at the same intervals as the rainfall. The other indices have only been available since the beginning of the 1980s.
2.2.2. Spatial Data
The spatial data used to analyze changes in land use in the Nyong basin were mainly Landsat 8 satellite images from January 2018, Landsat TM from March 2000 and Landsat MSS from March 1973. Three Landsat scenes cover the entire basin, corresponding to path/row 185/57, 185/58, 184/57 (for Landsat 8 and Landsat TM satellites) and 199/57, 199/58, 198/57 (for the Landsat MSS satellite). All the images are made available to the general public for free by the National Aeronautics and Space Administration (NASA), via the US Geological Survey site (https://earthexplorer.usgs.gov/ accessed on 26 January 2022), in GeoTIFF format. Uploaded images taken during the dry winter season (December to mid-March) were preferred over the rainy seasons because they are less affected by cloud disturbances.
2.3. Data Analysis
2.3.1. Hydroclimatic Data
The analysis of precipitation, average river discharge and runoff coefficients (at annual and seasonal time steps) was carried out using Pettitt [35] and Mann–Kendall [36,37,38] tests, at the 95% significance level.
The Pettitt test seems to be the most suitable for the analysis of incomplete series such as ours because it can separate the series into two periods with an overall distinct behavior, which avoids the detection of false discontinuities which can sometimes be observed with other tests such as Hubert segmentation. Its principle consists of dividing the studied series (of N size) into two sub-samples of sizes m and n, respectively. We then calculated the sum of the ranks of the elements of each sub-sample in the total sample. A statistical study is then carried out based on the two sums thus determined; then, it is tested according to the hypothesis that the two sub-samples do not belong to the same population. The Pettitt test is non-parametric and derives from that of Mann–Whitney. The absence of a discontinuity in the series (Xi) of size N constitutes the null hypothesis. Its implementation supposes that for any instant T between 1 and N, the time series (Xi) 1 to t and t + 1 to N belong to the same population. The variable to be tested is the maximum in the absolute value of the variable Ut, N defined by:
where Dij = Sign (Xi − Xj) with: sign (x) = 1 if x > 0, 0 if x = 0 and −1 if x < 0. If the null hypothesis is rejected, an estimate of the date of discontinuity is given by defining the maximum in the absolute value of the variable Ut, N.
In addition to the Pettitt test, the Mann–Kendall test was also used to analyze precipitation, average river discharge and runoff coefficients (at annual and seasonal time steps). This test is based on the test statistic “S” defined as follows:
where the xj are the sequential data values; n is the length of the data set; and sgn = (θ) if θ > 1, 0 if θ = 0 and −1 if θ < 0. There is no significant trend in the series analyzed when the calculated p-value is above the chosen significance level.
To assess the behavior of extreme flows, the Indicators of Hydrologic Alteration (IHA) tool, version 7.1, developed by The Nature Conservancy was used. This tool offers the possibility of comparing the parameters characterizing the flow regimes under different conditions [39]. It uses daily discharge values and produces several important statistics. Only four of them were considered essential for this study, among which were the average, the coefficient of variation (CV) of extreme discharge and the Julian date of the annual minimum and maximum. By dividing the series of values in the period before and after the discontinuity, the tool calculates the change that occurred in the evolution of each of these parameters after the discontinuity. We can thus analyze not only the sign of change between the two periods but also the magnitude of this difference.
The correlation coefficient is the criterion used to assess the links between the rainfall indices and the climatic indices selected. Denoted by “r,” the correlation coefficient is the ratio between the covariance (γ) of two variables (X and Y) and the product of their standard deviations. It indicates the strength and direction of the linear relationship between these variables. Varying between −1 and +1, it reflects a strong correlation if it is less than −0.5 or greater than 0.5:
where denotes the covariance of the variables X and Y; and denote their standard deviations.
2.3.2. Spatial Data
Landsat images were classified using the supervised maximum likelihood classification, using the software Sentinel Application Platform (SNAP). This enabled us to perform a diachronic analysis of the evolution of land use in the basins studied. This operation was preceded by operations of preprocessing and recognition of objects in the field by photography and GPS (Global Positioning System). Satellite image preprocessing refers to all the processes applied to raw data to correct the geometric and radiometric errors that characterize certain satellite images. These errors are generally due to technical problems with the satellites, and interactions between outgoing electromagnetic radiation and atmospheric aerosols, also called “atmospheric noise”. The atmospheric disturbances are influenced by various factors that are present on the day of acquisition, including weather, fires and other human activities. They affect all the images acquired by passive satellites including Landsat 4-5-7 and 8. With the downloaded Landsat images being orthorectified, the preprocessing involved the atmospheric correction of the images and reprojection into the local system (WGS_84_UTM_Zone_32N). For this, neo-channels were created, to increase the readability of the data by enhancing certain properties less obvious in the original image, thus showing more clearly the elements of the scene. Three indices are therefore created, namely: the Normalized Difference Vegetation Index (NDVI, Equation (1)), the Brightness Index (BI, Equation (2)) and the Normalized Difference Water Index (NDWI, Equation (3)). These indices respectively highlight vegetated surfaces, sterile (non-chlorophyllin) elements such as urban areas and water bodies. The formulae used in creating these indices are:
where NIR: ground reflectance of the surface in the near-infrared channel; R: ground reflectance of the surface in the red channel and MWIR: ground reflectance of the surface in the mid-wave infrared channel. Due to the fact that the study area extends over several scenes, the enhancement operations were followed by the mosaic of the different scenes used on each date. It was an operation of joining two or more adjacent images into a single image. The use of Google Earth, as well as the spaces sampled from the GPS, made it possible to identify with certainty the impervious areas (buildings, savannas, bare soils and crops), water bodies (large rivers, lakes and ponds) and the forests (secondary, degraded, non-degraded and swampy) of each mosaic. Before the classification, the separability of the spectral signatures of the sampled objects to avoid interclass confusion was assessed by calculating the “transformed divergence” index. The value of this index is between 0 and 2. A value >1.8 indicates a good separability between two given classes. The different classes used in this study show good separability between them, irrespective of the image considered, with indices >1.9. The validation of the classifications obtained was carried out using the confusion matrix, making it possible to obtain treatment details to validate the choice of training plots. After validating the land use/land cover maps, the statistical and spatial differences of each class between 1973 and 2018 were evaluated.
3. Results
3.1. Evolution of Annual and Seasonal Precipitation
3.1.1. Interannual Evolution of Precipitated Quantities
Annual Precipitation
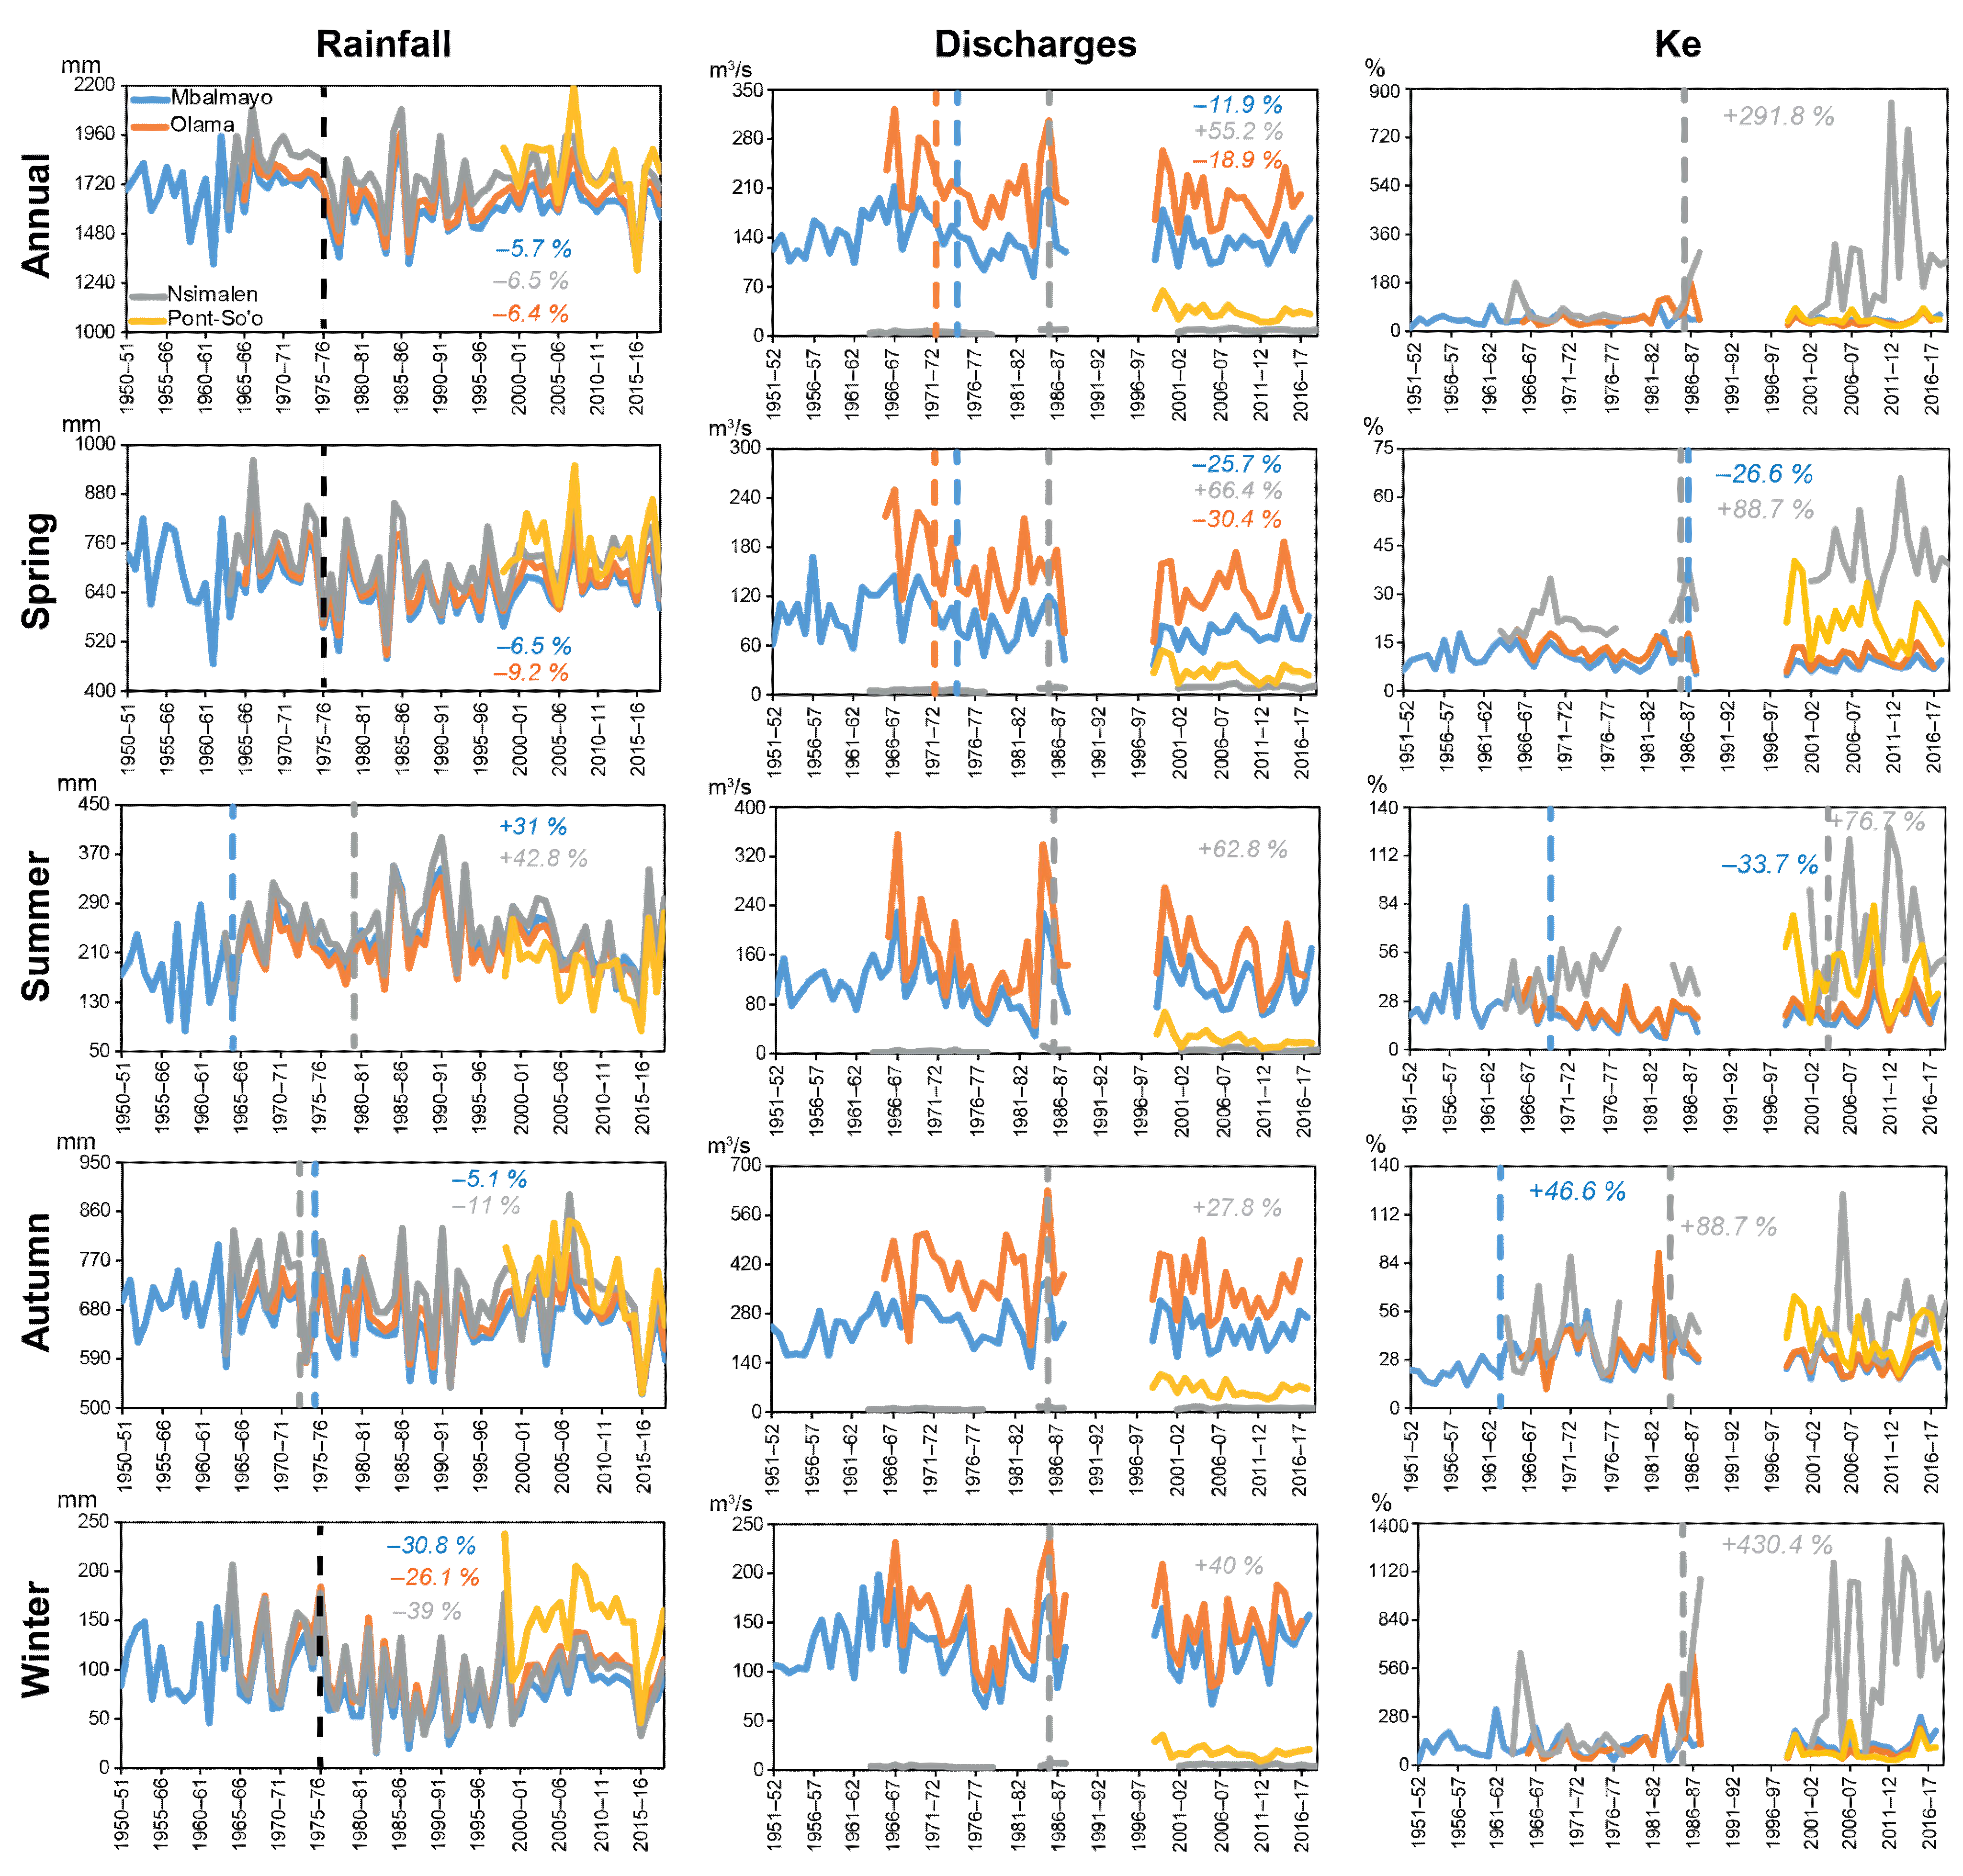
The results of our analysis indicate statistically significant negative trends in the annual precipitation in the Nyong basin (Olama and Mbalmayo) and the Mefou basin (Table 2 and Figure 3). Pettitt’s test showed a major rupture in the series of annual precipitation in these basins in 1975–76 (Figure 3). The deficits associated with this rupture were respectively −6.4%, −5.7% and −6.5% (Figure 3). In the Nyong basin at Olama and Mbalmayo, a drop in precipitation started in the 1970s and remained uninterrupted until the 2000s. In the Mefou sub-basin, in addition to that which was previously mentioned, the 1980s also seemed concerned by this enhancement (Table 3). The So’o basin experienced a significant decrease in annual precipitation from the 2000s (−3.5%) to the 2010s (−4%); however, Pettitt’s and Mann–Kendall’s tests did not reveal any rupture in their series (Figure 3 and Table 2). This could be related to the length of the time series (19 years only).
Previous studies in the Nyong basin at Mbalmayo have reported the absence of a rupture in the time series of annual precipitation in this basin [26,28]. This result differs from that obtained in the present study. A rupture marking a decrease in precipitation was highlighted in the series of precipitation in this same basin in 1975–76. This difference in results could be attributed to the different sources of precipitation used in the two studies. This study used rainfall data obtained from the Climatic Research Unit (CRU) while Ebodé et al. [28], for their part, used rainfall data from the System of Environmental Information on Water Resources and their Modeling (SIEREM) (1950–1999) and Tropical Rainfall Measuring Mission (TRMM) 3B42 V7 (2000–2016). Liénou et al. [26] used data obtained from SIEREM precipitation only. This could also be due to the difference between the lengths of the precipitation series used. This study covers the period 1950–51 to 2017–18, while that of Liénou et al. [26] covers the period 1950–2000.
Seasonal Precipitation
Precipitation during the rainy season decreased over all the basins studied. This decrease was statistically significant in some cases (Figure 3 and Table 2). Spring precipitation decreased statistically in 1975–76 in Nyong at Olama and Mbalmayo. The rates of change recorded following this rupture were respectively −9.2% and −6.5% (Figure 3). Despite this decrease in the Nyong basin at these two stations since the 1970s, it should be noted that spring precipitation has increased slightly over the past two decades (Table 3). Although it is not statistically significant in the Mefou basin, the drop in spring precipitation observed since the 1970s was only interrupted during the 2000s (Table 3). In the So’o basin, spring precipitation decreased from the 2000s to the 2010s (Table 3). However, this decrease was not significant according to the Pettitt test (Figure 3).
In the case of the autumn precipitation, it decreased significantly only in Nyong at the Mbalmayo and Mefou basins. The deficits caused by the ruptures identified in the series (1974–75 for the Nyong and 1972–73 for the Mefou) were −5.1% in the first case, and −11% in the second (Figure 3). The analysis of the decadal deviations from the interannual average of the four basins shows an evolution in the autumn precipitation, which is in line with that described for the annual precipitation over the same decades (Table 3).
The opposite trends have been highlighted in the dry season rainfall, except in the So’o. There was an increase in summer precipitation and a decrease in winter precipitation. The increase in summer precipitation was statistically significant for the Nyong basin at Mbalmayo and Mefou. Ruptures were respectively identified in their series in 1964–65 (+31%) and 1979–80 (+42.8%) (Figure 3). Despite a general increase observed in the various basins during the 1960s for certain basins (Nyong at Mbalmayo) and 1980s for others (Nyong at Olama and Mefou), the analysis of the decadal deviations from the interannual mean nevertheless reveals a significant drop in summer precipitation which started during the 2000s and intensified considerably in the following decade (Table 3). The precipitation of the summer dry season decreased from the 2000s to the following decade in the So’o basin. This decrease was, however, not statistically significant (Figure 3).
The decrease in winter precipitation was significant for the Nyong (at Olama and Mbalmayo) and Mefou basins. The rates of change recorded after the rupture was detected in their series in 1975–76 were, respectively, −26.1%, −30.8% and −39% (Figure 3). Although it experienced a general decrease during the 1970s, winter precipitation seems to have increased considerably since the 2000s (Table 3). This rise was not significant in the Nyong basin (Olama and Mbalmayo). In Mefou, the relapse that began during the 2010 decade was significant (Table 3). The precipitation of the dry winter season did not change statistically in the So’o basin; however, we noted a decrease from the 2000s to the 2010s (Table 3).
Like the previous studies relating to the studied region [26,28], this study highlights a cross-trend evolution of summer and winter precipitation between the 1960/1980 and 1990 decades. However, the present work reveals a reversal of these previously known trends from the 2000s. These new trends have only been demonstrated by a small number of studies so far [4,28].
3.1.2. Spatial Evolution of Precipitation
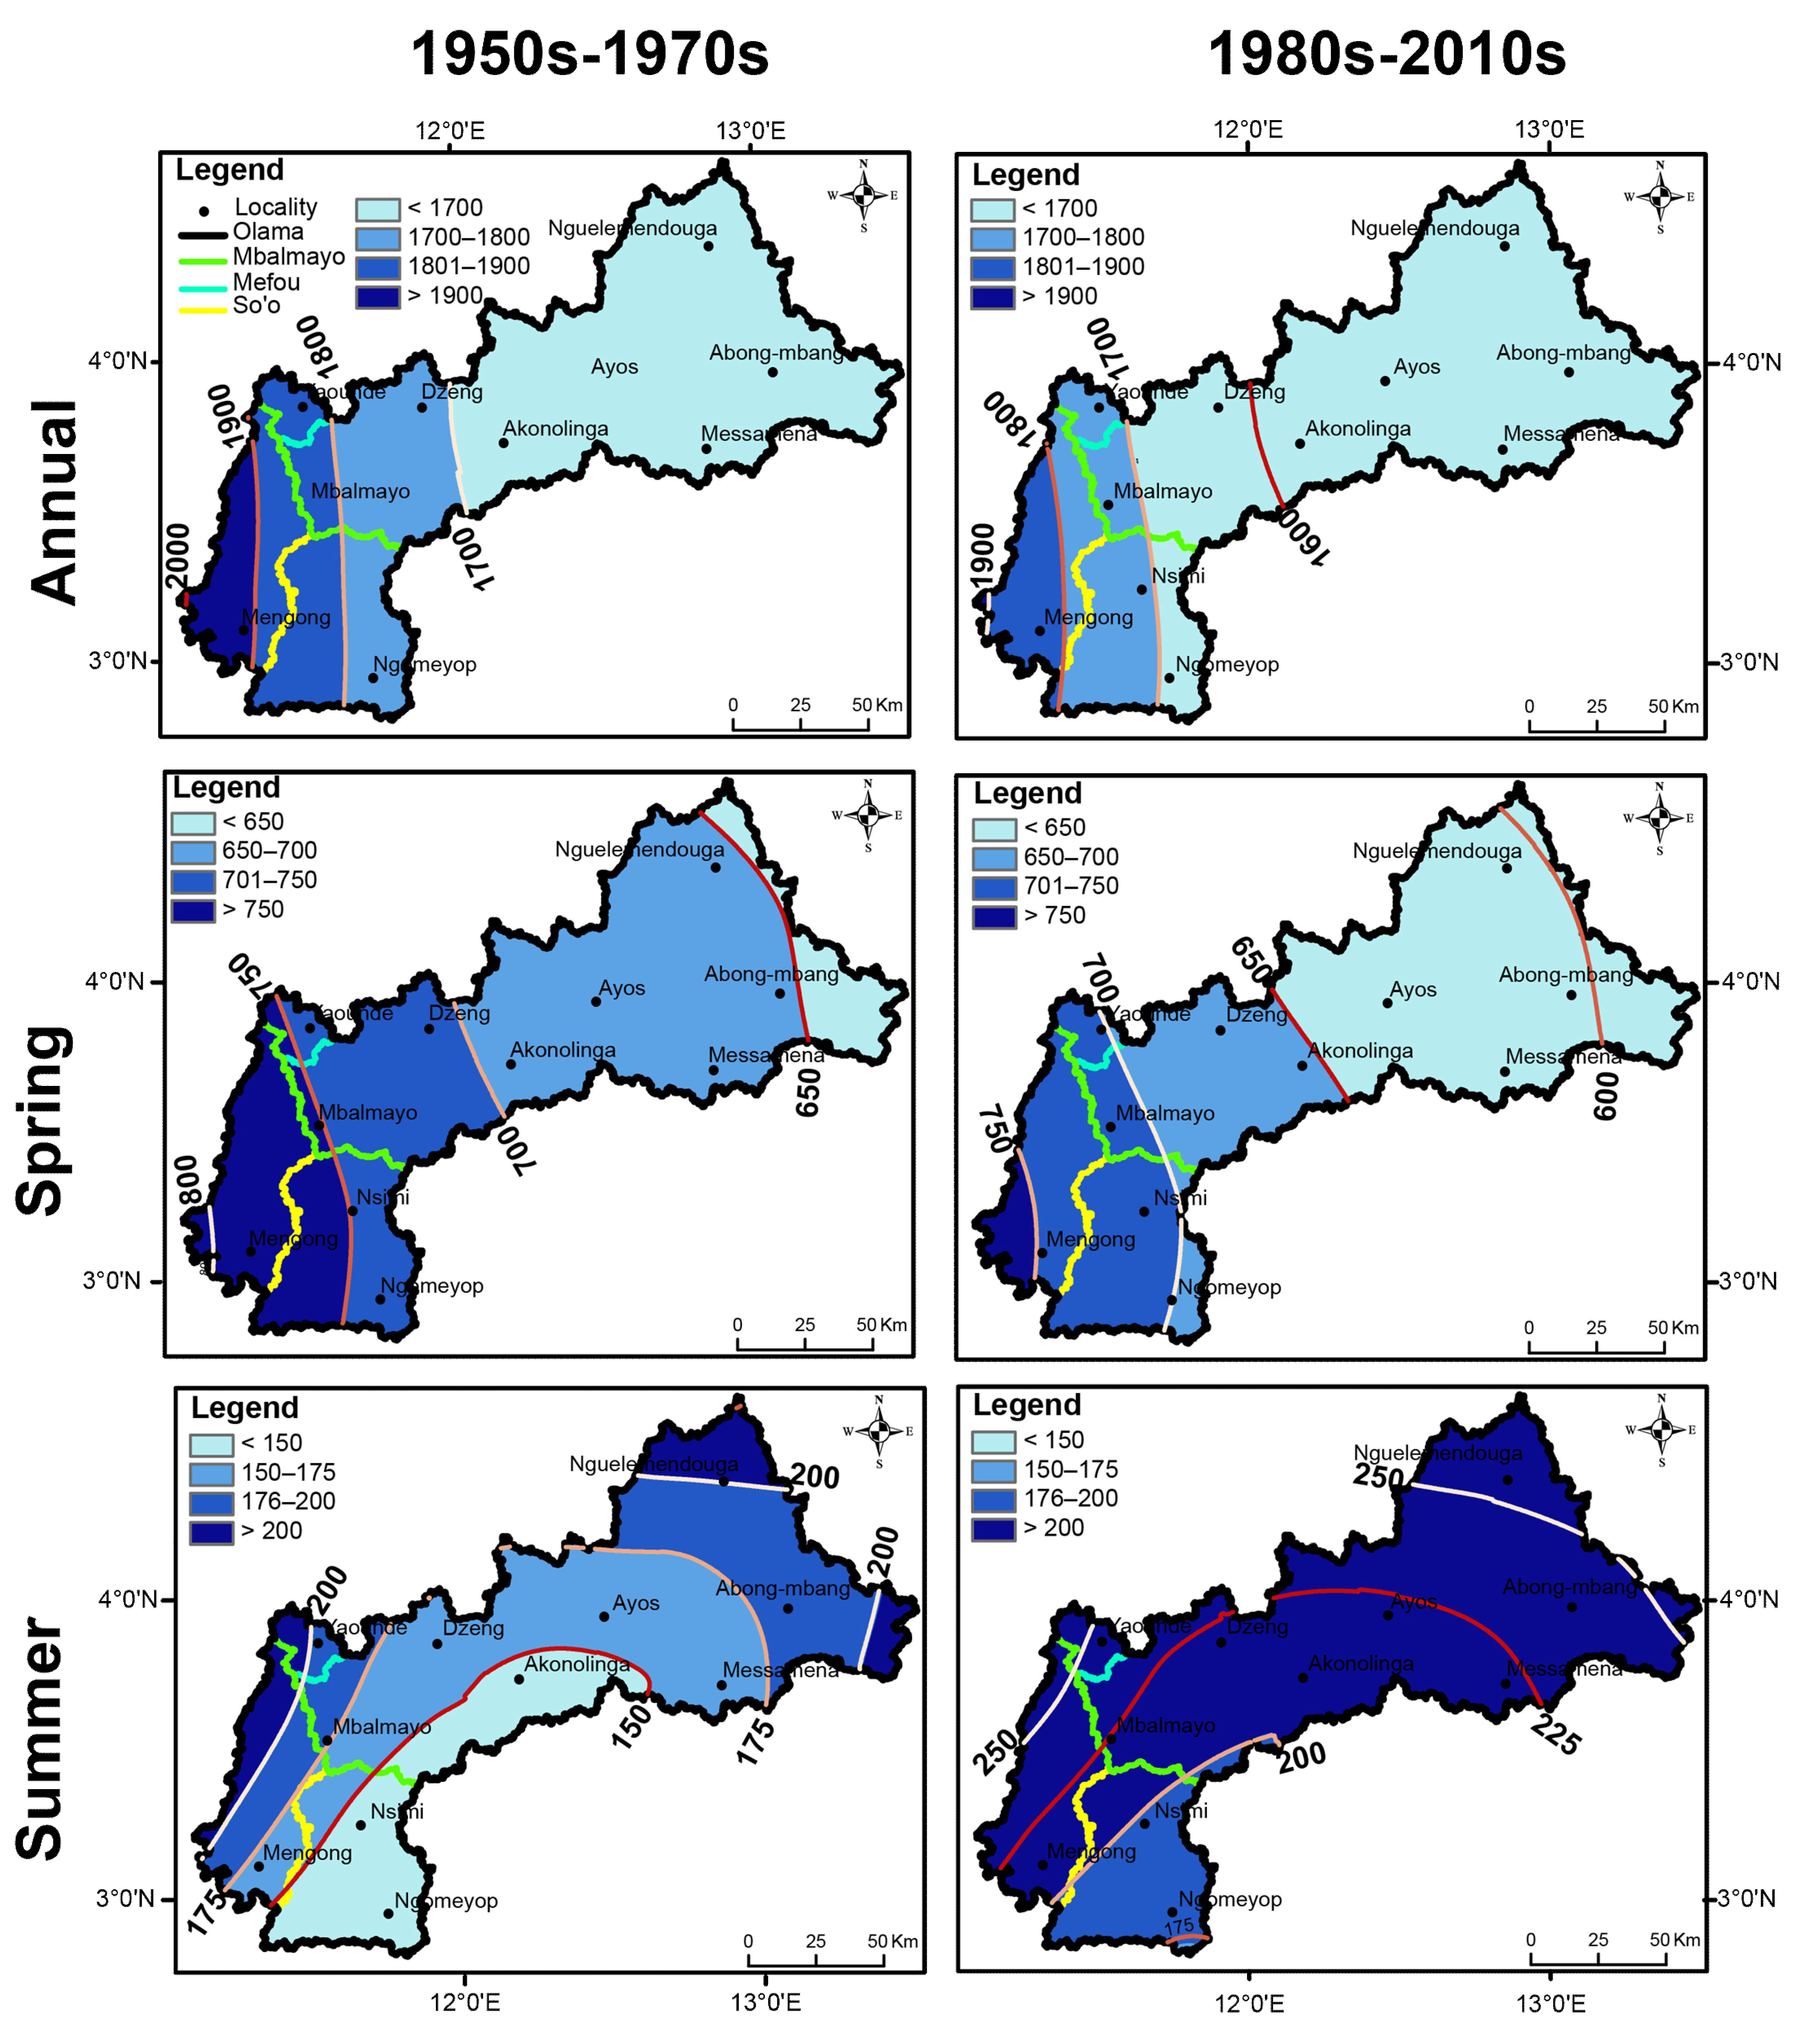
The analysis results of the interannual evolution of rainfall show that the 1970s represent the pivotal period of rainfall evolution in the study area. This led us to investigate the spatial distribution of rainfall in the Nyong basin and sub-basins during the period after this decade. The question therefore arises as to whether the changes in annual and seasonal rainfall observed around the 1970s were accompanied by a modification in its spatial distribution.
Figure 4 shows the spatial distribution of average annual and seasonal rainfall over the 1950–1979 and 1980–2017 periods. In terms of annual rainfall, it accounted for a decrease in the basins from east to west between the two compared periods. The limits of the selected precipitation classes were progressing towards the west (Figure 4). Likewise, if we stick to the 1600 mm isohyet, for example, it was located towards Dzeng during the first defined period, but it shifted towards Nsimi (to the west) during the second period (Figure 4).
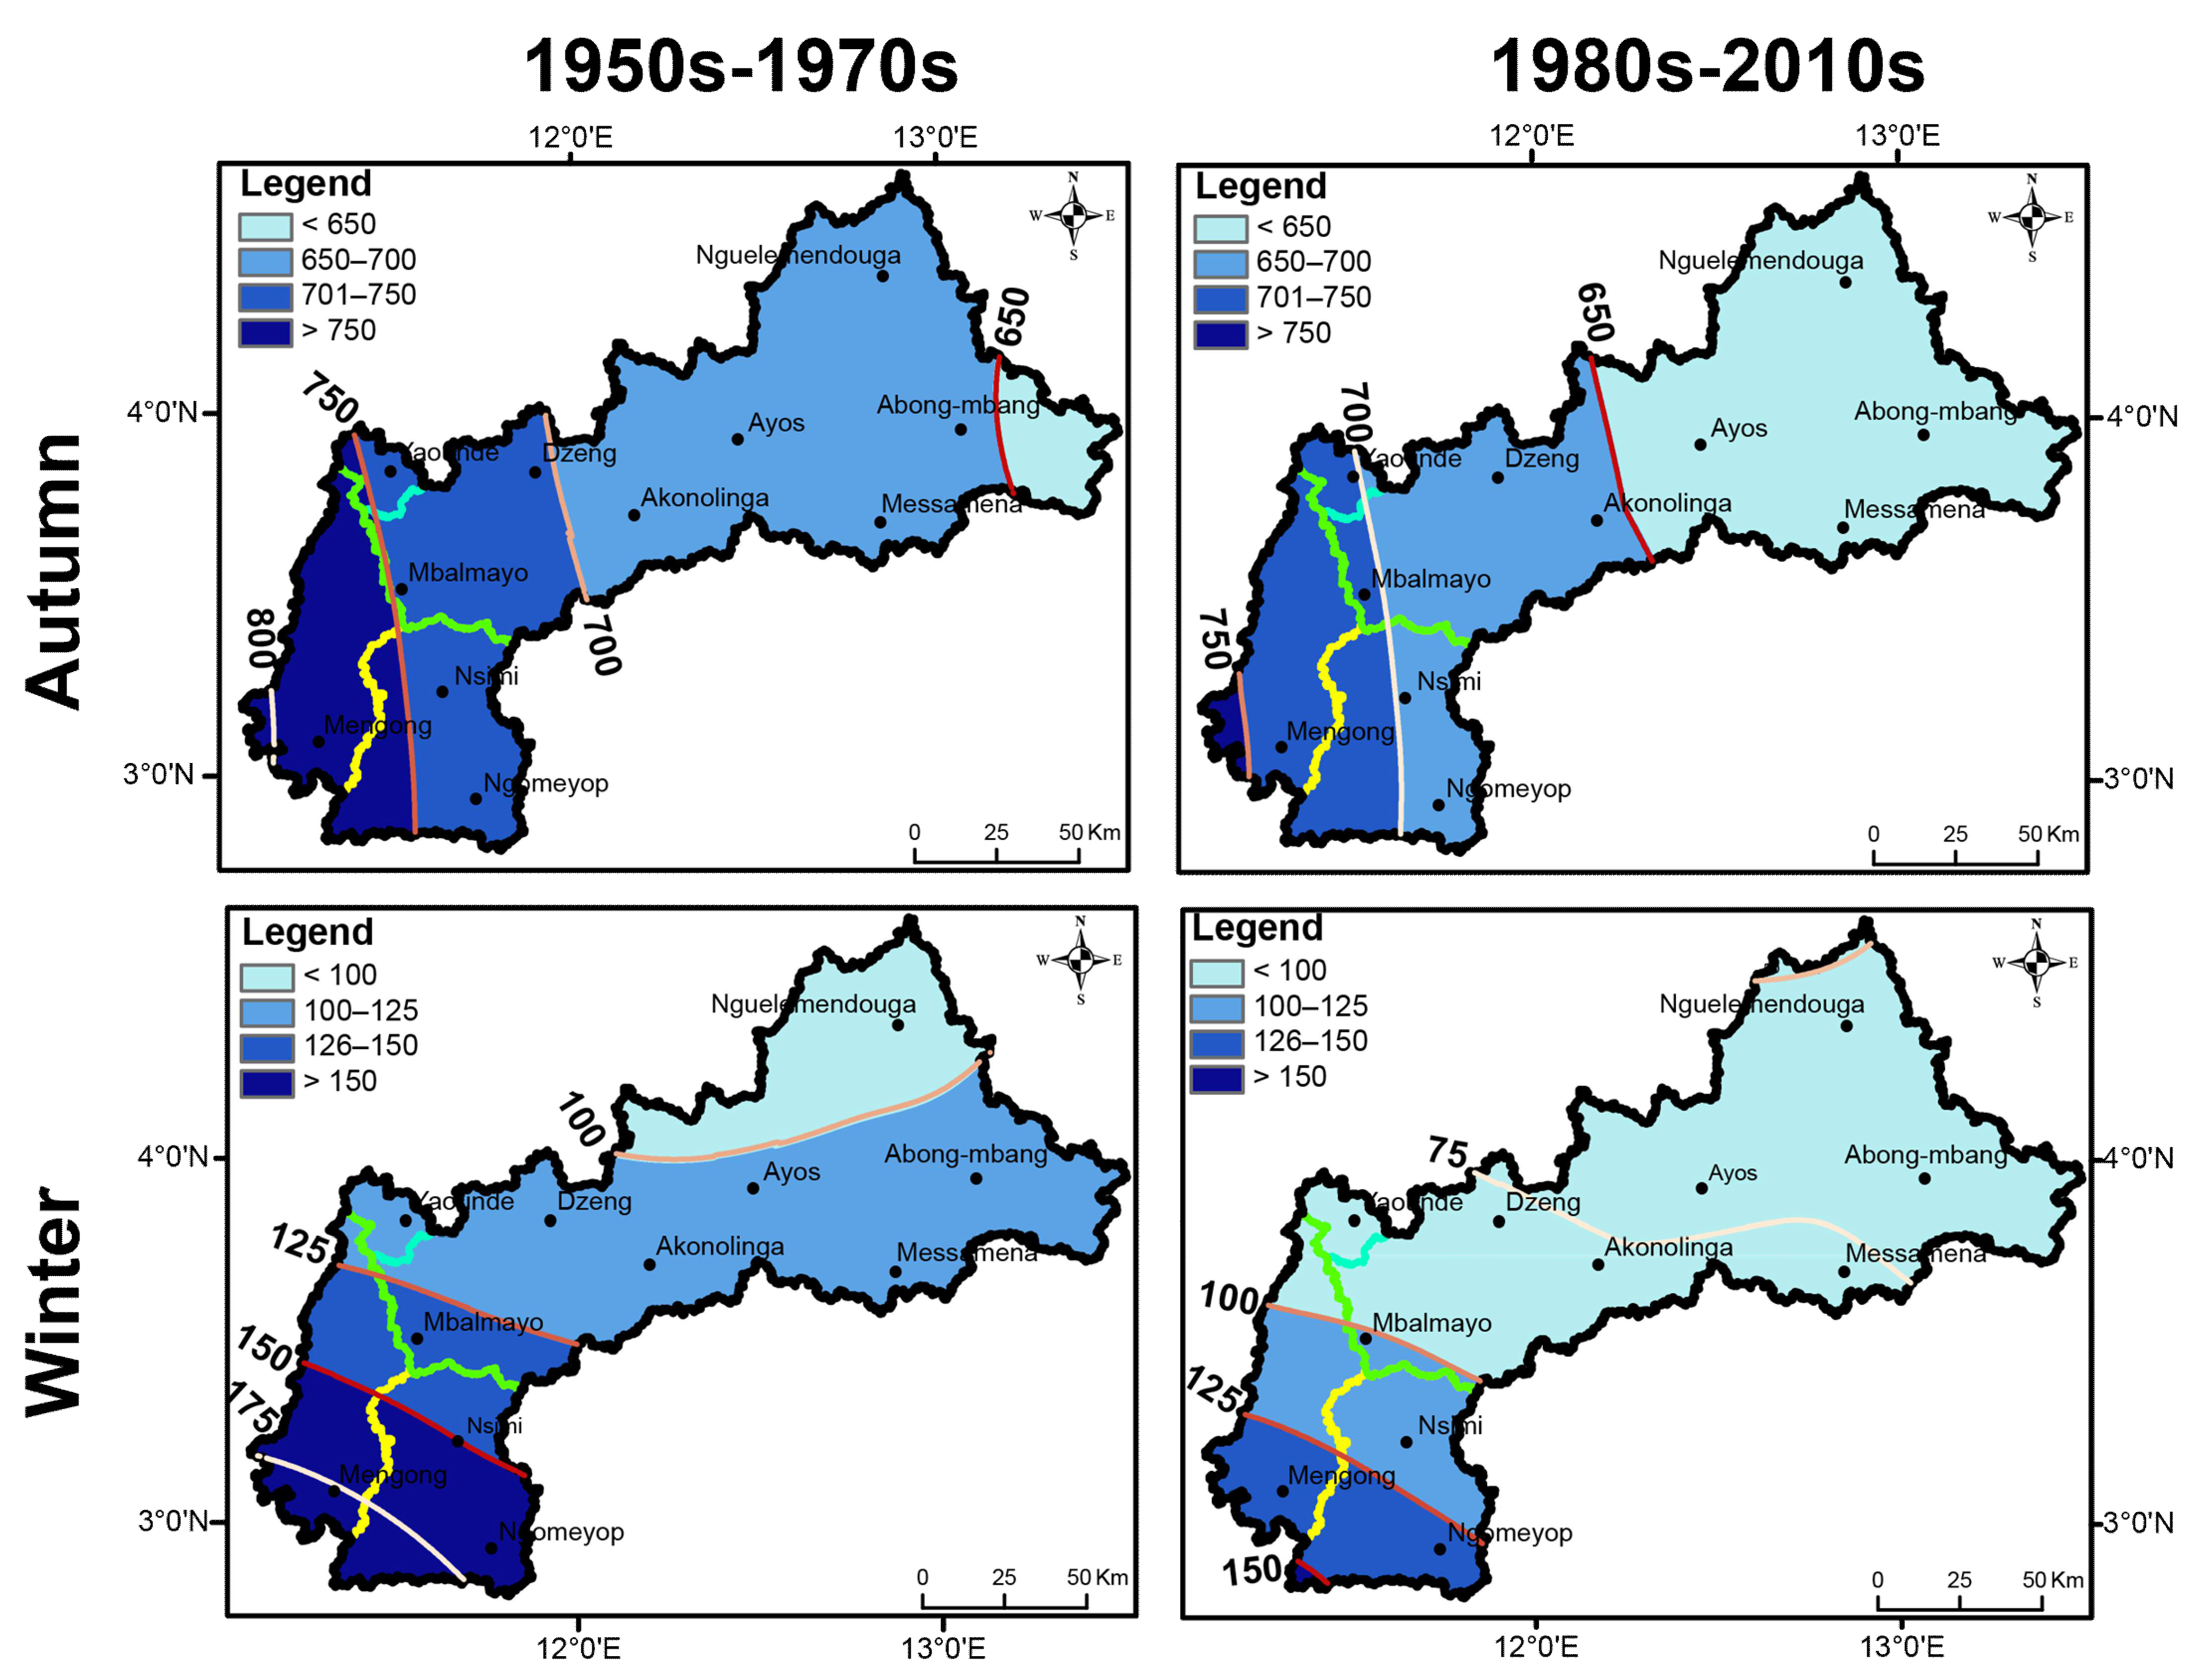
As for the rainy season’s rainfall, we also observed, as with the annual precipitation, a decrease in rainfall in the different basins from east to west between the periods compared. For spring, the limit of the weakest precipitation class (<650 mm) was around Abong-mbang during the first period but reached Akonolinga during the second period (Figure 4). In addition, the 750 mm isohyet located near Yaounde during the first period almost disappeared in the Nyong basin at Olama. The autumn precipitation evolved almost identically to spring in the basins studied (Figure 4).
In the case of the dry season precipitation, we noted an increase in summer precipitation from north to south in the basins (Figure 4). Summer precipitation exceeding 200 mm was confined to the northwest and southwest during the first period under study but extended to cover almost the entire basin during the second period. Winter precipitation decreased in the same direction (north–south). The lowest precipitation class (<100 mm) was confined to the north of the basin during the first period and covered most of the catchment during the second (Figure 4).
3.1.3. Relationships between Rainfall and Some Potential Sources of Variability
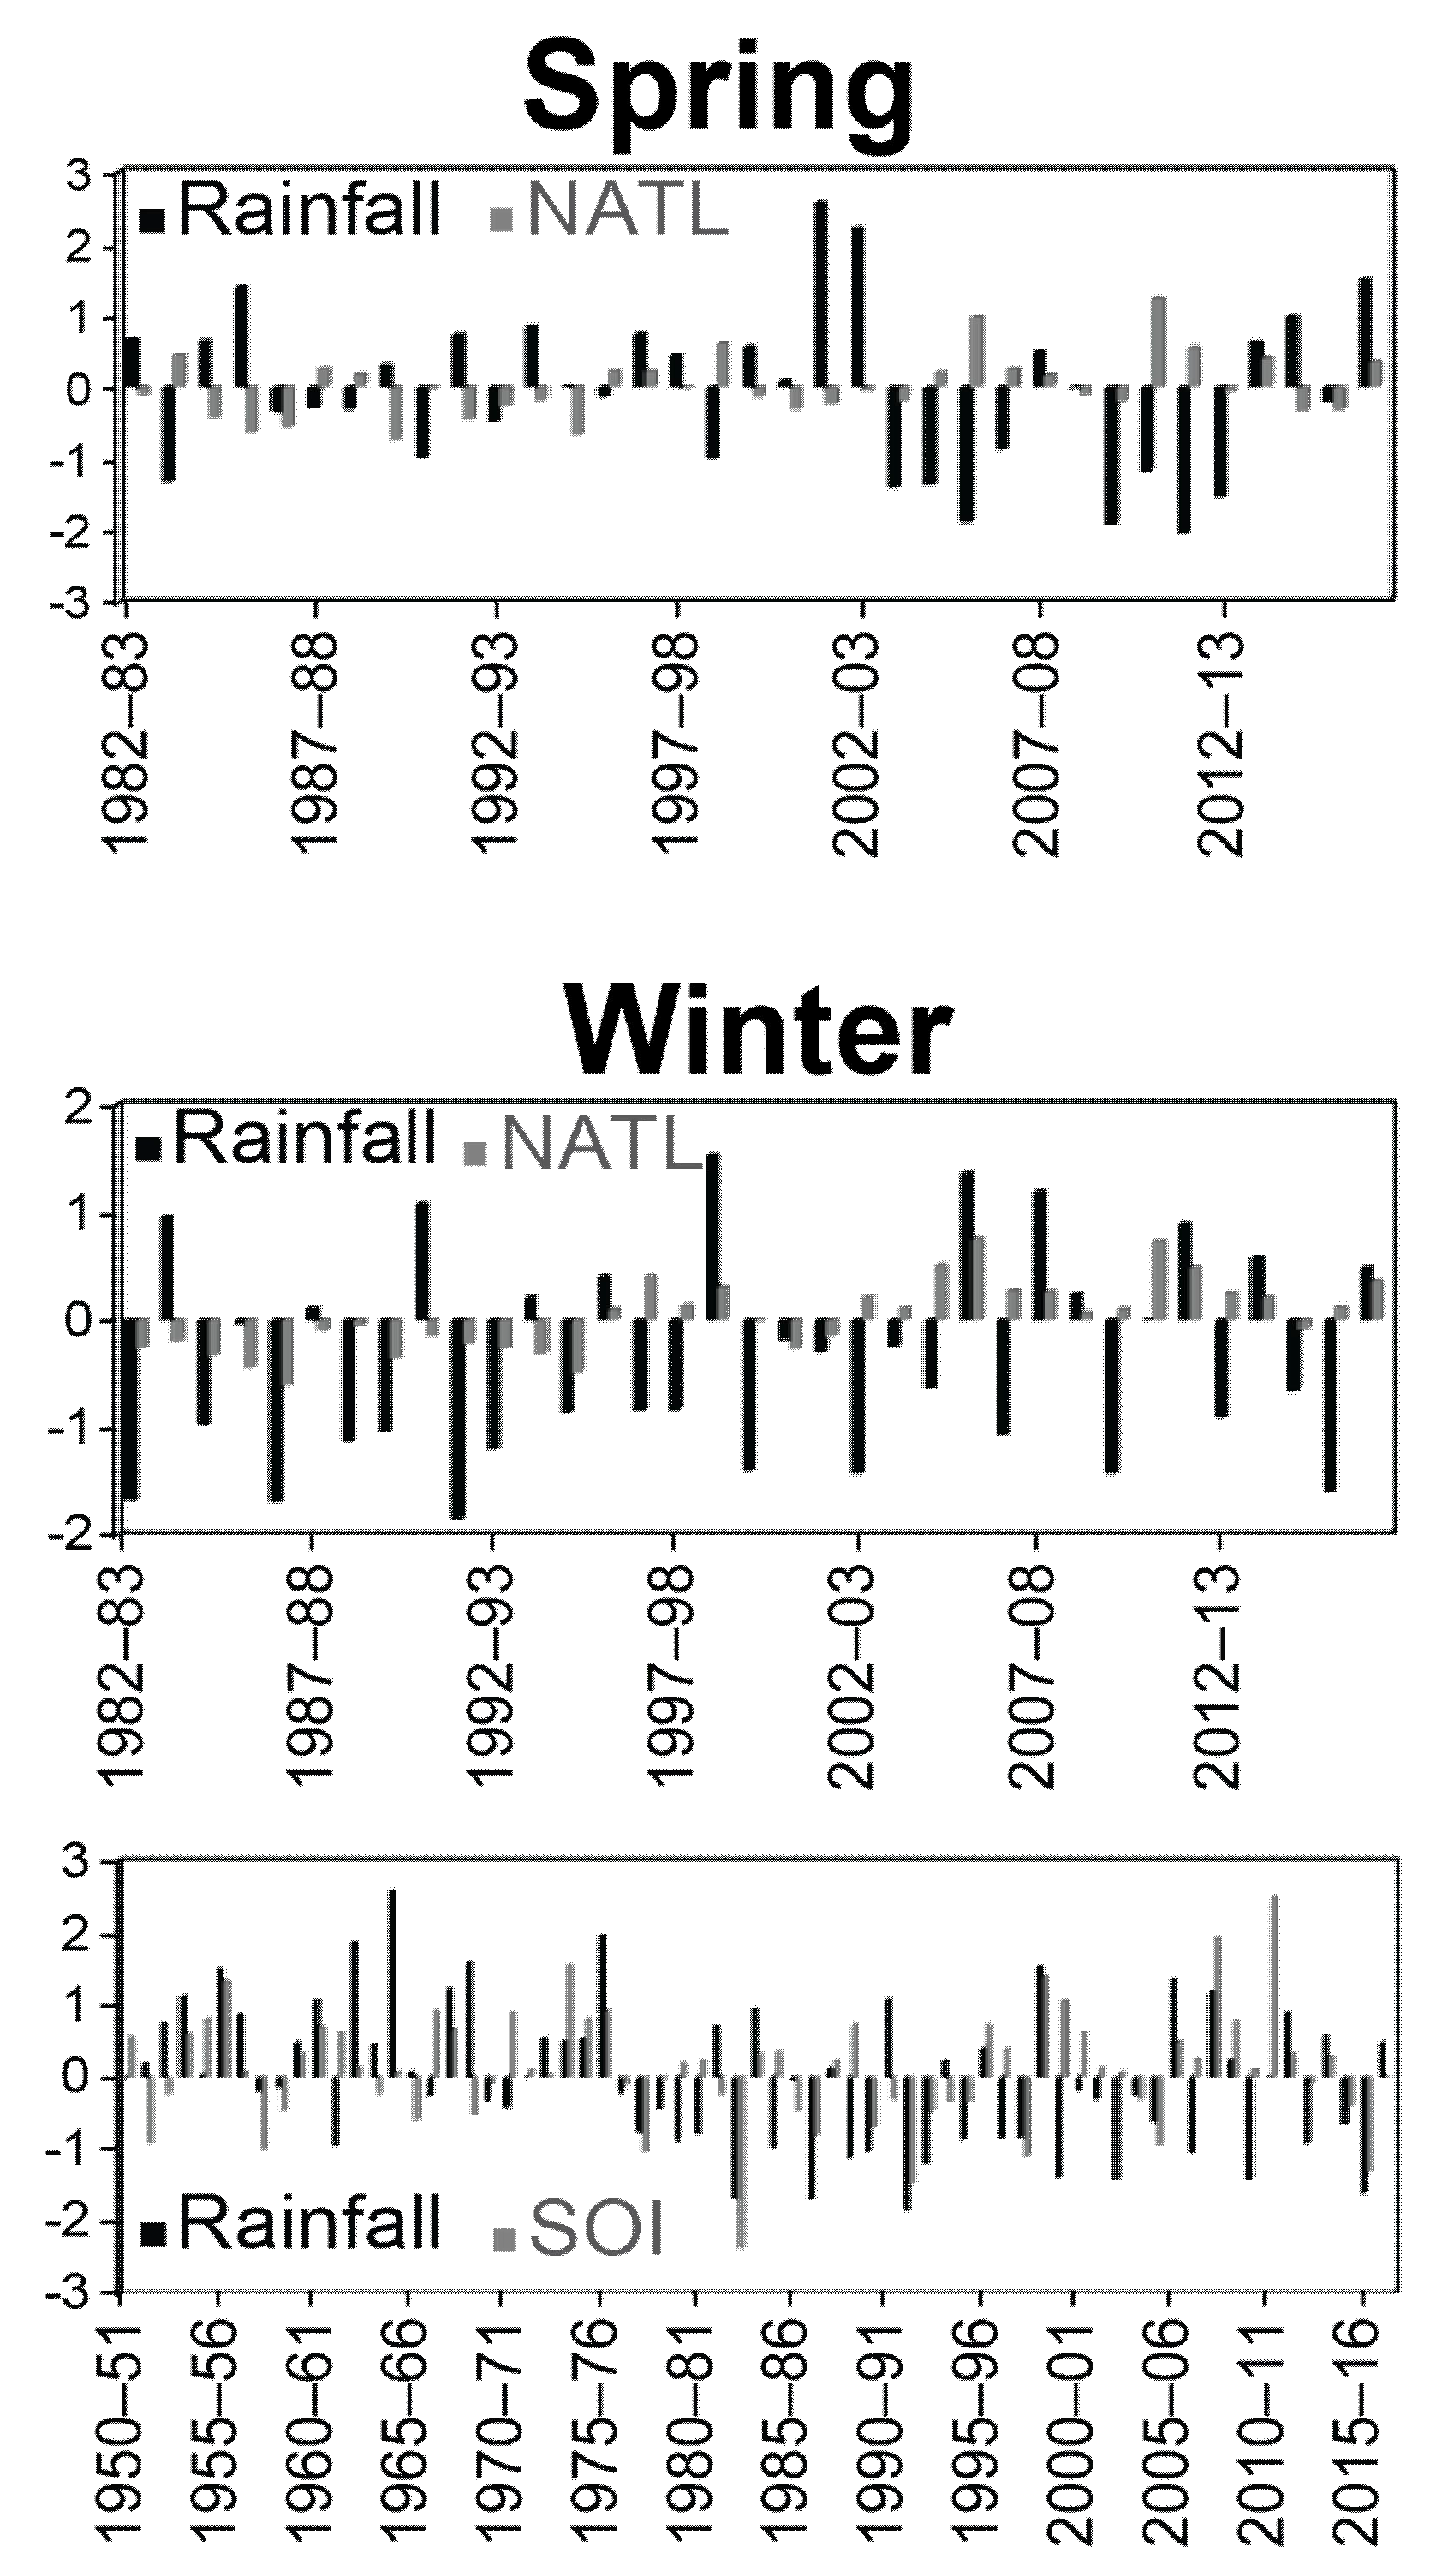
The changes in precipitation described above (decrease in annual rainfall and rainy seasons; cross-trend evolution in dry season rainfall) motivated us to the examination of the links between the rainfall in the Nyong basin and certain relevant sources of large-scale climate variability (SOI, NATL, SATL, DMI, MEI and NAO), which may influence precipitation in the region [34]. Table 4 presents the correlations between the anomalies of the representative climatic indices of these sources of variability and those of rainfall in the basin studied (Nyong at Olama) at annual and seasonal time steps. This analysis shows significant correlations in this basin between the anomalies of the NATL indices and those of rainfall during spring, but also between the anomalies of these same indices and those of rainfall in winter. Important links have also been demonstrated between the rainfall anomalies of this watershed and those of the SOI in winter.
NATL indices were negatively correlated with rainfall during spring (Table 4). This implies that warming (cooling) of the Tropical North Atlantic was associated with the low (heavy) precipitation over the Nyong watershed during this season (Figure 5). This configuration was sometimes taken by default on the two watersheds, in particular in 1986–87, 1990–91, 1993–94, 1996–97, 2010–11, etc. Opposite signs of NATL indices and the rainfall anomalies were, however, noted for 74% of the years studied in this watershed (Table 5).
The NATL indices, on the other hand, were positively correlated with winter rainfall (Table 3). An increase in the temperature of the Tropical North Atlantic would be concomitant with abundant rainfall in the watershed studied during this season and conversely (Figure 5). A different situation was nevertheless observed in these watersheds in 1990–91, 1996–97, 1997–98, 2004–05, 2015–16, etc. The proportion of years for which the same sign of anomalies was observed between these two variables during winter was 69% in the Nyong basin (Table 5).
As in the previous case, the SOI was positively correlated with the rainfall in the watershed studied in winter (Table 4). This implies that a warming of the Pacific Ocean was synchronous with the generally abundant rainfall during this season (Figure 5). This situation was not, however, observed for certain years (1950–51, 1963–64, 1968–69, 1970–71, 1984–85, 1990–91, 1996–97, etc.). The percentage of years having recorded the same sign of anomalies between rainfall and SOI in winter was 56%. The correlation between rainfall and SOI anomalies was good in winter, but the proportion of years with the same sign of anomalies did not give enough clear information.
The fact that winter rainfall was correlated with both the temperatures of the Tropical North Atlantic and the Pacific Ocean indicates a probable simultaneous control of these two oceans on the precipitation of the whole region during the winter.
Bogning et al. [40] recently demonstrated that an important relationship exists between the March-April-May (MAM) rainfall and the tropical Atlantic Niño. According to them, the negative temperature anomalies in the south-eastern equatorial Atlantic are at the origin of the positive anomalies of the MAM rainfall in the Ogooue watershed. The negative correlation coefficient between these two variables is high (r = −0.74). This study also highlights a relatively strong link (r = −0.56) between the spring rainfall of this watershed located further north of the equator and the temperatures of the Atlantic Ocean, with the difference that the link with the rainfall of this season has been established this time with the temperatures of the Tropical North Atlantic of the same season.
3.2. Evolution of Average and Extreme Discharge
The main features and trends in hydrological variability reported here are those detected for average (annual and seasonal) and extreme (maximum and minimum) discharges.
3.2.1. Average Flows
Average Annual Discharges
The annual modules of Nyong at Olama and Mbalmayo decreased significantly over their respective study periods (Figure 3). Ruptures were identified in the Nyong annual module series at these two sections, respectively: in 1971–72 (−18.9%) and 1973–74 (−11.9%). In these two sections, the 1980s was the only wet period after the 1970s (Table 3). Unlike the previous cases, the Mefou annual average discharges have increased significantly since 1985–86 (Figure 3). The surplus following this rupture was +55.2%. From the 1980s, all decades were wet in this basin, despite the slight decline observed during the 2010s (Table 3). The So’o average annual discharges decreased not significantly from the 2000s to the 2010s (Table 2 and Figure 3).
A comparison with other rivers in the sub-region (Ntem, Ogooué and Nyong), where similar analyses have been carried out, shows opposite evolutions which are at the same time shifted compared to the Mefou [28,41]. First of all, the statistically significant rupture that was detected marked, in the case studied, the start of a wet period, whereas it was a reverse trend on the rivers involved. It then appeared that this was later on the Mefou (1985–86); conversely, it occurred much earlier on the three other rivers concerned by the comparison; specifically, in 1977 on the Ogooue at Fougamou, in 1971 on the Ntem at Ngoazik and 1973 on the Nyong at Mbalmayo [28,41].
Evolution of Average Seasonal Discharges
The spring modules evolved similarly to the annual modules in the Nyong (at Olama and Mbalmayo) and the Mefou basins. Ruptures occurred in the discharge series during the same years as the annual modules (Figure 3). The rates of change recorded following these ruptures were −30.4% (Olama), −25.7 (Mbalmayo) and +66.4% (Mefou). The decrease in spring modules, which began in the 1970s, was continuous until the 2010s in the Nyong basin at Olama and Mbalmayo (Table 3). The increase noted for the modules of this season on the Mefou during the 1980s was amplified starting from the 2000s. In the So’o basin, the spring modules decreased non-significantly from the 2000s to the 2010s (Table 3).
The autumn modules changed significantly in the Mefou basin only. A rupture followed by a surplus of +27.8% was detected in this season’s module series in 1985–86 (Figure 3). Despite their general increase, the modules of this season have declined considerably since the 2000s in this basin (Table 3). In the Nyong basin (at Olama and Mbalmayo), autumn modules increased between the 1970s and 1980s, but have declined significantly since the 2000s (Table 3). In the So’o basin, the autumn modules decreased insignificantly from the 2000s to the 2010s (Table 3).
In summer and winter, average discharges in the Mefou appear to have experienced a statistically significant change, according to the Pettitt test. The ruptures occurred during these two seasons in 1985–86. The respective surpluses noted were +62.8% and +40% (Figure 3). The discharges of these two seasons increased since the 1980s, but there has been a drop since the 2000s, which seems more important during winter (Table 3). The average discharges of the Nyong at Olama and Mbalmayo have decreased during the summer since the 1970s. However, this decrease was periodically interrupted during the 1980s and 2000s on the Nyong at Olama (Table 3). Winter modules have also generally decreased since the 1970s in the Nyong basin at Olama and Mbalmayo, but a considerable increase was observed during the 2010 decade. The decadal deviations from the interannual average of this decade were +3.3% and +9.8% at Olama and Mbalmayo (Table 3). The So’o experienced a non-significant decrease in summer and winter discharges between the 2000s and 2010s (Table 3).
We note that the power of the tests is a function of the size of the series [38,42,43]. It is visible in the case of the So’o. Only 18 years long, the series of average discharges (annual and seasonal) of the So’o were the only ones to have not recorded any statistically significant evolution, except those of the summer. However, in the case of the three other basins, whose sizes of the series oscillate between 51 years (Olama) and 65 years (Mbalmayo), significant changes have been recorded in most cases, in particular by the Pettitt test. The power of the tests also seems to depend on the importance of the series’ variability, but also on the condition that this (series) has a large size. Average discharges series (annual and seasonal) of the Mefou, for example, had significant coefficients of variation, oscillating between 22% and 44% (Table 1). Both tests revealed statistically significant changes in most cases (Table 2). For the So’o, on the other hand, where the series were short, the average summer discharges were the only ones to have recorded a statistically significant change (Table 2); yet, the variability of the different series’ studied was also high, between 31% (winter) and 51% (summer) (Table 1).
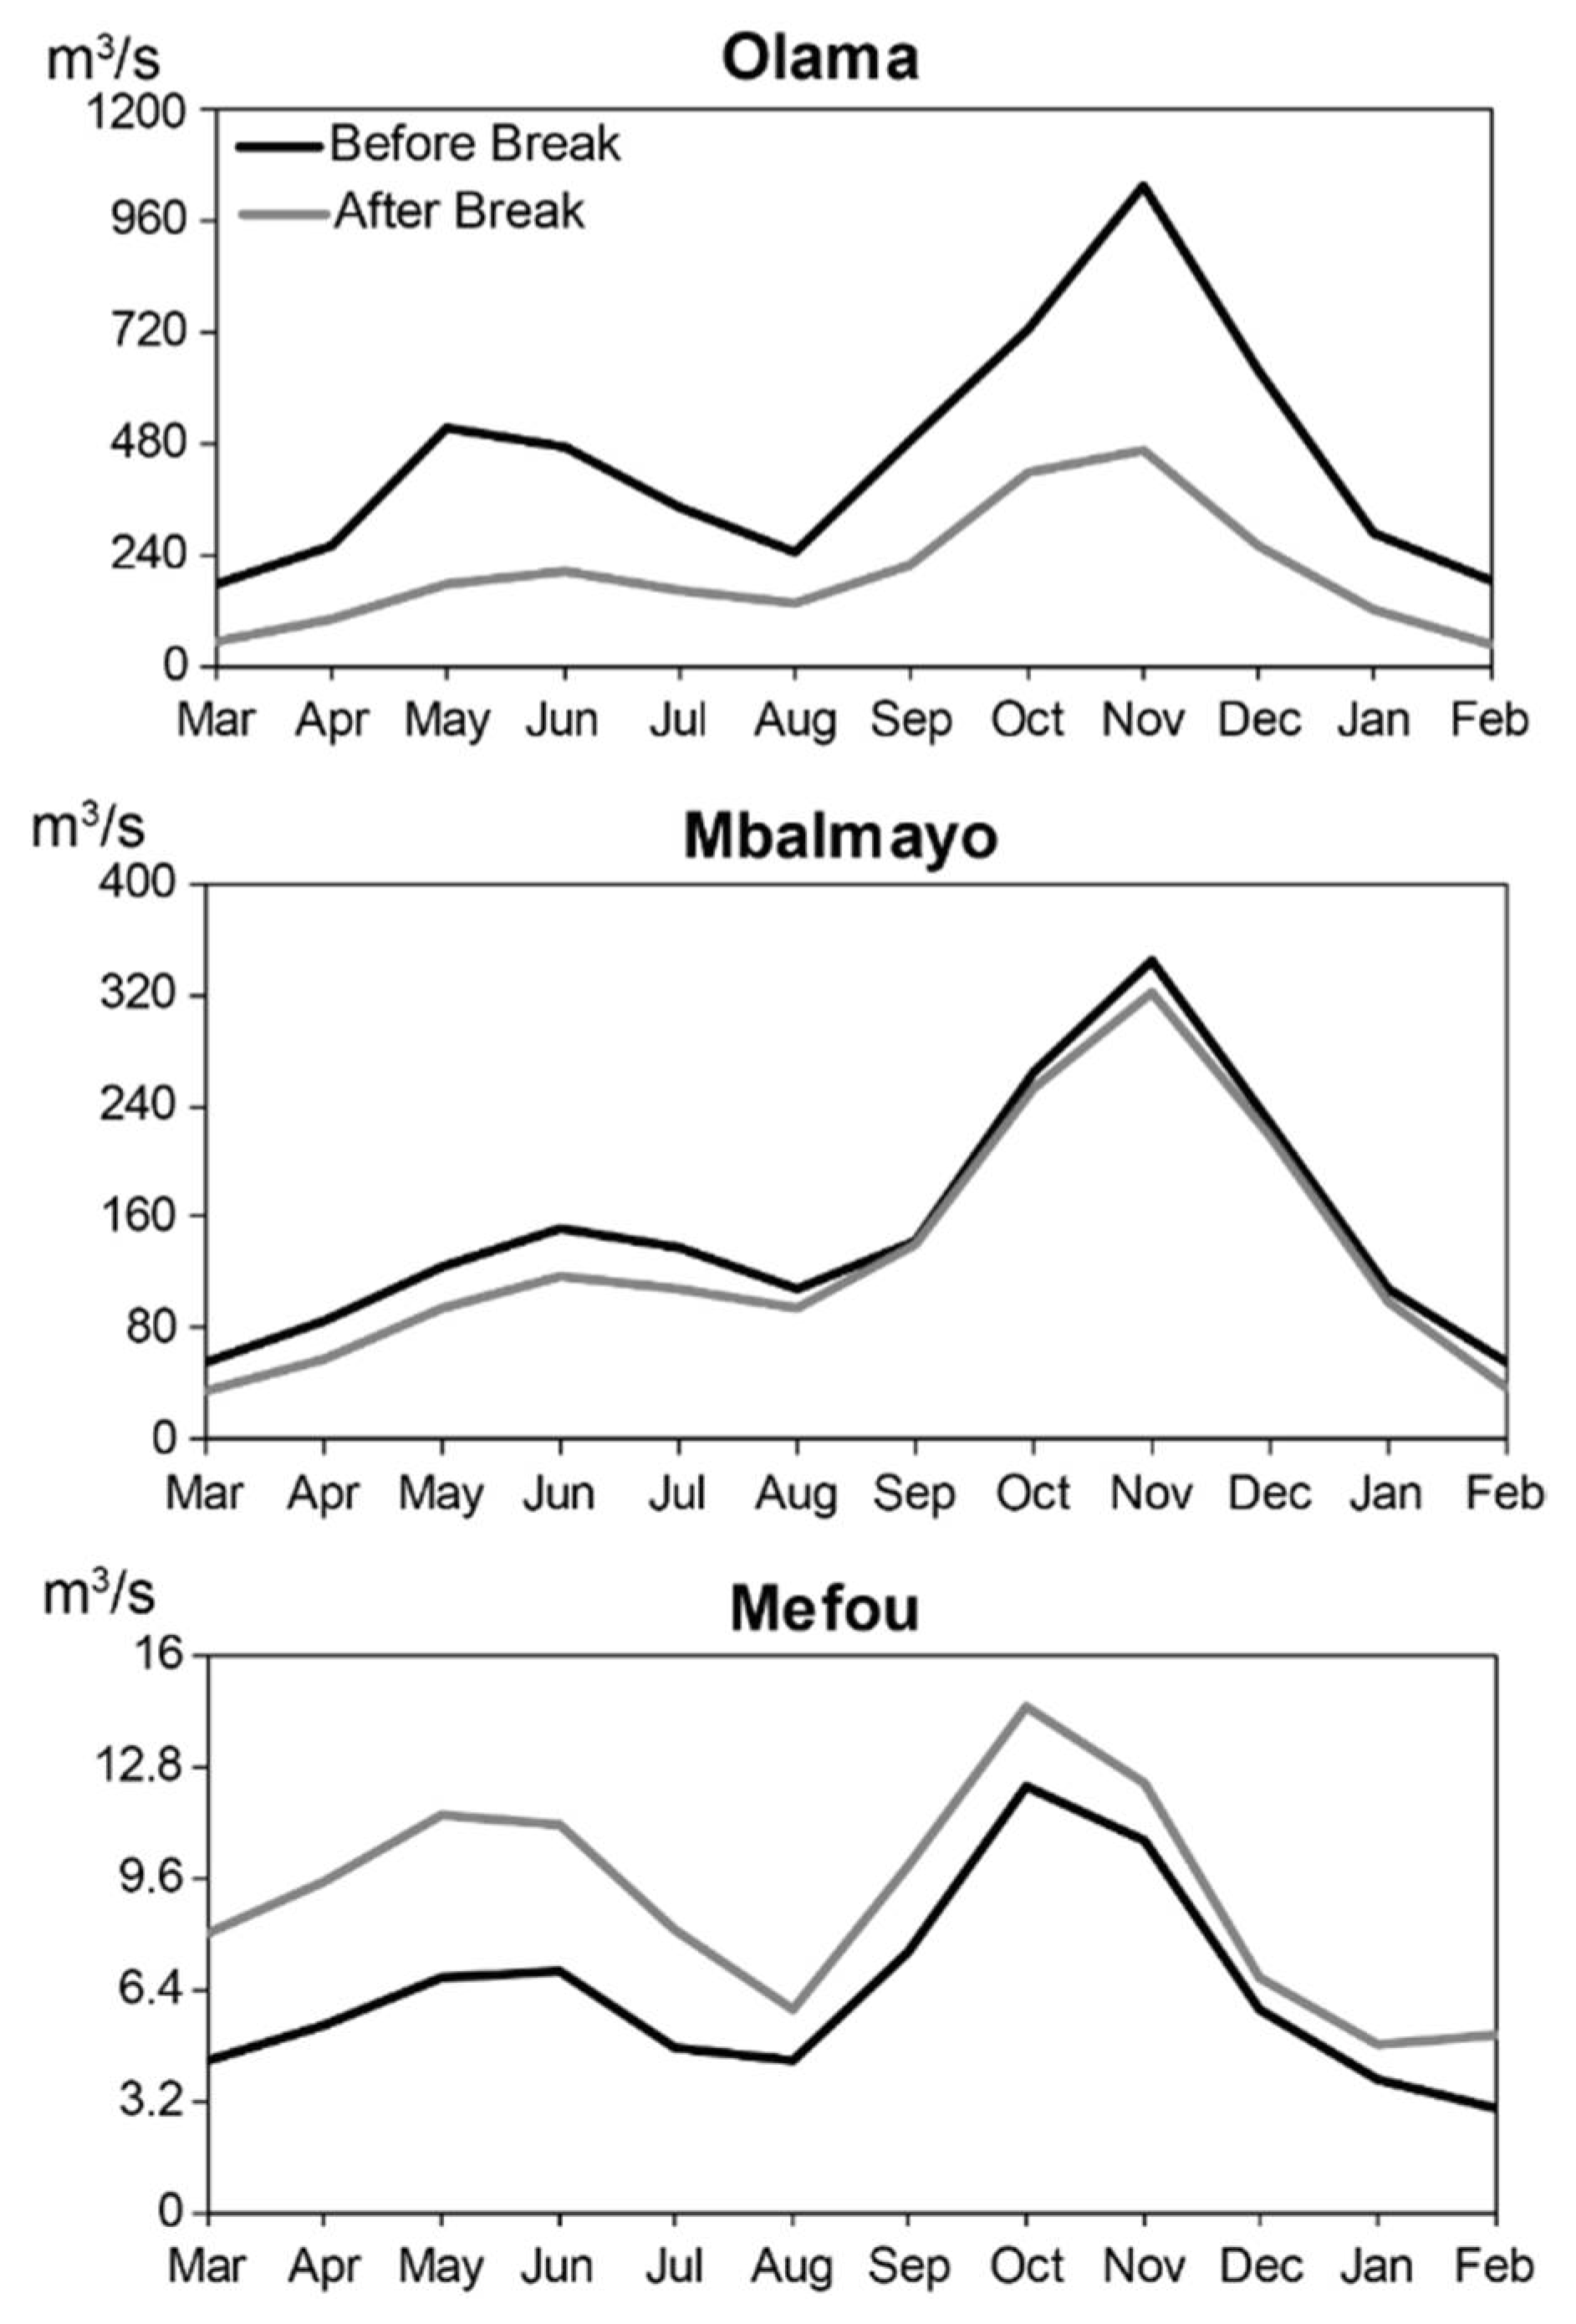
By comparing the regimes of the homogeneous periods located before and after the rupture in the different basins, we note that the Nyong regime remained practically stable in the two sections studied after the rupture. However, there was a sharp decrease in spring and autumn after the discontinuity at the Olama outlet. At the Mbalmayo outlet, the spring discharges seem to be the only ones to have been significantly impacted (Figure 6). The Mefou regime at Nsimalen, on the other hand, has been considerably modified. The spring flood almost caught up with the autumn (Figure 6).
3.2.2. Extreme Flows
The extreme flows of the Nyong (Olama and Mbalmayo) and Mefou were analyzed through maximum and minimum over consecutive days (1, 3, 7, 30 and 90 days).
Maximum Flows
First of all, it is worth noting that the period after the rupture corresponded to a deficit phase on the Nyong (Olama and Mbalmayo) and a surplus phase on the Mefou.
For the Nyong at Olama, the dryness of this period was also noticeable in the maximum flows. There was a decrease in all the ranges of maximum flows evaluated (Table 6). The 90-day maximum flow experienced the largest decline (−9.2%), while the smallest decrease was observed for the 30-day maximum (−7.2%). The variability of all maximum flow ranges was relatively modest and did not change significantly after the rupture. Before or after the rupture, the coefficients of variation of the different maximum flow ranges oscillated between 22% and 23% (Table 6). The average onset date of the maximum was only three (3) days early after the rupture (Table 6).
In the case of the Nyong at Mbalmayo, despite the dryness of the post-rupture period, all maximum flow ranges did not experience significant changes during the latter period (Table 6). The 3-day maximum flow recorded the largest increase (+0.55%), and the largest deficit (−0.76%) was noted for the 30-day maximum flow (Table 6). A slight reduction in the variability of maximums was also noted during this period, which appeared greater in the case of the short-term ranges (1-day to 7-day), for which the coefficients of variation decreased from 26% before the rupture to 23% after (Table 6). The maximum appeared earlier in Mbalmayo after the rupture. Their average Julian observation date reduced from 318 before the rupture to 309 after the rupture (Table 6).
For the Mefou, the different maximum flow ranges have all increased after the rupture. These increases were between +31.2% (7-day maximum) and +46.5% (90-day maximum). While an upward trend was observed for a flood, this was not the case for the coefficients of variation and the maximum dates of occurrence. The coefficients of variation of the various ranges of maximum flow rates decreased by more than 10% after the rupture. The average date of onset of the maximum reduced from 302 before the rupture to 180 after (Table 6).
The Minimum Flows
The minimum flows evolved in the same direction as the maximum flows in the Nyong basin at Olama. The various ranges considered decreased at rates ranging from −31% (30-day minimum) to −19.6 (1-day minimum). This decrease was accompanied by a significant increase in their variability. The increase in the variability of the 30-day minimum flow was the least significant. Its coefficient of variation increased from 32.2% before the rupture to 72.9 after (Table 6). The onset Julian date of the minimum increased by 5 days on average after the discontinuity (Table 6).
For the Nyong basin at Mbalmayo, the evolution of minimum flows differed from that of the maximum. All of the different ranges taken into account have decreased considerably after the rupture, regardless of the flow duration. The rates of change recorded after the discontinuity were quite close from one range to another, varying between −29.3% and −36.2% (Table 6). The 90-day minimum flow rate was the only one where there was a slight reduction in variability after the rupture. For the other four ranges, an increase was observed, which seemed greater for the short-term minimum (1 and 3-day). Their coefficients of variation increased from 30% before the rupture to 41% after (Table 6). The minimums were slightly late on the Nyong after the rupture. Their average Julian date increased from 61 before the rupture to 67 after (Table 6).
In the case of the Mefou basin, the minimum evolved in the same direction as the maximum (Table 6). Their rate of change was between +57.1% (90-day minimum) and +82.3% (7-day minimum). The variability of all minimum flow ranges increased slightly after the rupture. The average Julian date of onset of flows was earlier, over time reducing from 80 before the rupture to 71 after (Table 6).
4. Discussion
The changes in the flow regimes in the studied basins require explanations which are provided herein by examining the flow regimes using a combination of environmental forcings (land use and precipitation).
4.1. The Impact of Changes in Land Use Patterns
Significant hydrological changes observed after the rupture occurred in some of the studied basins (Mefou and Nyong at Mbalmayo) seem not to have any links with changes in precipitation. In the case of Mefou, annual and seasonal precipitation decrease (apart from summer), while the annual and seasonal average discharges increase. Additionally, while the maximum and minimum discharges are increasing, the rainy seasons (autumn and spring) and the winter precipitation, which are respectively at the origin of their production, are decreasing. In the case of Nyong, it is virtually the same situation. The maximum stability is concomitant with a decrease in precipitation during the rainy seasons that generate them. All this prompts us to investigate the evolution of land use in the two basins.
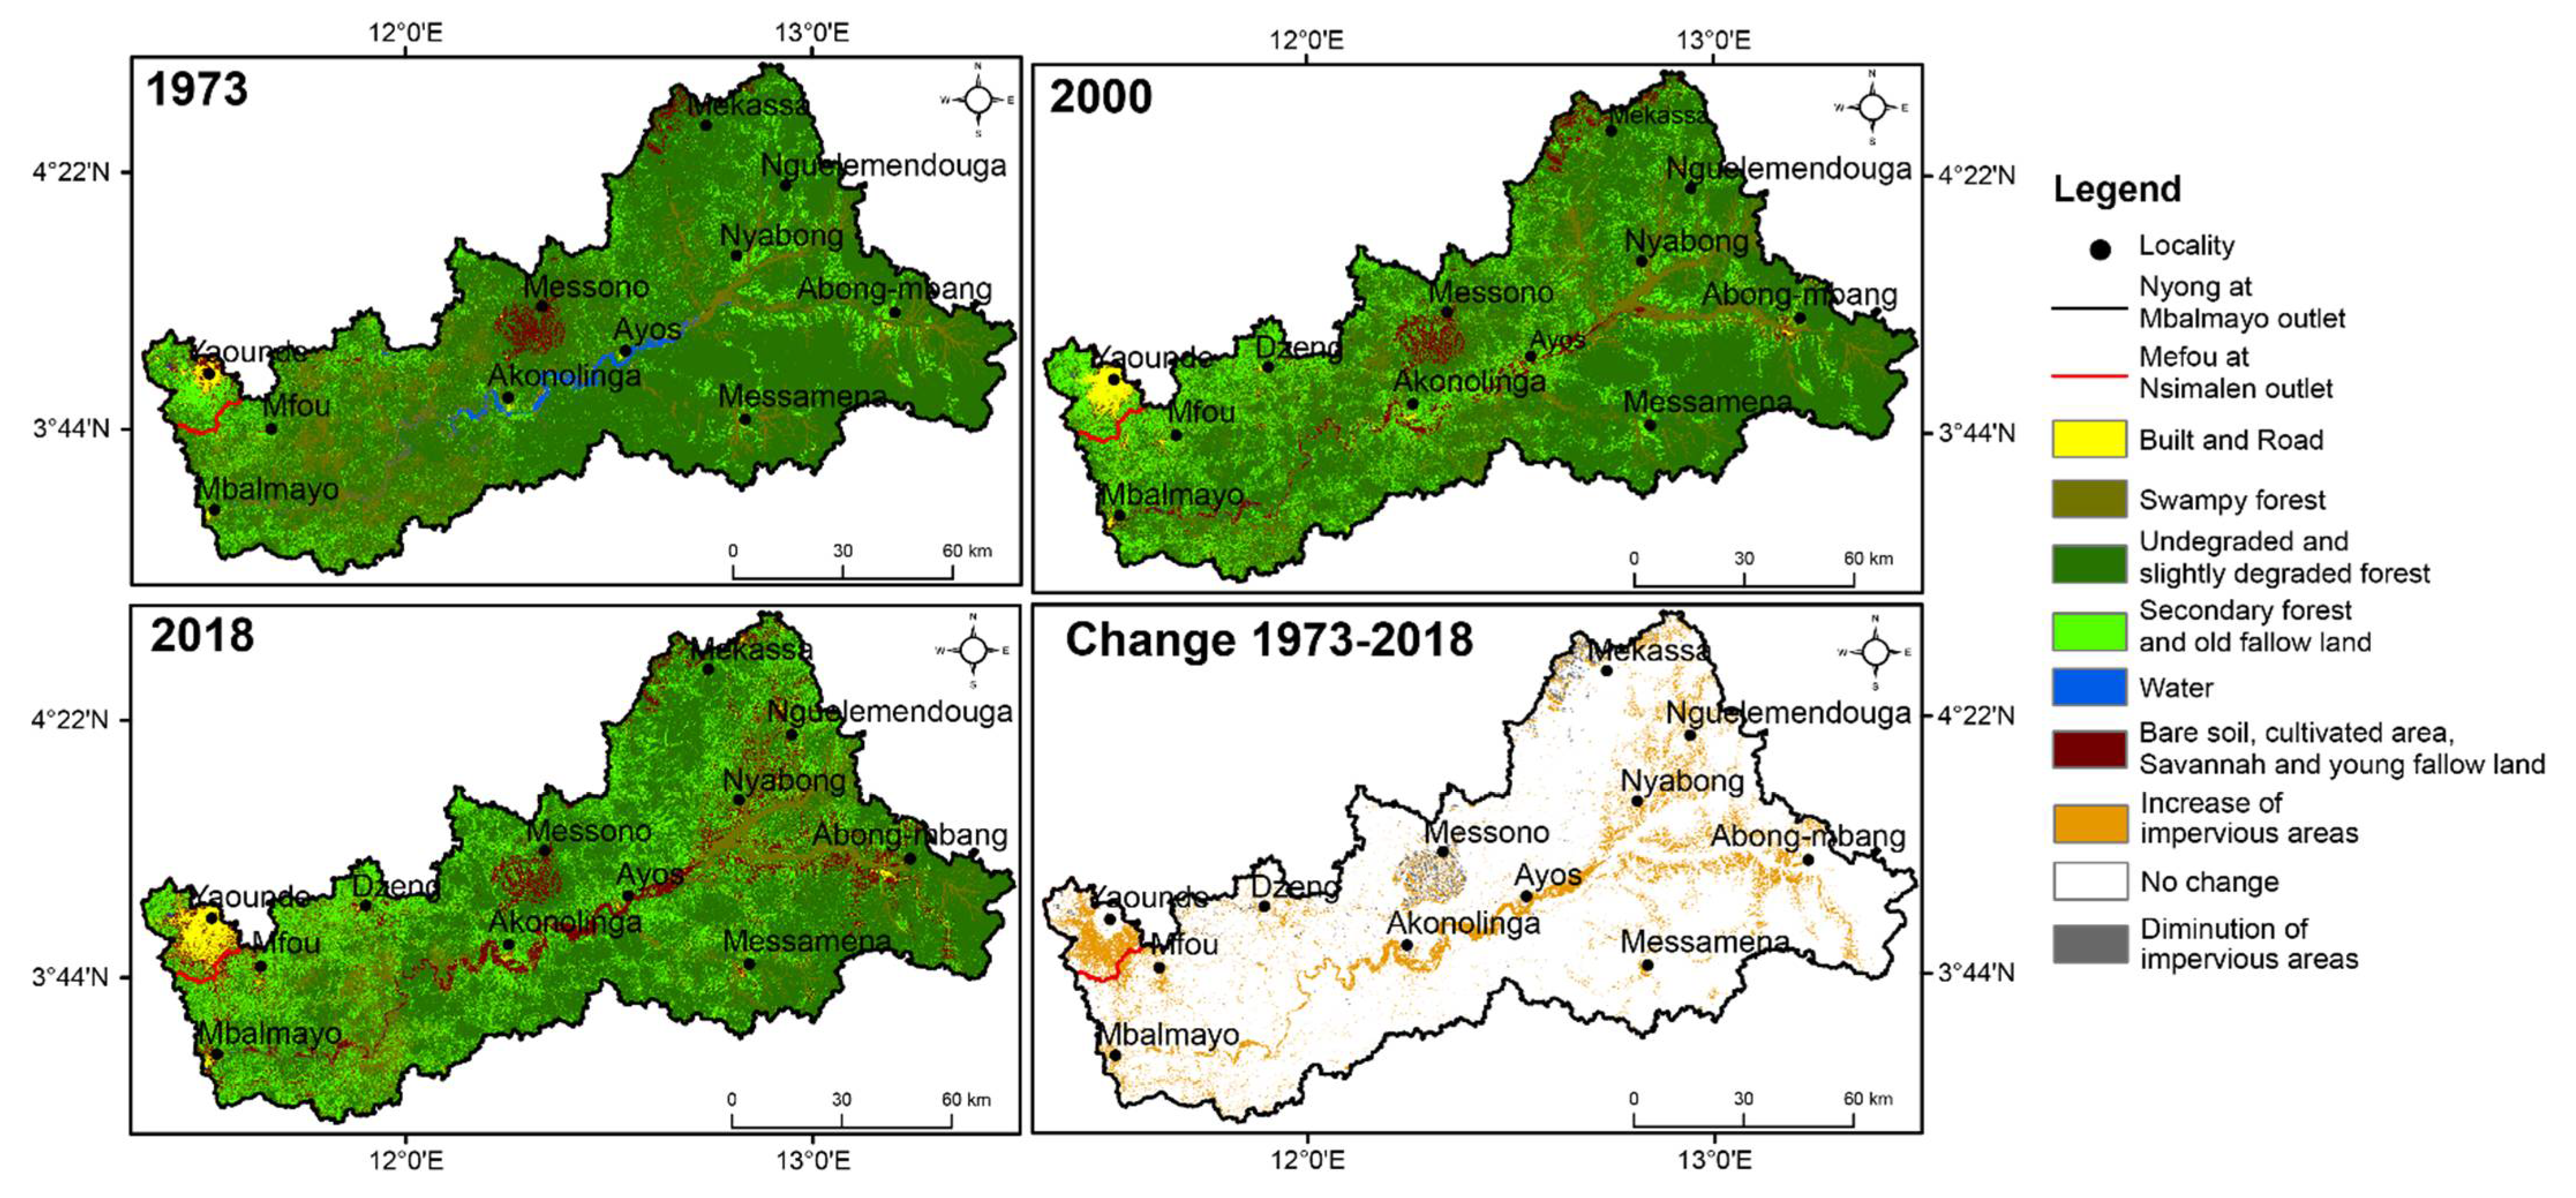
A change detection analysis performed with SNAP, through the diachronic comparison of the results of supervised classifications of Landsat images, shows significant changes in land occupation and use patterns in the Nyong basins at Mbalmayo and Mefou (Figure 7). In general, there is an increase in impervious areas in these two basins (made up of buildings, roads, bare soil, young fallows and cultivation areas) to the detriment of forest areas and water bodies. In the Nyong basin in Mbalmayo, the increases are between +416.3% (bare soil, savannah, cultivated area, young fallow) and +222.8% (buildings, roads). In the Mefou, changes in land use are between +676.9% (buildings and roads) and +300.4% (bare soil, savannah, cultivated area, young fallow) (Table 7). Some authors in Central Africa [44,45,46,47], West Africa [48,49] and elsewhere [50,51] have made similar observations relating to changes in land use in these sub-regions.
In a medium-sized basin like the Mefou, changes of this type and of such a magnitude can induce hydrological alterations such as those observed in this basin (increase in average and extreme flows, the early timing of peak flows). Regarding the increase in flows, it should be noted that, in a context where the precipitation that generates the flows decreases, the most logical thing would have been to observe a corresponding decrease in flows; however, this is not the case. The current rate of urbanization in this basin seems to be the most plausible factor to justify this trend. In this case, the decrease in precipitation appears to have been offset by increasing runoff. The annual average runoff coefficients of this basin have indeed increased significantly since the 1980s (Figure 3 and Table 3), following a phase of accelerated urbanization in the upstream part of this basin (Yaoundé region) from the 1980s [52]. Concerning the early timing of maximum flows, the observed changes in surface conditions reduce the response time of the basin. Thresholds of impervious surfaces beyond which urbanization is supposed to have, at the basin scale, a statistically significant influence on river flows, are proposed in the literature. However, the figures put forward by the various authors are somewhat contradictory. Some authors place this threshold at 10% of impervious surfaces [53,54], while others place it at 20% [55]. The threshold proposed by Yang et al. [56] is much lower (3–5%). In all cases, by remaining strictly within the limits of the Mefou sub-basin at Nsimalen outlet on the one hand, and by considering the urban surfaces (buildings and roads) analyzed using the Landsat 8 image of 2018 on the other hand, it appears that this imperviousness rate, which exceeds 50%, is exceeded in the case studied. Under these conditions, it is logical that hydrological alterations such as those observed in this study occur. Studies in sub-Saharan Africa [45,57] and elsewhere [58,59,60,61] have already reported the impact of urbanization on runoff. This work has shown an increase in average flows, following an increase in impervious areas in the studied basins.
For the Nyong basin at Mbalmayo, the stability observed for the maximums after the rupture could also be a consequence of the changes in surface conditions. The most logical process would have been to see the maximum decrease because of the evolution of the precipitation of the two rainy seasons that generate them. The current rate of urbanization of this basin, although modest, seems to be the main factor that can justify this lack of trend. As in the Mefou case, the increase in runoff has offset the decrease in precipitation. It is quite possible to wonder about the impact of such a modest imperviousness rate on runoff. Given that the changes in extremes do not agree with other processes having a proven impact on runoff—in this case, the decrease in precipitation highlighted in this study and the increase in temperatures postulated by Amougou et al. [62] in the region—which act rather in the direction of flows reduction and a late observation of the maximums, it is quite possible to attribute this flow’s trend to the changes in land cover, however modest they may be. Their combined action on the flows could have been considerably amplified by their location in the basin (to the west, near the outlet of the basin), which would favor the rapid delivery of runoff with the least possible losses towards the outlet, thus erasing the effect of size and forest cover of the basin. Some authors [63,64] have already shown that the impacts of impervious surfaces are attenuated when they are not near rivers. If this situation persists, there is every reason to believe that an increase in the Nyong’s flood will occur within a few years, despite the drop in precipitation. This urbanization action is not perceptible on the flows in Olama (further downstream) because of the considerable contributions of the So’o (after Mbalmayo), which is one sub-basin on the left bank that is still almost mainly forestry.
4.2. The Impact of Precipitation
At the annual time scale, the impact of precipitation is perceptible in the flows of the studied basins. There is a significant synchronous decrease in precipitation and flow in the Nyong basin at Olama and Mbalmayo during the 1970s. Although the dates of ruptures highlighted for the precipitation and the flows do not strictly coincide in the two cases (Olama and Mbalmayo), the fact that they occur during the same decade, marked by the beginning of an evolution in the same direction (decrease), leads us to postulate a possible link between these two variables (precipitation and flows). Mpakam et al. [65] also highlighted the impact of rainfall on Nyong’s discharges at the annual time step.
In the rainy season, the autumn flows and runoff coefficients increase in the Nyong basin at Mbalmayo and Olama between the 1970–1990 decades, while the precipitation does not very much in the region. This increase seems to be the result of summer precipitation increasing. The summer precipitation’s impact on autumn discharges is more noticeable during the decades 2000 and 2010. For these last, there is a joint decrease in summer precipitation, autumn flows and runoff coefficients despite a negligible variation in autumn precipitation in the large basins (Table 3). Because of these developments, the increase in precipitation during the summer dry season during the decades from 1970–1990, considerably reduces the deficit of evaporation and water reserves in the soil at the start of the autumn rainy season, favoring runoff [26]. The portion of precipitation that is converted to runoff increases, resulting in an increase in autumn runoff coefficient during these decades (Table 3). The decrease in summer precipitation during the decades 2000 and 2010 has the opposite effect, which is why we see, during the latter, a reduction in runoff coefficients responsible for a reduction in flow.
In the spring, the precipitation and the flows decrease in a statistically significant way during the decade 1970. As with the annual time step, one could expect a possible impact of the precipitation of this season on its discharges. However, the winter precipitation’s impact also appears noticeable in spring runoff, between the 1970–1990 decades only. The winter precipitation decline over this interval appears to be closely related to that of the spring runoff. The rates of change in these two variables during this interval are consistent (decrease in both cases) (Table 3). Liénou et al. [26] already suggested this influence of winter precipitation over the same period. The authors argue that from the 1970s, the decline in winter precipitation created a water deficit (evaporation and soil water reserve) in the basin at the start of the first spring rainy season. This winter deficit means that a part of the precipitation received during the spring first fills this water deficit; therefore, the fraction that generates the runoff is reduced. Then, this results in low runoff for the same average precipitation levels during the spring, which explains the decrease in the runoff coefficient (Figure 3). In the decades 2000–2010, on the other hand, the impact of winter precipitation on spring runoff is not visible (Table 3). Over this interval, the winter precipitation impacts the winter runoff itself. It is visible during the 2010s, during which a lesser drop in winter precipitation is concomitant with an increase in the runoff for the same season. The lesser impact of winter precipitation on the spring flows of the Nyong between the 2000–2010 decade has been already suggested in the literature [28]. However, it should be noted that, unlike the Nyong basin, the increase in winter precipitation observed in the region between the decades 2000–2010 is visible in the spring flows from basins located further south, such as the Ntem and the Ogooué [4,28].
The role of precipitation is also visible in the flows of the Mefou. In reality, in this basin, precipitation contributes to amplifying or reducing the increase in runoff observed since the 1980s. We note that summer precipitation has increased significantly in the Mefou basin, since 1979–80. Annual and seasonal precipitation is decreasing. Significant statistically decreasing trends are observed for autumn (1972–73) and winter (1978–79) precipitation. The different cases where a downward trend was observed (autumn and winter) are also those for which increases in flow are the least important after the identical rupture of 1985–86. On the other hand, the greatest increases in flow are observed in cases where there is an upward trend (summer) or an absence of rupture (spring). Similarly, the 2010s, characterized by a significant drop in precipitation, also happen to be the years for which the surpluses observed since the 1980s are generally the lowest, apart from the spring for which the increase remains relatively high (Table 3).
In the So’o basin, the precipitation–flow relationship seems quite clear. From the 2000s to the 2010s, there is a non-significant decrease for these two variables (Table 3).
5. Conclusions
The objective of this study was both to characterize, over the recent period, the hydroclimatic variability in the Nyong basin (at Olama and Mbalmayo gauging stations) and two of its sub-basins (So’o and Mefou), and also to look for the key factors explaining the observed hydrological fluctuations. On an annual timescale, precipitation has decreased statistically over the basins studied. In the Nyong (Olama and Mbalmayo), the decrease in precipitation was synchronous with that of discharge, while it was concomitant with an increase in flows on the Mefou. The extreme flows (maximum and minimum) decreased on the Nyong at Olama after the rupture of the average discharges. In the Nyong at Mbalmayo, the maximums were stable after the rupture, while the minimum decreased. The maximum and minimum discharges of the Mefou, for their part, have increased significantly. Maximum discharge stability in the Nyong and the increase in extreme flows (maximum and minimum) on the Mefou in the context of precipitation decrease seem to result from changes in land use patterns, mainly marked by an increase in runoff caused by changes in land use/land cover especially urbanization, bare soil and cultivated areas, and a decrease in forest cover and water bodies. Seasonally, the precipitation of the dry seasons has a considerable impact on the flows of the rainy seasons, which follow them on the large basins (Olama and Mbalmayo). However, on the Mefou (a small catchment), precipitation influences the flows of the seasons during which they occur. Tramblay et al. [66] have shown on the Mono river in Togo that using a soil moisture accounting model (SMA) could improve the river modelling, by considering the changes in soil moisture due to land use/land cover changes. This is a path to follow for further studies in the region.
Author Contributions
Conceptualization: V.B.E., J.J.B., B.N.N. and G.M.; methodology: V.B.E., J.J.B. and G.M.; software: V.B.E. and B.N.N.; validation: J.J.B., G.M.; formal analysis: V.B.E. and G.M.; investigation: V.B.E.; data curation: V.B.E.; writing—original draft preparation: V.B.E. and G.M.; writing—review and editing: V.B.E., G.M., E.N., J.R.; project administration: J.J.B.; funding acquisition: J.J.B. All authors have read and agreed to the published version of the manuscript.
Funding
This research received no external funding.
Acknowledgments
The authors wish to thank the Cameroonian authorities and national services of Meteorology and Hydrology, for providing data to the Joint International Laboratory (LMI) DYCOFAC. The authors also thank the National Observing System M-TROPICS (Multiscale TROPIcal CatchmentS) from France, which subsidizes observations in experimental tropical watersheds. The authors warmly thank the agents of the IRD (Research Institute for Developing Countries) representation in Cameroon, and the direction of the LMI DYCOFAC, at Yaoundé, for their administrative and financial support.
Conflicts of Interest
The authors declare no conflict of interest.
References
- Aulenbach, B.T.; Landers, M.N.; Musser, J.W.; Painter, J.A. Effects of impervious area and BMP implementation and design on storm runoff and water quality on eight small watersheds. JAWRA J. Am. Water Resour. Assoc. 2017, 53, 382–399. [Google Scholar] [CrossRef]
- Diem, J.E.; Hill, T.C.; Milligan, R.A. Diverse multi-decadal changes in streamflow within a rapidly urbanizing region. J. Hydrol. 2018, 556, 61–71. [Google Scholar] [CrossRef]
- Oudin, L.; Salavati, B.; Furusho-Percot, C.; Ribstein, P.; Saadi, M. Hydrological impacts of urbanization at the catchment Scale. J. Hydrol. 2018, 559, 774–786. [Google Scholar] [CrossRef] [Green Version]
- Ebodé, V.B.; Mahé, G.; Amoussou, E. Changement climatique dans le bassin versant de l′Ogooué: Évolution récente et impact sur les écoulements. Proc. Int. Assoc. Hydrol. Sci. 2021, 384, 247–253. [Google Scholar] [CrossRef]
- Larbi, I.; Hountondjic, F.C.; Dotse, S.Q.; Mama, D.; Nyamekyee, C.; Adeyerif, O.E.; Koubodanab, H.D.; Odoomi, P.R.; Asarej, Y.M. Local climate change projections and impact on the surface hydrology in the Vea catchment, West Africa. Hydrol. Res. 2021, 52, 6. [Google Scholar] [CrossRef]
- Gibson, C.A.; Meyer, J.L.; Poff, L.E.; Georgakakos, A. Flow regime alterations under changing climate in two river basins: Implications for freshwater ecosystems. River Res. Appl. 2005, 21, 849–864. [Google Scholar] [CrossRef]
- Salavati, B. Impact de l′Urbanisation sur la Réponse Hydrologique des Bassins Versants Urbains. Ph.D. Thesis, Université Pierre et Marie Curie, Paris, France, 2015. [Google Scholar]
- Hadour, A.; Meddi, M.; Mahé, G. Effects of Climate Change and Human Action on the Decrease of Sediment Discharge to the Coast: An Example of the Largest Wadi in the Maghreb. Int. J. Sediment Res. 2021, 36, 268–278. [Google Scholar] [CrossRef]
- Mzava, P.; Valimbab, P.; Nobertb, J. Quantitative analysis of the impacts of climate and land-cover changes on urban flood runoffs: A case of Dar es Salaam, Tanzania. J. Water Clim. Change 2021, 12, 2835–2853. [Google Scholar] [CrossRef]
- Tian, J.; Guo, S.; Yin, J.; Pan, Z.; Xiong, F.; He, S. Quantifying both climate and land use/cover changes on runoff variation in Han River basin. China Front. Earth Sci. 2022. [Google Scholar] [CrossRef]
- Onyutha, C.; Nyesigire, R.; Nakagiri, A. Contributions of Human Activities and Climatic Variability to Changes in River Rwizi Flows in Uganda, East Africa. Hydrology 2021, 8, 145. [Google Scholar] [CrossRef]
- Yang, G.; Zhang, M.; Xie, Z.; Li, J.; Ma, M.; Lai, P.; Wang, J. Quantifying the Contributions of Climate Change and Human Activities toWater Volume in Lake Qinghai, China. Remote Sens. 2022, 14, 99. [Google Scholar] [CrossRef]
- Idrissou, M.; Diekkrüger, B.; Tischbein, B.; Op de Hipt, F.; Näschen, K.; Poméon, T.; Yira, Y.; Ibrahim, B. Modeling the Impact of Climate and Land Use/Land Cover Change onWater Availability in an Inland Valley Catchment in Burkina Faso. Hydrology 2022, 9, 12. [Google Scholar] [CrossRef]
- Yira, Y.; Diekkrüger, B.; Steup, G.; Aymar, Y.B. Impact of climate change on hydrological conditions in a tropical West African catchment using an ensemble of climate simulations. Hydrol. Earth Syst. Sci. 2017, 21, 2143–2161. [Google Scholar] [CrossRef] [Green Version]
- Namugize, J.N.; Jewitt, J.; Graham, M. Effects of land use and land cover changes on water quality in the Umngeni river catchment, South Africa. Phys. Chem. Earth Parts A/B/C 2018, 105, 247–264. [Google Scholar] [CrossRef]
- Nonki, R.M.; Lenouo, A.; Lennard, C.J.; Tchawoua, C. Assessing climate change impacts on water resources in the Benue River Basin, Northern Cameroon. Environ. Earth Sci. 2019, 78, 606. [Google Scholar] [CrossRef]
- Gorgoglione, A.; Gregorio, J.; Rios, A.; Alonso, J.; Chreties, C.; Fossati, M. Influence of land use/land cover on surface-water quality of Santa Lucìa river, Uruguay. Sustainability 2020, 12, 4692. [Google Scholar] [CrossRef]
- Getahun, Y.S.; Li, M.H.; Chen, P.Y. Assessing impact of climate change on hydrology of Melka Kuntrie Subbasin, Ethiopia with Ar4 and Ar5 projections. Water 2020, 12, 1308. [Google Scholar] [CrossRef]
- L’Hôte, Y.; Mahé, G.; Somé, B. The 1990s rainfall in the Sahel: The third driest decade since the beginning of the century. Reply to discussion. Hydrol. Sci. J. 2003, 48, 493–496. [Google Scholar] [CrossRef] [Green Version]
- Sarr, M.A.; Zoromé, M.; Seidou, O.; Bryant, C.R.; Gachon, P. Recent trends in selected extreme precipitation indices in Senegal—A changepoint approach. J. Hydrol. 2013, 505, 326–334. [Google Scholar] [CrossRef]
- Cisse, M.T.; Sambou, S.; Dieme, Y.; Diatta, C.; Bop, M. Analyse des écoulements dans le bassin du fleuve Sénégal de 1960 à 2008. Revue Sci. Eau 2014, 27, 167–187. [Google Scholar] [CrossRef] [Green Version]
- Nka, N.B.; Oudin, L.; Karambiri, H.; Paturel, J.E.; Ribstein, P. Trends in floods in West Africa: Analysis based on 11 catchments in the region. Hydrol. Earth Syst. Sci. 2015, 19, 4707–4719. [Google Scholar] [CrossRef] [Green Version]
- Bodian, A.; Diop, L.; Panthou, G.; Dacosta, H.; Deme, A.; Dezetter, A.; Ndiaye, P.M.; Diouf, I.; Vischel, T. Recent Trend in Hydroclimatic Conditions in the Senegal River Basin. Water 2020, 12, 436. [Google Scholar] [CrossRef] [Green Version]
- Buisson, A. La grande saison sèche 1985 au Gabon. Situation climatique en Afrique intertropicale. Météorologie 1985, 15, 5–13. [Google Scholar]
- Kpoumié, A.; Ngouh, A.N.; Mfonka, Z.; Nsangou, D.; Bustillo, V.; Ndam, N.J.; Ekodeck, G.E. Spatio-temporal assessing rainfall and dam impacts on surface runoff in the Sanaga river basin (transition tropical zone in central part of Cameroon). Sustain. Water Resour. Manag. 2022, 8, 26. [Google Scholar] [CrossRef]
- Liénou, G.; Mahé, G.; Paturel, J.E.; Servat, E.; Sighomnou, D.; Ekodeck, G.E.; Dezetter, A.; Dieulin, C. Evolution des régimes hydrologiques en région équatoriale camerounaise: Un impact de la variabilité climatique en zone équatoriale? Hydrol. Sci. J. 2008, 53, 789–801. [Google Scholar] [CrossRef]
- Kouassi, A. Caractérisation d’une Modification Eventuelle de la Relation Pluie-Débit et ses Impacts Sur Les Ressources en eau en Afrique de l’Ouest: Cas du Bassin Versant du N’zi (Bandama) en Côte d’Ivoire. Ph.D. Thesis, Université de Cocody, Abidjan, Côte d’Ivoire, 2007. [Google Scholar]
- Ebodé, V.B.; Mahé, G.; Dzana, J.G.; Amougou, J.A. Anthropization and Climate Change: Impact on the Discharges of Forest Watersheds in Central Africa. Water 2020, 12, 2718. [Google Scholar] [CrossRef]
- Ewane, E.B.; Lee, H.H. Assessing land use/land cover change impacts on the hydrology of Nyong River Basin, Cameroon. J. Mt. Sci. 2020, 17, 50–67. [Google Scholar] [CrossRef]
- BUCREP. Rapport de Présentation des Résultats Définitifs du Recensement de la Population en 2005; BUCREP: Yaoundé, Cameroon, 2011. [Google Scholar]
- Nkiaka, E.; Nawaz, N.R.; Lovett, J.C. Using self-organizing maps to infill missing data in hydro-meteorological time series from the Logone catchment, Lake Chad basin. Environ. Monit. Assess. 2016, 188, 400. [Google Scholar] [CrossRef] [Green Version]
- Olivry, J.C. Fleuves et Rivieres du Cameroun; MESIRES-ORSTOM: Paris, France, 1986. [Google Scholar]
- Letouzey, R. Notice de la Carte Phytogéographique du Cameroun au 1/500000; Institut de la Carte Internationale de la Végétation: Toulouse, France, 1985. [Google Scholar]
- Bush, E.R.; Jeffery, K.; Bunnefeld, N.; Tutin, C.; Musgrave, R.; Moussavou, G.; Mihindou, V.; Malhi, Y.; Lehmann, D.; Edzang, N.J.; et al. Rare ground data confirm significant warming and drying in western equatorial Africa. PeerJ 2020, 8, e8732. [Google Scholar] [CrossRef] [Green Version]
- Pettitt, A.N. A non-parametric approach to the change-point problem. Appl. Stat. 1979, 28, 126–135. [Google Scholar] [CrossRef]
- Mann, H.B. Nonparametric tests against trend. Econometrica 1945, 13, 245–259. [Google Scholar] [CrossRef]
- Kendall, M.G. Rank Correlation Methods; Griffin: London, UK, 1975. [Google Scholar]
- Yue, S.; Pilon, P.; Cavadias, G. Power of the Man–Kendall and Spearman’s rho tests for detecting monotonic trends in hydrological series. J. Hyrdol. 2002, 259, 254–271. [Google Scholar] [CrossRef]
- Richter, B.D.; Baumgartner, J.V.; Braun, D.P.; Powell, J. A spatial assessment of hydrologic alteration within river network. Regul. Rivers Res. Manag. 1998, 39, 329–340. [Google Scholar] [CrossRef]
- Bogning, S.; Frappart, F.; Paris, A.; Blarel, F.; Ninõ, F.; Picart, S.S.; Lanet, P.; Seyler, F.; Mahé, G.; Onguene, R.; et al. Hydro-climatology study of the Ogooué River basin using hydrological modeling and satellite altimetry. Adv. Space Res. 2020, 68, 672–690. [Google Scholar] [CrossRef]
- Conway, D.P.; Persechino, A.; Ardoin–Bardin, S.; Hamandawana, H.; Dieulin, C.; Mahé, G. Rainfall and river flow variability in sub-saharan Africa during the 20th century. J. Hydrom. 2009, 10, 41–59. [Google Scholar] [CrossRef]
- Wang, F.; Shao, W.; Yu, H.; Kan, G.; He, X.; Zhang, D.; Ren, M.; Wang, G. Re-evaluation of the Power of the Mann-Kendall Test for Detecting Monotonic Trends in Hydrometeorological Time Series. Front. Earth Sci. 2020, 8, 14. [Google Scholar] [CrossRef]
- Totaro, V.; Gioia, A.; Iacobellis, V. Numerical investigation on the power of parametric and nonparametric tests for trend detection in annual maximum series. Hydrol. Earth Syst. Sci. 2020, 24, 473–488. [Google Scholar] [CrossRef] [Green Version]
- Njogi, B.A. Modélisation du Fonctionnement Hydrologique et Incidences des Activités Anthropiques sur la Dynamique Spatio-temporelle du Bassin Versant de la Mefou (Cameroun); Mémoire de Master, Université de Liège: Liège, Belgique, 2019. [Google Scholar]
- Ebodé, V.B.; Mahé, G.; Amoussou., E. Impact de la variabilité climatique et de l′anthropisation sur les écoulements de la Bénoué (nord Cameroun). Proc. Int. Assoc. Hydrol. Sci. 2021, 384, 261–267. [Google Scholar] [CrossRef]
- Ewane, E.B. Assessing land use and landscape factors as determinants of water quality trends in Nyong River basin, Cameroon. Environ. Monit. Assess. 2020, 192, 507. [Google Scholar] [CrossRef] [PubMed]
- Tadoum, M.; Tchamba, M.; Tanougong, A. Spatio-Temporal Dynamic of Land Use in the Dja-Odzala-Minkebe Landscape between Cameroon, Congo and Gabon: Influence on the Evolution of Forest Cover in a Context of Cross-Border Cooperation. Open J. For. 2021, 11, 222–237. [Google Scholar] [CrossRef]
- Kergoat, L.; Hiernaux, P.; Baup, F.; Boulain, N.; Cappelaere, B.; Cohard, J.M.; Descroix, L.; Galle, S.; Guilbert, S.; Guichard, F.; et al. Land surface in AMMA: Extending Ecosystem, Energy and Water Balance Studies in Space and Time is Some-Times Surprising. In Proceedings of the 2nd International Conference of AMMA Program, Karlsruhe, Germany, 26–30 November 2007. [Google Scholar]
- Leblanc, M.; Favreau, G.; Massuel, S.; Tweed, S.; Loireau, M.; Cappelaere, B. Land clearance and hydrological change in the Sahel: South-west Niger. Glob. Planet. Chang. 2008, 61, 49–62. [Google Scholar] [CrossRef]
- Gebrelibanos, T.; Assen, M. Land use/land cover dynamics and their driving forces in the Hirmi watershed and its adjacent agro-ecosystem, highlands of Northern Ethiopia. J. Land Use Sci. 2015, 10, 81–94. [Google Scholar] [CrossRef]
- Belay, T.; Mengistu, D.A. Land use and land cover dynamics and drivers in the Muga watershed, Upper Blue Nile basin, Ethiopia. Remote Sens. Appl. Soc. Environ. 2019, 15, 100249. [Google Scholar] [CrossRef]
- Dzana, J.G.; Amougou, J.A.; Onana, V. Modélisation spatiale des facteurs d′aggravation des écoulements liquides à Yaoundé. Application au bassin versant d′Akë. Mosella 2004, 29, 78–91. [Google Scholar]
- Schueler, T. The importance of imperviousness. Watershed Prot. Tech. 1994, 1, 100–101. [Google Scholar]
- Booth, D.B.; Jackson, C.R. Urbanization of Aquatic Systems: Degradation Thresholds, Stormwater Detection, and the Limits of Mitigation. J. Am. Water Res. Assoc. 1997, 33, 1077–1090. [Google Scholar] [CrossRef]
- Brun, S.E.; Band, L.E. Simulating runoff behavior in an urbanizing watershed. Comp. Environ. Urban Syst. 2000, 24, 5–22. [Google Scholar] [CrossRef]
- Yang, G.X.; Bowling, L.C.; Cherkauer, K.A.; Pijanowski, B.C.; Niyogi, D. Hydroclimatic Response of Watersheds to Urban Intensity: An Observational and Modeling-Based Analysis for the White River Basin, Indiana. J. Hydrometeorol. 2010, 11, 122–138. [Google Scholar] [CrossRef] [Green Version]
- Amogu, O.; Descroix, L.; Yéro, K.S.; Le Breton, É.; Mamadou, I.; Ali, A.; Vischel, T.; Bader, J.-C.; Moussa, I.B.; Gautier, E.; et al. Increasing river flows in Sahel? Water 2010, 2, 170–199. [Google Scholar] [CrossRef] [Green Version]
- Coe, M.T.; Costa, M.H.; Soares-Filho, B.S. The influence of historical and potential future deforestation on the streamflow of the Amazon river—Land surface processes and atmospheric feedbacks. J. Hydrol. 2009, 369, 165–1774. [Google Scholar] [CrossRef]
- Getachew, H.E.; Melesse, A. The impact of land use change on the hydrology of the Angereb watershed. Int. J. Water Sci. 2013, 1, 1–7. [Google Scholar]
- Dias, L.C.; Macedo, M.N.; Costa, M.H.; Coe, M.T.; Neil, C. Effects of land cover change on evapotranspiration and streamflow of small catchments in the Upper Xingu river basin, Central Brazil. J. Hydrol. 2015, 4, 108–122. [Google Scholar] [CrossRef] [Green Version]
- Lee, E.; Livino, A.; Han, S.C.; Zhang, K.; Briscoe, J.; Kelman, J.; Moorcroft, P. Land cover change explains the increasing discharge of the Paraná river. Reg. Environ. Change 2018, 18, 1871–1881. [Google Scholar] [CrossRef] [PubMed] [Green Version]
- Amougou, J.A.; Ndam, N.J.R.; Djocgoue, P.F.; Bessoh, B.S. Variabilité climatique et régime hydrologique dans un milieu bioclimatique de transition: Cas du Zbassin fluvial de la Sanaga. Afr. Sci. 2015, 11, N°5. [Google Scholar]
- Sheeder, S.A.; Ross, J.D.; Carlson, T.N. Dual urban and rural hydrograph signals in three small watersheds. J. Am. Water Res. Assoc. 2002, 38, 1027–1040. [Google Scholar] [CrossRef]
- Walsh, C.J.; Kunapo, J. The importance of upland flow paths in determining urban effects on stream ecosystems. J. N. Am. Benthol. Soc. 2009, 28, 977–990. [Google Scholar] [CrossRef]
- Mpakam, H.G.; Ombolo, A.; Samba, A.P.; Bineli, A.E. The Impact of Climate Variabilities on the Water Resources of Nyong River (Cameroon) during Few Anterior Decades. Int. J. Geosci. 2016, 7, 459–469. [Google Scholar] [CrossRef] [Green Version]
- Tramblay, Y.; Amoussou, E.; Dorigo, W.; Mahé, G. Flood risk under future climate: Linking extreme value models and flood generating precesses. J. Hydrol. 2014, 519, 549–558. [Google Scholar] [CrossRef]
Figure 1.
Location of the studied basins (Nyong at Olama and Mbalmayo, So’o at So’o bridge and Mefou at Nsimalen).
Figure 1.
Location of the studied basins (Nyong at Olama and Mbalmayo, So’o at So’o bridge and Mefou at Nsimalen).

Figure 2.
Patterns in oceanic sea surface temperatures (SSTs) likely to influence weather in the studied region, according to Bush et al. [34].
Figure 2.
Patterns in oceanic sea surface temperatures (SSTs) likely to influence weather in the studied region, according to Bush et al. [34].

Figure 3.
Evolution of precipitations, discharges and runoff coefficients (Ke) of the basins studied at annual and seasonal time steps. The vertical dashed lines indicate the rupture years. The corresponding rates of change appear on their right sides. The ruptures in black are identical to several basins.

Figure 4.
Spatial distribution of mean precipitation in the basins studied at annual and seasonal time steps, between the 1950–1970 and 1980–2010 decades.
Figure 4.
Spatial distribution of mean precipitation in the basins studied at annual and seasonal time steps, between the 1950–1970 and 1980–2010 decades.


Figure 5.
Comparison of evolutions of climatic indices and normalized rainfall anomalies.

Figure 6.
Average annual hydrological cycles of some basins studied Nyong (at Olama and Mbalmayo) and Mefou at Nsimalen before (in black) and after the rupture (break) (in grey).
Figure 6.
Average annual hydrological cycles of some basins studied Nyong (at Olama and Mbalmayo) and Mefou at Nsimalen before (in black) and after the rupture (break) (in grey).

Figure 7.
Spatial distribution of the main land use patterns having links with runoff in the Nyong at Mbalmayo and Mefou basins in 1973, 2000 and 2018. (The runoff areas include buildings, roads, savannas, cultivated areas and young fallows).
Figure 7.
Spatial distribution of the main land use patterns having links with runoff in the Nyong at Mbalmayo and Mefou basins in 1973, 2000 and 2018. (The runoff areas include buildings, roads, savannas, cultivated areas and young fallows).


Table 1.
Statistics of precipitations and average flows (annual and seasonal) of the basins studied over their respective study periods, but also on both sides of the identified ruptures.
Table 1.
Statistics of precipitations and average flows (annual and seasonal) of the basins studied over their respective study periods, but also on both sides of the identified ruptures.
| Periods | Interannual | Years of Rupture | Mean | Cv (%) | |||
|---|---|---|---|---|---|---|---|
| Mean | Cv (%) | Before | After | Before | After | ||
| Precipitation (mm) | |||||||
| Olama | |||||||
| Annual | 1675 | 8 | 1975–76 | 1769 | 1651 | 4 | 8 |
| Spring | 676 | 11 | 1974–75 | 731 | 664 | 9 | 10 |
| Summer | 224 | 21 | - | - | - | - | - |
| Autumn | 677 | 8 | - | - | - | - | - |
| Winter | 98 | 37 | 1975–76 | 124 | 92 | 31 | 36 |
| Mbalmayo | |||||||
| Annual | 1641 | 8 | 1975–76 | 1701 | 1605 | 8 | 9 |
| Spring | 662 | 10 | 1972–73 | 692 | 647 | 13 | 10 |
| Summer | 225 | 24 | 1964–65 | 181 | 237 | 32 | 20 |
| Autumn | 668 | 9 | 1975–76 | 690 | 655 | 8 | 9 |
| Winter | 87 | 41 | 1975–76 | 107 | 74 | 35 | 38 |
| Pont So’o | |||||||
| Annual | 1800 | 9 | - | - | - | - | - |
| Spring | 743 | 10 | - | - | - | - | - |
| Summer | 185 | 27 | - | - | - | - | - |
| Autumn | 724 | 11 | - | - | - | - | - |
| Winter | 148 | 28 | - | - | - | - | - |
| Nsimalen | |||||||
| Annual | 1767 | 8 | 1975–76 | 1857 | 1739 | 6 | 8 |
| Spring | 714 | 11 | - | - | - | - | - |
| Summer | 241 | 51 | 1979–80 | 208 | 267 | 48 | 46 |
| Autumn | 710 | 19 | 1974–74 | 755 | 698 | 21 | 18 |
| Winter | 97 | 55 | 1975–76 | 126 | 87 | 47 | 53 |
| Discharges (m3/s) | |||||||
| Olama | |||||||
| Annual | 204.5 | 21 | 1971–72 | 243 | 197 | 21 | 19 |
| Spring | 142.6 | 29 | 1971–72 | 191 | 133 | 24 | 26 |
| Summer | 158 | 42 | - | - | - | - | - |
| Autumn | 375 | 24 | - | - | - | - | - |
| Winter | 148 | 25 | - | - | - | - | - |
| Mbalmayo | |||||||
| Annual | 139 | 20 | 1973–74 | 151 | 131.6 | 19 | 18 |
| Spring | 88 | 31 | 1973–74 | 105 | 76 | 28 | 27 |
| Summer | 111 | 31 | - | - | - | - | - |
| Autumn | 243 | 23 | - | - | - | - | - |
| Winter | 123 | 20 | - | - | - | - | - |
| Pont So’o | |||||||
| Annual | 34.9 | 31 | - | - | - | - | - |
| Spring | 28.7 | 37 | - | - | - | - | - |
| Summer | 24 | 55 | - | - | - | - | - |
| Autumn | 66.2 | 31 | - | - | - | - | - |
| Winter | 19.2 | 31 | - | - | - | - | - |
| Nsimalen | |||||||
| Annual | 7.5 | 28 | 1985–86 | 5.8 | 9 | 29 | 13 |
| Spring | 8.1 | 32 | 1985–86 | 5.7 | 9.6 | 21 | 18 |
| Summer | 6 | 42 | 1985–86 | 4.3 | 7 | 63 | 23 |
| Autumn | 11 | 24 | 1985–86 | 9.7 | 12.4 | 27 | 16 |
| Winter | 5 | 26 | 1985–86 | 4 | 5.6 | 26 | 18 |
Table 2.
Results of annual and seasonal rainfall, discharges and runoff coefficient analysis using Mann–Kendall’s test. The “+” and “−” signs indicate positive and negative trends, respectively. Calculated p-values below the significance level (α = 0.05) indicate that there is a significant trend in the series. Values in bold indicate significant trends.
| Variables | Annual | Spring | Summer | Autumn | Winter | |||||
|---|---|---|---|---|---|---|---|---|---|---|
| p-Value | Evolution | p-Value | Evolution | p-Value | Evolution | p-Value | Evolution | p-Value | Evolution | |
| Olama | ||||||||||
| Rainfall | 0.1698 | − | 0.351 | − | 0.2155 | − | 0.633 | − | 0.7998 | − |
| Discharges | 0.05106 | − | 0.009002 | − | 0.5657 | − | 0.06542 | − | 0.7125 | − |
| Ke | 0.7044 | − | 0.006281 | − | 0.4878 | − | 0.0703 | − | 0.9914 | − |
| Mbalmayo | ||||||||||
| Rainfall | 0.03547 | − | 0.03877 | − | 0.32 | − | 0.08 | − | 0.147 | − |
| Discharges | 0.3782 | − | 0.008722 | − | 0.4246 | − | 0.8688 | − | 0.8418 | − |
| Ke | 0.6645 | + | 0.01127 | − | 0.1909 | − | 0.4488 | + | 0.3018 | − |
| Nsimalen | ||||||||||
| Rainfall | 0.06932 | − | 0.2008 | − | 0.191 | + | 0.2891 | − | 0.882 | − |
| Discharges | 0.001171 | + | 0.000278 | + | 0.004695 | + | 0.258117 | + | 0.1514 | + |
| Ke | 0.000015 | + | 0.000336 | + | 0.001934 | + | 0.06517 | + | 0.000413 | + |
| So’o | ||||||||||
| Rainfall | 0.1235 | − | 0.02006 | − | 0.2639 | − | 0.6077 | − | 0.6946 | − |
| Discharges | 0.06909 | − | 0.3301 | − | 0.005244 | − | 0.1192 | − | 0.2691 | − |
| Ke | 0.381 | − | 0.1834 | − | 0.23 | − | 0.3468 | − | 0.9225 | − |
Table 3.
Deviations (%) of the decadal, annual and seasonal averages of precipitation, discharges and runoff coefficients compared to their interannual means in the basins studied.
Table 3.
Deviations (%) of the decadal, annual and seasonal averages of precipitation, discharges and runoff coefficients compared to their interannual means in the basins studied.
| Variables | Decades | Olama | Mbalmayo | Pont So’o | Nsimalen | ||||||||||||||||
|---|---|---|---|---|---|---|---|---|---|---|---|---|---|---|---|---|---|---|---|---|---|
| Annual | Spring | Summer | Autumn | Winter | Annual | Spring | Summer | Autumn | Winter | Annual | Spring | Summer | Autumn | Winter | Annual | Spring | Summer | Autumn | Winter | ||
| Precipitation | 1950 | - | - | - | - | - | 2.5 | 7.3 | −21.5 | 4 | 14.1 | - | - | - | - | - | - | - | - | - | - |
| 1960 | 6.5 | 9.2 | 3.1 | 3.6 | 16.5 | 3.8 | 2.5 | −2.2 | 4 | 27.3 | - | - | - | - | - | 8 | 4.8 | −5 | 10.5 | 38.4 | |
| 1970 | 1.1 | 1.4 | −3.7 | 0.4 | 15.9 | 0.9 | 0.1 | 2.8 | −0.2 | 8.9 | - | - | - | - | - | −3 | 3.5 | −24.7 | −7.7 | 20.8 | |
| 1980 | −2 | −3.2 | 7 | −1.1 | −19.3 | −2.7 | −3.9 | 11.8 | −3.4 | −27.0 | - | - | - | - | - | 4.7 | 2.9 | 30.2 | 4.7 | −30.6 | |
| 1990 | −2.3 | −5.4 | 5.8 | −0.5 | −11.3 | −2.7 | −6.5 | 11.4 | −1.6 | −19.4 | - | - | - | - | - | −9.7 | −19.4 | 19.3 | −5.6 | −19.5 | |
| 2000 | 2.4 | 1.9 | −2.5 | 3.6 | 10.1 | 1 | 0.1 | 2 | 1.2 | 1.9 | 3.5 | 1.5 | 1.2 | 5.6 | 6.7 | 5.7 | 8.4 | 18.1 | 0.4 | −1.2 | |
| 2010 | −2.7 | 1.1 | −9 | −4.1 | −2.9 | −3.0 | 0.4 | −6 | −4.8 | −9.1 | −4 | −1.7 | −1.3 | −6.3 | −7.3 | −12.6 | −11.2 | −15.1 | −9 | −41.2 | |
| Discharges | 1950 | - | - | - | - | - | −5 | 9 | −0.5 | −14.4 | −4.3 | - | - | - | - | - | |||||
| 1960 | 15.1 | 37.9 | 34.2 | 3.3 | 16.1 | 17.6 | 25.9 | 20.4 | 12.7 | 15.9 | - | - | - | - | - | −18.7 | −29.8 | −35.7 | −10.4 | −11.7 | |
| 1970 | −1.7 | 3.8 | −18.2 | 2.5 | −9.9 | −4.2 | −1 | −14.2 | 0.5 | −12.1 | - | - | - | - | - | −30.4 | −33.5 | −38.8 | −18.2 | −29.3 | |
| 1980 | 5.6 | 0.4 | 3.5 | 10.7 | 6.2 | 1.5 | −4.5 | −9.3 | 8.4 | −1.5 | - | - | - | - | - | 26.7 | 9.3 | 48.3 | 28.2 | 24.5 | |
| 1990 | - | - | - | - | - | - | - | - | - | - | - | - | - | - | - | - | - | - | - | - | |
| 2000 | −5.3 | −8.6 | 3.7 | −5.5 | −12.3 | −7.4 | −15.6 | −1 | −4.4 | −10.9 | 9.8 | 25.1 | 20.3 | 7.6 | 5.6 | 23.6 | 28.5 | 24.8 | 12.4 | 17.3 | |
| 2010 | −8.4 | −14.6 | −14.9 | −11.3 | 3.3 | −2.8 | −12.3 | −2.1 | −5.6 | 9.8 | −12.2 | −4.3 | −25.9 | −9.3 | −6.9 | 14.8 | 21.8 | 7.2 | 9.7 | 0.3 | |
| Ke | 1950 | - | - | - | - | - | −9.9 | 8.3 | 46.1 | −31.2 | −13.0 | - | - | - | - | - | - | - | - | - | - |
| 1960 | −15.5 | 28.3 | 20.2 | −8.6 | −27.9 | 7.2 | 24 | 12.7 | 5.2 | 6 | - | - | - | - | - | −55.7 | −29.4 | −40.8 | −18.2 | −61.8 | |
| 1970 | −17.8 | 2.1 | −11.2 | 7.7 | −28.4 | −7.2 | −3.2 | −18.8 | 16.5 | −11.2 | - | - | - | - | - | −65.4 | −35.7 | −7 | −1 | −76.9 | |
| 1980 | 83 | 6.3 | −15.6 | 24.2 | 119.2 | 14 | 6.9 | −32.3 | 32.3 | 17 | - | - | - | - | - | −2.1 | −10.2 | −25.6 | 0.3 | −0.2 | |
| 1990 | - | - | - | - | - | - | - | - | - | - | - | - | - | - | - | - | - | - | - | - | |
| 2000 | −28.3 | −9.9 | 3.7 | −16 | −38.3 | −13.8 | −16.1 | −11.2 | −10.5 | −13.9 | 4.3 | 12.2 | 11.5 | 2.1 | 0.1 | −4.4 | 24.6 | 17.3 | 6.8 | −8.9 | |
| 2010 | −14.9 | −14 | 7.2 | −12.9 | −18.9 | 9.9 | −14.0 | 7.6 | −8.4 | 18 | −5.2 | −15.2 | −14.2 | −2.4 | −0.2 | 137.2 | 43.7 | 41.2 | 10.7 | 161.2 | |
Table 4.
Correlation between rainfall indices and climatic indices at annual and seasonal time steps. Significant correlations are in bold.
Table 4.
Correlation between rainfall indices and climatic indices at annual and seasonal time steps. Significant correlations are in bold.
| Indices | Annual | Spring | Summer | Autumn | Winter |
|---|---|---|---|---|---|
| DMI | −0.23 | −0.09 | 0.09 | −0.23 | −0.02 |
| MEI | −0.03 | −0.11 | −0.16 | −0.1 | 0.11 |
| NAO | −0.04 | 0.05 | 0.2 | −0.02 | −0.24 |
| NATL | −0.17 | −0.56 | −0.09 | −0.11 | 0.53 |
| SATL | 0 | −0.08 | 0.14 | −0.12 | 0.36 |
| SOI | 0.21 | −0.04 | 0.1 | 0.16 | 0.55 |
Table 5.
Frequency of years having the same/opposite signs of ocean indices and rainfall anomalies. NY: number of years; NYOS: number of years with opposite signs; NYSS: number of years with same signs.
Table 5.
Frequency of years having the same/opposite signs of ocean indices and rainfall anomalies. NY: number of years; NYOS: number of years with opposite signs; NYSS: number of years with same signs.
| NATL&Rainfall (Spring) | NATL&Rainfall (Winter) | SOI&Rainfall (Winter) | ||||||
|---|---|---|---|---|---|---|---|---|
| NY | NYOS | % | NY | NYSS | % | NY | NYSS | % |
| 35 | 26 | 74 | 35 | 24 | 69 | 68 | 38 | 56 |
Table 6.
Statistics relating to the maximum and minimum flows of some studied basins (Nyong in Olama and Mbalmayo, and Mefou in Nsimalen) before and after the rupture identified in their respective series.
Table 6.
Statistics relating to the maximum and minimum flows of some studied basins (Nyong in Olama and Mbalmayo, and Mefou in Nsimalen) before and after the rupture identified in their respective series.
| IHA Statistics | Means (m3/s) | Cv (%) | Change | |||
|---|---|---|---|---|---|---|
| Before Rupture | After Rupture | Before Rupture | After Rupture | m3/s | % | |
| Olama | ||||||
| Minimum flows | ||||||
| 1-day minimum | 47.1 | 37.9 | 65.9 | 141.6 | −9.2 | −19.6 |
| 3-day minimum | 52.5 | 38.6 | 52.3 | 140.7 | −13.9 | −26.5 |
| 7-day minimum | 57.3 | 40.1 | 51.9 | 136.4 | −17.2 | −29.9 |
| 30-day minimum | 69 | 47.6 | 46.9 | 113.6 | −21.4 | −31 |
| 90-day minimum | 101.3 | 70.4 | 33.2 | 72.9 | −30.9 | −30.5 |
| Maximum flows | ||||||
| 1-day maximum | 622.1 | 571.2 | 22.2 | 22.8 | −50.9 | −8.2 |
| 3-day maximum | 618.1 | 565.9 | 22.8 | 23.1 | −52.2 | −8.4 |
| 7-day maximum | 609 | 557 | 23.6 | 23.1 | −52 | −8.5 |
| 30-day maximum | 543.7 | 504.4 | 24.5 | 23.4 | −39.3 | −7.2 |
| 90-day maximum | 424.4 | 385.5 | 22.8 | 22.9 | −38.9 | −9.2 |
| Average Julian dates | ||||||
| of minimum | 62 | 67 | ||||
| of maximum | 310 | 307 | ||||
| Mbalmayo | ||||||
| Minimum flows | ||||||
| 1-day minimum | 25.5 | 17.9 | 0.30 | 0.41 | −7.6 | −29.7 |
| 3-day minimum | 26.2 | 18.2 | 0.30 | 0.41 | −8 | −30.6 |
| 7-day minimum | 27.8 | 19.4 | 0.30 | 0.38 | −8.4 | −30.5 |
| 30-day minimum | 41.5 | 26.5 | 0.28 | 0.36 | −15 | −36.3 |
| 90-day minimum | 82.9 | 58.6 | 0.31 | 0.29 | −24.4 | −29.4 |
| Maximum flows | ||||||
| 1-day maximum | 366.9 | 366.6 | 0.26 | 0.23 | −0.3 | −0.08 |
| 3-day maximum | 363.6 | 365.6 | 0.26 | 0.23 | 2 | 0.6 |
| 7-day maximum | 361.2 | 362.5 | 0.26 | 0.23 | 1.3 | 0.4 |
| 30-day maximum | 340.8 | 338.2 | 0.26 | 0.25 | −2.6 | −0.8 |
| 90-day maximum | 274 | 271.7 | 0.25 | 0.25 | −2.3 | −0.8 |
| Average Julian dates | ||||||
| of minimum | 61 | 67 | ||||
| of maximum | 318 | 309 | ||||
| Nsimalen | ||||||
| Minimum flows | ||||||
| 1-day minimum | 1.5 | 2.6 | 0.33 | 0.34 | +1.1 | +73.3 |
| 3-day minimum | 1.6 | 2.9 | 0.27 | 0.31 | +1.3 | +81.2 |
| 7-day minimum | 1.7 | 3.1 | 0.25 | 0.29 | +1.4 | +82.3 |
| 30-day minimum | 2.3 | 3.9 | 0.27 | 0.28 | +1.6 | +69.5 |
| 90-day minimum | 3.5 | 5.5 | 0.27 | 0.22 | +2 | +57.1 |
| Maximum flows | ||||||
| 1-day maximum | 16.4 | 23.1 | 0.31 | 0.19 | +6.7 | +40.8 |
| 3-day maximum | 15.3 | 20.3 | 0.31 | 0.13 | +5 | +32.6 |
| 7-day maximum | 14.1 | 18.5 | 0.32 | 0.12 | +4.4 | +31.2 |
| 30-day maximum | 11.7 | 15.8 | 0.35 | 0.14 | +4.1 | +35 |
| 90-day maximum | 8.8 | 12.9 | 0.34 | 0.19 | +4.1 | +46.5 |
| Average Julian dates | ||||||
| of minimum | 88 | 71 | ||||
| of maximum | 302 | 180 | ||||
Table 7.
Evolution of the land use patterns having links with runoff in the Nyong at Mbalmayo and Mefou basins between the years 1973 and 2018.
Table 7.
Evolution of the land use patterns having links with runoff in the Nyong at Mbalmayo and Mefou basins between the years 1973 and 2018.
| Land Use Modes | Area Occupied in the Basin (km2) | Evolution between 1973 and 2018 | |||
|---|---|---|---|---|---|
| 1973 | 2000 | 2018 | km2 | % | |
| Nyong at Mbalmayo | |||||
| Built and road | 77.6 | 177 | 250.5 | +172.9 | +222.8 |
| Bare soil, cultivated area, savannah and young fallow land | 272.1 | 658.7 | 1405 | +1132.9 | +416.3 |
| Water | 143.9 | 11 | 8.6 | −135.3 | −1573.2 |
| Secondary forest and old fallow land | 1671.2 | 3062 | 4391 | +2719.8 | +162.7 |
| Undegraded and slightly degraded forest | 10340.2 | 8917 | 7100.9 | −3239.3 | −31.3 |
| Swampy forest | 1833 | 1510 | 1182 | −651 | −35.5 |
| Mefou at Nsimalen | |||||
| Built and road | 21.6 | 117.6 | 167.8 | +146.2 | +676.9 |
| Bare soil, cultivated area, savannah and young fallow land | 24.5 | 37.8 | 98.1 | +73.6 | +300.4 |
| Water | 1.1 | 1 | 0.9 | −0.2 | −22.2 |
| Secondary forest and old fallow land | 168.8 | 116.8 | 86.2 | −82.6 | −48.9 |
| Undegraded and slightly degraded forest | 150.4 | 130,4 | 61.7 | −88.7 | −59 |
| Swampy forest | 61.6 | 24.6 | 13.3 | −48.3 | −363.1 |
Publisher’s Note: MDPI stays neutral with regard to jurisdictional claims in published maps and institutional affiliations. |
© 2022 by the authors. Licensee MDPI, Basel, Switzerland. This article is an open access article distributed under the terms and conditions of the Creative Commons Attribution (CC BY) license (https://creativecommons.org/licenses/by/4.0/).
Share and Cite
MDPI and ACS Style
Ebodé, V.B.; Braun, J.J.; Nnomo, B.N.; Mahé, G.; Nkiaka, E.; Riotte, J. Impact of Rainfall Variability and Land Use Change on River Discharge in South Cameroon. Water 2022, 14, 941. https://doi.org/10.3390/w14060941
AMA Style
Ebodé VB, Braun JJ, Nnomo BN, Mahé G, Nkiaka E, Riotte J. Impact of Rainfall Variability and Land Use Change on River Discharge in South Cameroon. Water. 2022; 14(6):941. https://doi.org/10.3390/w14060941
Chicago/Turabian StyleEbodé, Valentin Brice, Jean Jacques Braun, Bernadette Nka Nnomo, Gil Mahé, Elias Nkiaka, and Jean Riotte. 2022. "Impact of Rainfall Variability and Land Use Change on River Discharge in South Cameroon" Water 14, no. 6: 941. https://doi.org/10.3390/w14060941
Note that from the first issue of 2016, this journal uses article numbers instead of page numbers. See further details here.