Article

Optimization of the Anaerobic-Anoxic-Oxic Process by Integrating ASM2d with Pareto Analysis of Variance and Response Surface Methodology

1
State Key Laboratory of Pollution Control and Resource Reuse, Tongji University, Shanghai 200092, China
2
Sino-German College of Applied Sciences, Tongji University, Shanghai 201804, China
*
Authors to whom correspondence should be addressed.
Water 2022, 14(6), 940; https://doi.org/10.3390/w14060940
Submission received: 8 February 2022 / Revised: 1 March 2022 / Accepted: 16 March 2022 / Published: 17 March 2022

Abstract

:
Wastewater treatment plants (WWTPs) are high-energy-consuming units. Reasonable operation strategies can enable WWTPs to meet discharge standards while reducing the operating cost. In this study, the activated sludge model 2d (ASM2d), Pareto analysis of variance (ANOVA), and response surface methodology (RSM) were jointly used to simulate and optimize the operation of a lab-scale anaerobic-anoxic-oxic (AAO) reactor. The optimization objective was to determine the optimal design and operational parameters (DOPs) that could enhance both pollutant removal and energy saving. The DOPs that had significant influence on the optimization objective, such as sludge retention time (SRT), dissolved oxygen (DO), and the ratio of biodegradable chemical oxygen demand to total nitrogen (BCOD/TN), were identified by Pareto ANOVA. The optimal DOPs with SRT of 15 days, DO concentration of 0.5 mg/L, and BCOD/TN of 5.21 were determined by RSM. Under the optimal conditions, the removal efficiencies of NH4+-N, total nitrogen (TN), and total phosphorus (TP) were 96.2%, 76.8%, and 92.8%, respectively, and the annual operating cost was $26.4. Furthermore, this combination of DOPs was validated using a pilot-scale AAO system. The TN and TP removal efficiencies were improved by 11.0% and 5.0%, respectively, and the annual operating cost could be reduced by 15.0%. Overall, this study confirmed that the method integrating ASM2d with Pareto ANOVA and RSM was effective in optimizing wastewater treatment processes.

1. Introduction

In recent years, water environment protection has received increasing attention in China. Many wastewater treatment plants (WWTPs) need to upgrade their treatment processes or configurations to meet stricter wastewater discharge standards [1]. Wastewater treatment is an energy-intensive industry, and energy-saving technologies can enable WWTPs to meet strict discharge standards while reducing the operating cost. For example, the aeration energy consumption of a biological treatment unit accounts for 30.0–70.0% of the total energy consumption of the WWTPs [2]. Sean et al. [3] found that every 1.0 mg/L decrease of dissolved oxygen (DO) concentration in the aeration tank could reduce the energy consumption by 5.0–7.0% with the effluent still meeting the wastewater discharge standards.
However, the activated sludge system is complex and uncertain. It has the characteristics of nonlinear dynamics, multi-time scale in the internal processes as well as a multivariable structure [4]. Optimizing the design and operational parameters (DOPs) is time-consuming and labor-intensive. In the past few decades, many advanced mathematical models of the activated sludge process have been developed to evaluate and predict the treatment performance of various WWTPs, such as the artificial neural network model [5,6], the Neuro-Fuzzy model based on the statistical method [7], and activated sludge models (ASMs) based on biokinetics [8]. These models are effective tools for simulating the complex biochemical wastewater treatment processes. They can economically and effectively guide the operation of the biological treatment processes to achieve an excellent treatment effect and reduce energy consumption. A series of ASMs (ASM1, ASM2, ASM2d, ASM3) developed by the International Water Association (IWA) has been used to simulate complex activated sludge processes and predict biological treatment efficiency under dynamic conditions. Wu et al. [9] used the ASM3 to simulate and optimize the operation of a coking WWTP, reducing the operating cost from 7.2 $/m3 to 6.4 $/m3. Many factors, including DO concentration [10], the ratio of carbon to nitrogen [11,12], the volume ratio of the anoxic tank to the aerobic tank (Vanx/Vaer ratio) [13], the sludge retention time (SRT), and the hydraulic retention time (HRT) [14], can significantly affect the removal efficiencies of pollutants in biological treatment systems. Therefore, it is a multi-factor and multi-objective optimization task to adjust multiple parameters to achieve effluent quality compliance and energy saving at the same time. Xie et al. [15] combined the ASM2d, support vector regression and accelerated genetic algorithm to simulate and optimize the operation of a Carrousel oxidation ditch. The results showed that better effluent quality was achieved by reducing the total HRT, SRT and internal recirculation ratio (IRR) while extending the aerobic HRT. Cao et al. [16] combined the GPS-X and response surface methodology (RSM) for determining the optimal DOPs to improve the total nitrogen (TN) removal efficiency; by optimizing DO concentration and SRT; the removal efficiencies of NH4+-N and TN were increased to 97.1% and 85.3%, respectively. RSM is an experimental design method that can be used to analyze the relationships between explanatory variables and one or more responses. While reducing the number of experiments, RSM can help researchers build models to evaluate the effects of multiple factors, thus achieving optimal conditions for ideal responses [17]. However, selection of the parameter sets used for optimization is a key step in RSM. Analysis of variance (ANOVA) is a commonly used statistical method, which can identify important sources of uncertainty and quantify the individual and interactive effects of factors [18]. Pareto ANOVA based on the Pareto principle is a simplified ANOVA method [19], which can quickly and easily screen out important DOPs for the subsequent optimization step using RSM. Although RSM has already been used to optimize contaminant removal and resource recovery in wastewater treatment processes [20,21,22], Pareto ANOVA and RSM have not been coupled with ASMs to optimize wastewater treatment processes.
In this study, the combination of Pareto ANOVA and RSM for multi-objective optimization was applied to optimize the lab-scale anaerobic-anoxic-oxic (AAO) system based on the ASM2d. Eleven stoichiometric and kinetic parameters were calibrated and validated at different phases according to the operation data of the system, and then the validated model was used to determine the optimal DOPs for the removal of pollutants as well as for energy saving. Finally, the optimal DOPs were tested and validated in a pilot-scale AAO system. The results indicated that the combination of ASM2d, Pareto ANOVA and RSM could optimize the key DOPs accurately and effectively. This research provides a useful tool for optimizing the operation of activated sludge processes.

2. Materials and Methods

2.1. Operation of the AAO Reactor

The lab-scale AAO system used for model calibration and validation consisted of an AAO reactor and a sedimentation tank, with working volumes of 15.3 L and 4.0 L, respectively. The AAO reactor was divided into three compartments (anaerobic zone, anoxic zone, and aerobic zone) by baffles. The working volume of the anaerobic zone was 2.0 L, and the total volume of the anoxic and aerobic zones was 13.3 L. The Vanx/Vaer ratio could be changed by adjusting the position of the baffle. Agitators were set up in the anaerobic and anoxic zones, and the aerobic zone was aerated by microporous aerators. Real wastewater and inoculated sludge were collected from a municipal WWTP in Shanghai, China. The flowrate of the influent wastewater was 20 L/day. The external recirculation ratio (ERR) and the IRR were 300% and 100%, respectively. The SRT was controlled at 15 days.
Three different operation phases were applied to the lab-scale AAO system, namely the calibration phase, validation phase I, and validation phase II. The DOPs of each phase are shown in Table 1. To examine whether the ASM2d could accurately predict the system performance under different operational conditions, the Vanx/Vaer ratio and the amount of external carbon source affecting the ratio of biodegradable chemical oxygen demand to total nitrogen (BCOD/TN) were set differently in the two validation phases. In validation phase I, the Vanx/Vaer ratio was 1:3, and about 150 mg/L sodium acetate (providing approximately 120 mg/L of chemical oxygen demand (COD)) was added to the anoxic zone. In validation phase II, the Vanx/Vaer ratio was 3:1, and about 190 mg/L sodium acetate (providing approximately 150 mg/L of COD) was added to the anoxic zone. The average concentration of COD in the influent of the lab-scale AAO system was 209 ± 20 mg/L. The physical-chemical method was used to fractionate the influent COD and the result is shown in Figure 1 [23]. The specific influent quality of the model input is shown in Table S1.
The pilot-scale AAO system was established in a municipal WWTP in Anhui Province, China. It also consisted of an AAO reactor and a sedimentation tank made of steel (Figure S1). The working volumes of the anaerobic zone, the anoxic zone, and the aerobic zone were 4.3 m3, 9.4 m3, and 18.7 m3, respectively. The working volume of the sedimentation tank was 8.4 m3. Agitators were set up in the anaerobic and anoxic zones, and the aerobic zone was aerated by microporous aerators. The wastewater and inoculated sludge were collected from the grit chamber effluent and the excess sludge, respectively, in the WWTP. The influent flowrate of the pilot-scale AAO system was 50 m3/day. The ERR and the IRR were 300% and 100%, respectively. The SRT was controlled at 15 days, which was the same with the SRT of the AAO system of the WWTP. The influent COD fractionation of the pilot-scale AAO system is shown in Figure S2, and the DOPs and specific influent quality of the model input are shown in Tables S2 and S3, respectively.
The removal efficiency of pollutants was calculated using Equation (1):
Removal   efficiency = M inf M eff M inf × 100 %
where M inf is the influent concentration of pollutants; M eff is the effluent concentration of pollutants.

2.2. Sensitivity Analysis and Simulation Evaluation

Thirty-six kinetic and 6 stoichiometric parameters related to autotrophs, heterotrophs, and phosphorus accumulating organisms (PAOs) were selected for local sensitivity analysis (LSA). The central relative sensitivity (CRS) was used to express the influence of each parameter on the simulation of the lab-scale and pilot-scale AAO systems. The larger the CRS, the greater was the influence of the parameter on the simulation. CRS was calculated as follows [24]:
FAS i , j ( t ) = y i θ j + = y i ( t , θ j + Δ θ j ) y i ( t , θ j ) Δ θ j
BAS i , j ( t ) = y i θ j = y i ( t , θ j ) y i ( t , θ j Δ θ j ) Δ θ j
CAS i , j ( t ) = FAS i , j ( t ) + BAS i , j ( t ) 2
CRS i , j ( t ) = CAS i , j ( t ) × θ j y i ( t , θ j )
where FAS is the forward absolute sensitivity; BAS is the backward absolute sensitivity; CAS is the central absolute sensitivity; y i is the model output function; θ j is the jth parameter; Δ θ j is the change of the jth parameter; y i θ j is the absolute sensitivity of the ith model output function to the jth parameter.
When one parameter was changed, the remaining parameters kept the default values, and the absolute values of CRS of all parameters were compared. The steady-state LSA has a good correlation with the dynamic LSA, so the result of the steady-state LSA can be used for dynamic calibration [25].
Sensitivity analysis was used to obtain the parameters which had significant influence on the simulation, and the simulated values which fitted well with the measured values were obtained by adjusting the values of these parameters. The fitting degree between the measured values and the simulated values was characterized by the Theil inequality coefficient (TIC). When TIC is less than 0.3, it can be considered that there is a good fitting degree between the measured values and the simulated values [26]. The TIC calculation is shown in Equation (6):
TIC = ( Y sim Y real ) 2 Y sim 2 + Y real 2
where Y sim is the simulated value, Y real is the measured value.
The simulation and the sensitivity analysis of the model in this study were carried out on the WEST® platform. The default values of the stoichiometric and kinetic parameters were used in the first run of the simulation, and some of the parameters were adjusted based on the results of the sensitivity analysis to reduce the differences between the simulated and measured values.

2.3. Screening for Important DOPs

To screen the DOPs that had significant influence on the dependent variables (removal efficiencies of NH4+-N, TN, total phosphorus (TP), and the operating cost), ANOVA was performed with RStudio (version 0.94.102) to obtain the interaction between the DOPs (BCOD/TN, DO concentration, SRT, Vanx/Vaer ratio), and the dependent variables (the principle and operation files of ANOVA can be found in Supplementary Materials). Furthermore, the Pareto analysis was applied based on the results of ANOVA to screen the important DOPs. The contribution rate was used in the Pareto analysis to numerically evaluate the degree of the influence of DOPs on the dependent variables [27]. The F-value conforming to the F-distribution was used to calculate the contribution rate of each DOP. The contribution rates of DOPs were the proportion of the F-value of each DOP to the sum of the F-values of all DOPs [28]. The calculation process of the contribution rate is summarized in Supplementary Material S1. The contribution rate of each DOP was sorted, and the cumulative contribution rate was calculated. A combination of DOPs whose cumulative contribution rate exceeded 80% was considered to have a major impact on the dependent variables. In this study, Pareto ANOVA was performed based on the results of an orthogonal experiment. The orthogonal experiment was simulated on the ASM2d in the lab-scale system and the experimental design table is shown in Table S4. In the orthogonal experiments and optimization experiments of DOPs, influent quality different from that in the model calibration and validation stages was selected (Table S5).

2.4. DOPs Optimization Based on ASM2d

The results of Pareto ANOVA were used to determine the DOPs to be optimized in the RSM. The RSM software used in this research was Design Expert® 8.0. Box–Behnken design, which is a common second-order experimental design method in RSM [29], was adopted for the experimental design. The optimization experiment was carried out based on the ASM2d in a lab-scale system. RSM was performed on the simulated results, and the influence of each DOP on the second-order linear model was evaluated by ANOVA (details are shown in Supplementary Material S2). DOPs that did not contribute to the final second-order linear model were eliminated and a three-dimensional response surface map was drawn according to the establishment results of the second-order linear model. Multiple responses were optimized simultaneously using Design Expert® 8.0 to determine the optimal DOPs for both pollutant removal and energy saving.

2.5. Global Sensitivity Analysis

The optimal DOPs obtained from the lab-scale experiment were tested in the pilot-scale AAO system aformentioned. To optimize the operation of the pilot-scale AAO system, global sensitivity analysis (GSA) was used to investigate how the model outputs were influenced by the parameters that changed simultaneously. GSA can compare the influence of different parameters based on comprehensive modeling using all the parameters [30]. The principle of GSA is as previously described by Sin et al. [31]. The parameters in the ASM2d can be divided into two categories: (i) DOPs, such as different biochemical zone volumes, ERR and IRR, etc. (ii) Model parameters (including stoichiometric and kinetic parameters) related to sludge properties in the ASM2d. The probability density function (PDF) and the value range of the parameters involved in GSA are shown in Table S6.

2.6. Analytical Methods

All the samples were filtered through a 0.45 µm membrane before analysis. COD, mixed liquor suspended solids (MLSS), mixed liquor volatile suspended solids (MLVSS), NH4+-N, NO2-N, NO3-N, TN, PO43−-P, TP, and the biochemical oxygen demand for 5 days (BOD5) were analyzed according to the standard methods [32]. The concentrations of NH4+-N, NO2-N, NO3-N, TN, PO43−-P, and TP were analyzed using an ultraviolet-visible spectrophotometer (L6S, Shanghai INESA, Shanghai, China). The pH was measured using a pH meter (MODEL6010, JENCO, Shanghai, China). The DO concentration was measured using a DO meter (HQ30d, Hach, Loveland, CO, USA). A gas chromatography (6890N, Agilent, Santa Clara, CA, USA) with flame ionization detector and automatic sampler was used to quantitatively determine volatile fatty acids. Molecular nitrogen gas was used as the carrier gas, and DBWA × 125–7332 (30 m × 30 mm × 0.25 mm) was used as the capillary column. The temperature of the sampler and the detector was set at 220 °C and the furnace temperature was run at 55 °C for 1 min, and then raised to 110 °C at 30 °C/min and kept for 1 min. After that, the temperature was raised to 220 °C at 30 °C/min and kept for 1 min. All chemicals with analytical grade in this study were bought from Sinopharm Chemical Reagent Co., Ltd. of China (Shanghai, China).

3. Results and Discussion

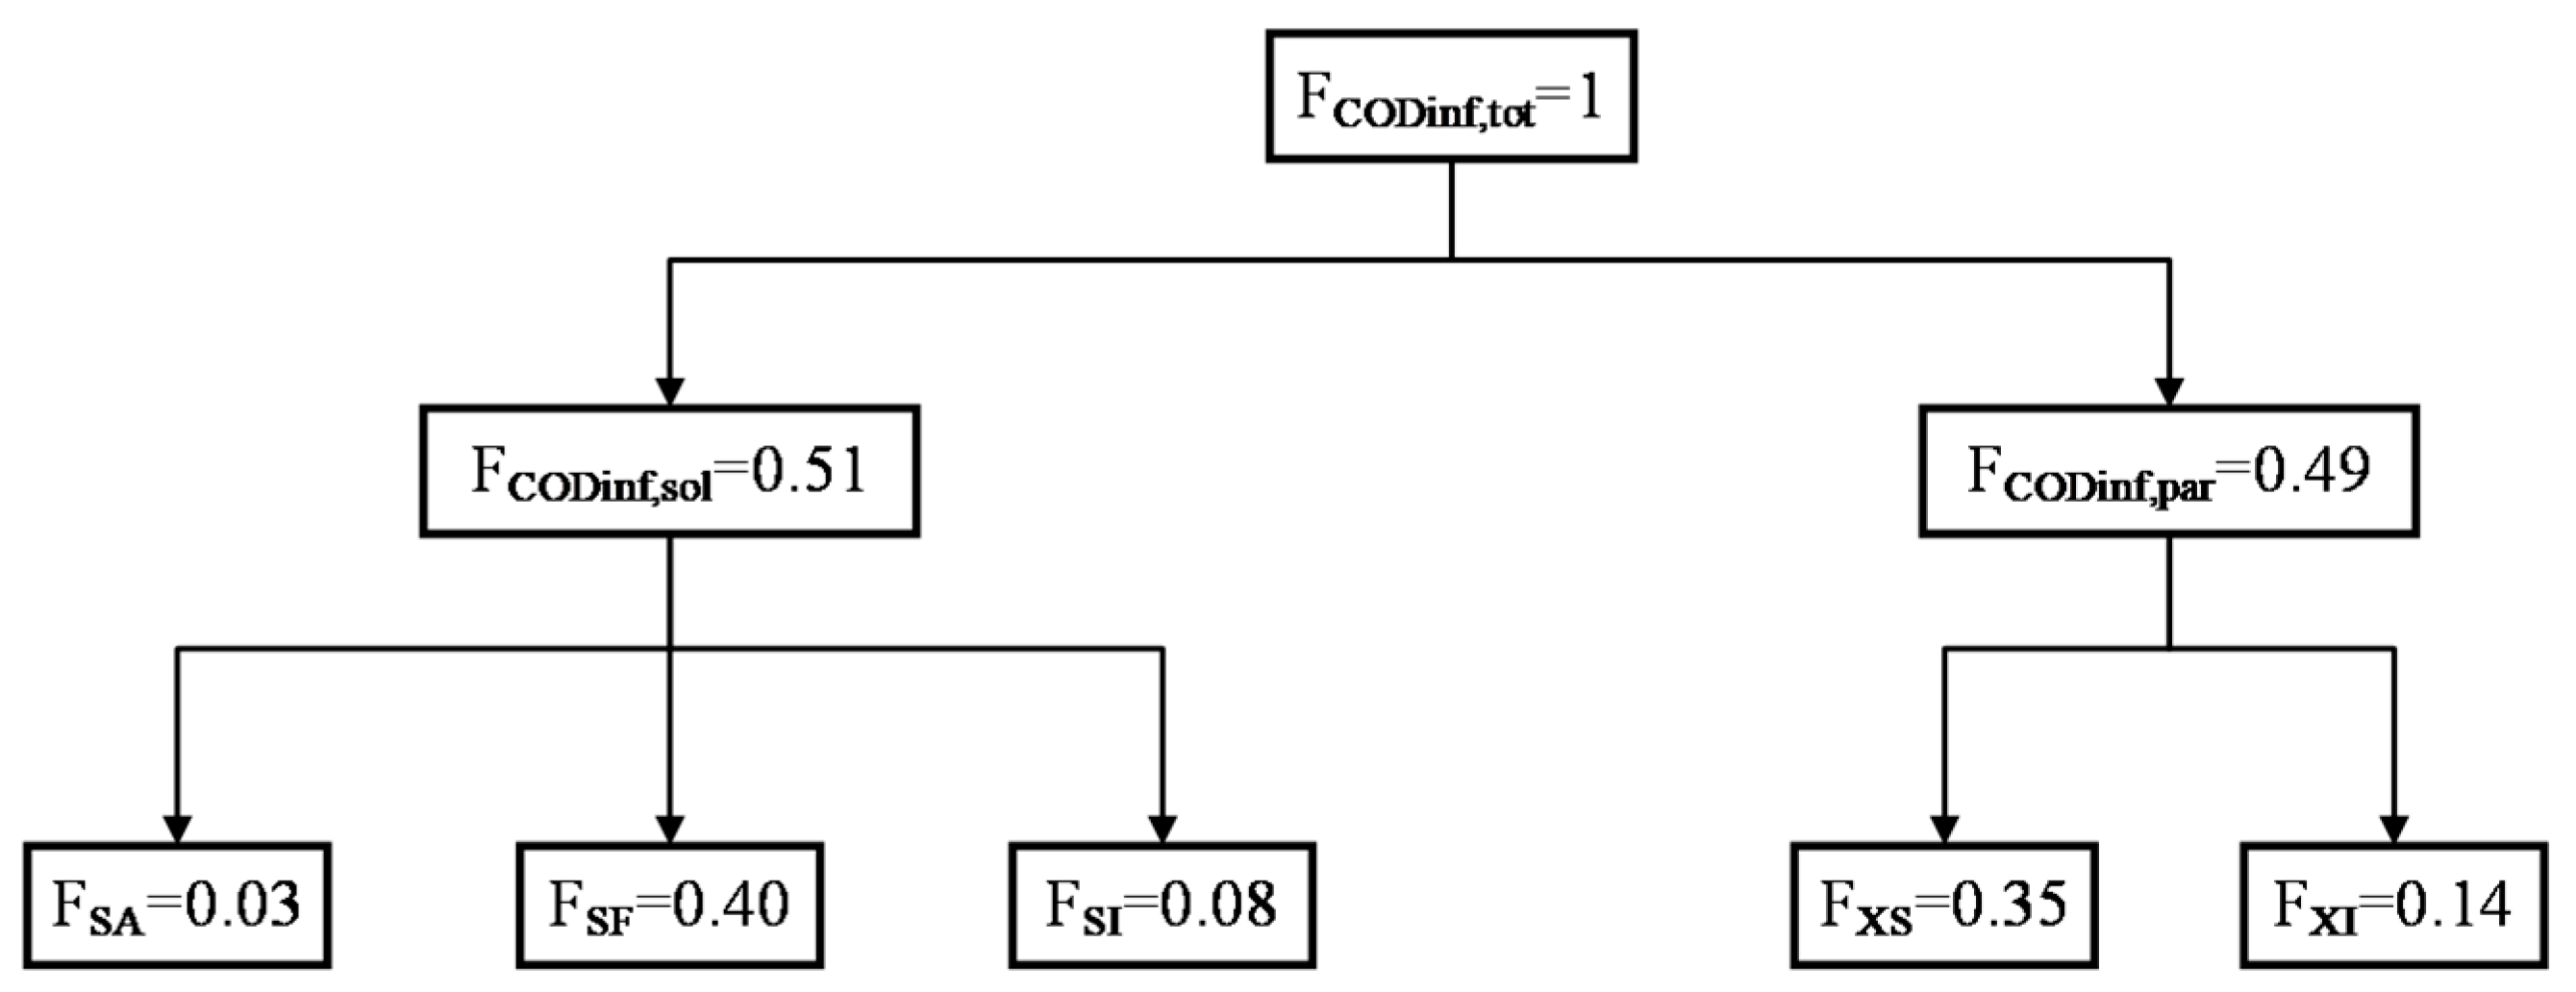
3.1. Calibration and Validation of ASM2d in the Lab-Scale AAO System

By ranking the absolute values of CRS of the stoichiometric and kinetic parameters in the ASM2d in terms of effluent quality indexes (NH4+-N, NO3-N, TN, PO43−-P, TP, and COD), 11 parameters that had great impacts on the effluent quality were obtained (Table S7).
The hydrolysis rate constant (kh) had a great influence on the effluent quality. That is because the biodegradation of the slowly biodegradable organic matter (XS) in wastewater starts from hydrolysis, which is usually slower than the growth of heterotrophic bacteria. Therefore, the hydrolysis process is considered to be the rate-limiting step for the removal of organic matter and nutrients [33]. The yield for heterotrophic biomass (YH), the yield for autotrophic biomass (YAUT) and the decay coefficient for autotrophic biomass (bAUT) also had great influences on all effluent quality indexes, while the half saturation coefficient for oxygen (KO) and the half saturation coefficient for oxygen of autotrophic biomass (KO,AUT) had great influences on the processes related to nitrogen removal. Except for poly-phosphate requirement per polyhydroxyalkanoate stored (YPO), other stoichiometric and kinetic parameters closely related to PAOs in ASM2d had little influence on the phosphorus removal process. This might have been caused by the low content of BCOD in the influent of the reactor, which could not meet the growth of PAOs [34]. Therefore, compared with the heterotrophic bacteria and autotrophic nitrifying bacteria, the contribution of PAOs to the pollutant removal was negligible.
YH and the maximum specific growth rate for autotrophic biomass (μAUT) were measured [35], which were 0.67 ± 0.01 gCOD/gCOD and 0.71 ± 0.14 day−1, respectively. The measured values of YH and μAUT were within the reported range of literature and slightly altered in the calibration [36,37]. Other parameters were adjusted according to the result of the sensitivity analysis by comparing the simulated results and the experimentally measured results of the calibration phase. The values of the adjusted parameters are shown in Table 2 and the values of the remaining parameters in ASM2d were set according to those reported by IWA [8]. Using the adjusted parameters, the simulated values of NH4+-N, TN, PO43−-P, TP, COD in the effluent and MLSS of the aerobic zone were well fitted to the measured ones (details of simulated and experimentally measured results are shown in Figure S3). The TIC values of each index in the calibration phase were all less than 0.3 (Table 3), indicating that the adjustment of these 11 parameters was appropriate and effective in reducing the difference between the simulated and measured values.
The calibrated model was further validated using the operation data of the two validation phases (Figure S3). Except that the TIC of the PO43−-P exceeded 0.3 in the validation phase II, the TIC values of the other effluent quality indexes in each phase were all less than 0.3 (Table 3). This indicated that the model was successfully validated and could be used for further optimization.

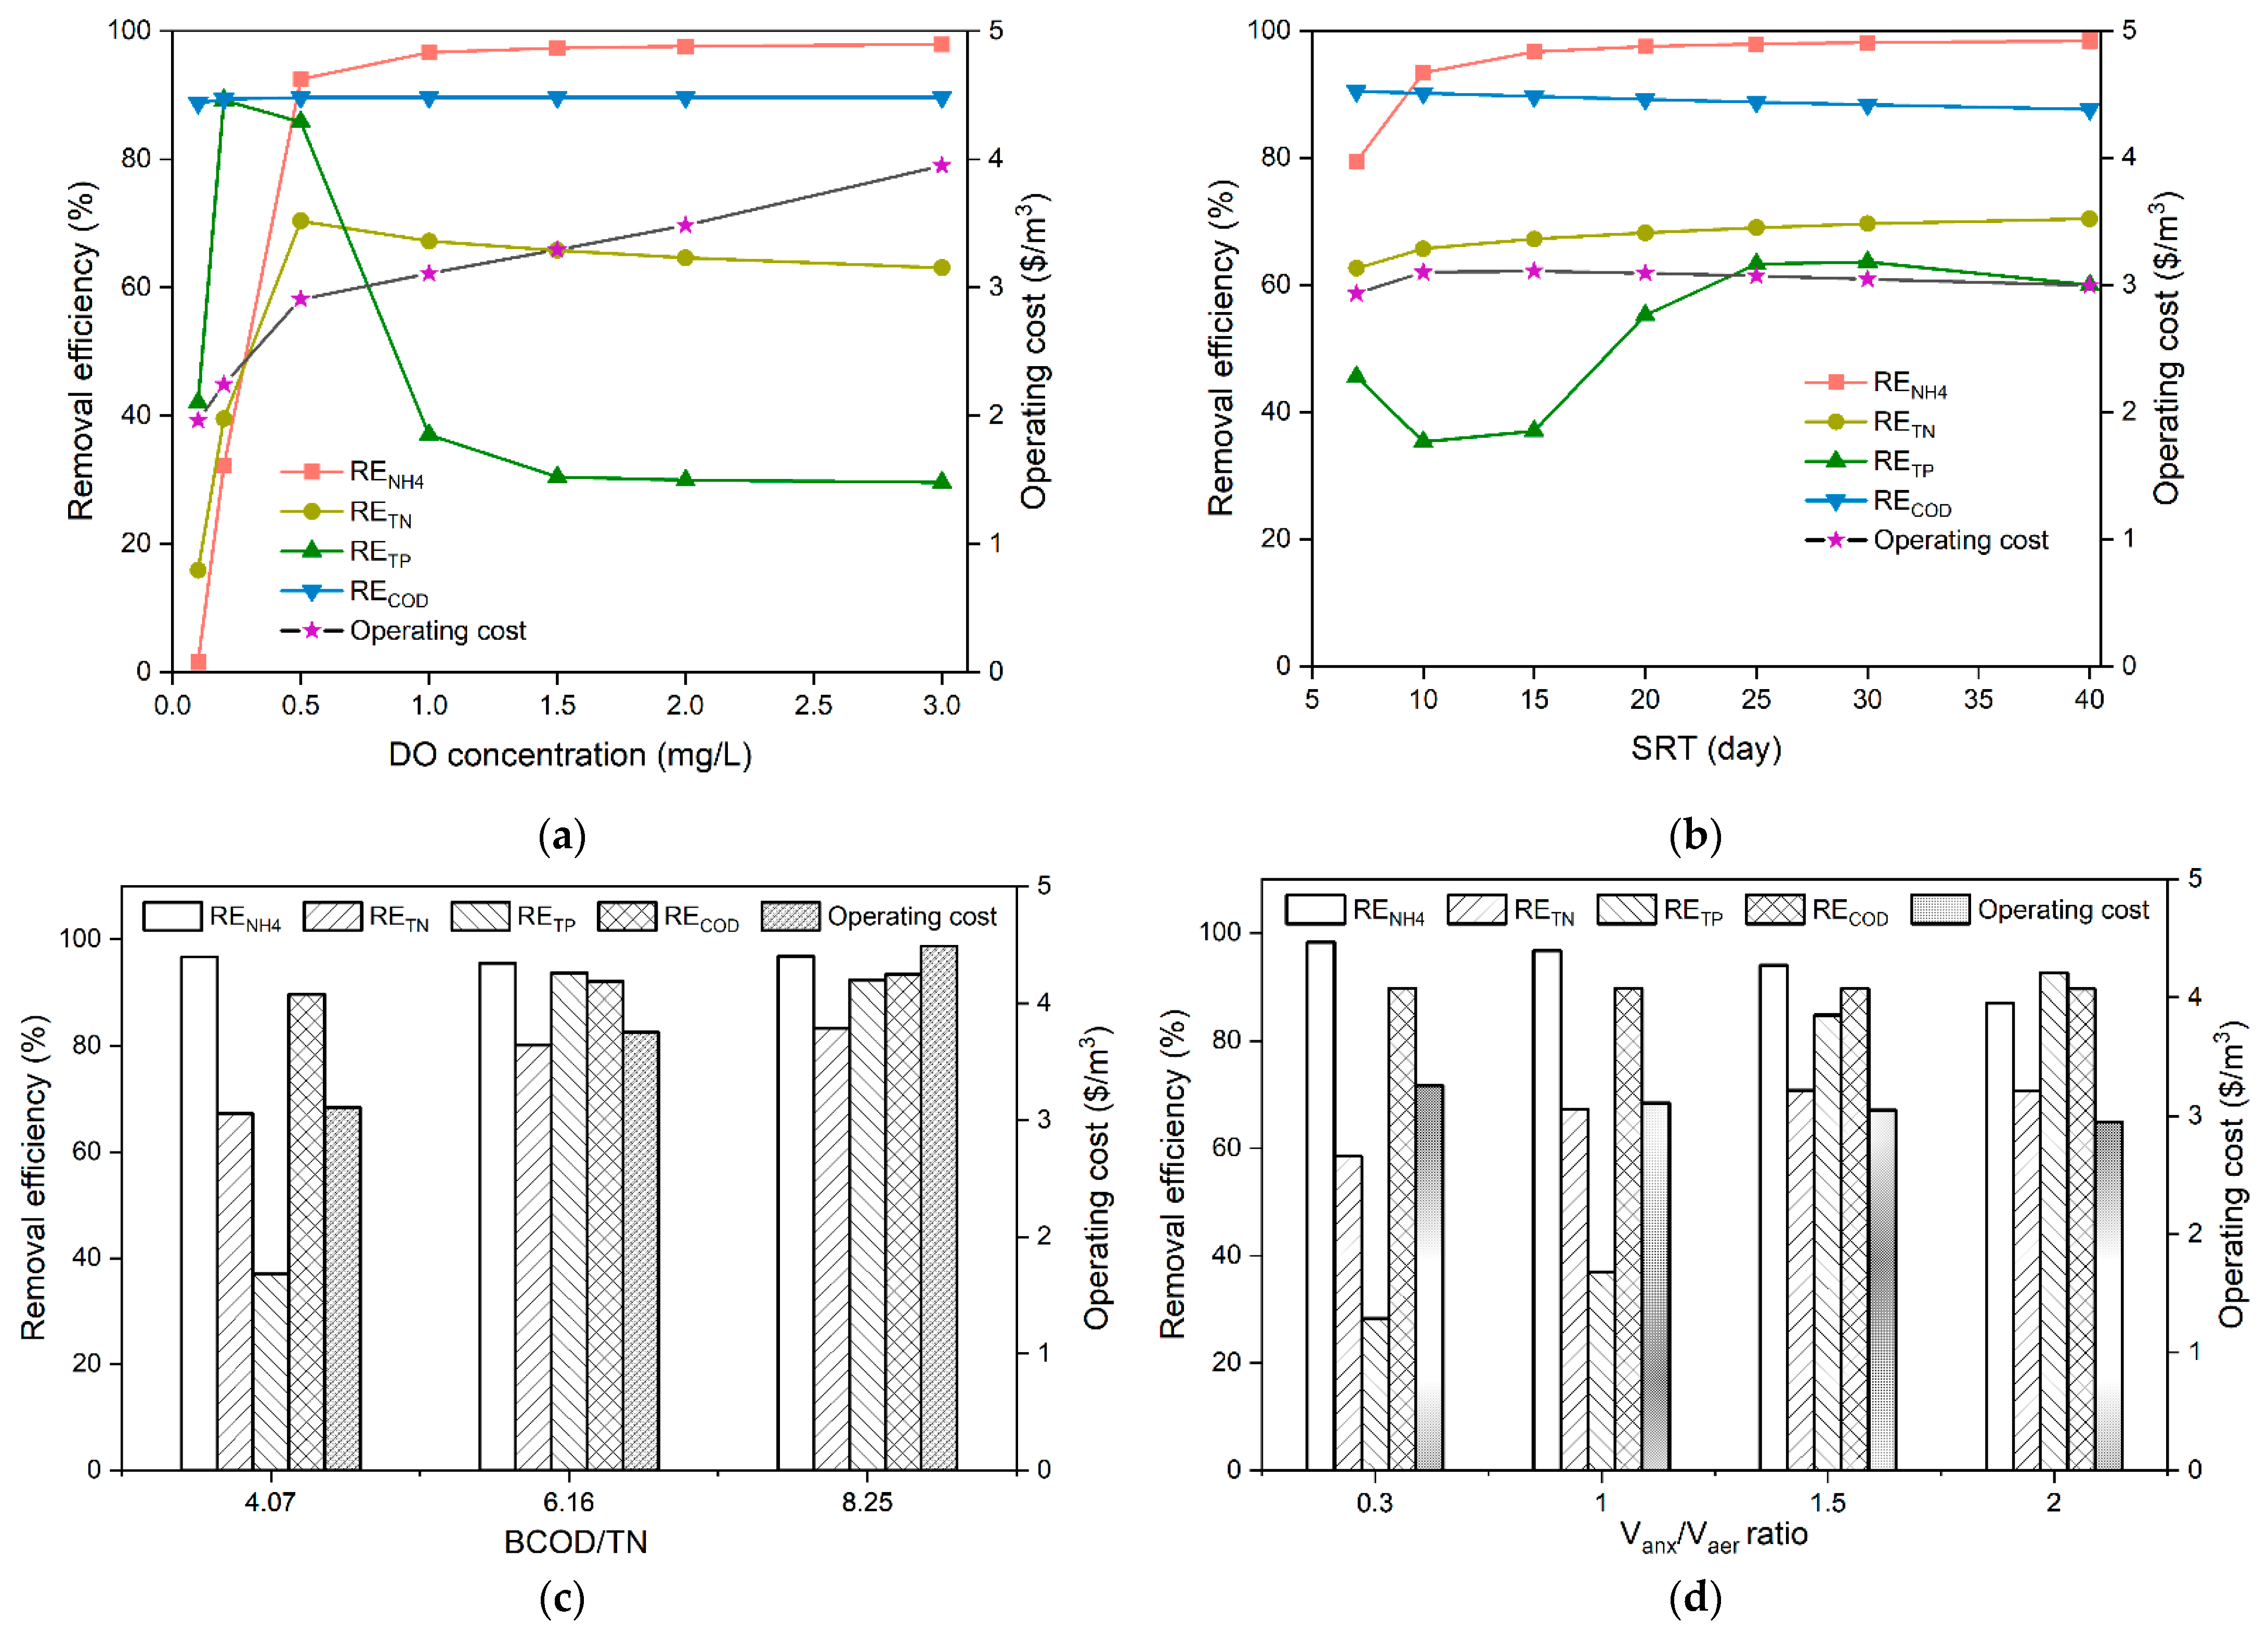
3.2. Effects of DOPs on Pollutant Removal and the Operating Cost

To select suitable ranges for DOPs, it was necessary to study how DOPs affected pollutant removal and the operating cost (calculation formulas of the operating cost are shown in Table S8). Previous studies have shown that DO concentration [10], BCOD/TN [11,41], Vanx/Vaer ratio [13], and SRT [14] are the main DOPs affecting the pollutant removal in biological processes. Therefore, the variations of effluent NH4+-N, TN, TP, COD, and the operating cost at different DO concentrations, BCOD/TN, Vanx/Vaer ratio, and SRT were investigated in the calibrated ASM2d.
The simulated results of pollutant removal and the operating cost changing with different DO concentration are shown in Figure 2a. When the DO concentration was in the range of 0.1–0.3 mg/L, the removal efficiency of NH4+-N was only about 3.0% and the removal efficiency of TN was about 20.0%. This is because the nitrifying bacteria in the system were significantly inhibited. When the DO concentration was greater than 0.5 mg/L, the nitrification capacity of the system was restored, and the removal efficiency of NH4+-N gradually increased with the increase of DO concentration. However, when the DO concentration rose to 1.0 mg/L, further increase of DO concentration had little effect on the improvement of NH4+-N removal efficiency, which was consistent with the phenomenon observed by Liu et al. [42]. Excessive DO concentration would also adversely affect the denitrification process and cause a decrease in TN removal efficiency. The TP removal efficiency decreased significantly with the increase of DO concentration. The main reason was that the nitrate concentration in the aerobic zone increased along with the DO concentration. This may have resulted in competition for the carbon source between PAOs and denitrifying bacteria, which led to the poor phosphorus removal [43]. Since most of the COD had been utilized in the anaerobic and anoxic zones, less COD reached the aerobic zone. Consequently, the change of DO concentration had little effect on the COD removal efficiency. The operating cost of WWTPs mainly includes the aeration cost and the sludge disposal cost, and the amount of aeration is closely related to the DO concentration. Thus, the operating cost increased with the increase of the DO concentration.
The simulated results of pollutant removal and the operating cost with different SRT are shown in Figure 2b. When the DO concentration in the aerobic zone was kept at around 1.0 mg/L, the removal efficiency of NH4+-N was almost not affected by SRT (longer than 15 days) and was always around 98.0%. However, the TN removal efficiency was only 65.0%. This may be because the mixed liquor recirculating from the aerobic zone brought oxygen into the anoxic zone and affected the denitrification process. When the SRT was longer than 25 days, the longer the SRT, the lower was the TP removal efficiency. This may be because the decay ratio of activated sludge in the system became higher with the extension of SRT. Thus, the observed biomass yield and the abundance of PAOs decreased [44,45], which led to the poor phosphorus removal performance of the system. In general, microorganisms can make good use of the biodegradable carbon source in municipal wastewater. Therefore, the COD removal efficiency had little change with the increase of SRT, and the effluent COD was always less than 50.0 mg/L, meeting the WWTP effluent discharge standard of China (EDSC) [46]. The operating cost decreased slightly with the increase of SRT. This is because the increase of SRT reduced the daily excess sludge production and the corresponding sludge disposal cost.
Although the removal efficiency of NH4+-N was not affected by the change of BCOD/TN, the increase of BCOD/TN could significantly improve the removal efficiency of TN. When the BCOD/TN increased from 4.07 to 6.16, the TN removal efficiency increased by 30.3%. When BCOD/TN was further increased from 6.16 to 8.25, the TN removal efficiency only increased by 8.6% (Figure 2c). In addition, when the BCOD/TN was 6.16, the effluent quality met with the requirements of the EDSC, and the TN removal efficiency was 72.0%. It can be seen from Figure 2c that, for a system unable to effectively remove phosphorus due to insufficient carbon source, the addition of a carbon source could significantly improve the TP removal efficiency [47]. Meanwhile, when BCOD/TN was further increased from 6.16 to 8.25, little increase in the phosphorus removal efficiency was observed. Moreover, the addition of a carbon source would increase the operating cost of the wastewater treatment unit. When the BCOD/TN increased from 4.07 to 6.16, the operating cost increased by about 33.0%.
According to Figure 2d, the larger the Vanx/Vaer ratio, the higher were the removal efficiencies of TN and TP. The increase in the volume of the anoxic zone improved the anoxic HRT, which was conducive to the enrichment of denitrifying organisms and denitrifying phosphorous accumulating organisms, resulting in higher TN and TP removal efficiencies. The increase in the volume of the aerobic zone would have increased the retention time of nitrifiers in the aerobic zone, which was conducive to the removal of NH4+-N. However, an increase in the volume of the aerobic zone would also increase the required airflow, leading to an increase in the operating cost. The removal efficiency of COD did not change with the Vanx/Vaer ratio and was stable at 89.0%.

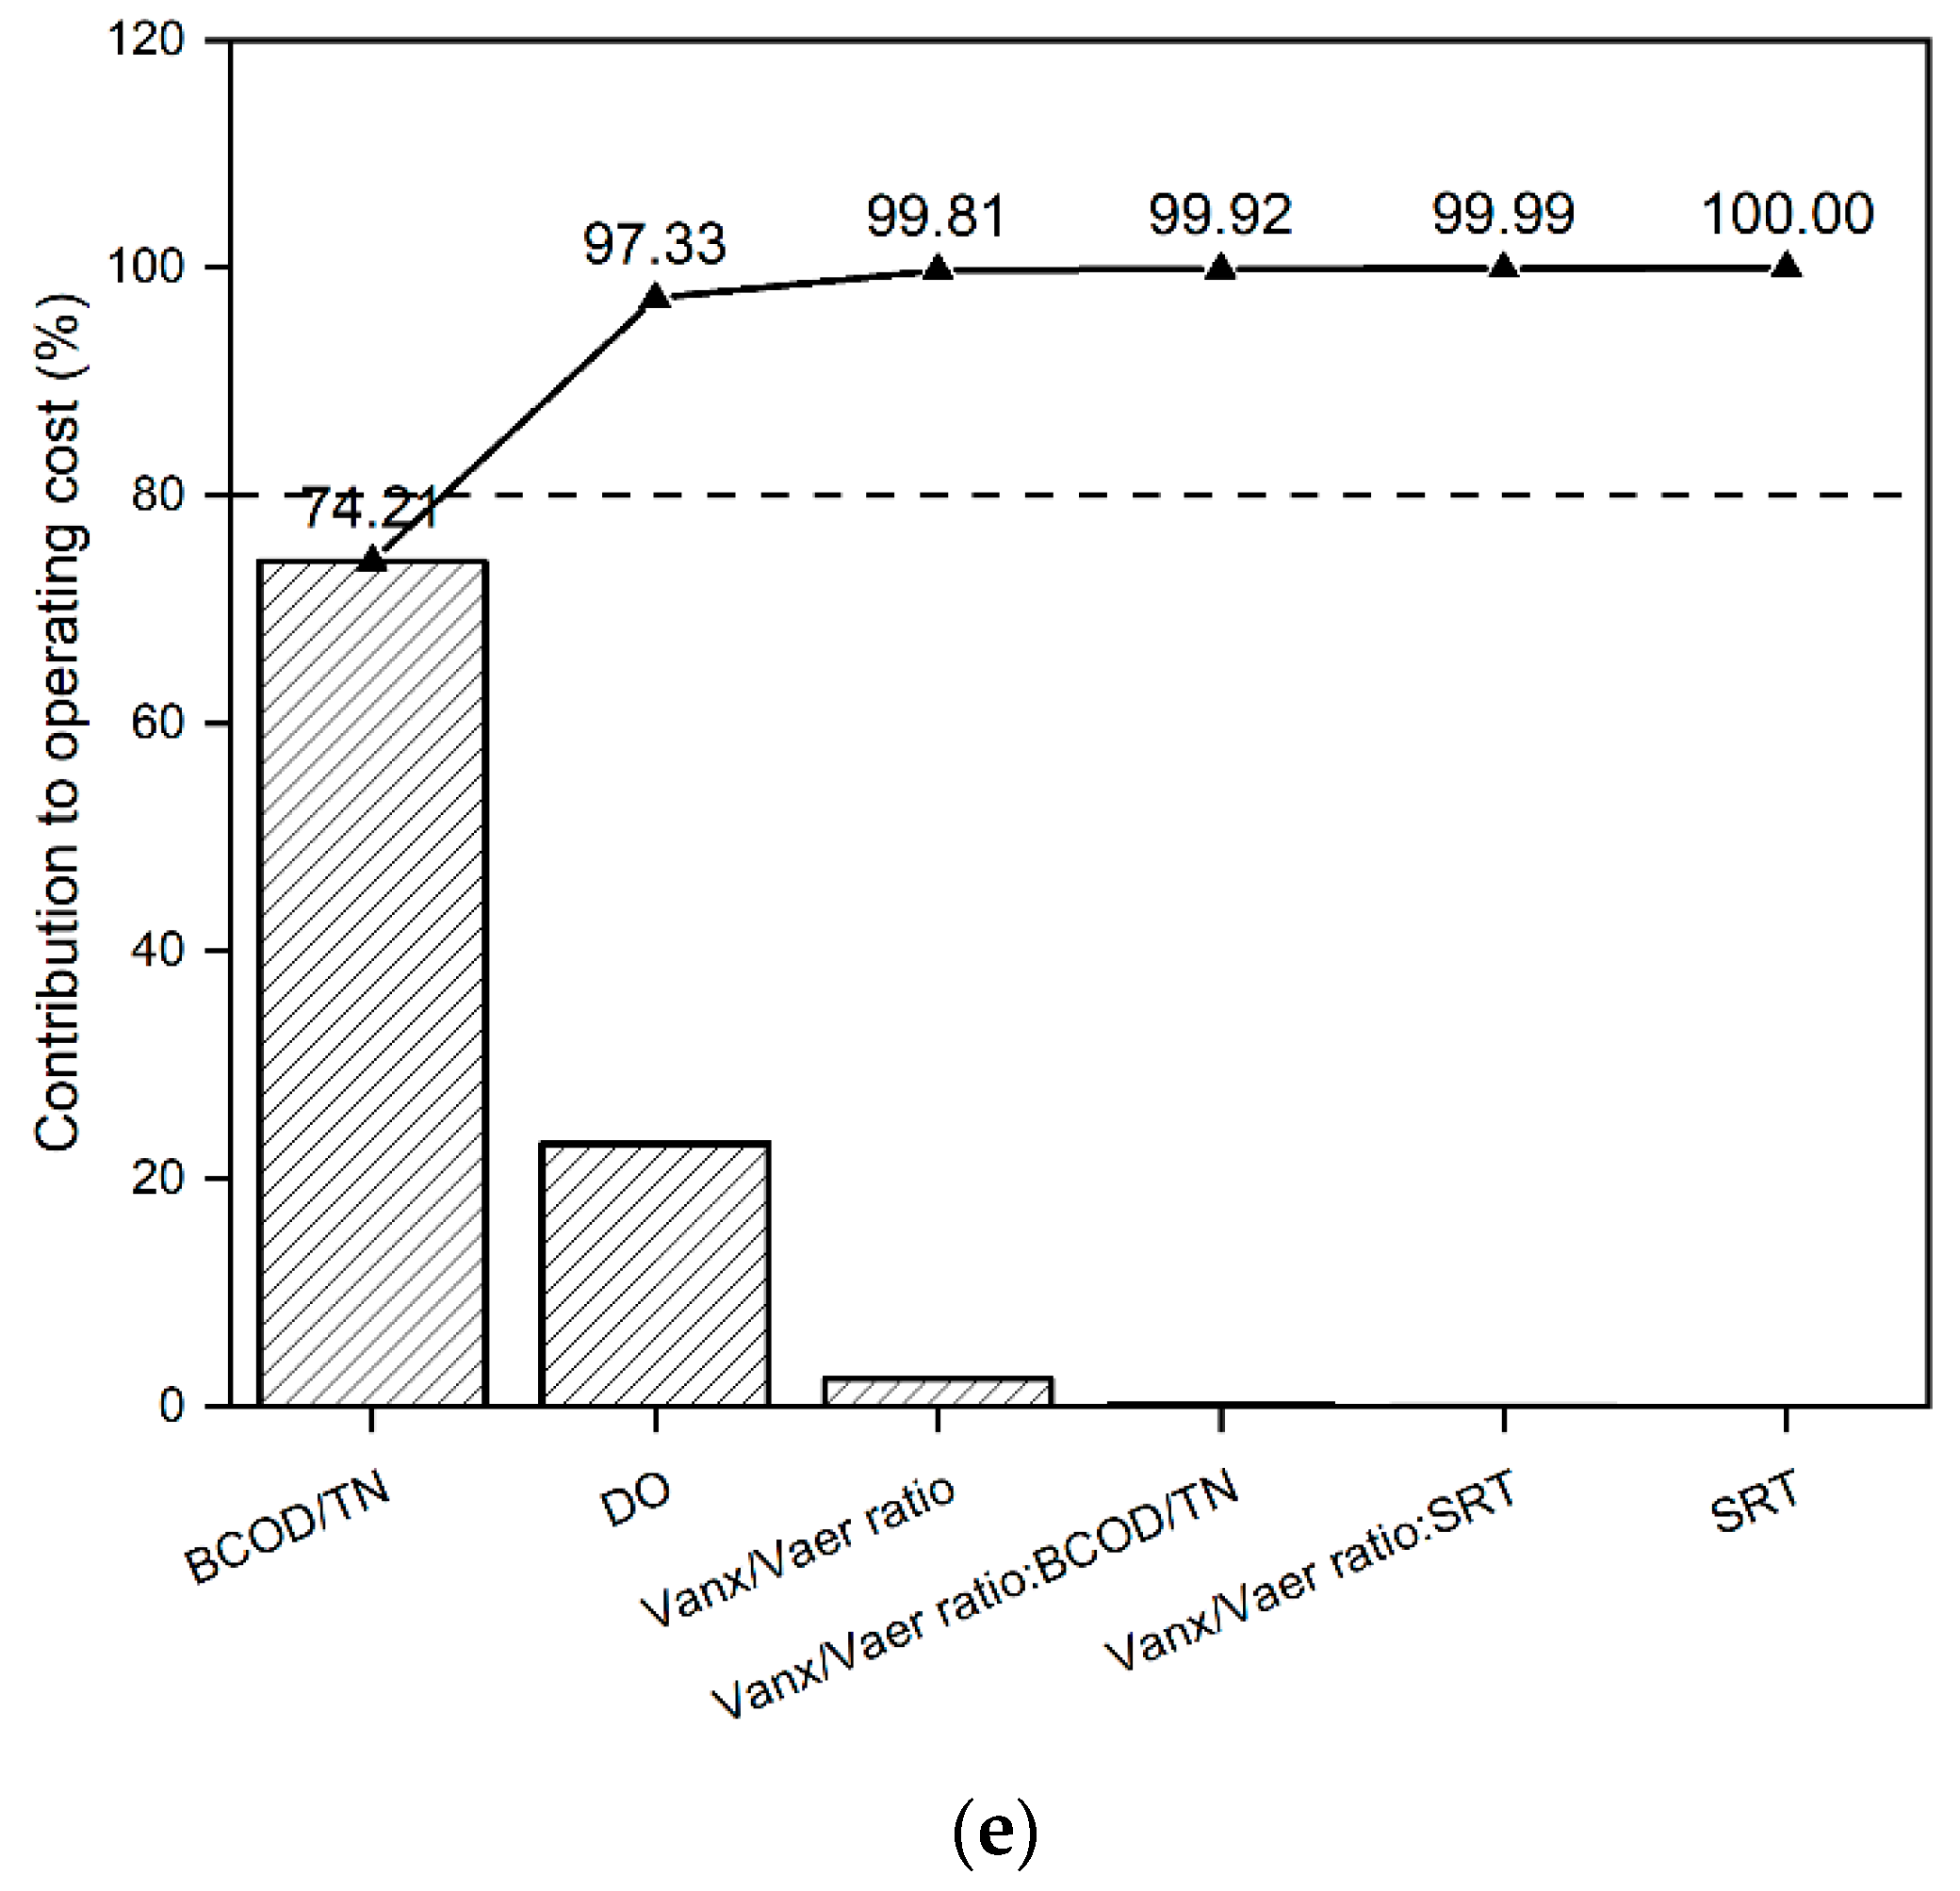
3.3. Pareto ANOVA Analysis

Orthogonal experiments were designed and simulated on the ASM2d in the lab-scale system, and Pareto ANOVA was performed based on the simulated results. The orthogonal experimental design table and simulated results are shown in Table S4.
The result of ANOVA analysis for the removal efficiencies of NH4+-N, TN, TP, COD, and the operating cost is shown in Tables S9–S13. Figure 3 shows the Pareto diagram of each objective. DO concentration, SRT, and BCOD/TN had significant impacts on pollutant removal and the operating cost, while the Vanx/Vaer ratio only had a greater effect on phosphorus removal. As most WWTPs use post-chemical methods to remove phosphorus, DO concentration, SRT, and BCOD/TN were selected for subsequent optimization by RSM.

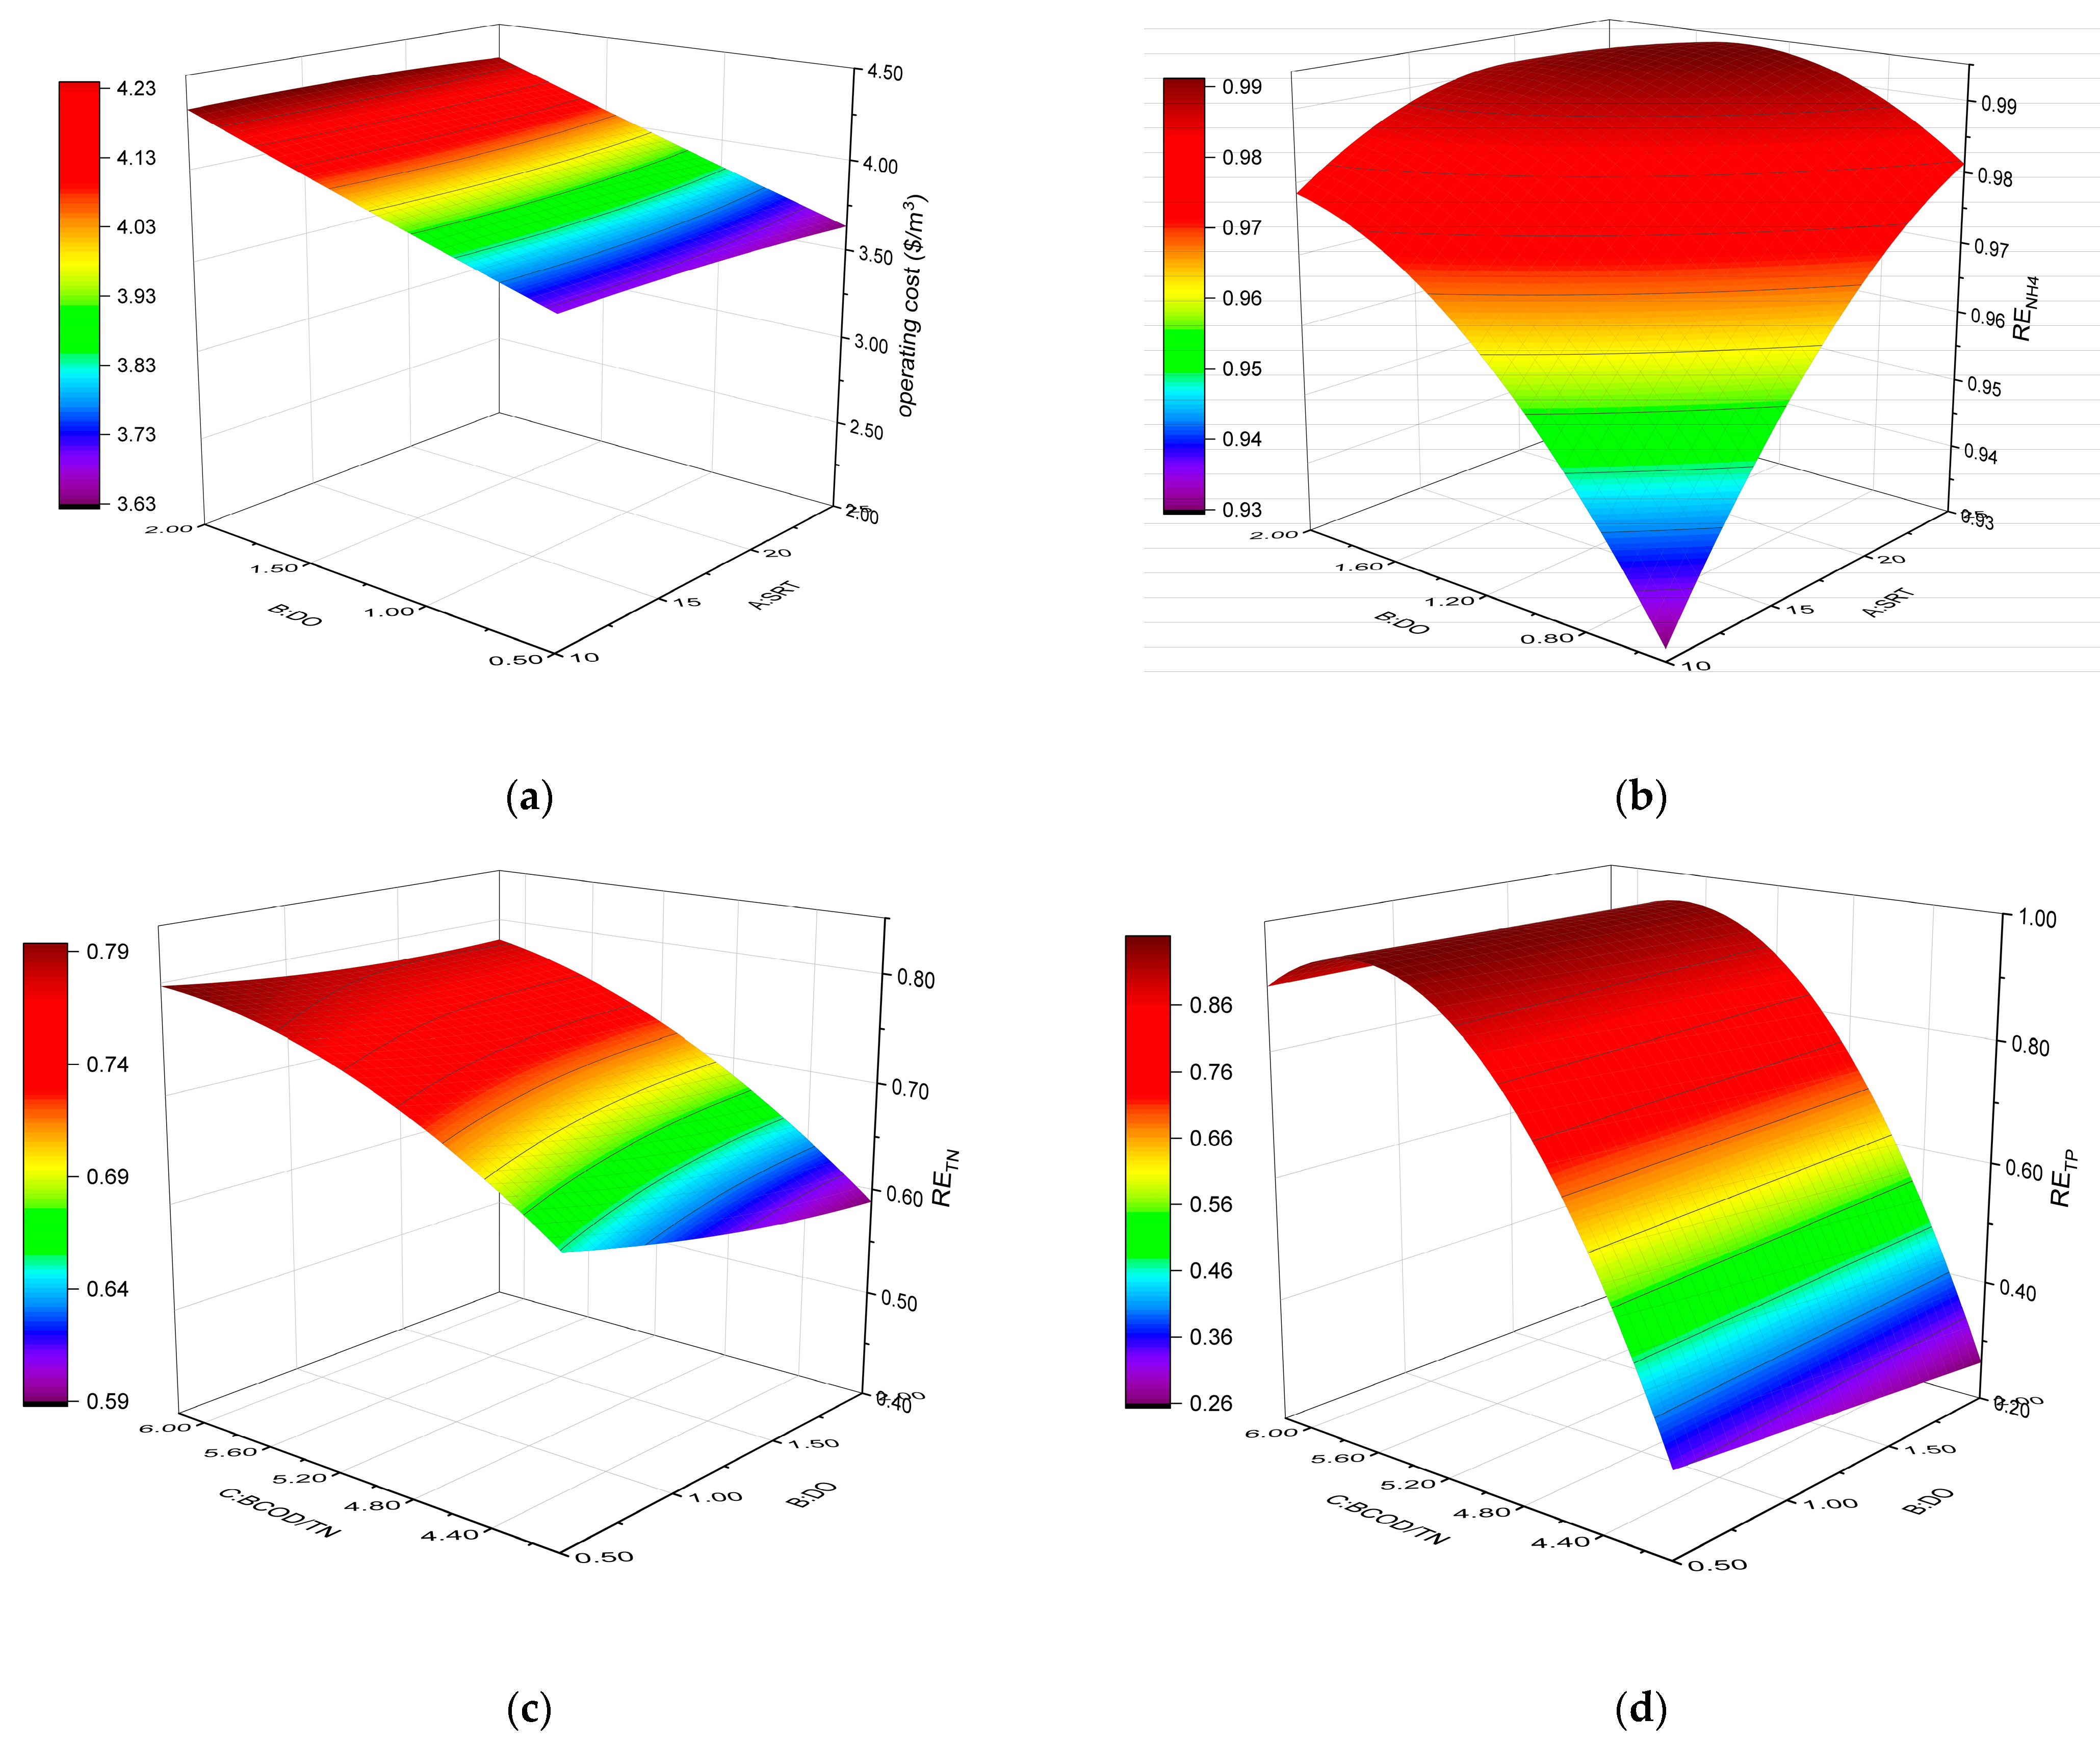
3.4. DOP Optimization by RSM Based on the ASM2d

The value ranges of DO concentration, BCOD/TN, and SRT in the optimization experiments were determined according to single factor experiments (Table 4). It can be seen from Figure 2 that when DOPs were within the value ranges in Table 4, the variation of COD removal efficiency was within 3.0%. Therefore, only the removal efficiencies of NH4+-N, TN, TP, and the operating cost were included as objectives (responses) in the subsequent optimization experments.
To avoid the tedious and time-consuming adjustment of the selected DOPs, RSM was used to effectively optimize the multi-variable DOPs at different levels. Three levels of three factors were selected for response surface analysis, and 20 different scenarios were designed based on RSM software (i.e., 20 sets of DOPs were designed for optimization). First, each scenario was simulated based on the ASM2d in the lab-scale system to obtain the simulated value for the optimization objective, and the detailed information of the optimization experiment is shown in Table S14. ANOVA analysis with a confidence level of 0.05 was then used to determine the significance of all variables. The factors that had no significant influence on the response were removed to obtain the final quadratic model for each response, as shown in Table S15. Table S16 summarizes the ANOVA analysis of each regression quadratic equation. The graph of the regression equation was presented as the response surface graph, and the corresponding contour map was plotted using Design-Expert® 8.0. The 3D response surfaces and contour maps of removal efficiencies of NH4+-N, TN, TP, and the operating cost are shown in Figure 4.
The response surface graphs obtained from the regression equations clearly showed the relationship between factors and responses. For example, the maximum removal efficiency of NH4+-N occurred at the intersection of the maximum values of SRT and DO concentration. Both long SRT and high DO concentration were beneficial to the nitrification process. However, the operating cost rose rapidly with the increase of DO concentration. The decrease of BCOD/TN would lead to a decrease of the removal efficiencies of TN and TP, while the increase of the carbon source would lead to an increase of the operating cost.
Based on the regression quadratic equations, multiple responses were optimized simultaneously by using Design-Expert® 8.0 to determine the optimal DOPs that could simultaneously achieve high NH4+-N, TN, and TP removal efficiencies as well as low operating cost. The function used for optimization was the expected function. The optimal DOPs obtained by RSM were as follows: SRT = 25 days, DO concentration = 0.5 mg/L, BCOD/TN = 5.22. The results obtained by running the optimal DOPs in the model of the lab-scale system are summarized in Plan A in Table 5. The accuracy of RSM predictions was measured by relative deviation (RD). RD was calculated as follow:
RD = | m p | m × 100 %
where, m is the simulated result of the ASM2d in the lab-scale system, and p is the predicted result of RSM.
It can be seen from Plan A in Table 5 that the prediction of TN removal efficiency and the operating cost under the optimal conditions obtained by RSM was very close to the results obtained by the ASM2d calibrated in the lab-scale system, but the predictions of TP removal efficiency were slightly different. This is because the quadratic term of SRT was considered to have less influence on TP removal efficiency due to its large p-value in ANOVA analysis when establishing the quadratic term equation related to TP removal efficiency, and therefore it was removed from the equation. Although the extension of SRT can affect the TP removal efficiency [45], it is less significant than the influence of DO concentration and BCOD/TN. The SRT of the pilot-scale AAO system was 15 days. Accordingly, the second expectation function was established and the SRT was set as 15 days. The obtained results are shown in Plan B in Table 5. In Plan B, the RD between the predicted values of RSM and the simulated values of the ASM2d in the lab-scale system was very small, indicating that the optimal DOPs obtained from the quadratic polynomial equation were reliable. Compared with plan A, the removal efficiencies of NH4+-N and TN decreased slightly. However, when the NH4+-N removal efficiency was greater than 84.0% and the TN removal efficiency was greater than 72.0%, the NH4+-N concentration (1.1 mg/L) and the TN concentration (7.0 mg/L) in the effluent could meet the EDSC. Therefore, Plan B could meet the discharge requirements and improve the TP removal efficiency at the same time. In terms of the operating cost, Plan B increased by about 1.4% compared with Plan A, and the increase was not significant. Therefore, Plan B can be selected as the optimal condition that can simultaneously meet the requirements of pollutant removal and energy saving.

3.5. Validation of the Optimal DOPs Based on the Pilot-Scale AAO System

To validate the optimal DOPs obtained by the ASM2d based on the lab-scale system and RSM, Plan B was tested using the ASM2d implemented on the pilot-scale reactor. Table S17 shows the default and calibrated values of parameters in the ASM2d in the pilot-scale system and Figure S4 shows the calibration and validation results of the pilot-scale system. The results of the validation were compared with the simulated results of the ASM2d in the lab-scale system (Table 5). In the pilot-scale modeling, when the DO concentration was reduced to 0.5 mg/L, although the NH4+-N removal efficiency was slightly decreased, the effluent NH4+-N concentration ranged from 0.4 to 1.7 mg/L, and it still met the EDSC. In addition, after increasing BCOD/TN, the effluent TN concentration was less than 10.0 mg/L. The operating cost of the WWTP in Anhui province was 3.93 $/m3/day, and it was reduced significantly in the pilot-scale modeling. Changes in aeration cost, sludge disposal cost, mixed cost, and chemicals cost before and after the process improvement of the pilot-scale system are shown in Figure S5. The reduction of the operating cost was mainly due to the reduction of the airflow rate. In this case, the operating cost can be reduced by 15.0% in a one-year perspective. Moreover, it can be seen from Table 5 that, in addition to ammonia removal efficiency and the operating cost, the simulated results of the TN and TP removal efficiencies in the pilot-scale system with optimal DOPs were significantly different from those of the lab-scale system. This may be due to the different influent quality. Sodium acetate as the external carbon source was added to the lab-scale system, resulting in more easily degradable carbon source in the influent, which was conducive to the removal of TN and TP.
GSA analysis was also used to investigate the effect of DOPs and model parameters related to sludge properties on model prediction. The parameters examined included DOPs and model parameters related to sludge properties. In the t-value analysis of standard regression coefficients (SRC), it was found that the absolute values of the t-value of all parameters for the three outputs SRC were greater than 1.96, indicating that all parameters had significant effects on the three outputs. This study only focused on the absolute values of the t-value of the top 10 parameters that had a significant influence on each output variable (Table S18). Overall, the model parameters related to sludge properties had a great influence on the three outputs. Among the top ten parameters influencing the three outputs, only the volume of the anoxic zone (Anoxic.Vol) was a DOP, and it had a negative influence on all three outputs. In addition, the difference in treatment scale can affect the dispersion of sludge flocs in the system. Therefore, the influence of Anoxic.Vol could be regarded as the difference in the degree of sludge dispersion. Among the model parameters related to sludge properties adjusted in the lab-scale and pilot-scale modeling, only kh was in the top 10 influential parameters (Table 2 and Table S17). In the model in the lab-scale system, the default value was used for kh. However, in the model in the pilot-scale system, the value of kh was slightly lower than the default value to reduce the hydrolysis rate of XS. The hydrolysis of XS is considered to be the rate-limiting step for the removal of organic matter as well as nitrogen and phosphorus [33]. Therefore, different kh may cause different predictions of the TN removal efficiency.

3.6. Application Limitation and Perspective

In this study, the method integrating ASM2d with Pareto ANOVA and RSM was used to successfully obtain the optimal DOPs of the lab-scale AAO system. Pareto ANOVA can screen out DOPs to be investigated for optimization by RSM, and this method has been rarely reported. Moreover, the combination of ASMs, Pareto ANOVA, and RSM has not been used to optimize wastewater treatment processes. This optimization method is simple, effective, and easy-to-use, which is suitable for practical applications.
However, it should be noted that the simulation experiments in this study were carried out under the condition of a constant flow. Although the steady-state simulation is not as practical as the dynamic simulation for the actual operation of WWTPs, the results of the steady-state simulation can also be used as a reference. Hvala et al. [48] used the steady-state simulation to choose the upgrade process for an existing WWTP. Koch et al. [49] used the steady-state model to compare the configurations of different biological phosphorus removal processes and preliminarily estimate the nutrient removal efficiency. The steady-state simulation allows the plant performance and key parameters to be determined very quickly. In addition, the buffer tank in some WWTPs can control the excessive inflow of wastewater in the event of peak flow and reduce the diurnal variability of wastewater strength [50,51]. Meanwhile, some WWTPs are designed with long HRT, and the HRT required by the biological treatment unit can be met, despite fluctuations in the influent flowrate. Due to the use of a buffer tank and long HRT, the operation of WWTPs may be relatively stable. In this case, the steady-state simulation may be significant and can provide a theoretical basis for the subsequent dynamic simulation and the operation strategy optimization. However, the practicability of this novel method in the dynamic simulation and whether the optimal DOPs obtained in the dynamic simulation are the same as those obtained in the steady-state simulation, also need to be studied in the future.
The optimization process of DOPs in this study was based on the ASM2d model. However, some restrictive conditions of the ASM2d model make it somewhat inconsistent with the real situation. For example, some complex biological processes are simplified into one step (e.g., nitrification and denitrification), and sludge settleability cannot be accurately predicted by the settling models in ASM2d [52]. However, with appropriate calibration, the difference between the simulation results and the real situation can be reduced to an acceptable range (e.g., the TIC of the simulated value is less than 0.3). In addition, it can be seen from Table S18 that the composition ratios of nitrogen and total suspended solids in the sludge had a significant impact on nitrogen removal and the operating cost. In future studies, the transformation of nitrogen and total suspended solid components during the AAO process should be further studied to improve the accuracy of the model.

4. Conclusions

Based on the ASM2d, the effluent quality and operating cost of the lab-scale AAO reactor were simulated and optimized using Pareto ANOVA and RSM. SRT, DO concentration and BCOD/TN were the DOPs that had great influences on the optimization objectives. Under the conditions of DO concentration = 0.5 mg/L, BCOD/TN = 5.21, and SRT = 15 days, satisfactory effluent quality could be obtained (concentrations of NH4+-N, TN, and TP in effluent were 1.1 mg/L, 7.0 mg/L, and 0.2 mg/L, respectively), and the operating cost could be reduced by 5.0%. A pilot-scale experiment was used to validate the optimal DOPs. The TN and TP removal efficiencies were improved by 11.0% and 5.0%, respectively, and the annual operating cost could be reduced by 15.0%. In addition, GSA analysis revealed that the changes in the degree of sludge dispersion and sludge hydrolytic parameters would lead to uncertainty in the simulation work when expanding the experimental scale. This study provides a useful method combing ASM2d and statistical analysis for the optimization of the design and operation of WWTPs. Further evaluation of this method under dynamic simulation of full-scale WWTPs is still needed.

Supplementary Materials

The following are available online at https://www.mdpi.com/article/10.3390/w14060940/s1, Figure S1: The picture of the pilot-scale AAO reactor. Figure S2: Fractionation of influent COD for the modeling of the pilot-scale AAO system, Figure S3: Calibration and validation results of the ASM2d in the lab-scale system, Figure S4: Calibration and validation results of the ASM2d in the pilot-scale system, Figure S5: Changes of aeration cost, sludge disposal cost, mixed cost, and chemicals cost before and after process optimization of pilot-scale AAO modeling, Table S1: Influent quality of the model input of the lab-scale AAO system during calibration and validation phases, Table S2: DOPs of the pilot-scale AAO system, Table S3: Influent quality of the model input of the pilot-scale AAO system during calibration and validation phases, Table S4: Simulated results of orthogonal experiment design for removal efficiencies of pollutants and the operating cost, Table S5: Influent quality of the model input in orthogonal experiments and the optimization experiments of DOPs, Table S6: The information on parameters concerned in GSA, Table S7: LSA of stoichiometric and kinetic parameters in the ASM2d concerning effluent quality based on lab-scale experiment, Table S8: Calculation formulas of the operating cost, Table S9: The result of ANOVA analysis for RENH4, Table S10: The result of ANOVA analysis for RETN, Table S11: The result of ANOVA analysis for RETP, Table S12: The result of ANOVA analysis for RECOD, Table S13: The result of ANOVA analysis for the operating cost, Table S14: Simulated results of RSM experiment based on Box–Behnken design for removal efficiencies of pollutants and the operating cost, Table S15: Regression quadratic equations for the studied responses, Table S16: ANOVA results for responding quadratic models, Table S17: Default and adjusted values of parameters in the ASM2d calibrated based on the pilot-scale AAO system, Table S18: Absolute t-value of the top 10 parameters that had significant influence on RENH4, RETN and the operating cost, Text S1: Operation files of ANOVA analysis, Text S2: ANOVA analysis of regression quadratic equation obtained from RSM, Text S3: References for Supplementary Material.

Author Contributions

Z.W. was involved in validation, writing—original draft preparation and formal analysis. Y.L. was involved in conceptualization, funding acquisition, writing—review and editing and supervision. Z.Z. was involved in writing—review and editing and project administration. W.G. was involved in software. T.J. was involved in experiment, validation, and developing the models. P.M. was involved in investigation. All authors have read and agreed to the published version of the manuscript.

Funding

This work was supported by the Fundamental Research Funds for the Central Universities, China (No. 22120190202).

Conflicts of Interest

The authors declare no conflict of interest.

Abbreviations

WWTPsWastewater treatment plants
DODissolved oxygen
DOPsDesign and operational parameters
ASMsActivated sludge models
IWAInternational Water Association
Vanx/Vaer ratioThe volume ratio of the anoxic tank to the aerobic tank
SRTSludge retention time
HRTHydraulic retention time
IRRInternal recirculation ratio
RSMResponse surface methodology
TNTotal nitrogen
ANOVAAnalysis of variance
AAOAnaerobic-anoxic-oxic
ERRExternal recirculation ratio
BCOD/TNRatio of biodegradable chemical oxygen demand to total nitrogen
CODChemical oxygen demand
LSALocal sensitivity analysis
CRSCentral relative sensitivity
TICTheil inequality coefficient
TPTotal phosphorus
GSAGlobal sensitivity analysis
PDFProbability density function
MLSSMixed liquor suspended solid
MLVSSMixed liquor volatile suspended solid
BOD5Biochemical oxygen demand for 5 days
PAOsPhosphorus accumulating organisms
EDSCEffluent discharge standard of China
RDRelative deviation
SRCStandard regression coefficient

References

  1. Herrera-Navarrete, R.; Arellano-Wences, H.J.; Colin-Cruz, A.; Sampedro-Rosas, M.L.; Rosas-Acevedo, J.L.; Rodriguez-Herrera, A.L. Thematic and Geographical Trend in Scientific Research Applied in Municipal Wastewater Treatment Plants: An Overview. Water Air Soil Pollut. 2021, 232, 318. [Google Scholar] [CrossRef]
  2. Povoa, P.; Oehmen, A.; Inocencio, P.; Matos, J.S.; Frazao, A. Modelling energy costs for different operational strategies of a large water resource recovery facility. Water Sci. Technol. 2017, 75, 2139–2148. [Google Scholar] [CrossRef]
  3. Sean, W.-Y.; Chu, Y.-Y.; Mallu, L.L.; Chen, J.-G.; Liu, H.-Y. Energy consumption analysis in wastewater treatment plants using simulation and SCADA system: Case study in northern Taiwan. J. Clean. Prod. 2020, 276, 124248. [Google Scholar] [CrossRef]
  4. Mihalache, S.F.; Carbureanu, M. Monitoring and Decision Making Support Systems for Activated Sludge Process. In Proceedings of the 6th International Symposium on Electrical and Electronics Engineering (ISEEE), Galati, Romania, 18–20 October 2019. [Google Scholar]
  5. Novotny, V.; Jones, H.; Capodaglio, A. Time series analysis models of activated sludge plants. Water Sci. Technol. 1991, 23, 1107–1116. [Google Scholar] [CrossRef]
  6. Raduly, B.; Gernaey, K.V.; Capodaglio, A.G.; Mikkelsen, P.S.; Henze, M. Artificial neural networks for rapid WWTP performance evaluation: Methodology and case study. Environ. Model. Softw. 2007, 22, 1208–1216. [Google Scholar] [CrossRef]
  7. Gaya, M.S.; Wahab, N.A.; Sam, Y.M.; Razali, M.C.; Samsudin, S.I. Neuro-Fuzzy Modelling of Wastewater Treatment System. In Proceedings of the IEEE International Conference on Control System, Computing and Engineering (ICCSCE), Penang, Malaysia, 23–25 November 2012. [Google Scholar]
  8. Henze, M.; Gujer, W.; Mino, T.; van Loosdrecht, M.C.M. Activated Sludge Models ASM1, ASM2, ASM2d and ASM3; IWA Publishing: London, UK, 2000; p. 121. [Google Scholar]
  9. Wu, X.; Yang, Y.; Wu, G.; Mao, J.; Zhou, T. Simulation and optimization of a coking wastewater biological treatment process by activated sludge models (ASM). J. Environ. Manag. 2016, 165, 235–242. [Google Scholar] [CrossRef]
  10. Shourjeh, M.S.; Kowal, P.; Drewnowski, J.; Szelas, B.; Szaja, A.; Lagod, G. Mutual Interaction between Temperature and DO Set Point on AOB and NOB Activity during Shortcut Nitrification in a Sequencing Batch Reactor in Terms of Energy Consumption Optimization. Energies 2020, 13, 5808. [Google Scholar] [CrossRef]
  11. Zhu, G.C.; Lu, Y.Z.; Xu, L.R. Effects of the carbon/nitrogen (C/N) ratio on a system coupling simultaneous nitrification and denitrification (SND) and denitrifying phosphorus removal (DPR). Environ. Technol. 2020, 42, 3048–3054. [Google Scholar] [CrossRef]
  12. Bonassa, G.; Bolsan, A.C.; Hollas, C.E.; Venturin, B.; Candido, D.; Chini, A.; De Pra, M.C.; Antes, F.G.; Campos, J.L.; Kunz, A. Organic carbon bioavailability: Is it a good driver to choose the best biological nitrogen removal process? Sci. Total Environ. 2021, 786, 147390. [Google Scholar] [CrossRef]
  13. Rong, Y.; Chang, H.; Wu, C.; Zhang, W.; Jin, P. Effects of aeration partition ratio on nitrogen removal performance and the microbial community in the A2/O process. Desalin. Water Treat. 2019, 147, 326–333. [Google Scholar] [CrossRef]
  14. Duyar, A.; Ciftcioglu, V.; Cirik, K.; Civelekoglu, G.; Urus, S. Treatment of landfill leachate using single-stage anoxic moving bed biofilm reactor and aerobic membrane reactor. Sci. Total Environ. 2021, 776, 145919. [Google Scholar] [CrossRef]
  15. Xie, W.-M.; Zhang, R.; Li, W.-W.; Ni, B.-J.; Fang, F.; Sheng, G.-P.; Yu, H.-Q.; Song, J.; Le, D.-Z.; Bi, X.-J.; et al. Simulation and optimization of a full-scale Carrousel oxidation ditch plant for municipal wastewater treatment. Biochem. Eng. J. 2011, 56, 9–16. [Google Scholar] [CrossRef]
  16. Cao, J.; Yang, E.; Xu, C.; Zhang, T.; Xu, R.; Fu, B.; Feng, Q.; Fang, F.; Luo, J. Model-based strategy for nitrogen removal enhancement in full-scale wastewater treatment plants by GPS-X integrated with response surface methodology. Sci. Total Environ. 2021, 769, 144851. [Google Scholar] [CrossRef]
  17. Dargahi, A.; Vosoughi, M.; Mokhtari, S.A.; Vaziri, Y.; Alighadri, M. Electrochemical degradation of 2,4-Dinitrotoluene (DNT) from aqueous solutions using three-dimensional electrocatalytic reactor (3DER): Degradation pathway, evaluation of toxicity and optimization using RSM-CCD. Arab. J. Chem. 2022, 15, 103648. [Google Scholar] [CrossRef]
  18. Wang, F.; Huang, G.H.; Fan, Y.; Li, Y.P. Robust Subsampling ANOVA Methods for Sensitivity Analysis of Water Resource and Environmental Models. Water Resour. Manag. 2020, 34, 3199–3217. [Google Scholar] [CrossRef]
  19. Latha, B.; Senthilkumar, V.S. Modeling and Analysis of Surface Roughness Parameters in Drilling GFRP Composites Using Fuzzy Logic. Mater. Manuf. Processes 2010, 25, 817–827. [Google Scholar] [CrossRef]
  20. Shokoohi, R.; Jafari, A.J.; Dargahi, A.; Torkshavand, Z. Study of the efficiency of bio-filter and activated sludge (BF/AS) combined process in phenol removal from aqueous solution: Determination of removing model according to response surface methodology (RSM). Desalin. Water Treat. 2017, 77, 256–263. [Google Scholar] [CrossRef]
  21. Thirugnanasambandham, K.; Sivakumar, V.; Shine, K. Performance evaluation of chemical coagulation process to treat bagasse wastewater: Modeling and optimization. Pol. J. Chem. Technol. 2016, 18, 99–104. [Google Scholar] [CrossRef] [Green Version]
  22. Daneshgar, S.; Vanrolleghem, P.A.; Vaneeckhaute, C.; Buttafava, A.; Capodaglio, A.G. Optimization of P compounds recovery from aerobic sludge by chemical modeling and response surface methodology combination. Sci. Total Environ. 2019, 668, 668–677. [Google Scholar] [CrossRef]
  23. Roeleveld, P.J.; van Loosdrecht, M.C.M. Experience with guidelines for wastewater characterisation in The Netherlands. Water Sci. Technol. 2002, 45, 77–87. [Google Scholar] [CrossRef]
  24. Claeys, F.H.A. A Generic Software Framework for Modelling and Virtual Experimentation with Complex Biological Systems. Ph.D. Thesis, Ghent University, Ghent, Belgium, January 2008. [Google Scholar]
  25. Liwarska-Bizukojc, E.; Olejnik, D.; Biernacki, R.; Ledakowicz, S. Calibration of a complex activated sludge model for the full-scale wastewater treatment plant. Bioprocess Biosyst. Eng. 2011, 34, 659–670. [Google Scholar] [CrossRef] [Green Version]
  26. Acosta-Cordero, L.; Carrera-Chapela, F.; Montalvo, S.; Guerrero, L.; Palominos, N.; Borja, R.; Huilinir, C. Modeling of the effect of zeolite concentration on the biological nitrification process in the presence of sulfide and organic matter. J. Environ. Sci. Health Part A-Toxic/Hazard. Subst. Environ. Eng. 2020, 56, 123–135. [Google Scholar] [CrossRef] [PubMed]
  27. Abe, J.O.; Popoola, O.M.; Popoola, A.P.I.; Ajenifuja, E.; Adebiyi, D.I. Application of Taguchi design method for optimization of spark plasma sintering process parameters for Ti-6Al-4V/h-BN binary composite. Eng. Res. Express 2019, 1, 025043. [Google Scholar] [CrossRef] [Green Version]
  28. Zhang, Q.; Feng, J.; Zhang, Q.; Peng, X. Performance prediction and evaluation of the scroll-type hydrogen pump for FCVs based on CFD-Taguchi method. Int. J. Hydrog. Energy 2019, 44, 15333–15343. [Google Scholar] [CrossRef]
  29. Tang, T.; Cao, S.; Xi, C.; Chen, Z. Multifunctional magnetic chitosan-graphene oxide-ionic liquid ternary nanohybrid: An efficient adsorbent of alkaloids. Carbohydr. Polym. 2021, 255, 117338. [Google Scholar] [CrossRef]
  30. Hwangbo, S.; Al, R.; Chen, X.; Sin, G. Integrated Model for Understanding N2O Emissions from Wastewater Treatment Plants: A Deep Learning Approach. Environ. Sci. Technol. 2021, 55, 2143–2151. [Google Scholar] [CrossRef]
  31. Sin, G.; Gernaey, K.V.; Neumann, M.B.; van Loosdrecht, M.C.; Gujer, W. Global sensitivity analysis in wastewater treatment plant model applications: Prioritizing sources of uncertainty. Water Res. 2011, 45, 639–651. [Google Scholar] [CrossRef]
  32. APHA (American Public Health Association). Standard Methods for the Examination of Water and Wastewater, 21st ed.; APHA: Washington, DC, USA, 2005. [Google Scholar]
  33. Drewnowski, J.; Makinia, J.; Kopec, L.; Fernandez-Morales, F.-J. Modelization of Nutrient Removal Processes at a Large WWTP Using a Modified ASM2d Model. Int. J. Environ. Res. Public Health 2018, 15, 2817. [Google Scholar] [CrossRef] [Green Version]
  34. He, Q.; Song, J.; Zhang, W.; Gao, S.; Wang, H.; Yu, J. Enhanced simultaneous nitrification, denitrification and phosphorus removal through mixed carbon source by aerobic granular sludge. J. Hazard. Mater. 2020, 382, 121043. [Google Scholar] [CrossRef]
  35. De Arana-Sarabia, M.E.; Vasiliadou, I.A.; Vitanza, R.; Cortesi, A.; Gallo, V. Mathematical Simulation and Validation of a Wastewater Treatment Plant in Northern Italy. Environ. Eng. Sci. 2018, 35, 1136–1147. [Google Scholar] [CrossRef]
  36. Lu, X.; Pereira, T.D.S.; Al-Hazni, H.E.; Majtacz, J.; Zhou, Q.; Xie, L.; Makinia, J. Model-Based Evaluation of N2O Production Pathways in the Anammox-Enriched Granular Sludge Cultivated in a Sequencing Batch Reactor. Environ. Sci. Technol. 2018, 52, 2800–2809. [Google Scholar] [CrossRef] [PubMed]
  37. Chen, W.; Dai, H.; Han, T.; Wang, X.; Lu, X.; Yao, C. Mathematical modeling and modification of a cycle operating activated sludge process via the multi-objective optimization method. J. Environ. Chem. Eng. 2020, 8, 104470. [Google Scholar] [CrossRef]
  38. Jeppsson, U. Modelling Aspects of Wastewater Treatment Processes; Lund Institute of Technology: Lund, Sweden, 1996. [Google Scholar]
  39. Nair, A.M.; Fanta, A.; Haugen, F.A.; Ratnaweera, H. Implementing an Extended Kalman Filter for estimating nutrient composition in a sequential batch MBBR pilot plant. Water Sci. Technol. 2019, 80, 317–328. [Google Scholar] [CrossRef] [PubMed] [Green Version]
  40. Mannina, G.; Cosenza, A.; Viviani, G. Uncertainty assessment of a model for biological nitrogen and phosphorus removal: Application to a large wastewater treatment plant. Phys. Chem. Earth Parts A/B/C 2012, 42–44, 61–69. [Google Scholar] [CrossRef]
  41. Li, J.; Zhang, L.; Peng, Y.; Zhang, Q. Effect of low COD/N ratios on stability of single-stage partial nitritation/anammox (SPN/A) process in a long-term operation. Bioresour. Technol. 2017, 244, 192–197. [Google Scholar] [CrossRef]
  42. Liu, G.; Wang, J. Quantifying the chronic effect of low DO on the nitrification process. Chemosphere 2015, 141, 19–25. [Google Scholar] [CrossRef]
  43. Fazal, S.; Gao, L.; Zhong, Z.; Liu, Z.; Zhu, L.; Zhang, B. The competition among heterotrophs under anoxic conditions for carbon source. Desalin. Water Treat. 2018, 105, 189–198. [Google Scholar] [CrossRef]
  44. Liu, G.; Wang, J. Enhanced removal of total nitrogen and total phosphorus by applying intermittent aeration to the Modified Ludzack-Ettinger (MLE) process. J. Clean. Prod. 2017, 166, 163–171. [Google Scholar] [CrossRef]
  45. Onnis-Hayden, A.; Majed, N.; Li, Y.; Rahman, S.M.; Drury, D.; Risso, L.; Gu, A.Z. Impact of solid residence time (SRT) on functionally relevant microbial populations and performance in full-scale enhanced biological phosphorus removal (EBPR) systems. Water Environ. Res. 2020, 92, 389–402. [Google Scholar] [CrossRef]
  46. Ministry of Ecology and Environment of the People’s Republic of China. Discharge Standard of Pollutants for Municipal Wastewater Treatment Plant. Available online: http://www.mee.gov.cn/ywgz/fgbz/bz/bzwb/shjbh/swrwpfbz/200307/t20030701_66529.shtml (accessed on 25 November 2021).
  47. Sun, Y.; Zhang, Q.; Li, X.; Chen, Y.; Peng, Y. Nutrients removal by interactions between functional microorganisms in a continuous-flow two-sludge system (AAO-BCO): Effect of influent COD/N ratio. Sci. Total Environ. 2021, 793, 148581. [Google Scholar] [CrossRef]
  48. Hvala, N.; Vrecko, D.; Burica, O.; Strazar, M.; Levstek, M. Simulation study supporting wastewater treatment plant upgrading. Water Sci. Technol. 2002, 46, 325–332. [Google Scholar] [CrossRef] [PubMed]
  49. Koch, G.; Kuhni, M.; Rieger, L.; Siegrist, H. Calibration and validation of an ASM3-based steady-state model for activated sludge systems—Part II: Prediction of phosphorus removal. Water Res. 2001, 35, 2246–2255. [Google Scholar] [CrossRef]
  50. David, H.F.; Liu, B.G.L. Wastewater Treatment; CRC Press: Boca Raton, FL, USA, 2020; pp. 125–131. [Google Scholar]
  51. Anna Mikola, J.R.; Kiuru, H. Diurnal Flow Equalization and Prefermentation Using Primary Clarifiers in a BNR Plant. Water Environ. Fed. 2007, 1, 1–13. [Google Scholar] [CrossRef]
  52. Regmi, P.; Stewart, H.; Amerlinck, Y.; Arnell, M.; Garcia, P.J.; Johnson, B.; Maere, T.; Miletic, I.; Miller, M.; Rieger, L.; et al. The future of WRRF modelling—Outlook and challenges. Water Sci. Technol. 2019, 79, 3–14. [Google Scholar] [CrossRef]
Figure 1. Fractionation of influent COD for the modeling of the lab-scale AAO system.
Water 14 00940 g001
Figure 2. Simulated results for the removal efficiencies of NH4+-N(RENH4), TN(RETN), TP(RETP), COD(RECOD), and the operating cost with the change of (a) DO concentration; (b) SRT; (c) BCOD/TN; (d) Vanx/Vaer ratio. The initial values of the DOPs were as follows: DO = 1.0 mg/L, SRT = 15 days, BCOD/TN = 4.07, Vanx/Vaer ratio = 1.0.
Water 14 00940 g002
Figure 3. Pareto diagram of removal efficiencies of (a) NH4+-N, (b) TN, (c) TP, (d) COD, and (e) the operating cost. The filled rectangles represent the contribution rates of DOPs, the triangles represent cumulative contribution rates, and the horizontal dotted lines represent reference lines.
Water 14 00940 g003aWater 14 00940 g003b
Figure 4. Response surface curves and contour maps of the quadratic models for (a) the operating cost and removal efficiencies of (b) NH4+-N, (c) TN, and (d) TP. Actual factors are as follows: (a) BCOD/TN = 5.05; (b) BCOD/TN = 5.12; (c) SRT = 15 d; (d) SRT = 15 d.
Water 14 00940 g004
Table 1. DOPs of the lab-scale AAO system.
Calibration PhaseValidation Phase IValidation Phase II
Vanx/Vaer ratio1:31:33:1
Addition of sodium acetate (COD mg/L)0120150
DO concentration (mg/L)2.02.02.0
Average temperature (°C)22.020.018.5
Influent flowrate (L/day)202020
Duration (day)282435
Table 2. Default and adjusted values of 11 key parameters in the ASM2d based on the lab-scale AAO system.
ParametersCharacterizationUnitDefault Value [8]Values Used in This StudyGeneral Range
YHYield for heterotrophic biomassgCOD/gCOD0.6250.70.5–0.67 [36]
bAUTDecay coefficient for autotrophic biomassday−10.150.140.05–0.2 [38]
µHMaximum specific growth rate for heterotrophic biomassday−1652–6.25 [36]
KNH,AUTHalf saturation coefficient for ammonium (substrate) of autotrophic biomassgSNH/m310.680.1–4 [39]
KNONitrate half saturation coefficientgSNO/m30.50.550.1–1 [39]
KO,AUTHalf saturation coefficient for oxygen of autotrophic biomassgO2/m30.50.40.1–4 [39]
ηNO,hetAnoxic growth reduction coefficient of heterotrophic biomass-0.80.550.55–0.85 [8]
QPPRate constant for storage of polyphosphateday−11.51.2751–1.5 [40]
ηNO,hydAnoxic hydrolysis reduction factor-0.60.550.55~0.9 [8]
bHRate constant for lysis and decay of heterotrophic biomassday−10.40.450.02–1.44 [38]
µAUTMaximum specific growth rate for autotrophic biomassday−110.790.2–1.2 [37]
Table 3. The TIC values concerning effluent quality indexes and MLSS of the aerobic zone of ASM2d in the lab-scale AAO system.
PhaseNH4+-NTNPO43−-PTPCODMLSS
Calibration0.080.120.060.050.170.10
Validation I0.070.260.190.150.080.10
Validation II0.170.140.440.240.200.07
Table 4. Value range of DOPs in optimization experiments.
DOPsDO Concentration
(mg/L)
BCOD/TNSRT
(Day)
Value range0.5–2.04.07–6.1610–25
Table 5. Comparison between the predicted results by RSM and ASM2d on the WEST® platform (Plan A and Plan B) as well as the simulated results of ASM2d in different scales under the optimal conditions.
DOPsOperation Results
Plan A
SRT (day)DO concentration (mg/L)BCOD/TNRENH4RETNRETPOperating cost ($/m3/day)
RSM250.55.2297.7%78.2%93.6%3.54
WEST250.55.2297.7%78.6%89.8%3.56
RD---0.05%0.52%4.19%0.56%
Plan B
RSM150.55.2195.2%76.1%93.4%3.60
WEST150.55.2196.2%76.8%92.8%3.61
RD---1.03%0.90%0.68%0.28%
WEST (in the lab-scale system)150.55.2196.2%76.8%92.8%3.61
WEST (in the pilot-scale system)150.55.2194.6%66.1%53.4%3.34
RD---1.66%16.23%73.92%8.08%
Publisher’s Note: MDPI stays neutral with regard to jurisdictional claims in published maps and institutional affiliations.

