
Conservation Genetics of Mediterranean Brown Trout in Central Italy (Latium): A Multi-Marker Approach
by
 , ,
, ,
Anna Rita Rossi
1 ,
,
Lorenzo Talarico
2,3,* ,
,
Gerardo Petrosino
1,
Simone Crescenzo
1 and
Lorenzo Tancioni
2 1
Department of Biology and Biotechnology “C. Darwin”, Sapienza University of Rome, 00161 Rome, Italy
2
Laboratory of Experimental Ecology and Aquaculture, Department of Biology, University of Rome Tor Vergata, 00133 Rome, Italy
3
Italian National Institute for Environmental Protection and Research (ISPRA), 00144 Rome, Italy
*
Author to whom correspondence should be addressed.
Water 2022, 14(6), 937; https://doi.org/10.3390/w14060937
Submission received: 20 January 2022
/
Revised: 11 March 2022
/
Accepted: 15 March 2022
/
Published: 17 March 2022
(This article belongs to the Special Issue Biodiversity Conservation and Ecosystem Management in Fresh and Transitional Waters)
Abstract
:Brown trout is considered a complex of incipient species, including several phylogenetic lineages, whose natural distribution in the Mediterranean area has been altered, since the beginning of the 1900s, by massive introductions of domestic strains of Atlantic origin to support fisheries. Introduced trout naturalize in new suitable environments and extensively hybridize with native populations. Here, we characterized putatively neutral and adaptive genetic variability and population structure of Mediterranean brown trout from six river catchments in central peninsular Italy, as revealed by both mitochondrial (Control Region) and nuclear (microsatellites, LDH-C1, major histocompatibility complex) markers. We quantified the admixture of wild populations with hatchery strains and evaluated the effects of domestic trout introductions on shaping population genetics. Our analyses indicated: (1) a composite picture of genetic variability in the area, with the presence of all native Mediterranean trout mitochondrial lineages (“Adriatic”, “Mediterranean”, “marmoratus”), various frequencies of allochthonous genotypes and different rates of introgression among sampling sites; (2) asymmetric mito-nuclear introgression; (3) increasing nuclear marker diversity with increasing levels of admixture across populations; (4) strong population structure coupled with relatively low effective population size. Data allowed the identification of five management units and we propose specific actions to support ongoing and future conservation strategies within the examined area.
1. Introduction
Brown trout (Salmo trutta Linnaeus, 1758) is considered an iconic freshwater fish of remarkable economic value, and one of the most broadly distributed (and stocked) salmonids worldwide. The taxon is characterized by an extraordinary genetic and ecological polymorphism, which has often given rise to local phenotypic morphae [1,2]. Consequently, the nomenclature and systematic status of the taxon have been long debated and are still unresolved [2,3,4]. Brown trout is thus considered a complex of incipient species, including several phylogenetically distinct mitochondrial lineages whose origin and spatial distribution are linked to Pliocene and early Pleistocene climatic fluctuations that affected the distribution range and the dispersal of brown trout [2,5].
Since the middle of the 19th century, stock enhancement plans have carried on the introduction of hatchery-reared specimens of Atlantic origin in various geographic areas, including Italy, to support fisheries [1,6]. In the Mediterranean area, introduced domestic trout extensively hybridize with native trout resulting in the massive introgression of Atlantic genes in wild populations [3,7,8].
Brown trout is nowadays considered one of the world’s 100 top invasive species [9] while, paradoxically, it is also included in the IUCN Red List of threatened species and the European Habitat Directive [10] that prioritize the conservation of native wild populations. Besides hybridization with human-introduced allochthonous trout, native populations are also exposed to various (interplaying) threats, among which are global warming, habitat fragmentation and degradation. Indeed, upward range shift caused by temperature increases [11] and the occurrence of physical/hydrological barriers contribute to the genetic isolation and fragmentation of wild populations, which are often small and unstructured—i.e., mostly represented by juveniles and young individuals [12]. These factors eventually can promote the erosion of diversity by genetic drift [13].
Cornerstones of modern conservation genetics are evolutionary significant unit (ESU) and management unit (MU) concepts [14,15], that rely on the genetic distinctiveness of populations along with demographic features [16]. Importantly, adaptive genetic distinctiveness should be also taken into account to exhaustively define ESUs and MUs, since the maintenance of adaptive variation is crucial for optimal and effective conservation strategies [17,18]. The ESU approach has the desirable advantage to circumvent “obstacles” and challenges that controversial taxonomies can cause for conservation and management of taxa [19], as in the case of brown trout [20]. Practically, such a goal can be reached by characterizing the genetic diversity of wild populations through multiple classes of genetic markers, each providing a specific evolutionary perspective—such as recent/historical demography, or selection and (local) adaptation [17]—based on their mechanism of inheritance and their polymorphic information content [21], as applied in some threatened native-Italian freshwater fishes (e.g., [22,23,24]).
In brown trout, fragments of the mitochondrial non-coding Control Region (CR) and various microsatellite arrays have been commonly used to assess neutral genetic diversity across populations. Specifically, the former is primarily employed for the identification of relatively ancient lineages (as defined by [5]), while the latter are extensively used for assessing genetic population structure even at the fine spatial scale [25,26,27,28]. When combined, they provide a useful tool to determine the distinctiveness of populations [29]. On the other hand, the nuclear Lactate Dehydrogenase C1 gene (LDH-C1), whose alleles are diagnostic of Mediterranean-native and Atlantic lineages [30], conveniently provides estimates of the amount of introgression from domestic lineages in wild Mediterranean populations (see Section 2 for details). Conversely, adaptive variation can be inferred through loci that are somehow linked to fitness-related traits such as the highly polymorphic genes of the major histocompatibility complex (MHC), which are directly involved in the immune response against parasites [31]. Specifically, signatures of historical and/or current selection have been demonstrated for the MHC-DAB gene in brown trout (e.g., [32,33,34]), hence making it a candidate locus to reveal natural adaptive variation. However, to the best of our knowledge, brown trout ESUs/MUs have never been defined using both neutral and adaptive marker classes to date.
Genetic studies targeting wild Italian brown trout populations frequently revealed remarkable levels of admixture between native and Atlantic (domestic) strains [6,29,35,36]. Most of the Sardinian populations provide an exception [29], as well as some mainland populations isolated by natural and/or artificial barriers preventing fish dispersal [6]. The current distribution of allochthonous brown trout and the admixture degree in wild populations correlate with geological and climate factors, which differently acted in Eastern and Western Alps, Apennines, Sardinia, and Sicily areas [37].
In the peninsular area, a high and complex genetic diversity of brown trout populations has been reported around the Tyrrhenian Sea [29] with central Italy characterized by the coexistence of populations retaining unique genetic features [26,38,39]. In this area, brown trout inhabits mostly mountain freshwaters and, sporadically, lowland cold waters. Previous studies pointed out the presence of all the native Mediterranean mitochondrial lineages (Adriatic “AD”, Mediterranean “ME” and marmoratus “MA”), together with Atlantic haplotypes (“AT” lineage) of domestic origin, the abundance of which varies from site to site [6,25,26,39].
In this research, we focused on the central Italy “hotspot” of Mediterranean brown trout genetic diversity. We aimed at characterizing neutral and adaptive genetic variability and population structure as revealed by multiple markers classes (microsatellites, MHC-DAB, CR) while quantifying admixture with domestic trout (as assessed by the LDH-C1 gene). Additionally, we evaluated the effects of natural (drainage basin, altitude) and anthropogenic (LDH-C1-based admixture) variables to shape population genetic diversity and structuring. Finally, based on our results, we define MUs and propose specific actions to support ongoing and future conservation within the examined area.
2. Materials and Methods
2.1. Study Area, Sample Collection, and DNA Extraction
During August–October 2019, overall 175 brown trout were caught by electrofishing and released after taking a small fin clip. We gathered specimens from six chosen river catchments (seven sampling locations) covering the major drainage basins in central Italy (Figure 1) and/or showing remarkable hydrographic and ecological variability (Table 1). Fin clips were preserved in 99.8% ethanol at −20 °C, and then genomic DNA was extracted following a salt-extraction protocol [40].
2.2. Amplification and Genotyping of Mitochondrial and Nuclear Loci
We used a mitochondrial marker and various categories of nuclear loci to comprehensively assess both neutral and adaptive genetic diversity of wild populations and estimate admixture with domestic lineages.
Firstly, the mitochondrial Control Region (CR) was amplified with primer pair PST and FST, following protocols reported in [41], to identify maternal lineages. Amplicons were purified and forward-sequenced by an external service to ultimately obtain a fragment of 544–545 bp. Sequences were visualized and manually corrected using the online software Chromas 2.6.6 available at http://www.technelysium.com.au, accessed on 20 September 2021) and aligned in MEGA 7 [42] with the Clustal W algorithm. We retrieved CR haplotypes using DnaSp 6 [43] and assigned them to major brown trout lineages (sensu [5]) by phylogeny—a Neighbor-Joining tree was built in MEGA 7 including representative sequences of lineages AD, MA, ME, and AT lineages.
Secondly, to deeply characterize population diversity, we genotyped individuals at 11 polymorphic microsatellite loci (STR), namely STR60 and STR73 [44], SSA85 [45], SSOSL417 [46], SSA410UOS and SSA408UOS [47], SSSP2213 [48], OMM1064 [49], SSAD190 [50], Oneμ2 [51], SSA103NVH [52]—see supporting information provided in Talarico et al. (2021) for PCR-amplification and genotyping procedures of STR loci. Note that STR and LDH-C1 profiles of a subset of individuals have been already published in [34]; data archived in Dryad doi.org/10.5061/dryad.xsj3tx9fg), although used for purposes other than the present study.
Thirdly, individuals were typed for the LDH-C1 gene through the RFLP method detailed in [30] that is routinely used to distinguish between the LDH-C1*90 allele (that is widely distributed in wild brown trout populations from northern Europe and, more importantly, it is fixed within European hatchery stocks of brown trout) and the LDH-C1*100 allele (occurring in wild native populations from the Mediterranean area), thus allowing to estimate admixture between native and domestic lineages.
Lastly, in the final dataset, we included genotypes of the major histocompatibility complex class II DAB locus (hereafter MHC-DAB) for a subset of 156 trout to account for non-neutral genetic variation, as there was evidence for historical and contemporary positive/balancing selection on this gene (data from [34]).
2.3. Population Genetic Diversity and Relationship with Introgression from Domestic Trout
In GenePop on the Web [53] we tested for departures from Hardy–Weinberg expectations (probability test and Markov chain method with default parameters) for each nuclear marker (STR loci, LDH-C1, and MHC-DAB), and for linkage disequilibrium between pairs of loci across populations. In both cases, p-values were Bonferroni-adjusted for multiple testing. We estimated the frequency of null alleles with the EM algorithm implemented in FreeNA [54].
Typical indices of population polymorphism were obtained in Arlequin 3.5 [55]: the number of alleles (A) and private alleles (Ap), the expected (He) and observed (Ho) heterozygosity for STR loci and the MHC-DAB; the number of haplotypes (H) and private haplotypes (Hp), the haplotype diversity (Hd), and the Kimura-2-parameters based nucleotide diversity (π) for the CR. To compare diversity among populations with unequal sample sizes, we also computed allelic and haplotype richness (Ar and Hr) by rarefaction using the allel.rich function of the PopGeneReport package in R [56], setting sample size of 12 (24 alleles) for STR and MHC-DAB, and 14 (haplotypes) for the CR.
The frequency of the LDH-C1*90 allele was calculated for each population as a proxy of the introgression of hatchery genes into native populations. We explored the effects of stocking with domestic brown trout on the genetic diversity of wild native populations by testing the relationship between measures of population diversity (allelic/haplotype richness, expected heterozygosity) and the frequency of the domestic LDH-C1*90 allele. For each marker separately, we fit a non-linear model (second-order polynomial regression) in R, since we expected high diversity associated with intermediate (around 50%) frequency of the LDH-C1*90 allele, i.e., when admixture between native and domestic lineage is maximized.
2.4. Population Structure and Demography
We estimated marker-specific genetic differentiation between population pairs in Arlequin testing significance with 1000 permutations. Differentiation was computed as Nei’s Fst for STR loci and the MHC-DAB, and as Φst (Kimura-2 parameters method) for the CR. Matrices of pairwise genetic distances were then visualized by two-dimensions non-metric multidimensional scaling (NMDS) in Past 4.04 [57]).
To investigate relationships (admixture) among examined populations based on STR loci, we performed a multi-locus Bayesian analysis of population structure in Structure v2.3.4 [58]. We ran the admixture model with correlated allele frequencies and no population origin priors (500,000 iterations after a burn-in period of 200,000 iterations) five times for each K value in the range 1–8. Results of replicated runs were combined with Clumpak [59]. To define the optimal number of clusters (K), we evaluated both the highest log probability of K (LnP method; [58]) and the highest rate of change in LnP between successive K (ΔK method; [60] as implemented in StructureSelector [61].
Additionally, we ran the discriminant analysis of principal components (Dapc) in the R-package Adegenet v1.3 [62] to identify genetic clusters, as this multivariate approach does not rely on genetic assumptions [63]. We first visually examined the pattern of Bayesian Information Criterion (BIC) values in the range 1–8 clusters (K) using the find.cluster function (K-means clustering on PCA-transformed data). After choosing the optimal one(s), we ran the actual discriminant analysis (dapc function: Principal Coordinate retained = 90; discriminant functions retained = 3) and obtained membership probabilities of each individual for the K groups previously identified.
The Geneclass v2.0 software [64] was used to compute the probability that each individual belonged to each reference population. The analysis was performed using the Bayesian assignment criterion of [65] and a Monte Carlo resampling algorithm with 10,000 simulated individuals and setting the assigned threshold at 0.05.
The analysis of molecular variance (AMOVA) was used to test whether the ecology and geography of sampling localities contribute to explaining the partitioning of genetic variation within and between groups of coherent populations. Specifically, we tested three a priori hypotheses: (1) panmixia (all populations grouped); (2) differentiation between mountain (elevation > 650 m above the sea level, namely MEL, SIM1, SIM2, and TRO) and lowland (<300 m above the sea level, namely CAR, RAP, and SCR) populations, since the elevation provides a proxy of multiple environmental and ecologic variables (e.g., fish assemblage, sediment granulometry, water temperature, slope); (3) differentiation between unrelated major drainage basins as shown in Figure 1 and Table 1 (TRO vs. SIM1/SIM2 vs. SCR vs. MEL/CAR/RAP). AMOVAs were performed in Arlequin (10,000 permutations) for STR loci, the MHC-DAB and the CR (setting Kimura-2 parameters distance) separately.
For each population, we inferred the STR-based effective population size (Ne) according to the sibship assignment method implemented in Colony v. 2.0.0.6 [66] without information on parental genotypes. We assumed non-random mating and polygamy for both males and females [67] and set no priors and a genotyping error rate of 2% to account for erroneous sizing of alleles and allelic dropouts. Finally, we tested for severe recent population size reductions using Bottleneck 1.2.02 [68], applying the two-phase mutation model (95% stepwise and 5% non-stepwise microsatellite mutations) with 10,000 iterations and assessing significant heterozygote excess with the one-tailed Wilcoxon test.
3. Results
3.1. Mitochondrial and Nuclear Polymorphism and Population Diversity
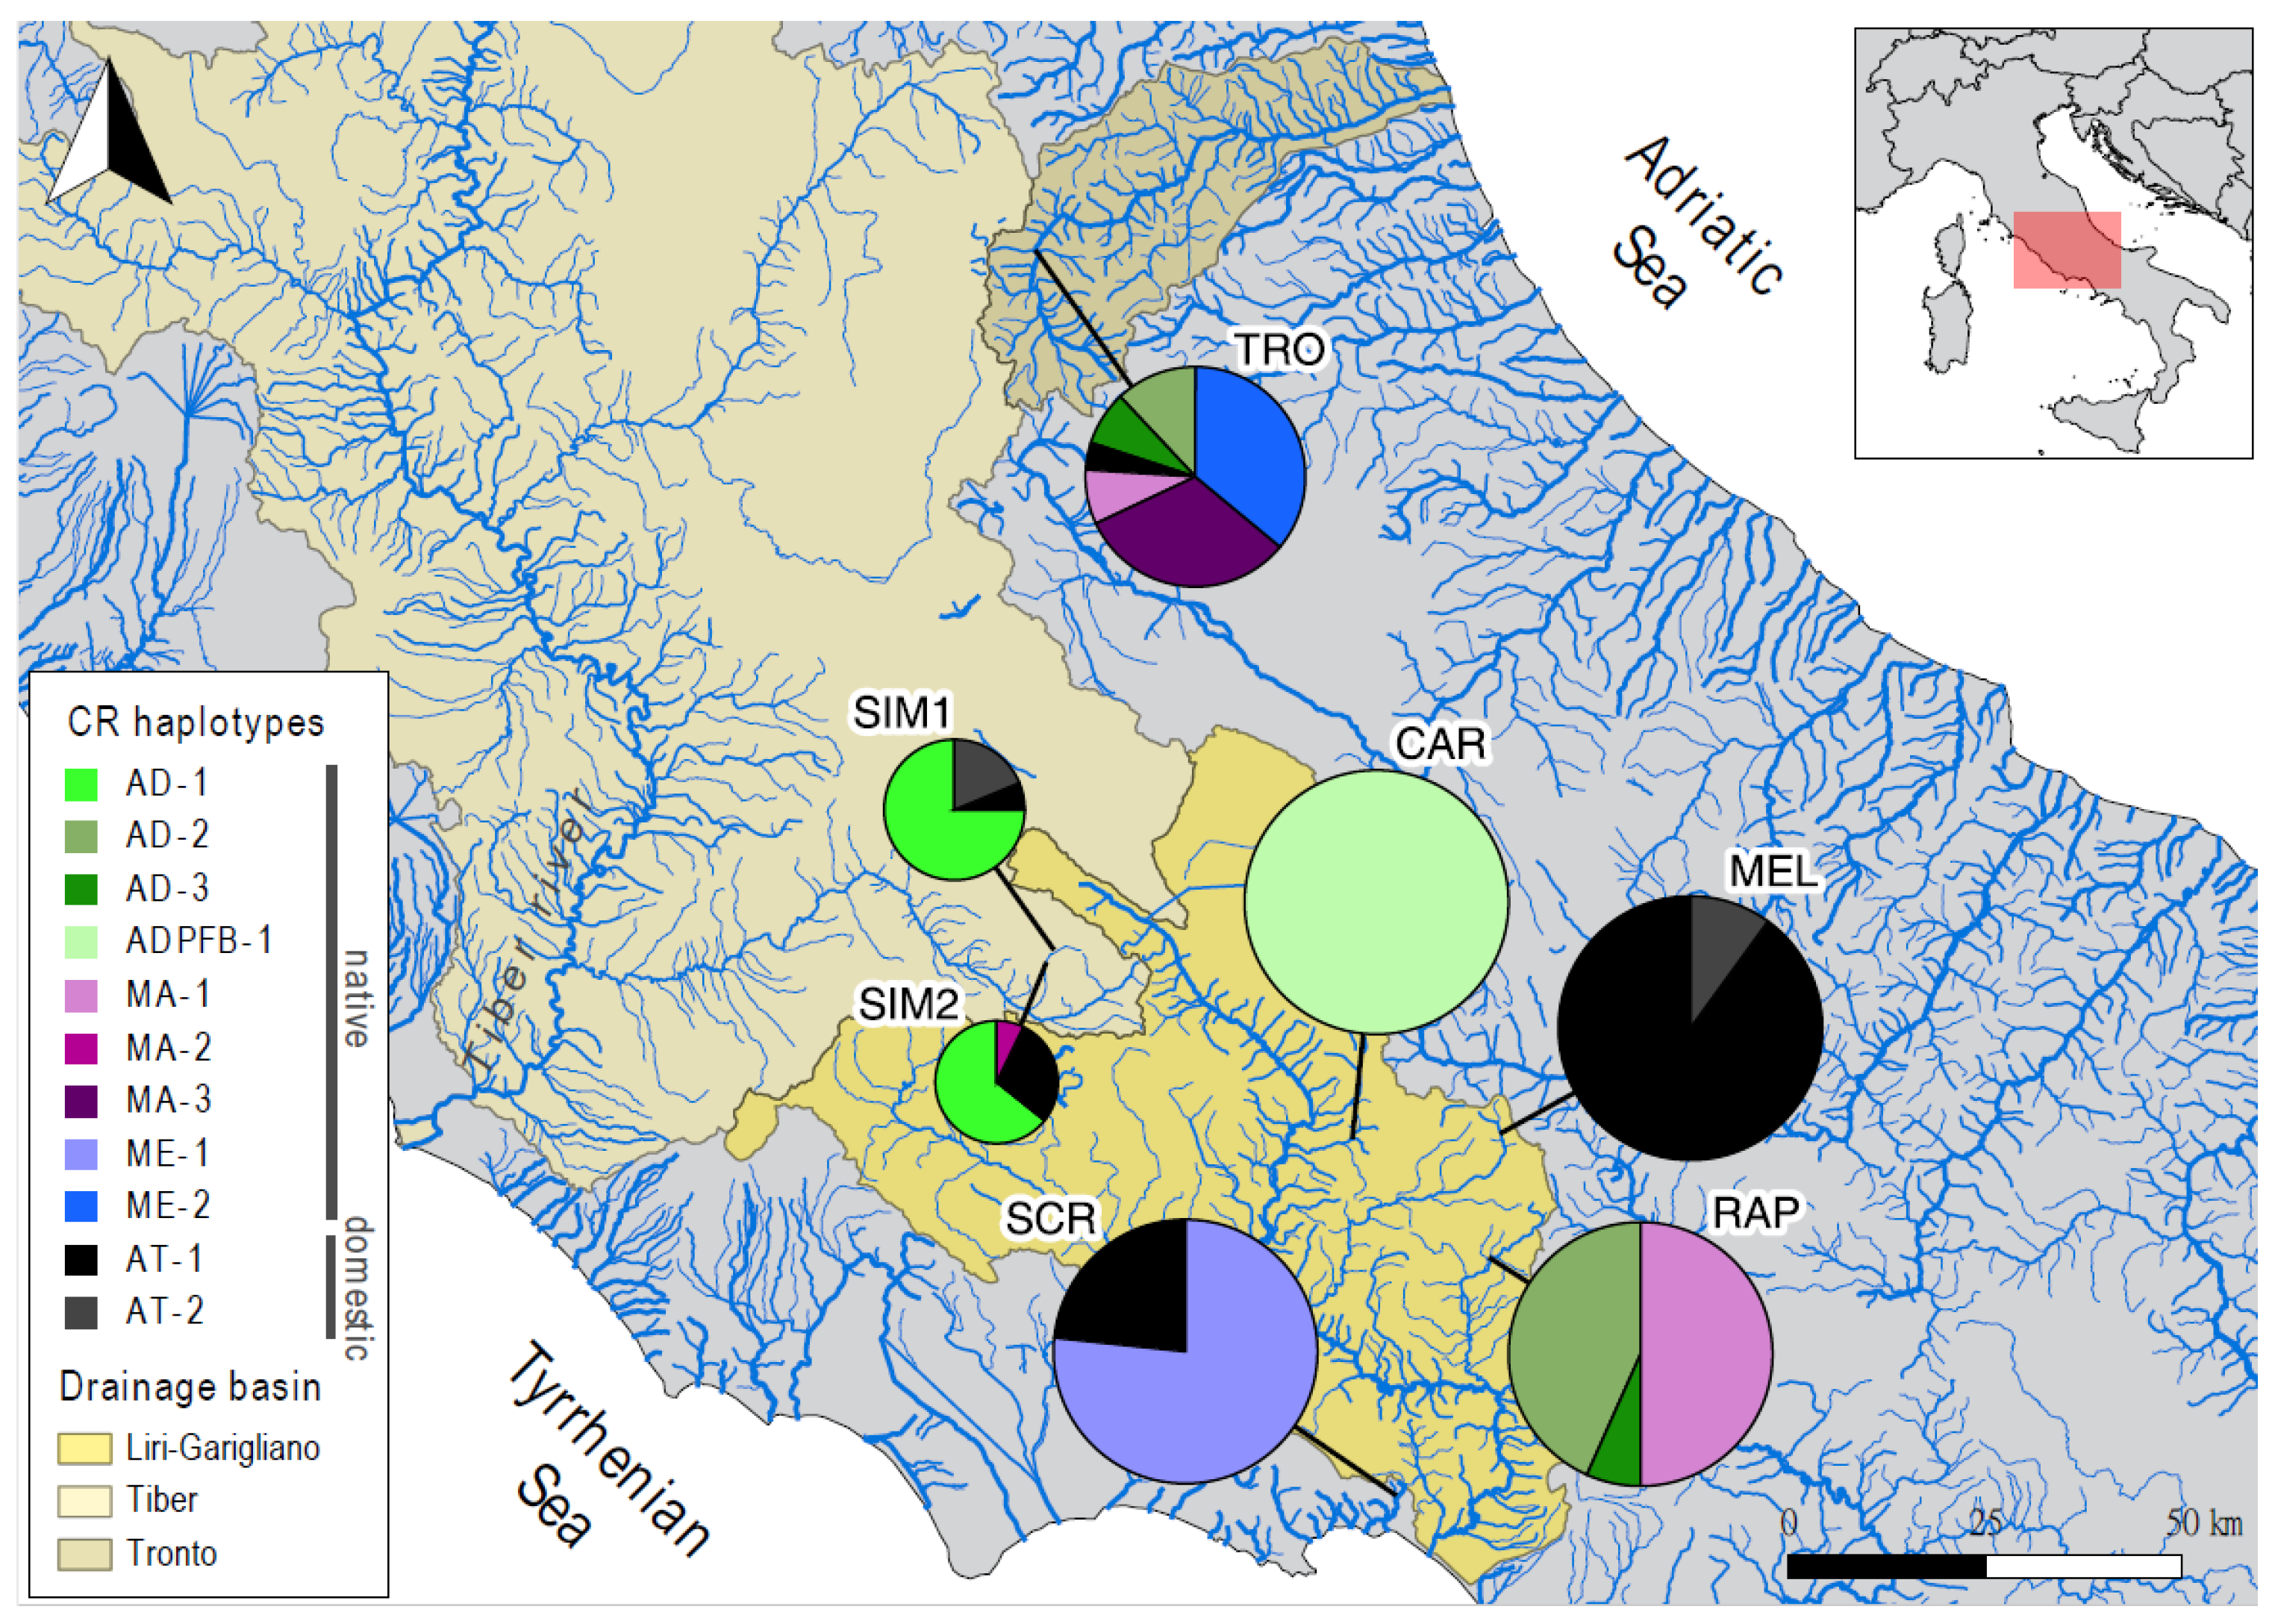
We identified 11 CR haplotypes (GenBank accessions: OL830460-70): nine of them belonged to mitochondrial native lineages (4 AD, 2 ME, and 3 MA), while two belonged to the domestic AT lineage (Figure 1). Nine haplotypes matched with previously identified brown trout CR variants (four of them, AD-3, MA-1, MA-2, and MA-3, were never reported in the Latium region before), while one (ME-2) was new. Frequencies and distribution of native and Atlantic (hatchery) haplotypes across populations are depicted in Figure 1 and reported in Table S1 in the Electronic Supplementary Materials (ESI).
Nuclear markers provided genotype frequencies (see Table S2 in ESI for STR genotypes of an additional 19 individuals not examined in Talarico et al., 2021) that did not deviate significantly from Hardy–Weinberg expectations except for the STR locus SSOSL417 in the Rapido (RAP) site (Table S3 in ESI). The FreeNA analysis revealed no substantial (frequency >20%) or systematic occurrence of null alleles across loci/populations (Table S4 in ESI). There was statistically significant (p < 0.05) linkage disequilibrium in only 5 out of 546 pairwise loci comparisons (three in RAP and two in TRO; Table S5 in ESI), thus suggesting no physical linkage between any loci. Consequently, we safely retained all loci for downstream analyses.
Indices of population genetic diversity are reported in Table 2 for each marker. Specifically, Tronto (TRO)—and to a lesser degree Simbrivio (SIM1 and SIM2)—showed high polymorphism across all marker types. Conversely, low mitochondrial diversity was measured in Carpello (CAR) and Melfa (MEL) where we found a single fixed native haplotype and two domestic haplotypes, respectively (Figure 1). Depleted nuclear DNA variation was revealed in Santa Croce (SCR).
3.2. Extent of Introgression and Its Relationship with Population Diversity
The frequency of the LDH-C1*90 allele varied considerably across populations (range = 5–90%), from roughly native populations (SCR and CAR) to heavily stocked sites (MEL, SIM2) (Table 2; Table S1 in ESI). Note that the Atlantic component detected through the CR was 3–52% lower than that revealed by the LDH-C1 in 5 out of 7 sampling sites (see Table S1 in ESI).
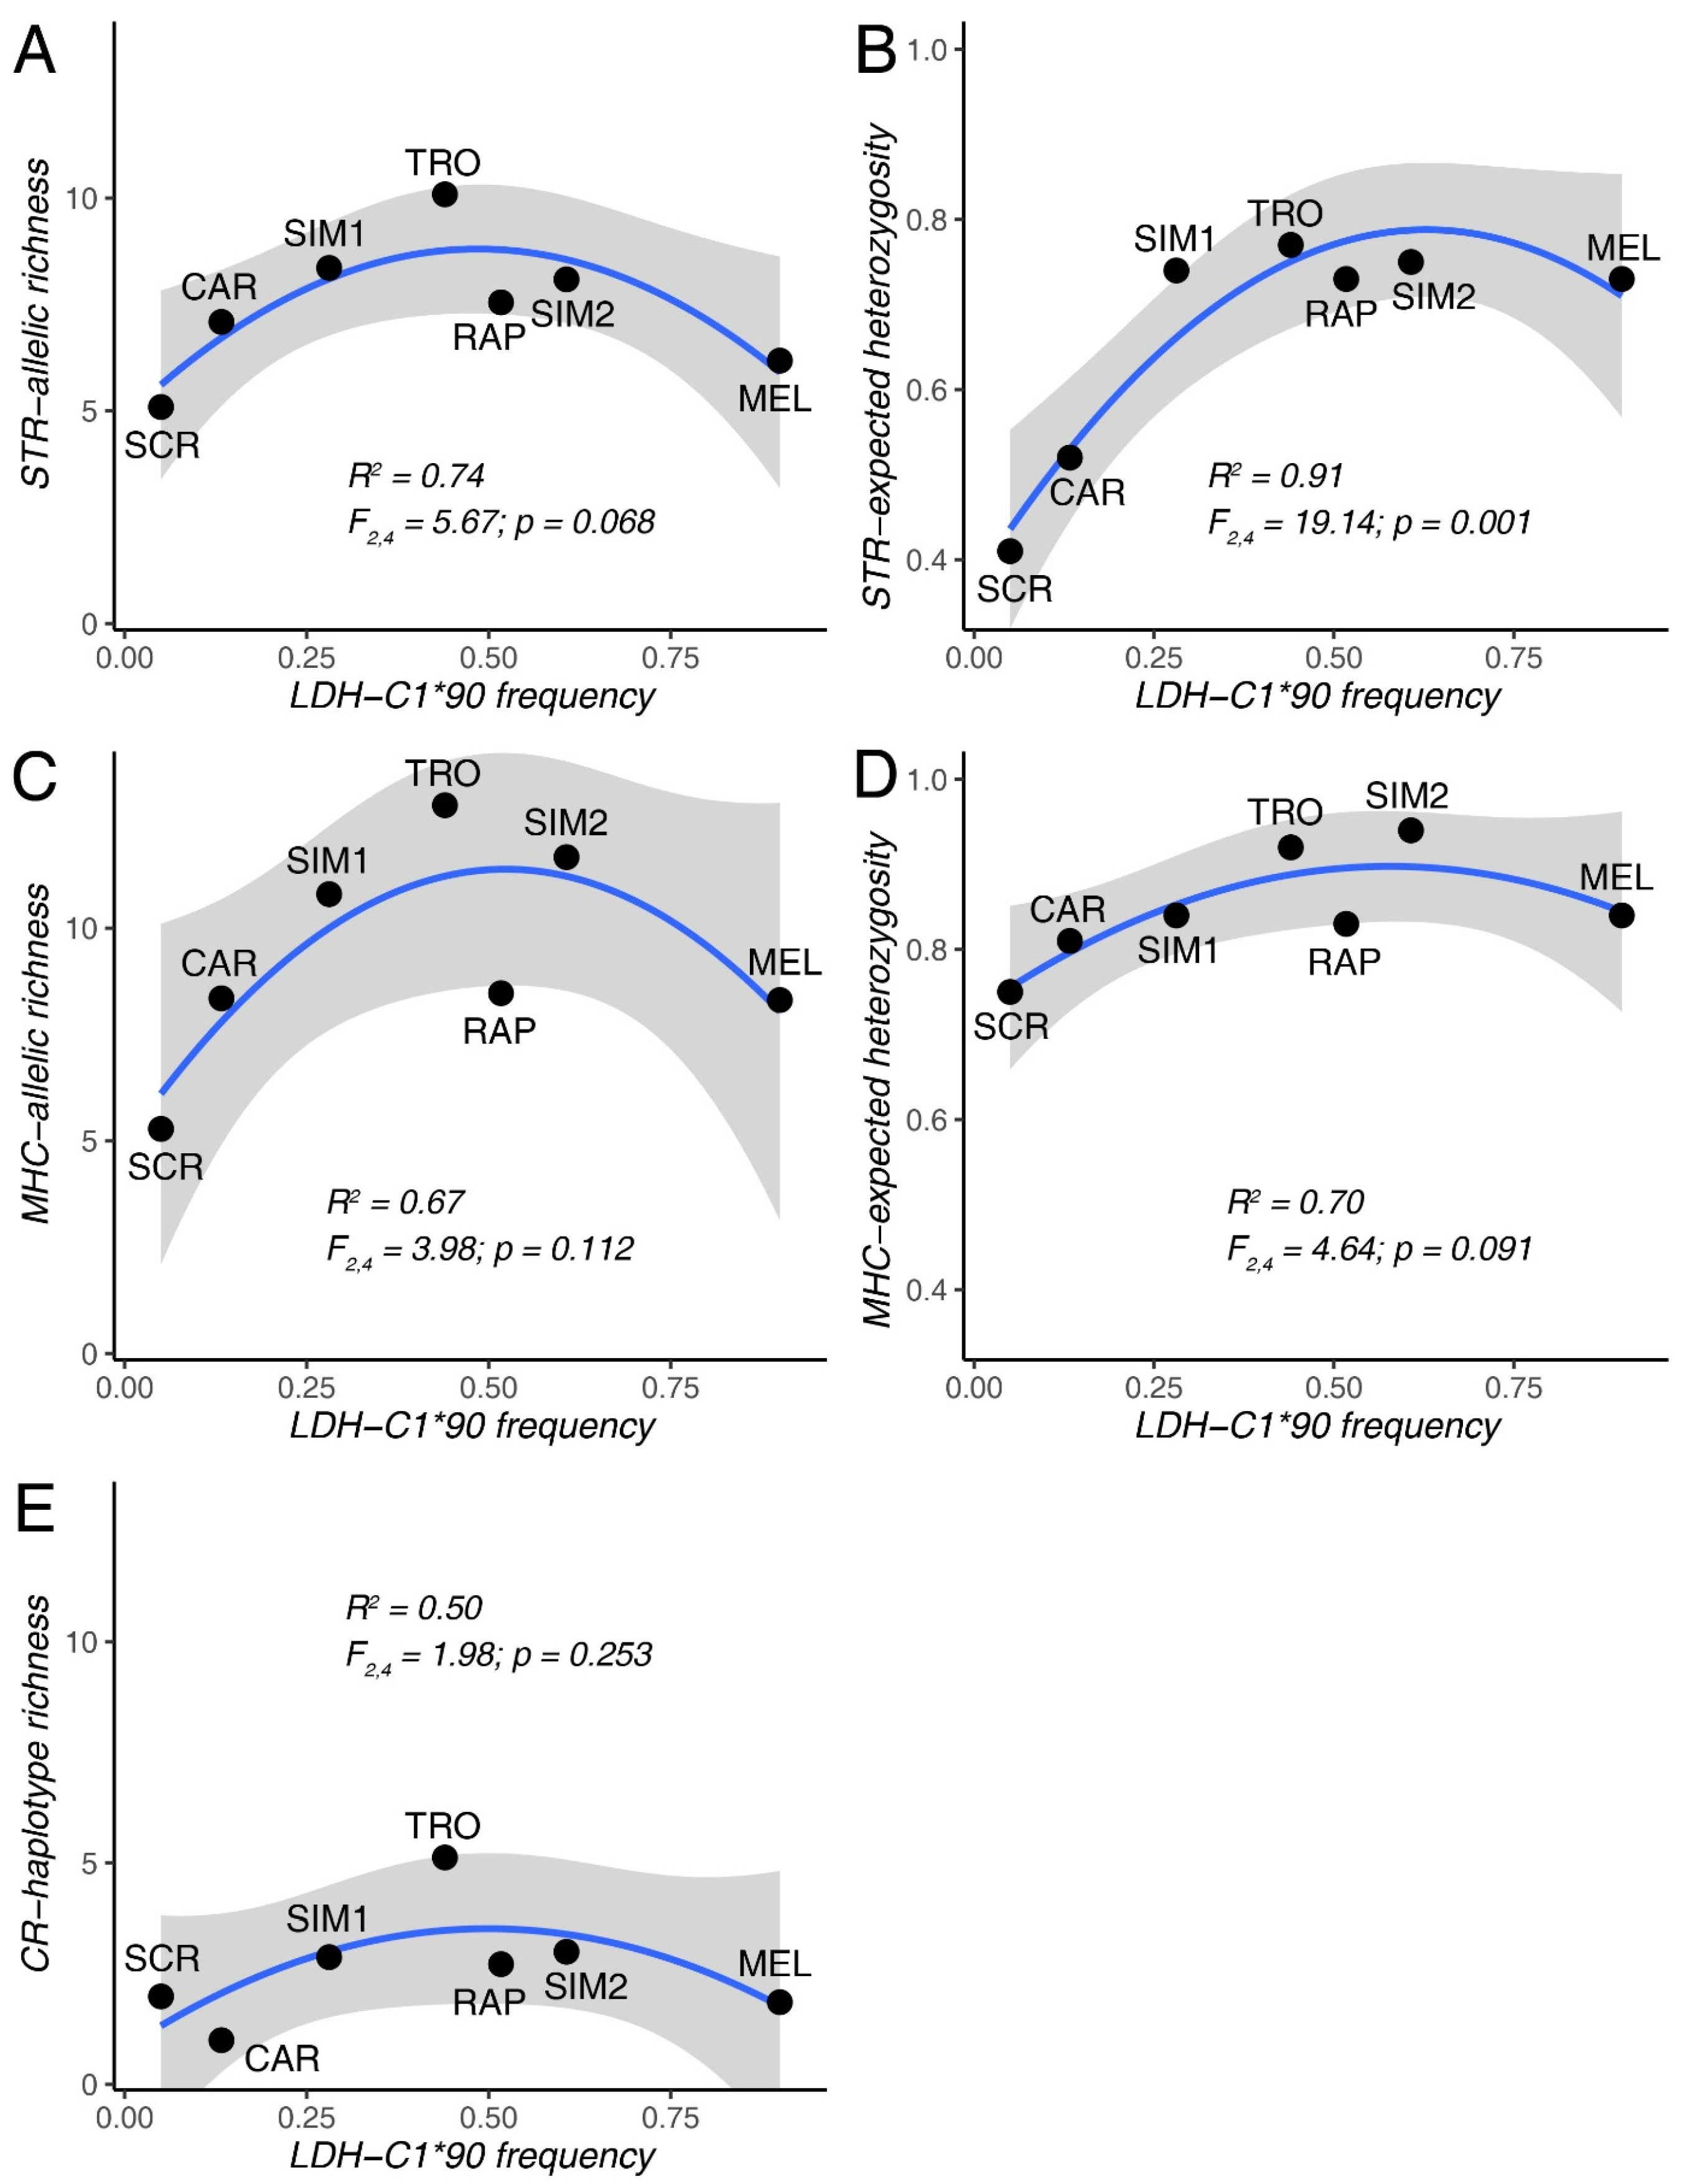
Models indicated that the frequency of LDH-C1*90 allele remarkably contributed to explaining STR and MHC-DAB genetic diversity across populations (R2 ranging from 67% to 91%; Figure 2A–D), with higher population diversity observed at intermediate LDH-C1*90 frequency (corresponding to the maximum admixture between native and domestic lineages). However, only the model predicting STR-based expected heterozygosity was statistically supported (p = 0.001; Figure 2B) while others only indicated a weak tendency (0.07 < p < 0.11), likely because of limited observations. Conversely, LDH-C1 based admixture did not explain CR haplotype richness across populations (p = 0.25; Figure 2E).
3.3. Genetic Population Structure and Demography
Genetic differentiation was statistically significant (p < 0.05 after Bonferroni correction) for all population pairs except SIM1-SIM2 for all markers, and RAP-TRO for the mitochondrial CR (Table S6 in ESI). Among STRs, values of locus-by-locus Fst indicated that the SSA85 locus mainly contributed to sample differentiation (Table S7 in ESI), as private alleles 101 and 103 were almost fixed in CAR and SCR, respectively (Figure S1 in ESI).
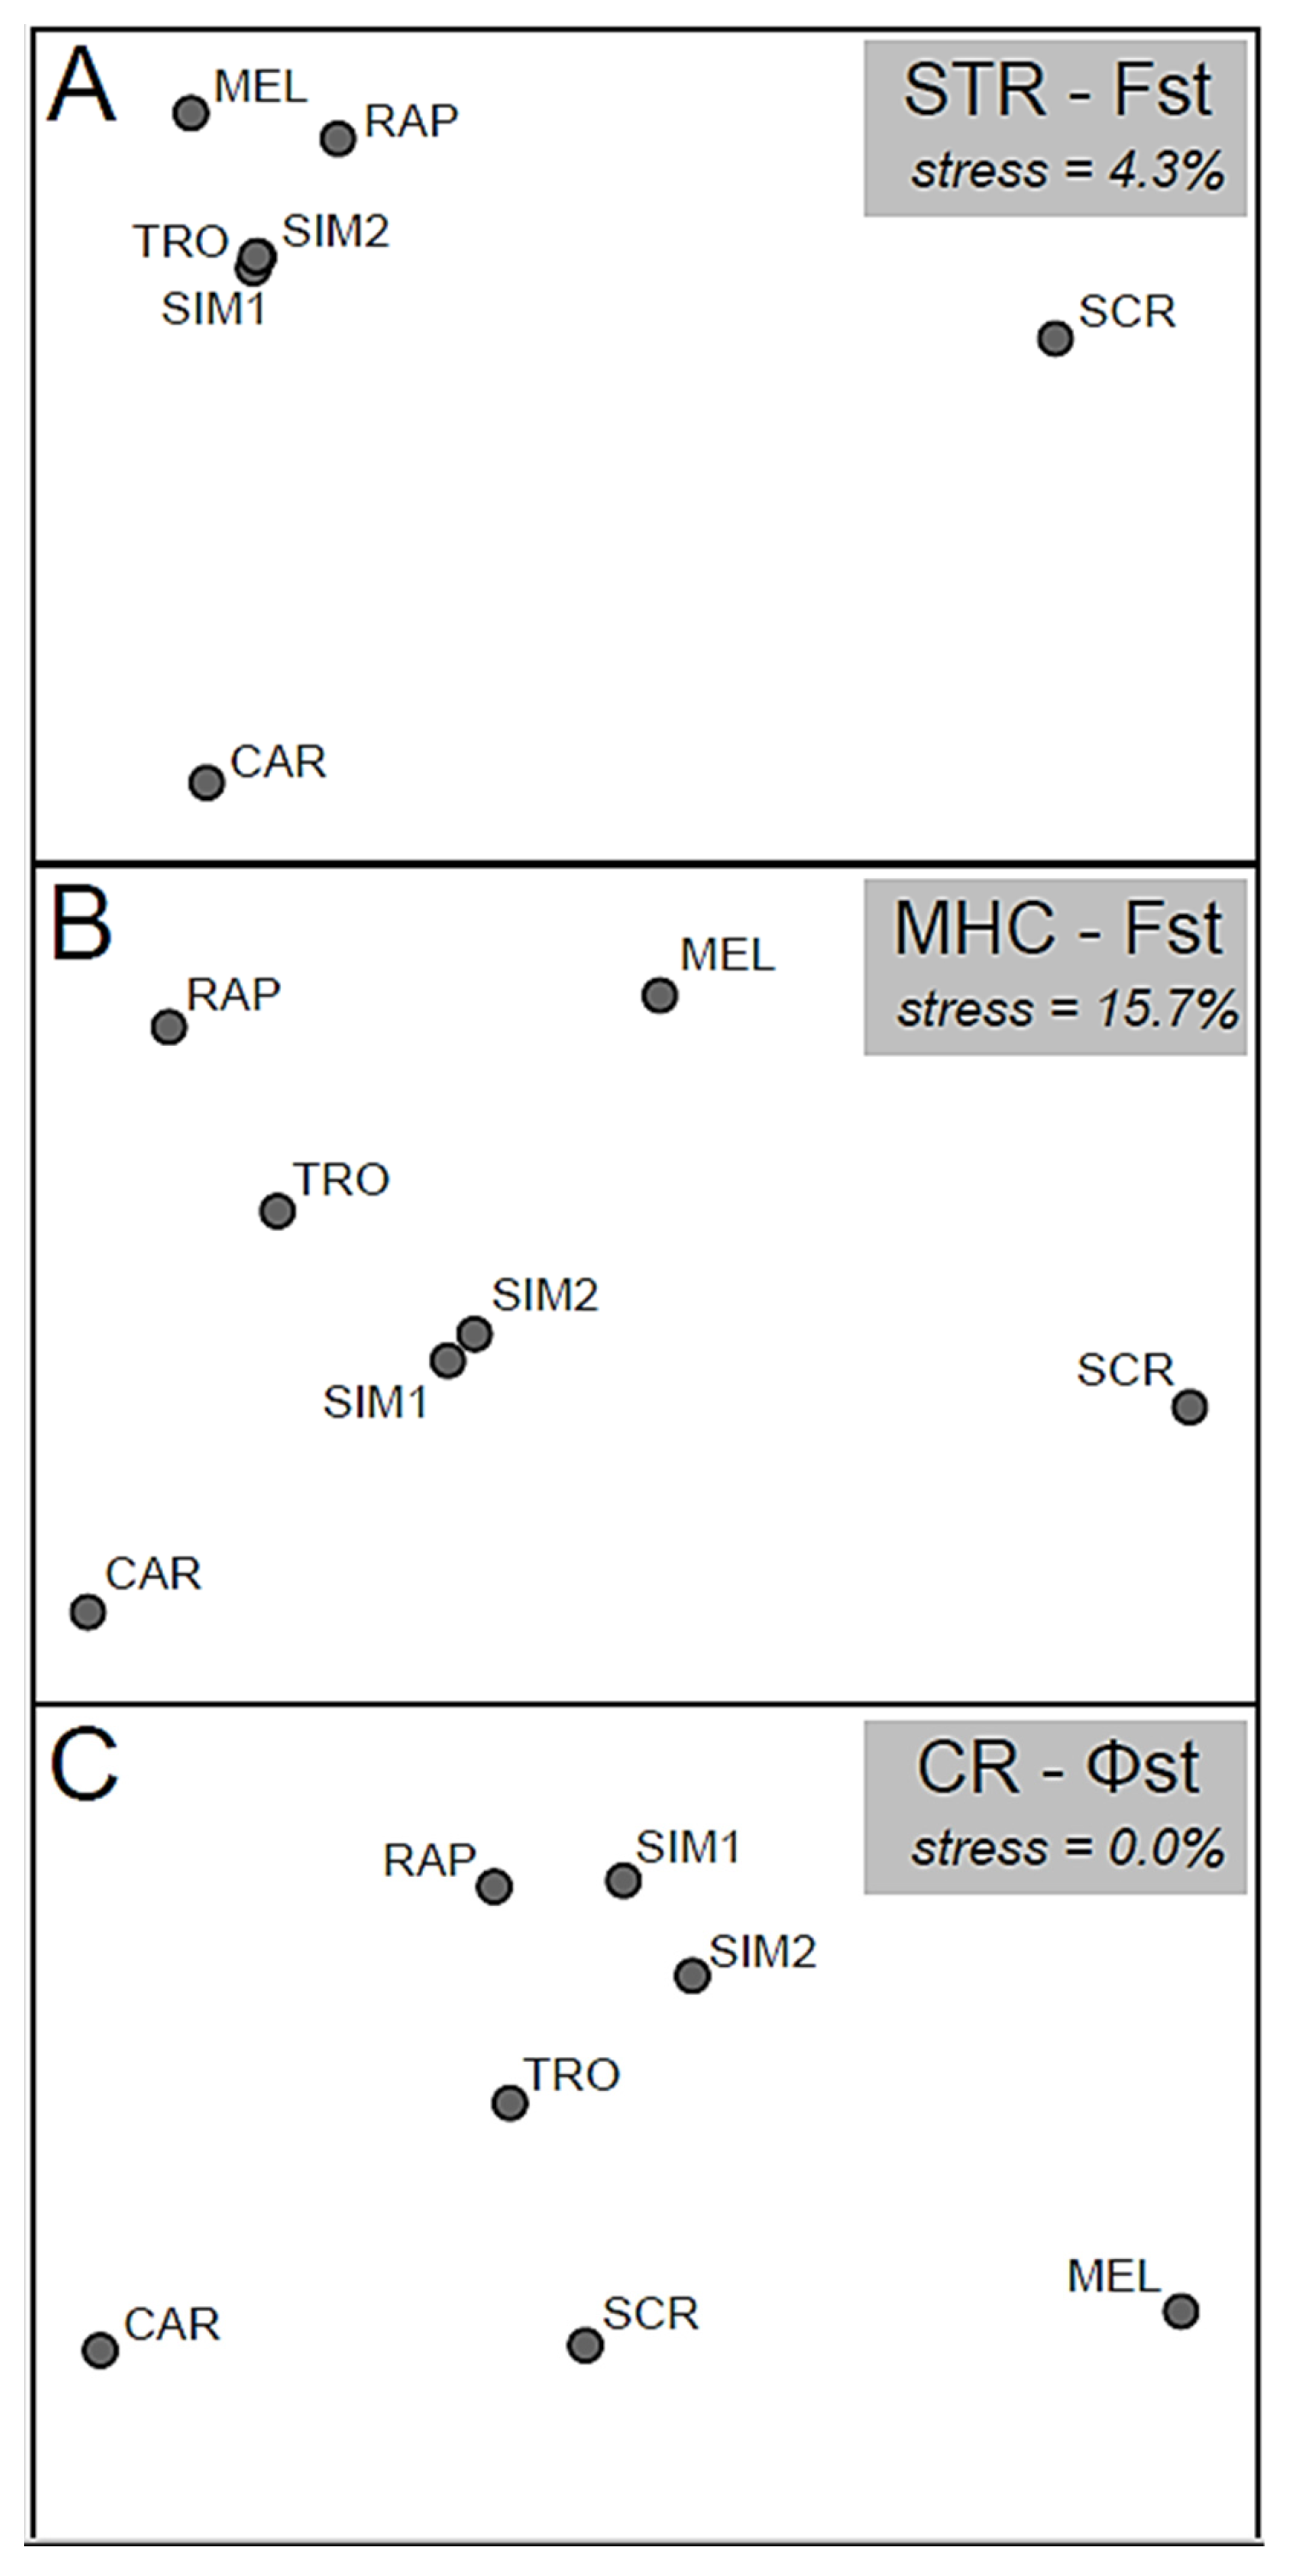
Irrespective of the marker class, NMDSs revealed differentiation among river catchments with special distinctiveness of Santa Croce (SCR) and Carpello (CAR) populations (Figure 3). Stocked sites (MEL, RAP, SIM1-2, and TRO) showed relative genetic similarity according to only STR-based Fst (Figure 3A), while a more pronounced differentiation was evident in MHC-DAB and CR-based NMDSs (Figure 3B,C).
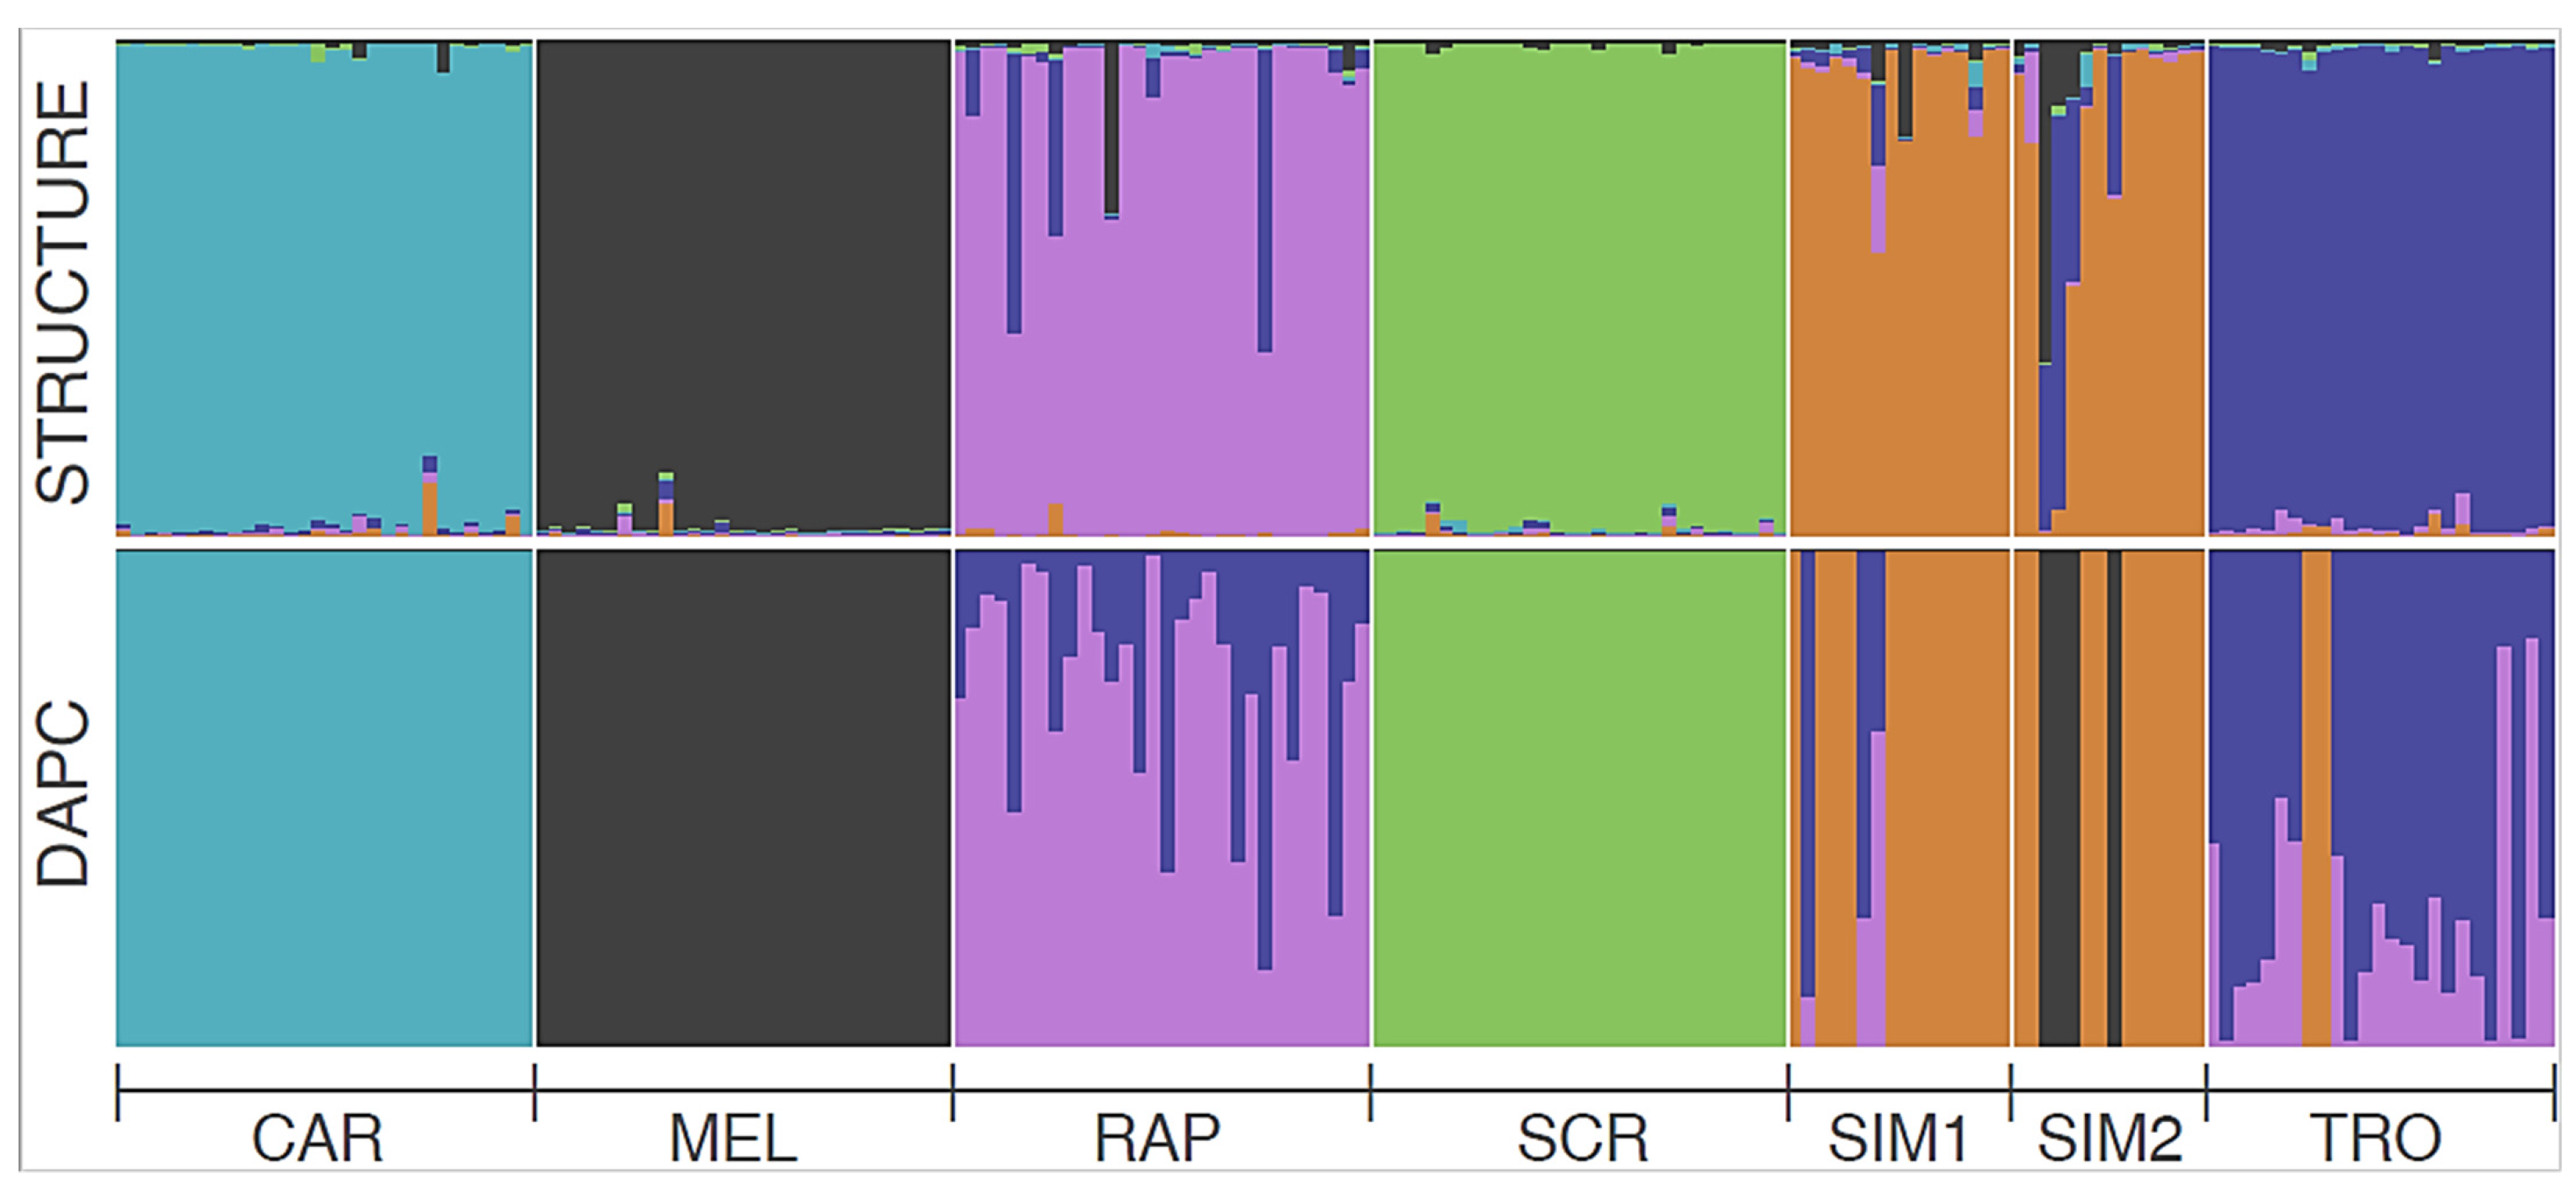
Both LnP and ΔK methods suggested six optimal Structure clusters (Figure S2 in ESI), clearly corresponding to river catchments (SIM1 and SIM2 formed a single group), with low levels of inter-cluster admixture (Figure 4)—but see Figure S3 in ESI for clustering results when K ranged between 2 and 8. A similar population structure was obtained with Dapc when considering K = 6—but note that the BIC pattern suggested from 5 to 7 optimal clusters with similar support (Figure S4 in ESI)—although there was some degree of admixture, particularly between TRO and RAP. In both analyses CAR, MEL, and SCR formed a “pure” cluster each. Consistently, the Geneclass analysis correctly assigned 86.3% of the individuals to their actual sampling site (Table S8 in ESI). Only 14 out of 175 individuals were not assigned to any site, likely because of their admixed genome (this was particularly evident from Structure barplots of individual admixture; see Figure 4). Most of the misassignments occurred between SIM1 and SIM2 sites: when these sites were pooled together, the fraction of correct assignments for SIM increased to 83.3%, while the global one increased to 91.4%.
AMOVA breakdowns indicated that differentiation within and among populations accounted for the vast majority of genetic variance for each maker class, while variance explained by differences among drainage basins or mountain/lowland river catchments was negligible and statistically non-significant (Table 3).
Effective population sizes estimated through the sibship method were generally low (Table 2), ranging between 17 (RAP) and 88 (SIM2). Finally, the Bottleneck analysis supported a recent population size reduction in MEL (p = 0.004).
4. Discussion
We characterized putatively/nearly neutral (STR, LDH-C1, and CR) and adaptive (MHC-DAB) variation in seven brown trout sampling locations from central Italy, revealing various frequencies of the Atlantic genetic component and different rates of introgression across sites and marker types. We also revealed a well-defined population genetic structure, consistent among markers, eventually allowing identifying distinct MUs and conservation priorities.
4.1. Genetic Diversity
Our analysis of mtDNA showed a dynamic mosaic pattern of native lineages in central Italy revealing the presence of both native and allochthonous haplotypes, consistently with previous studies [26,39]. Below we focus this discussion section on novel insight. First, the occurrence of marmoratus (MA) haplotypes provides new information about the spatial distribution of such mitochondrial lineage, so far poorly known in the Italian peninsula. The MA lineage identifies, although not exclusively, Salmo marmoratus (Cuvier, 1829) that is endemic of the Alpine watersheds draining to the Northern Adriatic Sea [1,2]. Nevertheless, haplotypes from the MA lineage are also found in wild native populations of Mediterranean brown trout from rivers flowing into the central Adriatic (e.g., Fiastrone, Esino, Aterno), including a tributary of the Tronto river (i.e., the Fosso Tufo) [6,25,28,69] and, more recently, from Corsican rivers [70]. Therefore, to the best of our knowledge, the occurrence of MA haplotypes in Rapido (RAP) and Simbrivio (SIM2) rivers provides the first remarkable records of such lineage in drainage basins of the Italian peninsula flowing into the Tyrrhenian Sea, as well as in the Latium region. Its presence could be either natural, as MA native haplotypes trout have been reported in other areas from central Italy, or may result from the introduction. Particularly, their abundance in the Rapido river (RAP) is somehow surprising, as a previous study did not detect any MA haplotypes in a sampling site located 13 km downstream from RAP [39]. However, (anthropogenic) physical barriers separate both sites, likely reducing their connectivity: natural waterfalls and small weirs are believed effective in preventing brown trout (and other freshwater salmonids) dispersal, thus shaping fine-scale patterns of population structure [71,72]. Further investigation is needed to clarify the native/allochthonous nature of MA haplotypes in RAP and SIM2. Conversely, the occurrence of the MA lineage in the Tronto river (TRO) was expected, because of its previously demonstrated native origin in such area [69]. Second, the nature of the Melfa population is surprising: MEL appears indeed almost entirely represented by domestic trout (100% AT haplotypes and 90% of LDH-C1*90 allele), despite being located in a poorly accessible creek stretch within the core area of the “Abruzzo, Lazio e Molise National Park”. Here introductions are not supposed to occur and there is no official documentation of previous stocking activities (see below for further discussion).
In a general perspective, we found two major patterns concerning the effect of stocking with domestic trout on genetic diversity in wild recipient populations. Firstly, both STR and MHC variation increased with higher LDH-C1 based admixture, so that maximum diversity was found in RAP, TRO, and SIM sites (Figure 2A–D). Although non-native invasive populations/species often undergo a genetic bottleneck and consequently a stochastic loss of genetic diversity, an increase in genetic variability in recipient wild populations can be observed [73,74,75], even for non-neutral loci [34]. This may be due to successive introductions from the same or genetically divergent source populations/stocks—in the case of brown trout, high levels of genetic polymorphism and admixture emerged from the analyses of hatchery strains from Europe and North America [76]. Introgressive hybridization with native individuals may further contribute to increasing population genetic diversity, as in the case of natural secondary contact between deeply diverged allopatric lineages, or in the case of stocking with allochthonous individuals [77]. Anyhow, the increase in genetic variability caused by admixture with domestic trout has likely an impact on the original diversity of natural populations as it may disrupt their adaptive makeup, affecting the fitness of the recipient population [78,79,80]. This well applies to salmonids, as they frequently show local adaptation [81], thus being particularly sensitive to population admixture [74]. Introgressed populations of Mediterranean brown trout are dramatically common in Italy, being found in the same [26,39] or different geographic areas [6,29,35,69], as well as in other countries [7,73,82]. However, this is not a general rule, and captive introgression sometimes occurs at low rates even in actively stocked ecosystems [83].
The second remarkable finding concerns the usually lower frequency of Atlantic haplotypes as compared to that of LDH-C1*90 alleles across sampling sites, although not statistically supported (one-way Wilcoxon rank test: W = 6; p = 0.109), likely because of the small sample size. This may indicate mito-nuclear discrepancy and asymmetric introgression between markers, as also suggested by the lack of correlation between haplotype richness and the observed degree of admixture (LDH-C1*90 frequency) across populations (Figure 2E). Such a mismatch may result from various non-mutually exclusive mechanisms: native females preferably mating with domestic males (non-random mating), different fitness and/or migratory behavior associated with lineages and sexes [28,84]. Anyhow, if empirically verified, this would imply an underestimation of the Atlantic component based on the mitochondrial DNA in wild admixed populations.
4.2. Population Structure and Demography
Our analyses agreed to identify a strong genetic structure of wild populations in central Italy, irrespective of the molecular marker from which the analyses relied on. Interestingly, structuring was apparently not linked to geography (i.e., drainage basins) or altitude of sampling sites (see AMOVA results, Table 3). A substantial inter-population differentiation emerged from almost all pairwise comparisons among sites and assignment tests (Tables S6 and S8 in ESI)—this does not apply for Simbrivio sites (SIM1 and SIM2; Tiber River basin) that are quite similar, being only 3 km away from each other. Consistently, both Structure and Dapc suggested each examined river catchment forming a distinct cluster showing a roughly low admixture degree and high self-assignment percentages (GeneClass results). The observed structuring is likely influenced by the distribution of informative STR alleles (e.g., those of the SSA85 locus) and mirrors the distribution of the typical Mediterranean genotypes (LDH-C1*100 allele) and native mitochondrial haplotypes. Indeed, populations characterized by higher frequencies of the Mediterranean component (i.e., SCR and CAR) appeared the most divergent in NMDS plots, especially with respect to STR loci. Additionally, the distinctiveness of Carpello (CAR) and Santa Croce (SCR) was evident at basal subdivisions of Structure (Figure S3 in ESI): with K = 2, CAR and SCR formed a unique cluster separated from other sites; with K = 3, CAR and SCR formed two discrete clusters, while other sites were grouped together (except for Simbrivio sites). Importantly, the differentiation between CAR and SCR was even more pronounced than that with the almost-pure Atlantic site (MEL)—such distinction emerged only since K ≥ 4 of Structure partitioning (Figure S3 in ESI). Geographic isolation and limited stocking with domestic strains likely led to and maintained the remarkable distinctiveness of CAR and SCR, as supported by the observed relatively low levels of genetic variability at all examined markers. However, we did not find the signature of bottlenecks, indicating demographically stable populations in the recent past, although coupled with small effective population sizes (Ne = 40 and 34, respectively). Overall, Ne estimates of Latium sites (excluding MEL) are comparable to those reported for eight Apennine populations of Mediterranean brown trout from the Adriatic slope (Ne range: 27–58; Mann–Whitney test: U = 20, p = 0.846; [6]) and nine wild brown trout populations in North-western Spain (Ne range: 21–137; Mann–Whitney test: U = 19.5, p = 0.410; [27]) using the Colony software and almost identical analysis parameters. Generally, small brown trout Ne sizes may result from multiple concurring factors, among which the isolation of wild populations and demographic fluctuations associated with water flow fluctuations [27].
The genetic makeup of MEL, almost entirely Atlantic, unambiguously indicates its anthropogenic origin, resulting from the release of hatchery-reared individuals in a natural site where native individuals were likely originally rare or even absent. We might argue that such introduction is relatively recent, as supported by the evidence of a recent bottleneck. Interestingly, the gene pool of the MEL population is clearly distinguishable from those of the other examined populations (results from the Structure analysis and the assignment test), including the admixed ones (according to the occurrence of the LDH-C1*90 allele). This evidence eventually indicates that the source stock of MEL was likely different from most of those used for stocking purposes in the other Latium sites.
Finally, the employment of MHC in the conservation genetics of Mediterranean brown trout deserves a special mention. Distinguishing between domestic (Atlantic) and Mediterranean-native MHC-DAB alleles was challenging or even not possible because of non-diagnostic sequence genealogies and the probable widespread allele sharing among Atlantic and native lineages [34]. In other words, the highly polymorphic MHC-DAB locus apparently shows limited usefulness for admixture estimates in the examined population, meanwhile being suitable for investigating functional variation and population structure, and thus defining “adaptive” units.
4.3. Management Implications
All in all, our analyses pointed out five MUs on native Mediterranean brown trout in the study area, corresponding with local populations at each river catchment, and characterized by a roughly site-specific genetic makeup: Santa Croce (SCR), Carpello-Fibreno (CAR), Tronto (TRO), Simbrivio (SIM1 and SIM2), and Rapido (RAP). Below we discuss site-specific threats and conservation actions to preserve the local diversity of each MU.
The SCR population should be considered a conservation priority for multiple reasons: (1) typical genetic makeup (e.g., excluding the domestic AT-1, SCR is fixed for the private ME-1 haplotype) and limited introgression from domestic lineages; (2) remarkably reduced genetic diversity even at adaptive genes (Table 1), presumably a signature of ancient bottlenecks [26]—Santa Croce directly flows into the sea, thus the population is likely isolated since the loss of anadromy of Mediterranean brown trout; (3) limited habitat, also potentially vulnerable to consequences of climate change—for instance, the population could not migrate upstream in case of increase in water temperatures [11], risking local extinction; (4) plausible adaptation to peculiar ecological features, such as the relatively hot water temperature of a lowland watercourse. Here, in situ conservation action should limit angling activities, and monitor poaching and illegal stocking with domestic trout. In addition, water abstraction during the dry season should be supervised (e.g., through the maintaining of the minimum river flow) since overexploitation may affect trout survival. Supportive in situ reproduction can be evaluated to sustain the natural population in the case of strong demographic fluctuations due to human activities.
Similarly to SCR, the CAR population is another rare “sanctuary” of highly pure Mediterranean brown trout. Here, multiple studies pointed out the distinctiveness of the population, with local haplotype(s) almost fixed (this study) [26,38,39,85]. The CAR site is located in a Regional protected area where stocking activities stopped decades ago, ensuring the genetic integrity of the population [38]. Nevertheless, local rangers reported (personal communication) increasing trout predation by fish-eating birds (e.g., herons, cormorants) during the breeding period, when trout gather at the confluence between the creek Carpello (the main spawning habitat) and River Fibreno (the large watercourse hosting most of the trout population). Future actions should aim at minimizing over-predation in such a circumscribed area.
Simbrivio (SIM1, SIM2) and Tronto (TRO) populations deserve conservation attention especially because they host high genetic variability (e.g., multiple native lineages and some locally distributed CR haplotypes), possibly resulting from their supposed demographic stability—they are the largest populations so we may expect a limited loss of diversity by genetic drift as compared to smaller populations. Nevertheless, both sites are/were subject to massive stocking with domestic trout, therefore, exotic genes also contribute to the observed high diversity. For these reasons, conservation actions should aim to increase the frequency of native genes, meanwhile reducing domestic ones. It should be considered to: (1) effectively monitor the (illegal) introduction of Atlantic (hatchery) trout; (2) start programs, one for each MU, of selective breeding and restocking with genetically suitable adult individuals, fry, or fertilized eggs. Furthermore, (3) recreational angling could also contribute to the purpose if controlled and carried on before restocking with native trout, as angling selectively removes recently introduced domestic trout from wild populations: catchability of hatchery trout is believed more effective than that of native individuals [86], although the efficiency of “selective angling” remains controversial [73].
In principle, the RAP population may constitute a rare refugee of the marmoratus (MA) lineage in the Tyrrhenian slope. Nevertheless, further investigations (e.g., examining additional sampling sites and molecular markers) are needed to confirm its native origin. If so, Rapido should be treated as a separate MU and a protected area should be set up in consequence. The above-mentioned conservation actions should be applied to preserve native genes and remove domestic genes (LDH-C1*90 allele frequency is about 52%).
Finally, we invoke future surveys aiming at exploring the occurrence of native populations in the Melfa basin, to be employed for the restocking of the MEL site upon the eradication of the extant naturalized Atlantic population. As the MEL population is located above a 10 m waterfall within a National Park, protection and isolation of the re-founded population would be facilitated, but see [6] for the ineffectiveness of protected areas in Italy to preserve native Mediterranean brown trout biodiversity.
Our data reiterate that conservation genetics provides multiple tools for monitoring threatened salmonid populations/species and identifying donor populations, thus preventing the spread of non-native genes [87]. In addition, whole-genome sequencing enhances the possibility to disclose further hidden biodiversity in the Salmo trutta complex [88]. However, as for other species, the opportunity offered by molecular markers still seems dismissed in planning management actions [18].
Supplementary Materials
The following supporting information can be downloaded at: https://www.mdpi.com/article/10.3390/w14060937/s1, Figure S1: Distribution of SSA85 alleles across populations; Figure S2: Optimal number of Structure clusters; Figure S3: Barplots of Bayesian clustering analysis in Structure; Figure S4: BIC values for the different Dapc clustering partitions; Table S1: CR haplotypes and LDH-C1 genotypes distribution across populations; Table S2: Microsatellite genotypes of additional individuals; Table S3: Exact tests for Hardy-Weinberg equilibrium; Table S4: Frequency of null alleles; Table S5: Tests of linkage disequilibrium; Table S6: Population pairwise genetic distances; Table S7: F-statistics (microsatellites); Table S8: Geneclass assignment.
Author Contributions
A.R.R. and L.T. (Lorenzo Tancioni) conceived and designed the study with support from L.T. (Lorenzo Talarico) and G.P.; L.T. (Lorenzo Tancioni), L.T. (Lorenzo Talarico) and G.P. collected DNA samples; S.C., G.P. and L.T. (Lorenzo Talarico) carried out laboratory experiments; L.T. (Lorenzo Talarico) and G.P. performed data analysis and visualization; L.T. (Lorenzo Tancioni) and A.R.R. provided financial support and laboratory resources; A.R.R. and L.T. (Lorenzo Talarico) wrote the manuscript with the contribution of L.T. (Lorenzo Tancioni). All authors have read and agreed to the published version of the manuscript.
Funding
This research was funded by ARSIAL—Regional Agency for the Development and Innovation of Agriculture of Latium (to LTan and ARR) and by Sapienza University of Rome (Project2146271-2020 to ARR).
Institutional Review Board Statement
All sampling procedures were authorized by the “Direction of agriculture, promotion of the food chain and culture, hunting and fishing” and “Regional Directorate for Environmental Policies and Waste Cycle” of the Latium Region (authorization no. G10101-27/7/2019 and Q169/2019).
Data Availability Statement
Data are available in Dryad doi:10.5061/dryad.xsj3tx9fg and in GenBank https://www.ncbi.nlm.nih.gov/genbank/, accessed on 20 September 2021 (A.N. OL830460-70).
Acknowledgments
We thank P.T. Colombari, M. Martinoli, G. Moccia, and A. Rakaj for their kind help in field activities and DNA sampling.
Conflicts of Interest
The authors declare no conflict of interest.
References
- Meraner, A.; Gandolfi, A. Genetics of the genus Salmo in Italy: Evolutionary history, population structure, molecular ecology and conservation. In Brown Trout: Biology, Ecology and Management; Lobón-Cerviá, J., Sanz, N., Eds.; John Wiley & Sons, Ltd.: Chichester, UK, 2018; pp. 65–102. [Google Scholar]
- Sanz, N. Phylogeographic history of brown trout: A review. In Brown Trout: Biology, Ecology and Management; Lobón-Cerviá, J., Sanz, N., Eds.; John Wiley & Sons, Ltd.: Chichester, UK, 2018; pp. 17–64. [Google Scholar]
- Segherloo, I.H.; Freyhof, J.; Berrebi, P.; Ferchaud, A.-L.; Geiger, M.; Laroche, J.; Levin, B.A.; Normandeau, E.; Bernatchez, L. A genomic perspective on an old question: Salmo trouts or Salmo trutta (Teleostei: Salmonidae)? Mol. Phylogenet. Evol. 2021, 162, 107204. [Google Scholar] [CrossRef] [PubMed]
- Tougard, C.; Justy, F.; Guinand, B.; Douzery, E.J.P.; Berrebi, P. Salmo macrostigma (Teleostei, Salmonidae): Nothing more than a brown trout (S. trutta) lineage? J. Fish Biol. 2018, 93, 302–310. [Google Scholar] [CrossRef] [PubMed] [Green Version]
- Bernatchez, L. The evolutionary history of brown trout (Salmo trutta L.) inferred from phylogeographic, nested clade, and mismatch analyses of mitochondrial DNA variation. Evolution 2001, 55, 351–379. [Google Scholar] [CrossRef] [PubMed]
- Splendiani, A.; Giovannotti, M.; Righi, T.; Fioravanti, T.; Cerioni, P.N.; Lorenzoni, M.; Carosi, A.; La Porta, G.; Barucchi, V.C. Introgression despite protection: The case of native brown trout in Natura 2000 network in Italy. Conserv. Genet. 2019, 20, 343–356. [Google Scholar] [CrossRef]
- Madeira, M.J.; Gómez-Moliner, B.J.; Machordom Barbé, A. Genetic introgression on freshwater fish populations caused by restocking programmes. Biol. Invasions 2005, 7, 117–125. [Google Scholar] [CrossRef]
- Ferguson, A. Genetic Impacts of Stocking on Indigenous Brown Trout Populations (Environment Agency Science Report No. SC040071/SR). 2007; ISBN 978-1-84432-798-0. Available online: https://www.gov.uk/government/publications/genetic-impacts-of-stocking-on-indigenous-brown-trout-populations (accessed on 3 July 2021).
- Global Invasive Species Database. Available online: http://193.206.192.138/gisd/100_worst.php (accessed on 1 July 2021).
- CEE. Council Directive 92/43/EEC of 21 May 1992 on the conservation of natural habitats and of wild fauna and flora. Off. J. Eur. Com. 1992, 206, 7–50. Available online: https://eur-lex.europa.eu/legal-content/EN/TXT/?uri=celex%3A31992L0043 (accessed on 1 July 2021).
- Almodóvar, A.; Nicola, G.G.; Ayllón, D.; Elvira, B. Global warming threatens the persistence of Mediterranean brown trout. Glob. Chang. Biol. 2012, 18, 1549–1560. [Google Scholar] [CrossRef] [Green Version]
- Ayllón, D.; Railsback, S.F.; Harvey, B.C.; García Quirós, I.; Nicola, G.G.; Elvira, B.; Almodóvar, A. Mechanistic simulations predict that thermal and hydrological effects of climate change on Mediterranean trout cannot be offset by adaptive behaviour, evolution, and increased food production. Sci. Total Environ. 2019, 693, 133648. [Google Scholar] [CrossRef] [PubMed]
- Leroy, G.; Carroll, E.L.; Bruford, M.W.; DeWoody, J.A.; Strand, A.; Waits, L.; Wang, J. Next-generation metrics for monitoring genetic erosion within populations of conservation concern. Evol. Appl. 2018, 11, 1066–1083. [Google Scholar] [CrossRef] [Green Version]
- Moritz, C. Defining ‘Evolutionarily Significant Units’. Trends Ecol. Evol. 1994, 9, 373–375. [Google Scholar] [CrossRef]
- Allendorf, F.W.; Luikart, G.; Aitken, S.N. Conservation and the Genetics of Populations; Wiley-Blackwell: Oxford, UK, 2016. [Google Scholar]
- Palsbøll, P.J.; Bérubé, M.; Allendorf, F.W. Identification of management units using population genetic data. Trends Ecol. Evol. 2007, 22, 11–16. [Google Scholar] [CrossRef] [PubMed]
- Funk, W.C.; McKay, J.K.; Hohenlohe, P.A.; Allendorf, F.W. Harnessing genomics for delineating conservation units. Trends Ecol. Evol. 2012, 27, 489–496. [Google Scholar] [CrossRef] [PubMed] [Green Version]
- Willi, Y.; Kristensen, T.N.; Sgrò, C.M.; Weeksd, A.R.; Ørstedb, M.; Hoffmannd, A.A. Conservation genetics as a management tool: The five best-supported paradigms to assist the management of threatened species. Proc. Natl. Acad. Sci. USA 2022, 119, e2105076119. [Google Scholar] [CrossRef]
- Zachos, F.E.; Apollonio, M.; Bärmann, E.V.; Festa-bianchet, M.; Göhlich, U.; Christian, J.; Haring, E.; Kruckenhauser, L.; Lovari, S.; Mcdevitt, A.D.; et al. Species inflation and taxonomic artefacts—A critical comment on recent trends in mammalian classificatio. Mamm. Biol. 2013, 78, 1–6. [Google Scholar] [CrossRef]
- Splendiani, A.; Palmas, F.; Sabatini, A.; Caputo Barucchi, V. The name of the trout: Considerations on the taxonomic status of the Salmo trutta L., 1758 complex (Osteichthyes: Salmonidae) in Italy. Eur. Zool. J. 2019, 86, 432–442. [Google Scholar] [CrossRef] [Green Version]
- Serrote, C.M.L.; Reiniger, L.R.S.; Silva, K.B.; Rabaiolli, S.M.S.; Stefanel, C.M. Determining the Polymorphism Information Content of a molecular marker. Gene 2020, 726, 144175. [Google Scholar] [CrossRef] [PubMed]
- Livi, S.; De Innocentiis, S.; Longobardi, A.; Cataudella, S.; Tancioni, L.; Rampacci, M.; Marino, G. Genetic structure of Barbus spp. populations in the Marches Region of central Italy and its relevance to conservation actions. J. Fish Biol. 2013, 82, 806–826. [Google Scholar] [CrossRef] [PubMed]
- Rossi, A.R.; Milana, V.; Pulcini, D.; Cataudella, S.; Martinoli, M.; Tancioni, L. An integrated genetic and morphological approach to clarify the conservation status of the threatened Italian endemic species Alburnus albidus (Cypriniformes: Cyprinidae). Hydrobiologia 2016, 770, 73–87. [Google Scholar] [CrossRef]
- Rossi, A.R.; Petrosino, G.; Crescenzo, S.; Milana, V.; Talarico, L.; Martinoli, M.; Rakaj, A.; Lorenzoni, M.; Carosi, A.; Ciuffardi, L.; et al. Phylogeography and population structure of Squalius lucumonis: A baseline for conservation of an Italian endangered freshwater fish. J. Nat. Cons. 2021, 64, 126085. [Google Scholar] [CrossRef]
- Gratton, P.; Allegrucci, G.; Sbordoni, V.; Gandolfi, A. The evolutionary jigsaw puzzle of the surviving trout (Salmo trutta L. complex) diversity in the italian region. A multilocus Bayesian approach. Mol. Phylogenet. Evol. 2014, 79, 292–304. [Google Scholar] [CrossRef] [PubMed]
- Fabiani, A.; Gratton, P.; Zappes, I.A.; Seminara, M.; D’Orsi, A.; Sbordoni, V.; Allegrucci, G. Investigating the genetic structure of trout from the Garden of Ninfa (central Italy): Suggestions for conservation and management. Fish. Manag. Ecol. 2018, 25, 1–11. [Google Scholar] [CrossRef]
- Sanz, N.; Araguas, R.M.; Fernández-Cebrián, R.; Lobón-Cerviá, J. Factors modelling population structure in brown trout Salmo trutta L.: Genetic monitoring of populations in Esva River (northwestern Spain). Hydrobiologia 2019, 837, 117–131. [Google Scholar] [CrossRef]
- Splendiani, A.; Fioravanti, T.; Ruggeri, P.; Giovannotti, M.; Carosi, A.; Marconi, M.; Lorenzoni, M.; Righi, T.; Nisi, P.; Vincenzo, C.; et al. Life history and genetic characterisation of sea trout Salmo trutta in the Adriatic Sea. Freshw. Biol. 2019, 65, 460–473. [Google Scholar] [CrossRef]
- Berrebi, P.; Caputo Barucchi, V.; Splendiani, A.; Muracciole, S.; Sabatini, A.; Palmas, F.; Tougard, C.; Arculeo, M.; Maric, S. Brown trout (Salmo trutta L.) high genetic diversity around the Tyrrhenian Sea as revealed by nuclear and mitochondrial markers. Hydrobiologia 2019, 826, 209–231. [Google Scholar] [CrossRef]
- McMeel, O.M.; Hoey, E.M.; Ferguson, A. Partial nucleotide sequences, and routine typing by polymerase chain reaction-restriction fragment length polymorphism, of the brown trout (Salmo trutta) lactate dehydrogenase, LDH-C1*90 and *100 alleles. Mol. Ecol. 2001, 10, 29–34. [Google Scholar] [CrossRef]
- Kaufman, J. Unfinished Business: Evolution of the MHC and the Adaptive Immune System of Jawed Vertebrates. Annu. Rev. Immunol. 2018, 36, 383–409. [Google Scholar] [CrossRef] [PubMed]
- Hansen, M.M.; Skaala, Ø.; Jensen, L.F.; Bekkevold, D.; Mensberg, K.-L.D. Gene flow, effective population size and selection at major histocompatibility complex genes: Brown trout in the Hardanger Fjord, Norway. Mol. Ecol. 2007, 16, 1413–1425. [Google Scholar] [CrossRef] [Green Version]
- Schenekar, T.; Weiss, S. Selection and genetic drift in captive versus wild populations: An assessment of neutral and adaptive (MHC-linked) genetic variation in wild and hatchery brown trout (Salmo trutta) populations. Conserv. Genet. 2017, 18, 1011–1022. [Google Scholar] [CrossRef] [Green Version]
- Talarico, L.; Marta, S.; Rossi, A.R.; Crescenzo, S.; Petrosino, G.; Martinoli, M.; Tancioni, L. Balancing selection, genetic drift, and human mediated-introgression interplay to shape MHC (functional) diversity in Mediterranean brown trout. Ecol. Evol. 2021, 11, 10026–10041. [Google Scholar] [CrossRef] [PubMed]
- Caputo, V.; Giovannotti, M.; Nisi Cerioni, P.; Caniglia, M.L.; Splendiani, A. Genetic diversity of brown trout in central Italy. J. Fish Biol. 2004, 65, 403–418. [Google Scholar] [CrossRef]
- Palombo, V.; De Zio, E.; Salvatore, G.; Esposito, S.; Iaffaldano, N.; D’Andrea, M. Genotyping of two Mediterranean trout populations in Central-Southern Italy for conservation purposes using a rainbow-trout-derived SNP array. Animals 2021, 11, 1803. [Google Scholar] [CrossRef] [PubMed]
- Splendiani, A.; Ruggeri, P.; Giovannotti, M.; Pesaresi, S.; Occhipinti, G.; Fioravanti, T.; Lorenzoni, M.; Nisi Cerioni, P.; Caputo Barucchi, V. Alien brown trout invasion of the Italian peninsula: The role of geological, climate and anthropogenic factors. Biol. Invasions 2016, 18, 2029–2044. [Google Scholar] [CrossRef]
- Gratton, P.; Allegrucci, G.; Gandolfi, A.; Sbordoni, V. Genetic differentiation and hybridization in two naturally occurring sympatric trout Salmo spp. forms from a small karstic lake. J. Fish Biol. 2013, 82, 637–657. [Google Scholar] [CrossRef] [PubMed]
- Rossi, A.R.; Petrosino, G.; Milana, V.; Martinoli, M.; Rakaj, A.; Tancioni, L.; Petrosino, G.; Milana, V.; Martinoli, M.; Rakaj, A.; et al. Genetic identification of native populations of Mediterranean brown trout Salmo trutta L. complex (Osteichthyes: Salmonidae) in central Italy. Eur. Zool. J. 2019, 86, 424–431. [Google Scholar] [CrossRef] [Green Version]
- Aljanabi, S.M.; Martinez, I. Universal and rapid salt-extraction of high quality genomic DNA for PCR-based techniques. Nucleic Acids Res. 1997, 25, 4692–4693. [Google Scholar] [CrossRef] [PubMed]
- Cortey, M.; García-Marín, J.L. Evidence for phylogeographically informative sequence variation in the mitochondrial control region of Atlantic brown trout. J. Fish Biol. 2002, 60, 1058–1063. [Google Scholar] [CrossRef]
- Kumar, S.; Stecher, G.; Tamura, K. MEGA7: Molecular evolutionary genetics analysis version 7.0 for bigger datasets. Mol. Biol. Evol. 2016, 33, 1870–1874. [Google Scholar] [CrossRef] [PubMed] [Green Version]
- Rozas, J.; Ferrer-Mata, A.; Sánchez-DelBarrio, J.C.; Guirao-Rico, S.; Librado, P.; Ramos-Onsins, S.E.; Sánchez-Gracia, A. DnaSP 6: DNA sequence polymorphism analysis of large data sets. Mol. Biol. Evol. 2017, 34, 3299–3302. [Google Scholar] [CrossRef]
- Estoup, A.; Presa, P.; Krieg, F.; Vaiman, D.; Guyomard, R. (CT)n and (GT)n microsatellites: A new class of genetic markers for Salmo trutta L. (brown trout). Heredity 1993, 71, 488–496. [Google Scholar] [CrossRef] [PubMed] [Green Version]
- O’Reilly, P.T.; Hamilton, L.C.; McConnell, S.K.; Wright, J.M. Rapid analysis of genetic variation in Atlantic salmon (Salmo salar) by PCR multiplexing of dinucleotide and tetranucleotide microsatellites. Can. J. Fish. Aquat. Sci. 1996, 53, 2292–2298. [Google Scholar] [CrossRef]
- Slettan, A.; Olsaker, I.; Lie, Ø. Atlantic salmon, Salmo salar, microsatellites at the SSOSL25, SSOSL85, SSOSL311, SSOSL417 loci. Anim. Genet. 1995, 26, 277–285. [Google Scholar] [CrossRef]
- Cairney, M.; Taggart, J.B.; Høyheim, B. Characterization of microsatellite and minisatellite loci in Atlantic salmon (Salmo salar L.) and cross-species amplification in other salmonids. Mol. Ecol. 2000, 9, 2175–2178. [Google Scholar] [CrossRef] [PubMed]
- Paterson, S.; Piertney, S.B.; Knox, D.; Gilbey, J.; Verspoor, E. Characterization and PCR multiplexing of novel highly variable tetranucleotide Atlantic salmon (Salmo salar L.) microsatellites. Mol. Ecol. Notes 2004, 4, 160–162. [Google Scholar] [CrossRef]
- Rexroad, C.E.; Coleman, R.L.; Hershberger, W.K.; Killefer, J. Rapid communication: Thirty-eight polymorphic microsatellite markers for mapping in rainbow trout. J. Anim. Sci. 2002, 80, 541–542. [Google Scholar] [CrossRef] [PubMed]
- King, T.L.; Eackles, M.S.; Letcher, B.H. Microsatellite DNA markers for the study of Atlantic salmon (Salmo salar) kinship, population structure, and mixed-fishery analyses. Mol. Ecol. Notes 2005, 5, 130–132. [Google Scholar] [CrossRef]
- Scribner, K.T.; Gust, J.R.; Fields, R.L. Isolation and characterization of novel salmon microsatellite loci: Cross-species amplification and population genetic applications. Can. J. Fish. Aquat. Sci. 1996, 53, 833–841. [Google Scholar] [CrossRef]
- Thorsen, J.; Zhu, B.; Frengen, E.; Osoegawa, K.; de Jong, P.J.; Koop, B.F.; Davidson, W.S.; Høyheim, B. A highly redundant BAC library of Atlantic salmon (Salmo salar): An important tool for salmon projects. BMC Genom. 2005, 6, 50. [Google Scholar] [CrossRef] [PubMed] [Green Version]
- Rousset, F. GENEPOP’007: A complete re-implementation of the GENEPOP software for Windows and Linux. Mol. Ecol. Resour. 2008, 8, 103–106. [Google Scholar] [CrossRef] [PubMed]
- Chapuis, M.P.; Estoup, A. Microsatellite null alleles and estimation of population differentiation. Mol. Biol. Evol. 2007, 24, 621–631. [Google Scholar] [CrossRef] [Green Version]
- Excoffier, L.; Lischer, H.E.L. Arlequin suite ver 3.5: A new series of programs to perform population genetics analyses under Linux and Windows. Mol. Ecol. Res. 2010, 10, 564–567. [Google Scholar] [CrossRef] [PubMed]
- Adamack, A.T.; Gruber, B. PopGenReport: Simplifying basic population genetic analyses in R. Methods Ecol. Evol. 2014, 5, 384–387. [Google Scholar] [CrossRef]
- Hammer, Ø.; Harper, D.A.T.; Ryan, P.D. Past: Paleontological statistics software package for education and data analysis. Palaeontol. Electron. 2001, 4. Available online: https://palaeo-electronica.org/2001_1/past/issue1_01.htm (accessed on 20 September 2021).
- Pritchard, J.K.; Stephens, M.; Donnelly, P. Inference of population structure using multilocus genotype data. Genetics 2000, 155, 945–959. [Google Scholar] [CrossRef]
- Kopelman, N.M.; Mayzel, J.; Jakobsson, M.; Rosenberg, N.A.; Mayrose, I. CLUMPAK: A program for identifying clustering modes and packaging population structure inferences across K. Mol. Ecol. Resour. 2015, 15, 1179–1191. [Google Scholar] [CrossRef] [PubMed] [Green Version]
- Evanno, G.; Regnaut, S.; Goudet, J. Detecting the number of clusters of individuals using the software STRUCTURE: A simulation study. Mol. Ecol. 2005, 14, 2611–2620. [Google Scholar] [CrossRef] [PubMed] [Green Version]
- Li, Y.L.; Liu, J.X. StructureSelector: A web-based software to select and visualize the optimal number of clusters using multiple methods. Mol. Ecol. Resour. 2018, 18, 176–177. [Google Scholar] [CrossRef] [PubMed]
- Jombart, T. Adegenet: A R package for the multivariate analysis of genetic markers. Bioinformatics 2008, 24, 1403–1405. [Google Scholar] [CrossRef] [PubMed] [Green Version]
- Jombart, T.; Devillard, S.; Balloux, F. Discriminant analysis of principal components: A new method for the analysis of genetically structured populations. BMC Genet. 2010, 11, 94. [Google Scholar] [CrossRef] [Green Version]
- Piry, S.; Alapetite, A.; Cornuet, J.M.; Paetkau, D.; Baudouin, L.; Estoup, A. GENECLASS2: A Software for genetic assignment and first-generation migrant detection. J. Hered. 2004, 95, 536–539. [Google Scholar] [CrossRef]
- Rannala, B.; Mountain, J.L. Detecting immigration by using multilocus genotypes. Proc. Natl. Acad. Sci. USA 1997, 94, 9197–9201. [Google Scholar] [CrossRef] [Green Version]
- Wang, J. A new method for estimating effective population sizes from a single sample of multilocus genotypes. Mol. Ecol. 2009, 18, 2148–2164. [Google Scholar] [CrossRef]
- Serbezov, D.; Bernatchez, L.; Olsen, E.M.; VØllestad, L.A. Mating patterns and determinants of individual reproductive success in brown trout (Salmo trutta) revealed by parentage analysis of an entire stream living population. Mol. Ecol. 2010, 19, 3193–3205. [Google Scholar] [CrossRef]
- Piry, S.; Luikart, G.; Cornuet, J.-M. BOTTLENECK: A computer program for detecting recent reductions in the effective population size using allele frequency data. J. Hered. 1999, 90, 502–503. [Google Scholar] [CrossRef]
- Splendiani, A.; Giovannotti, M.; Nisi Cerioni, P.; Caniglia, M.L.; Caputo, V. Phylogeographic inferences on the native brown trout mtDNA variation in central Italy. Ital. J. Zool. 2006, 73, 179–189. [Google Scholar] [CrossRef] [Green Version]
- Delling, B.; Sabatini, A.; Muracciole, S.; Tougard, C.; Berrebi, P. Morphologic and genetic characterization of Corsican and Sardinian trout with comments on Salmo taxonomy. Knowl. Manag. Aquat. Ecosyst. 2020, 421, 21. [Google Scholar] [CrossRef]
- Thaulow, J.; Borgstrøm, R.; Heun, M. Brown trout population structure highly affected by multiple stocking and river diversion in a high mountain national park. Conserv. Genet. 2013, 14, 145–158. [Google Scholar] [CrossRef]
- Torterotot, J.B.; Perrier, C.; Bergeron, N.E.; Bernatchez, L. Influence of forest road culverts and waterfalls on the fine-scale distribution of brook trout genetic diversity in a boreal watershed. Trans. Am. Fish. Soc. 2014, 143, 1577–1591. [Google Scholar] [CrossRef]
- Almodóvar, A.; Nicola, G.G.; Elvira, B.; García-Marín, J.L. Introgression variability among Iberian brown trout Evolutionary Significant Units: The influence of local management and environmental features. Freshw. Biol. 2006, 51, 1175–1187. [Google Scholar] [CrossRef]
- Consuegra, S.; Phillips, N.; Gajardo, G.; Garcia de Leaniz, C. Winning the invasion roulette: Escapes from fish farms increase admixture and facilitate establishment of non-native rainbow trout. Evol. Appl. 2011, 4, 660–671. [Google Scholar] [CrossRef] [PubMed]
- Rius, M.; Darling, J.A. How important is intraspecific genetic admixture to the success of colonising populations? Trends Ecol. Evol. 2014, 29, 233–242. [Google Scholar] [CrossRef]
- Berrebi, P.; Horvath, A.; Splendiani, A.; Palm, S.; Bernaś, R. Genetic diversity of domestic brown trout stocks in Europe. Aquaculture 2021, 544, 737043. [Google Scholar] [CrossRef]
- Hänfling, B. Understanding the establishment success of non-indigenous fishes: Lessons from population genetics. J. Fish Biol. 2007, 71 (Suppl. D), 115–135. [Google Scholar] [CrossRef]
- Miller, L.M.; Close, T.; Kapuscinski, R. Lower fitness of hatchery and hybrid rainbow trout compared to naturalized populations in Lake Superior tributaries. Mol. Ecol. 2004, 13, 3379–3388. [Google Scholar] [CrossRef]
- Hansen, M.M.; Fraser, D.J.; Meier, K.; Mensberg, K.L.D. Sixty years of anthropogenic pressure: A spatio-temporal genetic analysis of brown trout populations subject to stocking and population declines. Mol. Ecol. 2009, 18, 2549–2562. [Google Scholar] [CrossRef]
- Wollebaek, J.; Knut, H.R.; Brabrand, A.; Heggenes, J. Interbreeding of genetically distinct native brown trout (Salmo trutta) populations designates offspring fitness. Aquaculture 2012, 356, 158–168. [Google Scholar] [CrossRef]
- Garcia de Leaniz, C.; Fleming, I.A.; Einum, S.; Verspoor, E.; Jordan, W.C.; Consuegra, S.; Aubin-Horth, N.; Laius, D.; Letcher, B.H.; Youngson, A.F.; et al. A critical review of adaptive genetic variation in Atlantic salmon: Implications for conservation. Biol. Rev. 2007, 82, 173–211. [Google Scholar] [CrossRef]
- Garcia-Marín, J.L.; Araguas, R.M.; Vera, M.; Sanz, N. Understanding the Brown Trout Population Genetic Structure in the Iberian Peninsula. In Brown Trout: Biology, Ecology and Management; Lobón Cerviá, J., Sanz, N., Eds.; John Wiley & Sons Ltd.: Chichester, UK, 2018; pp. 103–126. [Google Scholar]
- White, S.L.; Miller, W.L.; Dowell, S.A.; Bartron, M.L.; Wagner, T. Limited hatchery introgression into wild brook trout (Salvelinus fontinalis) populations despite reoccurring stocking. Evol. Appl. 2018, 11, 1567–1581. [Google Scholar] [CrossRef]
- Hansen, M.M.; Ruzzante, D.E.; Nielsen, E.E.; Mensberg, K.L.D. Microsatellite and mitochondrial DNA polymorphism reveals life-history dependent interbreeding between hatchery and wild brown trout (Salmo trutta L.). Mol. Ecol. 2000, 9, 583–594. [Google Scholar] [CrossRef]
- Querci, G.; Pecchioli, E.; Leonzio, C.; Frati, F.; Nardi, F. Molecular characterization and hybridization in Salmo (trutta) macrostigma morphotypes from Central Italy. Hydrobiologia 2013, 702, 191–200. [Google Scholar] [CrossRef]
- Mezzera, M.; Largiadèr, C.R. Evidence for selective angling of introduced trout and their hybrids in a stocked brown trout population. J. Fish Biol. 2001, 59, 287–301. [Google Scholar] [CrossRef]
- Hargrove, J.S.; Kazyak, D.C.; Lubinski, B.A.; Rogers, K.M.; Bowers, O.K.; Fesenmyer, K.A.; Habera, J.W.; Henegar, J. Landscape and stocking effects on population genetics of Tennessee Brook Trout. Conserv. Genet. 2021; in press. [Google Scholar] [CrossRef]
- Saha, A.; Andersson, A.; Kurland, S.; Keehnen, N.L.P.; Kutschera, V.E.; Hössjer, O.; Ekman, D.; Karlsson, S.; Kardos, M.; Ståhl, G.; et al. Whole-genome resequencing confirms reproductive isolation between sympatric demes of brown trout (Salmo trutta) detected with allozymes. Mol. Ecol. 2022, 31, 498–511. [Google Scholar] [CrossRef] [PubMed]
Figure 1.
Frequency and geographic distribution of 11 Control Region (CR) haplotypes across seven wild sampling sites from three drainage basins in central Italy. Population abbreviations refer to Table 1; pie charts are proportional to sample sizes.
Figure 1.
Frequency and geographic distribution of 11 Control Region (CR) haplotypes across seven wild sampling sites from three drainage basins in central Italy. Population abbreviations refer to Table 1; pie charts are proportional to sample sizes.

Figure 2.
Second-order polynomial regression between the frequency of the domestic LDH-C1*90 allele and measures of genetic diversity (allele/haplotype richness, expected heterozygosity), based on 11 STR loci (A,B), the MHC-DAB gene (C,D), and the Control Region (E). For each model, the R-squared, the F-statistic, the p-value, and the 95% confidence intervals (in grey) are shown. Population abbreviations refer to Table 1.

Figure 3.
Non-metric two-dimensional scaling of the pairwise genetic distance (Fst or Φst) matrix computed for: (A) 11 STR loci; (B) the MHC-DAB gene; and (C) the mitochondrial Control Region. Population abbreviations as in Table 1.
Figure 3.
Non-metric two-dimensional scaling of the pairwise genetic distance (Fst or Φst) matrix computed for: (A) 11 STR loci; (B) the MHC-DAB gene; and (C) the mitochondrial Control Region. Population abbreviations as in Table 1.

Figure 4.
Barplots of individual, STR-based admixture as obtained through the Bayesian clustering analysis in Structure (above) and the Dapc assignment procedure (below) for the optimal number of inferred clusters (K = 6). Population abbreviations refer to Table 1.
Figure 4.
Barplots of individual, STR-based admixture as obtained through the Bayesian clustering analysis in Structure (above) and the Dapc assignment procedure (below) for the optimal number of inferred clusters (K = 6). Population abbreviations refer to Table 1.


Table 1.
Geographic and ecological features of seven sampling sites (Pop) of Mediterranean brown trout from central Italy. The Datum for geographic coordinates is WGS84; SAC stands for Special Area of Conservation; temperatures of water (Water T°) was measured three times per site in August.
Table 1.
Geographic and ecological features of seven sampling sites (Pop) of Mediterranean brown trout from central Italy. The Datum for geographic coordinates is WGS84; SAC stands for Special Area of Conservation; temperatures of water (Water T°) was measured three times per site in August.
| Pop | River Catchment | Drainage Basin (Outlet) | Lat° (N) | Lon° (E) | Elev. (m) | Water T° (± SE) | Fish Assemblage | River Substrate | Protected Area |
|---|---|---|---|---|---|---|---|---|---|
| CAR | Carpello | Liri-Garigliano (Tyrrhenian Sea) | 41.70 | 13.68 | 293 | 11.4 (±0.2) | Gasterosteus aculeatus | Gravel and aquatic macrophytes | SAC, Regional Natural Reserve |
| MEL | Melfa | Liri-Garigliano (Tyrrhenian Sea) | 41.70 | 13.91 | 1159 | 8.8 (±0.1) | - | Boulder, pebbles, gravel | SAC, National Park |
| RAP | Rapido | Liri-Garigliano (Tyrrhenian Sea) | 41.56 | 13.88 | 154 | 13.6 (±0.0) | - | Pebbles, gravel | - |
| SCR | Santa Croce | Santa Croce (Tyrrhenian Sea) | 41.29 | 13.71 | 37 | 13.7 (±0.2) | Anguilla anguilla, Lampetra planeri, Sarmarutilus rubilio, Squalius squalus | Gravel and aquatic macrophytes | SAC, close to Regional Park |
| SIM1 | Simbrivio | Tiber (Tyrrhenian Sea) | 41.94 | 13.24 | 794 | 11.3 (±0.1) | - | Boulder, pebbles, gravel | SAC, Regional Park |
| SIM2 | Simbrivio | Tiber (Tyrrhenian Sea) | 41.92 | 13.22 | 701 | 12.0 (±0.2) | - | Pebbles, gravel | SAC, Regional Park |
| TRO | Tronto | Tronto (Adriatic Sea) | 42.73 | 13.26 | 693 | 10.7 (±0.1) | - | Pebbles, gravel | - |
Table 2.
Genetic variability parameters for each marker across seven Mediterranean brown trout sampling sites (Pop). N, number of individuals collected and analyzed for CR, LDH-C1, and STRs; NMHC, number of individuals analyzed at the MHC-DAB locus; H, number of haplotypes and of private haplotypes (Hp); Hr, haplotype richness; Hd, haplotype diversity; π, nucleotide diversity; * 90, frequency of the Atlantic LDH-C1*90 allele; A, number of alleles and of private alleles (Ap); Ar, allelic richness; Ne, effective population size.
| CR | LDH-C1 | 11 STR loci | MHC-DAB | |||||||||||||||||
|---|---|---|---|---|---|---|---|---|---|---|---|---|---|---|---|---|---|---|---|---|
| Pop | N (NMHC) | H (Hp) | Hr | Hd (±SE) | π% (±SE) | *90 | Ho | He | A (Ap) | Ar | Ho (±SE) | He (±SE) | Ne (95% CI) | A (Ap) | Ar | Ho | He | |||
| CAR | 30 (28) | 1 (1) | 1.00 | - - | - - | 0.13 | 0.27 | 0.24 | 7.09 (1.45) | 4.92 | 0.47 (0.09) | 0.52 (0.10) | 40 (24–71) | 13 (6) | 8.35 | 0.86 | 0.81 | |||
| MEL | 30 (27) | 2 (0) | 1.86 | 0.19 (0.09) | 0.034 (0.05) | 0.90 | 0.20 | 0.18 | 6.18 (0.45) | 5.21 | 0.69 (0.06) | 0.73 (0.05) | 34 (21–62) | 12 (2) | 8.31 | 0.81 | 0.84 | |||
| RAP | 30 (25) | 3 (0) | 2.72 | 0.58 (0.04) | 0.471 (0.289) | 0.52 | 0.43 | 0.51 | 7.55 (0.73) | 5.95 | 0.78 (0.08) | 0.73 (0.07) | 17 (9–35) | 12 (5) | 8.47 | 0.88 | 0.83 | |||
| SCR | 30 (26) | 2 (1) | 1.99 | 0.37 (0.08) | 0.408 (0.258) | 0.05 | 0.10 | 0.10 | 5.09 (1.00) | 3.83 | 0.41 (0.08) | 0.41 (0.07) | 34 (22–60) | 7 (3) | 5.28 | 0.65 | 0.75 | |||
| SIM1 | 16 (15) | 3 (0) | 2.88 | 0.43 (0.13) | 0.501 (0.314) | 0.28 | 0.44 | 0.42 | 8.36 (0.73) | 6.93 | 0.74 (0.06) | 0.74 (0.05) | 45 (24–95) | 15 (3) | 10.80 | 0.60 | 0.84 | |||
| SIM2 | 14 (12) | 3 (1) | 3.00 | 0.54 (0.11) | 0.591 (0.364) | 0.61 | 0.36 | 0.49 | 8.09 (0.73) | 6.82 | 0.68 (0.05) | 0.75 (0.06) | 88 (35–∞) | 14 (5) | 11.67 | 0.75 | 0.94 | |||
| TRO | 25 (23) | 6 (2) | 5.12 | 0.77 (0.05) | 0.677 (0.394) | 0.44 | 0.40 | 0.50 | 10.09 (1.73) | 7.44 | 0.75 (0.05) | 0.77 (0.05) | 54 (32–104) | 20 (11) | 12.89 | 0.91 | 0.92 | |||
Table 3.
AMOVA hierarchical analysis examining the partitioning of genetic variance of nuclear loci (STR and MHC-DAB) and mitochondrial DNA Control Region (CR) according to different hypothesized structures: no structure (one group), drainage basins (four groups), mountain and lowland (two groups). The amount of variation (%) explained by differences among groups, among populations within groups, and within populations, along with the p-values (statistically significant values are in bold) are given.
| Grouping | Hierarchical Level | nDNA | mtDNA | ||||
|---|---|---|---|---|---|---|---|
| 11 STR | MHC-DAB | CR (K2P) | |||||
| Variation | p | Variation | p | Variation | p | ||
| One group | Among populations | 21.96 | 0.000 | 15.08 | 0.000 | 62.77 | 0.000 |
| Within populations | 78.04 | 0.000 | 84.92 | 0.000 | 37.23 | 0.000 | |
| Four groups: drainage basins CAR/MEL/RAP vs. SCR vs. SIM1/SIM2 vs. TRO | Among groups | 4.61 | 0.273 | 1.05 | 0.393 | −28.78 | 0.899 |
| Among populations within groups | 18.16 | 0.000 | 14.23 | 0.000 | 89.13 | 0.000 | |
| Within populations | 77.23 | 0.000 | 84.72 | 0.000 | 39.64 | 0.000 | |
| Two groups: mountain vs. lowland CAR/RAP/SCR vs. MEL/SIM1/SIM2/TRO | Among groups | 2.06 | 0.231 | −0.13 | 0.574 | 3.53 | 0.463 |
| Among populations within groups | 20.56 | 0.000 | 15.16 | 0.000 | 59.78 | 0.000 | |
| Within populations | 77.38 | 0.000 | 84.96 | 0.000 | 36.69 | 0.000 | |
Publisher’s Note: MDPI stays neutral with regard to jurisdictional claims in published maps and institutional affiliations. |
© 2022 by the authors. Licensee MDPI, Basel, Switzerland. This article is an open access article distributed under the terms and conditions of the Creative Commons Attribution (CC BY) license (https://creativecommons.org/licenses/by/4.0/).
Share and Cite
MDPI and ACS Style
Rossi, A.R.; Talarico, L.; Petrosino, G.; Crescenzo, S.; Tancioni, L. Conservation Genetics of Mediterranean Brown Trout in Central Italy (Latium): A Multi-Marker Approach. Water 2022, 14, 937. https://doi.org/10.3390/w14060937
AMA Style
Rossi AR, Talarico L, Petrosino G, Crescenzo S, Tancioni L. Conservation Genetics of Mediterranean Brown Trout in Central Italy (Latium): A Multi-Marker Approach. Water. 2022; 14(6):937. https://doi.org/10.3390/w14060937
Chicago/Turabian StyleRossi, Anna Rita, Lorenzo Talarico, Gerardo Petrosino, Simone Crescenzo, and Lorenzo Tancioni. 2022. "Conservation Genetics of Mediterranean Brown Trout in Central Italy (Latium): A Multi-Marker Approach" Water 14, no. 6: 937. https://doi.org/10.3390/w14060937
Note that from the first issue of 2016, this journal uses article numbers instead of page numbers. See further details here.