Article

Water Footprint of the Water Cycle of Gran Canaria and Tenerife (Canary Islands, Spain)

by
Noelia Cruz-Pérez
1,
Juan C. Santamarta
1,2,*,
Alejandro García-Gil
3,
Jesica Rodríguez-Martín
4,
Fernando Miralles-Wilhelm
2,
Anastasia Hernández-Alemán
5 and
Maite M. Aldaya
6
1
Departamento de Ingeniería Agraria y del Medio Natural, Universidad de La Laguna (ULL), 38200 Tenerife, Spain
2
Department of Atmospheric, Oceanic and Earth Sciences, George Mason University, Fairfax, VA 22030, USA
3
Geological Survey of Spain (IGME-CSIC), C/Ríos Rosas 23, 28003 Madrid, Spain
4
Departamento Técnicas y Proyectos en Ingeniería y Arquitectura, Universidad de La Laguna (ULL), 38200 Tenerife, Spain
5
Instituto de Turismo y Desarrollo Económico Sostenible (TiDeS), University of Las Palmas de Gran Canaria, 35001 Las Palmas, Spain
6
Institute on Innovation & Sustainable Development in the Food Chain (IS-FOOD), Public University of Navarra (UPNA), Jerónimo de Ayanz Building, Arrosadia Campus, 31006 Pamplona, Spain
*
Author to whom correspondence should be addressed.
Water 2022, 14(6), 934; https://doi.org/10.3390/w14060934
Submission received: 9 February 2022 / Revised: 13 March 2022 / Accepted: 15 March 2022 / Published: 17 March 2022
(This article belongs to the Section Water Use and Scarcity)

Abstract

:
When it comes to exploiting natural resources, islands have limitations due to the quantity of these resources and the potential for harm to the ecosystem if exploitation is not done in a sustainable manner. This article presents a study of the water footprint of the different drinking water collection facilities and wastewater treatment facilities in the Canary Islands, in order to determine the blue, green, and grey water footprints in each case. The results show high percentages of drinking water losses, which raises the blue water footprint of the Canary Islands archipelago. The grey water footprint was studied in terms of Biochemical Oxygen Demand (BOD5). The green water footprint was not considered because it is a dimension of the water footprint mainly calculated for agricultural crops. Of the facilities studied, the wells for extraction of drinking water from the aquifer and the distribution network have the largest blue water footprint for the years under study (2019 and 2020). Only the wastewater treatment plants have a gray water footprint in this study, with values between 79,000 and 108,000 m3 per year. As a general conclusion, the most important factor in reducing the water footprint of the water cycle in the Canary Islands is optimization of the water resource, improving existing infrastructures to minimize losses, and implementing a greater circular economy that reuses water on a regular basis.

1. Introduction

The impacts of climate change affect livelihoods, health, ecosystems, the economy, and society. These impacts are the result of the interaction of variations in climate and the vulnerability of systems exposed to them [1]. Changes in rainfall rates and temperature, the emergence of agricultural pests, and variability in water availability are among other impacts affecting livelihoods (agriculture and livestock) [2]. There will also be effects on ecosystems due to the physiological and demographic changes that modify their functioning [3]. All of these environmental implications are interconnected, and one element they have in common is the availability of clean water.
In addition to the expected general environmental impacts, it should be noted that climate change may be even more problematic on islands [4]. Islands are particularly vulnerable to climate change [5] due to their small size, their concentrated population in coastal areas, and their reduced availability of natural resources. The islands are characterized as tourist destinations, where services can only be guaranteed by the availability of water [6]. All islands in the world have developed systems, sometimes unique, to obtain drinking water, such as the water galleries in the Canary Islands [7] and horizontal rainwater harvesting in Hawaii [8]. However, the predominant system on islands that guarantees the availability of water is seawater desalination [9]. Seawater desalination also involves a water-energy nexus that has been the result of studies on European islands [10].
Unlike the Mediterranean islands, which enjoy a desert climate in summer and a large influx of tourists during those months [11], the Canary Islands have a subtropical climate and a constant tourist flow throughout the year, increasing slightly in winter. Therefore, the Canary Islands have a high and constant water demand throughout the year [12]. Among other sectors, this affects the production and management of drinking water in the Canary Islands. This production can be divided between the western and eastern islands [13]:
  • Eastern Islands: this group of islands (Gran Canaria, Fuerteventura, and Lanzarote) lacks the same availability of groundwater resources as the western islands. This is why desalination has played an important role on these islands since the 1970s, especially on Fuerteventura and Lanzarote [14]. On the island of Gran Canaria, surface water resources are important, and the island has 75 large dams [15], although the exploitation of underground water resources, with wells and water galleries, is also relevant [16].
  • Western islands: these islands (Tenerife, La Palma, La Gomera, and El Hierro) are rich in groundwater; approximately 80% of the drinking water demand is covered through groundwater.
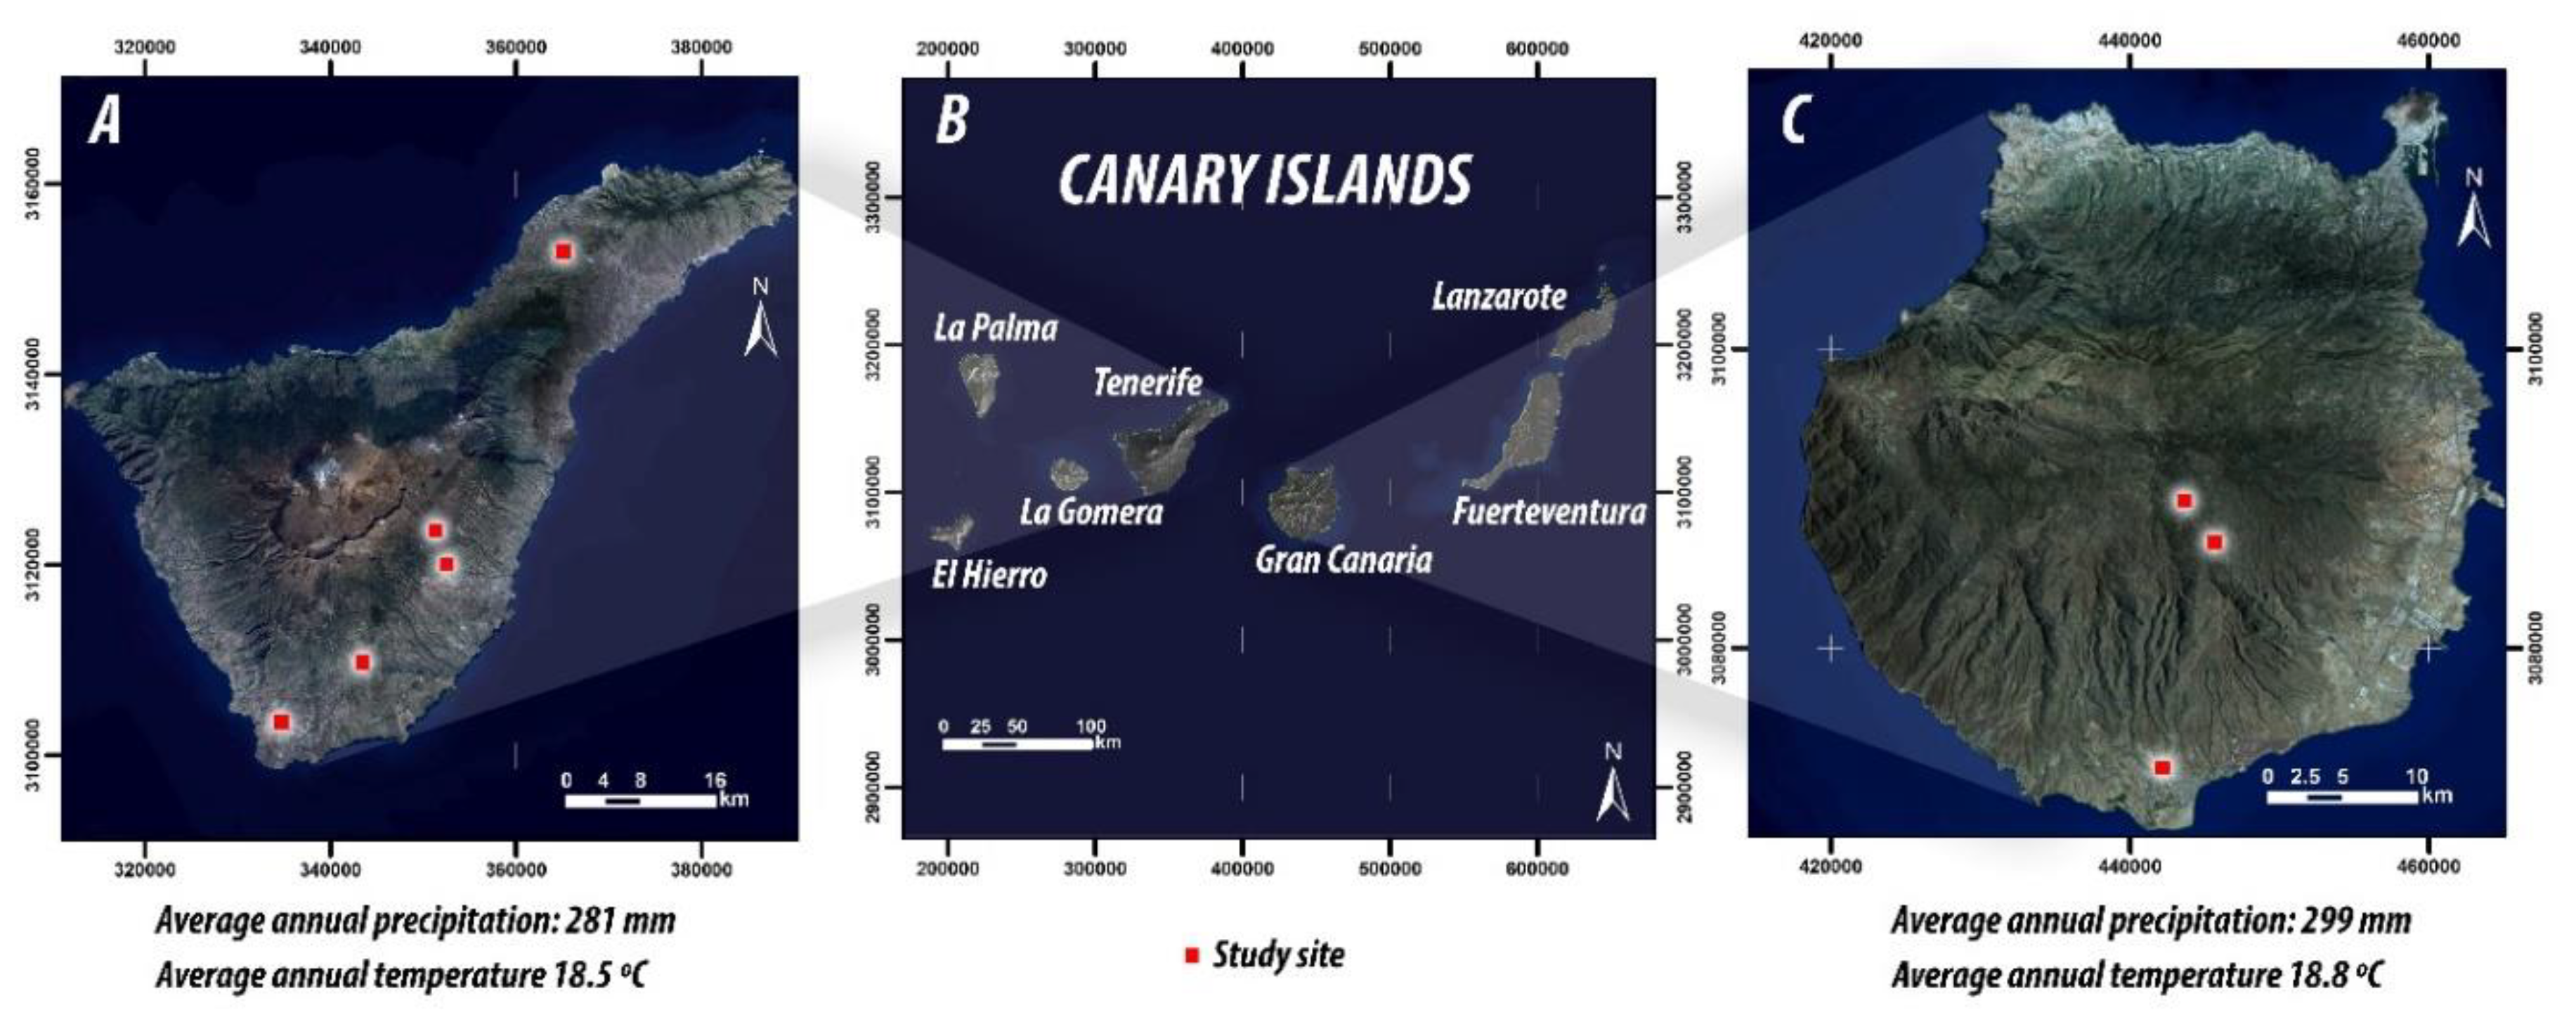
The diverse sources of water in the islands depend on the island studied. The eastern islands, such as Lanzarote and Fuerteventura, have a lower relief compared to the rest of the islands in the archipelago. They have utilized seawater desalination for over thirty years [17]. Due to their orographic conditions, they have less annual rainfall and, therefore, fewer surface and groundwater resources. However, in the western islands such as La Palma or Tenerife, groundwater resources represent a high percentage of water availability, which helps supply different demands (agricultural, industrial, urban, and tourist) [18]. In the specific case of the island of Tenerife, the island’s aquifer has been exploited since 1920 through the construction of galleries and wells by private initiatives [19]. The intensification of demand for water on the island, mainly due to agricultural and tourist activity, has meant that the previous state of equilibrium has been lost [20].
The quantity of water that is lost before reaching the end user must be added to this water model. This wasted water refers to water losses (see Figure 1) along the water distribution networks, which are estimated at 60% on Tenerife and at 30% on Gran Canaria (data obtained from the Institute of Statistics of the Canary Islands). Therefore, in addition to the water needs derived from agriculture and urban use (including tourism), nearly half the water obtained from the sea or from subway and/or surface water resources is lost along the network.
In the Canary Islands, studies have been done on the availability of water and the carbon footprint associated with some water facilities, such as desalination plants [21] or hotel water supply [22], but the water footprint associated with the production of drinking water in the Canary Islands has not been specifically studied.
Therefore, this article focuses on calculation of the water footprint of infrastructure facilities that are part of the water cycle in the Canary Islands, such as desalination plants, wastewater treatment plants, and water galleries and/or water wells that pump water extracted from aquifers. Specifically, the study focuses on the islands of Tenerife (west side) and Gran Canaria (east side), working with data from 2019 and 2020. Diversification of water supply and water management in the Canary Islands is key as it is constrained by climate variability (alternating years with abundant rainfall and drought years), mountainous landscape, size, and isolation from the mainland [18,23]. To this end, we have used the water footprint methodology defined by the Water Footprint Network (WFN), to define for the first time the water footprint of facilities linked to the integral water cycle in the Canary Islands.

Study Area

The Canary Islands, located off the coast of the Sahara Desert, consist of eight islands that are an outermost region of Spain. They are located within a region known as Macaronesia and are characterized by a subtropical climate, with abundant microclimates within the islands. Average annual temperatures range between 18 and 25°, and the average annual rainfall is approximately 600 mm [24].
The Canary Islands have two capitals, one for each province of the archipelago, Tenerife and Gran Canaria. This study focuses on these two islands, selecting five infrastructure facilities on the island of Tenerife and three on the island of Gran Canaria. The island of Tenerife is more represented as it has one infrastructure facility of each type: a water gallery, a well, a drinking water distribution network for an entire municipality, a desalination plant, and a wastewater treatment plant. On the island of Gran Canaria, a desalination plant in the south and two wells in the center of the island were selected (see Figure 2).
The Tenerife Island Water Council (CIATF) compiled and reviewed historical meteorological information, which led to the composition of a series of rain and temperature records for the whole island over 60 years (1944/2004). The results of this study show that the effects of climate change are already appreciable, with a trend towards a decrease of −3 mm/year [25]. The decrease in rainfall on the islands directly affects the recharge of the island aquifer since part of the rain is converted into infiltration. Therefore, when precipitation decreases, infiltration decreases and, consequently, recharge of the aquifer. One conclusion that can be drawn is that it is necessary to consider the option of managed aquifer recharge in the islands in the medium and long term [26]. Although this study was developed only on the island of Tenerife, it is useful to observe the trend in precipitation and temperature changes in the Canary Islands in general.
In socioeconomic terms, the Canary Islands will also face disadvantages arising from availability of water on the islands. As an illustration, if rainfall decreases, the aquifer recharge decreases, making it necessary to increase the islands’ desalination capacity, which, in turn, means greater energy consumption [27]. Furthermore, the potential episodes of drought will affect agriculture [28], increasing the archipelago’s dependence on the outside world.
It is important to know the water footprint of the main facilities that constitute the integral water cycle in the Canary Islands, so that water saving measures can be implemented more efficiently in the Canary archipelago. The archipelago is likely to face episodes of drought, with a water demand that is already high, mainly due to agriculture, tourism, and the local population. Tourism is not expected to decrease in the islands, nor is the local population expected to decrease in the medium or long term.

2. Materials and Methods

The sector under evaluation is the entire water cycle in Gran Canaria and Tenerife (Canary Islands), and the main facilities regarding this sector in the archipelago are described below:
  • Water galleries: tunnels dug into the interior of the islands in search of the aquifer. These excavations have a certain inclination and, once the aquifer is reached, the water is extracted by gravity without the need for pumping [29].
  • Wells: vertical boreholes of different diameters and depths that seek to reach the aquifer (mainly in coastal areas) to extract drinking water. It is very important to control the extraction flow rates in this type of infrastructure, to avoid saline intrusion and consequent deterioration of the quality of the water extracted [30].
  • Desalination: consists of obtaining seawater and removing the chlorides from it to make it suitable for human consumption [22]. Generally, a reverse osmosis process is used, consisting of the installation of semi-permeable membranes that eliminate the ions and make the water drinkable.
  • Wastewater treatment plants: a facility that collects the wastewater generated in a city or company and, through physicochemical processes, removes the physicochemical pollutants from it. In this way, the water can be run through a tertiary treatment that allows it to be reused, or it can be discharged into a watercourse following a procedure in accordance with the applicable legislation.
Two private companies provided us with the necessary data for this study. A questionnaire was sent to them, which helped determine the water footprint of each facility. The questionnaire was structured as open-ended questions, regarding the following aspects:
  • Water wells and galleries: flow extracted from the aquifer by these facilities, facility-related water losses not returning to the system (after water abstraction), and reuse of water in any process.
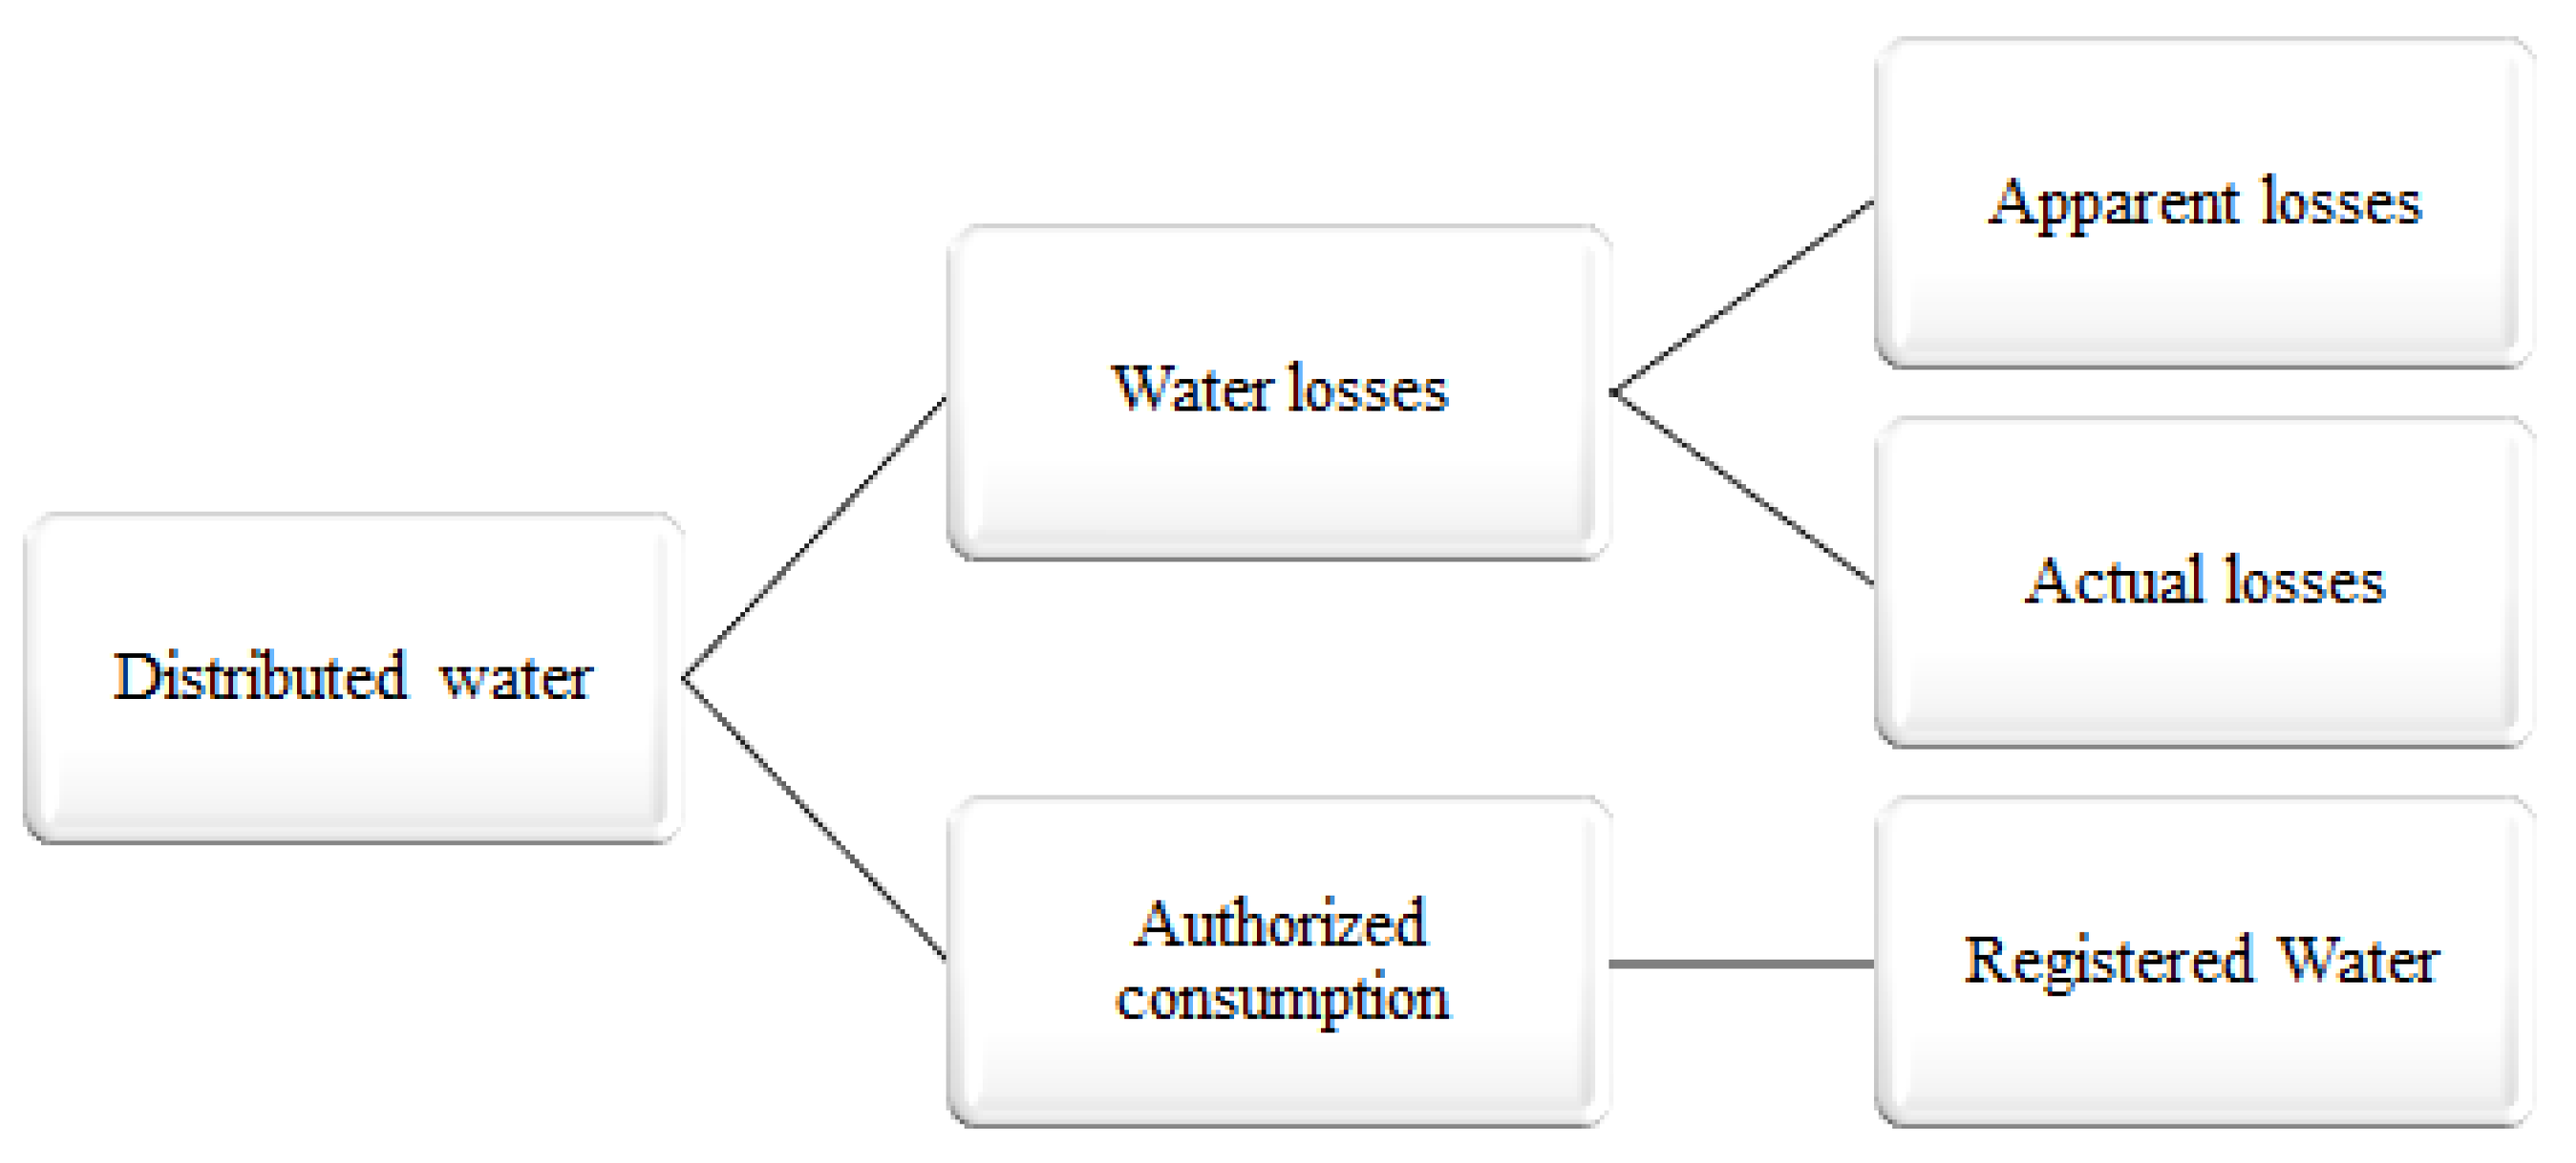
  • Distribution network: measuring the water flowing through the network, as well as the water losses along the system.
  • Wastewater treatment plant: flow of water treated, most important pollutant(s) found in the water and concentration value(s), volume of drinking water used, destination of the treated effluent, reuse of water, and disposal of the sludge generated.
  • Seawater desalination plant: flow obtained from the sea, flow of drinking water used in the facility, total desalinated flow, and reuse of water.
All processes that contribute significantly to the overall water footprint should be included in the calculation of a water footprint. The selected methodology was proposed by the WFN [31]. An assessment of the water footprint components is made, including direct and indirect components, as a global study of water consumption gives a more accurate picture of the resources consumed within each activity. This study does not analyze the indirect water footprint related to the following components as they were not significant: (i) the overhead supply chain (freshwater use associated with supporting materials used in the business, for example, the freshwater use behind the concrete and steel used in the factory and machinery), as it is negligible according to Ercin et al. [32]; (ii) the water consumed by the electricity supplier as the energy mix does not involve water-intensive biofuels or hydropower. With regard to the direct water footprint, this study has excluded drinking water consumed for cooling the machines as they are a closed loop system.
The three dimensions of direct or indirect water footprint are outlined hereafter.

2.1. Blue Water

Consumptive water use, which encompasses any of four processes [31]: evaporation of water, water incorporated into a product, water that does not return to the same catchment area, or water that does not return in the same period. The formulation used in this case would be as follows (Equation (1)):
WFblue = blue water evaporation + blue water incorporation + lost return flow
For water galleries and wells, all water abstracted from the aquifer by the installation has been accounted for, to indicate the total volume abstracted. However, this would be the blue water footprint attributed to the end user and not to the operator. For this reason, freshwater losses have only been accounted for in the groundwater facilities, in regard to blue water footprint. The percentage of water lost from the total captured by these groundwater collection facilities has been requested.
This study considers the percentage of water lost along the distribution route since it is water that has been obtained from a specific source and does not reach the end user (is lost along the way).
For water processing facilities, only the consumptive use of blue water in the industrial process has been accounted for in desalination plants. However, in water treatment plants, as the values for water evaporation are not known and, since the electricity mix of the suppliers does not contain a hydropower or biofuel source, the remaining water that can be used in energy production is considered minimal and is not counted here.

2.2. Grey Water

Grey water is the amount of water that remains contaminated after or during the industrial process. It is defined as the volume of fresh water necessary to assimilate the pollutant load until it reaches the levels required by current ambient water quality regulations (Equation (2)). It is calculated by dividing the pollutant load (L) by the difference between the ambient water quality standard for that pollutant and its natural concentration in the receiving water body [32].
WFgrey = (L × Cwat)/(Cmax − Cnat),
where
L = volume of polluted water; Cwat = concentration of the pollutant in the polluted water; Cmax = maximum concentration of the pollutant; and Cnat = natural concentration of the pollutant.
The values of L and Cwat were obtained from information provided by the private water companies, and the values of Cmax and Cnat were obtained from current regulations applicable in the study area. According to current Spanish wastewater regulations, the maximum value for BOD5 concentration in discharge is 25 mg/L [33]. The natural concentration value of this parameter is zero, according to recent studies [34]. Since several pollutants can typically be found in water, the grey water footprint is determined by the most critical pollutant associated with the largest grey water footprint of the critical substance, in this case BOD5 (mg/L).
The grey water footprint was calculated using the methodology proposed by Morera et al. [35] for wastewater treatment plants. This is the application of the WFN methodology to wastewater treatment plants. Prior to the study by Morera et al. [35], only two previous studies concerning the water footprint of wastewater had been conducted [36,37]. This study showed that the grey water footprint of a wastewater treatment plant has the highest value of the water footprint components, with the blue water footprint being considerably lower, and is mainly due to the production of electricity. The equation that is proposed by Morera et al. [35] is shown in Equation (3):
WFgrey = max [WFgrey(p) = (Qe × (ce(p) − cmax(p))/(cmax(p) − cnat(p))],
The grey water footprint of water galleries, wells, and distribution networks has not been calculated as they are facilities that do not deal with contaminated water. The grey water footprint of desalination plants has been disregarded since the reject water from a desalination plant is seawater with a higher salt concentration, and, because the reject water is discharged back into the sea, it is not counted as grey water either.
Although it is not included in the water footprint, the correct management of the brine from a desalination plant is key to assessing the environmental performance of this facility [38].

2.3. Green Water

This indicator is particularly important in the agricultural and forestry sector but is practically negligible in the rest of the water footprint calculations [39]; therefore, it is not included in this article (Equation (4)):
WFgreen = evaporation of green water + incorporation of green water,

3. Results and Discussion

In total, eight facilities (five on the island of Tenerife and three on the island of Gran Canaria) were studied for the years 2019 and 2020. Table 1 shows the main characteristics of the systems analyzed, and Table 2 addresses the results for grey water footprint.
The volume of water extracted from wells and galleries differs, depending on usage, as well as the qualitative characteristics of the groundwater, where sustainable water flow rates are sometimes set to avoid excessive depletion of the aquifer [18]. It is also noticeable that, in most cases, the volume of water withdrawn was slightly lower in 2020 compared to 2019. It could be assumed that this decrease is due to the drastic reduction of tourist activity in the archipelago. However, the values are not significantly different from each other, which could also indicate that agriculture and urban use in the Canary Islands are the major water demand in the archipelago, regardless of tourism activity.
The highest blue water footprint value is that of the drinking water distribution network. Considering that the blue water in the distribution network is determined by the losses along the network, being many kilometres long and working with constant water flows, the losses that occur in these networks are higher than those of wells and galleries [40].
In the case of seawater desalination plants, although the volume of water extracted is high, this does not affect the water footprint as seawater is not a scarce resource and is typically excluded from a water footprint calculation [31]. Desalination is a way of substituting one scarce resource (freshwater) for another (energy). Additionally, it should be noted that, although it is not included in the water footprint, the correct management of the brine from a desalination plant is key to assessing environmental performance of this facility [38]. No studies have been found on the water footprint of desalination plants; however, numerous studies related to the carbon footprint have been found [22,41,42,43]. Desalination plants are facilities with high electricity consumption, which generate a water-energy balance that has been studied in detail around the world, in order to make this method of drinking water production more sustainable.
Regarding the grey water footprint, the wastewater treatment plant shows a grey water footprint related to BOD5 of 79,062 and 108,347 m3/year, for the years 2019 and 2020 respectively (Table 2). These values required to assimilate the pollutant load of the wastewater are low compared to the study of Morera et al. [35] for wastewater treatment plants in Spain. The main difference is that the analysis of Morera et al. was done for different types of water pollutants (such as nitrogen and phosphorus) and the treated flows were higher. There is no grey water footprint related to the rest of the facilities as they deal with drinking water that is not contaminated in the extraction process.
Although there are no specific studies on the water footprint of wastewater treatment plants, studies have been found that address the different pollutants that can be found in water. One of the most important is nitrogen, which is key to crop growth and soil health [44]. However, nitrogen often reaches the aquifer due to field irrigation, which washes the soil and incorporates the nitrogen on its way to the subsoil [45]. In the Murcia region of Spain, the effluent from 12 wastewater treatment plants was studied to determine the impact of emerging pollutants, especially in those flows reused in agriculture [46]. It was found that the treatment plants have a greater facility to remove common pollutants, but it is more difficult to remove emerging pollutants from water without tertiary treatment.
Climate forecasts predict a decrease in rainfall in the coming years [47], as well as an increase in temperatures and variability in winds (which may affect horizontal rainfall in the Canary Islands). It is therefore necessary to ensure that distribution of water resources on the islands of the archipelago is optimized, in order to minimize real and apparent water losses as much as possible. In addition, it is considered vital to increase the production of wastewater regeneration (reuse) in the Canary Islands, in order to reduce the demand for conventional and non-conventional resources [48]. However, it is necessary to apply the appropriate treatments to eliminate common contaminants and also those emerging from the water.
In the Canary Islands, there is no extensive literature dedicated to the water footprint of facilities in the archipelago. However, greenhouse gas emissions linked, above all, to tourist establishments have been exhaustively studied. The water-energy nexus is very strong, and this is especially true in facilities such as seawater desalination plants, where large amounts of energy are needed to produce drinking water [49]. This link between energy and water has led to the study of emissions, including, among other areas, the production of domestic hot water in hotels [50], and different types of membranes in desalination by reverse osmosis [51]. It has also been of interest to study emissions associated with tourist infrastructures such as hotels [22] and marinas [4]. Mitigation of greenhouse gas emissions is key, especially in isolated island areas, where there is usually a high dependence on fossil fuels [52], due to their insular situation. Often, despite having renewable energy sources, these have not been developed enough in the European Outermost Regions to turn the island territories into examples of sustainability, although this is the intention in the future with the sustainable development goals in the 2030 Agenda [53].

4. Conclusions

This study, for the first time, analyses the green, blue, and grey water footprint of eight facilities that are part of the water cycle in the two main Canary Islands, Tenerife and Gran Canaria. The facilities include desalination plants, wastewater treatment plants, water galleries, and water wells. The facilities with the largest amount of water abstracted are those related to the collection of drinking water, such as water galleries and wells. These are traditional water extraction systems, which abstract water from the natural environment to cover demand by society and industry. The water footprint is defined here by the losses of drinking water in the installation, which do not return to their place of origin, as is the case with the distribution networks. When looking at consumptive water use, the distribution network of water has the highest water footprint (i.e., consumptive losses), followed by wells and water galleries. The exception to this is seawater desalination plants. Although they generate drinking water, because the raw material is seawater, this is not included in calculating the water footprint. The environmental impact of the brine in these facilities must also be considered, not as part of the water footprint but as an environmental impact. Only in wastewater treatment plants has the grey water footprint been studied as it is the only facility that works with wastewater containing pollutants. The green water footprint has not been accounted for in any of the cases since it is not incorporated into the elements studied.
A characteristic of the Canary Islands is fluctuation in water availability within a year and between years. Because of the variation in water availability, water demand also varies over time. Therefore, in future research, it would be interesting to analyze fluctuations in the water footprint and water availability within and between years, in order to understand sustainability of water use. Diversification of water supply from different sources is crucial on islands, to adjust to fluctuating demand and supply, and to improve resilience to climate change.
In addition, it would be interesting to continue analyzing the characteristics and the management of drinking water collection facilities as well as distribution networks, to truly understand the extent of water losses and their impact on the water footprint of the archipelago. In the case of wastewater treatment plants, it would be interesting to continue the study of the grey water footprint for specific pollutants, such as nitrates, and to not focus only on BOD5.
In order to reduce the water footprint of the Canary Islands, it is necessary, above all, to reduce the generalized water demand. Water demand reduction is achieved through the installation of water resource optimization systems, especially in crop and green areas irrigation installations. In addition, monitoring of the networks is also required in order to quickly detect losses of drinking and/or waste water and to enable the operating and maintenance company to act quickly in situations that lead to a high waste of drinking water. Another of the key measures to improve water saving involves educating the population and tourism businesses. Hotels, for example, must take great care of the circular economy and this is passed on to the users of the facility. Users should be made aware of this effort and act accordingly. Businesses and government of the Canary Islands are increasingly aware of the importance of efficient management of the water abatement network, from catchment to purification, and more and more sustainable management measures are being observed. In addition, an increment in the use of treated water is vital to reduce pressure on the aquifer and to close the water cycle, optimizing resources without increasing demand.

Author Contributions

Conceptualization, N.C.-P. and M.M.A.; software, A.G.-G.; validation, J.C.S. and F.M.-W.; investigation, J.R.-M.; resources, A.H.-A.; data curation, A.G.-G. and A.H.-A.; writing—original draft preparation, N.C.-P.; writing—review and editing, M.M.A.; supervision, J.C.S. All authors have read and agreed to the published version of the manuscript.

Funding

This research was funded by the European Union’s Horizon 2020 research and innovation program under grant agreement 101037424, project ARSINOE (climate-resilient regions through systemic solutions and innovations).

Institutional Review Board Statement

Not applicable.

Informed Consent Statement

Not applicable.

Data Availability Statement

The data presented in this study are available on request from the corresponding author.

Acknowledgments

The development of this study has been possible thanks to the government of the Canary Islands, through the project “Analysis of the carbon and water footprint of the three main economic activities in the Canary Islands: Tourism, Agriculture and Integrated Water Cycle”, under grant agreement N° 20160026.

Conflicts of Interest

The authors declare no conflict of interest.

References

  1. IPCC. Climate Change 2014: Impacts, Adaptation and Vulnerability; Field, L.L.W., Barros, V.R., Dokken, D.J., Mach, K.J., Mastrandrea, M.D., Bilir, T.E., Chatterjee, M., Ebi, K.L., Estrada, Y.O., Genova, R.C., et al., Eds.; Cambridge University Press: Cambridge, UK, 2014. [Google Scholar]
  2. Liu, J.; Folberth, C.; Yang, H.; Röckström, J.; Abbaspour, K.; Zehnder, A.J.B. A Global and Spatially Explicit Assessment of Climate Change Impacts on Crop Production and Consumptive Water Use. PLoS ONE 2013, 8, e057750. [Google Scholar] [CrossRef] [PubMed] [Green Version]
  3. Tingley, M.W.; Estes, L.D.; Wilcove, D.S. Climate Change Must Not Blow Conservation off Course. Nature 2013, 500, 271–272. [Google Scholar] [CrossRef] [PubMed]
  4. Cruz-Pérez, N.; Martín-Rodríguez, J.; García, C.; Ioras, F.; Christofides, N.; Vieira, M.; Bruccoleri, M.; Santamarta, J.C. Comparative Study of the Environmental Footprints of Marinas on European Islands. Sci. Rep. 2021, 11, 9410. [Google Scholar] [CrossRef] [PubMed]
  5. Duvat, V.K.E.; Magnan, A.K.; Wise, R.M.; Hay, J.E.; Fazey, I.; Hinkel, J.; Stojanovic, T.; Yamano, H.; Ballu, V. Trajectories of Exposure and Vulnerability of Small Islands to Climate Change. Wiley Interdiscip. Rev. Clim. Chang. 2017, 8, e478. [Google Scholar] [CrossRef] [Green Version]
  6. Queiroz, R.E.; Guerreiro, J.; Ventura, M.A. Demand of the Tourists Visiting Protected Areas in Small Oceanic Islands: The Azores Case-Study (Portugal). Environ. Dev. Sustain. 2014, 16, 1119–1135. [Google Scholar] [CrossRef]
  7. Izquierdo, T. Conceptual Hydrogeological Model and Aquifer System Classification of a Small Volcanic Island (La Gomera; Canary Islands). Catena 2014, 114, 119–128. [Google Scholar] [CrossRef]
  8. Bassiouni, M.; Oki, D.S. Trends and Shifts in Streamflow in Hawai’i, 1913-2008. Hydrol. Process. 2013, 27, 1484–1500. [Google Scholar] [CrossRef]
  9. Segurado, R.; Costa, M.; Duic, N.; Carvalho, M.G. Integrated Analysis of Energy and Water Supply in Islands. Case Study of S. Vicente, Cape Verde. Energy 2015, 92, 639–648. [Google Scholar] [CrossRef]
  10. Patlitzianas, K.; Christos, K. Effective Financing for Provision of Renewable Electricity and Water Supply on Islands. Energy Sustain. Dev. 2012, 16, 120–124. [Google Scholar] [CrossRef]
  11. Papapostolou, C.; Kondili, E.; Zafirakis, D.; Tzanes, G. Sustainable Water Supply Systems for the Islands: The Integration with the Energy Problem. Renew. Energy 2020, 146, 2577–2588. [Google Scholar] [CrossRef]
  12. García-Rodríguez, J.L.; García-Rodríguez, F.J.; Castilla-Gutiérrez, C. Human Heritage and Sustainable Development on Arid Islands: The Case of the Eastern Canary Islands. Isl. Stud. J. 2016, 11, 113–130. [Google Scholar]
  13. Santamarta, J.C. Hidrología de Las Islas Volcánicas; Singularidades y Contribución de La Ingeniería Forestal. Montes 2014, 116, 26–31. [Google Scholar]
  14. González-Morales, A.; Ramón-Ojeda, A.Á. La Desalación de Agua de Mar En Las Canarias Orientales: Los Casos de Lanzarote y Fuerteventura. Agua y Territorio/Water Landsc. 2019, 13, 15–26. [Google Scholar] [CrossRef]
  15. Gonzálvez, J.J.G. Las Grandes Presas de Gran Canaria: Toponimia, Propiedad, Tipología y Construcción. In La Cultura Del Agua En Gran Canaria; Universidad de Las Palmas de Gran Canaria: Las Palmas, Spain, 2008; Volume 47. [Google Scholar]
  16. Rodríguez, M.; Fernando, L.; Santana, C.; del Carmen, M. Captaciones de Aguas Subterráneas En Gran Canaria: Necesidad de Su Inventario; Universidad de Las Palmas de Gran Canaria: Las Palmas, Spain, 2013. [Google Scholar]
  17. Gómez-Gotor, A.; Del Río-Gamero, B.; Prieto Prado, I.; Casañas, A. The History of Desalination in the Canary Islands. Desalination 2018, 428, 86–107. [Google Scholar] [CrossRef]
  18. Custodio, E.; del Carmen Cabrera, M.; Poncela, R.; Puga, L.O.; Skupien, E.; del Villar, A. Groundwater Intensive Exploitation and Mining in Gran Canaria and Tenerife, Canary Islands, Spain: Hydrogeological, Environmental, Economic and Social Aspects. Sci. Total Environ. 2016, 557–558, 425–437. [Google Scholar] [CrossRef] [PubMed]
  19. Custodio, E.; Sahuquillo, A.; Albiac, J. Sustainability of Intensive Groundwater Development: Experience in Spain. Sustain. Water Resour. Manag. 2019, 5, 11–26. [Google Scholar] [CrossRef]
  20. Aguilera-Klink, F.; Pérez-Moriana, E.; Sánchez-García, J. The Social Construction of Scarcity. The Case of Water in Tenerife (Canary Islands). Ecol. Econ. 2000, 34, 233–245. [Google Scholar] [CrossRef]
  21. Perez, D.; Javier, F.; Otin, M.R.P.; Mouhaffel, A.G.; Martin, R.D.; Chinarro, D. Energy and Water Consumption and Carbon Footprint in Tourist Pools Supplied by Desalination Plants: Case Study, the Canary Islands. IEEE Access 2018, 6, 11727–11737. [Google Scholar] [CrossRef]
  22. Pérez, D.; Javier, F.; Chinarro, D.; Mouhaffel, A.G.; Martín, R.D.; Otín, M.P. Comparative Study of Carbon Footprint of Energy and Water in Hotels of Canary Islands Regarding Mainland Spain. Environ. Dev. Sustain. 2019, 21, 1763–1780. [Google Scholar] [CrossRef]
  23. Hughes, S.J.; Malmqvist, B. Atlantic Island Freshwater Ecosystems: Challenges and Considerations Following the EU Water Framework Directive. Hydrobiologia 2005, 544, 289–297. [Google Scholar] [CrossRef]
  24. García-Santos, G.; Bruijnzeel, L.A. Rainfall, Fog and Throughfall Dynamics in a Subtropical Ridge Top Cloud Forest, National Park of Garajonay (La Gomera, Canary Islands, Spain). Hydrol. Processes 2011, 25, 411–417. [Google Scholar] [CrossRef]
  25. Braojos, J.J.; Farrujia, I.; Fernández, J. Los recursos hídricos en tenerife frente al cambio climático. Jornadas Sobre Las Aguas Subterráneas En La Directiva Marco de Aguas 2006, 1–16. Available online: https://www.aguastenerife.org/images/pdf/ponenciasdocumentos/RecurHidricosTFE&CambioClimatico.pdf (accessed on 8 February 2022).
  26. Llamas, M.R.; Custodio, E.; de la Hera, A.; Fornés, J.M. Groundwater in Spain: Increasing Role, Evolution, Present and Future. Environ. Earth Sci. 2015, 73, 2567–2578. [Google Scholar] [CrossRef]
  27. Schallenberg-Rodríguez, J.; Veza, J.M.; Blanco-Marigorta, A. Energy Efficiency and Desalination in the Canary Islands. Renew. Sustain. Energy Rev. 2014, 40, 741–748. [Google Scholar] [CrossRef]
  28. Paneque, P. Drought Management Strategies in Spain. Water 2015, 7, 6689–6701. [Google Scholar] [CrossRef] [Green Version]
  29. Santamarta, J.C. Hidrología y Recursos Hídricos En Islas y Terrenos Volcánicos; Colegio de Ingenieros de Montes: Madrid, Spain, 2013. [Google Scholar]
  30. Cruz-Fuentes, T.; del Carmen Cabrera, M.; Heredia, J.; Custodio, E. Groundwater Salinity and Hydrochemical Processes in the Volcano-Sedimentary Aquifer of La Aldea, Gran Canaria, Canary Islands, Spain. Sci. Total Environ. 2014, 484, 154–166. [Google Scholar] [CrossRef] [PubMed]
  31. Hoekstra, A.Y.; Chapagain, A.K.; Aldaya, M.M.; Mekonnen, M.M. The Water Footprint Assessment Manual; Earthscan: London, UK, 2011. [Google Scholar]
  32. Ercin, A.E.; Aldaya, M.M.; Hoekstra, A.Y. Corporate Water Footprint Accounting and Impact Assessment: The Case of the Water Footprint of a Sugar-Containing Carbonated Beverage. Water Resour. Manag. 2011, 25, 721–741. [Google Scholar] [CrossRef]
  33. BOE. Real Decreto 509/1996. Normas Aplicables Al Tratamiento de Las Aguas Residuales Urbanas; Boletín Oficial Del Estado: Madrid, Spain, 1996. [Google Scholar]
  34. Pellicer-Martínez, F. La Evaluación de La Huella Hídrica Gris En Una Demarcación Hidrográfica. In Congreso Nacional Del Medioambiente; Conama: Madrid, Spain, 2014; Volume 26, Available online: www.conama2014.org (accessed on 20 October 2021).
  35. Morera, S.; Corominas, L.; Poch, M.; Aldaya, M.M.; Comas, J. Water Footprint Assessment in Wastewater Treatment Plants. J. Clean. Prod. 2016, 112, 4741–4748. [Google Scholar] [CrossRef] [Green Version]
  36. Liu, C.; Kroeze, C.; Hoekstra, A.Y.; Gerbens-Leenes, W. Past and Future Trends in Grey Water Footprints of Anthropogenic Nitrogen and Phosphorus Inputs to Major World Rivers. Ecol. Indic. 2012, 18, 42–49. [Google Scholar] [CrossRef]
  37. Shao, L.; Chen, G.Q. Water Footprint Assessment for Wastewater Treatment: Method, Indicator, and Application. Environ. Sci. Technol. 2013, 47, 7787–7794. [Google Scholar] [CrossRef]
  38. Kress, N.; Gertner, Y.; Shoham-frider, E. Seawater Quality at the Brine Discharge Site from Two Mega Size Seawater Reverse Osmosis Desalination Plants in Israel (Eastern Mediterranean). Water Res. 2020, 171, 115402. [Google Scholar] [CrossRef]
  39. Veettil, A.V.; Mishra, A.K. Water Security Assessment Using Blue and Green Water Footprint Concepts. J. Hydrol. 2016, 542, 589–602. [Google Scholar] [CrossRef]
  40. Pietrucha-Urbanik, K.; Rak, J.R. Consumers’ perceptions of the supply of tap water in crisis situations. Energies 2020, 13, 3617. [Google Scholar] [CrossRef]
  41. Heihsel, M.; Lenzen, M.; Malik, A.; Geschke, A. The Carbon Footprint of Desalination: An Input-Output Analysis of Seawater Reverse Osmosis Desalination in Australia for 2005–2015. Desalination 2019, 454, 71–81. [Google Scholar] [CrossRef]
  42. Sobhani, R.; Abahusayn, M.; Gabelich, C.J.; Rosso, D. Energy Footprint Analysis of Brackish Groundwater Desalination with Zero Liquid Discharge in Inland Areas of the Arabian Peninsula. Desalination 2012, 291, 106–116. [Google Scholar] [CrossRef]
  43. Tal, A. Addressing Desalination’s Carbon Footprint: The Israeli Experience. Water 2018, 10, 197. [Google Scholar] [CrossRef] [Green Version]
  44. Custodio, E.; Llamas, M.R.; Villarroya, F. The Role of the Spanish Committee of the International Association of Hydrogeologists in the Management and Protection of Spain’s Groundwater Resources. Hydrogeol. J. 1998, 6, 15–23. [Google Scholar] [CrossRef]
  45. Serio, F.; Miglietta, P.P.; Lamastra, L.; Ficocelli, S.; Intini, F.; de Leo, F.; de Donno, A. Groundwater Nitrate Contamination and Agricultural Land Use: A Grey Water Footprint Perspective in Southern Apulia Region (Italy). Sci. Total Environ. 2018, 645, 1425–1431. [Google Scholar] [CrossRef]
  46. Martínez-Alcala, I.; Pellicer-Martínez, F.; Fernandez-López, C. Pharmaceutical Grey Water Footprint: Accounting, Influence of Wastewater Treatment Plants and Implications of the Reuse. Water Res. 2018, 135, 278–287. [Google Scholar] [CrossRef]
  47. del Río, S.; Herrero, L.; Fraile, R.; Penas, A. Spatial Distribution of Recent Rainfall Trends in Spain (1961–2006). Int. J. Climatol. 2011, 31, 656–667. [Google Scholar] [CrossRef]
  48. Estévez, E.; Cabrera, M.d.; Molina-Díaz, A.; Robles-Molina, J.; Palacios-Díaz, M.d. Screening of Emerging Contaminants and Priority Substances (2008/105/EC) in Reclaimed Water for Irrigation and Groundwater in a Volcanic Aquifer (Gran Canaria, Canary Islands, Spain). Sci. Total Environ. 2012, 433, 538–546. [Google Scholar] [CrossRef]
  49. Santamarta, J.C.; Calvo, I.; Rodríguez-Martín, J.; Cruz-Pérez, N. Water status in the Canary Islands related to energy requirements. Energy Effic. 2022, 15, 12. [Google Scholar] [CrossRef]
  50. Pérez, F.J.D.; Martín, R.D.; Trujillo, F.J.P.; Díaz, M.; Mouhaffel, A.G. Consumption and emissions analysis in domestic hot water hotels. Case study: Canary Islands. Sustainability 2019, 11, 599. [Google Scholar] [CrossRef] [Green Version]
  51. Leon, F.; Ramos, A.; Vaswani, J.; Mendieta, C.; Brito, S. Climate Change Mitigation Strategy through Membranes Replacement and Determination Methodology of Carbon Footprint in Reverse Osmosis RO Desalination Plants for Islands and Isolated Territories. Water 2021, 13, 293. [Google Scholar] [CrossRef]
  52. Gils, H.C.; Simon, S. Carbon neutral archipelago—100% renewable energy supply for the Canary Islands. Appl. Energy 2017, 188, 342–355. [Google Scholar] [CrossRef] [Green Version]
  53. Hübscher, M.; Ringel, J. Opaque Urban Planning. The Megaproject Santa Cruz Verde 2030 Seen from the Local Perspective (Tenerife, Spain). Urban Sci. 2021, 5, 32. [Google Scholar] [CrossRef]
Figure 1. Schematic diagram of water losses in distributed water.
Water 14 00934 g001
Figure 2. Map of the Canary Islands (B) with the location of the facilities studied in Tenerife (A) and Gran Canaria (C).
Water 14 00934 g002
Table 1. Results of the total volume of water abstracted and blue water footprint at the eight facilities studied in the Canary Islands during the years 2019 and 2020.
IslandFacilityTotal Volume of Water Abstracted 2019 (m3/year)Blue Water Footprint 2019 (m3/year)Total Volume of Water Abstracted 2020 (m3/year)Blue Water Footprint 2020 (m3/year)
TenerifeWater gallery83,000166082,9001658
Well294,970.084424.55269,5444043.16
Desalination plant3,548,98490,0003,631,56490.00
Water treatment-0.00-0.00
Distribution130,93526,187132,02226,404.4
Desalination plant10,873,24393.008,613,17993.00
Gran CanariaWell 1318,6236372.46299,0995981.98
Well 2466146.6193.000.93
Table 2. Results of the grey water footprint at the eight facilities studied in the Canary Islands.
IslandFacilityGrey Water Footprint 2019 (m3/year)Grey Water Footprint 2020 (m3/year)
TenerifeWater gallery0.000.00
Well0.000.00
Desalination plant0.000.00
Water treatment79,062.22108,346.67
Distribution0.000.00
Desalination plant0.000.00
Gran CanariaWell 10.000.00
Well 20.000.00
Publisher’s Note: MDPI stays neutral with regard to jurisdictional claims in published maps and institutional affiliations.

