Article

Optimizing Hydraulic Retention Time and Area of Biological Settling Ponds for Super-Intensive Shrimp Wastewater Treatment Systems

1
College of Environment and Natural Resources, Can Tho University, Campus II, Can Tho 900000, Vietnam
2
United Graduate School of Agricultural Science, Tokyo University of Agriculture and Technology, Tokyo 183-8506, Japan
3
Can Tho Campus, FPT University, Can Tho 900000, Vietnam
4
WWF-Vietnam, No. 6, Lane 18, Nguyen Co Thach Street, Nam Tu Liem District, Ha Noi 100000, Vietnam
*
Author to whom correspondence should be addressed.
Water 2022, 14(6), 932; https://doi.org/10.3390/w14060932
Submission received: 8 February 2022 / Revised: 4 March 2022 / Accepted: 14 March 2022 / Published: 16 March 2022
(This article belongs to the Section Wastewater Treatment and Reuse)

Abstract

:
Biological settling ponds are a practicable approach for treating super-intensive shrimp aquaculture wastewater for almost all shrimp producers in the Vietnamese Mekong Delta (VMD). The optimization of the hydraulic retention time (HRT) of biological settling ponds plays a crucial role in establishing the stability of outflow wastewater quality and suitability of the settling pond area (SPA). This study aims to suggest appropriate HRT and SPA for super-intensive shrimp wastewater treatment systems based on the National Standard (QCVN 02-19:2014/BNNPTNT) and the best aquaculture practices (BAP) standards and guidelines. We investigated 20 typical super-intensive shrimp farms in the VMD and collected effluent samples from siphoning process, daily water exchange, and outflow of biological effluent-treatment settling ponds. The results showed that the average of each super-intensive shrimp farm produced wastewater at approximately 218 m3 ha−1 day−1. The contaminant loads of TSS, COD, TKN, and TP were commensurate to 177, 113, 9.86, and 4.19 kg ha−1 day−1, respectively. Based on the relationship between outflow COD, TSS concentrations, and HRT of biological-surveyed settling ponds, a 13.4-day HRT and 1934-m2 SPA were suggested to optimize the super-intensive shrimp wastewater treatment systems. Our recommendation for further work is to continuously optimize the HRT and SPA rates of functional ponds (anaerobic, facultative, and maturation) to ameliorate the engineering configuration of the recommended biological settling pond.

1. Introduction

Globally, Vietnam is one of the top-shrimp producers and exporters [1]. Extensive shrimp farms in Vietnam contain 675,000 ha of production ponds [2]. The annual yield of the farms is roughly 290 Tton y−1 of P. monodon and 475 Tton y−1 of L. vannamei [3]. The Vietnamese Mekong Delta (VMD) accounts for approximately 89.3% of the total national shrimp produced, which is concentrated in the five coastal provinces of Kien Giang, Ca Mau, Bac Lieu, Soc Trang, and Tra Vinh [4]. Vietnamese government policy has recently encouraged hi-tech shrimp farms to enhance national revenue by up to 10 billion USD by 2025 [5]. In the most common models, the super-intensive shrimp farm (SI-SF) system, especially Pacific white shrimp (L. vannamei), has recently been adopted due to their potential for high yield and commercial profits [6,7]. In the SI-SF, the stocking density commonly fluctuates from 250 to 300 shrimp per m−3, and the yield regularly touches 10–15 ton ha−1, while conventional shrimp farming only obtains 0.8–1.5 ton ha−1 [1]. Although the yield efficiency from SI-SF is in sight, the rapid expansion of SI-SF has recently put high pressure on the vicinity environment and natural ecosystems [6,8]. The operation of SI-SF requires a large amount of daily water exchange during farming, and produces considerable volumes of wastewater [9,10]. Wastewater from SI-SF typically comprises daily siphoning (WS) and water exchange (WE) recognized as biodegradable compositions. The physiochemical characteristics of the wastewater have generated considerable recent interest. Super-intensive shrimp wastewater (SI-SW) mainly includes urine, fecal matter, and uneaten shrimp feed [11]. Wastewater derived from SI-SF is characterized by a high chemical oxygen demand (COD), biological oxygen demand (BOD), and high concentrations of total suspended solids (TSS), dissolved particulate matter, volatile suspended solids (VSS), nitrogen (N), and phosphorous (P) [12,13]. Untreated wastewater is directly discharged into the surrounding water bodies, resulting in severe eutrophication and adverse effects on the aquatic ecosystem [14]. Moreover, ineffectively controlled wastewater often causes the spread of infectious diseases and thus a decline in aquacultural productivity [10]. Accordingly, wastewater treatments are obligatorily required before disposal [15].
In the VMD, SI-SF models generally discharge wastewater into settling ponds for biological treatment before releasing it to the external environment [5]. The effectiveness of SI-SW biotreatment processes by settling ponds mainly relies on the predominance of natural phenomena, requiring a long detention time to eliminate pollutants effectively [16]. Although this approach is practical for shrimp farms in the VMD’s coastal provinces, it requires a large land area to establish the additional settling ponds. According to [5], the typical SPA currently ranges from 0.2 ha to 1.6 ha. The considerable variation of pond areas results in the disparity of hydraulic retention times (HRT) and wastewater quality after treatment. Thus, it is noted that HRT and SPA are two key factors affecting the pollutant removal efficacy of SI-SW treatment systems in biological settling pond systems. However, little attention has been paid to optimizing HRT and SPA. Recently, Vietnam’s Ministry of Agriculture and Rural Development has enacted a National Standard Regulation on brackish water shrimp culture conditions for veterinary hygiene, environmental protection, and food safety (QCVN 02-19:2014/BNNPTNT) [17] that requires shrimp wastewater to be treated suitably to a permissible level before it is released into the environment. Also, effluent management responsibility is also considered according to best aquaculture practices (BAP) standards and guidelines [18] to sustain multinational shrimp culturing principles in general. Thus, shrimp wastewater treatment complying with the permitted threshold of QCVN 02-19:2014/BNNPTNT and BAP are of utmost interest. This study, therefore, aims to establish the HRT and SPA values in accordance with QCVN 02-19:2014/BNNPTNT and BAP for optimizing biological settling pond conditions to treat SI-SW in the VMD effectively. Generally, 20 SI-SFs in the VMD were investigated, and wastewater samples were collected at the biological settling ponds’ inlet and outlet points to target as a basis for establishing HRT and SPA retention values accordingly.

2. Materials and Methods

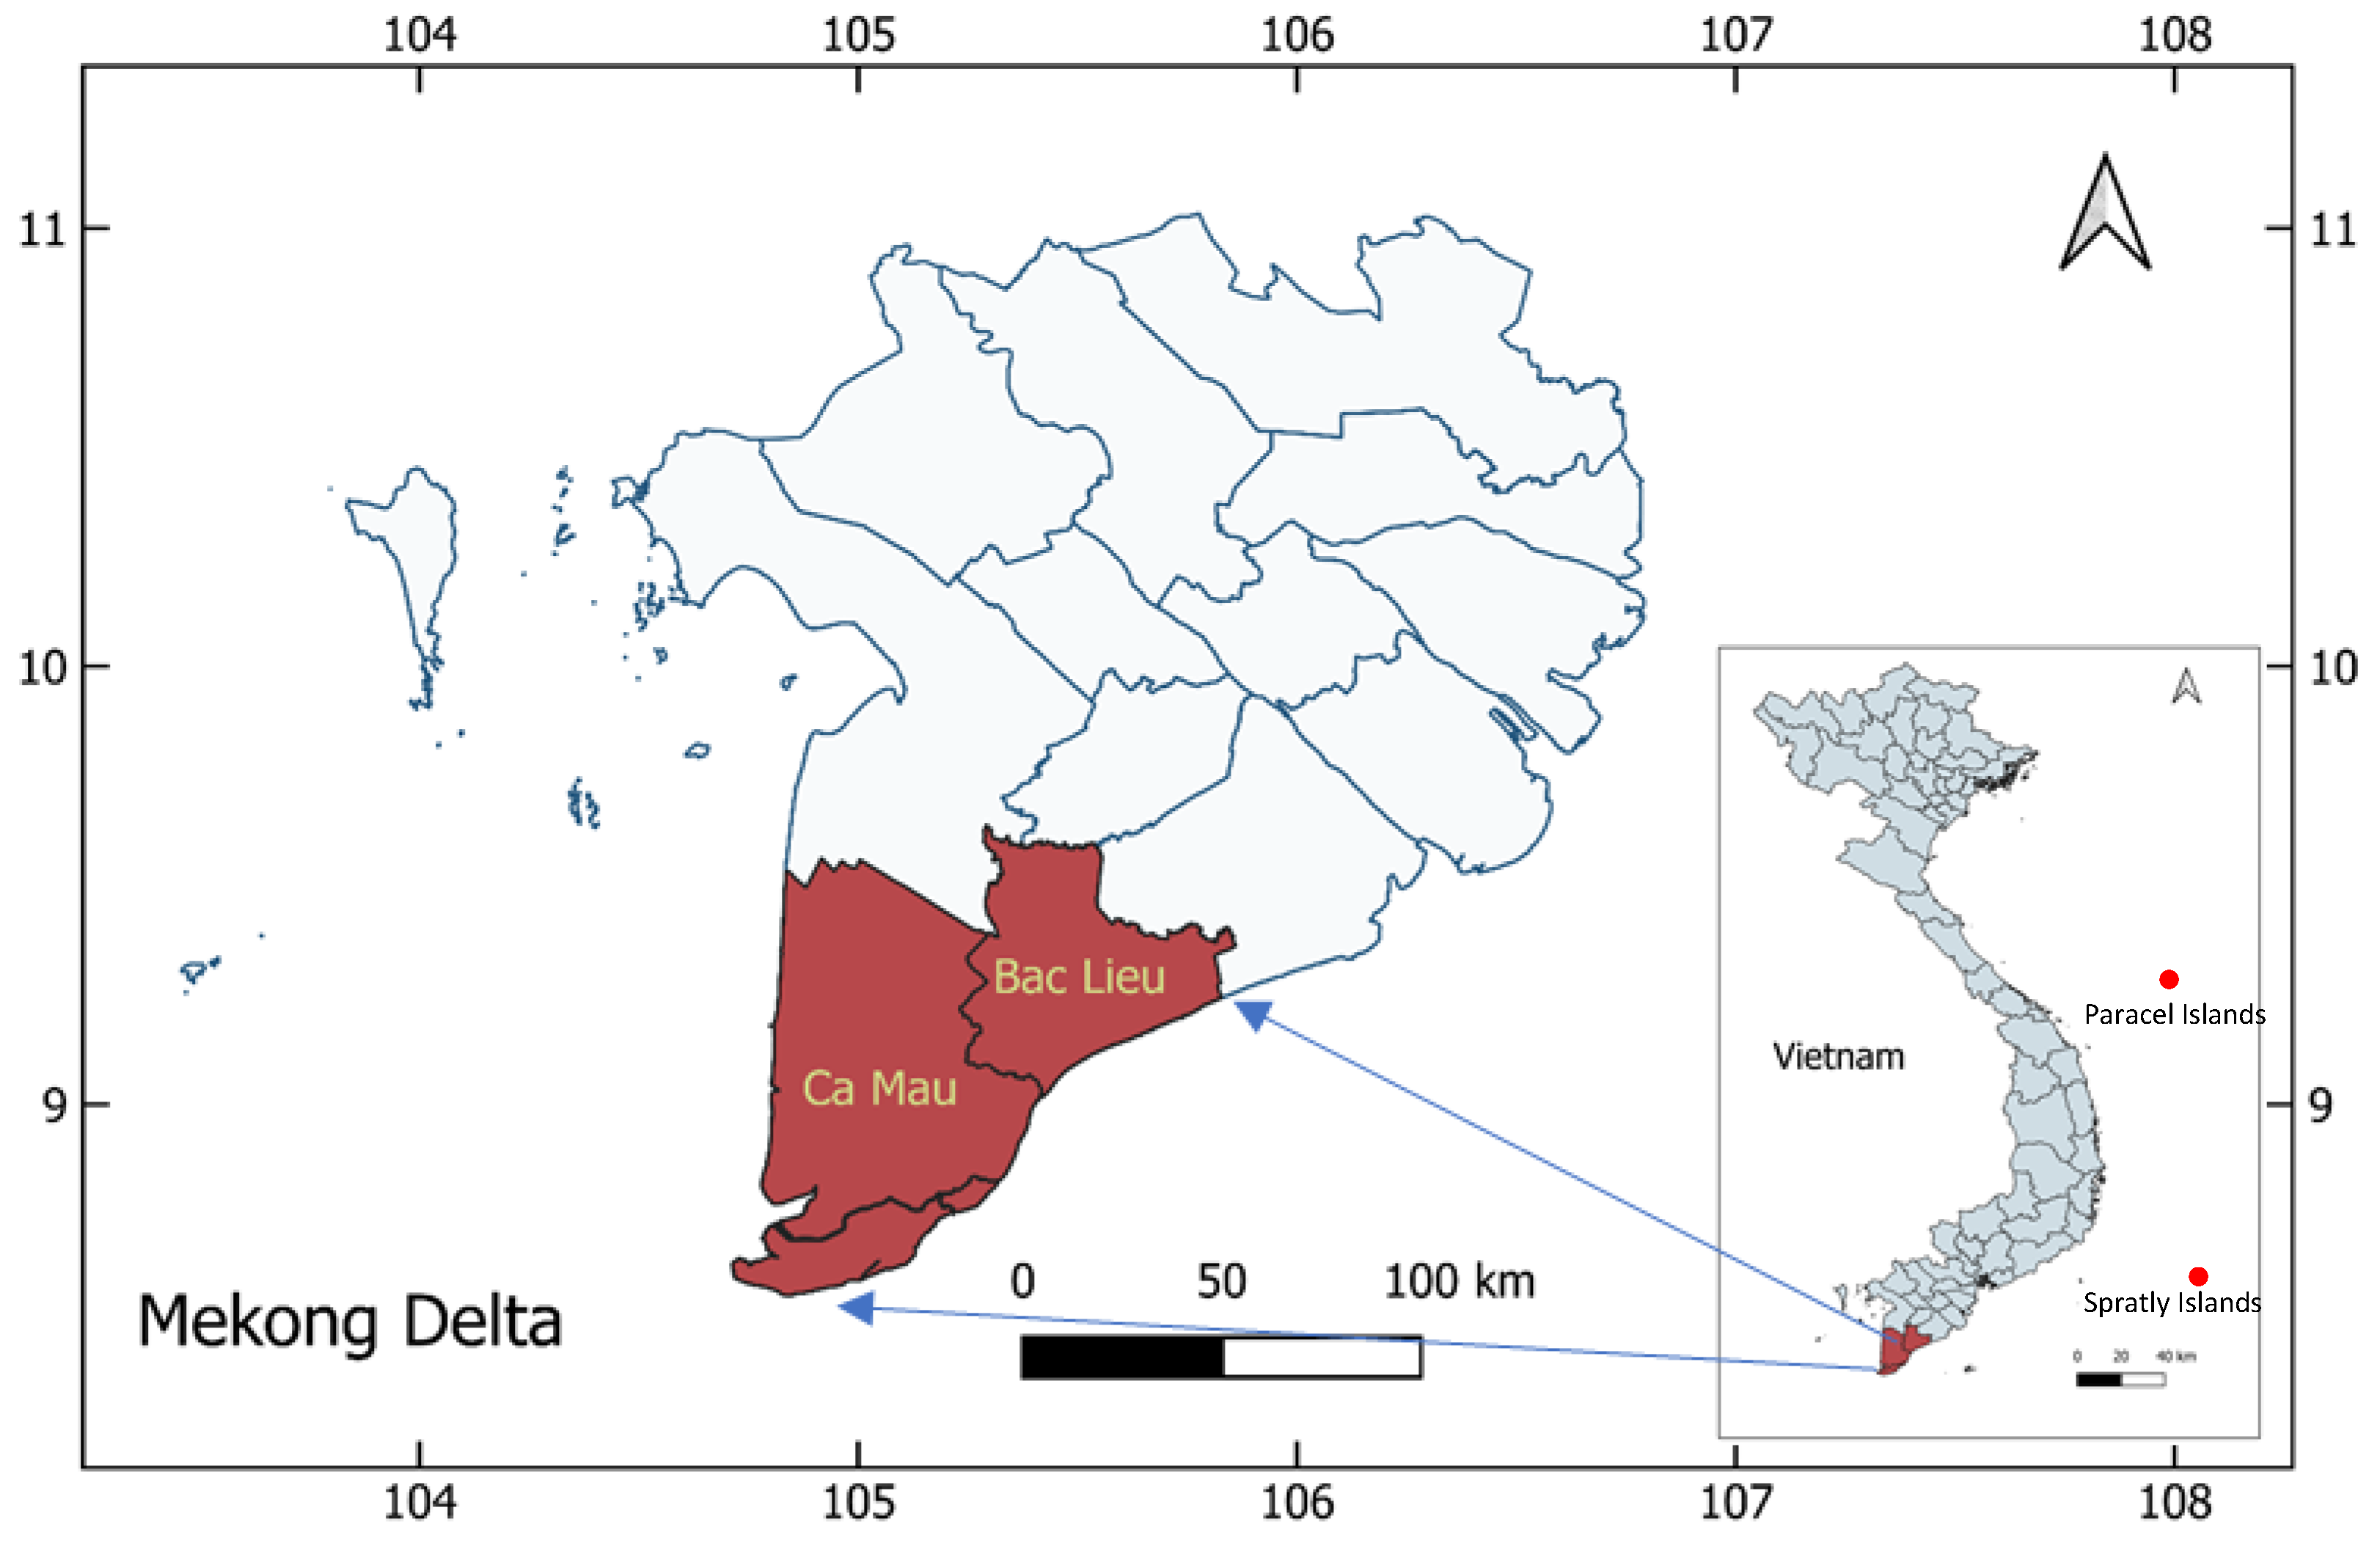
2.1. Study Area and Data Collection

The study was carried out in the Bac Lieu and Ca Mau provinces, where SI-SF is widespread [1]. The study area was located in Vietnam’s southmost coastal areas, which is contiguous between the Gulf of Thailand (Ca Mau province) and the East Sea (Bac Lieu and Ca Mau province), facilitating the development of shrimp stocking and intensive aquacultural activities (Figure 1). The SI-SF practices are stocked by either the indoor or outdoor systems. Typically, wastewater was discharged into settling ponds for biological treatment processes before releasing them into the environment.
Data were collected from 20 SI-SFs (eight farms in Bac Lieu province and 12 farms in Ca Mau province). The surface area of shrimp culture ponds and settling ponds was provided by farmers based on in-person interviews. The wastewater flow (SW and WE) generated per day was calculated based on the pumping time and flow of the individual wastewater pump on the farm. Furthermore, input (SW and WE samples) and outflow samples from each settling pond at every farm were collected to evaluate the wastewater treatment efficacy. Collected samples were determined temperature, pH, salinity, total suspended solids (TSS), chemical oxygen demand (COD), ammonium (N-NH4+), nitrite (N-NO2), Total Kjeldahl Nitrogen (TKN), total phosphorus (TP), and hydrosulfite (H2S).

2.2. Measurements

pH and temperature were measured directly at the sampling sites using pH meter (TOA-DKK cooperation, IM32P, Tokyo, Japan). Similarly, DO was also measured at sampling locations using DO meter (TOA-DKK, DO-31P, Tokyo, Japan). Salinity was measured by a refractometer (ATAGO Co., Ltd., Master-S28M, Tokyo, Japan). TSS, COD, N-NH4+, N-NO2, TKN, TP, and H2S were analyzed consistent with the standard methods for the examination of water and wastewater (SMEWW) [19]. Total alkalinity was determined by the titration method (SMEWW, 2320B). TSS was filtered through a weighed standard glass-fiber filter and dried, with the residue retained on the filter in an oven to a constant weight at 103 to 105 °C (SMEWW 2540D). COD was determined by an open reflux, titrimetric method (SMEWW 5220C), whereas the N-NH4+ was detected by the phenate method (SMEWW 4500-NH3 F). N-NO2 was analyzed by the colorimetric method (SMEWW 4500 NO2 B), and TKN was detected by the semi-micro-Kjeldahl method (SMEWW 4500-Norg C). TP was analyzed by using the persulfate method for simultaneous determination of total phosphorus (SMEWW 4500-P J).
The load rate (COD, TSS, TN, and TP) was calculated by the sum of the flow rate and the pollutant concentration of SW and WE, as follows:
FR = ( FR SW × PC SW + FR WE × PC WE ) × 10 3
where FR = pollutant flow rate (kg ha−1 day−1); FRsw/FRwe = flow rates of siphon wastewater and water exchange (m3 ha−1 day−1), respectively; PCsw/PCwe = pollutant concentrations of siphon and water exchange (mg L−1), respectively.
The treatment efficacy of settling ponds was calculated using the formula, as follows:
E t = Δ C in out C in × 100
where Et = wastewater treatment by settling ponds (%), ΔCin−out = inflow-outflow pollutant concentration (mg L−1), Cin = inflow pollutant concentration (mg L−1).
The HRT of the settling ponds was calculated by dividing the total volume of settling ponds by total wastewater flows.
HRT = TV sp FR w
where HRT = hydraulic retention time (day), TVsp = total volume of settling ponds (m3), FRw = flow rate of wastewater (m3 day−1).
The area of settling ponds was suggested based on optimal HRT, as follows:
A sp = FR w h × HRT
where Asp = area of settling ponds (m2), FRw = flow rate of wastewater (m3 day−1), HRT = hydraulic retention time (day), h = water depth of settling ponds (h = 1.5 m, suggested by [5].

2.3. Statistical Analysis

Non-linear regression analyses were used to understand the relationship between outflow pollutant concentrations; specifically, COD and HRT, and TSS and HRT at a confidence interval of 95%. For the optimization of HRT and SPA values, the correlations were referred to the QCVN 02-19:2014/BNNPTNT and BAP standards and guidelines for effluent water quality criteria after treatment. Our recommendations are not stated for recirculating aquacultural systems. Statistical data analysis was performed by R stats Version 4.2.0 (R Project for Statistical Computing, RRID:SCR_001905). The results are displayed in tabular form with mean ± standard deviation (SD, n = 20) and graphs.

3. Results

3.1. Inflow and Outflow Wastewater Characteristics

Table 1 illustrates that SW was characterized by high concentrations of TSS, COD, N-NH4+, TKN, TP, and H2S, while DO, N-NO2, NH3 concentrations were low (Table 1). It is evident that TSS concentrations exceeded the permissible level of the QCVN 02-19:2014/BNNPTNT and BAP by 34.23-fold and 68.46-fold, respectively, while COD concentration surpassed the national standard by 12.4 times (COD are not mentioned by BAP). However, it can be observed that the pollutant concentration substantially varied among sampled farms. For example, the standard deviation of TSS was 2820 mg L−1, whereas, for COD, the standard deviation was 1104 mg L−1.
Similarly, WE contained high TSS, COD, TKN, and TP concentrations (Table 1). Compared to the QCVN 02-19:2014/BNNPTNT, TSS and COD exceeded the permissible levels by 2.36 and 1.23 times, respectively, while TSS exceeded it by 4.78-fold compared to the BAP. It was apparent that a high DO level was detected in the WE due to continuous aeration in the shrimp ponds. Moreover, the data indicate that the concentrations of TSS, COD, N-NH4+, N-NO2, NH3, TKN, TP, and H2S in WE were consistently lower than that of SW, which accounted for 6.97%, 10.70%, 8.73%, 80.45%, 62.60%, 12.07%, 5.10%, and 10.06% of contaminant concentrations in the SW, respectively.
From the biological treatment in the settling ponds, average outflow pollutant concentrations unexceeded the national standard (QCVN 02-19:2014/BNNPTNT), but the TSS value transcended the BAP by 1.91-fold. It seems probable that environmental factors were slightly changed after treatment in the settling ponds. Specifically, pH, DO, and salinity concentrations showed slight increases of 0.39–0.46, 1.45–6.25 mg L−1, and 1.35–1.70‰, respectively, while the alkalinity value decreased by 50.50–87.00 mgCaCO3 L−1 (Table 1). Furthermore, pH consistently ranged within the permissible levels of the QCVN 02-19:2014/BNNPTNT and BAP. DO was consistently suitable with the BAP.

3.2. Flow Rates of Wastewater and vs. Removal

Table 2 depicts that the flow rate of wastewater (SW and WE) was relatively high, at 218 m3 ha−1 day−1. The flow rate of SW was considerably lower than that of WE. Unambiguously, the SW flow rate flushed out 36.14 ± 22.89 m3 ha−1 day−1, while WE released 181.85 ± 88.13 m3 ha−1 day−1 (data not shown). In inflow wastewater, TSS and COD exhibited top-loading rates in comparison with TKN and TP. It is noteworthy that TSS was removed more effectively than COD through the biological treatment processes. Also, TKN was considered as the radical nutrient contamination compared to that of TP. In parallel, the TKN removal rate by the settling ponds was relatively lower than that of TP. It was apparent that the difference in TSS, COD, TKN, and TP loading rates between inflow and outflow concentrations was 155.01, 86.03, 8.11, and 3.88 m3 ha−1 day−1, respectively. In general, the removal efficacy of TSS, COD, TKN, and TP by the natural settling pond system was relatively high, measured at 87.5%, 75.6%, 82.2%, and 92.6%, respectively, with an average HRT of 12.5 days.

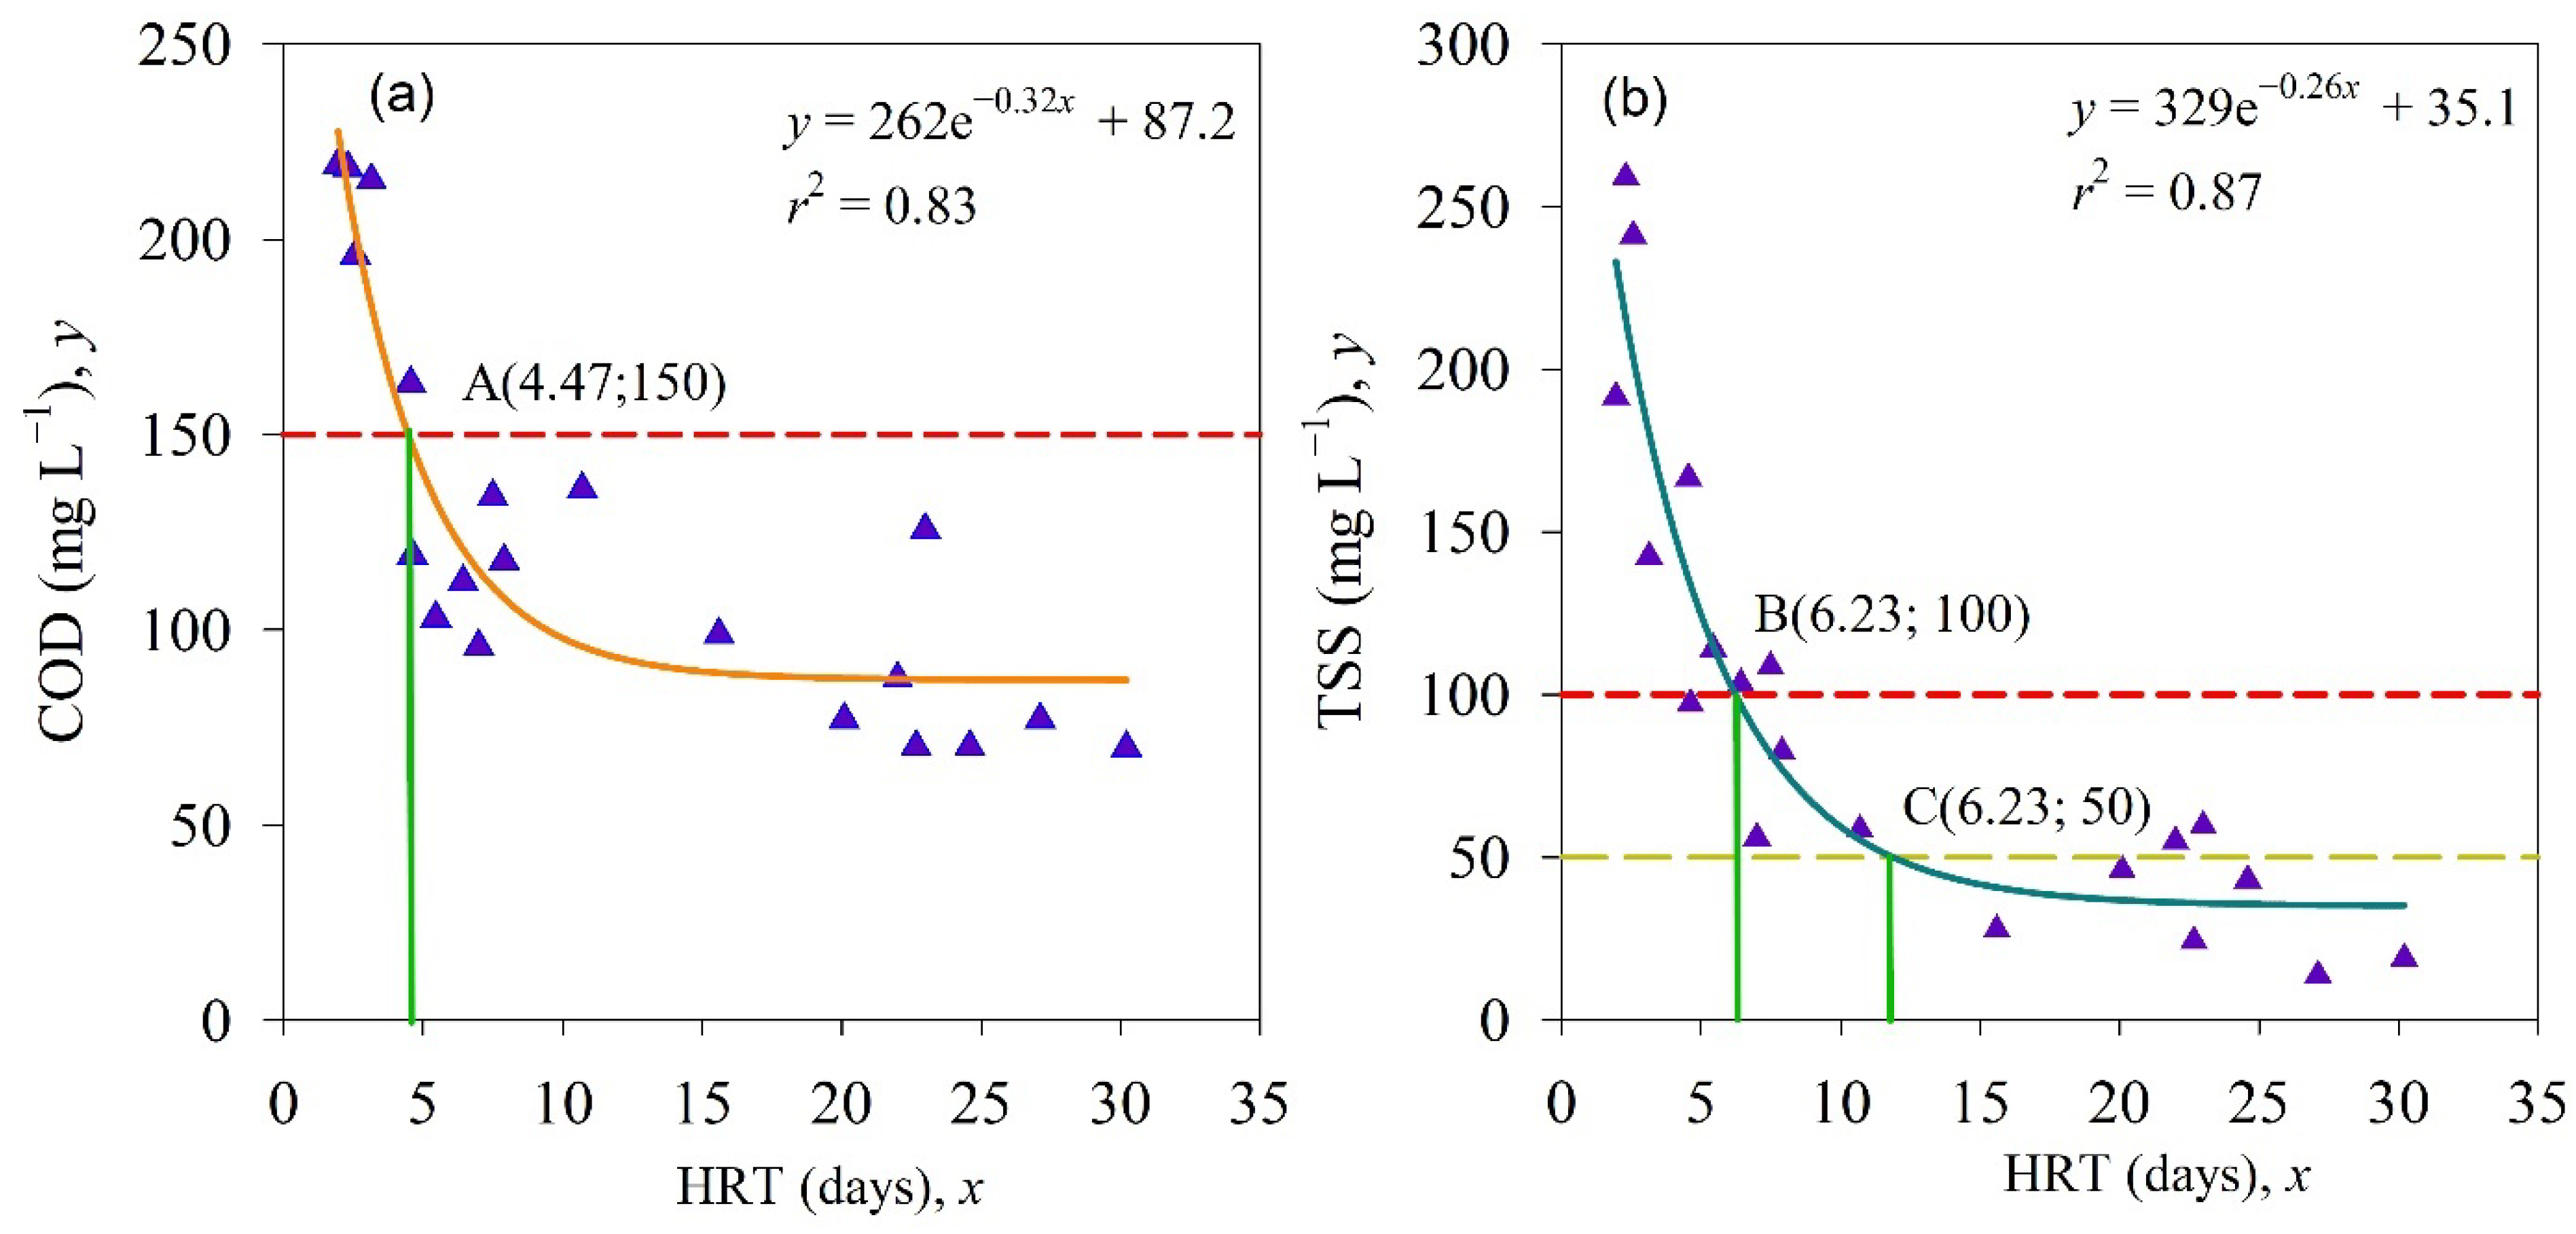
3.3. Relationship between HRT and Main Outflow Pollutants

Figure 2 shows the outflow concentration of COD and TSS and its correlation with the HRT. It can be observed that both COD and TSS concentration noticeably varied between shrimp farms, from 69.80 to 219.13 mg L−1 and 13.75 to 259.00 mg L−1, respectively. In general, biological settling ponds were effective for eliminating both COD and TSS with prolonged HRT. This is explained well by the positive exponential correlation of COD and HRT (r2 = 0.83) (Figure 2a) and TSS and HRT (r2 = 0.87) (Figure 2b). Pertaining to the regression and permissive level of the QCVN 02-19:2014/BNNPTNT, COD and TSS outflow concentrations are required below 150 and 100 mg L−1, respectively. As such, the optimal HRT based on QCVN 02-19:2014/BNNPTNT to efficiently treat COD was calculated at 4.47 days, while to treat TSS, the estimation is 6.23 days. However, the TSS limitation in relation to BAP requires below 50 mg L−1; referring to Figure 2b, HRT is calculated by 13.40 days. HRT optimization was, therefore, recommended to be a minimum of 13.40 days to admit both QCVN 02-19:2014/BNNPTNT and BAP standards and guidelines. According to Formula (4), we estimated that the minimum SPA in order to eliminate pollutants practically from the wastewater of SI-SFs was 1947 m2 (inflow rate, 217.98 m3 ha−1 day−1; water depth, 1.50 m).

4. Discussion

4.1. Pollutant Composition

Previous studies have shown that shrimp wastewater typically contains more degradable organic matter and dissolved inorganic nutrients [11,20,21]. COD content typically varies from 508–2430 mg L−1 [11,13,22], while TSS commonly ranges between 70–1031 mg L−1 [13,23,24]. Consistent with the report, Roy et al. [25] showed that organic carbon in shrimp wastewater kept a high level, 793 mg L−1. BOD5 typically fluctuates from 8–84 mg L−1 [24]. For the nutrient composition, TN and TP concentrations in shrimp wastewaters characteristically fluctuate in the range of 0.08 to 20.9 mg L−1 and 0.1 to 1.7 mg L−1 [10,24,26,27], respectively. N and P in shrimp effluent mainly exist in dissolved inorganic forms (N-NH4+, N-NO3 + N-NO2 and P-PO43−) [28,29]. N-NH4+, N-NO3+N-NO2 and P-PO43− concentrations in shrimp wastewater have been shown to vary between 1.6 and 3.8 mg L−1, 0.3 and 3.3 mg L−1 and 0.2 and 0.72 mg L−1 [10,27,30,31], respectively. However, these findings only examined on the characteristic of shrimp wastewater from intensive and semi-intensive shrimp culture systems. In this study, we therefore provide the characteristics of wastewater in either SW or WE from SI-SF systems.
The results of this study found that the several contaminant characteristics of WE from SI-SFs were ranged in the above-discussion findings. However, the shrimp SW contained a higher pollutant concentration, which substantially outstripped the typically detected value ranges and permissible levels of QCVN 02-19:2014/BNNPTNT. Particularly, average COD, TSS, TKN, and TP were higher, approximately 1.41, 1.78, 7.72, and 53.93 times, respectively, than that of the maximum concentration found from the above-mentioned previous studies; while this level is 12.36- (COD) and 34.23- (TSS) fold greater compared to QCVN 02-19:2014/BNNPTNT, respectively (note: TKN and TP are not explicitly regulated), and 68.46-fold (TSS) compared to the BAP. Among dissolved inorganic nutrient forms, N-NH4+ was typically determined to be dominant in the shrimp waste effluent [32,33,34]. Our study found that N-NH4+ had a high concentration in shrimp effluent. The primary source leading to high levels of pollutant concentration could be attributed to uneaten feed, carcasses, dead phytoplankton, and feces under very high stocking densities, as the feed consumption efficiency of shrimp only accounted for approximately 27% of intake sources [32,35]. It has been found that shrimp growth individually incorporated 21–24% of the N budget, while 10–13% of P remains in shrimp bodies. For conventional intensive/semi-intensive shrimp systems, organic matter and nutrients are deposited in sediment; 46% of N and 54% of P are deposited in the sediment as an output process [36]. However, up-to-date SI-SF systems eliminate deposited sediments several times per day through a bottom-siphon system to reduce toxic substance formation for shrimp ponds. Thus, the above-discussed findings partly explain the high pollutant concentrations found in SI-SF systems. Higher contaminations place extra pressure on local wastewater management and require effective on-site shrimp wastewater treatment development.

4.2. Contaminant Loads

Previous reports showed high levels of pollutant loads from intensive shrimp farming systems. For example, Anh et al. [24] estimated that contaminants of COD, TSS, TN, and TP in intensive shrimp farming systems in Vietnam (Can Gio area) were 4077, 6201, 159, and 20 kg ha−1 per crop−1, respectively. Likewise, TSS, TN, and TP loads discharged in several intensive shrimp farms in Thailand were 6650–9658, 178–223, and 15.7–24.9 kg ha−1 crop−1 [37], respectively. However, only a few studies have investigated the contaminant loads from SI-SFs. Here, the data of this study revealed that an average of 217.98 m3 ha−1 day−1 of wastewater based on 20 typical investigated farms could produce 177.15, 113.49, 9.86, and 4.19 kg ha−1 day−1 of COD, TSS, TN, and TP loads, respectively. It is assumed that the maximum shrimp-culturing crop in this system is 120 days. COD, TSS, TN, and TP loads were 13.62, 21.26, 1.18, and 0.50 ton ha−1 crop−1, respectively. It is indicated that the higher statistics of 3.34 (COD), 2.20–3.42 (TSS), 5.31–7.44 (TN), and 20.19–32.03 (TP) times greater, respectively, compared to findings of typical intensive shrimp farming systems. These data also provide an important outlook and robust platform for the calculation and recommendation of engineering parameters to design shrimp wastewater treatments safely and effectively.

4.3. HRT and SPA Optimization

Optimizing HRT and SPA are crucial elements to recommend proper engineering adjustments for improved shrimp wastewater treatments. Biological shrimp wastewater treatment systems by natural settling ponds were seen to be commonly applied and the system choice for farms in the study due to their simplicity and low-cost investments. The system allows for the removal of efficient pollutants through natural purification processes [38]. However, the HRT of the settling ponds shows considerable variation due to the availability of land and the investment capacity of shrimp producers. In fact, there are several standards for designing wastewater treatment by the settling ponds in general [16,39,40,41]. However, engineering recommendations differ in expected performance depending on the type of wastewater sources and their characteristics. Here, our study contributes to optimizing HRT for SI-SW treatment systems by settling ponds targeting a minimizing compulsory area to comply with both the national standard (QCVN 02-19:2014/BNNPTNT) and the BAP. We calculated the relationship of the HRT of current settling pond systems and the outflow concentration of contaminants (COD and TSS) from 20 typical shrimp farms in the VMD. Our data showed that the necessary time to eliminate COD effectively is 1.46 days shorter than TSS (6.23 days; Figure 2b) when referring to QCVN 02-19:2014/BNNPTNT. Longer HRT had to be proposed in relation to safeguarding the BAP. A minimum of 13.4 days is the optimal HRT for efficiency, removing 71.8% of TSS (from 177 mg L−1 TSS inflow to 50 mg L−1 TSS outflow). This recommended HRT is the safe threshold for removing COD successfully. Based on the calculated HRT, a land area of 1947 m3 is required for on-site wastewater treatment systems. The area requirements are modest and satisfactory for most shrimp producers.
For designing a typical biological wastewater treatment system, Ho et al. [38], reviewing 150 relevant articles, revealed that the archetypal model is divided into three sub-functional settling ponds: (i) the anaerobic pond, (ii) the facultative pond, and (iii) the maturation pond. It is notable that HRT is dissimilar between designated ponds depending on specific references and requirements; for example, the anaerobic pond is from two to three days [42,43]; the facultative pond ranges from three to six days [16,38]; and the maturation pond varies from three to five days [44,45]. In addition, the HRT of settling ponds in warm weather zones could be shorter than in cold locations [38,40]. Generally, the anaerobic pond has a shorter HRT than the facultative and maturation ponds, while facultative ponds require slightly longer than that of the maturation ponds. However, it is noticeable that a longer or shorter HRT depends on the targeted environmental parameters, the available land requirements, economic viability, and plentiful factors such as different climate zones [42]. On the basis of the results in this paper, we suggest a 13.4-day HRT for a series of settling ponds with a total required land area of 1947 m2, setting for an inflow rate of 217.98 m3 ha−1 day−1 and a water depth of 1.50 m. It is recommended that establishing a series of three consecutive settling ponds and optimizing HRT and SPA for each series is indispensable to ensure biological treatment function and efficacy.

5. Conclusions

This study assessed the chemical characteristic of the inflow/outflow SI-SW treatment system from 20 typical SI-SFs in the VMD. Recommendations for a feasible HRT as well as land area requirements for a biological shrimp wastewater treatment in accordance with the national standard (QCVN 02-19:2014/BNNPTNT) and the BAP were provided. Super-intensive shrimp wastewaters contain higher contaminant concentrations as compared to intensive shrimp farms reported in previous studies. Compared to QCVN 02-19:2014/BNNPTNT, TSS and COD contaminants in WE surpassed permissible levels by factors of approximately 2.36 and 1.23, while SW exceeded them by 34.23 and 12.36 times. Referring to the BAP, TSS surpassed the acceptable levels by 68.46 and 4.78 times for SW and WE, respectively. An estimated number of inflow and contamination loads revealed that the SI-SF system could produce 218 m3 ha−1 day−1 of wastewater, and 177, 113, 9.86, and 4.19 kg ha−1 day−1 of TSS, COD, TKN, and TP, respectively. Suggested HRT and APS optimization for SI-SWTS are 13.4 days and 1947 m2, respectively, recommending the full function of settling ponds, including anaerobic, facultative, and maturation ponds. This recommendation provides robust guidance for improving management and adjusting the design and operation of the current biological settling pond configuration. We recommend optimizing HRT and SPA for each functional settling pond to facilitate SI-SW treatment systems’ design and engineering efficiency.

Author Contributions

Conceptualization, T.S.N., H.V.T. and N.V.C.; methodology, T.S.N., H.V.T. and N.T.L.; software, T.S.N. and H.V.T.; validation, N.V.; formal analysis, H.V.T. and N.V.C.; investigation, T.S.N., H.V.T. and N.P.D.; resources, T.S.N.; data curation, T.S.N., H.V.T. and N.V.C.; writing—original draft preparation, T.S.N. and H.V.T.; writing—review and editing, N.T.L. and N.V.C.; visualization, T.S.N. and N.V.C.; supervision, N.V.C.; project administration, N.P.D.; funding acquisition, T.S.N. All authors have read and agreed to the published version of the manuscript.

Funding

This study was funded by WWF Viet Nam.

Institutional Review Board Statement

Not applicable.

Informed Consent Statement

Not applicable.

Data Availability Statement

Not applicable.

Acknowledgments

We would like to thank the WWF-Vietnam who financially supported this research. We thank shrimp producers, local management staff for their collaboration. We also thank Nigel Downes (CIM integrated expert, Can Tho University) for proofreading the manuscript.

Conflicts of Interest

The authors declare no conflict of interest.

References

  1. Anh, N.T.T.; Anh, N.T.K.; Jolly, K. Is Super-Intensification the Solution to Shrimp Production and Export Sustainability? Sustainability 2019, 11, 5277. [Google Scholar] [CrossRef] [Green Version]
  2. Boyd, C.E.; Davis, R.P.; McNevin, A.A. Perspectives on the mangrove conundrum, land use, and benefits of yield intensification in farmed shrimp production: A review. J. World Aquac. Soc. 2021, 53, 12841. [Google Scholar] [CrossRef]
  3. FAO. 2020. Available online: https://www.fao.org/fishery/en/statistics/software/fishstat/en (accessed on 21 January 2022).
  4. Lan, N.T.P. Social and ecological challenges of market-oriented shrimp farming in Vietnam. SpringerPlus 2013, 2, 675. [Google Scholar] [CrossRef] [PubMed] [Green Version]
  5. WWF-VN. Report on “Assessment and Recommendation of Appropriate Solutions to Treat Wastewater from Super-Intensive Shrimp Farms in the Vietnamese Mekong Delta”. 2020. (In Vietnamese) [Google Scholar]
  6. Khoa, T.N.D.; Tao, C.T.; Khanh, L.V.; Hai, T.N. Super-intensive culture of white leg shrimp (Litopenaeus vannamei) in outdoor biofloc systems with different sunlight exposure levels: Emphasis on commercial applications. Aquaculture 2020, 524, 735277. [Google Scholar] [CrossRef]
  7. Shi, Y.; Zhang, G.; Liu, J.; Zhu, Y.; Xu, J. Performance of a constructed wetland in treating brackish wastewater from commercial recirculating and super-intensive shrimp growout systems. Bioresour. Technol. 2011, 102, 9416–9424. [Google Scholar] [CrossRef]
  8. Dauda, A.B. Biofloc technology: A review on the microbial interactions, operational parameters and implications to disease and health management of cultured aquatic animals. Rev. Aquac. 2020, 12, 1193–1210. [Google Scholar] [CrossRef]
  9. Lin, Y.F.; Jing, S.R.; Lee, D.Y.; Chang, Y.F.; Chen, Y.M.; Shih, K.C. Performance of a constructed wetland treating intensive shrimp aquaculture wastewater under high hydraulic loading rate. Environ. Pollut. 2005, 134, 411–421. [Google Scholar] [CrossRef] [PubMed]
  10. Giao, N.T. Water quality in the super-intensive shrimp ponds in Bac Lieu province. Int. J. Environ. Agric. Biotechnol. 2020, 6, 32–39. [Google Scholar] [CrossRef]
  11. Boopathy, R.; Lyles, C. Shrimp Production and Biological Treatment of Shrimp Wastewater in the United States. In New Horizons in Biotechnology; Asia Tech Publishers: New Delhi, NY, USA, 2008; pp. 235–252. [Google Scholar]
  12. Kinne, P.N.; Samocha, T.M.; Jones, E.R.; Browdy, C.L. Characterization of Intensive Shrimp Pond Effluent and Preliminary Studies on Biofiltration. N. Am. J. Aquac. 2001, 63, 25–33. [Google Scholar] [CrossRef]
  13. Cohen, J.M.; Samocha, T.M.; Fox, J.M.; Gandy, R.L.; Lawrence, A.L. Characterization of water quality factors during intensive raceway production of juvenile Litopenaeus vannamei using limited discharge and biosecure management tools. Aquac. Eng. 2005, 32, 425–442. [Google Scholar] [CrossRef]
  14. Li, G.; Wu, Z.; Cheng, S.; Liang, W.; He, F.; Fu, G.; Zhong, F. Application of constructed wetlands on wastewater treatment for aquaculture ponds. Wuhan Univ. J. Nat. Sci. 2007, 12, 1131–1135. [Google Scholar] [CrossRef]
  15. Mirzoyan, N.; Tal, Y.; Gross, A. Anaerobic digestion of sludge from intensive recirculating aquaculture systems: Review. Aquaculture 2010, 306, 1–6. [Google Scholar] [CrossRef]
  16. Von Sperling, M. Waste Stabilisation Ponds; IWA Publ.: London, UK, 2007. [Google Scholar]
  17. Vietnam’s Ministry of Agriculture and Rural Development. National Standard Regulation on Brackish Water Shrimp Culture Conditions for Veterinary Hygiene, Environmental Protection, and Food Safety (QCVN 02-19:2014/BNNPTNT); Vietnam’s Ministry of Agriculture and Rural Development: Hanoi, Vietnam, 2015. (In Vietnamese)
  18. BAP. Best Aquaculture Practices Certification Standards and Implementation Guidelines; Farm Standard: Portsmouth, NH, USA, 2021. [Google Scholar]
  19. APHA; American Water Works Association and Water Environmental Federation. Standard Methods for the Examination of Water and Wastewater, 20th ed.; American Public Health Association: Washington, DC, USA, 1998. [Google Scholar]
  20. Tian, Y.; Chen, G.; Lu, H.; Zhu, H.; Ye, Y. Effects of shrimp pond effluents on stocks of organic carbon, nitrogen and phosphorus in soils of Kandelia obovata forests along Jiulong River Estuary. Mar. Pollut. Bull. 2019, 149, 110657. [Google Scholar] [CrossRef]
  21. McKinnon, A.D.; Trott, L.A.; Alongi, D.M.; Davidson, A. Water column production and nutrient characteristics in mangrove creeks receiving shrimp farm effluent. Aquac. Res. 2002, 33, 55–73. [Google Scholar] [CrossRef]
  22. Luo, W.; Deng, X.; Zeng, W.; Zheng, D. Treatment of wastewater from shrimp farms using a combination of fish, photosynthetic bacteria, and vegetation. Desalination Water Treat. 2012, 47, 221–227. [Google Scholar] [CrossRef]
  23. Barraza-Guardado, R.H.; Arreola-Lizárraga, J.A.; López-Torres, M.A.; Casillas-Hernández, R.; Miranda-Baeza, A.; Magallón-Barrajas, F.; Ibarra-Gámez, C. Effluents of Shrimp Farms and Its Influence on the Coastal Ecosystems of Bahía de Kino, Mexico. Sci. World J. 2013, 2013, 306370. [Google Scholar] [CrossRef]
  24. Anh, P.T.; Kroeze, C.; Bush, S.R.; Mol, A.P.J. Water pollution by intensive brackish shrimp farming in south-east Vietnam: Causes and options for control. Agric. Water Manag. 2010, 97, 872–882. [Google Scholar] [CrossRef]
  25. Roy, D.; Hassan, K.; Boopathy, R. Effect of carbon to nitrogen (C:N) ratio on nitrogen removal from shrimp production waste water using sequencing batch reactor. J. Ind. Microbiol. Biotechnol. 2010, 37, 1105–1110. [Google Scholar] [CrossRef]
  26. Bull, E.G.; Cunha, C.D.L.D.N.; Scudelari, A.C. Water quality impact from shrimp farming effluents in a tropical estuary. Water Sci. Technol. 2021, 83, 123–136. [Google Scholar] [CrossRef]
  27. Páez-Osuna, F. The Environmental Impact of Shrimp Aquaculture: Causes, Effects, and Mitigating Alternatives. Environ. Manag. 2001, 28, 131–140. [Google Scholar] [CrossRef]
  28. Martínez-Dalmau, J.; Berbel, J.; Ordóñez-Fernández, R. Nitrogen Fertilization. A Review of the Risks Associated with the Inefficiency of Its Use and Policy Responses. Sustainability 2021, 13, 5625. [Google Scholar] [CrossRef]
  29. Iber, B.T.; Kasan, N.A. Recent advances in Shrimp aquaculture wastewater management. Heliyon 2021, 7, e08283. [Google Scholar] [CrossRef] [PubMed]
  30. Jones, A.B.; O’Donohue, M.J.; Udy, J.; Dennison, W.C. Assessing Ecological Impacts of Shrimp and Sewage Effluent: Biological Indicators with Standard Water Quality Analyses. Estuar. Coast. Shelf Sci. 2001, 52, 91–109. [Google Scholar] [CrossRef]
  31. Alfiansah, Y.R.; Hassenrück, C.; Kunzmann, A.; Taslihan, A.; Harder, J.; Gärdes, A. Bacterial Abundance and Community Composition in Pond Water From Shrimp Aquaculture Systems With Different Stocking Densities. Front. Microbiol. 2018, 9, 2457. [Google Scholar] [CrossRef] [Green Version]
  32. Yang, P.; Lai, D.Y.F.; Jin, B.; Bastviken, D.; Tan, L.; Tong, C. Dynamics of dissolved nutrients in the aquaculture shrimp ponds of the Min River estuary, China: Concentrations, fluxes and environmental loads. Sci. Total Environ. 2017, 603–604, 256–267. [Google Scholar] [CrossRef] [PubMed] [Green Version]
  33. da Silva, K.R.; Wasielesky, W.; Abreu, P.C. Nitrogen and Phosphorus Dynamics in the Biofloc Production of the Pacific White Shrimp, Litopenaeus vannamei: Nitrogen and phosphorus dynamics in the biofloc production. J. World Aquac. Soc. 2013, 44, 30–41. [Google Scholar] [CrossRef]
  34. Li, R.H.; Liu, S.M.; Li, Y.W.; Zhang, G.L.; Ren, J.L.; Zhang, J. Nutrient dynamics in tropical rivers, lagoons, and coastal ecosystems of eastern Hainan Island, South China Sea. Biogeosciences 2014, 11, 481–506. [Google Scholar] [CrossRef] [Green Version]
  35. Cheng, X.; Hou, L.; Liu, M.; Zheng, Y.; Yin, G.; Li, X.; Li, X.; Gao, J.; Deng, F.; Jiang, X. Inorganic nitrogen exchange across the sediment–water interface in the eastern Chongming tidal flat of the Yangtze Estuary. Environ. Earth Sci. 2015, 74, 2173–2184. [Google Scholar] [CrossRef]
  36. Chaikaew, P.; Rugkarn, N.; Pongpipatwattana, V.; Kanokkantapong, V. Enhancing ecological-economic efficiency of intensive shrimp farm through in-out nutrient budget and feed conversion ratio. Sustain. Environ. Res. 2019, 29, 28. [Google Scholar] [CrossRef] [Green Version]
  37. Dierberg, F.E.; Kiattisimkul, W. Issues, impacts, and implications of shrimp aquaculture in Thailand. Environ. Manag. 1996, 20, 649–666. [Google Scholar] [CrossRef]
  38. Ho, L.T.; Van Echelpoel, W.; Goethals, P.L.M. Design of waste stabilization pond systems: A review. Water Res. 2017, 123, 236–248. [Google Scholar] [CrossRef] [PubMed]
  39. EPA/600/R-11088; Principles of Design and Operations of Wastewater Treatment Pond Systems for Plant Operators, Engineers, and Managers, United States Environmental Protection Agency. EPA: Columbus, OH, USA, 2011; p. 457.
  40. Kayombo, S.; Mbwette, T.S.A.; Katima, J.H.Y.; Ladegaard, N.; Jørgensen, S.E. Waste Stabilization Ponds and Constructed Wetlands-Design Manual; UNEP-IETC/Danida: Copenhagen, Denmark, 2004. [Google Scholar]
  41. Supriya, G.; Yamini, M.; Rupobrata, P.; Kalp, B.P.; Asheesh, K.Y. Conventional wastewater treatment technologies. In Strategic Perspectives in Solid Waste and Wastewater Management; Elsevier: Amsterdam, The Netherlands, 2021; Chapter 3; pp. 47–75. [Google Scholar] [CrossRef]
  42. Cruddas, P.H.; Asproulis, N.; Antoniadis, A.; Best, D.; Collins, G.; Porca, E.; Jefferson, B.; Cartmell, E.; McAdam, E.J. The impact of hydraulic retention time on the performance of two configurations of anaerobic pond for municipal sewage treatment. Environ. Technol. 2021, 1–14. [Google Scholar] [CrossRef] [PubMed]
  43. Mara, D.; Pearson, H. Design Manual for Waste Stabilization Ponds in Mediterranean Countries; Lagoon Technology International Ltda: Leeds, UK, 1998. [Google Scholar]
  44. Jadhav, K.; Jadhav, I.; Bilore, S.K. Effect of Hydraulic Retention Time (HRT) on Surveillance of Coliforms in Waste Stabilization Pond (WSP) System in Central India. Hydrol. Current Res. 2013, 4, 154. [Google Scholar] [CrossRef]
  45. Marais, G.V.R. Faecal Bacteria Kinetics in Waste Stabilization Ponds. J. Environ. Eng. Div. 1974, 100, 119–139. [Google Scholar] [CrossRef]
Figure 1. Study area in Bac Lieu and Ca Mau provinces, Vietnamese Mekong Delta.
Water 14 00932 g001
Figure 2. Relationship between COD and HRT (orange line) (a), and TSS and HRT (blue line) (b). The non-linear regression was done at a confidence interval of 95%. Red-dotted lines and the yellow line show the allowable limit of pollutant concentration in shrimp wastewater before releasing it to the receiving environment (QCVN 02-19:2014/BNNPTNT) and BAP, respectively.
Water 14 00932 g002
Table 1. Characteristics of super-intensive shrimp farming wastewater.
ParametersSiphon Wastewater InflowWater Exchange InflowSettling Pond OutflowStandard
Temperature (°C)32.55 ± 1.7032.21 ± 1.2333.69 ± 1.24NA
pH7.46 ± 0.277.53 ± 0.247.92 ± 0.485.5–9.0 ; 6.0–9.5
Salinity (‰)34.65 ± 5.6034.30 ± 5.2636.00 ± 4.41NA
Alkanility (mgCaCO3 L−1)293.00 ± 105.88257.50 ± 69.00206.00 ± 41.2NA
DO (mg L−1)0.47 ± 0.265.27 ± 1.556.72 ± 4.155
TSS (mg L−1)3422.9 ± 2820.3238.61 ± 152.4895.42 ± 71.98100 ; 50
COD (mg L−1)1853.7 ± 1103.8198.31 ± 62.46125.27 ± 51.17150
N-NH4+ (mg L−1)101.21 ± 54.858.83 ± 4.973.91 ± 4.51NA
N-NO2 (mg L−1)0.24 ± 0.190.19 ± 0.340.11 ± 0.29NA
NH3 (mg L−1)0.46 ± 0.460.29 ± 0.240.23 ± 0.26NA
TKN (mg L−1)161.32 ± 163.9319.48 ± 6.808.03 ± 6.98NA
TP (mg L−1)91.68 ± 133.504.68 ± 1.911.35 ± 0.78NA
H2S (mg L−1)19.21 ± 8.801.93 ± 0.631.81 ± 1.02NA
Data are presented by mean ± standard deviation (SD), n = 20; QCVN 02-19:2014/BNNPTNT; BAP standards and guidelines; “NA”, not applicable.
Table 2. Flow rates of wastewater, HRT and loading rate of TSS, COD, TKN, and TP, and removal efficacy of biological settling ponds.
ItemsWastewater
(m3 ha−1 day−1)
Inflow
(kg ha−1 day−1)
Outflow
(kg ha−1 day−1)
Settling Ponds
(day)
Removal Efficacy (%) ¡
Flow rate 217.98 ± 104.03NANANANA
HRTNANANA12.5 ± 9.56NA
TSSNA177.15 ± 173.4422.14 ± 25.19NA87.50
CODNA113.49 ± 92.3727.47 ± 19.04NA75.80
TKNNA9.86 ± 8.541.80 ± 2.00NA81.74
TPNA4.19 ± 5.300.31 ± 0.29NA92.6
the flow rate of SW and WE inflow; Flow rates of wastewater between inflow and outflow were assumed equivalently; Data are presented by mean ± standard deviation (SD), n = 20; was detected by Equation (1); ¡ was calculated by Equation (2).
Publisher’s Note: MDPI stays neutral with regard to jurisdictional claims in published maps and institutional affiliations.

