
The Role of Aquifers in Sustaining the Sponge City Concept in Chinese High-Density Housing
by
 , , , , and
Mengxiao Jin
1,2,3,†, 
Michele Lancia
2,3,*,†,
Yong Tian
2,3,
Stefano Viaroli
4 ,
,
Charles Andrews
5,
Junguo Liu
2,3 and
Chunmiao Zheng
2,3,* 1
School of Environment, Harbin Institute of Technology, Harbin 150001, China
2
Guangdong Provincial Key Laboratory of Soil and Groundwater Pollution Control, School of Environmental Science and Engineering, Southern University of Science and Technology, Shenzhen 518055, China
3
State Environmental Protection Key Laboratory of Integrated Surface Water-Groundwater Pollution Control, School of Environmental Science and Engineering, Southern University of Science and Technology, Shenzhen 518055, China
4
Department of Sciences, University of Roma Tre, 00146 Rome, Italy
5
S.S. Papadopulos and Associates, Inc., Rockville, MD 20852, USA
*
Authors to whom correspondence should be addressed.
†
These authors contributed equally to this work.
Water 2022, 14(6), 929; https://doi.org/10.3390/w14060929
Submission received: 14 January 2022
/
Revised: 13 March 2022
/
Accepted: 14 March 2022
/
Published: 16 March 2022
(This article belongs to the Topic Sustainable Environmental Technologies)
Abstract
:Chinese cities and megacities occupy large areas with high population densities. These urban sectors have extensive impervious surfaces and import large amounts of water from pristine sources, putting pressure on the urban drainage systems during storms. To reduce flood risk and tackle water scarcity, the Chinese government promulgated the Sponge City concept: an ensemble of absorbing features, including permeable pavements and green roofs, to reduce urban runoff and increase water storage. We evaluate the benefits of merging the urban aquifer with conventional Sponge City features by simulating stormwater storage in aquifers with a groundwater model (MODFLOW) and a stormwater management model (SWMM). The urban aquifers of an ideal district, characterized by high-density housing and a flat morphology, collect and dissipate extreme rains (200 mm in 6 h) when the hydraulic conductivity of the subsoil is higher than 1·10−5 m/s, roughly corresponding to a medium productive aquifer. Economic and ecological benefits at the catchment scale are also discussed. Suitable shallow aquifers are individuated and discussed throughout China via a hydrogeological and geomorphological approach. The proposed method increases the percentage of water that can be controlled above that obtained through conventional Sponge City features.
1. Introduction
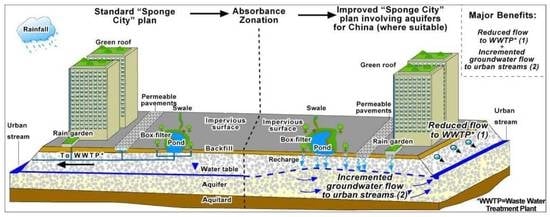
Asian megacities are susceptible to urban flooding due to rapid urban expansion and the increasing concentration of population and property [1]. Existing infrastructure collects a remarkable amount of water due to the sum of urban runoff and imported water for industrial and civil use [2]. Runoff from large storms, however, frequently overwhelms existing sewers and waste-water treatment plants (WWTP). Waterlogging and flooding have become more frequent as cities expand and climate change intensifies extreme weather events, more than anything previously experienced [3,4,5,6]. Inspired by strategies and practices from the Western world [7], China introduced the Sponge City concept to mitigate waterlogging and flooding risks [8]. The proposed concept consists of installations on the ground surface that collect and reuse rainfall with additional architectural, ecological, and socio-economic benefits [9]. To retrofit urban areas, installations are connected to pipes and tanks that increase the percentage of collected rainfall. Captured water flow has the dual goal of mitigating waterlogging and flooding risks while simultaneously addressing water scarcity [10].
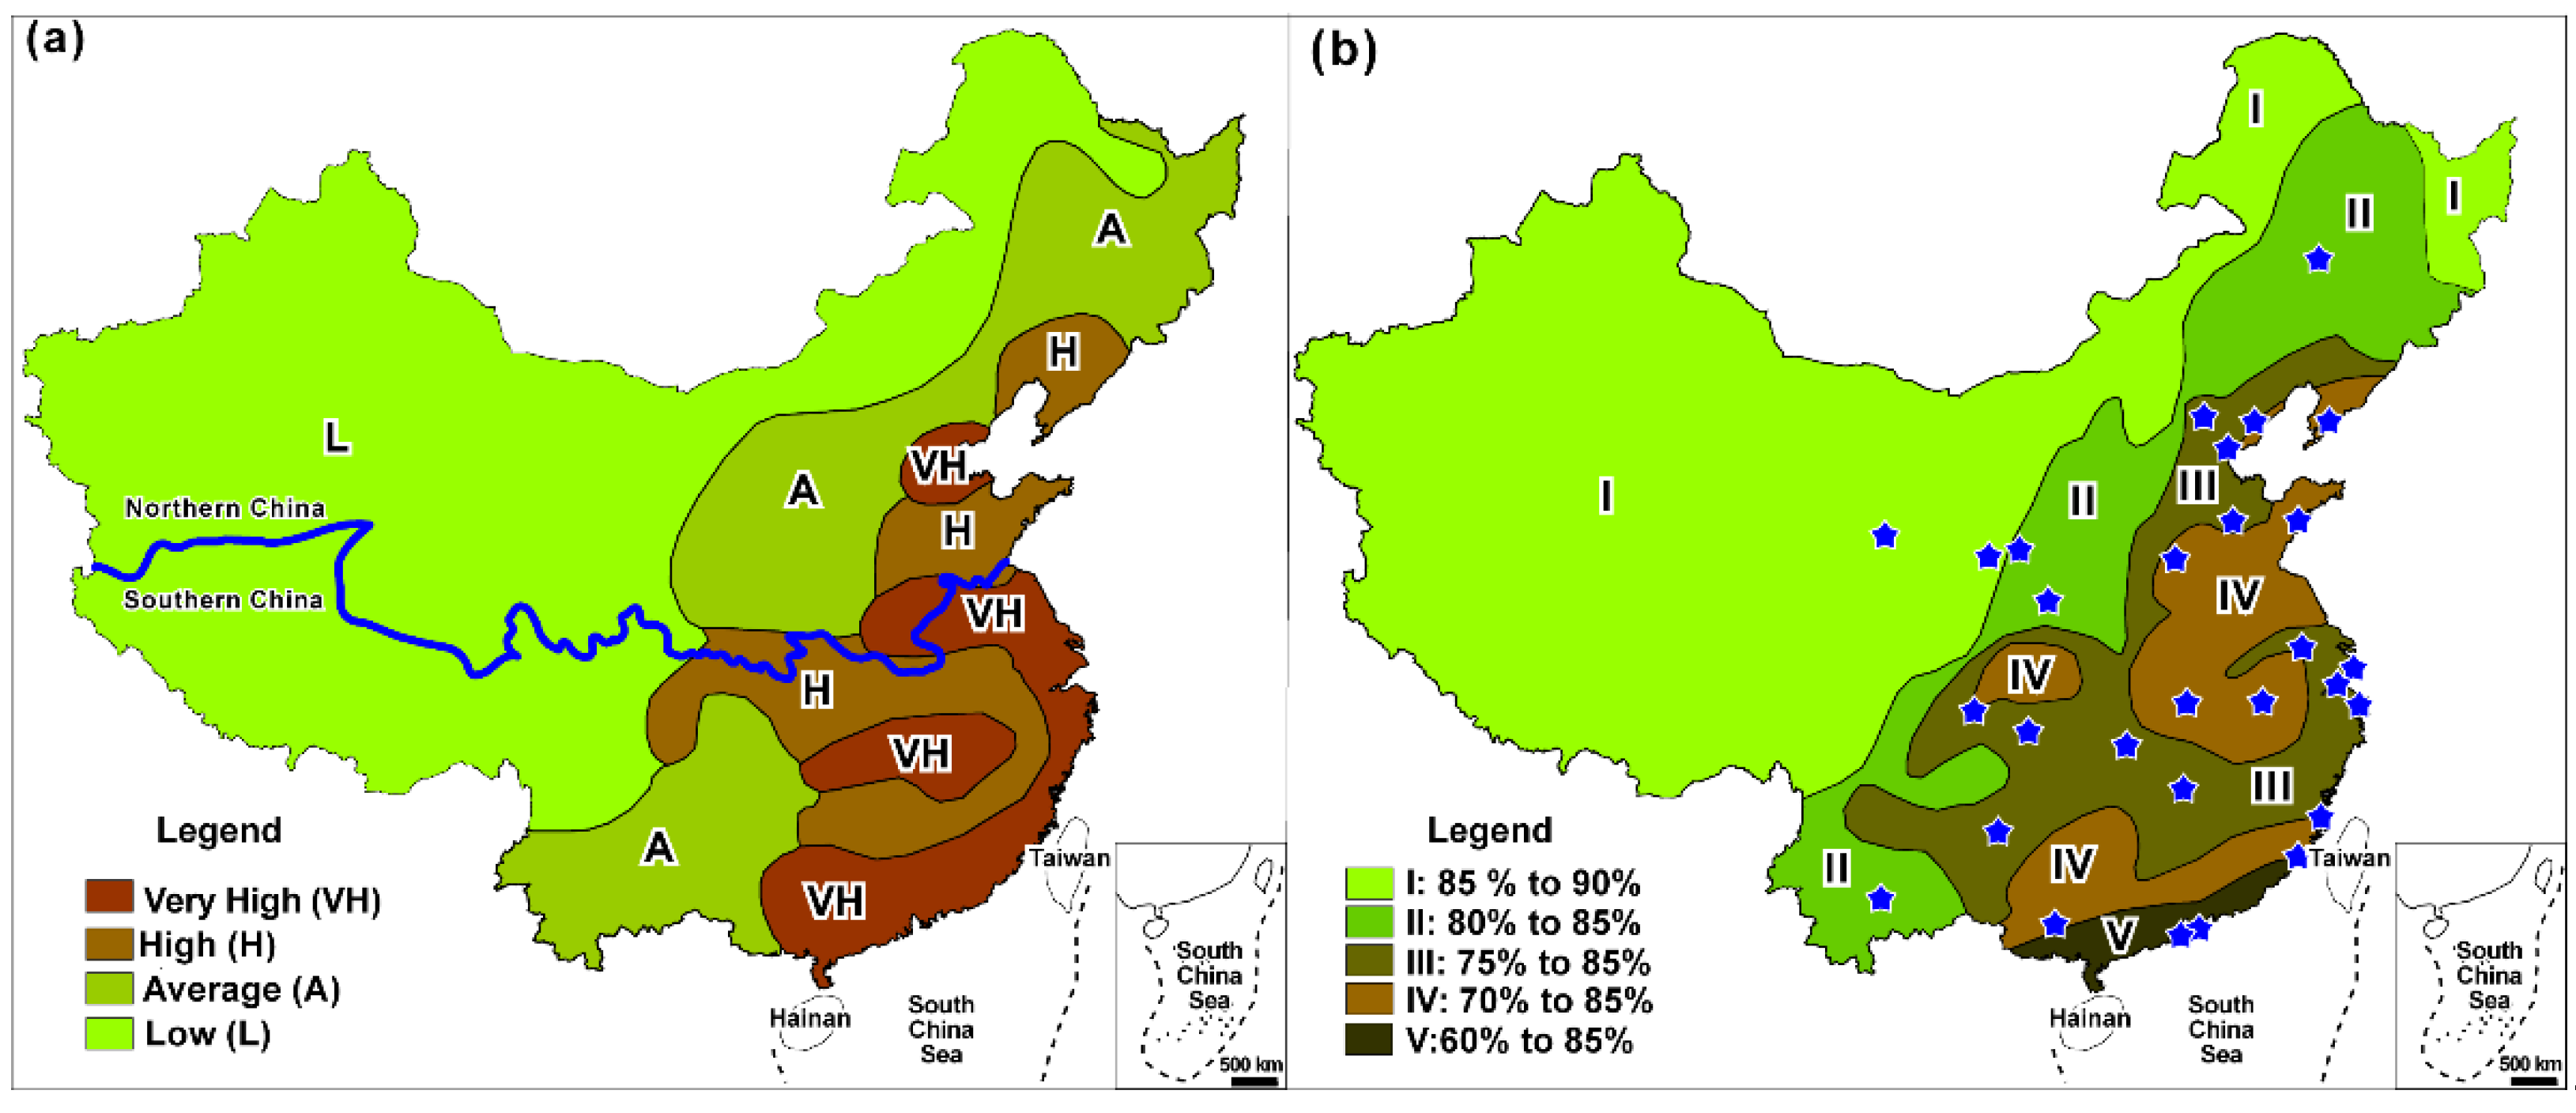
The goals of implementing the Sponge City concept reflect the duality of the water problem [11] between northern and southern China (Figure 1a). Northern China has a dry climate, and has historically relied on diminishing groundwater resources. Lately, expensive water infrastructures such as the South-to-North Water Diversion Project have alleviated the water scarcity, diverting surface water from southern China catchments [12]. Unfortunately, in northern China the rainfall is concentrated in the summer season, making the urban areas susceptible to waterlogging and flooding (Figure 1a). In southern China, the water demand is satisfied by the numerous reservoirs that gather the abundant sub-tropical rainfalls. During the prolonged wet season, waterlogging and flooding risks are high as the drainage network gets overloaded (Figure 1a). Unfortunately, two thirds of China’s land is at risk of flooding, and 62% of Chinese cities have experienced urban rainstorm waterlogging disasters in recent years [13], causing direct economic loss averaging 330 billion RMB per year between 2011 and 2016 [14]. Thus, urban waterlogging is a crucial problem that limits the sustainable and healthy development of Chinese cities and megacities [15].
In China, residential areas are arranged with high-density housing. This compact urban policy is convenient and feasible [16]. Among the setbacks, high-density housing produces a concentration of clean and black water, which is then managed by pipe networks and waste-water treatment plants (WWTPs). In case of heavy rainfall and storms, pipe network and urban streams come under pressure; the situation worsens during weather warnings as the population is encouraged to stay home, increasing domestic consumption. Despite the government’s recommendation to introduce 30% green areas in each compound [17], the management of urban groundwater and waterlogging risk mitigation in these areas is challenging.
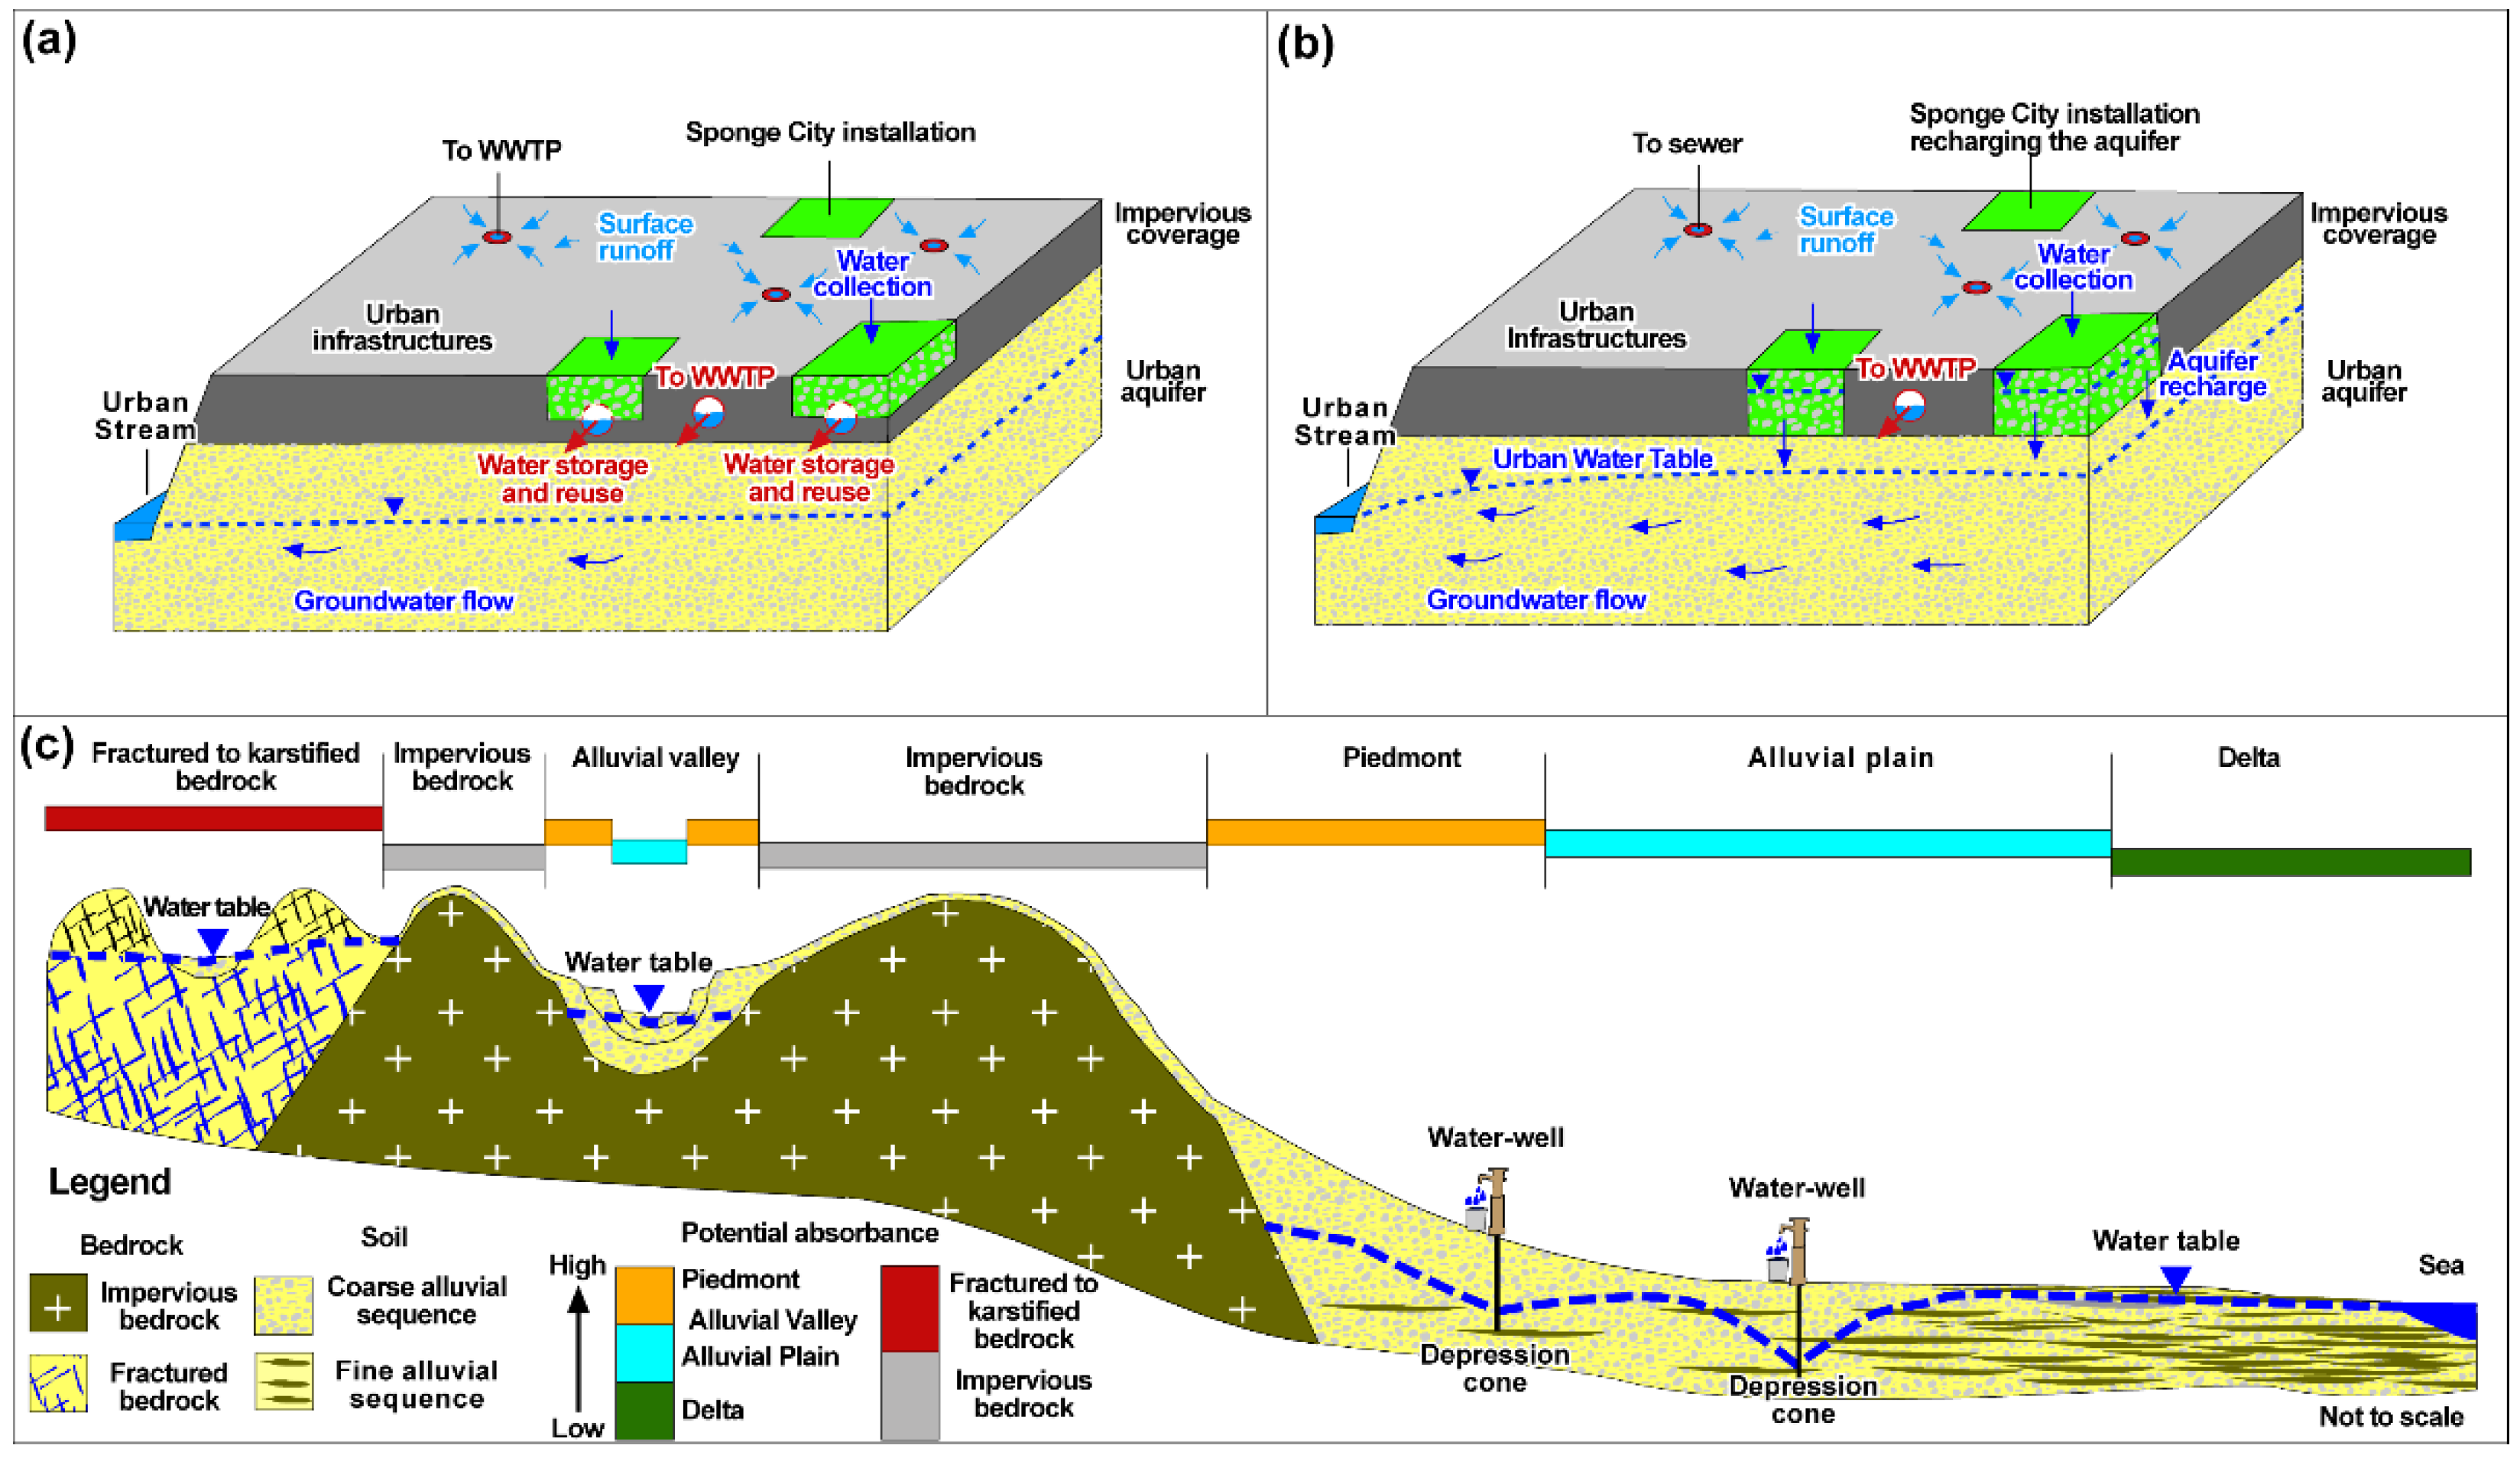
The Sponge City concept has the ambitious goal of controlling 65% to 100% of the runoff from urban areas; the goal varies throughout China (Figure 1b). Implementation of the Sponge City initiative began with several pilot sites, and is planned to be extended to many other areas within the next decades [18]. Considering that precipitation is not evenly distributed across the year, numerous and capacious infrastructures are necessary to collect and treat the summer runoff in both northern and southern China. Sponge City installations require pipes and tanks to collect rainfall (Figure 2a). The concept requires large storage volumes that are expensive, and retrofitting existing building and infrastructure is challenging. In addition, retrofitting practices are not adequately compensated through the reuse of collected water [19]. As an alternative, Sponge City installations can be designed to divert rainwater into urban aquifers, restoring natural recharge processes and the groundwater flow regime (Figure 2b). Urban aquifers are underutilized because they largely contain low quality water caused by pollution. Numerical analyses illustrate the effectiveness of urban soil for storing large volumes of water, but quantifying the potential for storage at the catchment scale is challenging [20,21]. The proposed method is inexpensive and can be applied to all minor cities characterized by smaller budgets.
The major obstacle to the use of urban aquifers as a component of Sponge City implementation is the characterization of the urban hydrogeology. In cities and megacities, groundwater recharge changes in space and time [22]. Impervious surfaces such as building and roads impede rainfall recharge, favoring surface runoff. At the same time, sewers, septic tanks, irrigation excess of parks and flowerbeds, and water supply networks recharge aquifers through infrastructure leakage. Water table maps and groundwater budgets are difficult to compile. In addition, for water storage in aquifers to be feasible (Figure 2b), the soils need to have a sufficiently high hydraulic conductivity and the water table should be located at sufficient depth to not rise to the surface during intense storms or during the prolonged wet season [23]. Ref. [24] suggests the potential absorbance of many Chinese megacities based on groundwater data and geomorphological evidence. However, regional scale analysis is necessary as the application of these practices is of wide interest, especially in smaller cities characterized by less funding.
Because of the duality of Chinese water issues, the intrinsic problem of urban groundwater, and the complexities of city infrastructures, the use of urban aquifers for storage of runoff is not trivial. The feasibility of utilizing aquifers as natural storage tanks in the Sponge City concept is assessed by numerical simulations. Aquifer dynamics underlying a flat residential area of high-density living compounds surrounded by streams are analyzed. The simulated setting represents a typical case in the urbanized alluvial plains and valleys of China. Soils with different hydraulic characteristics are implemented in a MODFLOW groundwater model [25], and results are compared with an ensemble of Sponge City installations, as suggested by [8], using the Storm Water Management Model (SWMM) [26,27]. Via the following analysis, the proposed method (1) quantifies the advantages and limits of the urban aquifers; and (2) compiles an absorbance map for the urban areas of China to assist in the improvement of the Sponge City performance.
2. Materials and Methods
2.1. The Aquifer Potential Absorbance
The potential for recharge absorbance at the city scale is difficult to characterize because of heterogeneities in the aquifers and the water infrastructure distribution systems. Variability in the geologic media and the leakage rate from the water infrastructure makes it difficult to characterize hydraulic conductivity and water table oscillations. As the urban expansion of the last decades encompassed large formerly rural areas, urbanization incorporated zones with anthropic modifications such as river diversions, dried up lakes and rivers, rice paddies or other cultivated areas where the natural absorbance capacity of the aquifers has been modified by adding or removing sediments.
Despite the intrinsic uncertainties and difficulties in characterizing the urban subsoil media, a general characterization can be developed by studying the shallow layers at the regional scale. In particular, the connection between the geomorphological and hydrogeological settings remains the driving factor in determining the regional absorbance potential. In accordance with the conceptual model proposed for the hilly terrains of Shenzhen via direct geomorphological and hydrogeological data [23] and major Chinese megacities [24], a conceptual model is proposed to characterize the urban areas. From the mountain sectors to the coastline, each geomorphological sector has unique characteristics of its own:
The bedrock sector is characterized by mountain slopes with a heterogeneous absorbance potential depending on hydraulic conductivity. Metamorphic to igneous rocks are mostly impervious, and infiltrated rain circulates through the shallow weathered blankets (Figure 2c). These blankets represent thin but continuous shallow aquifers where infiltration of precipitation depends on the hydraulic characteristics of the soil. Wet and warm climate areas tend to have thicker soils with a richer component of clays due to increased biological activity; a cold to dry climate, on the other hand, creates thinner but clastic soils [28]. Fractured to karstified sequences can help infiltrate a significant amount of rain via preferential paths (e.g., dolines, polje) or leakage from the upper soil. In this case, the regional water table can be located as deep as hundreds of meters below the ground surface.
The piedmont sector connects the mountain bedrock with alluvial plains and valleys. This sector consists of coarse sequences identifiable as detrital bands and alluvial fans. The sector extent depends on the basin or valley size, and the geological history that caused the depression. The piedmont at the base of the small hills has a width of just tens to hundreds of meters but reaches a width of tens of kilometers in the largest basins. The deposits generally have high conductivity and a flat water table connected to the multilayer aquifers of the alluvial plains and valleys. Moving upstream along the sector, the water table becomes deeper and potential absorbance increases (Figure 2c).
The alluvial valleys consist of coarse fluvial deposits with high hydraulic conductivity alternating with finer lacustrine deposits (natural or anthropic) that can be several orders of magnitude less conductive. Groundwater to surface water exchanges constrain the water table based on the river stage. Thus, the water table is close to the ground near the river and becomes deeper laterally on the fluvial terraces, morphologically higher in elevation (Figure 2c). Thus, potential absorbance generally increases as the distance from the river increases.
The alluvial plain sector is heterogeneous along both vertical and horizontal directions. This sequence is characterized by the alternation of conductive paleochannels, laterally passing to less conductive floodplain deposits. Because of the flat morphology, the water table in connections with rivers and streams is almost coincident with the ground surface. This feature is the main factor limiting the absorbance potential of the plains.
The delta sector is located at the mouth of a river with numerous streams and channels that deposit a huge quantity of fine sediments. Low hydraulic conductivity, flat morphology, and abundant water channel density make the water table almost coincident with the ground level. The potential absorbance capacity is almost null.
The conceptual model of absorbance potential is synthetized in Figure 2c, with a conceptual section from the mountain bedrock sector to the delta. Cities and megacities can occupy many sectors, encompassing more than one catchment. Hilly terrains have diffused small piedmont sectors; major plains and valleys usually have a large piedmont at their borders. The morphology is a direct consequence of the present and former climate, lithology and tectonics characteristics that shaped the landscape in geological times. In addition, the hydrogeological characteristics of the shallow soils in areas of urban expansion play a key role in potential absorbance. Because these parameters may also vary at the district scale, potential absorbance can be further quantified with additional local scale investigations.
2.2. Absorbance Zonation of China
A map of the absorbance potential throughout China was constructed by merging hydrogeological and geomorphological information. The hydrogeological map from [29] provides the basic hydrogeological setting of the area. Permafrost areas, karstified terrains, lacustrine to delta sequences, and the piedmont bands of the large plains have been imported from this map. A river database of China, hydrogeological maps at the province scale from the CGS database, and geomorphological and hydrogeological attributes were also used [30]. Unit limits were refined via manual surveys 1:1,000,000, querying satellite multispectral images from LANDSAT-8 and a Digital Elevation Model (DEM) with a resolution of 250 m. Areas with similar color, tone, and pattern were isolated and arranged with contiguous polygons, in accordance with photogeological techniques. ARGIS 10.4 was utilized for the development of the absorbance potential map.
2.3. Model Setup
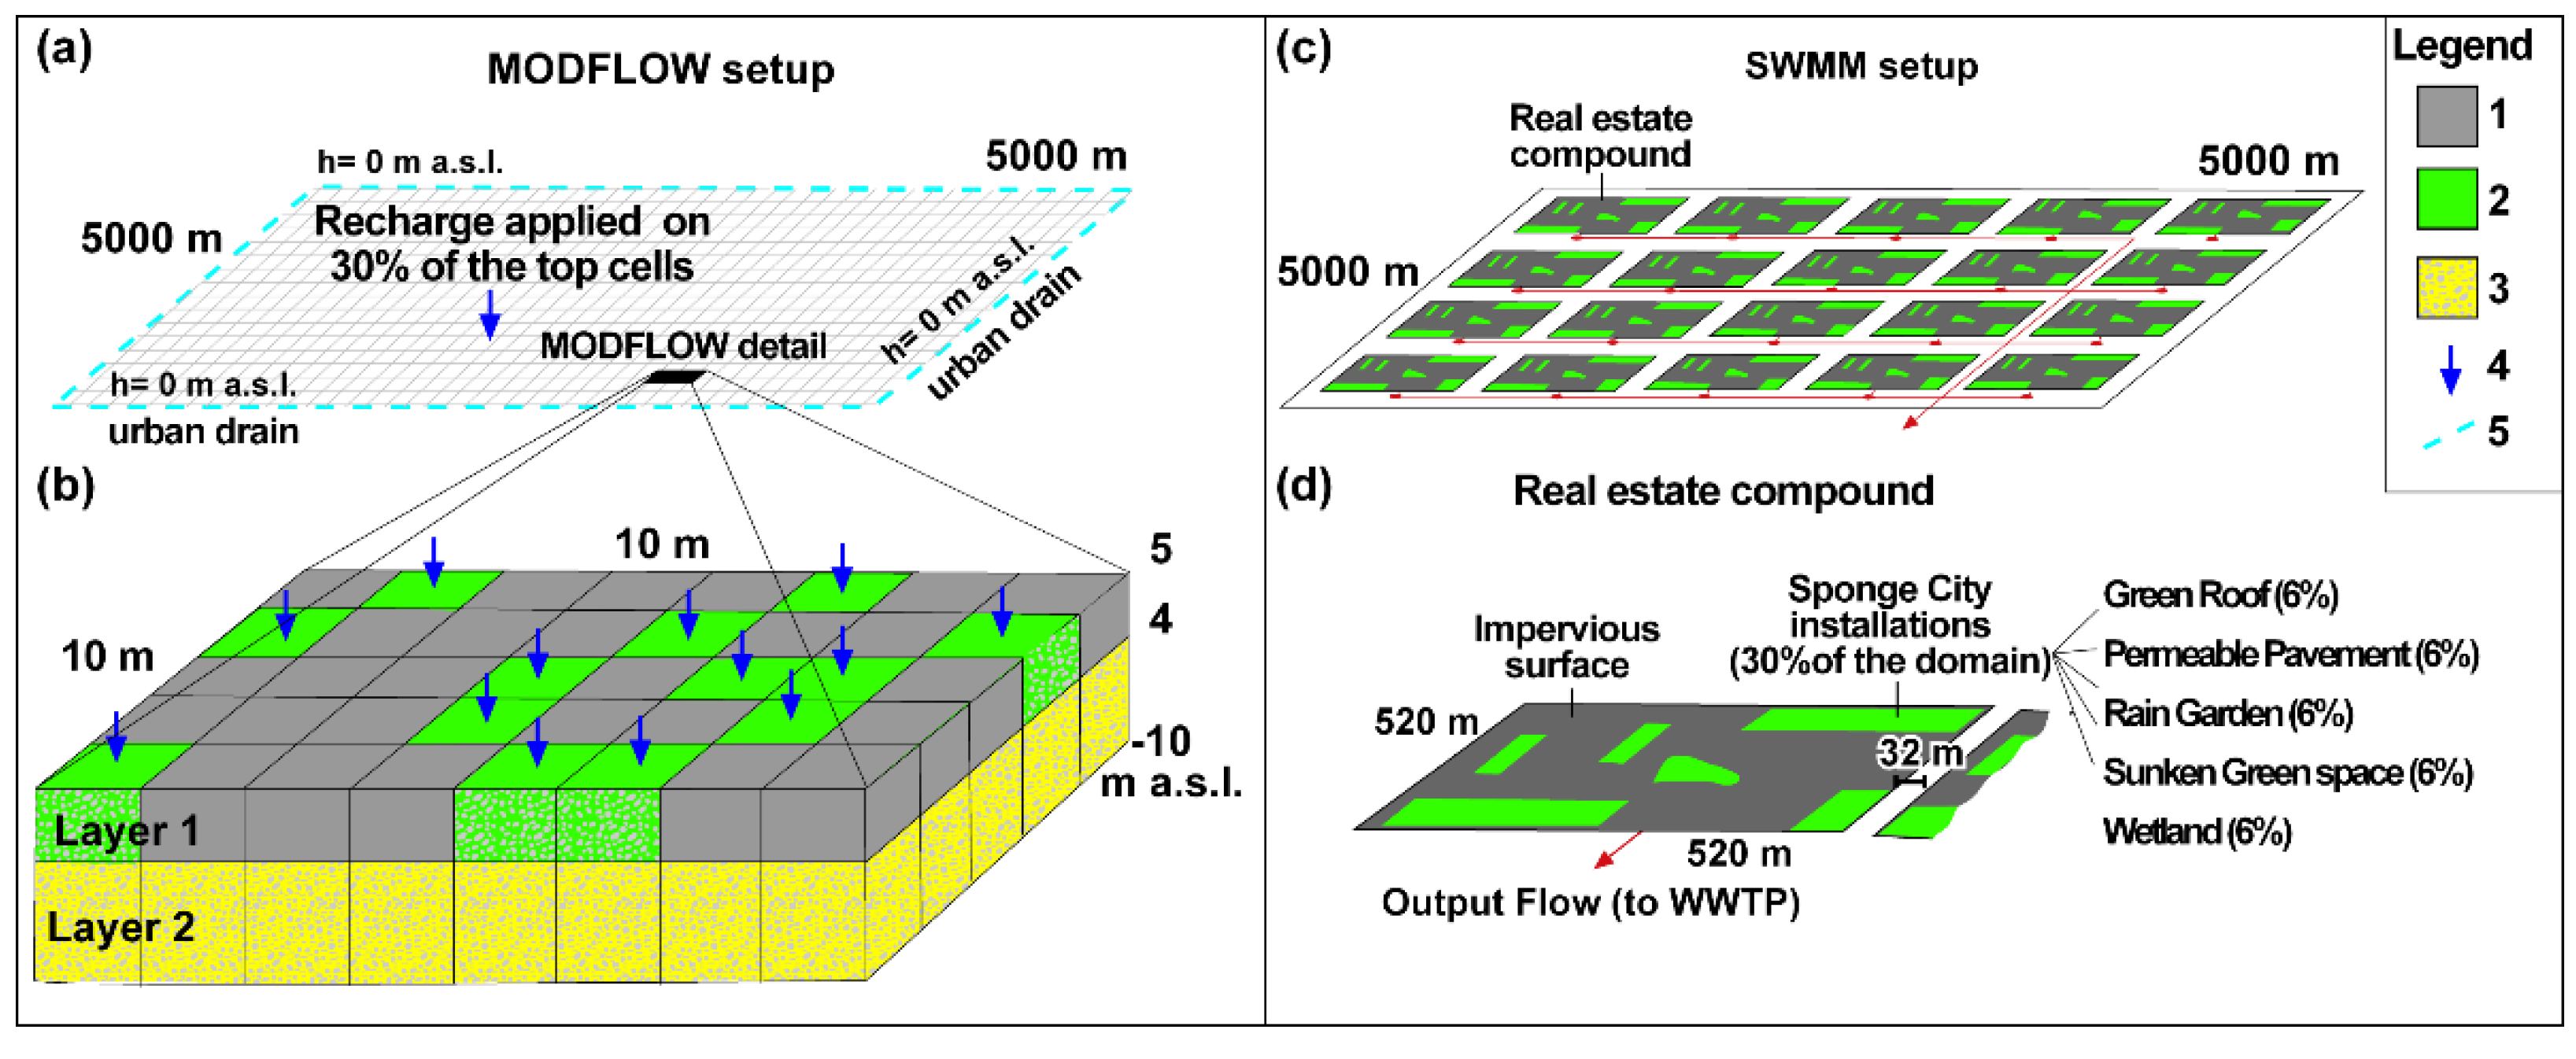
The hydraulic performance of an ideal flat district during and after an intense storm was evaluated using a groundwater model based on the MODFLOW code [25] to quantify the benefit of aquifer storage in the Sponge City design. The model has a square geometry with a total areal extent of 5000 m by 5000 m (25 km2), arranged with 81 real estate compounds of 520 m by 520 m (Figure 3). Each compound simulates high-density living buildings, regularly distributed across the domain and alternated with green spaces equipped with Sponge City installations. High-density living is the most popular construction style in China, and the hydrogeological characterization of these residential areas via numerical analysis is relevant at the national scale. The uniform characteristics of the buildings favor numerical discretization. On the contrary, city centers have unique characteristics due to historical and geographical reasons, and must be characterized at the local scale. In the model, compounds are equipped with absorbing installations covering 30% of the surface. This percentage is the average green space area suggested by the government for each compound [17]. The aquifer characteristics of the district were varied over a reasonable range, and the response of the aquifers to a storm was assessed for different scenarios. Calculated groundwater flows were quantified and compared among scenarios to assess the performance of the Sponge City installations (MOHURD 2014) via SWMM (Figure 3). In the model, MODFLOW and SWMM are loosely coupled as the interaction between groundwater and pipe is neglected.
2.3.1. MODFLOW Setup
The MODFLOW model simulates the groundwater head distribution throughout an ideal district constituted by many high-density living compounds. The model calculates the water flow discharging to the streams located at the domain edges (Figure 3a). It is characterized by 50,000 cells, 10 m width, distributed in 2 layers. Layer 1, specified as one meter thick, consists of absorbing installations and urban impervious infrastructures. The absorbing installations cover 30% of the real estate compounds. Cells are modelled as boxes of sand and gravel recharging the underlying urban aquifer (Figure 3a), arranged with clusters of at least 10 cells and randomly distributed throughout the domain. The remaining cells of Layer 1 are inactive; the urban runoff from the impervious surfaces flows to the sewer, and is not considered in the model. Layer 2 has a thickness of 45 m and represents the urban aquifer, hydraulically connected to the streams. During the MODFLOW simulations, the hydraulic conductivity and specific yield of Layer 2 are varied considering five different materials (Table 1). The UZF (Unsaturated Zone Flow) package in MODFLOW is used where the groundwater table is at land surface.
An initial simulation (first time step) of steady-state conditions was conducted with a recharge of 700 mm/a. This recharge rate is equivalent to a sub-tropical wet climate, with permeable terrains characterized by scarce runoff and large infiltration to the subsoil. The recharge rate includes average conditions for rainfall occurring in the area throughout the year, possible urban recharge from pipe leakage, and evapotranspiration. After a manual trial-and-error procedure, selected boundary conditions stressed the Sponge City system, increasing the chance of waterlogging via soil saturation. In fact, the abundant recharge maintains the water table close to ground level throughout the year. Subsequently, a transient simulation was conducted with 12 time steps of 30 min each with a recharge of 200 mm during this six-hour period to simulate an intense storm. Subsequent time steps simulated the 60 days after the storm, with a steady recharge of 700 mm/a. The analysis was repeated with five different materials having decreasing hydraulic conductivity and specific yield (Table 1), simulating different urban aquifers. Along the boundary of the domain, a specified head of 0 m a.s.l. represented the final outflow of the groundwater system (Figure 3a).
2.3.2. SWMM Setup
The Storm Water Management Model (SWMM) is a distributed hydrological model developed by the U.S. Environmental Protection Agency [26]. The model simulates the surface runoff water quantity of a single rainfall event or long-term events in the urban environment. Many studies have demonstrated the utility and usefulness of SWMM for planning and designing Sponge City-type facilities [31].
The domain model coincides with MODFLOW simulations consisting of 81 square catchments of 520 m by 520 m (Figure 3b). Each catchment corresponds to a real estate compound, connected with junctions and conduits, draining the urban runoff. A storm with a steady distribution of 200 mm in 6 h is considered in conjunction with the MODFLOW model. Manning’s roughness of impervious N-Imperv and perviousN-Perv; depression storage of impervious Dstore-Imperv and pervious Dstore-Perv; and Horton’s infiltration formula, were specified according to the SWMM manual [26]. These parameters affect hydrological processes in the pervious and impervious portions of each sub-catchment, including surface runoff and soil infiltration. Three scenarios were evaluated. In Scenario 1, the sewer drainage system directly collects the rainfall without Sponge City facilities. In Scenario 2, Sponge City installations retain the water attenuating the flow peak of the drainage system, which then flows to the WWTP. A standard module in SWMM simulates the retardation, evaporation, infiltration, and drainage processes of different facilities under rainstorm scenarios. In real estate compounds, five types of Sponge City facilities (Table 2) cover 30% of the top surface. In Scenario 3, Sponge City installations divert the water into the aquifers disconnected from the sewer drainage system.
3. Results
3.1. Drainage Capacity
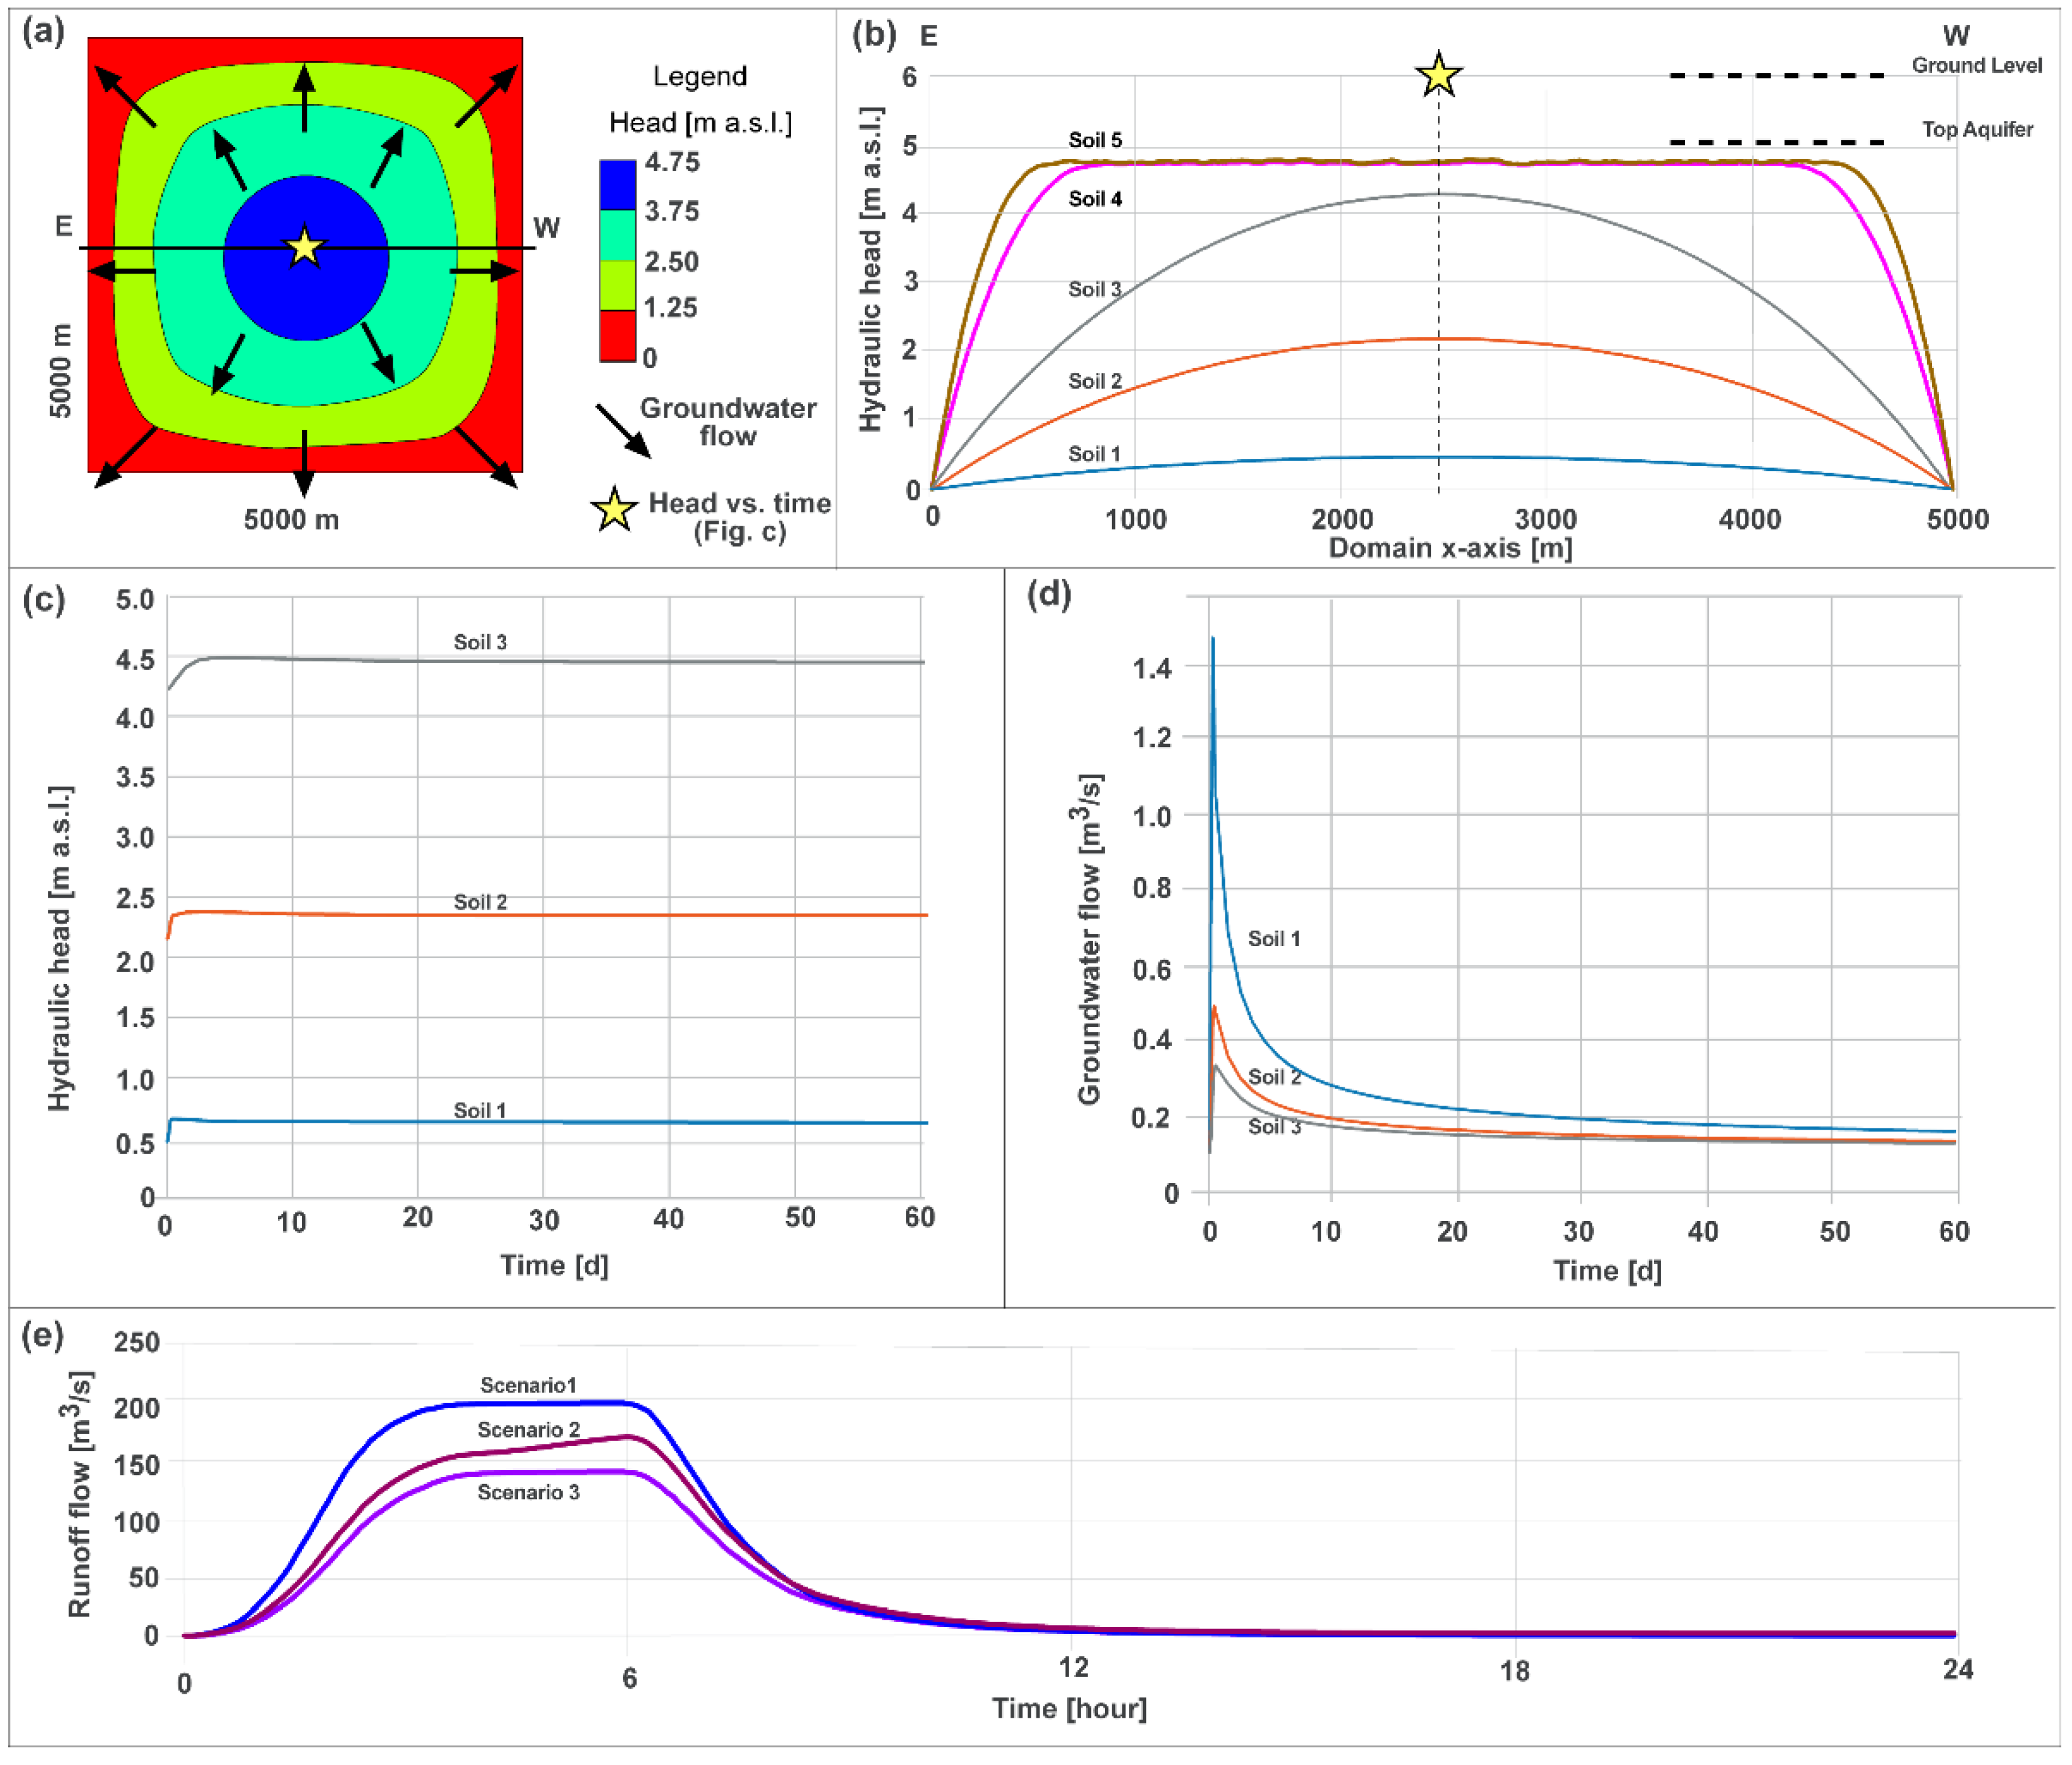
The MODFLOW model simulates the infiltration and draining capacity of urban aquifers through the year, and in the period following an intense rainfall event. Simulations are repeated for five different soils. In all the simulations, the aquifers discharge water into streams at the model boundaries. In steady-state conditions (1st time step), the hydraulic head has a sub-radial geometry with the maximum located in the domain center, the remotest point from the streams (Figure 4a). The maximum hydraulic head simulated in steady state conditions is 0.5 m a.s.l. for Soil 1, 2.2 m a.s.l. for Soil 2, and 4.2 m a.s.l. for Soil 3, with average gradients of 0.2‰, 0.9‰, and 1.7‰ (Figure 4b), respectively. In steady-state conditions, these soils collect and discharge to urban streams a continuous flow of 1.7 m3/s. Soil 4 and Soil 5 do not discharge all the collected water to the streams as 31% and 42% of the infiltrated water leaves the model as surface runoff throughout the model top, respectively. In fact, soils get saturated when the water table reaches the land surface. These soils are not suited to infiltrate a large amount of water during an exceptional storm. Thus, results of the transient groundwater model are only discussed for Soils 1, 2, and 3.
The hydraulic head in the aquifer at the center of the model domain is represented in Figure 4c. The hydraulic head reaches a maximum increment of 35 mm in the first days after the storm. In accordance with soil properties, the incremented hydraulic head slowly declines in the following weeks. Flow is further sustained by continuous recharge after the storm, considering the chance of fresh rainfall after the simulated exceptional storm. Higher increments are observed just underneath the gravel and sand boxes of Layer 1. The shape and number of contiguous active cells of Layer 1 slightly affect the increment variations with time. Peak discharges to the streams of 1.51 m3/s, 0.54 m3/s, and 0.38 m3/s are simulated for Soil 1, Soil 2, and Soil 3, respectively, in the hours after the storm. After 60 days, the flow is still 17% to 34% higher than the groundwater flow in steady-state conditions (Figure 4d).
The results from the storm water management model provide a broad framework of the performance of the drainage system following a storm. Drainage networks, with no Sponge City features, have an immediate response to the storm (Figure 4e). If a total impervious surface is considered, a total flow peak of 196 m3/s is reached (Scenario 1). When 30% of the real estate compound surface is improved with Sponge City installations draining to pipes and tanks, a total peak flow of 172 m3/s is simulated (Scenario 2). The total peak flow of the drainage network is just 12% less than Scenario 1, although the surface recharging the aquifer is about 30% of the real estate compounds. The total flow peak of Scenario 3 is 141 m3/s, a decrement of exactly 30% from Scenario 1. Decremented flow is obtained thanks to the water diverted to the subsoil via the installations.
3.2. The Absorbance Potential throughout China
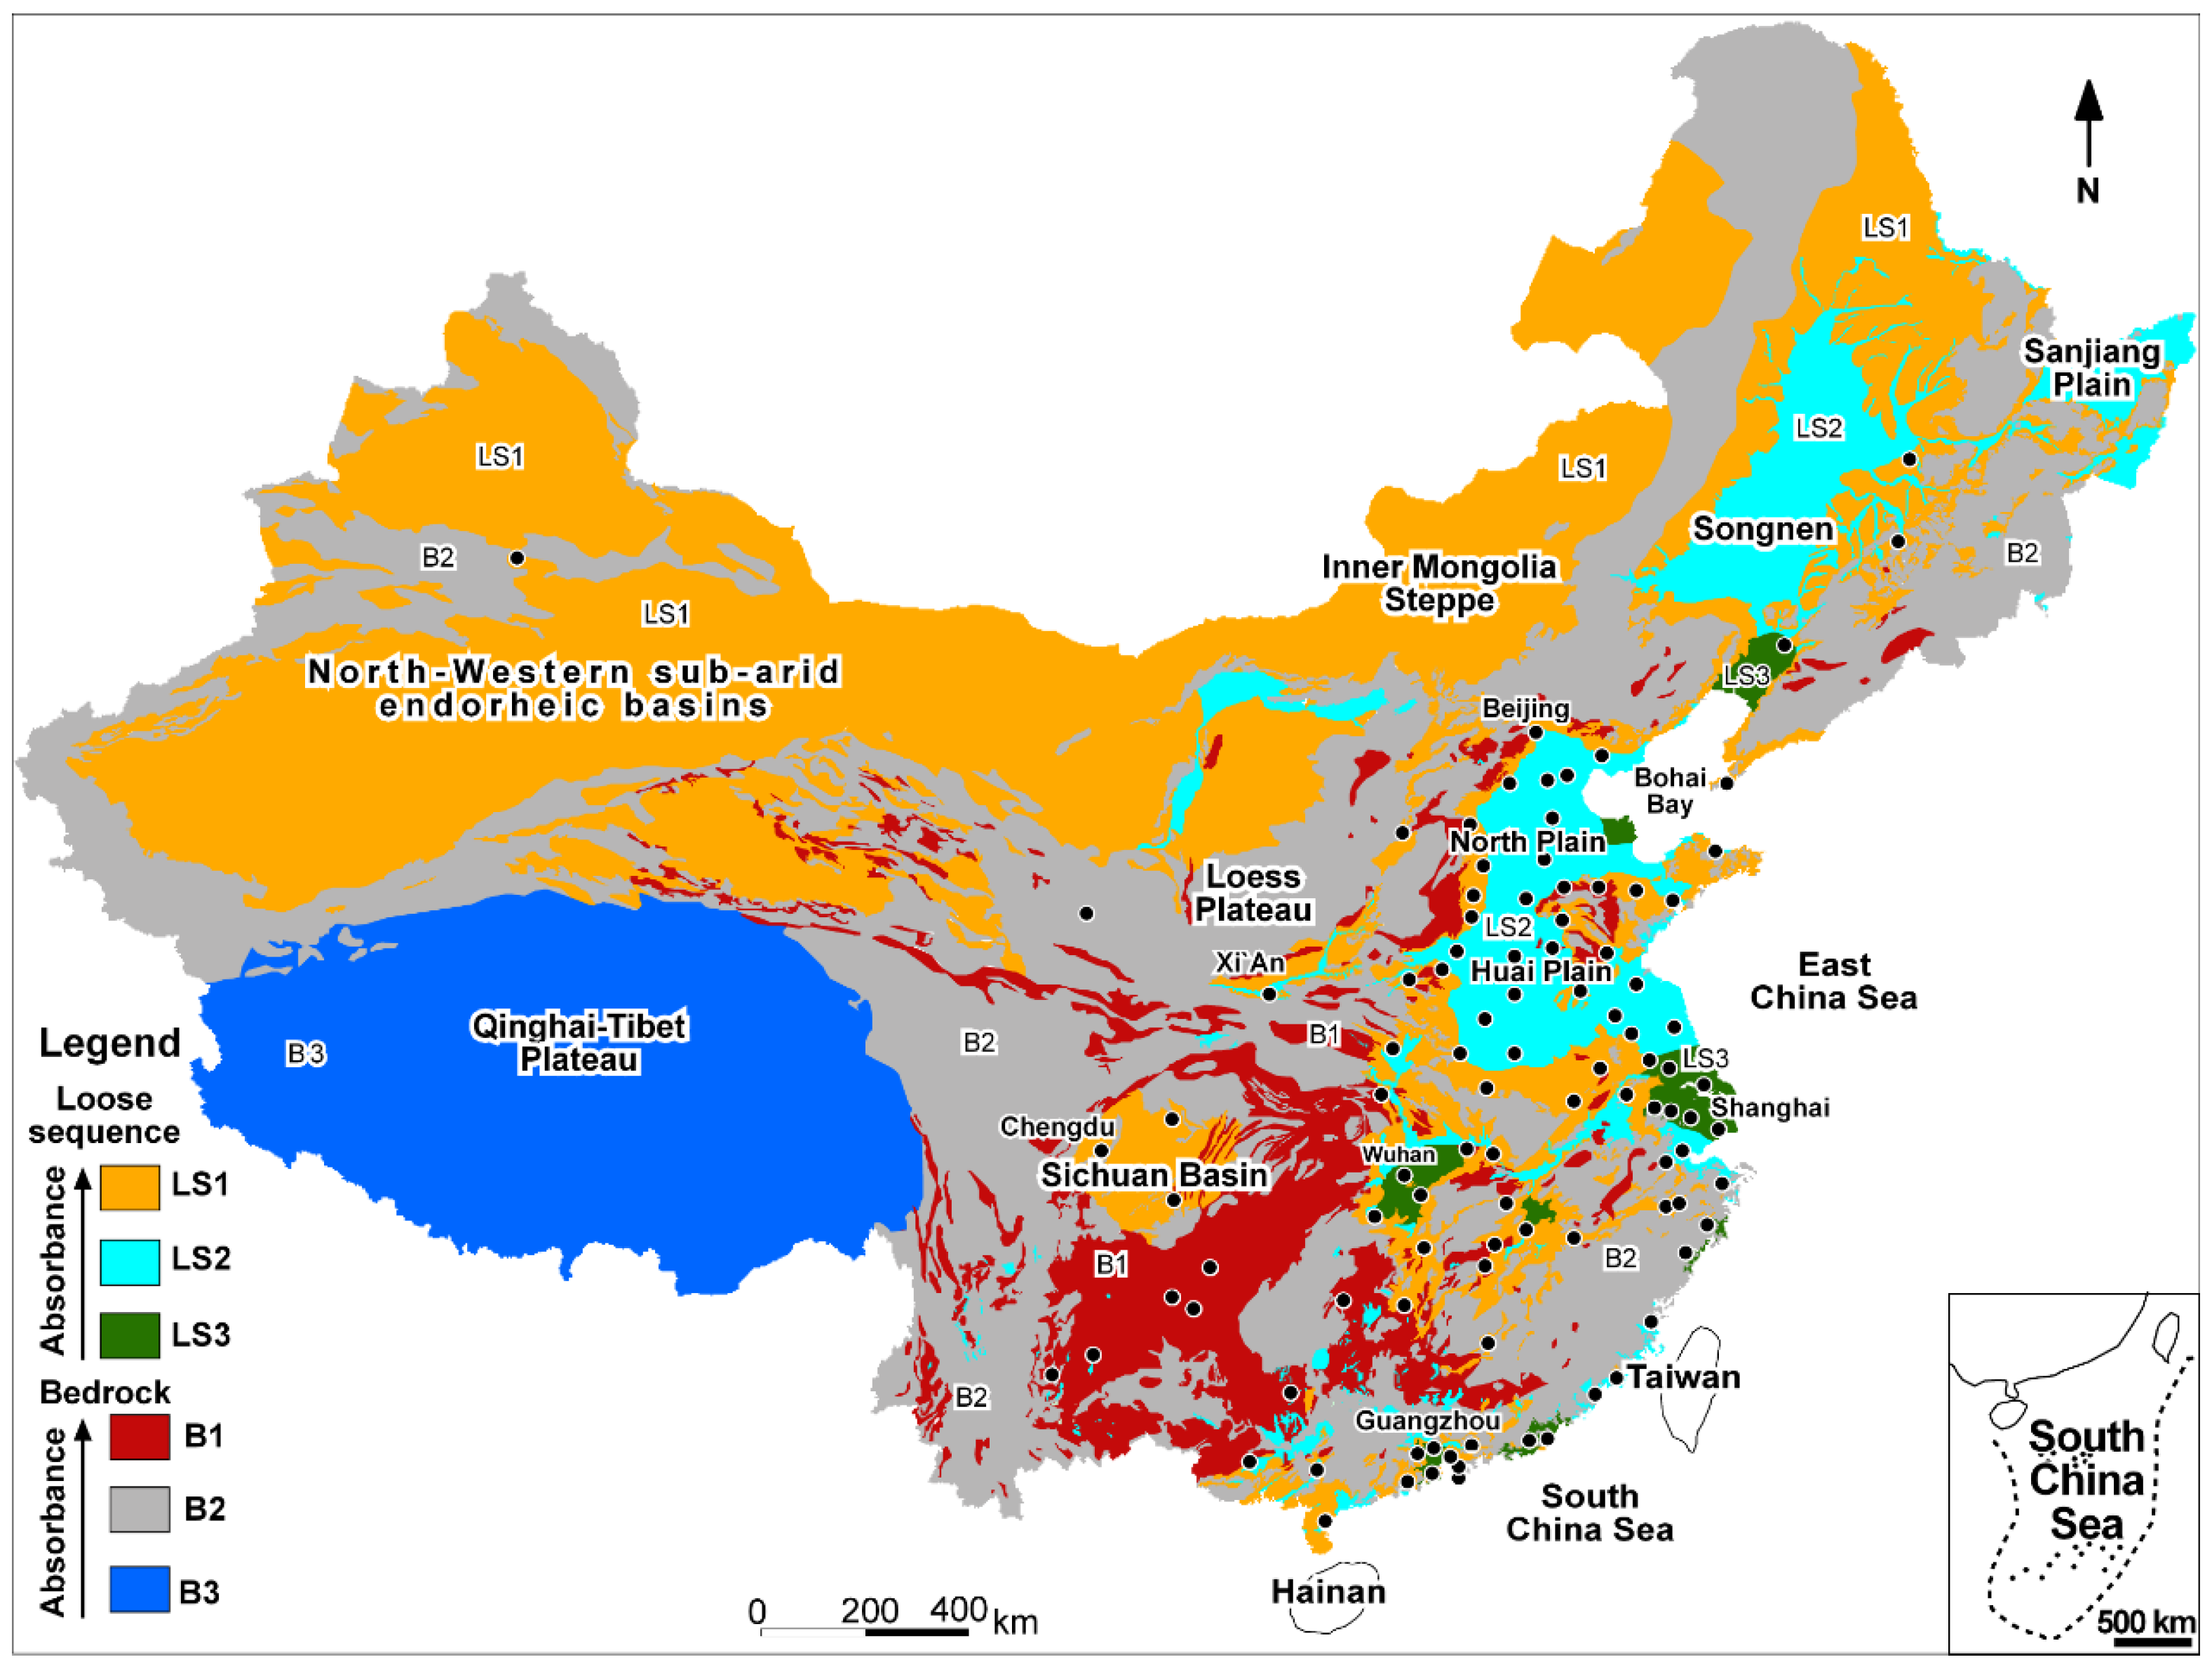
Numerical results point out that in flat urban areas, a significant amount of storm water can infiltrate to the subsoil, reducing the peak flow of the drainage network. A progressive reduction of the absorbance capacity was observed between Soil 3 (k = 5·10−5 m/s), Soil 4 (k = 1·10−5 m/s), and Soil 5 (k = 5·10−6 m/s), and that in the hydrogeological practice corresponded to the passage between an average to a low productive aquifer. Because soils and bedrocks have hydraulic conductivities that span several orders of magnitude, the detected threshold helps assess the absorbance potential. By combining the hydrogeological knowledge of the area with the proposed conceptual model and numerical results, an absorbance map of China is presented.
Piedmont bands, alluvial fans, and terraced alluvial deposits (LS1, in Figure 5) can absorb a significant amount of water. These units strategically extend along the border of the Sanjiang, Songnen, Huai, and North China Plains. The western bounds of Huai and North China Plain are highly urbanized, with many cities and megacities. Due to the alluvial fans, a hilly morphology with fractured to karst bedrock, the Sichuan basin has high potential absorbance. Terraced alluvial valleys of southern China are also mapped with a high potential absorbance capacity. The north-western endorheic basins have coarse sequences that can drain a significant amount of water towards the most depressed points. However, dry climate and lack of significant urbanization nullify the urban waterlogging risk.
The central portion of the alluvial basins and the bottom of river valleys (LS2) extends throughout eastern China (Figure 5). Sandy paleochannels have good hydraulic conductivity [36]. In the last decades, prolonged droughts and massive groundwater withdrawals to sustain urbanization lowered the regional water table, with a maximum drawdown of 1 m/a in North China Plain [11]. The groundwater drawdown caused the progressive disappearance of shallow water bodies. This effect incremented the potential absorbance of the aforementioned areas.
The terminal sector (LS3) is represented by the delta sequence located at the outlet of the major rivers. Lacustrine basins, which dried up in recent history (e.g., Wuhan basin), share the same low absorbance properties as delta sequences. Despite the high-density channels that may shorten the groundwater path from the installation to the streams, low conductive soils do not dissipate infiltration induced by the storm. In fact, densely urbanized areas face recurring waterlogging events, especially along the sub-tropical band, because of unfavorable morphological conditions.
Bedrock outcrops are less urbanized and less prone to be affected by severe waterlogging. Karstified to fractured sequences (B1) have a very high absorbing potential, naturally collecting up to 100% of the rainfall. If the karst processes are extremely intense, as in southern China, absorbed storm water is quickly transferred from aquifer to the rivers, increasing flood risks [37]. In fact, the base of the karst basins and valleys can be seasonally flooded as the regional groundwater level rises. Impervious bedrock (B2) has a limited absorbance capacity, driven by the weathering blankets. This unit coincides with the mountain sectors. The cities in the southeast of China, located on the thin coastal sectors, are often urbanized up to the extent of the bedrock (Figure 5). The Qinghai–Tibet Plateau (B3) has limited absorbance due to the permafrost but, at the same time, has scarce urbanization and a dry climate.
4. Discussion
Urban expansion changed the original urban pattern of major cities in China, merging small villages and rural areas into contiguous cities and megacities. The original urban cores were typically located near shallow water bodies on alluvial plains and in the delta sectors, and with expansion, have progressively also included upstream sectors characterized by a higher absorbance capacity. This process enormously increased in the last 50 years during China’s rapid economic growth. As the most permeable soils are urbanized and made impervious, the total runoff of the catchment increases at the expense of infiltration. In small catchments, the urbanization of the more permeable sectors puts pressure on the drainage network of less permeable sectors, generally located downstream.
Restoration of the natural water cycle in the urban environment is a winning formula to reduce waterlogging and flooding risk. Compared to traditional Sponge City features, installations involving urban aquifers produce better results due to their being disconnected from the drainage system. Numerical analyses have shown that for high-density housing compounds overlying average productive aquifers with hydraulic conductivity higher than 1·10−5 m/s, the area is appropriate for restoration of infiltration potential. Potential absorbance mapping performed at the regional scale (Figure 5) provides a general overview of the areas that are suitable for the proposed approach. In addition, identifying exploited shallow aquifers via water wells, currently or in the past, could represent an indicator of the absorbance potential at the local scale. In fact, a productive aquifer can not only release but also absorb significant volumes of water. However, local aquifer heterogeneities may affect the performance of the installations. Clayey lenses, especially located close to the ground surface, can inhibit seepage toward the discharge points. Before the design and the construction of the installations, preliminary hydrogeological investigations at the local scale can optimize the absorbance performance. In addition, a groundwater conceptual model verifying the preferential flow paths is a value added. Monitoring using a piezometer network can shed solid information about absorbance dynamics.
Taking advantage of the self-treatment capacity of the soil, water collected by the installations may not need treatment, saving money that would otherwise be spent on WWTPs. To guarantee enhanced protection of the aquifers, collected water should come from residential areas; major roads and industrial zones have greater potential for chemical spillage or contaminants. In steady-state conditions and with an aquifer recharge of Sponge City installations at 700 mm/a, the flow discharged to urban streams comes up to 0.17 m3/s. This amount of water bypasses WWTPs, resulting in savings of 6.3 million RMB per year, assuming an average water treatment cost of 1.18 RMB per m3 [38]. From the district to the megacity scale, the economic savings are significant in the long term, especially in wet climates where aquifer recharge via Sponge City installations is remarkable. Reduced initial capital costs and decreased operational and maintenance requirements also make these installations sustainable in minor cities characterized by lower budgets. An increase in the base flow of urban streams provides numerous ecological benefits supporting aquatic ecosystems, especially during the dry seasons. Considering the regional economic inequalities of Chinese cities, the saved money can be reinvested in alternative urban sustainability projects.
Including subsoil in the Sponge City concept can decrease waterlogging and flooding risks. In fact, the total peak flow in the drainage network is reduced proportionally to the extension of the installations, with a gain of more than double if compared to above-ground installations draining to pipes and tanks. However, the right proportion between above-ground installations and those recharging the aquifers will have to be arrived at, based on local conditions. In southern China, where the flood risk is high, the improved design should increase evapotranspiration throughout the installations to lower the water level inside the installation and aquifers, avoiding saturation during wet seasons. In the proposed simulations, an incremented evapotranspiration corresponds to a lower recharge in steady-state conditions. In northern China, characterized by both water scarcity and flood risk, installations diverting water to both pipes and soils may be convenient [39]. Different types of installations can be strategically located along different sectors of the catchment, increasing water availability while decreasing waterlogging and flooding risk. In favorable hydrogeological cases, the limit of the methodology is represented by the number of installations that can be merged in the urban pattern. For the realization of these improvements, local scale absorbance maps based on hydrogeological and geomorphological studies can assist decision-makers, especially during reorganization of urban areas or the retrofitting of existing buildings.
5. Conclusions
The inclusion of recharge to urban aquifers in the implementation of the Sponge City concept will mitigate waterlogging and flooding risks more effectively than standard installations. In the simulated domain, numerical analyses suggest that urban aquifers with a hydraulic conductivity higher than 1·10−5 m/s, corresponding to average productive aquifers, can reduce the stormwater flow peak by 18% relative to conventional Sponge City features. Numerous Chinese cities and megacities could benefit from this improved practice. The Sichuan basin, the karst terrains of Southern China, and the major alluvial valleys and hilly sectors have high potential absorbance due to the relatively high hydraulic conductivity of the shallow soils. Similarly, the intensively urbanized alluvial plains of northeastern China have high potential absorbance due to the overexploitation of shallow and deep aquifers.
Pilot projects at the catchment scale, with a combination of enhanced aquifer recharge and above-ground installations, are needed in areas where enhanced aquifer recharge is feasible (e.g., LS1 zone) to demonstrate the efficacy and cost-effectiveness of this approach. Such an approach should be very attractive for minor cities of China with small budgets, as implementation of this approach will be less costly than conventional methods. The costs are lower due to less infrastructure and reduced treatment costs. The proposed procedures can help fill the gap between the rich metropolises of the coast and the poor minor cities of the internal sectors. Direct savings of about 6.3 million RMB/a thanks to the reduced costs of WWTP has been assessed in the performed analysis for a residential area of 25 km2 with a sub-tropical climate. In accordance with the variegated wealth throughout the nation, the saved budget represents an important asset that can be reinvested in other activities. Exploiting urban aquifers as natural sponges has great potential to improve the Sponge City concept, increasing the volume of controlled urban water with possible obtainment of the ambitious goals of the promulged Sponge City concept. Enhancement of the Sponge City with the suggested practices can improve the sustainability of urban areas from an economic, environmental, and architectural point of view.
Author Contributions
M.J.: Software, Investigation, Data Curation; M.L.: Writing—original draft, Conceptualization, Methodology, Visualization; Y.T. Software, Investigation, Methodology; S.V.: Conceptualization, Methodology, C.A.: Writing—review & editing, Validation; J.L.: Writing—review & editing; C.Z.: Resources, Funding Acquisition, Supervision. All authors have read and agreed to the published version of the manuscript.
Funding
The study was supported by the National Natural Science Foundation of China (Grant No. 41861124003). Additional support was provided by the National Key R&D Program of China (Grant No.2018YFE0206200), and the High-level Special Funding of the Southern University of Science and Technology (Grant Nos. G02296302, G02296402).
Institutional Review Board Statement
Not applicable.
Informed Consent Statement
Not applicable.
Data Availability Statement
The data presented in this study are available on request from the corresponding author.
Acknowledgments
Authors are grateful to three anonymous reviewers for the constructive comments.
Conflicts of Interest
The authors declare no conflict of interest.
References
- Dewan, A.M. Floods in Megacities: Geospatial Techniques in Assessing Hazard, Risk and Vulnerability; Springer: Dordecht, The Netherlands, 2013; p. 199. [Google Scholar] [CrossRef]
- Barrett, M. Characteristics of urban groundwater. In Urban Groundwater Pollution; Lerner, D., Ed.; CRC Press: Boca Raton, FL, USA, 2003; pp. 29–50. [Google Scholar]
- Liu, J.; Zang, C.; Tian, S.; Liu, J.; Yang, H.; Jia, S.; You, L.; Liu, B.; Zhang, M. Water conservancy projects in China: Achievements, challenges and way forward. Glob. Environ. Chang. 2013, 23, 633–643. [Google Scholar] [CrossRef] [Green Version]
- Polade, S.D.; Pierce, D.W.; Cayan, D.R.; Gershunov, A.; Dettinger, M.D. The key role of dry days in changing regional climate and precipitation regimes. Sci. Rep. 2014, 4, 1–8. [Google Scholar] [CrossRef] [PubMed] [Green Version]
- Zheng, C.; Gorelick, S. Global change and the groundwater management challenge. Water Resour. Res. 2015, 51, 1–21. [Google Scholar] [CrossRef]
- Huang, Y.; Tian, Z.; Ke, Q.; Liu, J.; Irannezhad, M.; Fan, D.; Hou, M.; Sun, L. Nature-based solutions for urban pluvial flood risk management. Wiley Interdiscip. Rev. Water 2020, 7, e1421. [Google Scholar] [CrossRef]
- Fletcher, T.; Shuster, W.; Hunt, W.; Ashley, R.; Butler, D.; Arthur, S.; Throwsdale, S.; Barraud, S.; Semadeni-Davies, A.; Bertrand-Krajewski, J.; et al. SUSD, LID, BMPs, WSUD and more—The evolution and application of terminology surrounding urban drainage. Urban Water J. 2015, 12, 525–542. [Google Scholar] [CrossRef]
- MOHURD—Ministry of Housing and Urban Rural Development. Technical Guidelines of the Sponge City Development—Low Impact Development Systems for Storm Water; MOHURD: Beijing, China, 2014; 88p. Available online: http://www.mohurd.gov.cn/wjfb/201411/W020141102041225.pdf (accessed on 13 January 2022).
- Nguyen, T.T.; Ngo, H.H.; Guo, W.; Wang, X.; Ren, N.; Li, G.; Ding, J.; Liang, H. Implementation of a specific urban water management-Sponge City. Sci. Total Environ. 2019, 652, 147–162. [Google Scholar] [CrossRef] [PubMed]
- Liu, J.; Zhao, D. Three-dimensional water scarcity assessment by considering water quantity, water quality, and environmental flow requirements: Review and prospect. Chin. Sci. Bull. 2020, 65, 4251–4261. [Google Scholar] [CrossRef]
- Zheng, C.; Liu, J.; Cao, G.; Kendy, E.; Wang, H.; Jia, Y. Can China Cope with Its Water Crisis?—Perspectives from the North China Plain. Groundwater 2020, 48, 350–354. [Google Scholar] [CrossRef]
- Zhang, C.; Duan, Q.; Yeh, P.J.F.; Pan, Y.; Gong, H.; Moradkhani, H.; Gong, W.; Lei, X.; Liao, W.; Xu, W.; et al. Sub-regional groundwater storage recovery in North China Plain after the South-to-North water diversion project. J. Hydrol. 2021, 597, 126156. [Google Scholar] [CrossRef]
- Kong, F.; Sun, S.; Lei, T. Understanding China’s urban rainstorm waterlogging and its potential governance. Water 2021, 13, 891. [Google Scholar] [CrossRef]
- Wu, M.; Wu, Z.; Ge, W.; Wang, H.; Shen, Y.; Jiang, M. Identification of sensitivity indicators of urban rainstorm flood disasters: A case study in China. J. Hydrol. 2021, 599, 126393. [Google Scholar] [CrossRef]
- Zheng, Z.; Gao, J.; Wang, Z.; Yang, X.; Luo, X.; Jacquet, T.; Fu, G. Urban flooding in China: Main causes and policy recommendations. Hydrol. Processes 2016, 30, 1149–1152. [Google Scholar] [CrossRef]
- Chen, H.; Jia, B.; Lau, S.S.Y. Sustainable urban form for Chinese compact cities: Challenges of a rapid urbanized economy. Habitat Int. 2008, 32, 28–40. [Google Scholar] [CrossRef]
- MOHURD—Ministry of Housing and Urban Rural Development. Urban Residential Area Planning and Design Standards; MOHURD: Beijing, China, 2018; 43p. Available online: http://www.mohurd.gov.cn/wjfb/201811/t20181130_238590.html (accessed on 13 January 2022).
- MOHURD—Ministry of Housing and Urban Rural Development. Assessments Standard for Sponge City Construction Effect; MOHURD: Beijing, China, 2018; 48p. Available online: http://swj.sz.gov.cn/attachment/0/811/811433/9040752.pdf (accessed on 13 January 2022).
- Wright, T.J.; Liu, Y.; Carroll, N.J.; Ahiablame, L.M.; Engle, B.A. Retrofitting LID practices into existing neighborhoods: Is it worth it? Environ. Manag. 2016, 57, 856–867. [Google Scholar] [CrossRef] [PubMed] [Green Version]
- Zhang, K.; Chui, T.F.M. Linking hydrological and bioecological benefits of green infrastructures across spatial scales—A literature review. Sci. Total Environ. 2020, 646, 1219–1231. [Google Scholar] [CrossRef] [PubMed]
- Zhang, K.; Chui, T.F.M. Assessing the impact of spatial allocation of bioretention cells on shallow groundwater—An integrated surface-subsurface catchment-scale analysis with SWMM-MODFLOW. J. Hydrol. 2020, 586, 124910. [Google Scholar] [CrossRef]
- Lerner, D.N. Identifying and quantifying urban recharge: A review. Hydrogeol. J. 2002, 10, 143–152. [Google Scholar] [CrossRef]
- Lancia, M.; Zheng, C.; He, X.; Lerner, D.N.; Andrews, C.; Tian, Y. Hydrogeological constraints and opportunities for “Sponge City” developments: Shenzhen, southern China. J. Hydrol. Reg. Stud. 2020, 28, 100679. [Google Scholar] [CrossRef]
- Jin, M.; Lancia, M.; Tian, Y.; Viaroli, S.; Andrews, C.; Liu, J.; Zheng, C. Hydrogeological criteria to improve the Sponge City of China. Front. Environ. Sci. 2021, 9, 700463. [Google Scholar] [CrossRef]
- Niswonger, R.G.; Panday, S.; Ibaraki, M. MODFLOW-NWT, A Newton formulation for MODFLOW-2005. US Geol. Surv. Tech. Methods 2011, 6, 44. [Google Scholar]
- Rossman, L.A.; Huber, W.C. Storm Water Management Model Reference Manual, Volume III—Water Quality; EPA/600/R-16/093; U.S. Environmental Protection Agency: Cincinnati, OH, USA, 2016.
- Boroomandnia, A.; Bozorh-Haddad, O.; Bahrami, M.; Goharian, E.; Singh, P.V.; Loaiciga, H.A. Optimizing urban stormwater control strategies and assessing aquifer recharge through drywells in an urban watershed. Hydrogeol. J. 2021, 29, 1379–1398. [Google Scholar] [CrossRef]
- Melesse, A.M.; Abtew, W. Landscape Dynamics, Soils and Hydrological Processes in Varied Climates; Springer: Cham, Switzerland, 2016; 893p. [Google Scholar] [CrossRef]
- CGS—Chinese Geological Survey. Hydrogeological Map of People’s Republic of China, Scale 1:5,000,000. 1 Sheet 1979. Available online: http://en.cgs.gov.cn/ (accessed on 13 January 2022).
- CGS—Chinese Geological Survey. Repository of Geological and Hydrogeological Maps at Various Scale. 2021. Available online: https://geocloud.cgs.gov.cn/#/home (accessed on 13 January 2022).
- Chui, T.F.M.; Liu, X.; Zhan, W. Assessing cost-effectiveness of specific LID practice designs in response to large storm events. J. Hydrol. 2016, 533, 353–364. [Google Scholar] [CrossRef]
- Zheng, Y.; Chen, S.; Qin, H.; Jiao, J. Modeling the Spatial and Seasonal Variations of Groundwater Head in an Urbanized Area under Low Impact Development. Water 2018, 10, 803. [Google Scholar] [CrossRef] [Green Version]
- Randall, M.; Sun, F.; Zhang, Y.Y.; Bergen Jensen, M. Evaluating Sponge City volume capture ratio at the catchment scale using SWMM. J. Environ. Manag. 2019, 246, 745–757. [Google Scholar] [CrossRef] [PubMed]
- Liao, X.; Zheng, J.; Huang, C.; Huang, G. Approach for evaluating LID Measure layout scenarios based on random forest: Case of Guangzhou—China. Water 2018, 10, 894. [Google Scholar] [CrossRef] [Green Version]
- Charbonneau, C.; Bradford, A. Wetland modelling in PCSWMM: Exploring options to define wetland features and incorporate groundwater exchanges. J. Water Manag. Model. 2016, 25, C411. [Google Scholar] [CrossRef]
- Wu, C.; Xu, Q.; Ma, Y.; Zhang, X. Palaeochannels on the North China Plain: Palaeoriver geomorphology. Geomorphology 1996, 18, 37–45. [Google Scholar]
- Daoxian, Y. Karst of China; Geological Publishing House: Beijing, China, 1991; 224p. [Google Scholar]
- Zhang, R. Study on cost structure and Change trend of sewage treatment—Based on data analysis of Shanghai and Shenzhen A-share sewage treatment listed companies. Price Theory Pract. 2021, 113, 27–30. [Google Scholar] [CrossRef]
- Liu, Q.; Cui, W.; Tian, Z.; Tang, Y.; Tillotson, M.; Liu, J. Stormwater management modeling in “Sponge City” construction: Current state and future directions. Front. Environ. Sci. 2021, 9, 816093. [Google Scholar] [CrossRef]
Figure 1.
Generalized waterlogging risk in China (a). Key to the legend: very high (VH), high (H), average (A), low (L). Percentage of the urban runoff aimed to be controlled by the Sponge City plan (b). Key to the legend: 85% to 90% (I), 80% to 85% (II); 75% to 85% (III); 70% to 85% (IV); 60% to 85% (V). Blue stars indicate the pilot sites of the Sponge City Project. Redrawn from MOHURD 2014.

Figure 2.
Sponge City installations collect and reuse the urban runoff (a); Sponge City installations recharge the aquifer, increasing the water table elevation favoring seepage toward urban streams (b); conceptual models showing the relationship between the geomorphological zones and potential absorbance according to regional hydrogeological characteristics (c).

Figure 3.
MODFLOW model setup of the domain (a) and detail (b). Key to the legend: impervious urban infrastructures (1); Sponge City installations recharging the aquifer (2); urban aquifer (3); flow recharging the aquifers, 30% of the top cells (4); urban drain, h = 0 m a.s.l. (5). SWMM setup throughout the entire domain (c) and detail of the real estate compound (d). It is assumed that each compound is equally covered by green roofs, permeable pavements, rain gardens, sunken green spaces, and wetlands, covering 30% of the domain.

Figure 4.
MODFLOW groundwater model solution for Soil 3 (a); hydraulic head has a radial geometry flowing from the domain center to the model edges; hydraulic head distribution across the domain along the east–west direction for the five considered soils in steady-state conditions (b); hydraulic head measured at the domain center (yellow star) during and after the storm (c); groundwater flow discharging to the domain edge during and after the storm (d); SWMM solutions with total runoff for impervious surface (Scenario 1), Sponge City installations flowing to pipes and tanks, (Scenario 2) and installations recharging the aquifer (Scenario 3) (e).

Figure 5.
Absorbance potential map of China based on hydrogeological and geomorphological criteria. Key to the legend: piedmonts, desertic endorheic basins, alluvial fans, hilly terrains, incised alluvial terraces (LS1); main alluvial plains and valleys, seasonally flooded karst depression (LS2); deltas and lacustrine basins (LS3); karst bedrock (B1); outcrop bedrocks, weathered blankets, and minor alluvial valleys (B2); permafrost and frozen soils (B3). Black dots indicate top 100 most populous cities of China.


Table 1.
Hydraulic conductivity and specific yield of the materials used for MODFLOW models. Simulations are repeated five times, varying the soil properties of the underlying urban aquifer.
Table 1.
Hydraulic conductivity and specific yield of the materials used for MODFLOW models. Simulations are repeated five times, varying the soil properties of the underlying urban aquifer.
| Material | Type | Layer | Hydraulic Conductivity [m/s] | Specific Yield [%] |
|---|---|---|---|---|
| Sand and gravel box | Sponge City features | 1 | 1·10−3 | 0.33 |
| Soil 1 | Urban Aquifer | 2 | 5·10−4 | 0.31 |
| Soil 2 | Urban Aquifer | 2 | 1·10−4 | 0.27 |
| Soil 3 | Urban Aquifer | 2 | 5·10−5 | 0.23 |
| Soil 4 | Urban Aquifer | 2 | 1·10−5 | 0.21 |
| Soil 5 | Urban Aquifer | 2 | 5·10−6 | 0.19 |
Table 2.
SMWW parameters used for the simulations of Scenario 2. Data from [32] a, [33] b, [34] c, [35] d.
| Layer | Parameter | Green Roof a | Permeable Pavement a | Rain Garden b | Sunken Green Space c | Wetland d |
|---|---|---|---|---|---|---|
| Surface | Berm Height (mm) | 75 | 0 | 300 | 200 | 400 |
| Vegetation Volume Fraction | 0.2 | 0 | 0.2 | 0.2 | 0.3 | |
| Surface Roughness | 0.24 | 0.014 | 0.1 | 0.15 | 0.24 | |
| Surface Slope (%) | 1 | 1 | 2 | 1 | 1 | |
| Pavement | Thickness (mm) | - | 100 | - | - | - |
| Void Ratio | - | 0.2 | - | - | - | |
| Permeability (mm/h) | - | 360 | - | - | - | |
| Soil | Thickness (mm) | 150 | - | 500 | 500 | 500 |
| Porosity | 0.45 | - | 0.4 | 0.4 | 0.58 | |
| Field Capacity | 0.2 | - | 0.2 | 0.2 | 0.34 | |
| Wilting Point | 0.1 | - | 0.1 | 0.1 | 0.17 | |
| Conductivity (mm/h) | 120 | - | 72 | 3.6 | 7.62 | |
| Conductivity Slope | 5 | - | 10 | 10 | 8 | |
| Suction Head | 50 | - | 50 | 90 | 90 | |
| Storage | Thickness (mm) | 75 | 150 | - | 200 | 250 |
| Void Ratio | 0.5 | 0.5 | - | 0.5 | 0.5 |
Publisher’s Note: MDPI stays neutral with regard to jurisdictional claims in published maps and institutional affiliations. |
© 2022 by the authors. Licensee MDPI, Basel, Switzerland. This article is an open access article distributed under the terms and conditions of the Creative Commons Attribution (CC BY) license (https://creativecommons.org/licenses/by/4.0/).
Share and Cite
MDPI and ACS Style
Jin, M.; Lancia, M.; Tian, Y.; Viaroli, S.; Andrews, C.; Liu, J.; Zheng, C. The Role of Aquifers in Sustaining the Sponge City Concept in Chinese High-Density Housing. Water 2022, 14, 929. https://doi.org/10.3390/w14060929
AMA Style
Jin M, Lancia M, Tian Y, Viaroli S, Andrews C, Liu J, Zheng C. The Role of Aquifers in Sustaining the Sponge City Concept in Chinese High-Density Housing. Water. 2022; 14(6):929. https://doi.org/10.3390/w14060929
Chicago/Turabian StyleJin, Mengxiao, Michele Lancia, Yong Tian, Stefano Viaroli, Charles Andrews, Junguo Liu, and Chunmiao Zheng. 2022. "The Role of Aquifers in Sustaining the Sponge City Concept in Chinese High-Density Housing" Water 14, no. 6: 929. https://doi.org/10.3390/w14060929
Note that from the first issue of 2016, this journal uses article numbers instead of page numbers. See further details here.