Article

Combined Modeling of Multivariate Analysis and Geostatistics in Assessing Groundwater Irrigation Sustenance in the Middle Cheliff Plain (North Africa)

by
Abdelhamid Bradai
1,
Ibrahim Yahiaoui
2,
Abdelkader Douaoui
3,
Mohamed Amine Abdennour
4,
Aminjon Gulakhmadov
5,6,7 and
Xi Chen
5,6,*
1
Faculty of Natural Sciences and Live, Water and Environment Laboratory, University Hassiba Benbouali of Chlef, P.O. Box 78C, Ouled Fares, Chlef 02180, Algeria
2
Laboratory of Crop Production and Sustainable Valorization of Natural Resources, University Djilali Bounaama of Khemis Miliana, Khemis Miliana 44225, Algeria
3
Laboratory of Management and Valorization of Agricultural and Aquatic Ecosystems, Institute of Sciences, University Center Morsli Abdellah of Tipaza, Oued Merzoug, Tipaza 42000, Algeria
4
GeoEnvironmental Research Group, University of Extremadura, 10071 Caceres, Spain
5
Research Center for Ecology and Environment of Central Asia, Xinjiang Institute of Ecology and Geography, Chinese Academy of Sciences, Urumqi 830011, China
6
State Key Laboratory of Desert and Oasis Ecology, Xinjiang Institute of Ecology and Geography, Chinese Academy of Sciences, Urumqi 830011, China
7
Institute of Water Problems, Hydropower and Ecology of the National Academy of Sciences of Tajikistan, Dushanbe 734042, Tajikistan
*
Author to whom correspondence should be addressed.
Water 2022, 14(6), 924; https://doi.org/10.3390/w14060924
Submission received: 28 December 2021 / Revised: 10 March 2022 / Accepted: 11 March 2022 / Published: 16 March 2022
(This article belongs to the Special Issue Methods and Tools for Assessment of Groundwater)

Abstract

:
The assessment of groundwater irrigation using robust tools is essential for the sustenance of the agro-environment in arid and semi-arid regions. This study presents a reliable method consisting of a combination of multivariate analysis and geostatistical modeling to assess groundwater irrigation resources in the Western Middle Cheliff (Algeria). For this goal, mean data from 87 wells collected during April to July 2017 were used. The hierarchical cluster analysis (HCA) using the Q-mode approach revealed three distinct water types, with mineralization increasing from cluster 1 to cluster 3. The Principal Component Analysis (PCA) utilizing the Varimax method approach allowed the extraction of three main components: the first and second (PC1, PC2), revealing that the geogenic process, have influenced the hydrogeochemical composition of groundwater. The pollution induced by agriculture activities has been related to PC3. Based on the combination of multivariate analysis and geostatistical modeling, the distribution maps were created by interpolating the factor distribution values acquired in the study region using the ordinary kriging (OK) interpolation method. The findings revealed that both natural processes and man-made activities have a substantial impact on the quality of groundwater irrigation. Cluster mapping, another often used combining approach, has shown its effectiveness in assisting groundwater resource management.

1. Introduction

During the last few decades, groundwater irrigation has gained a drastic amount of interest worldwide, especially in arid and semi-arid areas. On a global scale, almost 43% of the irrigated areas depend on groundwater resources [1]. In an agro-economy, the use of groundwater irrigation is moreover increasing in South Asia, the annual usage is 262 km3 yr−1 (km3 = 1 billion m3), while it is (87 km3) in the Middle East, North Africa, and East Asia (57 km3). In terms of land cover, India (39 million hectares) has pioneered the use of groundwater in large areas, ahead of China (19 million hectares) and the United States (17 million hectares), which is in third place. In Algeria, the groundwater usage is 7.1 km3 yr−1 and covered 88% of irrigated lands (883,004 ha) in the first decade of the twenty-first century [2]. Meanwhile, due to over-exploitation and the recent hardness of the climate, the groundwater quality becomes vulnerable to deterioration in these regions [3,4]. In addition, irrigation agriculture has proven to give better yield outcomes than rainfall agriculture within different environments. As a result, due to the highly competitive demand, efforts are needed to manage agricultural water as efficiently as possible [1,2].
Various pieces of research have assessed the sustainability of irrigated groundwater. In semi-arid regions, the geochemical properties on which it is based are controlled by several factors: anthropogenic activity, general geology, chemical weathering of several rocks’ varieties of water recharge quality, water-rock interactions, and ion exchange [5,6]. Therefore, there is a growing interest on the effect of geochemical processes on groundwater quality. However, considering the hydrogeochemical parameters, it is necessary to determine the suitability of groundwater for human needs and irrigation purposes [7]. Interestingly, groundwater quality related-studies in Algeria are now focusing on the irrigation prospects in various parts of the country [8,9,10,11,12,13,14,15,16,17,18,19].
The geochemistry of groundwater is often determined by its interaction with the mineral components of the flowing aquifer. Subsequently, many studies developed methods to characterize and assess the causes of the geochemical changes in groundwater. These methods have adopted approaches from multivariate statistical analysis and geostatistical techniques, or their combination [20]. Thus, the hierarchical cluster analysis (HCA) and principal component analysis (PCA) are very effective multivariate statistical techniques used to solve the issues coming from hydrological factors, mainly, the geochemical parameters [13,19,20,21,22,23,24], and geochemical composition controls [25,26,27] coming from the anthropogenic action [7,28,29,30]. The HCA, a multidimensional statistical technique, is a common tool in the classification and development of geochemical models based on observation data taken from factor values [31].
Recently, the use of Geographic Information Systems (GIS) has widened the horizon in determining the spatial distribution of groundwater irrigation quality and its mapping assessment using geostatistical techniques [13,19,32,33,34,35,36]. In Geostatistics, the kriging interpolation method allows one to predict data at non-sampled points and to map their spatial variability. Hence, Ordinary kriging (OK) is a very useful method in environmental studies, especially in groundwater quality related-studies [37,38].
The evaluation of groundwater irrigation quality is based on the physicochemical parameters compared to the international established limits [39] or some calculated indexes, i.e., sodium adsorption ratio (SAR). However, a successful management of groundwater irrigation requires the intervention of geostatistical tools using the kriging methods to gain better knowledge on the spatial distribution of the aquifer’s parameters. Nowadays, the available literature contains practical examples on the combination of kriging and factor analysis methods [7,40,41,42,43,44]. Moreover, the OK method is often utilized to interpolate factors representing the weights of specific processes that influence water chemistry. The study of these derived variables will reduce our multivariate workflow space and help to determine their spatial distribution in the submerged layer resulting from the calculation of variograms [7,40,41,42].
The Middle-Cheliff plain is one of the most important agricultural areas in Algeria, and indeed in North Africa, where there is a reliance on and very high demand for irrigation water. The intense agricultural activity comes from an imbalance between availability and the demand for groundwater. This study is based on an integrated investigation aiming to assess the groundwater quality in a semi-arid environment. The objectives of the study are as follows: (i) to identify the key hydrochemical features and major ion sources using a range of statistical analyses and hydrochemical techniques; and (ii) to identify the major ion sources using a variety of statistical analyses and hydrochemical methods; (iii) to assess the sustainability of groundwater for irrigation through the combination of multivariate analysis and geostatistical modeling.

2. Materials and Methods
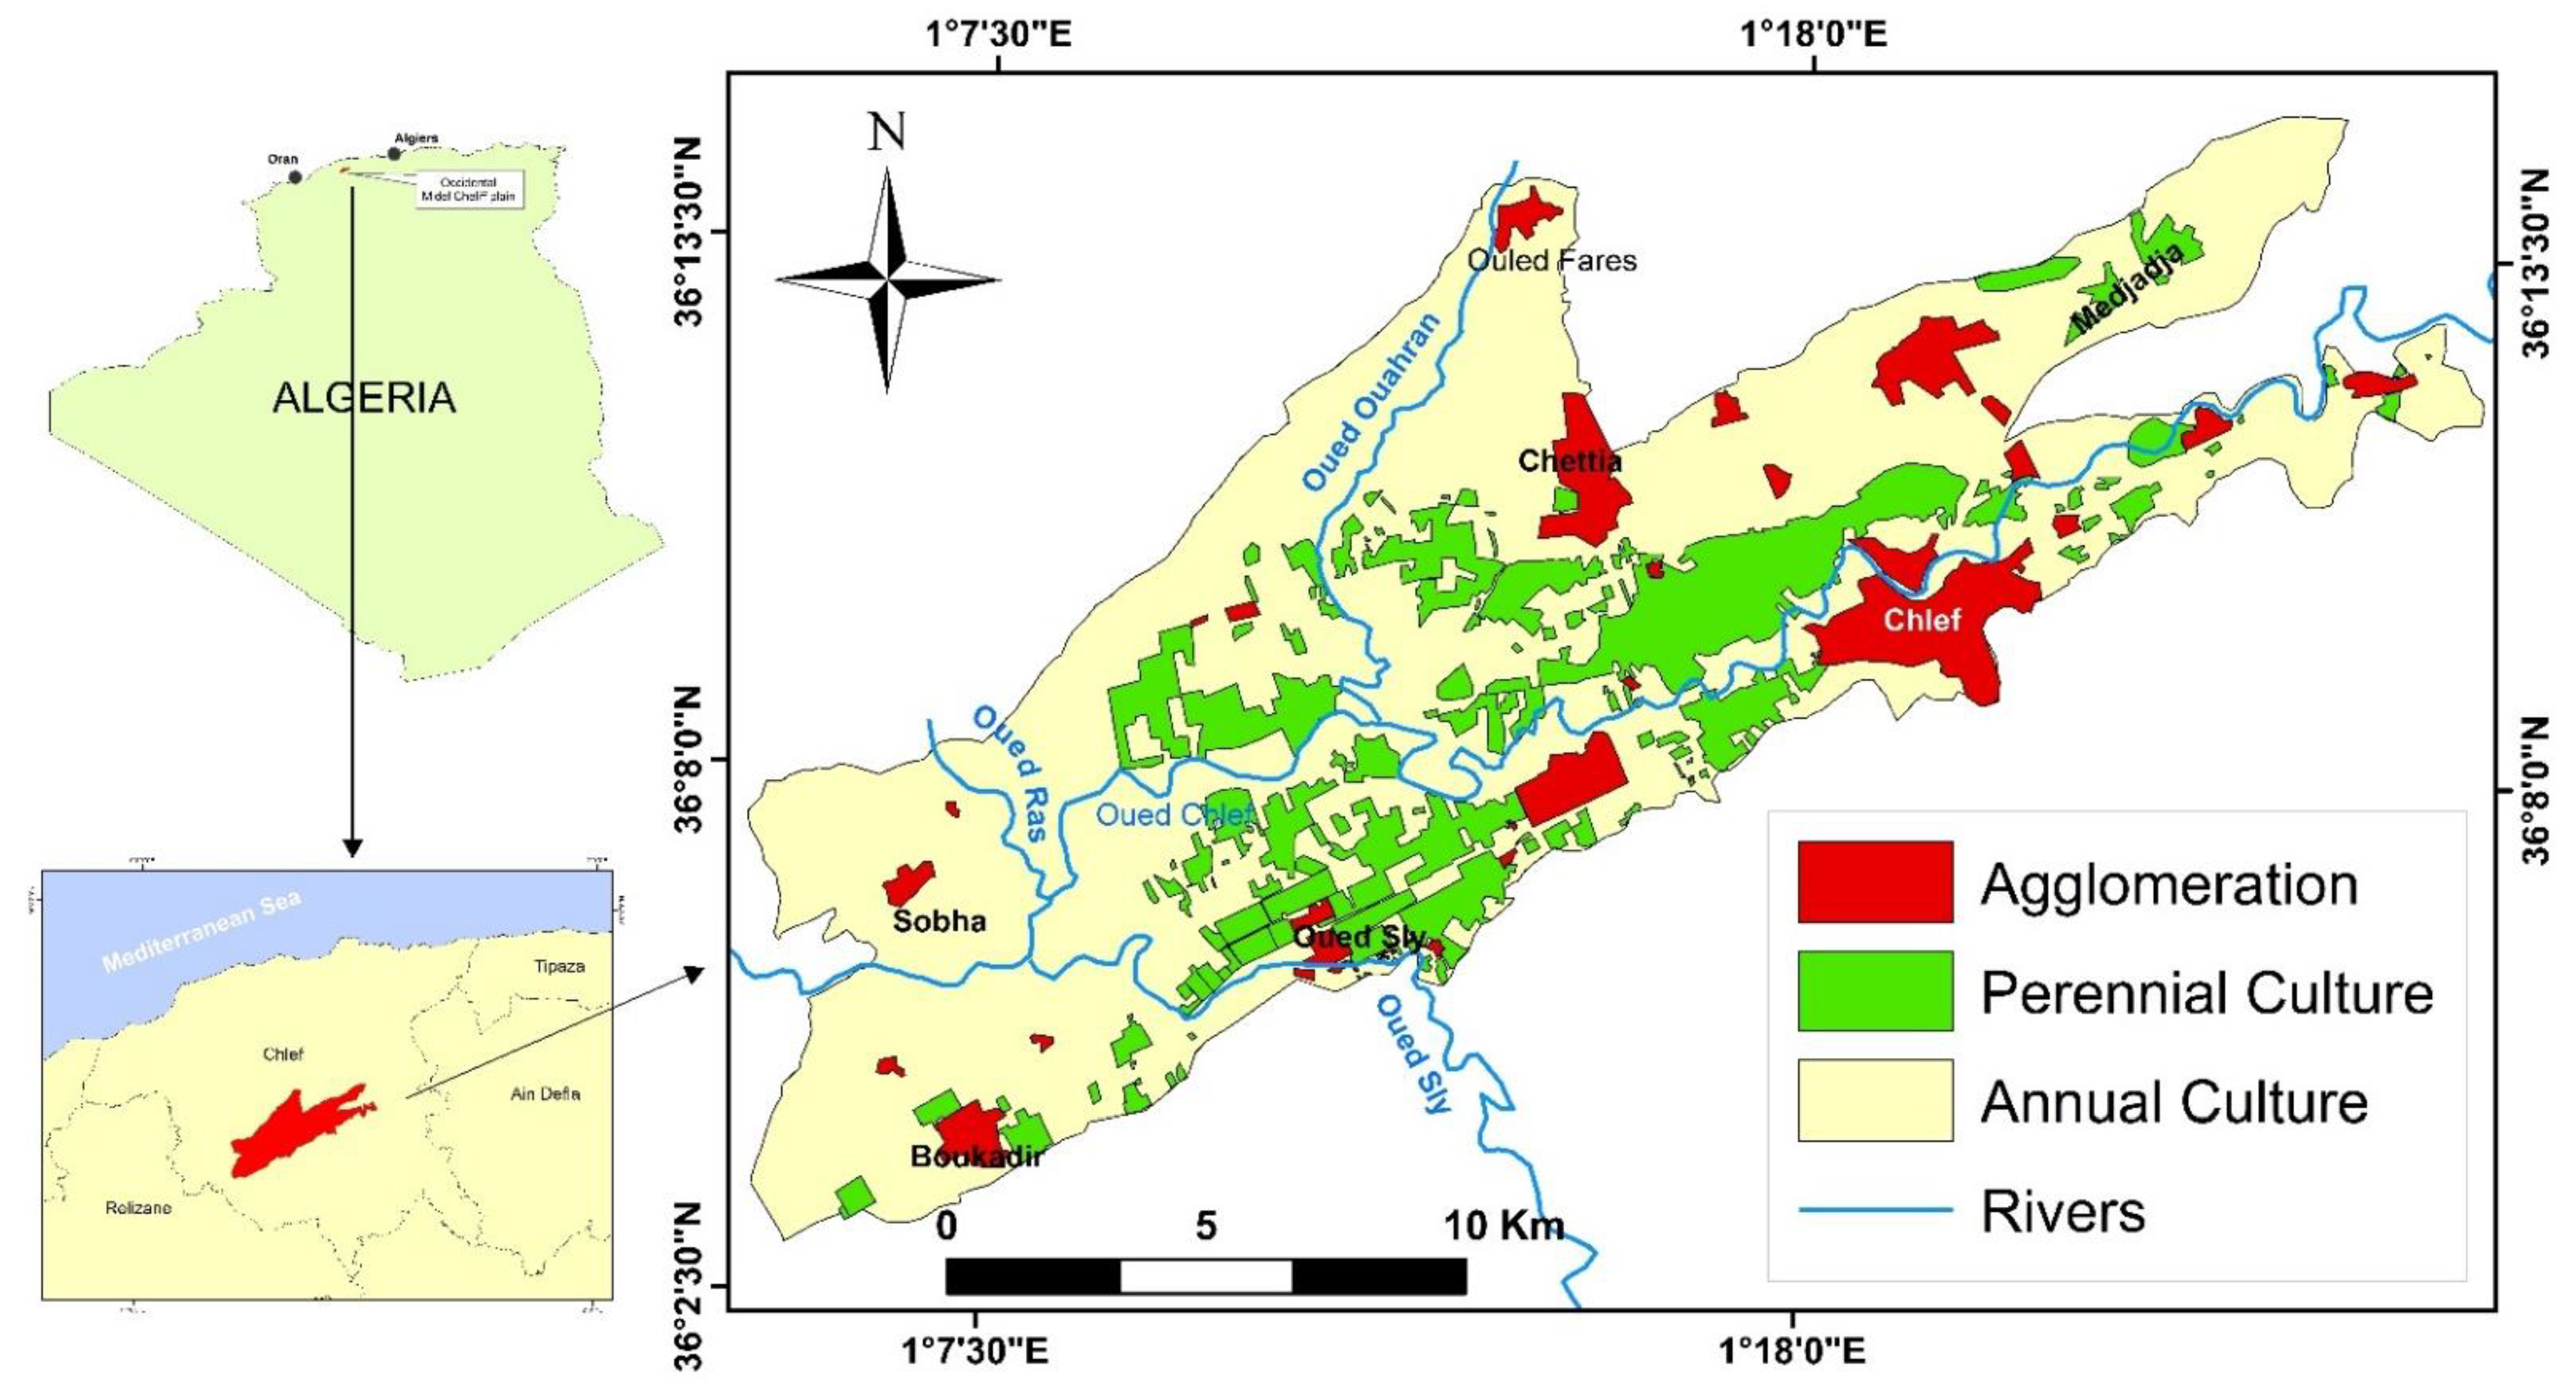
2.1. Study Area

Towards the north-west of Algeria, the Western Middle-Cheliff Plain (WMCP) is located 200 km from the capital Algiers and 30 km from the Mediterranean Sea (Figure 1). The plain is surrounded by the Medjaja Mountains to the north, the Ourasenis Massif to the south, the Beni Rached Massif to the east, and the Lower Cheliff Plain to the west. It is located between 36°3′ and 36°15′ N and 01°4′ and 01°27′ E. It has a semi-arid climate with an average annual temperature of 19.4 °C, the summer temperatures are particularly high, reaching 29 °C in July. In winters, the temperature decreases significantly and it is about 10 °C in January (1980–2018). The study site receives an average of 320 mm from annual precipitation (Chlef City station).
The WMCP is an agricultural area, covering 27,000 ha, of 10,000 ha (37.4%) is reconquered for actual irrigation [45]. The plain is dominated by tree cropping (38.61%), especially orange trees; it is the most important irrigated cropping surface and it occupies the central peripheral part of the right bank of Oued Chlef. Vegetable cropping ranks in second place (34.56%) near the north borders (ABIADH-MEDJADJA, OULED-FARES, SOBHA, OUED-SLY, and OUM-DROU). Potatoes are the main crop, covering about 60% of the region. Cereals, with 26.56%, concentrated in the foothills, dominated by 90% of wheat and 10% of barley [45,46].
Surface water from the dams of Oued Fodda and Sidi Yakoub was historically the main source of water for irrigation systems in the investigated region. Nonetheless, long-term drought episodes have had an impact on irrigation canals. This led to the deterioration of the watering network. Thus, this was behind the exhaustion of the groundwater resource, and, more than before, it was necessary that this resource was reasonably managed. Given the importance of groundwater in irrigation practices [47,48], farmers from the study area have built well canals from groundwater to supply the cropping systems with new irrigation volumes. Therefore, groundwater resources became the main supply for irrigation in the studied plain starting from the early 2000’s [43].

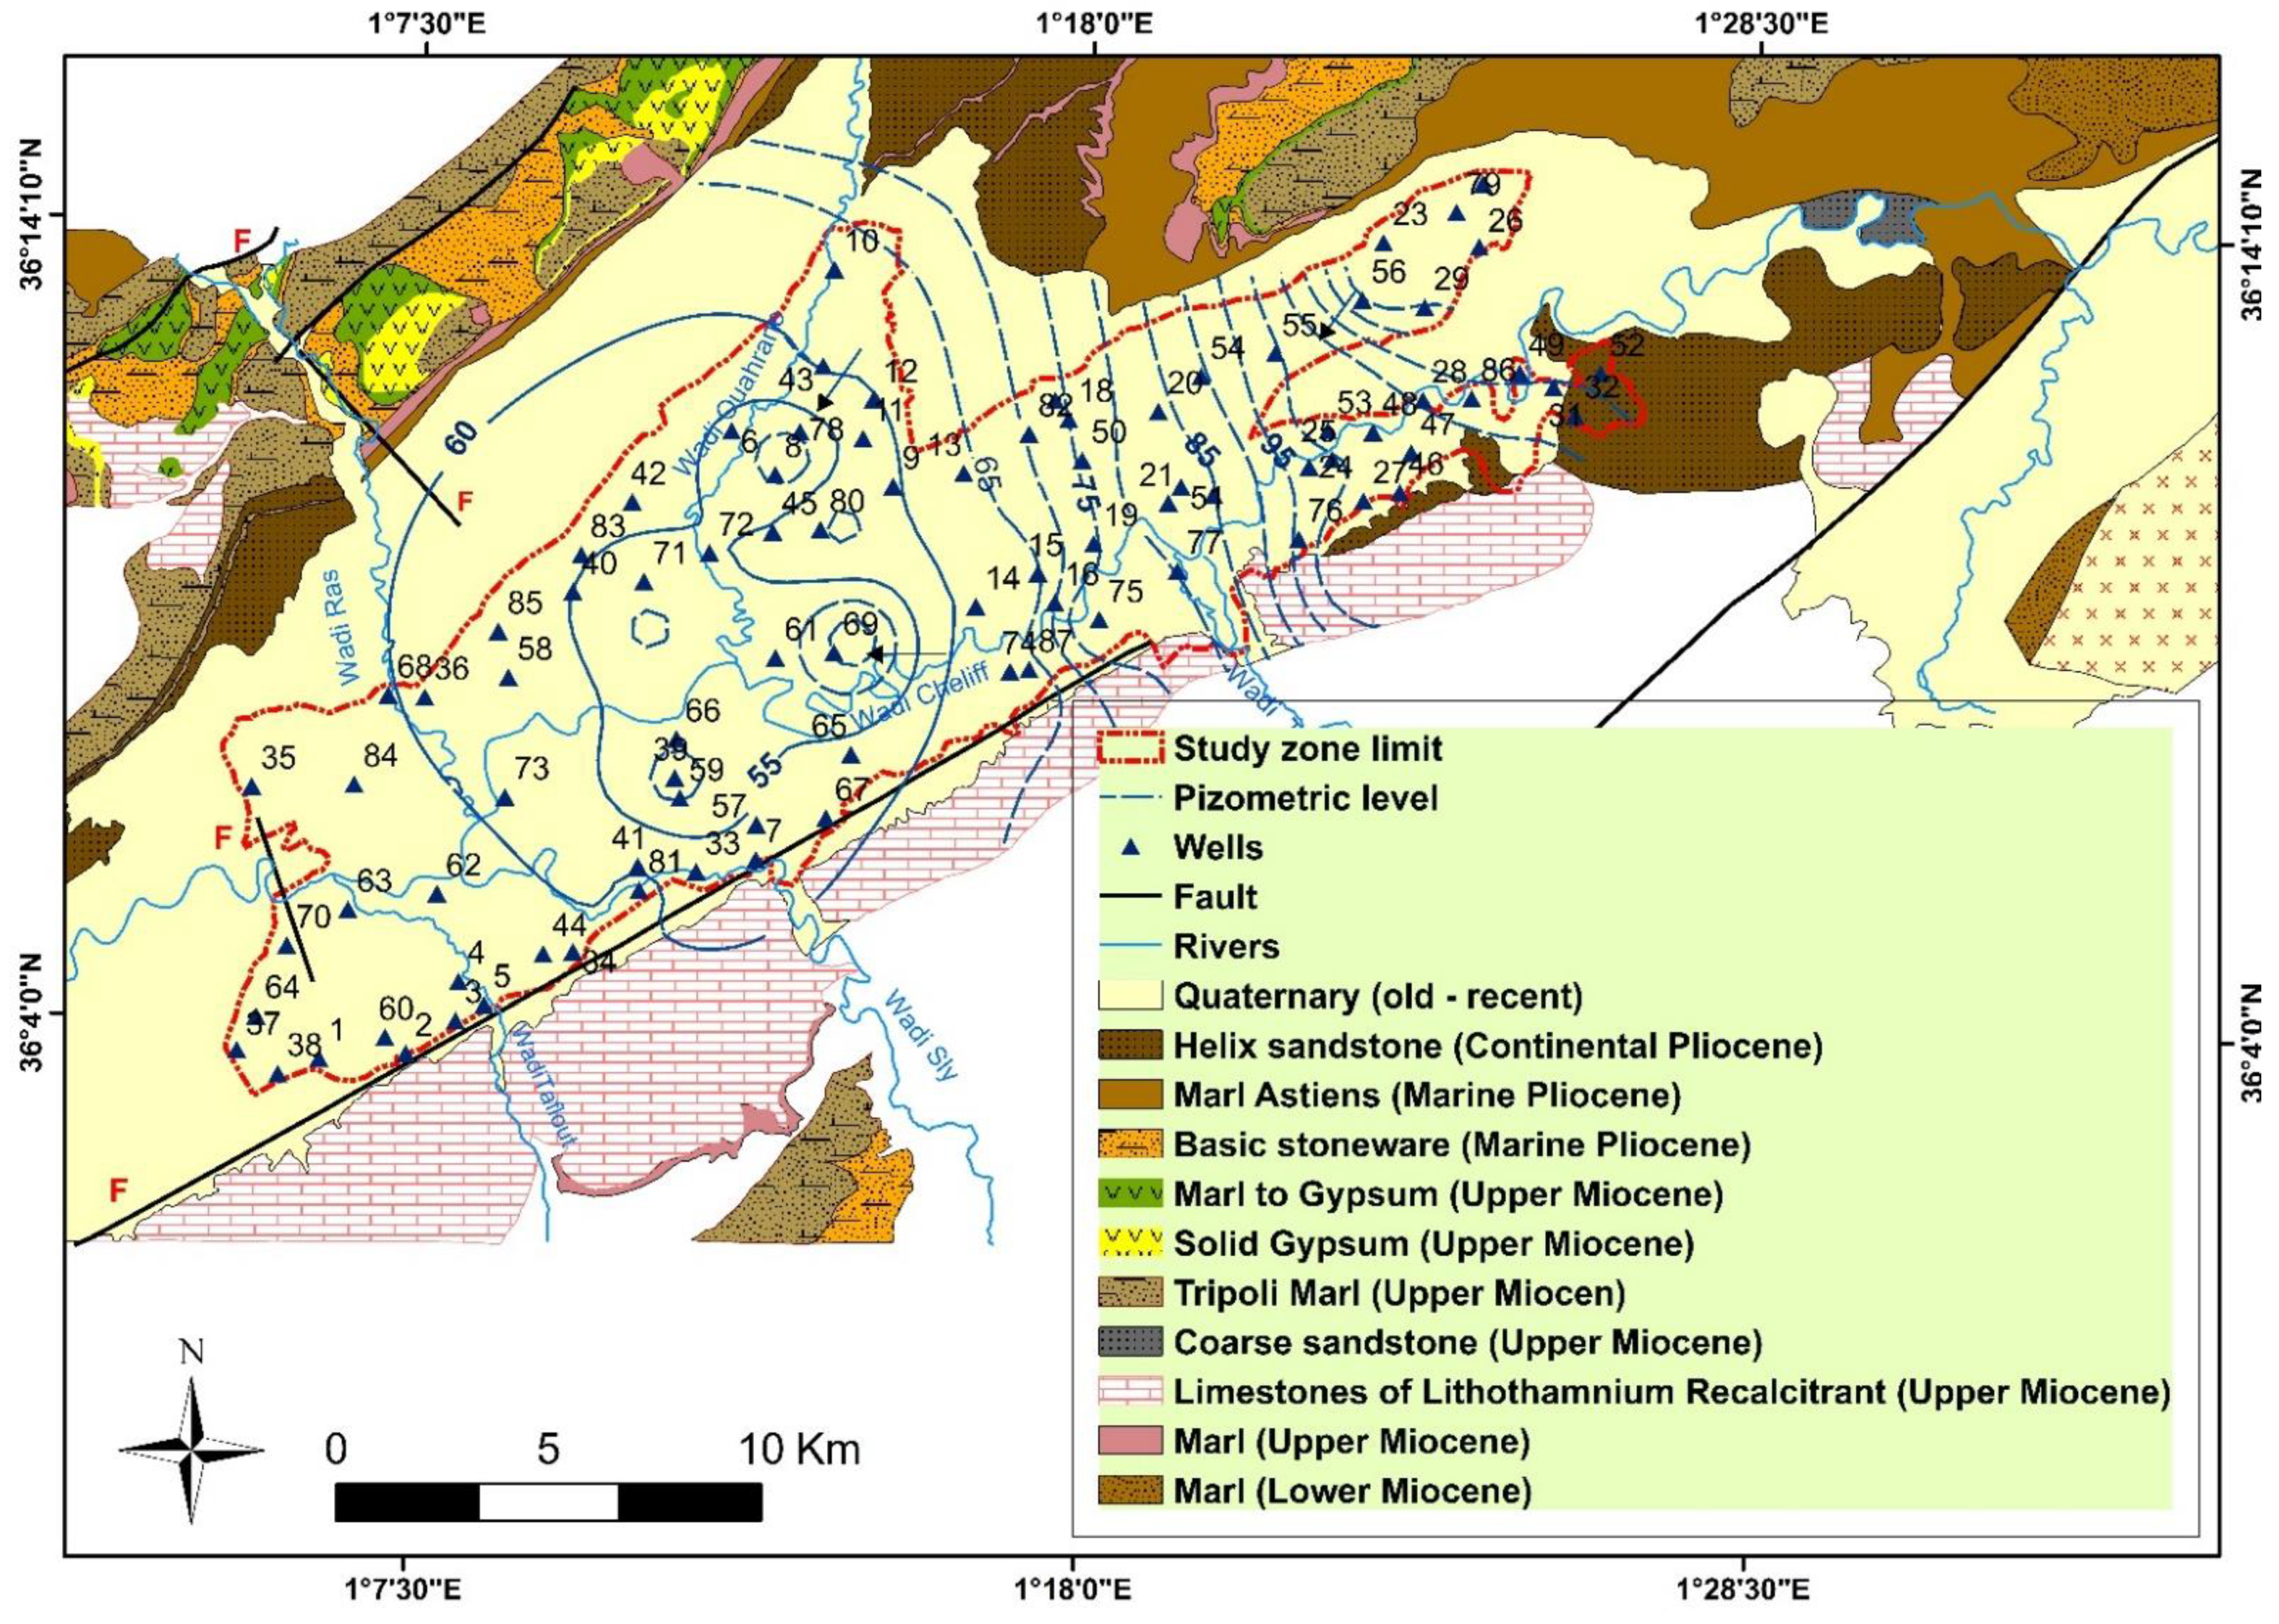
2.2. Geological and Hydrogeological Contexts

The middle Cheliff watershed in Algeria corresponds to a subsided intramountainous furrow in the Tellian Atlas. It lies between the Dahra Massif in the north and the strongholds of the Ouarsenis in the south [49,50,51]. According to lithostratigraphic information [49,50], the Middle-Cheliff depression appeared as a whole during the Mio-Plio-Quaternary formation age. The Cheliff wadi, which enters the plain of Oum Drou (Pontéba) and exits at the Boukadir threshold, runs through them from east to west (Charon). These hydraulic thresholds correspond to the upwelling of the impermeable clay-marl substratum in the crossing, which effectively excludes any underground flow. The Middle-Cheliff plains’ intra-mountainous furrow was filled by Neogene deposits containing Quaternary, Pliocene, and Miocene sediments [49].
The Quaternary deposits are the starting point for the Neogene formations of marine origin, which can reach thicknesses of 3000 m [49]. They are most common in the plains, where they are composed of coarse alluvium (ancient Quaternary) and silt (late Quaternary) placed on upper Pliocene sandstone and limestone elements. The Lower Pliocene (Marine Pliocene) begins with a transgression on the Late Miocene gypsum series. Furthermore, it concludes with the Astian regression (Figure 2).
Three aquifers with varying hydrogeological potential exist in the region. The Upper Miocene limestone outcrops at the valley’s southern boundary and lies beneath the alluvium; the Pliocene sandstone, which is practically buried by the Quaternary formations; and the Pleistocene–Quaternary alluvial deposits, which constitute the valley’s embankment. Clays and marls coexist with sand, gravel, and conglomerate strata in these deposits. This last aquifer, which is the subject of our investigation, has an annual water withdrawal of around 15.5 hm3 [52].
The piezometric map created in 2012 [52] depicts hydro-isohypse closed curves in the center of the plain and open curves at the borders. This denotes a supply from the borders to the plain. Piezometric lines perpendicular to the valley axis intersect in the plain’s center before continuing in an East–West parallel route over the Oued Cheliff. The aquifer pumping does not compensate the weak recharge in the plain’s center.

2.3. Sampling Collecting and Analysis

Over 87 geolocated active wells were used for irrigation, and groundwater samples were collected throughout the study plain during the period from April to July 2017. During which, the irrigation of cropping systems extends all over the study area. The use of a GPS device helped in georeferencing the collected samples. To avoid sample contamination, the aquifers are pumped up for a few minutes before sampling. The samples were then put in preconditioned 1L polyethylene bottles and kept at 4 °C in an icebox. The pH and EC measurements were collected directly in the field with a multi-parameter handheld instrument WTW 350i (0% precision). The samples were then brought to the laboratory and examined for their major chemical contents (Ca2+, Mg2+, Na+, K+, Cl, SO42−, HCO3, and NO3). The analytic methods utilized in this investigation matched the requirements of the American Public Health Association [53]. Calcium (Ca2+) and magnesium (Mg2+) concentrations were determined by volumetric measurements in the presence of EDTA aqueous solution; bicarbonate (HCO3) concentrations were determined by 0.1N hydrochloric acid titration; and chlorides (Cl) concentrations were determined by titration of neutral medium solution of silver nitrates in the presence of potassium chromate. The amounts of sodium (Na+) and potassium (K+) were measured using flame photometry. In collaboration with a laboratory from the “Algerian Water Agency”, the spectrophotometry technique was used to doze sulfate (SO42−) and nitrate (NO3). The charge balance error (CBE) was assessed for each analyzed sample (Equation (1)). It was found to be acceptable in comparison to the (10%) range utilized in most laboratories [54].
Charge - Balance   Error   ( CBE ) = [ cations anions cations + anions ] × 100

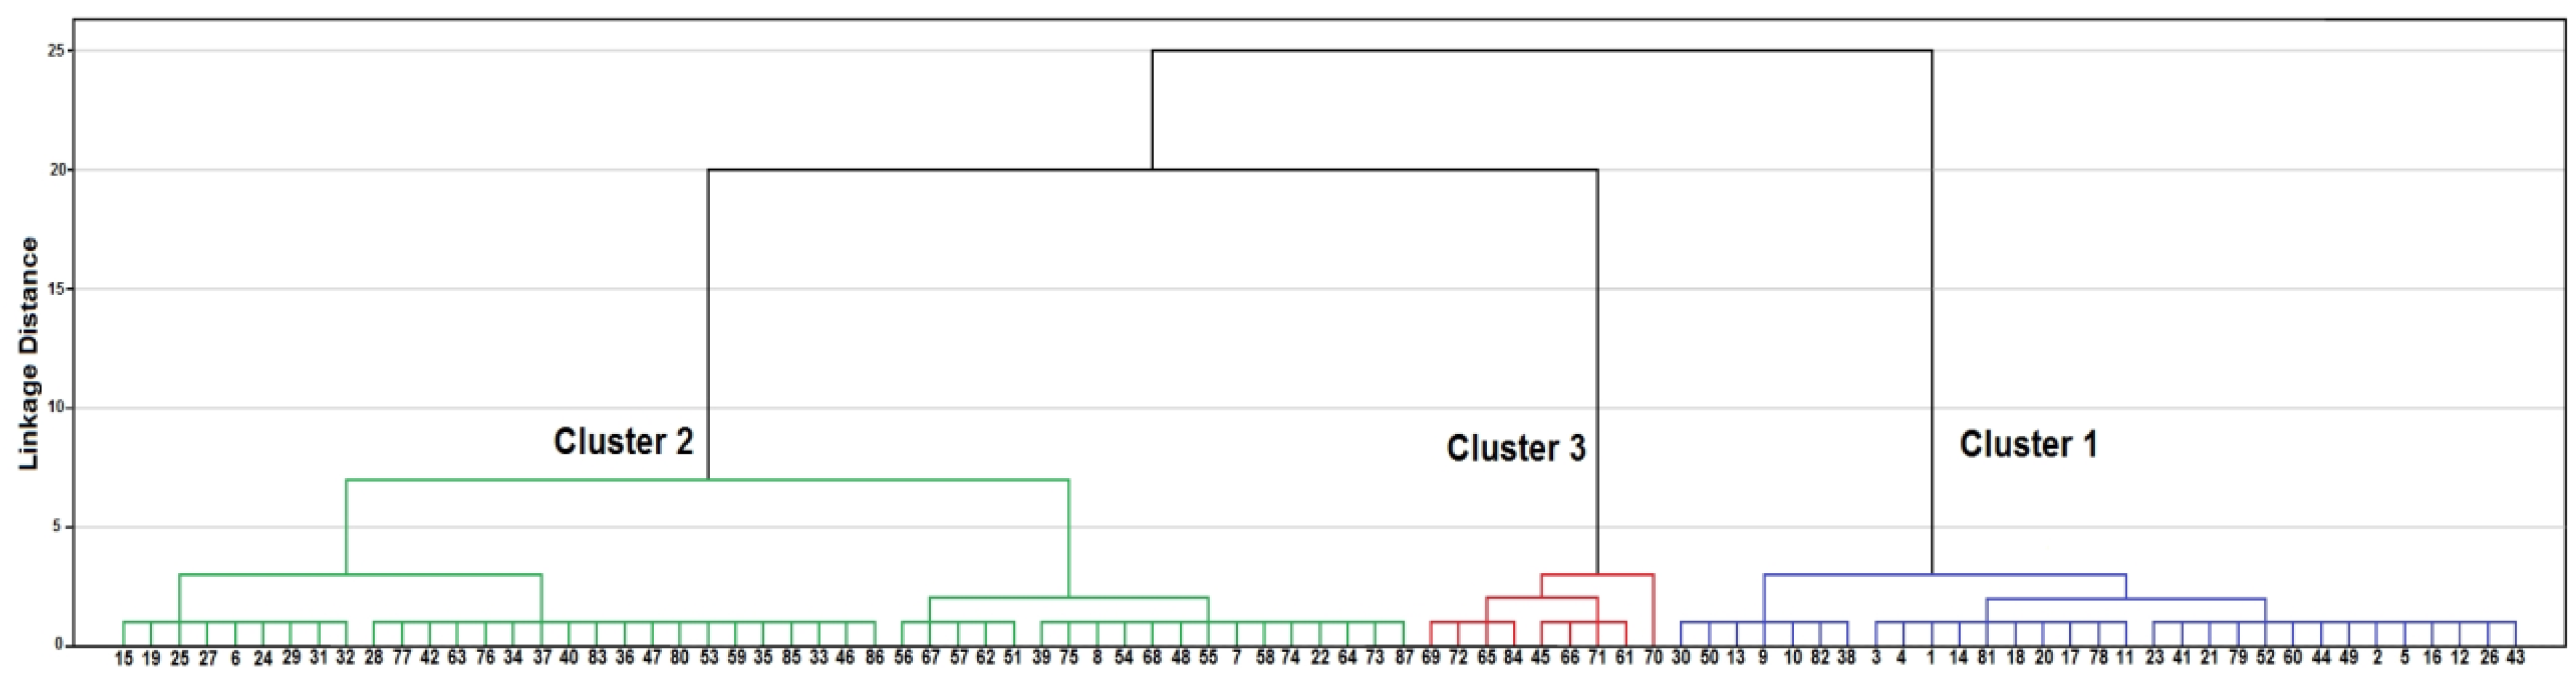
2.4. Statistical Analysis Approaches

The geochemical characterization of groundwater relies on the common use of the multivariate statistical analysis that retrieves valuable information from trends of chemical datasets [55]. In this study, the performance of HCA and PCA is usually used to extract the variability patterns and to identify the origins of the chemical elements. All the statistical processing was performed using the SPSS software v. 20.0 (IBM, Chicago, IL, USA) [56]. The HCA analysis used to classify the gathered groundwater samples is based on both Ward’s linkage approach and the Euclidean distance, both of which are frequently used in hydrochemical analyses [57]. The grouping process of samples with maximum similarity starts with the chemical compositions, then, a combination of the samples’ clusters with the Ward linkage method, the procedure is repeated until the full grouping of each sample. The clusters and the average linkage distance are presented graphically in the generated dendrogram from HCA to determine the number of homogeneous groups.
The PCA analysis creates associations between variables that reduces the sets of observations. The diagonalization of the correlation matrix is behind this reduction, giving rise to uncorrelated new dataset (orthogonal), with a decreasing order of importance called principal components (PCs) [58,59]. Considering the eigenvalue >1 [60], the execution of a Varimax rotation to these PCs has simplified the interpretation of the factors, whether it is related to the hydrochemical or anthropogenic processes that control the groundwater geochemistry. The factors with absolute loading value >0.75, 0.75–0.50, and 0.50–0.30 are considered “strong”, “moderate” and weak, respectively [61].

2.5. Geochemical Modelling

The geochemical modeling was performed by calculating the saturation index (SI) using PHREEQC v2.18 software for measuring data for defining the chemical reactions and aqueous speciation in the aquifer system [62]. The SI is calculated by Equation (2):
γ h = 1 2 N ( h ) i = 1 N ( h ) [ Z ( x i ) Z ( x i + h ) ] 2
where, IAP: ion activity product; Ksp: the solubility product at a given temperature.
The groundwater is being oversaturated when SI > 0 in a particular mineral (precipitation condition). SI < 0 indicates the under-saturation in a particular mineral (dissolution condition), whilst SI = 0 reflects the equilibrium state.

2.6. Geostatistical Modelling

Matheron was the first to develop and to apply the geostatistical theory starting from the mid-1960s [63]. Since then, it has grown into one of the most resilient approaches in applied statistics and earth sciences, particularly in hydrogeology, where it is used to create spatial maps of groundwater distribution and quality. The use of kriging interpolation techniques and semi-variogram models to interpolate the spatial pattern of groundwater irrigation analytical data is novel. The OK method, in particular, is an effective tool for linear interpolation [37,38].
The first step in the geostatistical modeling is determining the spatial dependence between neighboring observed points expressed using a variogram (γh) [64]. The semi-variance is defined as (γh), representing the semi-variance between the attribute values for all separated points by “h” distance as follows:
γ h = 1 2 N ( h ) i = 1 N ( h ) [ Z ( x i ) Z ( x i + h ) ] 2
where (γh): respresents the all pairs’ semi-variance for a lag distance h; Z(xi): the groundwater irrigation parameter information per point i; Z(xi + h): the groundwater irrigation parameter data for the rest of the separated points from xi by a discrete distance h; xi: the georeferenced location of Z(xi); N(h): the number of observation pairs for separated points by a distance h [65].
The second step is the interpolation using the ordinary kriging method. The output consists of generated predictive maps representing the interpolation at unsampled locations of the regionalized variables with a minimum square error [66]. The calculation of the spatial distribution with ordinary kriging (OK) using the following equation:
Z ( x 0 ) = i = 1 n λ i Z ( x i )
and
i = 1 n λ i = 1  
where, Z*(x0) is the estimated value of the groundwater irrigation parameter by a location x0, Z(xi) is the available sample of the groundwater irrigation parameter per location xi, and λi is the weight assigned to the sample value, and n is the number of considered samples in the prediction.
The combined use of multivariate statistical approaches and geostatistical modelling in this work aids in the evaluation of groundwater quality spatial mapping [20].

3. Results and Discussion

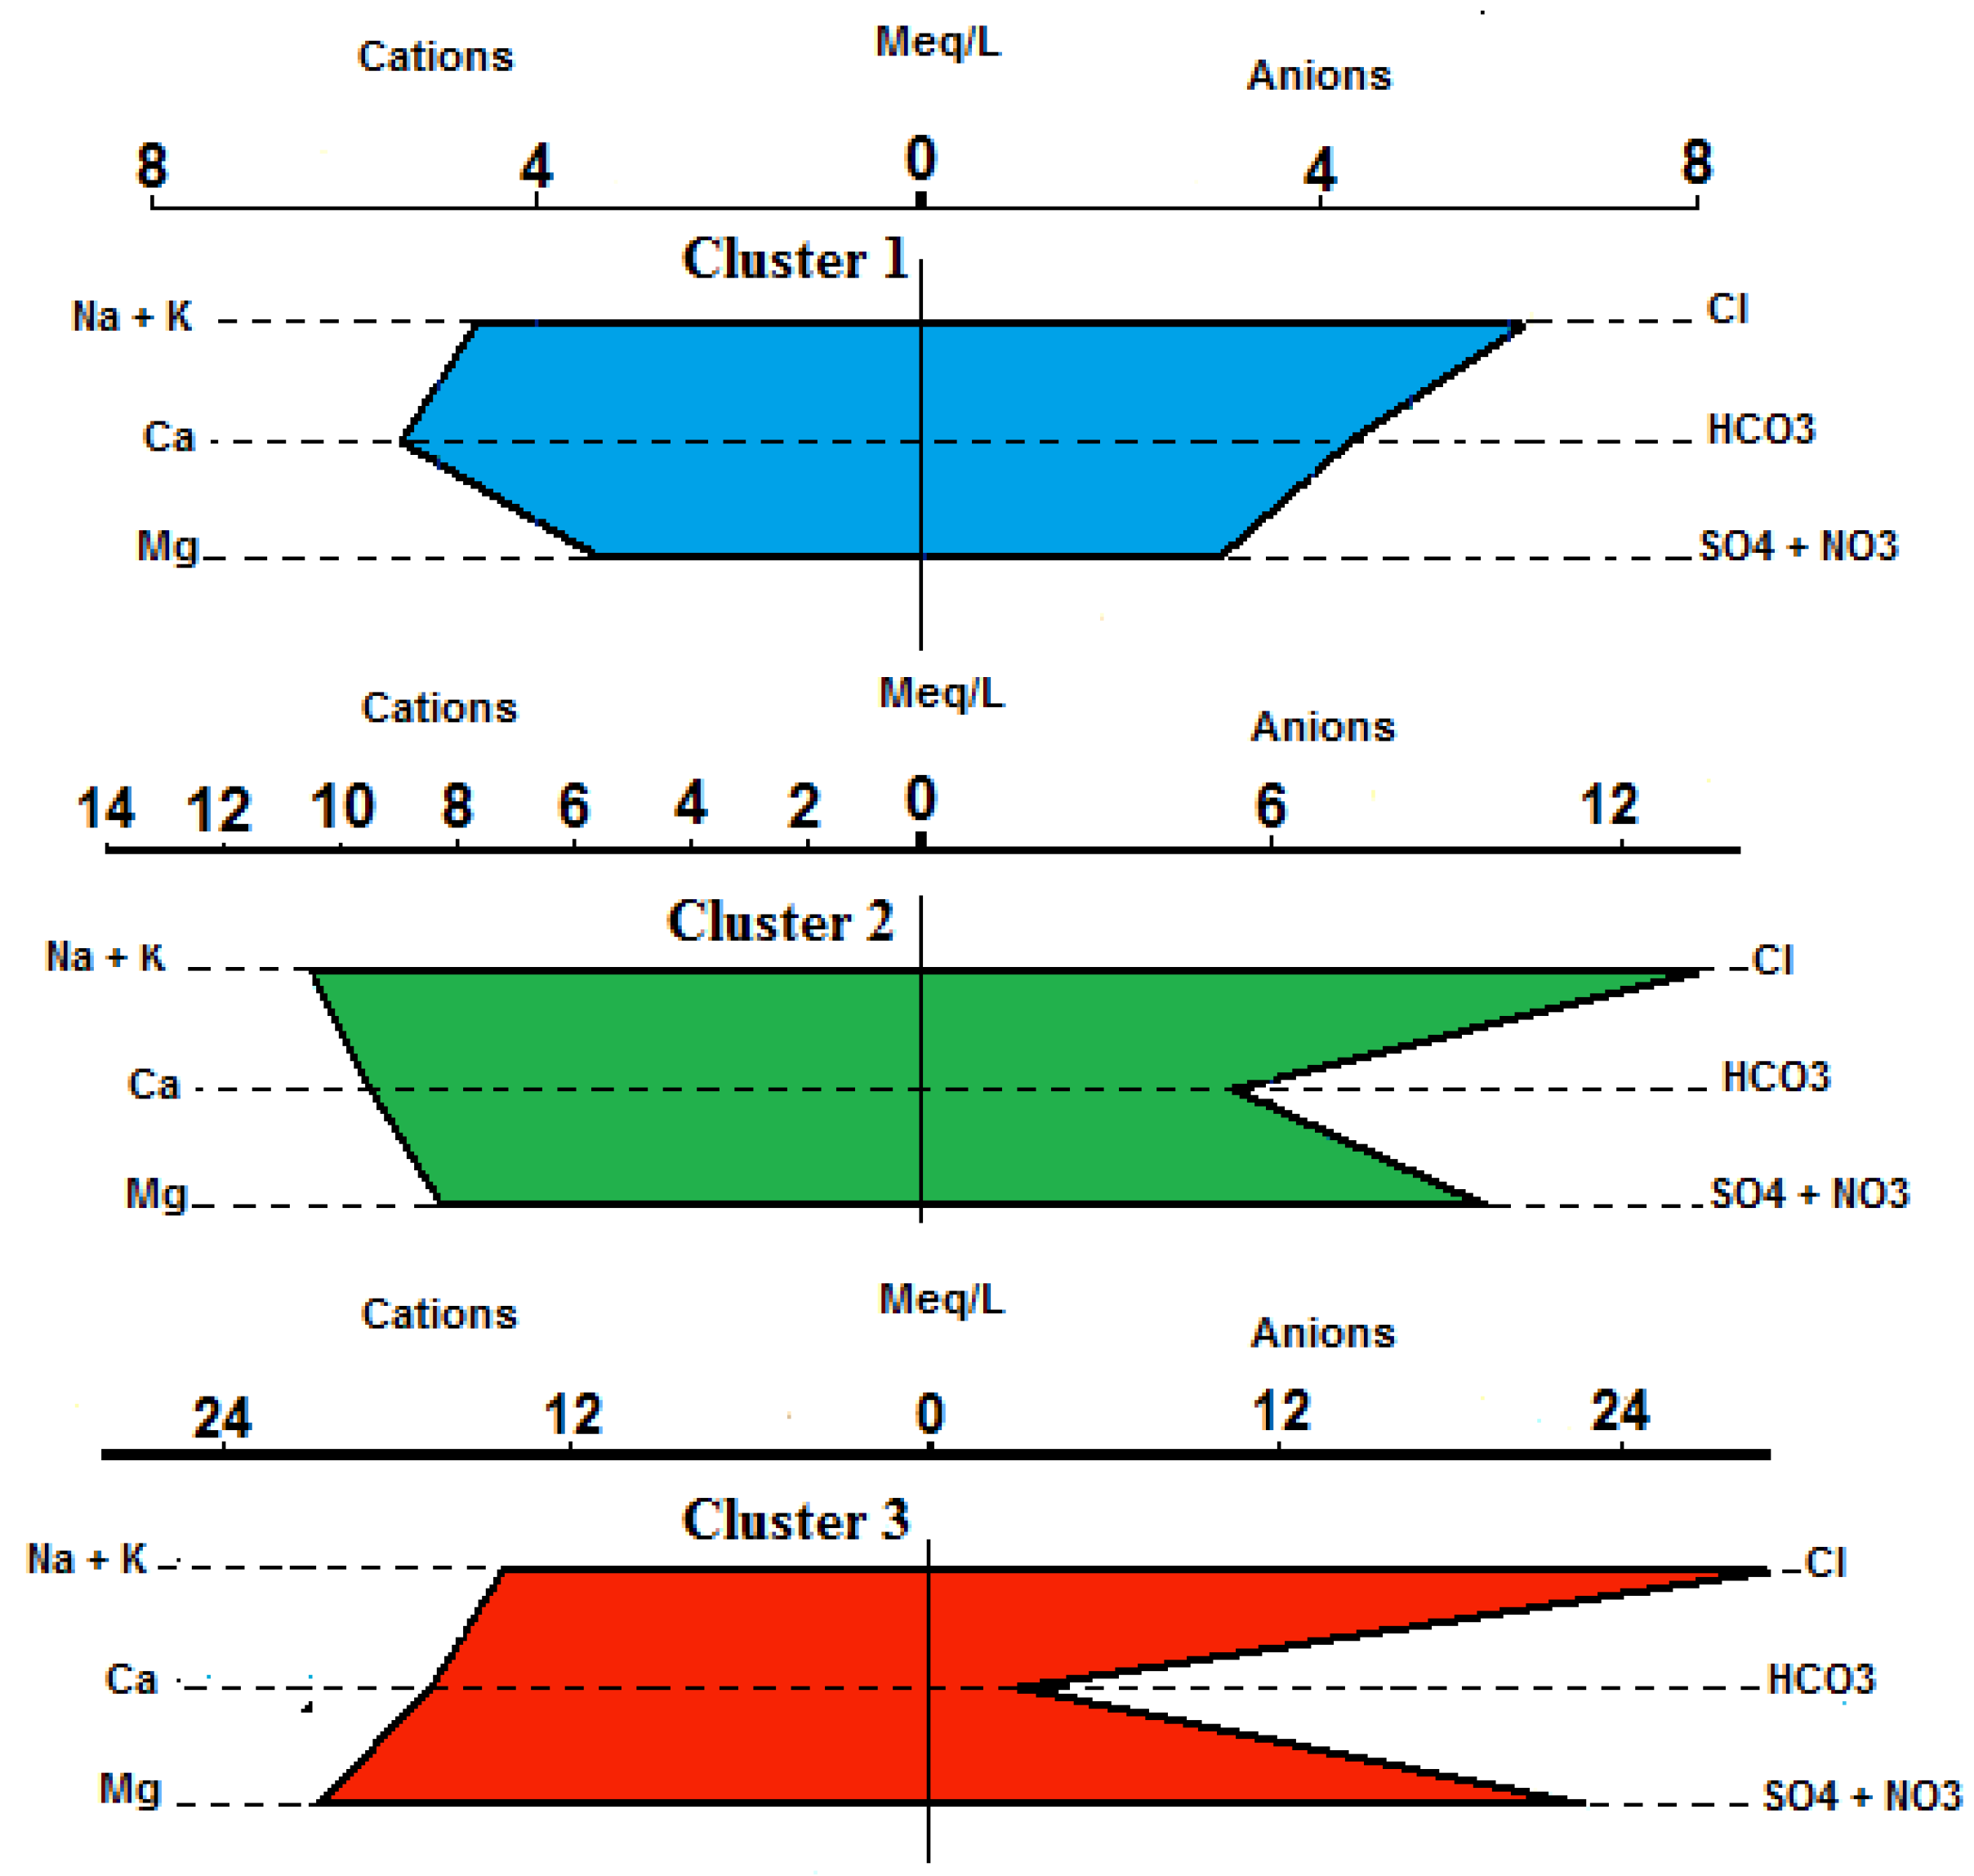
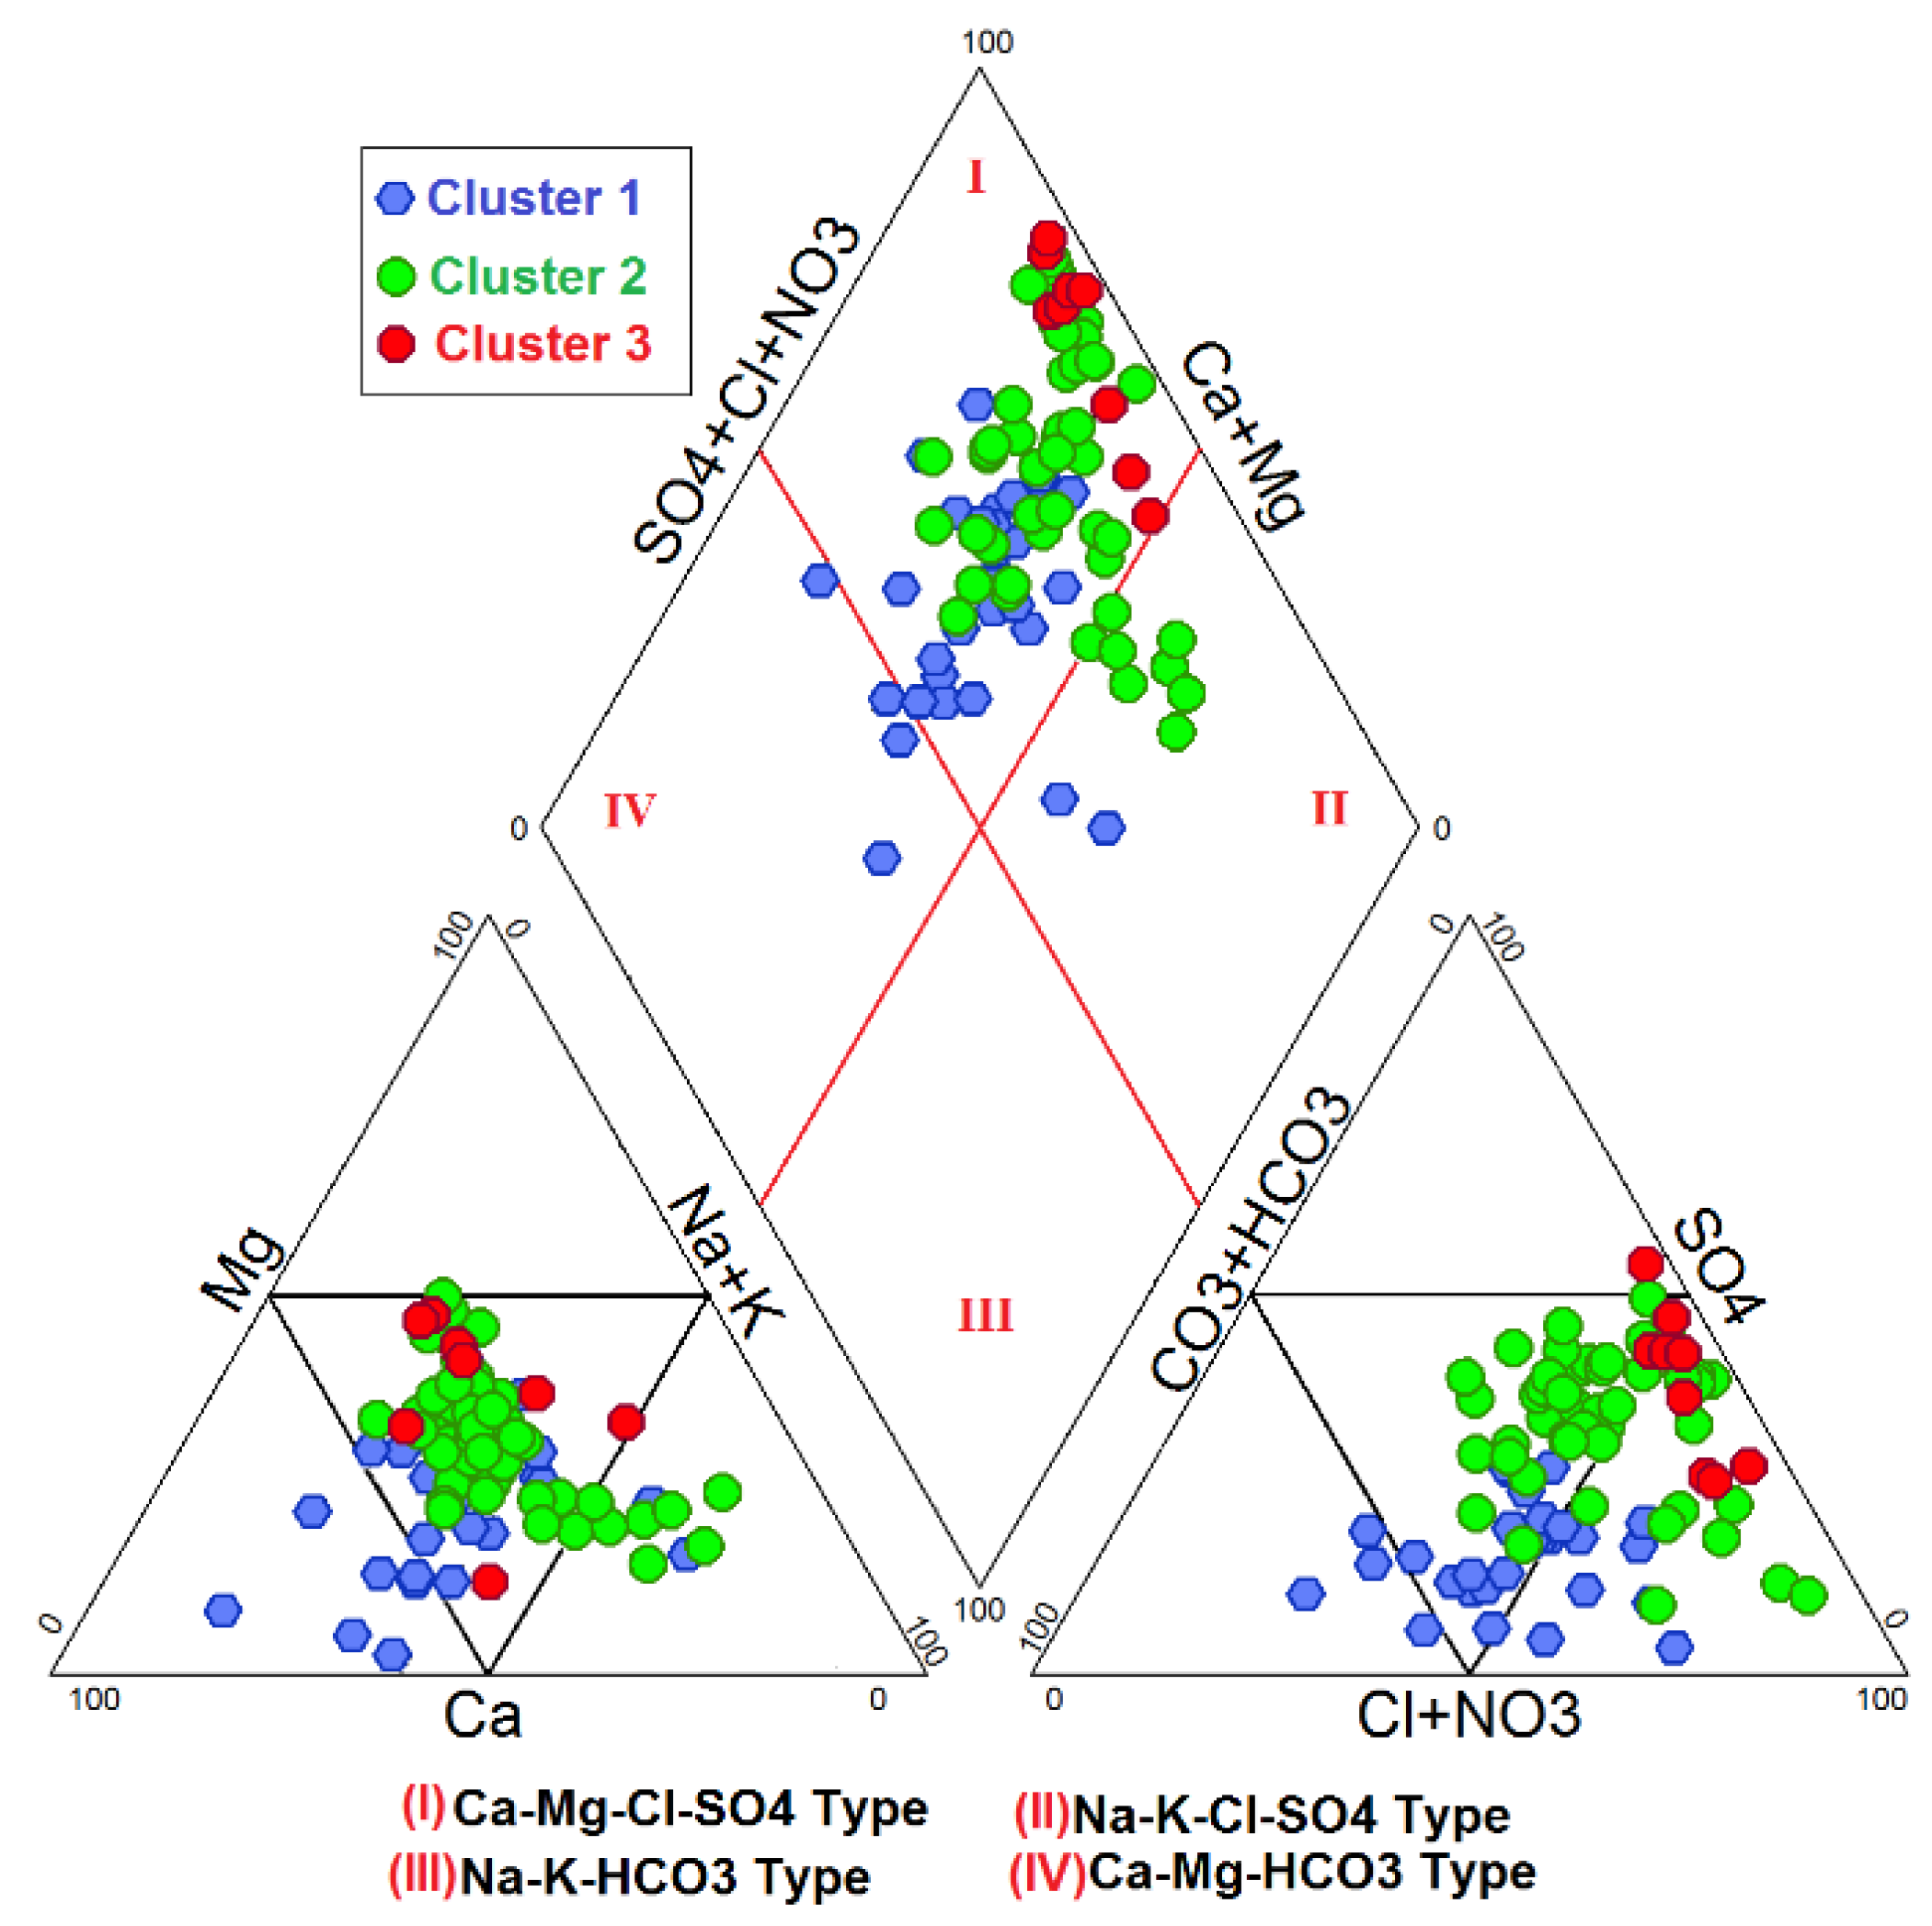
3.1. Hydrochemical Characterics of Groundwater

The concentrations for the majority of the chemical parameters were collected from nomalized data and were used to define the hydrochemical group using the Q-mod from the HCA approach, derived using Ward’s linkage method and the Euclidean distance for water sample similarity measurement. The HCA analysis produced a dendrogram (Figure 3), which divides groundwater samples into three groups. As a result, EC becomes a determining factor in identifying these clusters, ranging from cluster 1 to cluster 3. As a result, numerous clusters appear on the Piper [67] diagram to determine the geochemical development of groundwater types. In addition to statistical results, the physical and chemical properties of the three produced clusters were compared to Food and Agriculture Organization (FAO) criteria [39] and are given in Table 1.
Cluster 1 relies on EC mean value equal to 1358.7 µS/cm measured from 31 wells, showing moderate water salinity for irrigation (C3) [68], this class can be used for cropping practices that are moderately salt tolerant. Given their abundance, the major ions order is: Ca2+ > Na+ > K+ and Cl > HCO3 > SO42− (Figure 4). The hydrochemical type is distinguished by the evolution of Na+–K+–HCO3 into the Ca2+–Mg2+–Cl–SO42− facies (Figure 5). Bicarbonates (min = 137 mg/L, max = 427 mg/L, and mean = 275.2 mg/L) are the most abundant element in this cluster, followed by chloride (min = 72 mg/L, max = 361 mg/L, and mean = 214.9 mg/L) and SO42− (min = 13 mg/L, max = 361 mg/L, and mean 119.6 mg/L). The majority of samples exceeded the acceptable nitrate level (10 mg/L) [39] for irrigation water (21 wells out of 31 exceeded the 10 mg/L irrigation guideline).
Cluster 2 is formed by 47 wells (54% of the total samples) characterized by high water salinity of 1947 < EC < 3673 µS/cm, mean = 2744.4 µS/cm. Sodium, chloride, and sulfates are the dominant ions. Meanwhile, the concentration of Na+, Cl and SO42− varies from 110 to 480 mg/L, from 222.3 to 919.5 mg/L and 117.3 to 957 mg/L with mean concentrations of 242.2, 494.8 and 479.7 mg/L, respectively. The abundant major ions are, in descending order: Na+>Ca2+ >Mg2+ and Cl > SO42−- NO3 > HCO3 Figure 4). The hydrochemical type is characterized by Na+-K+-Cl-SO42− to evolve to Ca2+–Mg2+–Cl–SO42− facies (Figure 5).
In Cluster 3, only nine wells remain, with an EC value ranging from 4550 to 8230 µS/cm, mean = 5843.3 µS/cm, indicating highly mineralized groundwater. Mg2+ and Cl are the most dominant ions, stating a hyper composition of Ca2+–Mg2+-Cl- SO42− in the water facies. The influence of the environment on the wells of this cluster seems very important, especially from the agricultural practices that include chemical fertilizers and livestock.
For a better understanding of the hydrochemical process of groundwater, it is worth referring to Chadha (1999) [69], who presented a very clear illustration. This diagram is a modified version of the Piper diagram. It has been used successfully in various investigations to detect distinct hydrogeochemical processes [11,70]. The categorization of water using the Chadha diagram yielded four primary groupings (Figure 6). The application of this figure to groundwater data from the WMC plain reveals that the bulk of the three clusters’ samples fell into group 2, with fewer samples from cluster 2 falling into group 4. Group 2 is distinguished by an excess of Ca+2 and Mg+2 relative to Na+ and K+; this is due to the high calcium content of carbonate rocks, also the water-rock exchange along with the groundwater flowing (Figure 6). This group shows water type of Ca2+–Mg2+–Cl–SO42− composition.

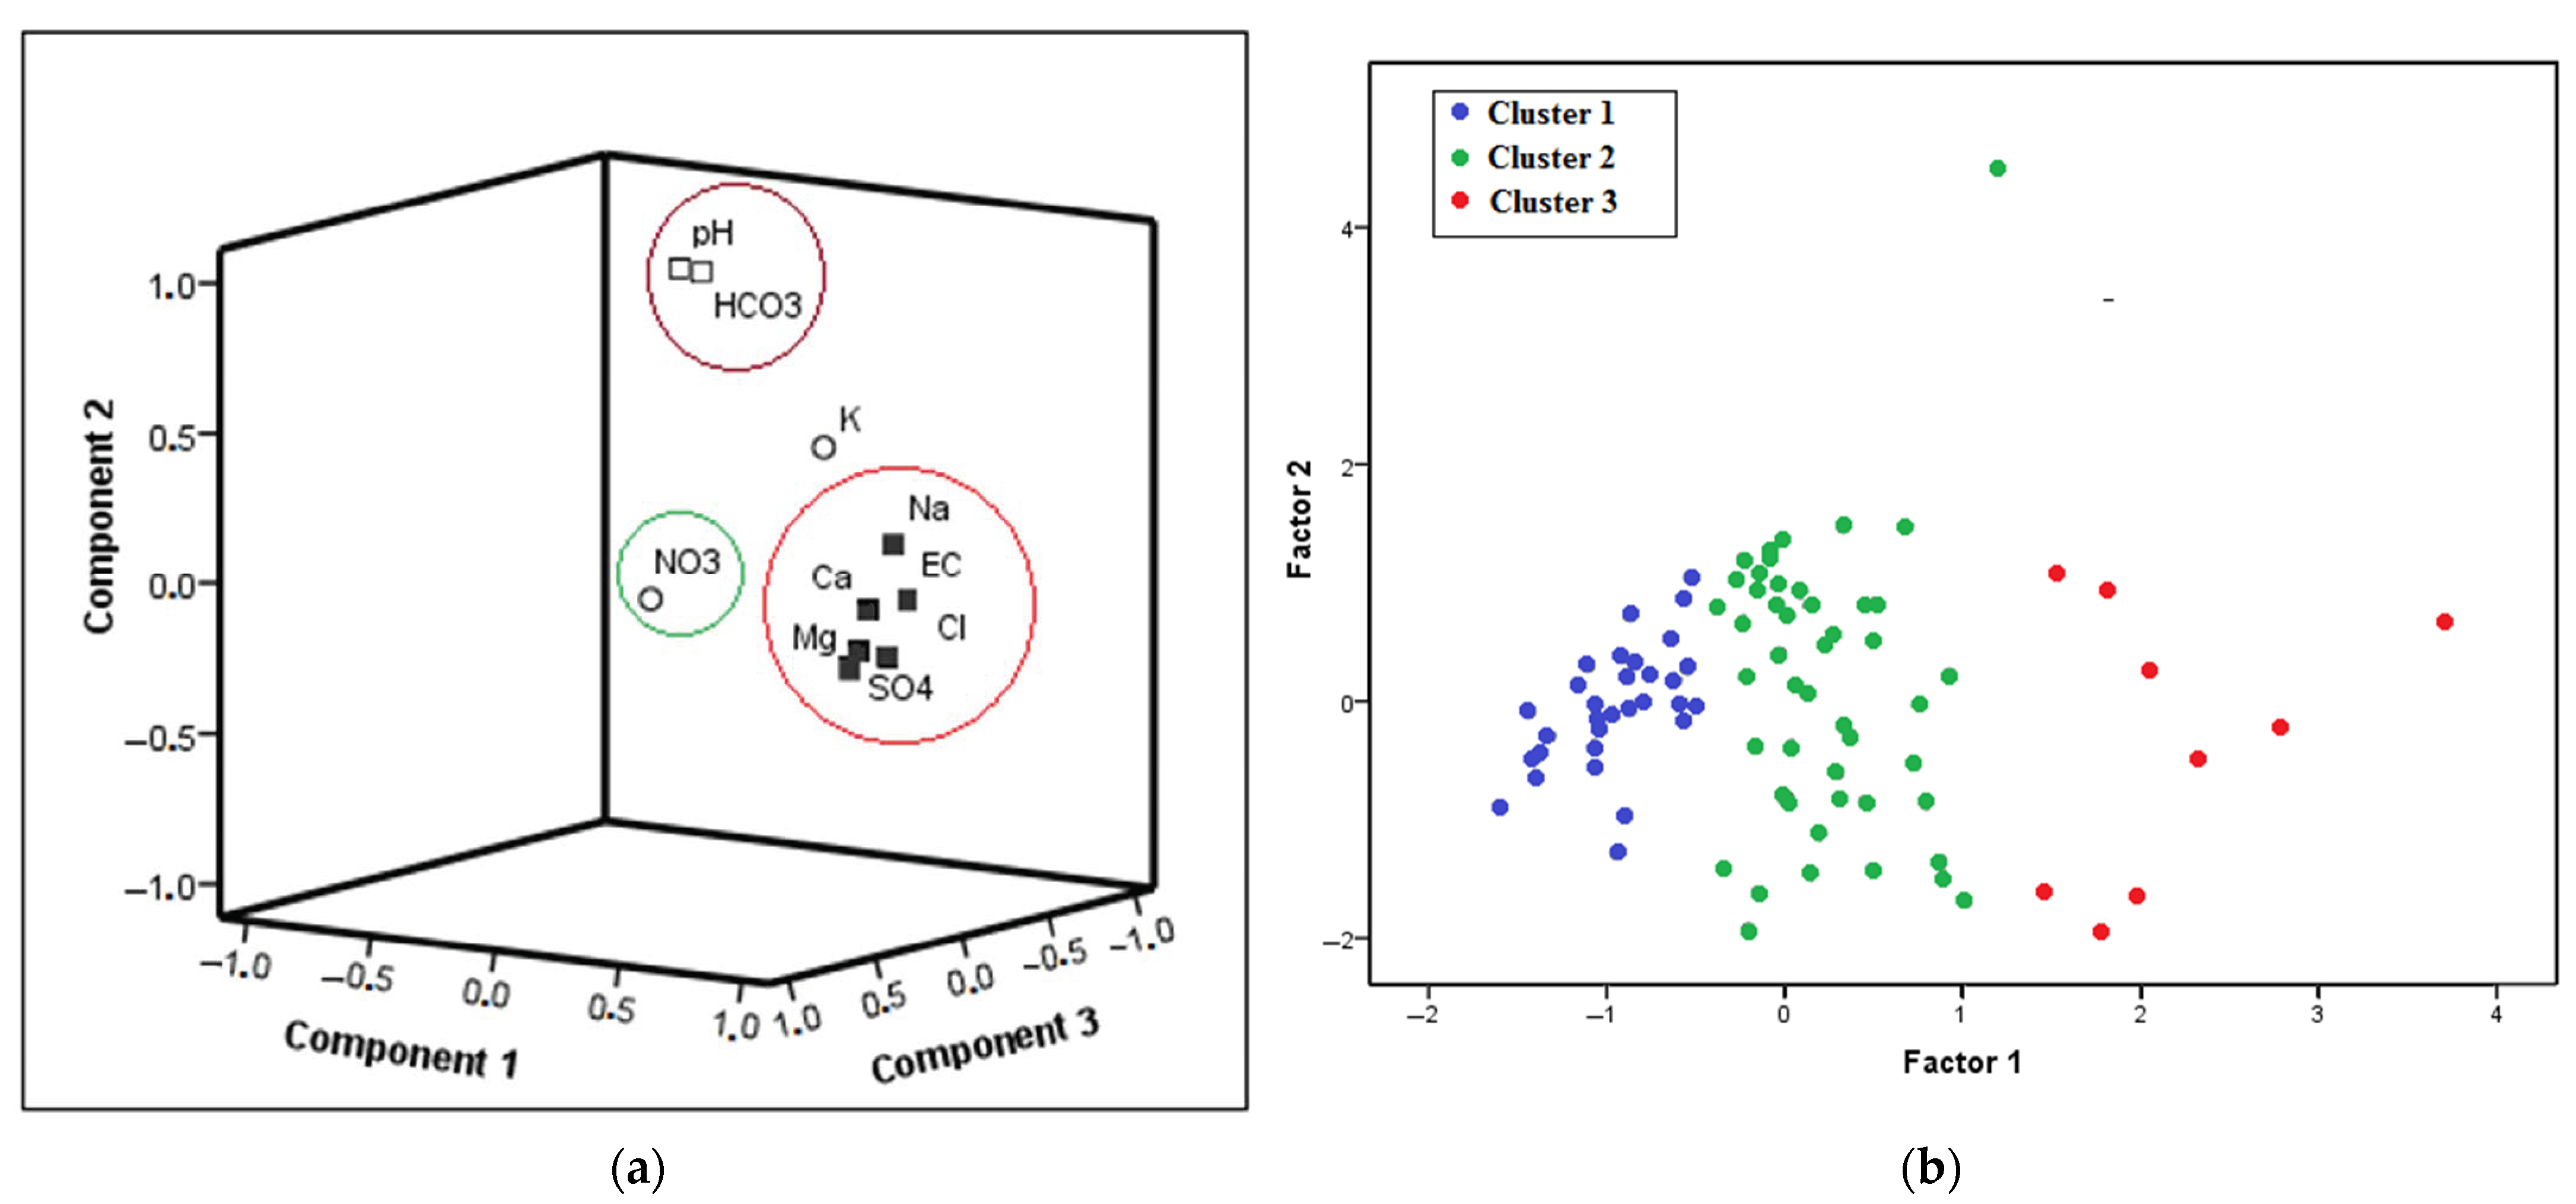
3.2. The Principal Component Analysis (PCA)

The dataset of 87 observations that had undergone a PCA analysis was alongside ten (10) physicochemical parameters (EC, pH, Mg2+, Na+, Ca2+, K+, Cl, SO42−, HCO3 and NO3). Through the SPSS software, the Varimax rotation method was performed (Table 2). The results indicate complex geochemical components in groundwater. Following this, we extracted three factors with an eigenvalue >1, representing 84.526% of the total variance in the groundwater quality dataset (Table 2 and Figure 7).
According to Table 2, component 1 with the highest variance of 48.087% represents a strong mineralization of groundwater. Regarding, the positive important loading >0.75, the controlling parameters of the water table chemistry are mainly EC, Cl, Ca2+, SO42−, Mg2+ and Na+ revealing salt leaching as well as a rock-water interaction within the aquifer. The major cations of this factor are Ca2+ and Mg2+, which may be formed by the weathering or reverse ion exchange process of carbonates [71].
The Rotated Varimax component 2 produced a total variance of 20.861% (Table 2), with a positive loading between pH and HCO3, with this component representing groundwater alkalinity. The pH in the examined groundwater is caused by the entry of precipitation into groundwater via deep percolation, as well as changes in mineral composition. HCO3 concentrations in groundwater revert to mineral dissolution in the saturated and unsaturated zones.
The Rotated Varimax component 3 represents 15.578% of the total sum of variation, with a significant loading of NO3 and K+, illustrating the influence of human-caused activities on the agriculture process. Indeed, the presence of nitrates in groundwater verifies the penetration of wastewater from agricultural practices that use a lot of nitrate fertilizers [11].
According to these findings, the key hydrogeochemical processes include aquifer material weathering, ion exchange, and human influences, notably agricultural activities.
The scatter-plot of both component 1 and 2 (Figure 7b) shows that all the water groups can be distinguished well in the PC space, and are the same as the clusters extracted from Q-mode HCA.

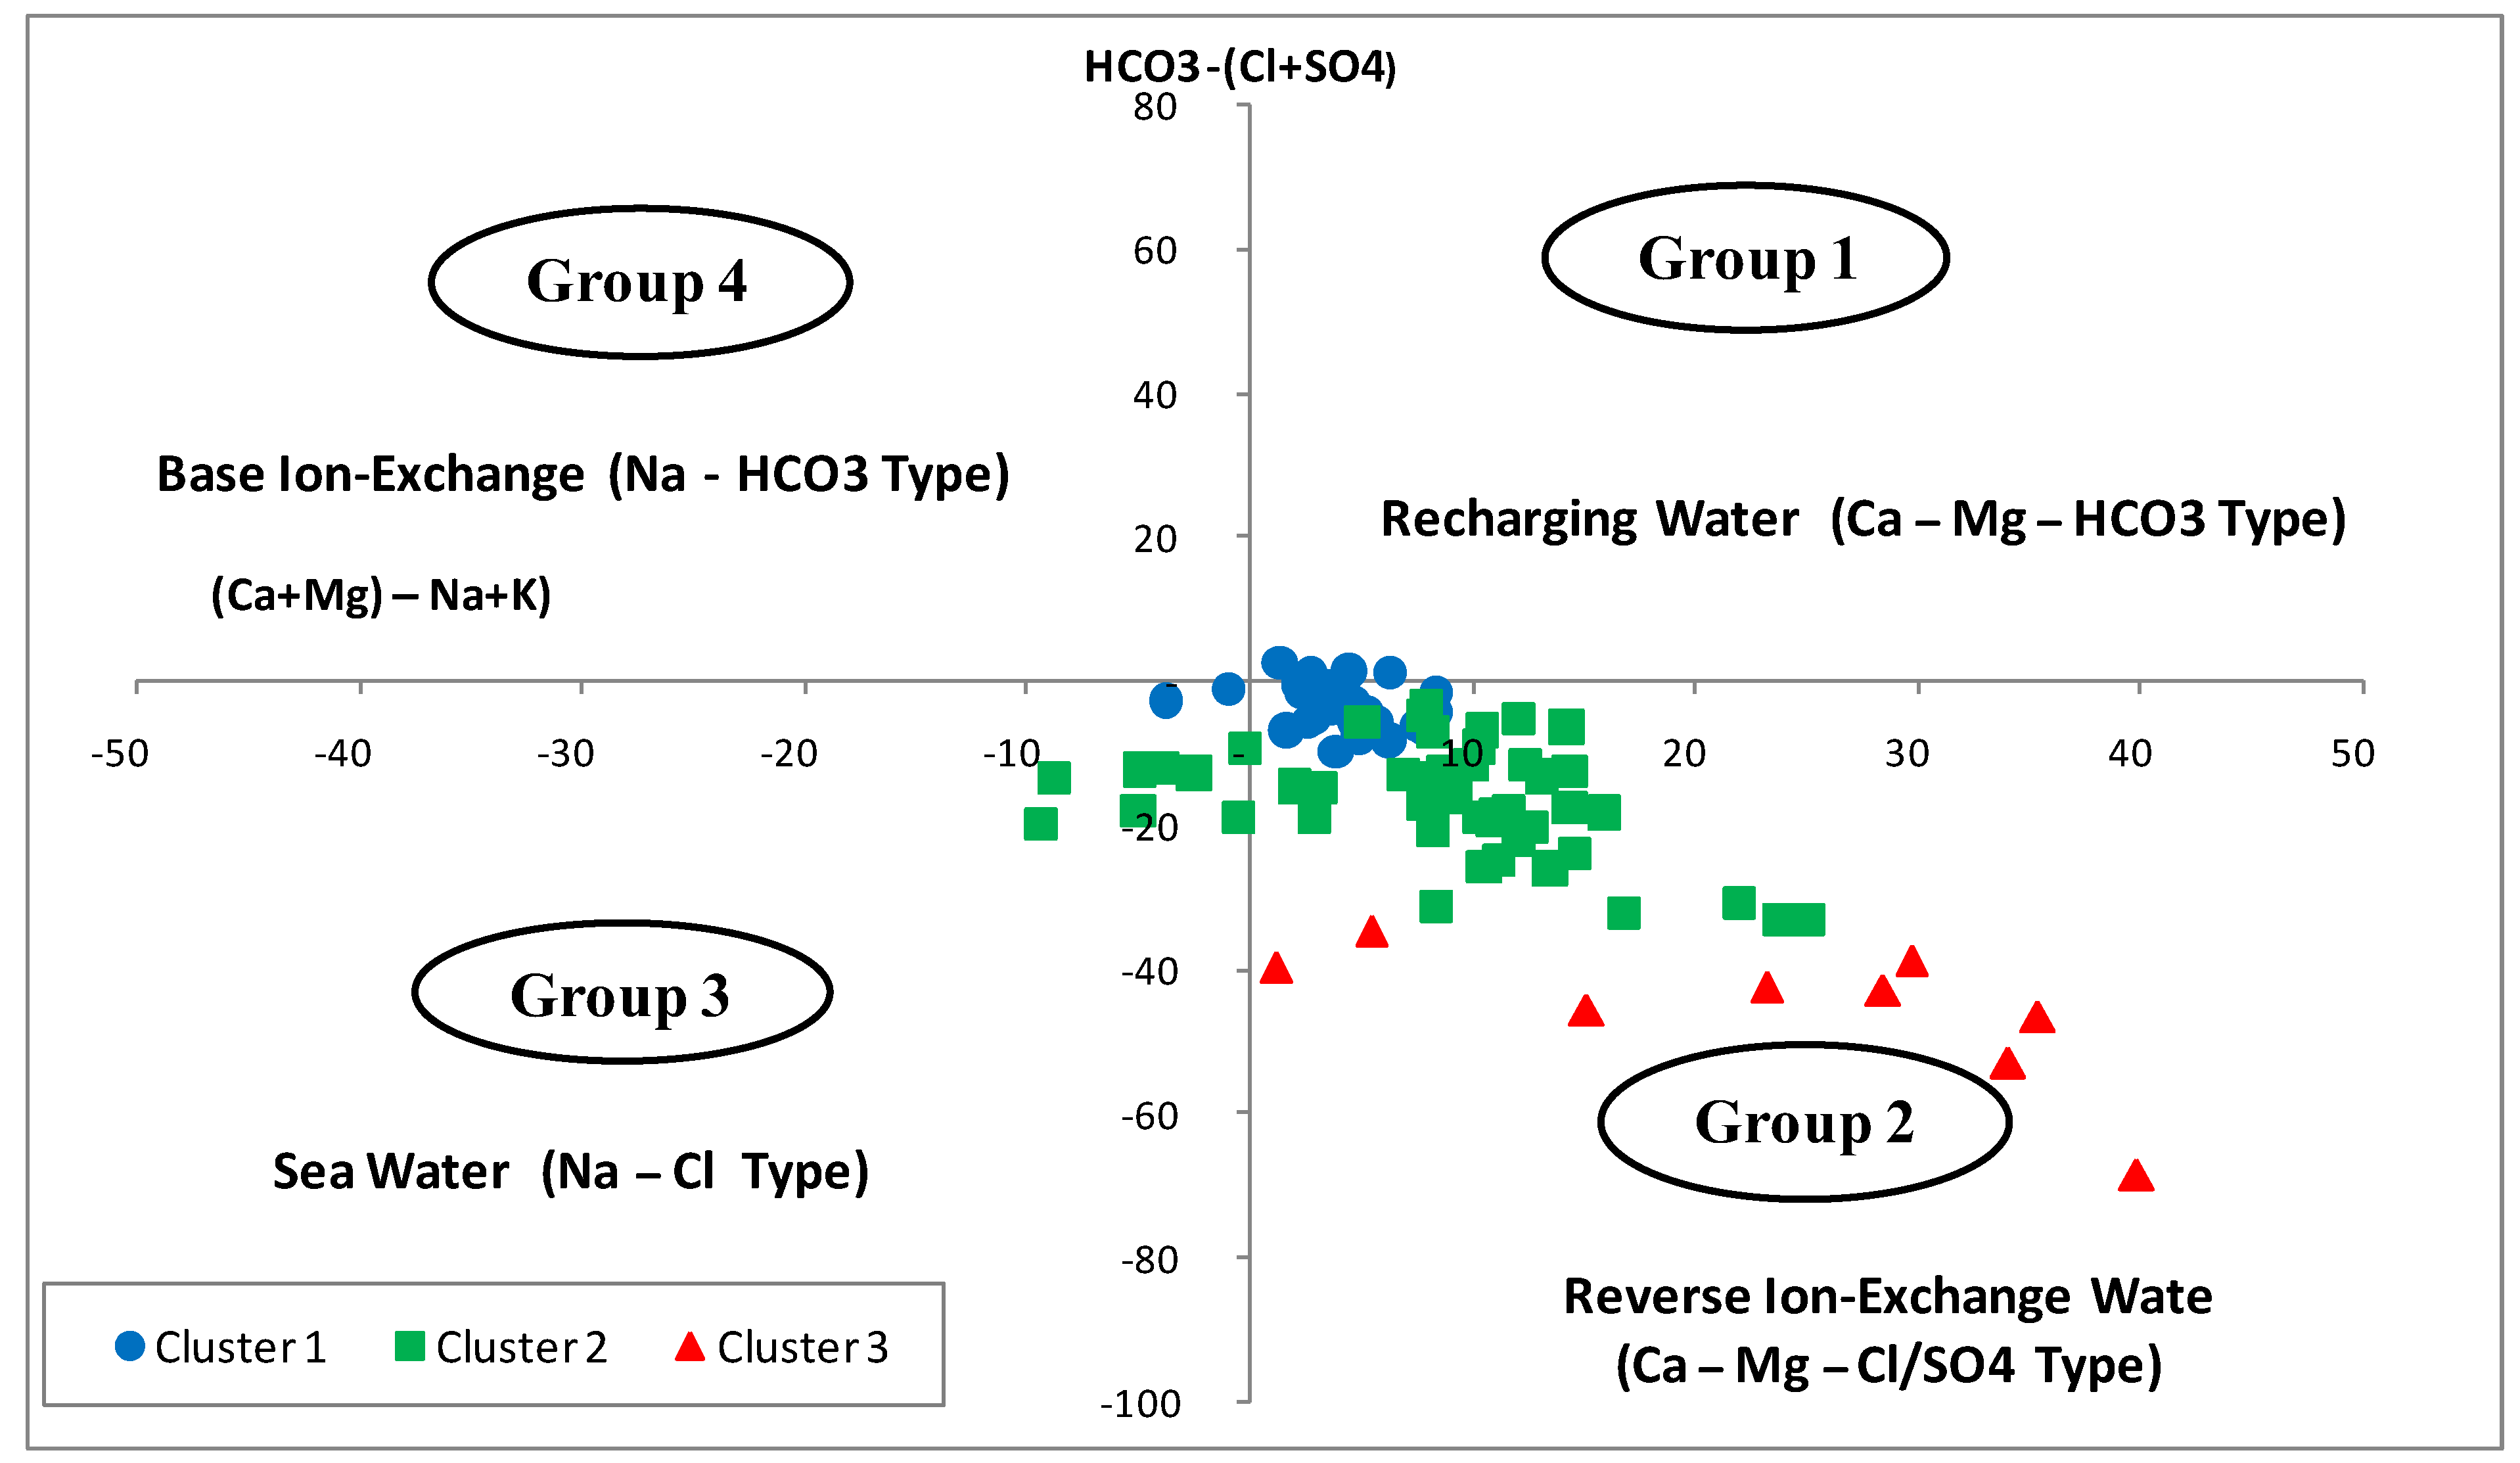
3.3. Hydrogeochemical Process
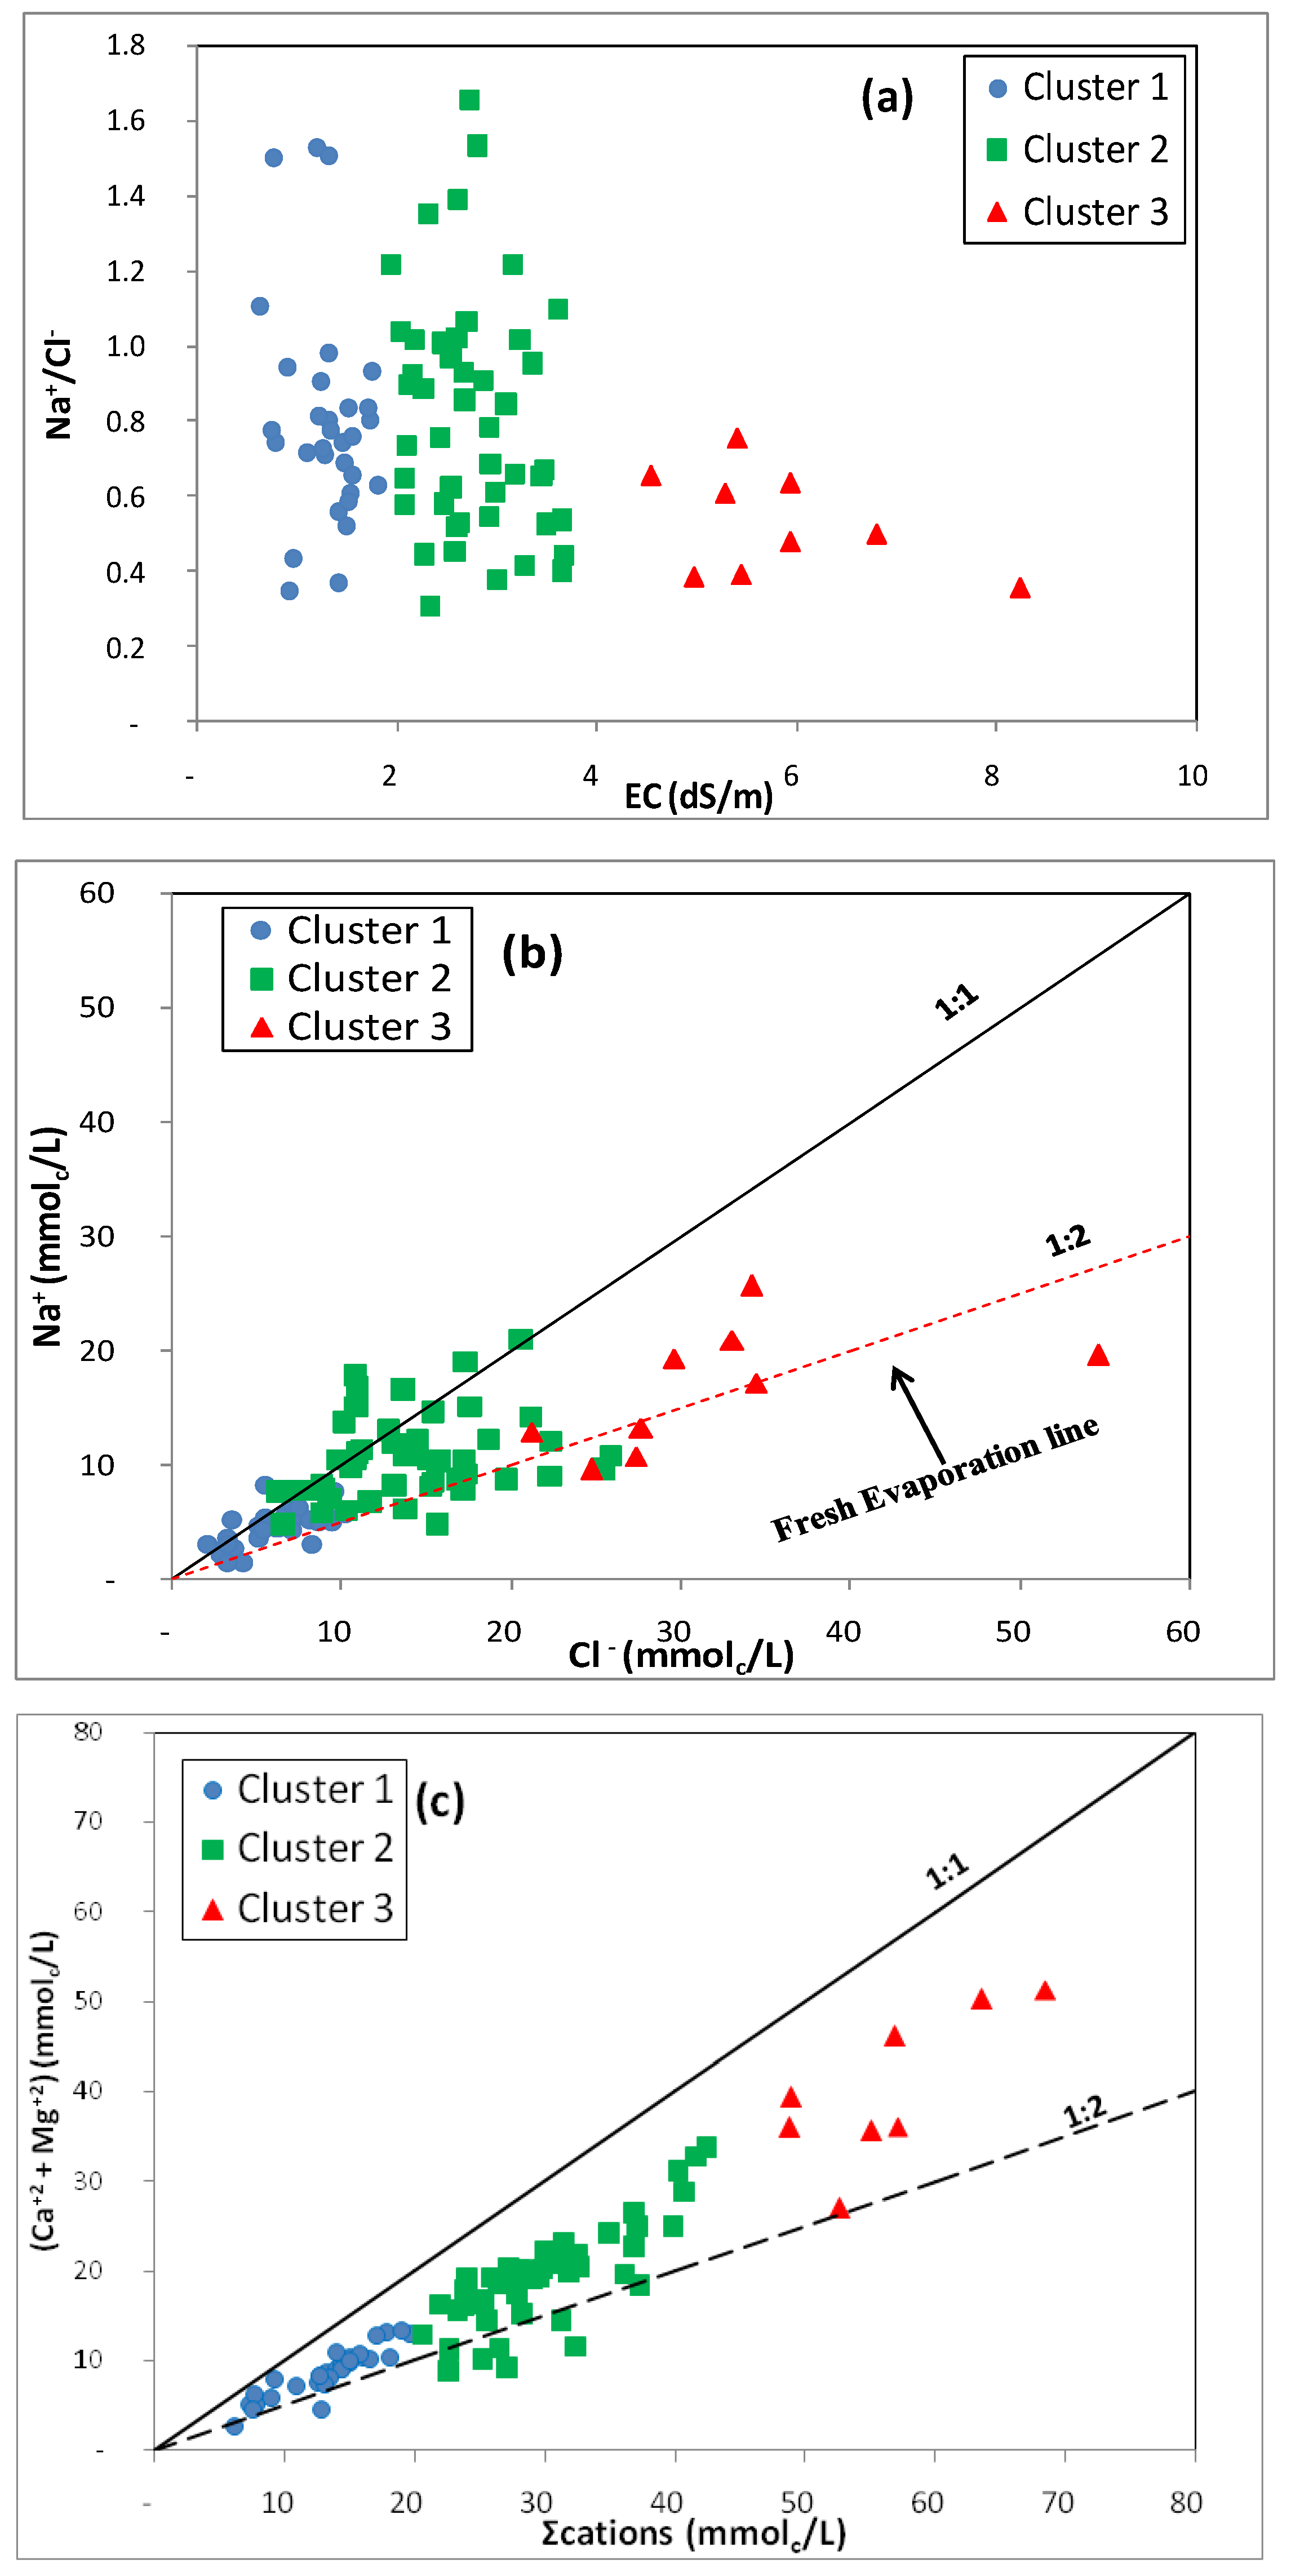
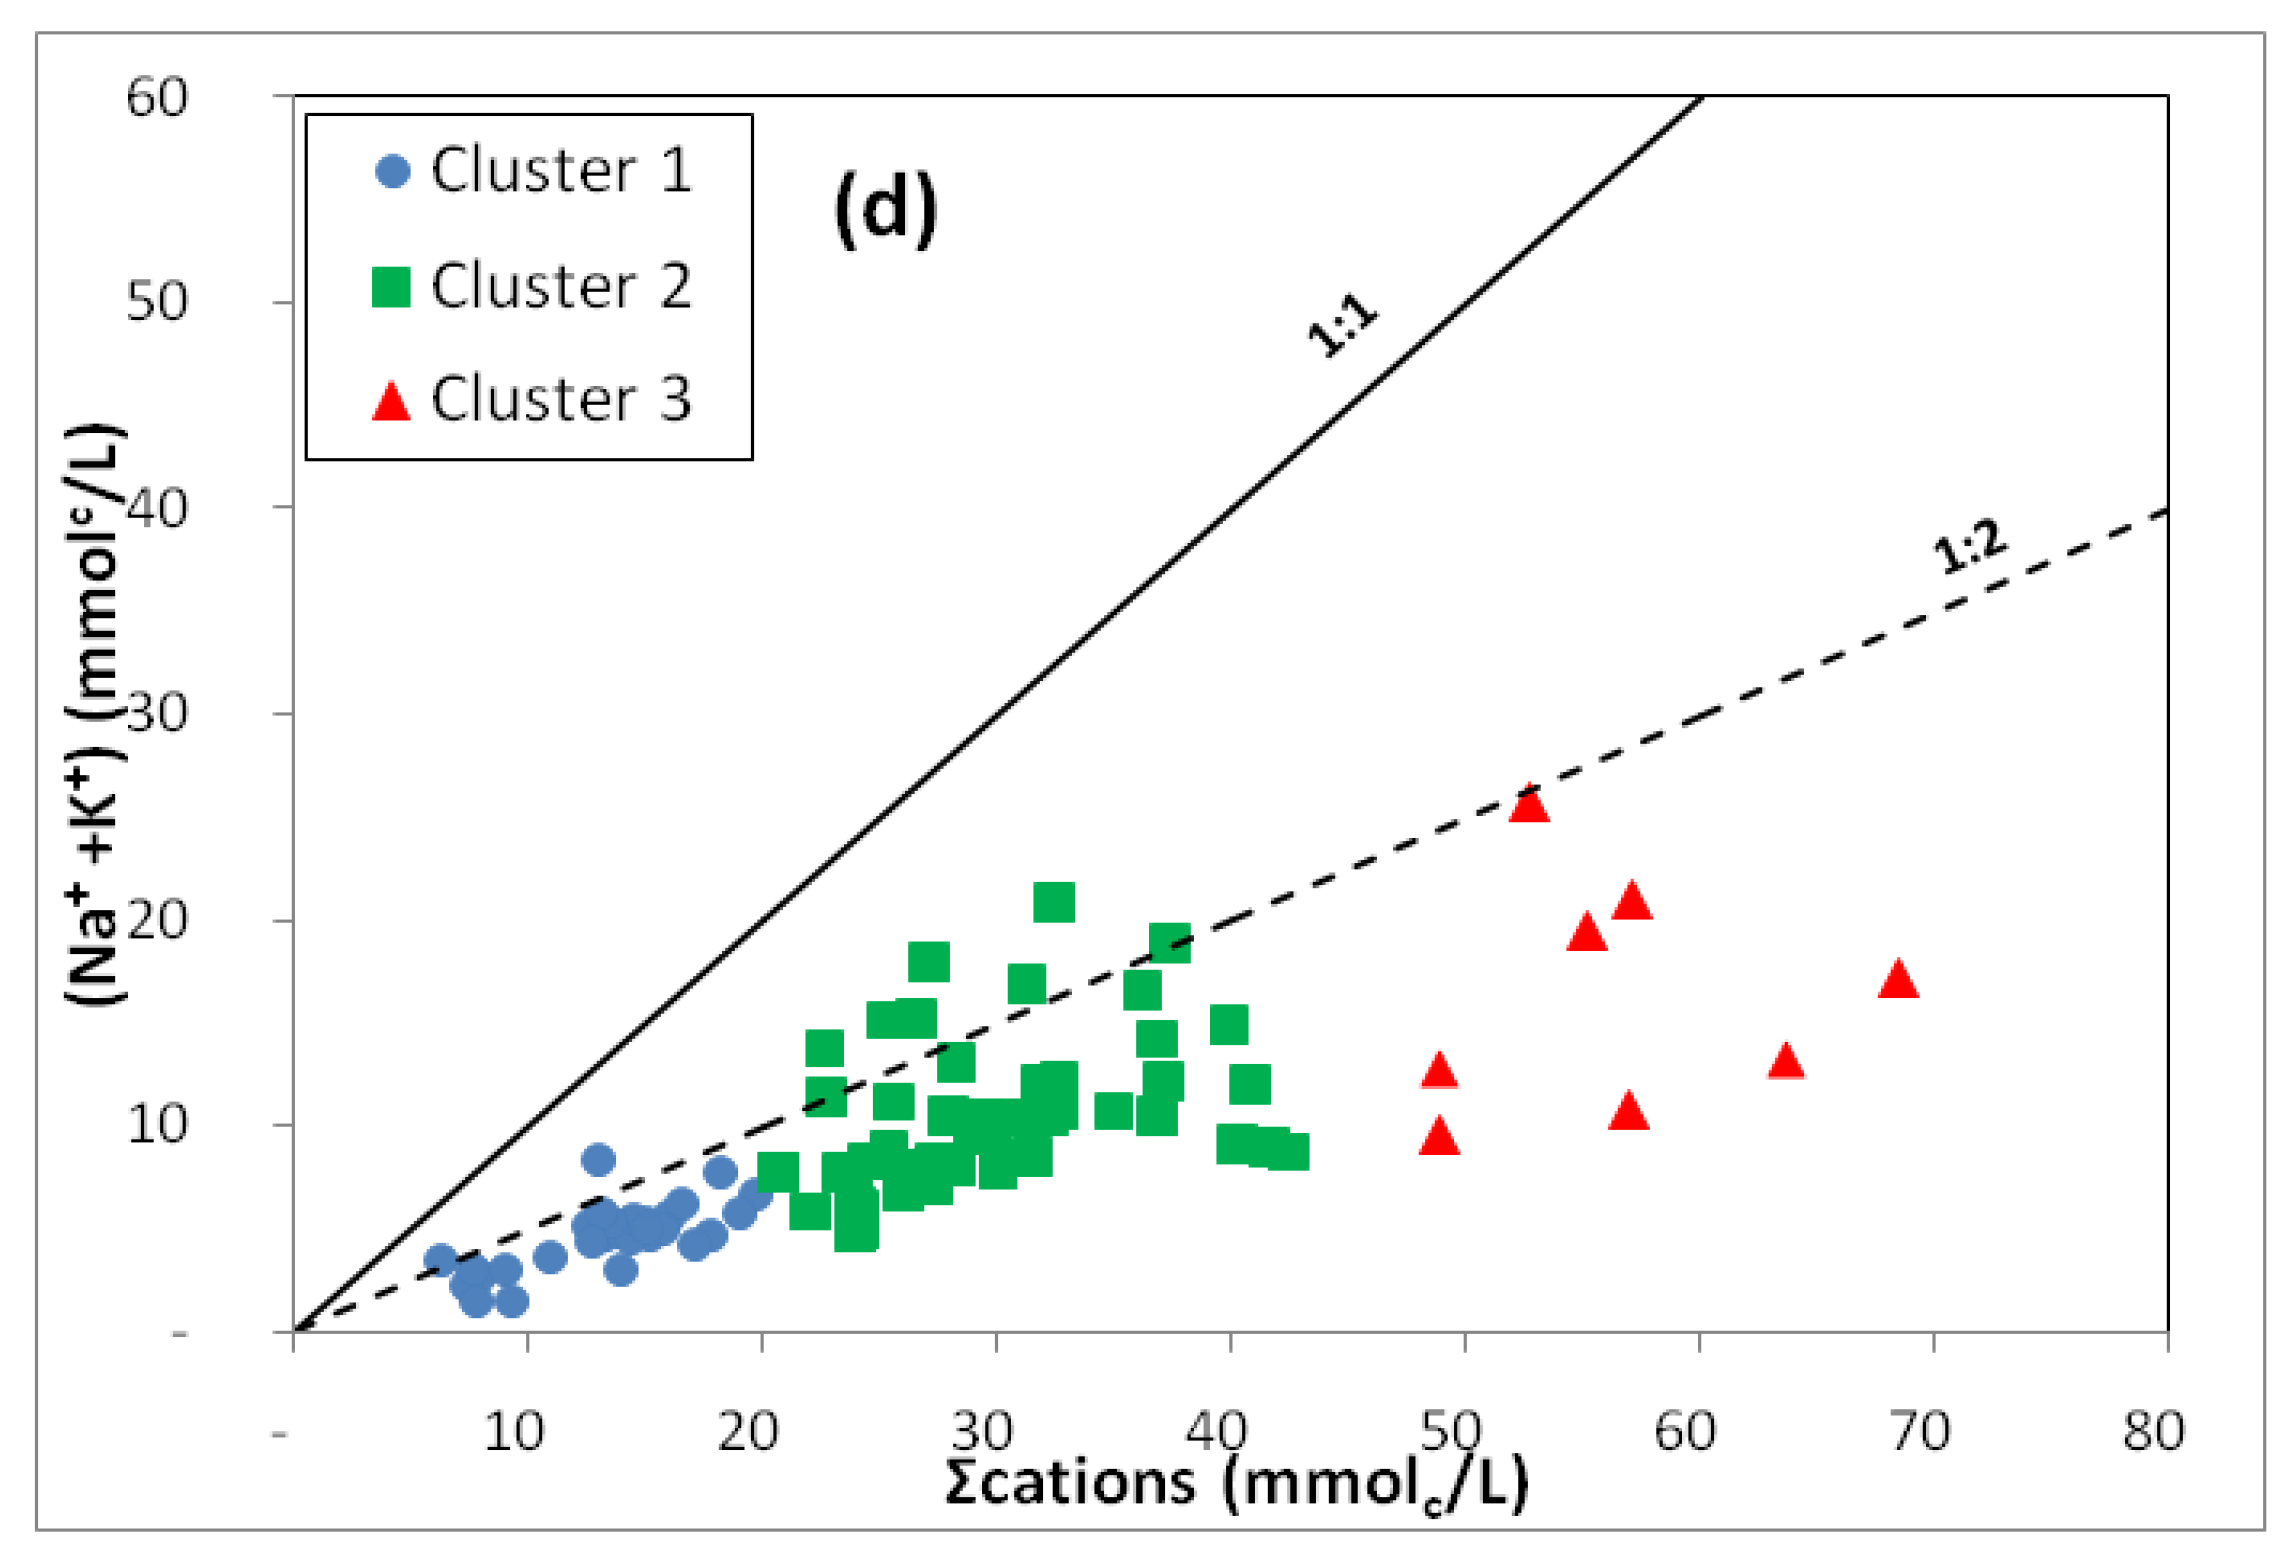
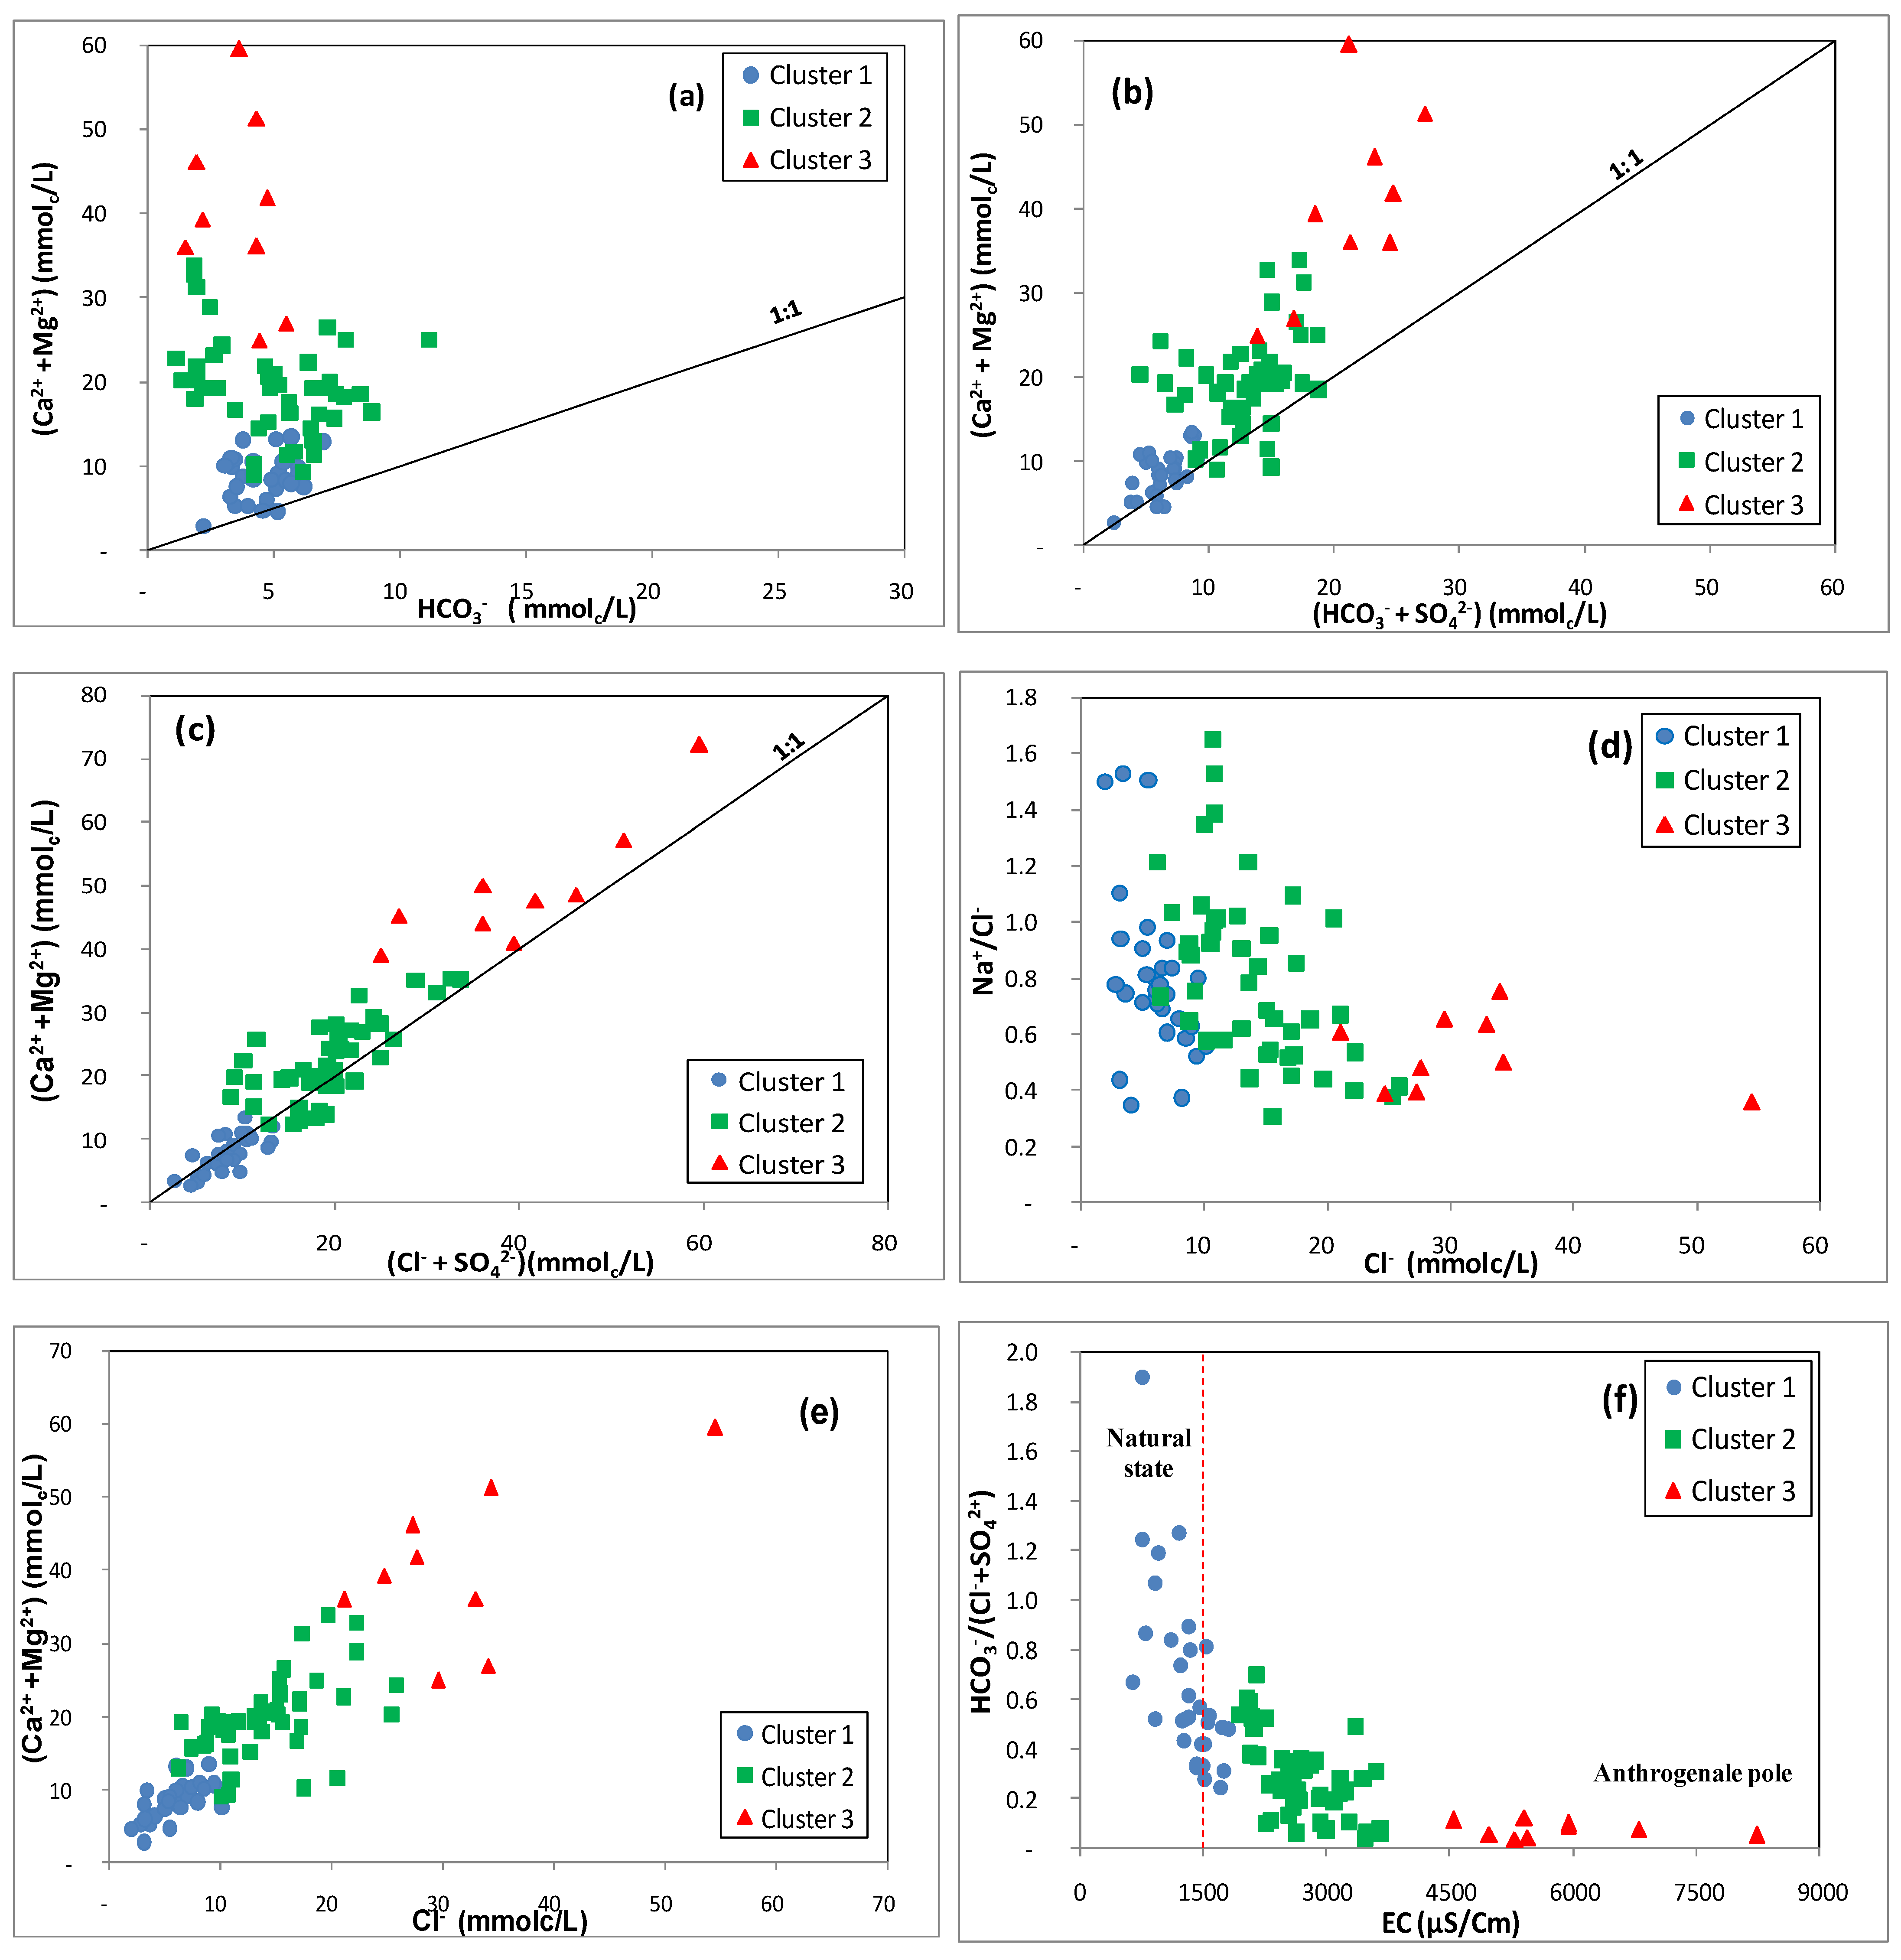
3.3.1. Evaporation

In semi-arid areas, the climatic effect through the evaporation process may increase the concentration level of all ions in the groundwater. The Na+/Cl vs. EC diagram plot is the indicator of evaporation (Figure 8a). The two chemical elements Na+ and Cl are moreover related to Halite dissolvance [72]. The ratio Na+/Cl < 1 indicates a Na+ content decrease related to its ion exchange with Ca2+ and Mg2+ in clays [73]. The increased ratio Na+/Cl (>1) refers to a none-halite source and indicates that the silicate weathering is the potential source of Na+. Figure 8a shows that the ratio of Na+/Cl lower than 1 (<1) is dominant and indicates that evaporation is the dominant process in the groundwater of the study area. Only four samples of cluster 1 present elevated values of Na+/Cl (12.9%), which indicates silicate weathering and 27 samples (87.1%) have a ratio >1 and the evaporation process. Fourteen samples of cluster 2 (29.9%) have a Na+/Cl ratio higher than one, and 33 samples (70.1%) have a Na+/Cl < 1. All the samples of cluster 3 have Na+/Cl ratio lower 1 and indicate that evaporation is dominated in this location.
The establishment of Plots between Na+ and Cl is helpful in controlling the salinization mechanism of groundwater. The halite dissolution gives rise to Na+ ions thus the resulting Na+/Cl molar ratio is close to one, indicating an obvious silicate weathering [74]. For the study area, the Na+ versus Cl plot (Figure 8b) is inferring that most of the points of clusters 1 and 2 are above the line of the freshwater evaporation and below the 1:1 section, and therefore are derived from a different anthropogenic background. The link between (Ca2+ + Mg2+) and (Na+ + K+) vs. the total cation concentration is typically used to confirm the silicate weathering process [11]. The association between calcium and magnesium ions and total cations reveals that fewer samples fall near to (Ca2+ + Mg2+) = 0.75 from the sum of cations line (Figure 8c), indicating that calcium and magnesium are much greater than potassium and sodium (Figure 8d). However, the majority of the calcium and magnesium in all clusters’ samples originates from the weathering of carbonate rocks.

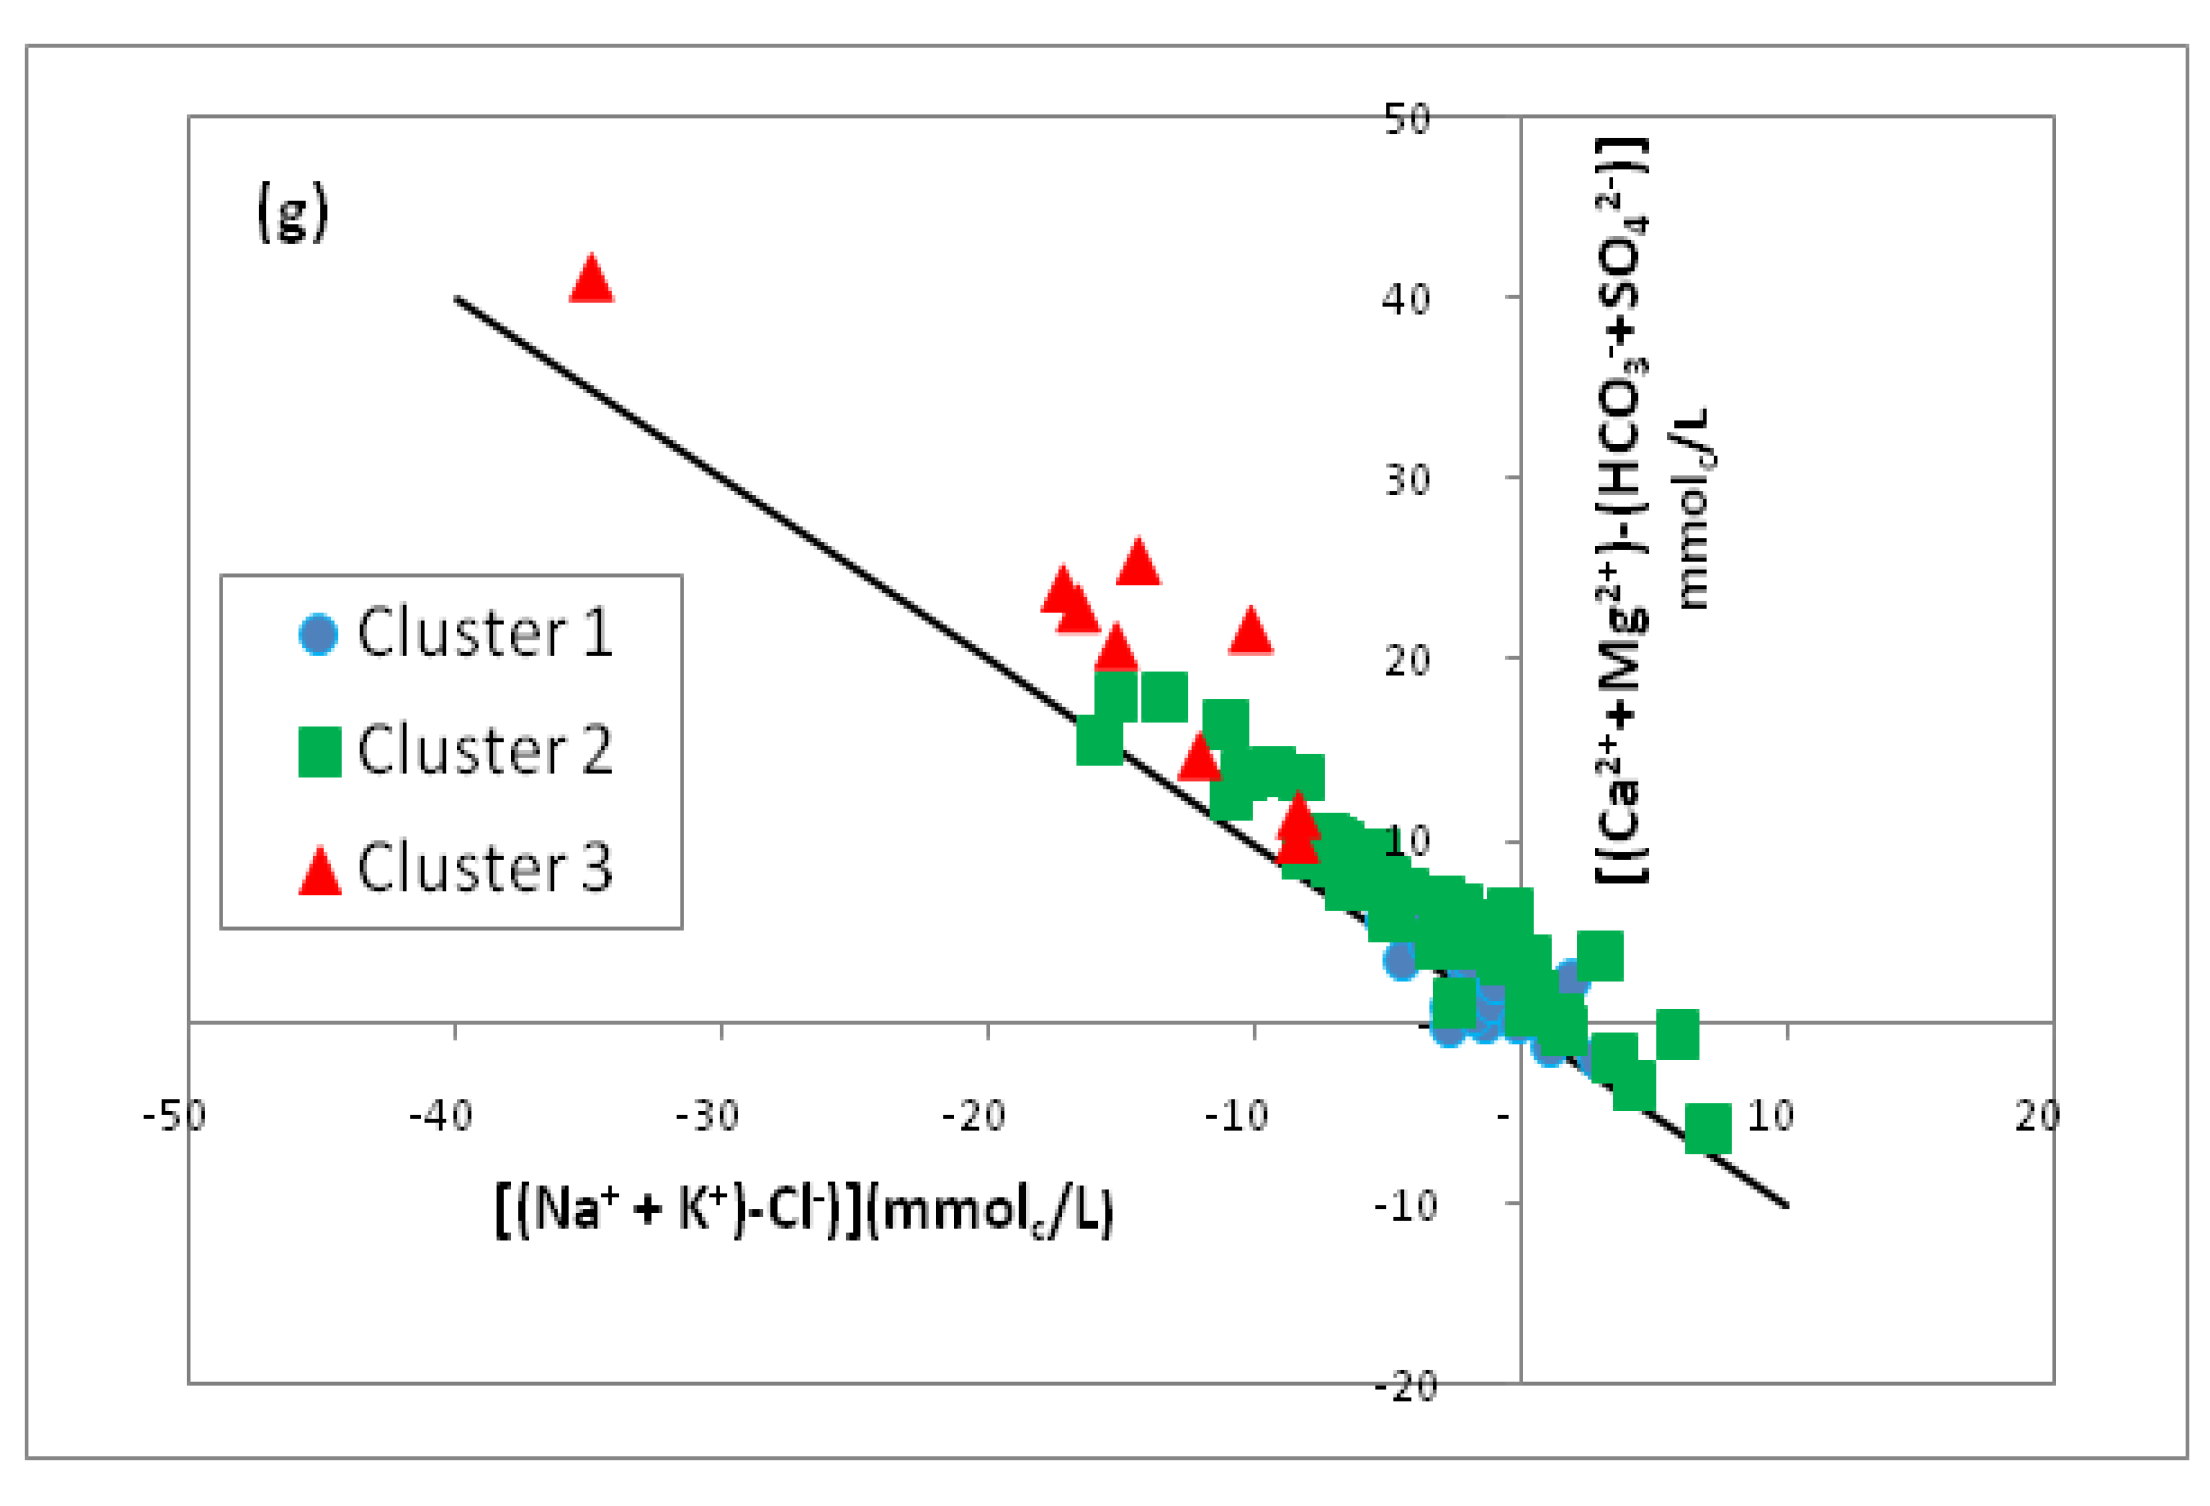
3.3.2. Ion Exchange Process

To further study the processes affecting calcium concentration, (Ca2+ + Mg2+) versus HCO3 were used in groundwater samples (Figure 9a). For carbonates, the most common weathering reaction is simple dissolution, and the Ca2+/ HCO3 ratio is equal to 0.5. The low Ca2+/ HCO3 molar ratio of 0.5 (<0.5) indicates that the calcium and magnesium in the water are enriched by the exchange of sodium and/or the exchange of cations in the clay or the HCO3 that can come from the weathering of the silicate. In contrast, the high ratio (>0.5) suggests other sources of Ca2+ and Mg2+, such as reverse ion exchange, observed in hard rock formations with increasing salinity [75,76]. The water samples of the three clusters in the study area are located on the upper side of the 1:1 intersection, indicating that the excess of (Ca2+ + Mg2+) is behind the dominant carbonate weathering and contributing to the Ca2+ and Mg2+ groundwater [77,78]. Due to the breakdown of the quaternary calcareous layer, the molar ratio of (Ca2+ + Mg2+) ranges between 2.7 and 59.5. As a result of this, Ca2+ and Mg2+ must be balanced with SO 4 2 and Cl (Figure 9c).
The established plot (Ca2+ + Mg2+) versus (SO42− + HCO3) defines three hydrogeochemical processes, mostly for samples at the 1:1 line, which are described by calcite and dolomite dissolution [79]. Figure 9b shows the distribution of the major samples on an equal line, indicating that the weathering degree of clay minerals, carbonates, and gypsum is relatively low, which is one of the mineralization factors of groundwater. The plot of Na+/Cl vs. Cl and (Ca2+ + Mg2+) vs. Cl (Figure 9d,e) shows that the salinity augments with the decrease in Na+/Cl and the increase in (Ca2+ + Mg2+), due to the reverse ion-exchange in the weathered clay layers [80]. Clay minerals have a boundary and negatively charged layered structure, on which the fixation and exchange of cations [81] occurs, as shown below:
Ca ( Mg ) Clay 2 + 2 Na + Ca 2 + ( Mg 2 + ) + Na Clay 2
A decrease in the (HCO3)/(Cl + SO42−) ratio versus EC (Figure 9f) is related the elevation in electrical conductivity. The samples are grouped in two different poles in the study area: the first one describes the samples at their primitive state. It is dominated by HCO3 [11]. The second pole has an EC lower than 1500 µS/cm with the dominance of Cl and SO42− ions characterizing an anthropogenic activity. The samples of this pole have EC > 1500 µS/cm, where human activities contribute to mineralization from many sources (agricultural practices, discharge of untreated sewage, etc.). This pole is dominated by samples from Cluster 2 and 3.
The creation of the bivariate plot from [(Ca2+ + Mg2+) − (HCO3+ SO42−)] versus [(Na+ + K+) − Cl] helped in studying the relationship between the ion exchange and reverse ion exchange processes [82]. In the present study, the obtained results are showing a controlled action of the reversed ion exchange process on the chemistry of the groundwater with a slope value of −1 (Figure 9g).

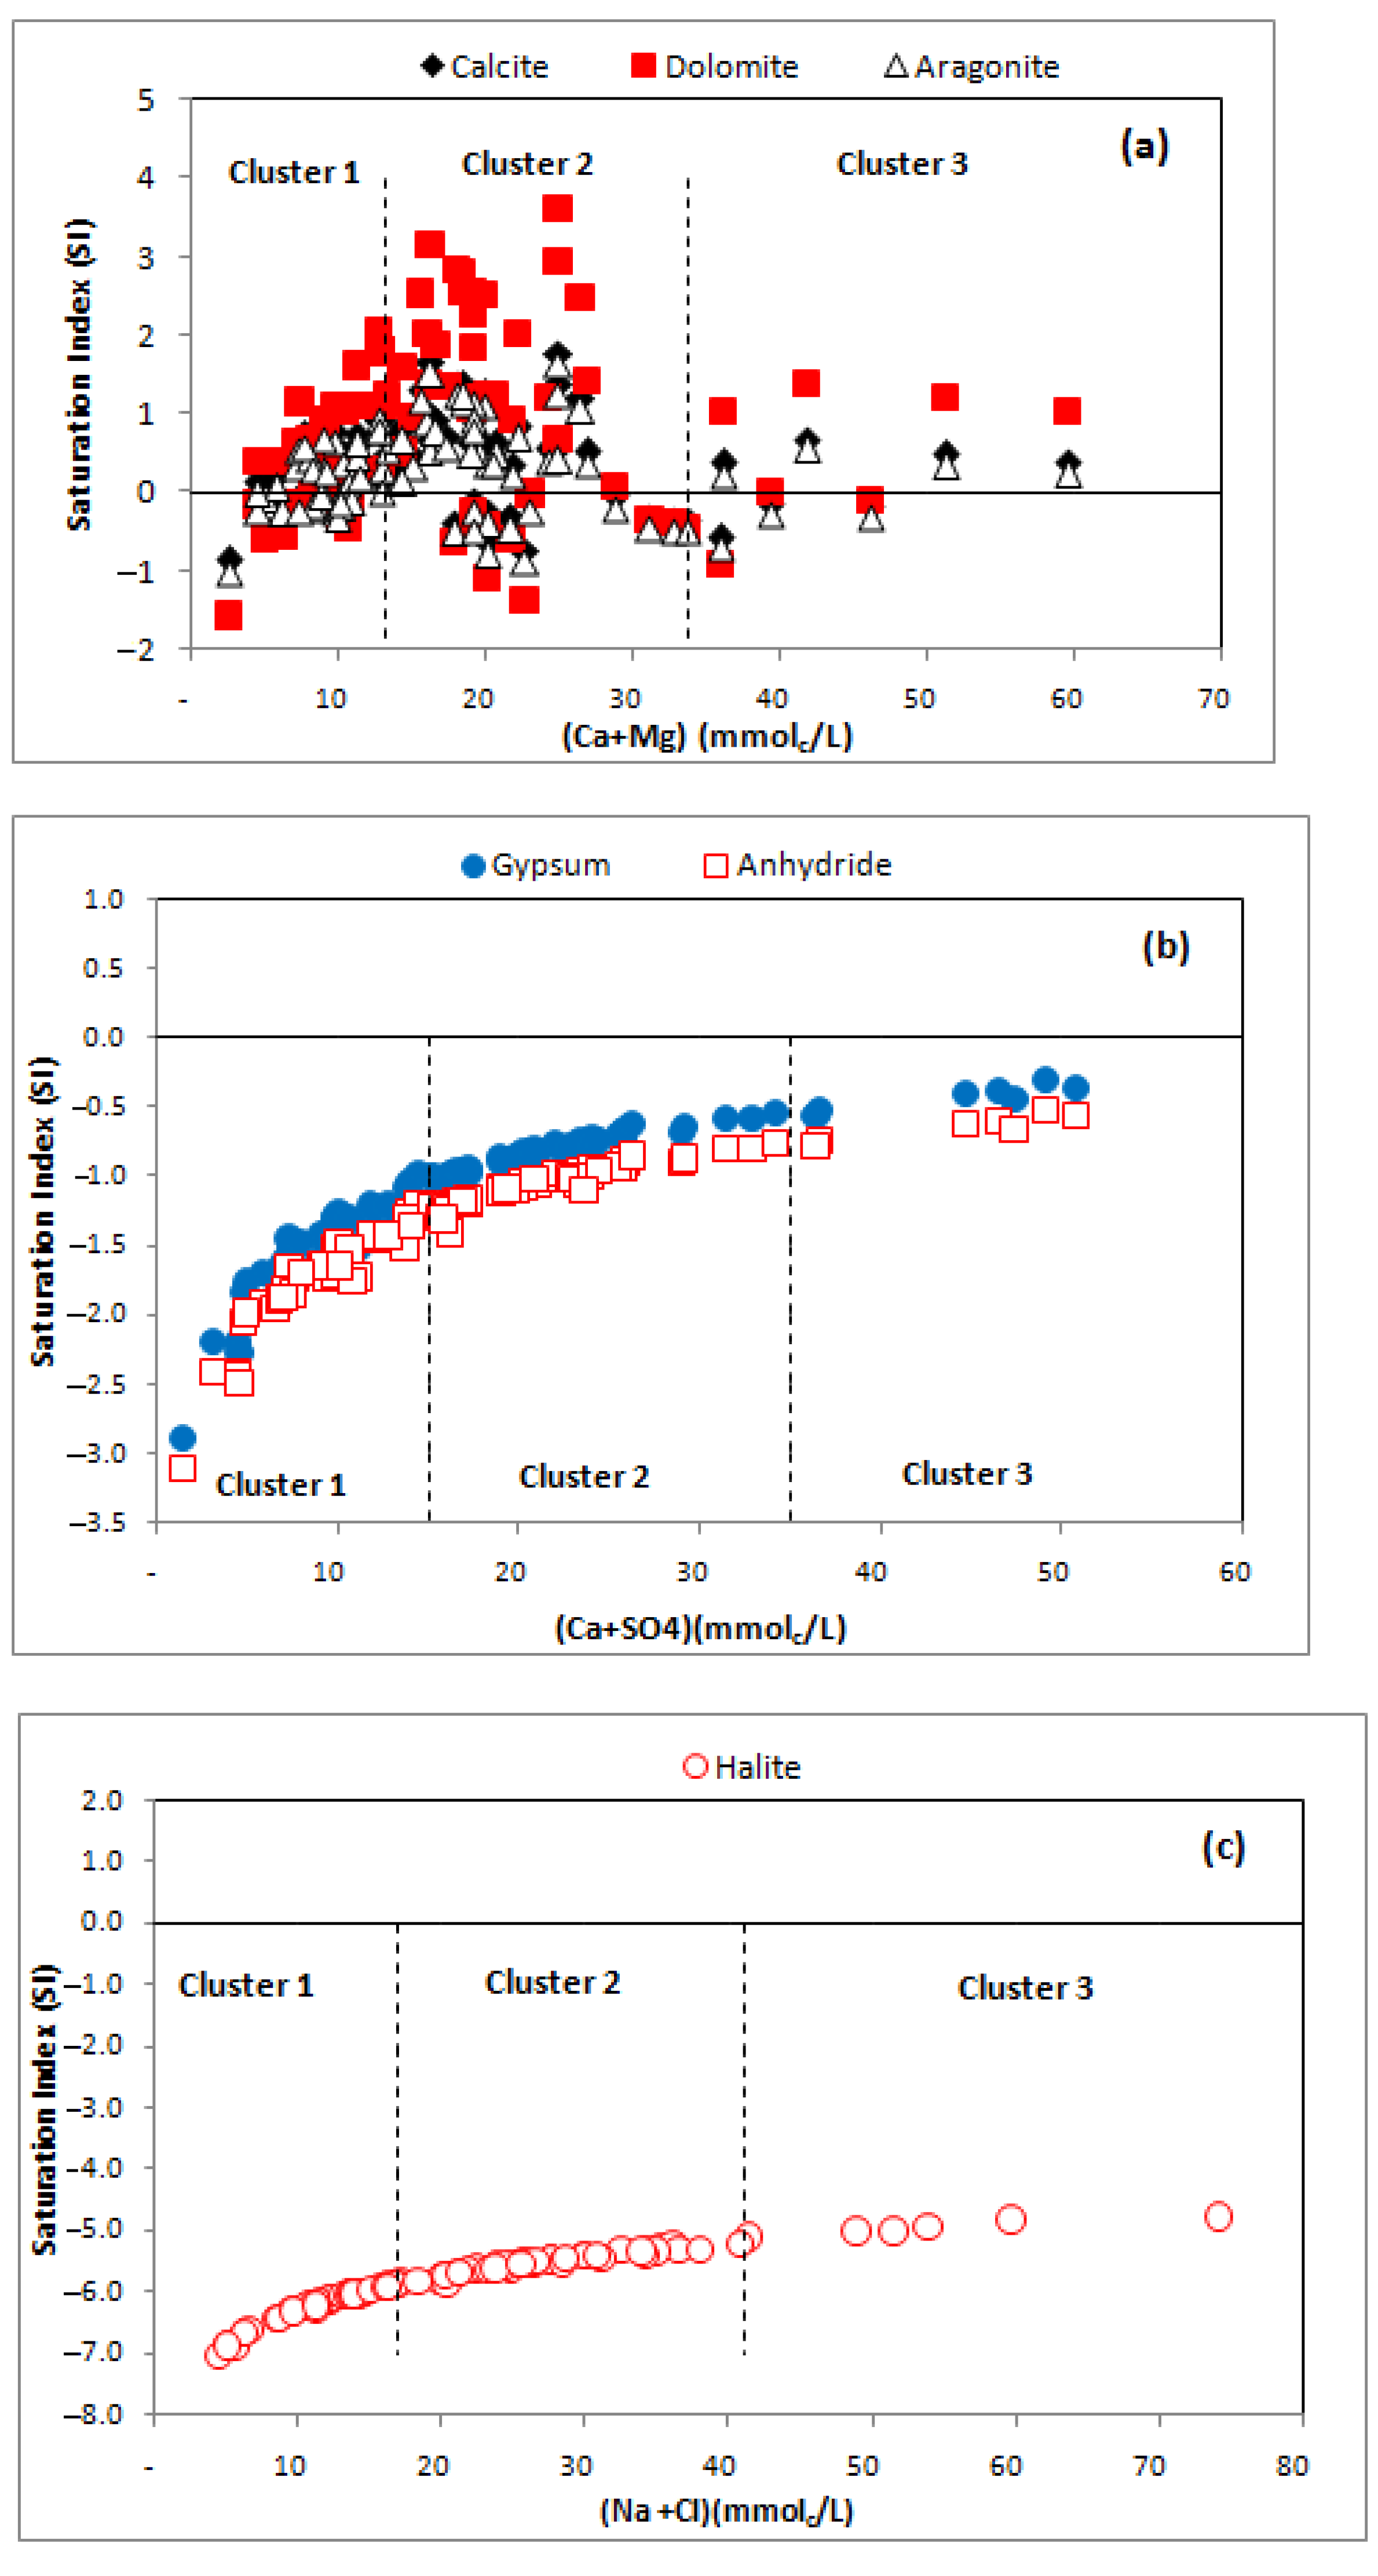
3.4. Geochemical Modelling

The determination of the groundwater geochemistry is based on the interacted action between the water and the aquifer’s mineral components. The use of SI to predict the reactive rock mineralogy from groundwater sampled data, eliminating the need to collect solid samples and to avoid mineralogy analysis. In this study, Table 3 presents the outputs of the SI calculation for the Calcite, Aragonite, Dolomite, Gypsum, Anhydrite, and Halite selected minerals. Positive SI values indicate oversaturation and mineral to precipitation from groundwater. The SI negative values refer to an under-saturation and thus mineral dissolution in the groundwater. The state of equilibrium occurs when the saturation index is between −0.5 and +0.5 and indicates that the mineral does not dissolve or precipitate in this groundwater [83]. The SI results indicate a precipitation tendency of carbonate minerals (calcite, aragonite and dolomite) in all clusters (Figure 10a). Given the high evaporation and low precipitation rates (<400 mm/year) in the study area, this is a reasonable record characterizing a deposition of aragonite, calcite and dolomite [13]. However, anhydrite, gypsum and halite (Figure 11b,c) are in a state of under-saturation, which states that the concentrations of their soluble components Na+, Cl, Ca2+ and SO42− do not require a mineral equilibrium [84], while anhydrite and gypsum minerals are on the way to equilibrium. Due to the nature of Na+, it exists in low concentrations compared to Cl, which can, on one hand, associate with clay minerals through an ion exchange process. On the other hand, the decrease in concentration of Na and increase in concentration of Ca returns mainly to the reverse ion-exchange that led to the minimized dissolution of gypsum [85].

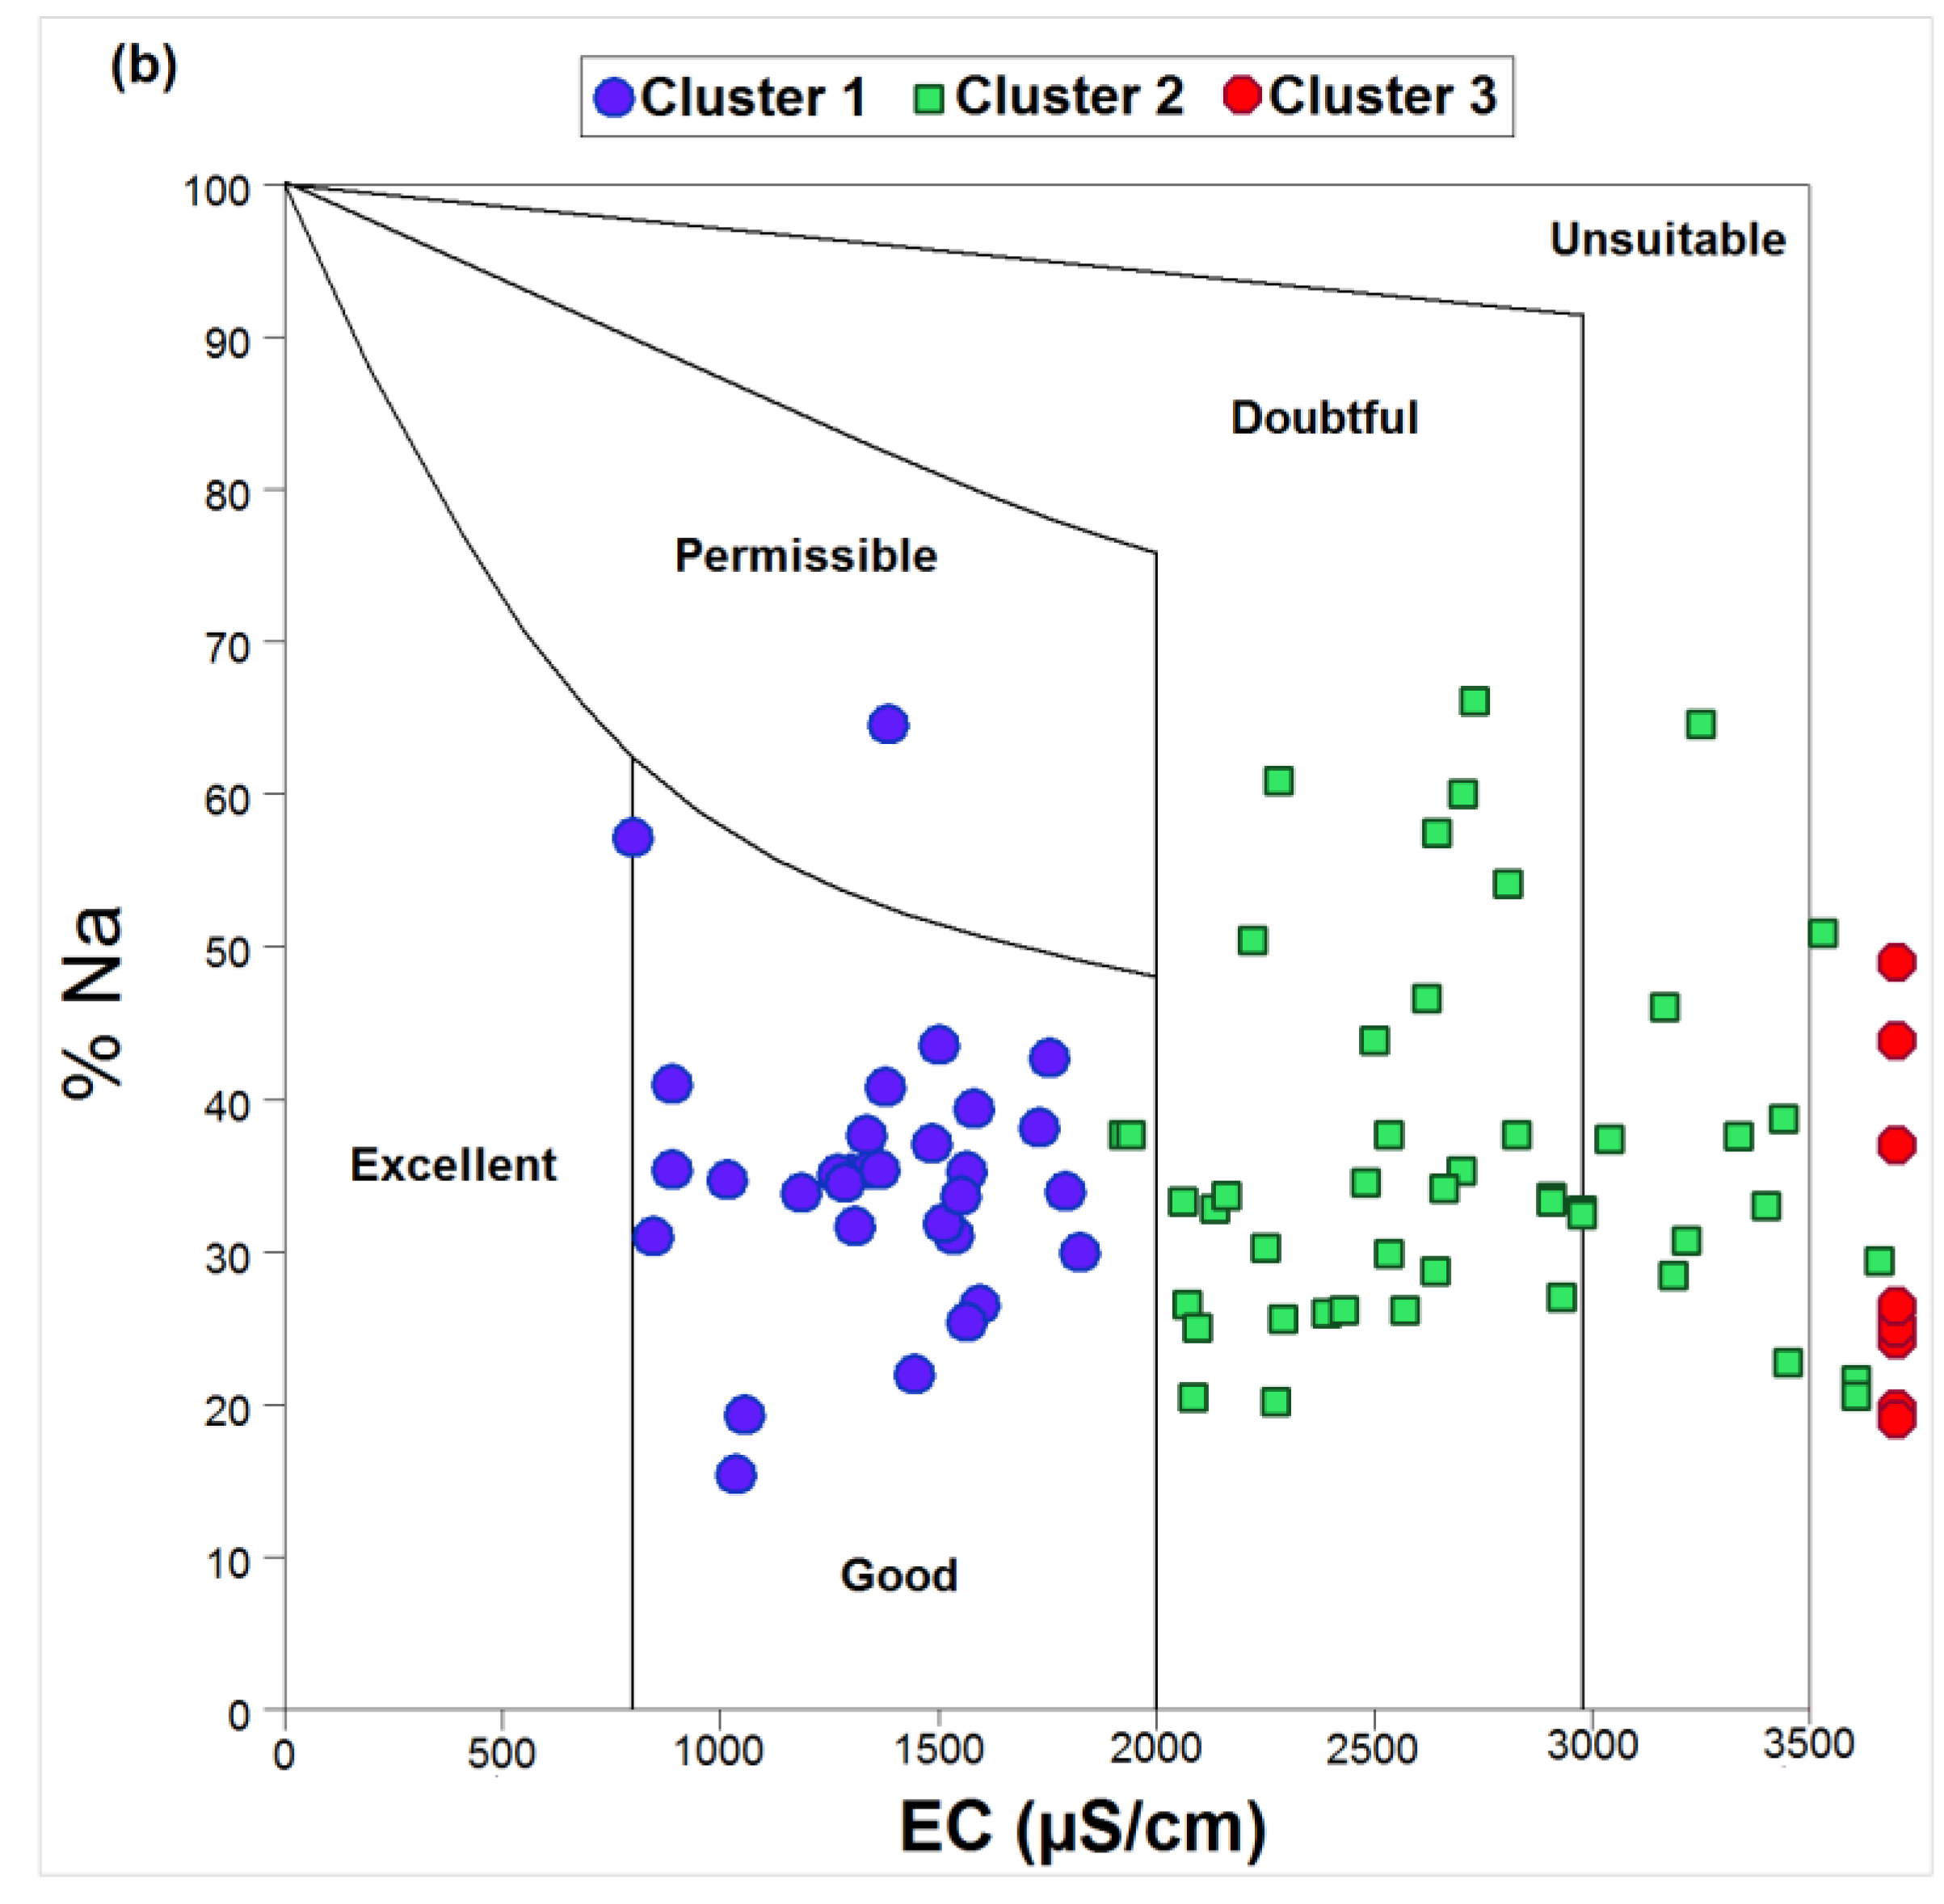
3.5. Assessment of Groundwater Irrigation Parameters

The adequacy of groundwater for irrigation is determined by comparing the risks of salinity and sodium concentration to the total cations in the system. The sodium concentration is expressed as a percentage of sodium (% Na) and a ratio of sodium adsorption (SAR), whilst salinity is expressed as electrical conductivity (EC) (Table 4). High salinity water tends to decrease the osmotic potential of irrigated plants over time. Meanwhile, the high concentrations in Na+ ion participates in a cation exchange process that affects the soil’s physical properties [86]. Many studies have shown that irrigation water enriched with Na+ leads to cation exchange reactions with a release of magnesium and calcium into the water. On the other hand, the use of water enriched with Ca2+ for irrigation leads to the release of Na+ ions and the preferential adsorption of Ca2+ ions at the cation exchange sites.
To determine the aptitude of groundwater for irrigation, EC is a very important key-parameter (Table 4). Hence, around 47.13% of the samples were admissible for irrigation in the study area (class C3). More than fifty samples were ranged from Doubtful class (C4: 44.83%) to Unsuitable class (C5: 8.04%), and no samples were Excellent class or good class (C1 and C2) for irrigation.This result shows that the high EC value affects the productivity of the plants (deficit in transpiration) and the structure of the soil. As a result, irrigation water with high EC rates diminishes crop production potential [68]. The sodium percentage (%Na) indicated that 72.41% of the samples are good quality for irrigation, while 17.24% are permissible for irrigation and 4.6% have doubtful quality. Meanwhile, five samples (5.75%) were considered as excellent quality. SAR values are in the range below 10, which according to SAR indicates excellent water and could be used for most soil types.
The irrigation parameters of %Na an SAR are expressed by following equations:
% Na   = ( Na + K Ca + Mg + Na + K ) × 100    
SAR = Na ( Ca + Mg ) 2  
Usually, the evaluation of water quality for irrigation is given using both a US salinity diagram and a Willox diagram (Figure 11); the first, the US salinity diagram, was proposed by the USSL [87], to show that the sodium adsorption ratio (SAR) has been plotted against the EC (Figure 11a). It is established using the DIGRAMME software.
According to Figure 11a, all the groundwater samples of cluster 1 belong to the categories C3S1. It is average to poor quality used with precautions and requires drainage, leaching and/or gypsum application. The samples of cluster 2 were ranged C4S1 (61.7%), C4S2 (34%), and C4S3 (4.3%). The quality of most samples (C4S1) is poor to bad water quality, to be used with caution for heavy soils and sensitive plants; the samples of C4S2 is qualified as very poor-quality water, and was used only for light and well-drained soils and for resistant plants with the necessity of leaching doses and/or gypsum contribution; the samples of C4S3 are very poor quality for irrigation. Most of the samples of cluster 3 (66.7%) fall into the field of C5S2; not recommended for irrigation.
The Willox diagram [68], which connects salt percentage and electrical conductivity values, demonstrates that, with the exception of one sample, the bulk of the groundwater samples are of excellent quality. Cluster 2 samples were 72.3% full in the dubious to inadequate (26.7 %) quality range. All of the samples in Cluster 3 are of poor quality (Figure 11b). The high sodium content in irrigation water causes it to be absorbed by clay particles, displacing Mg2+ and Ca2+ ions. The exchange of Na+ in water for Ca2+ and Mg2+ in soil affects soil permeability [88].

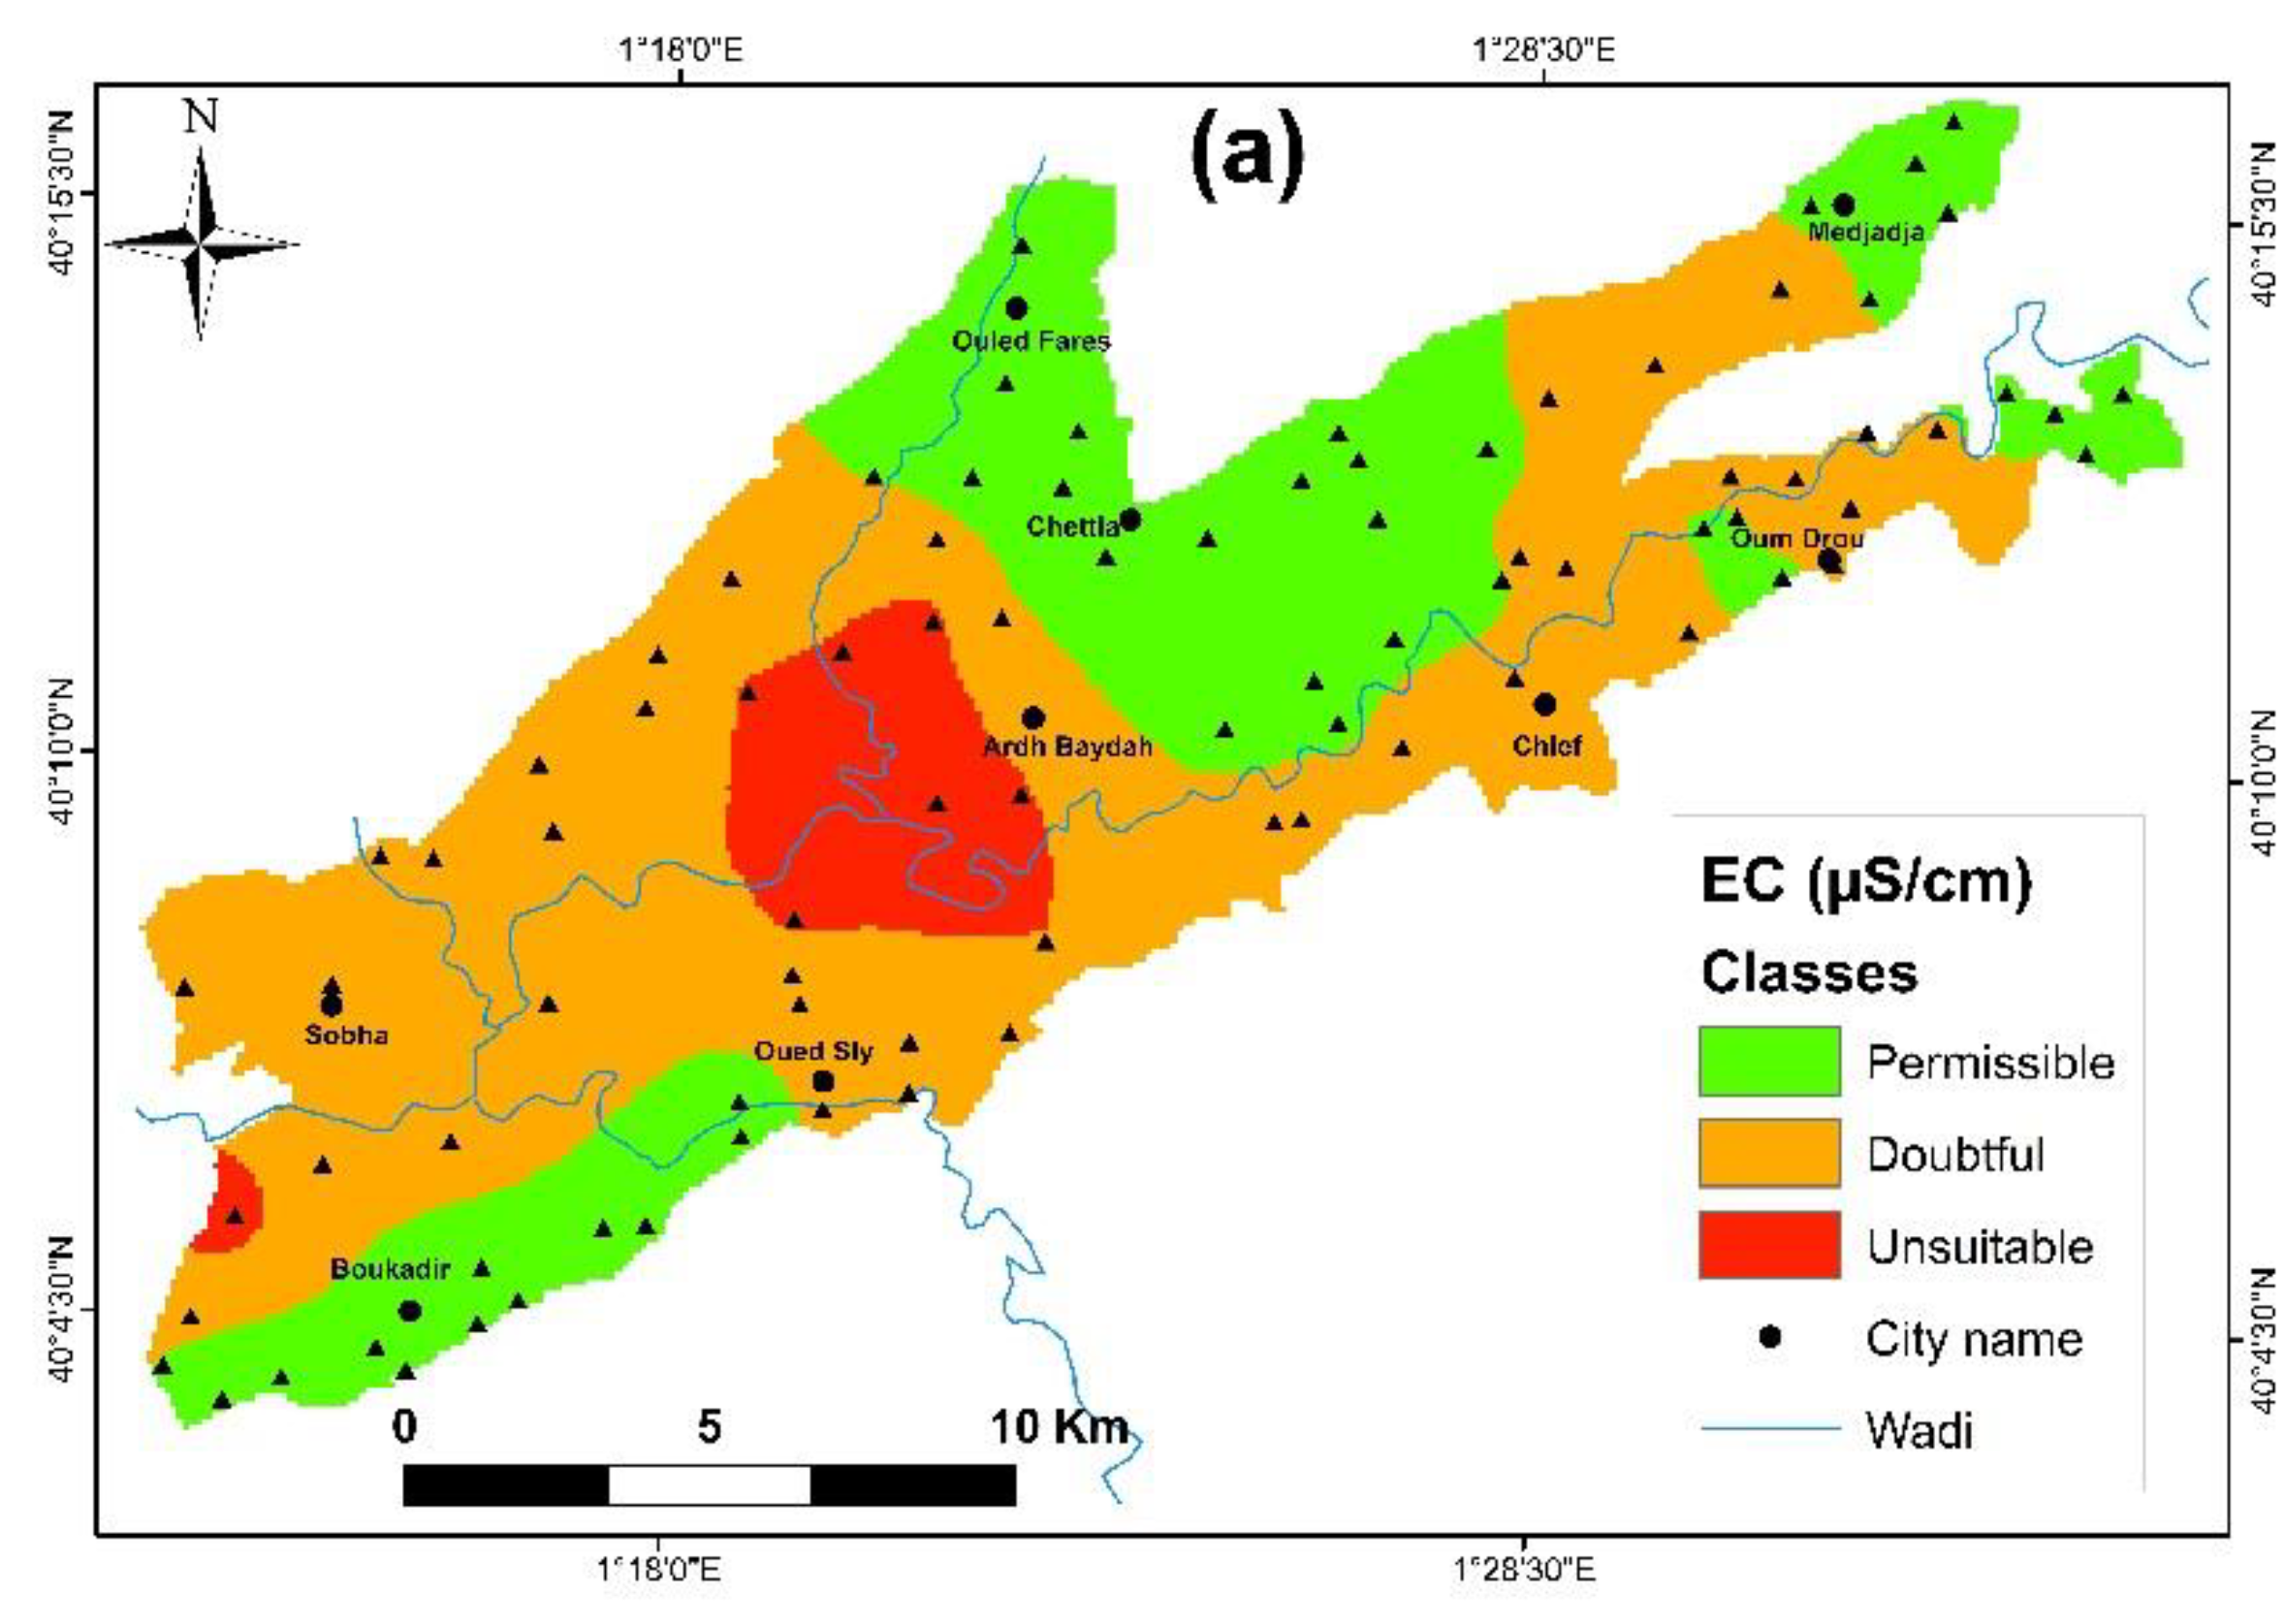
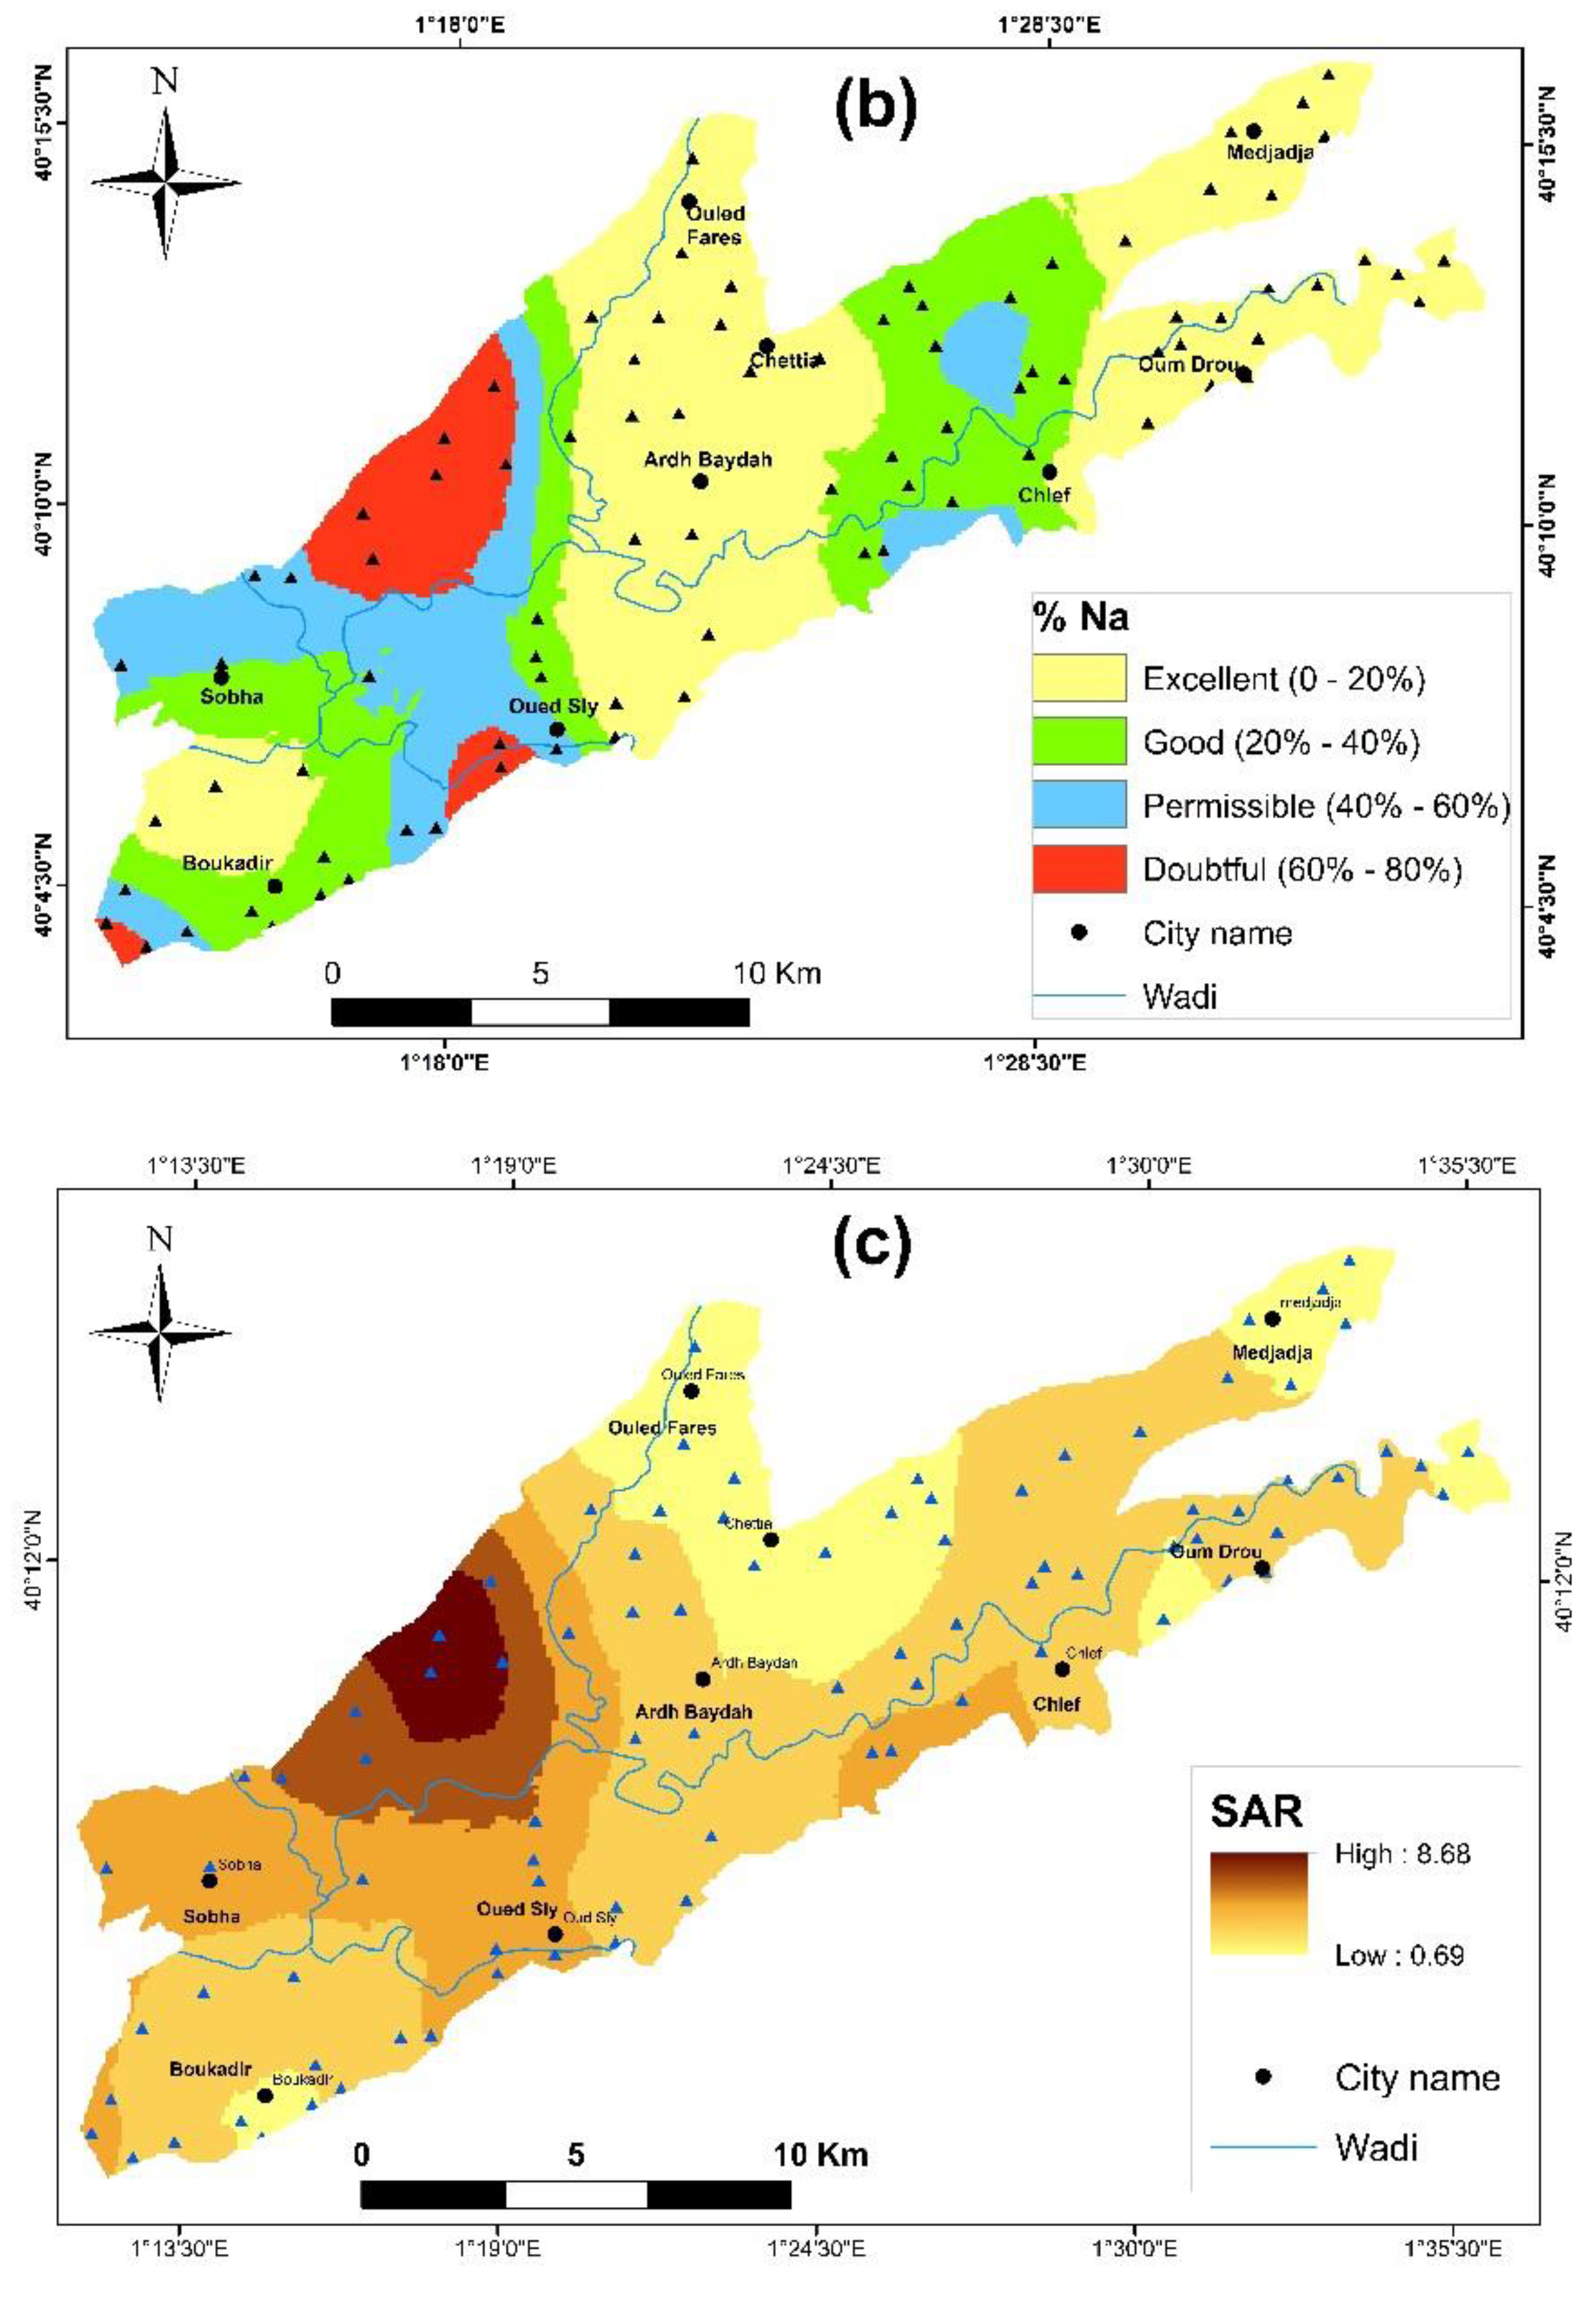
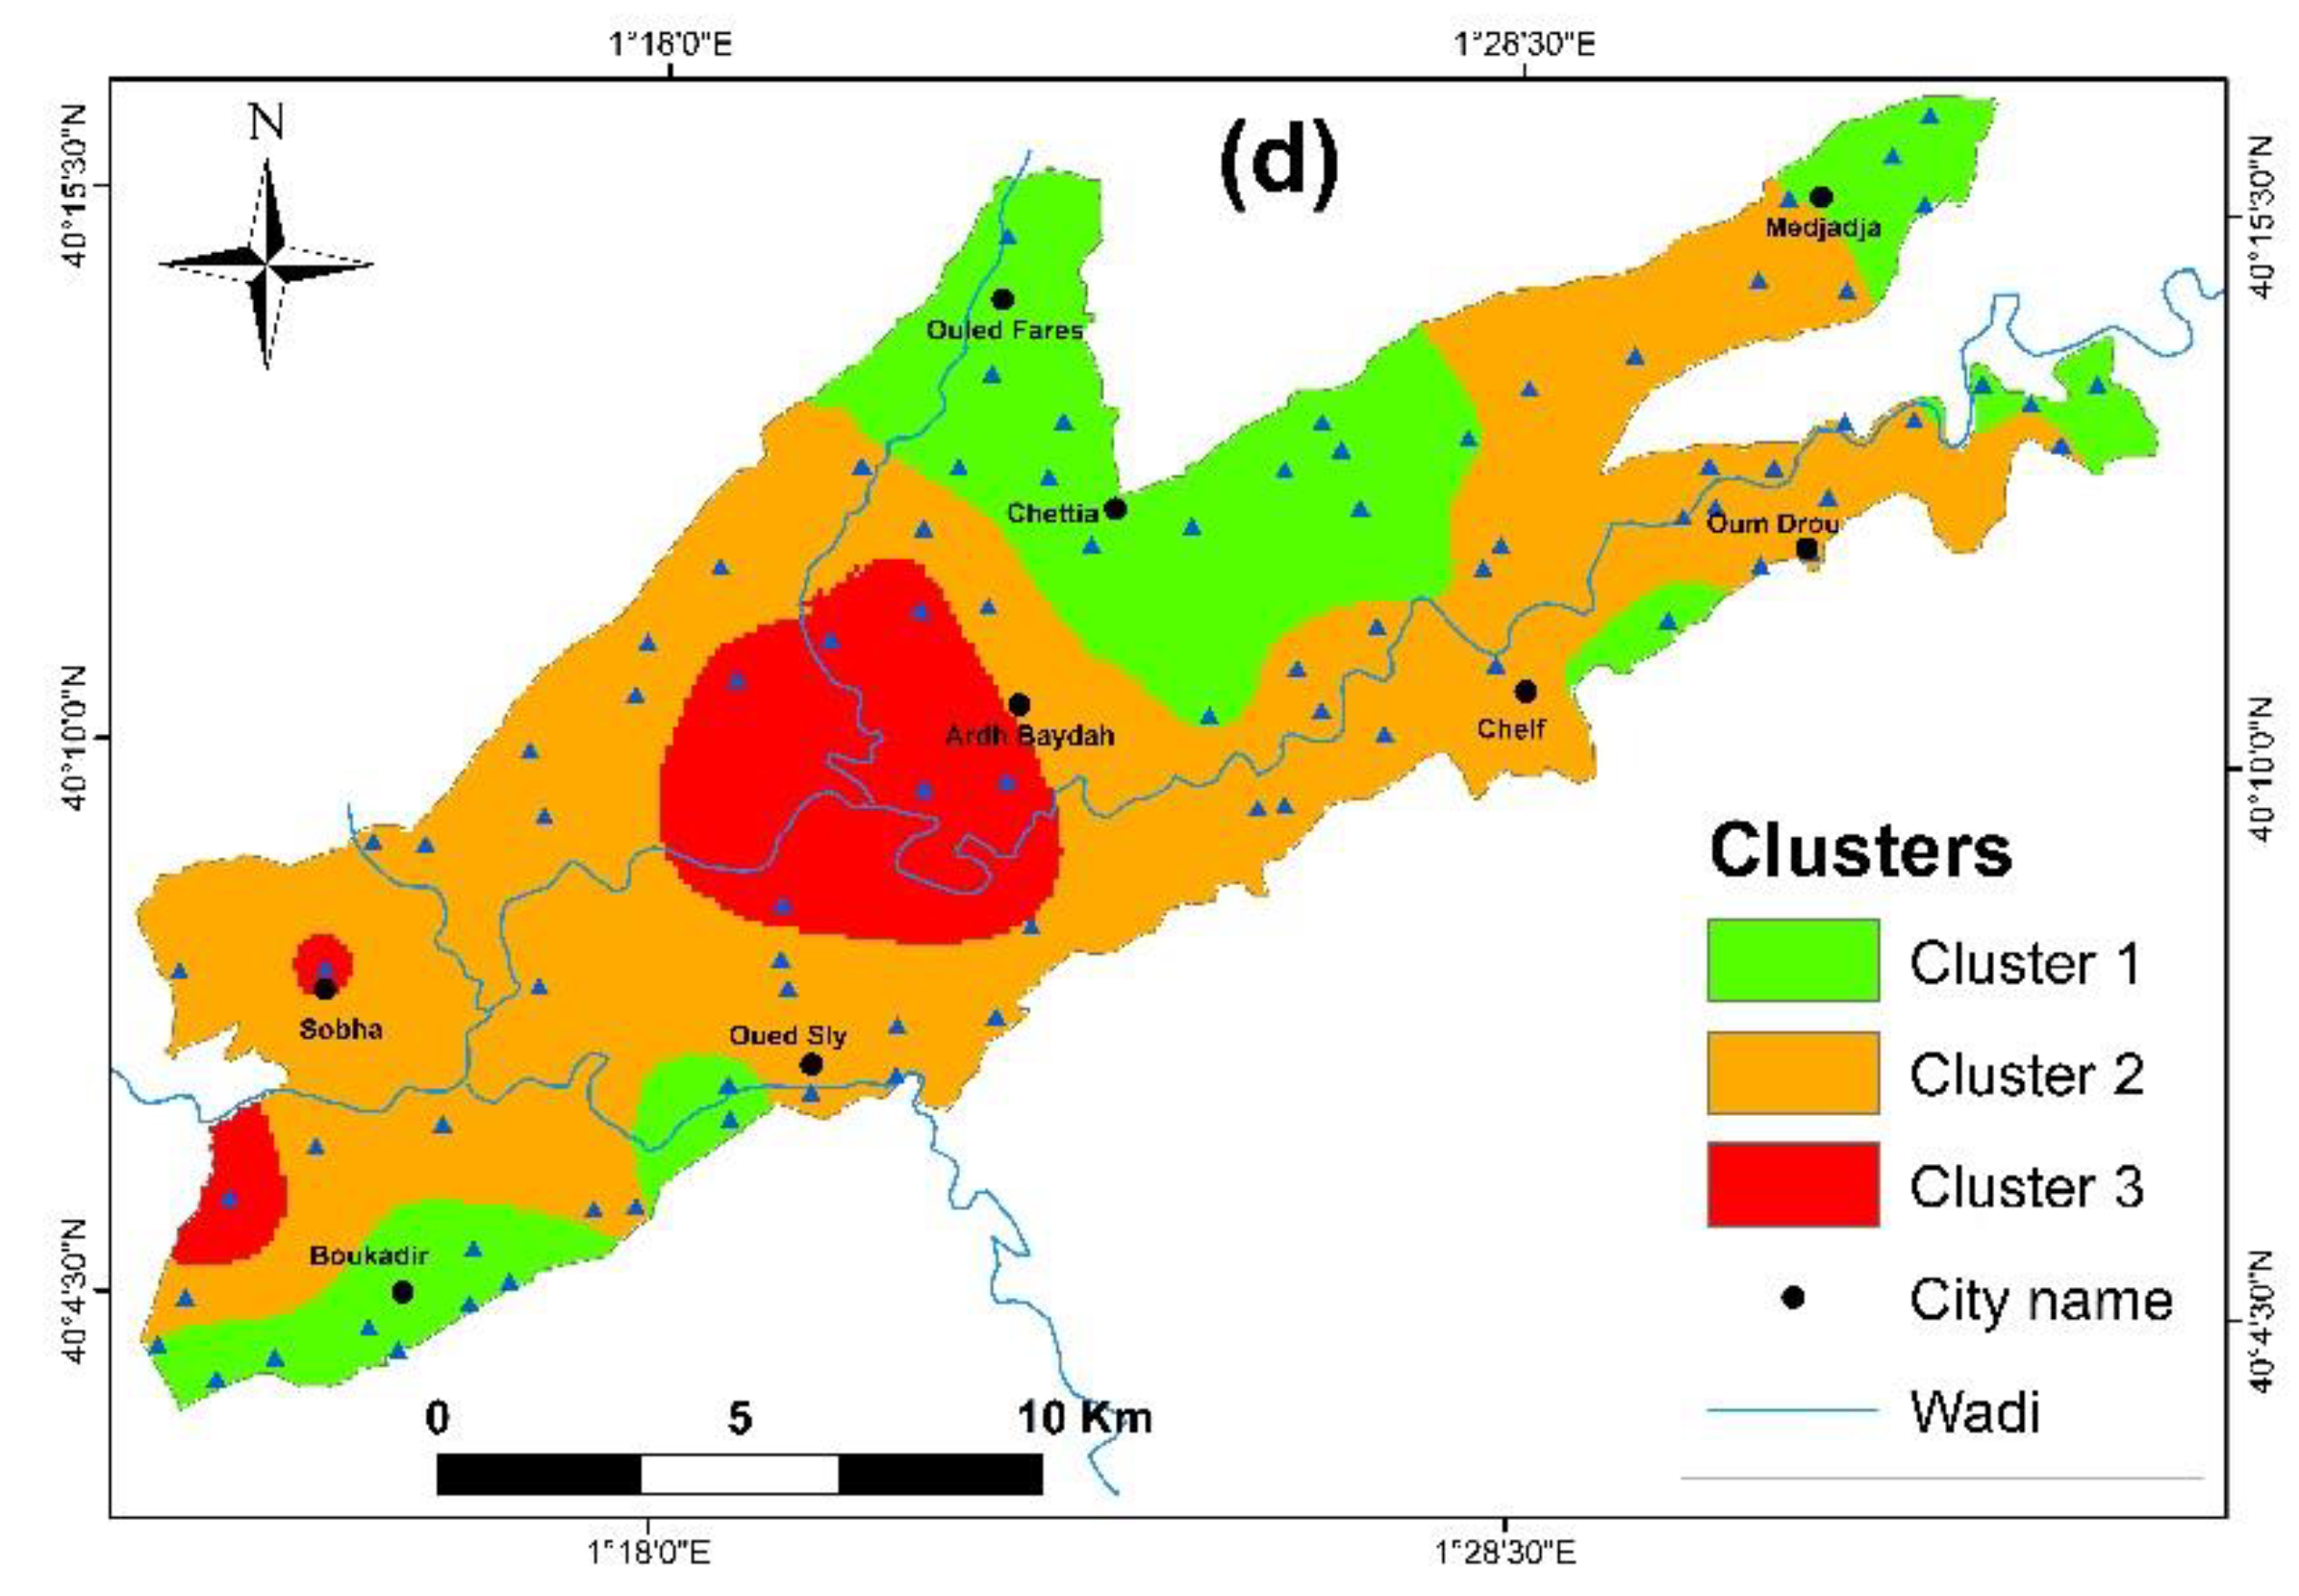
3.6. Geostatistical Modelling

The irrigation parameters of the studied water have been used for performing the Kriging interpolation. The best-fitted semi-variogram models were selected based on the nugget’s variance/sill ratio. There were three forms of spatial dependence considered in this study: strong when the ratio is less than 25%, mild when the ratio is between 25% and 75%, and weak when the ratio is greater than 75%. The mean error (ME) and root mean square standardized error (RMSSE) data are used to calculate the precision of the forecasts. The ME should be near zero, and the RMSSE should be close to one [38,89]. To assess the correctness of the interpolation, the cross-validation method was used. During cross-validation, each measured point is gradually deleted, and the value is predicted using the remaining data. The difference between each measured and predicted value is the error. Cross-validation can also be used to determine the best option [90].
According to Table 5, the EC parameter was fitted to the exponential semi-variogram model, %Na fitted Rational to the Quadratic model and SAR were feted to the Spherical model. Depending on the nuggets’ variance/sill ratio, EC has a strong structure of spatial dependence, while %Na and SAR have a moderate spatial structure. All three parameters were interpolated after transforming the dataset on logarithmic value.
The spatial distribution of the EC parameter (Figure 12a) shows the high salinity risk by groundwater irrigation. The water of doubtful quality (C4) is dominant, in particular in the south and northeastern part of the study area. Although, the north east of the study area has less EC values belonging to the permissible class (C3). The C5 class, is located in the center and a little to the west of the area and relies on very high salinity risk (EC > 5 dS/m). This class (C5) is located when there is excessive groundwater pumping (Figure 2), which, together with evaporation, is most likely the reason. The overlay analysis for %Na spatial distribution (Figure 12b) indicated that the upper part of the north-west and lower south-west zones had a higher concentration of %Na. This result is similar to the SAR distribution in the study area (Figure 12c). The lower concentration of SAR was observed mainly in the north-east part of the study area at the localities of Ouled Fares and Labidh Medjadja. Furthermore, the groundwater indicated calcium and magnesium precipitation in the form of calcite and dolomite (SI > 0). This can result in a reduction in the molality of Ca2+ and Mg2+. Due to evaporation, the value of SAR rises [91].

Combination of Factor Analysis and Geostatistical Modeling

In the current study, the estimation of spatial variability of the dominant factors retrieved their scores in the study area. The factor scores utilized in the study were taken from the PCA factor score coefficient matrix using standardized data for each water sample site. The OK technique is used to build spatial variability maps by an interpolation of the factor scores for each sampled point [20,44]. The spatial variability maps are generated. All the factor analysis was fitted to the Spherical model (Table 5). Factors 1 and 3 have strong spatial distribution dependence with nuggets’ variance/sill ratio <0.25. Factor 2 has weak spatial distribution dependence; the ratio is more than 0.75.
Figure 13a displays the distribution of Factor 1 scores in the study area. The central portion of the study area represents the high positive scores. The EC distribution map and the Factor 1 distribution pattern are genuinely similar for the study area (Figure 13a). This confirms that the interaction of the evaporation-water process in the aquifer is the determining factor of the overall groundwater chemistry in the study area and is behind the high scores of Factor 1.
The map representing the scores of factor 2 (Figure 13b) indicates high values to the northwestern and towards southeastern parts of the study area where the geologic processes enrich the aquifer with more carbonate and, thus, higher pH values in this location.
The factor 3 distribution map (Figure 13c) is under the effect of natural and anthropogenic processes with an increase in values from the west to the east in the study area. All the agricultural activities are mostly practiced in the center and eastern part of the study area (Figure 13c).
Another representation of groundwater quality from combining HCA and spatial analysis is cluster mapping using Mapping Clusters tools of ArcGIS software. This representation can show the locations of the cluster in the study area. Figure 13d shows the spatial distribution of the three clusters in the area. The groundwater quality for irrigation increasing from cluster 1 to cluster 3, the spatial distribution shows that cluster 2 is dominant in the study area, the cluster 1, qualified by good quality for irrigation, is located in the north area at the localities of Ouled fares and the southwest (BouKadir). Cluster 3, high risk, is located in the center and a small part in the north of Boukadir district to the extreme west of the WMCP.
Finally, these results have serious consequences on the environmental and agriculture sustenance of the study plain. Considering the increasing potential use of groundwater resources for irrigation, it will certainly lead to an important degradation risk of soil quality and endangering the crop yield, both in the short and long terms.

4. Conclusions

The triple combination of hydrogeochemical process, multivariate analysis and geostatistical modeling proved its usefulness in assessing the sustainability of irrigation groundwater in the agricultural plain of Western Middle-Cheliff, Northwest Algeria.
Three water types were extracted using a Q-mode cluster analysis based on the groundwater quality data sets. The first cluster represents the low salinity (EC = 1358.7 µS/cm) water sample and stretches to the north of the study area. The second one (Cluster 2) is dominant in the area. Also, a domination of Ca–Mg-Cl- SO42− facies in this cluster indicates a questionable salinity class C4 (EC = 2744.4 µ/cm). The third group (Cluster 3) has a high salinity level, is marked as unsuitable for irrigation (EC = 5843.3 µ/cm) and is dominated by Ca-Mg-Cl and SO42−.
The anionic concentrations of Cl and SO42− dominant in groundwater, as well as Ca2+ and Mg2+ from cationic abundances, show that alkaline earth (Ca2+ and Mg2+) outnumber alkali metals (Na+ and K+), and strong acids (Cl and SO42−) outnumber weak acids (HCO3, CO3). The hydrogeochemical mechanisms that influence groundwater chemistry have been dominated by reverse ion exchange. For evaporating minerals, all water groups are under-saturated. Carbonate minerals, on the other hand, are over-rated in all clusters.
The Varimax and PCA approaches produced three PCs that are said to account for more than 84 percent of the total variance. Both PC1 and PC2 discovered that the geogenic process has attacked the groundwater hydrogeochemical composition, in which the dissolution of carbonate and evaporated rocks, as well as reverse ion exchange and weathering processes, are included. The PC3 gene is connected to farming operations, in which irrigation becomes more frequent during the plant’s development phase.
Using ordinary kriging of geostatistical analysis, the geographical distribution maps for groundwater irrigation parameters indicated a significant spatial structure for EC and a moderate spatial structure for Na and SAR. The EC distribution map reveals that the uncertain quality (C4) predominates, particularly in the research area’s south and northeast. The class C5 is located in the plain’s center and is impacted by the region’s heavy pumpage as well as the evaporation process. The precipitation of Ca2+ and Mg2+ can raise the value of SAR (>10) in the investigated region.
The combination of PCA and the geostatistical modeling to assess groundwater suitability for irrigation was based on the factor scores in each groundwater monitored well. They are injected as variables in the OK method creating various surfaces and displaying the range and the rate of groundwater quality influenced by these common factors. The spatial distribution of Factor 1 seems strong and it is similar to the EC parameter spatial distribution in the area. This EC factor characterizes the groundwater mineralization. Factor 3 distribution reflects the recourse to irrigation at the actual time of the plant’s development. The obtained cluster map shows their spatial distribution along the area.
The pairing of geostatistical modeling and multivariate statistical methods in the evaluation of groundwater sustenance for irrigation provides a powerful and effective tool for studying and analyzing common factors of uncertainty and completing any long-term monitoring data analysis, particularly for datasets collected at large-scale regions. The current findings will aid future studies on environmental clean-up, pollution prevention, natural variation, and the implementation of water management initiatives.

Author Contributions

Conceptualization, A.B. and I.Y.; methodology, A.B.; software, A.B.; validation, M.A.A., A.D. and A.G.; formal analysis, A.B.; investigation, I.Y.; resources, X.C.; data curation, M.A.A.; writing—original draft preparation, A.B.; writing—review and editing, I.Y.; visualization, A.D.; supervision, A.G.; project administration, X.C.; funding acquisition, A.G. All authors have read and agreed to the published version of the manuscript.

Funding

This work was supported in part by the International Cooperation Project of National Natural Science Foundation of China under Grant 41761144079, in part by the Strategic Priority Research Program of the Chinese Academy of Sciences, the Pan-Third Pole Environment Study for a Green Silk Road under Grant XDA20060303, in part by the K. C.Wong Education Foundation under Grant GJTD-2020-14, in part by the Research Fund for International Scientists of National Natural Science Foundation of China under Grant 42150410393, in part by the CAS PIFI Fellowship under Grant 2021PC0002, in part by the Xinjiang Tianchi Hundred Talents Program under Grant Y848041, in part by the CAS Interdisciplinary Innovation Team under Grant JCTD-2019-20, in part by the project of the Research Center of Ecology and Environment in Central Asia under Grant Y934031, and in part by the Regional Collaborative Innovation Project of Xinjiang Uygur Autonomous Regions under Grant 2020E01010.

Data Availability Statement

The authors in this study did not consent to their data being shared publicly.

Acknowledgments

The authors present their thanks and gratitudes to the DGRSDT “General Directory of Scientific Research and Technological Development” for the continous support and encouragement.

Conflicts of Interest

The authors declare no conflict of interest.

References

  1. Shah, T. Groundwater Governance and Irrigated Agriculture; Paper No. 19; Global Water Partnership (GWP): Stockholm, Sweden, 2014; p. 67. [Google Scholar]
  2. Kuper, M.; Fayssen, N.; Hammani, A.; Hartani, T.; Marlet, S.; Hamamouche, M.F.; Ameur, F. Liberation or Anarchy? The Janus Nature of Groundwater Use on North Africa’s New Irrigation Frontiers. In Integrated Groundwater Management: Concepts, Approaches and Challenges; Jakeman, A.J., Barreteau, O., Hunt, R.J., Rinaudo, J.D., Ross, A., Eds.; Springer: Dordrecht, The Netherlands, 2016; pp. 583–615. [Google Scholar]
  3. Goyal, S.K.; Chaudhary, B.S.; Singh, O.; Sethi, G.K.; Thakur, P.K. GIS based spatial distribution mapping and suitability evaluation of groundwater quality for domestic and agricultural purpose in Kaithal district, Haryana state, India. Environ. Earth Sci. 2010, 61, 1587–1597. [Google Scholar] [CrossRef]
  4. Jangam, C.M.; Sanam, S.R.; Chaturvedi, M.K.; Padmakar, C.; Pujari, P.R.; Labhasetwar, P.K. Impact assessment of on-site sanitation system on groundwater quality in alluvial settings: A case study from Lucknow city in North India. Environ. Monit. Assess. 2015, 187, 614. [Google Scholar] [CrossRef] [PubMed]
  5. Alexakis, D.E. Meta-Evaluation of Water Quality Indices. Application into Groundwater Resources. Water 2020, 12, 1890. [Google Scholar] [CrossRef]
  6. Zhang, Q.; Zhou, B.; Dong, F.; Liu, Z.; Ostovari, Y. Spatial Variability of Groundwater Quality for Freshwater Production in a Semi-Arid Area. Water 2021, 13, 3024. [Google Scholar] [CrossRef]
  7. Vasanthavigar, M.; Srinivasamoorthy, K.; Vijayaragavan, K.; Rajiv Ganthi, R.; Chidambaram, S.; Anandhan, P.; Manivannan, R.; Vasudevan, S. Application of water quality index for groundwater quality assessment: Thirumanimuttar sub-basin, Tamilnadu, India. Environ. Monit. Assess. 2010, 171, 595–609. [Google Scholar] [CrossRef] [PubMed]
  8. Belkhiri, L.; Boudoukha, A.; Mouni, L.; Baouz, T. Multivariate Statistical Characterization of Groundwater Quality in Ain Azel Plain, Algeria. Afr. J. Environ. Sci. Technol. 2010, 4, 526–534. [Google Scholar]
  9. Chebbah, M.; Allia, Z. Geochemistry and hydrogeochemical process of groundwater in the Souf valley of Low Septentrional Sahara, Algeria. Afr. J. Environ. Sci. Technol. 2015, 9, 261–273. [Google Scholar] [CrossRef]
  10. Bouderbala, A.; Remini, B.; Saaed Hamoudi, A.; Antonio Pulido-Bosch, A. Application of Multivariate Statistical Techniques for Characterization of Groundwater Quality in the Coastal Aquifer of Nador, Tipaza (Algeria). Acta Geophys. 2016, 64, 670–693. [Google Scholar] [CrossRef] [Green Version]
  11. Bouderbala, A.; Gharbi, B.Y. Hydrogeochemical characterization and groundwater quality assessment in the intensive agricultural zone of the Upper Cheliff plain, Algeria. Environ. Earth Sci. 2017, 76, 744. [Google Scholar] [CrossRef]
  12. Slimani, R.; Guendouz, A.; Trolard, F.; Moulla, A.S.; Hamdi-Aïssa, B.; Bourrié, G. Identification of dominant hydrogeochemical processes for groundwaters in the Algerian Sahara supported by inverse modeling of chemical and isotopic data. Hydrol. Earth Syst. Sci. 2017, 21, 1669–1691. [Google Scholar] [CrossRef] [Green Version]
  13. Bouteraa, O.; Mebarki, A.; Bouaicha, F.; Nouaceur, Z.; Laignel, B. Groundwater quality assessment using multivariate analysis, geostatistical modeling, and water quality index (WQI): A case of study in the Boumerzoug-El Khroub valley of Northeast Algeria. Acta Geochim. 2019, 38, 796–814. [Google Scholar] [CrossRef]
  14. Bouaicha, F.; Dib, H.; Bouteraa, O.; Manchar, N.; Boufaa, K.; Chabour, N.; Demdoum, A. Geochemical assessment, mixing behavior and environmental impact of thermal waters in the Guelma geothermal system, Algeria. Acta Geochim. 2019, 38, 683–702. [Google Scholar] [CrossRef]
  15. Bouteldjaoui, F.; Bessenasse, M.; Kettab, A.; Scheytt, T. Combining geology, hydrogeology and groundwater flow for the assessment of groundwater in the Zahrez Basin, Algeria. Arab. J. Geosci. 2019, 12, 804. [Google Scholar] [CrossRef]
  16. Kouadra, R.; Demdoum, A.; Chabour, N. The use of hydrogeochemical analyses and multivariate statistics for the characterization of thermal springs in the Constantine area, Northeastern Algeria. Acta Geochim. 2019, 38, 292–306. [Google Scholar] [CrossRef]
  17. Kouadra, R.; Demdoum, A. Hydrogeochemical characteristics of groundwater and quality assessment for the purposes of drinking and irrigation in Bougaa area, Northeastern Algeria. Acta Geochim. 2020, 39, 642–654. [Google Scholar] [CrossRef]
  18. Medjani, F.; Djidel, M.; Labar, S.; Bouchagoura, L.; Rezzag Bara, C. Groundwater physico-chemical properties and water quality changes in shallow aquifers in arid saline wetlands, Ouargla, Algeria. Appl. Water Sci. 2021, 11, 82. [Google Scholar] [CrossRef]
  19. Barkat, A.; Bouaicha, F.; Bouteraa, O.; Mester, T.; Ata, B.; Balla, D.; Rahal, Z.; Szabó, G. Assessment of Complex Terminal Groundwater Aquifer for Different Use of Oued Souf Valley (Algeria) Using Multivariate Statistical Methods, Geostatistical Modeling, and Water Quality Index. Water 2021, 13, 1609. [Google Scholar] [CrossRef]
  20. Francisco, S.M.; Jiménez-Espinosa, R.; Pulido-Bosch, A. Mapping groundwater quality variables using PCA and geostatistics: A case study of Bajo Andarax, southeastern Spain. Hydrol. Sci. J. 2001, 46, 227–242. [Google Scholar]
  21. Hao, Z.; Duoxi, Y.; Haifeng, L.; Ningning, Z.; Liang, X. Application of principal component analysis and Bayes discrimination approach in water source identification. Coal. Geol. Explor. 2017, 45, 87–93. [Google Scholar]
  22. Singh, K.P.; Malik, A.; Mohan, D.; Sinha, S. Multivariate statistical techniques for the evaluation of spatial and temporal variationsin water quality of Gomti River (India)—A case study. Water Res. 2004, 38, 3980–3992. [Google Scholar] [CrossRef]
  23. Singh, C.K.; Kumar, A.; Shashtri, S.; Kumar, A.; Kumar, P.; Mallick, J. Multivariate statistical analysis and geochemical modeling for geochemical assessment of groundwater of Delhi, India. J. Geochem. Explor. 2017, 17, 59–71. [Google Scholar]
  24. Mohamed, I.; Othman, F.; Ibrahim, A.I.N.; Alaa-Eldin, M.E.; Yunus, R.M. Assessment of water quality parameters using multivariate analysis for Klang River basin, Malaysia. Environ. Monit. Assess. 2015, 187, 4182. [Google Scholar] [CrossRef]
  25. Alberto, W.D.; Del Pilar, D.M.; Valeria, A.M.; Fabiana, P.S.; Cecilia, H.A.; De Los Angeles, B.M. Pattern recognition techniques for theevaluation of spatial and temporal variations in water quality. A case study: Suquıa River Basin (Cordoba-Argentina). Water Res. 2001, 35, 2881–2894. [Google Scholar] [CrossRef]
  26. Selvakumar, S.; Chandrasekar, N.; Srinivas, Y.; Selvam, S.; Kaliraj, S.; Magesh, N.S.; Venkatramanan, S. Hydrogeochemical processes controlling the groundwater salinity in the coastal aquifers of Southern Tamil Nadu, India. Mar. Pollut. Bull. 2022, 174, 113264. [Google Scholar] [CrossRef]
  27. Chen, K.; Liu, Q.; Peng, W.; Liu, X. Source apportionment and natural background levels of major ions in shallow groundwater using multivariate statistical method: A case study in Huaibei Plain, China. J. Environ. Manag. 2022, 301, 113806. [Google Scholar] [CrossRef]
  28. Azzellino, A.; Colombo, L.; Lombi, S.; Marchesi, V.; Piana, A.; Andrea, M.; Alberti, L. Groundwater diffuse pollution in functional urban areas: The need to define anthropogenic diffuse pollution background levels. Sci. Total Environ. 2019, 656, 1207–1222. [Google Scholar] [CrossRef]
  29. Pereira, H.G.; Renca, S.; Sataiva, J. A case study on geochemical anomaly identification through principal component analysis supplementary projection. Appl. Geochem. 2003, 18, 37–44. [Google Scholar] [CrossRef] [Green Version]
  30. Love, D.; Hallbauer, D.; Amos, A.; Hranova, R. Factor analysis as a tool in groundwater quality management: Two Southern Africancase studies. Phys. Chem. Earth 2004, 29, 1135–1143. [Google Scholar]
  31. Meng, S.X.; Maynard, J.B. Use of statistical analysis to formulate conceptual models of geochemical behavior: Water chemical data from the Botucatu aquifer in Sao Paulo state. Braz. J. Hydrol. 2001, 250, 78–97. [Google Scholar] [CrossRef]
  32. Chen, L.; Feng, Q. Geostatistical analysis of temporal and spatial variations in groundwater levels and quality in the Minqin oasis, Northwest China. Environ. Earth Sci. 2013, 70, 1367–1378. [Google Scholar] [CrossRef]
  33. Venkatramanan, S.; Chung, S.Y.; Kim, T.H.; Kim, B.W.; Selvam, S. Geostatistical techniques to evaluate groundwater contamination and its sources in Miryang City, Korea. Environ. Earth Sci. 2016, 75, 994. [Google Scholar] [CrossRef]
  34. Shadrin, D.; Nikitin, A.; Tregubova, P.; Terekhova, V.; Jana, R.; Matveev, S.; Pukalchik, M. An Automated Approach to Groundwater Quality Monitoring—Geospatial Mapping Based on Combined Application of Gaussian Process Regression and Bayesian Information Criterion. Water 2021, 13, 400. [Google Scholar] [CrossRef]
  35. El Baba, M.; Kayastha, P.; Huysmans, M.; De Smedt, F. Evaluation of the Groundwater Quality Using the Water Quality Index and Geostatistical Analysis in the Dier al-Balah Governorate, Gaza Strip, Palestine. Water 2020, 12, 262. [Google Scholar] [CrossRef] [Green Version]
  36. Ben Moussa, A.; Chandoul, S.; Mzali, H.; Bel Haj Salem, S.; Elmejri, H.; Zouari, K.; Hafiane, A.; Mrabet, H. Hydrogeochemistry and evaluation of groundwater suitability for irrigation purpose in the Mornag region, northeastern Tunisia. Environ. Dev. Sustain. 2021, 23, 2698–2718. [Google Scholar] [CrossRef]
  37. Douaoui, A.E.K.; Hervé, N.; Walter, C.H. Detecting salinity hazards with in a semiarid context by means of combining soil and remote sensing data. Geoderma 2006, 134, 217–230. [Google Scholar] [CrossRef]
  38. Bradaï, A.; Douaoui, A.E.K.; Bettahar, N.; Yahiaoui, I. Improving the prediction accuracy of groundwater salinity mapping using indicator kriging method. J. Irrig. Drain. Eng. ASCE 2016, 142, 04016023. [Google Scholar] [CrossRef]
  39. Ayers, R.S.; Westcot, D.W. Food, Water Quality for Agriculture, Irrigation and Drainage; Agriculture Organization of the United Nations (FAO): Rome, Italy, 1994; ISBN 92-5-102263-1. [Google Scholar]
  40. Kim, K.O.; Yun, S.T.; Choi, B.Y.; Chae, G.T.; Joo, Y.; Kim, K.; Kim, H.S. Hydrochemical and multivariate statistical interpretations of spatial controls ofnitrate concentrations in a shallow alluvial aquifer around oxbow lakes (Osongarea, central Korea). J. Contam. Hydrol. 2009, 107, 114–127. [Google Scholar] [CrossRef] [PubMed]
  41. Jiang, J.; Wu, Y.; Groves, C.; Yuan, D.; Kambesis, P. Natural and anthropogenic factors affecting the groundwater quality in the Nandong karst undergroundriver system in Yunan, China. J. Contam. Hydrol. 2010, 109, 49–61. [Google Scholar] [CrossRef] [PubMed]
  42. Yidana, S.M.; Yidana, A. Assessing groundwater quality using water quality index and multivariate statistical analysis–the Voltaian Basin, Ghana. J. Environ. Earth Sci. 2010, 59, 1461–1473. [Google Scholar] [CrossRef]
  43. Yidana, S.M.; Banoeng-Yakubo, B.; Akabzaa, T.M. Analysis of groundwater quality using multivariate and spatial analyses in the Keta basin, Ghana. J. Afr. Earth Sci. 2010, 58, 220–234. [Google Scholar] [CrossRef]
  44. Kaur, L.; Rishi, M.S.; Sharma, S.; Sharma, B.; Lata, R.; Singh, G. Hydrogeochemical characterization of groundwater in alluvial plains of river Yamuna in northern India: An insight of controlling processes. J. King Saud Univ.-Sci. 2019, 31, 1245–1253. [Google Scholar] [CrossRef]
  45. Office National d’Irrigation et de Drainage Centre (ONIDC). Annuel Rapport (R1); ONIDC: Alger, Algéri, 2018. [Google Scholar]
  46. Belmiloud, N.; Bettahar, N. Modeling the Evolution of Nitrate Pollution of Groundwater in the Plain of Western Middle Cheliff. Am. J. Environ. Sci. 2016, 12, 16–26. [Google Scholar] [CrossRef] [Green Version]
  47. Bradaï, A.; Douaoui, A.E.K.; Hartani, T. Some problems of irrigation water management in Lower-Cheliff plain (Algeria). J. Environ. Sci. Eng. 2012, 1, 271–278. [Google Scholar] [CrossRef]
  48. Amichi, H.; Bouarfa, S.; Kuper, M.; Ducourtieu, O.; Imache, A.; Fusiller, J.L.; Bazin, G.; Hartani, T.; Chehat, F. How does unequal access to groundwater contribute to marginalization of small farmers? The case of public lands in Algeria. Irrig. Drain. 2012, 61 (Suppl. 1), 34–44. [Google Scholar] [CrossRef]
  49. Perrodon, A. Étude Géologique des Bassins Néogènes Sublittoraux de L’Algérie Nord Occidentale. Ph.D. Thesis, Universitéd’Alger, El Djazair, Algeria, 1957. [Google Scholar]
  50. SCET AGRI. Bilan des ressources en sol. In Étude du Réaménagement et de L’Extension du Périmètre du Moyen Cheliff; Rap A1.2.1. Pub. Ministère de L’Hydraulique: Alger, Algerie, 1984. [Google Scholar]
  51. SCET AGRI. Hydrologie-Hydrogéologie et bilan des ressources. In Étude du Réaménagement et de L’Extension du Périmètre du Moyen Chéliff; Rap A1.1.2. Pub. Ministère de L’Hydraulique: Alger, Algerie, 1984. [Google Scholar]
  52. ABH-CZ. Cadastre Hydraulique, Mission II; Agence de Bassin Hydrographique Cheliff-Zahrez: Chlef, Algerie, 2012. [Google Scholar]
  53. American Public Health Association (APHA). Standard Methods for the Examination of Water and Wastewater; APHA: Washington DC, USA, 2005. [Google Scholar]
  54. Domenico, P.A.; Schwartz, F.W. Physical and Chemical Hydrogeology; Wiley: New York, NY, USA, 1990; pp. 410–420. [Google Scholar]
  55. Khanoranga; Khalid, S. An assessment of groundwater quality for irrigation and drinking purposes around brick kilns in three districts of Balochistan province, Pakistan, through water quality index and multivariate statistical approaches. J. Geochem. Explor. 2018, 197, 14–26. [Google Scholar] [CrossRef]
  56. SPSS Software, version 20.0; IBM SPSS Statistics for Windows; IBM Corp: Armonk, NY, USA, 2011.
  57. Güler, C.; Thyne, G.D.; McCray, J.E.; Turner, K.A. Evaluation of graphical and multivariate statistical methods for classification of water chemistry data. Hydrogeol. J. 2002, 10, 455–474. [Google Scholar] [CrossRef]
  58. Helena, B.; Pardo, R.; Vega, M.; Barrado, E.; Fernandez, J.M.; Fernandez, L. Temporal evolution of groundwater composition in an alluvial aquifer (Pissuerga River, Spain) by principal component analysis. Water Res. 2000, 34, 807–816. [Google Scholar] [CrossRef]
  59. Singh, P.; Mishra, P.K. Geochemical assessment of groundwater quality for its suitability for drinking and irrigation purpose in rural areas of Sant Ravidas Nagar (Bhadohi), Uttar Pradesh. Geol. Ecol. Landsc 2018, 2, 127–136. [Google Scholar]
  60. Kaiser, H.F. The application of electronic computers to factor analysis. Educ. Psychol. Measur. 1960, 20, 141–151. [Google Scholar] [CrossRef]
  61. Liu, C.W.; Lin, K.H.; Kuo, Y.M. Application of factor analysis in the assessment of groundwater quality in a blackfoot disease area in Taiwan. Sci. Total Environ. 2003, 313, 77–89. [Google Scholar] [CrossRef]
  62. Parkhurst, D.L.; Apelo, C.A.J. User’s Guide to PHREEQC (Version 2)—A Computer Program for Speciation, Batch-Reaction, One Dimensional Transport, and Inverse Geochemical Calculations. United States Geological Survey. In Water Resources Investigations; Report 99-4259; USGS Publications: Washington, DC, USA, 1999. [Google Scholar]
  63. Matheron, G. Les Variables Régionalisées et Leur Estimation. Une Application de la Théorie des Fonctions Aléatoires Aux Sciences dela Nature; Masson et CIE: Masson, Paris, 1965. [Google Scholar]
  64. Webster, R.; Oliver, M.A. Geostatistics for Environmental Scientist; John Wiley and Sons: Chichester, UK, 2001; p. 149. [Google Scholar]
  65. Delhomme, J.P. Kriging in the Hydrosciences. Adv. Water Resour. 1978, 1, 251–266. [Google Scholar] [CrossRef]
  66. Bodrud-Doza, M.D.; Towfiqul Islam, A.R.M.; Ahmed, F.; Das, S.; Saha, N.; Safiur Rahman, M. Characterization of groundwater quality using water evaluation indices, multivariate statistics and geostatistics in central Bangladesh. Water Sci. 2016, 30, 19–40. [Google Scholar] [CrossRef] [Green Version]
  67. Piper, A.M. A graphic procedure in the geochemical interpretation of water-analyses. Trans. Am. Geophys. Union 1944, 25, 914–928. [Google Scholar] [CrossRef]
  68. Wilcox, L.V. Classification and Use of Irrigation Waters; US Department of Agriculture: Washington, DC, USA, 1955; p. 969.
  69. Chadha, D.K. A proposed new diagram for geochemical classification of natural waters and interpretation of chemical data. Hydrogeol. J. 1999, 7, 431–439. [Google Scholar] [CrossRef]
  70. Thilagavathi, R.; Chidambaram, S.; Prasanna, M.V.; Thivya, C.; Singaraja, C. A study on groundwater geochemistry and water quality in layered aquifers system of Pondicherry region, southeast India. Appl. Water Sci. 2012, 2, 253–269. [Google Scholar] [CrossRef] [Green Version]
  71. Subramani, T.; Rajmohan, N.; Elango, L. Groundwater geochemistry and identification of hydrogeochemical processes in a hard rock region, Southern India. Environ. Monit. Assess. 2010, 162, 123–137. [Google Scholar] [CrossRef] [PubMed]
  72. Sami, K. Recharge mechanisms and geochemical processes in a semi-arid sedimentary basin, Eastern Cape, South Africa. J Hydrol. 1992, 139, 27–48. [Google Scholar] [CrossRef]
  73. Krishnaraj, S.; Murugesan, V.; Vijayaraghavan, K.; Sabarathinam, C.; Paluchamy, A.; Ramachandran, M. Use of hydrochemistry and stable isotopes as tools for groundwater evolution and contamination investigations. Geosciences 2011, 1, 16–25. [Google Scholar] [CrossRef]
  74. Hounslow, A.W. Water Quality Data: Analysis and Interpretation; CRC Lewis Publishers: New York, NY, USA, 1995. [Google Scholar]
  75. May, A.L.; Loucks, M.D. Solute and isotopic geochemistry and groundwater flow in the Central Wasatch range, Utah. J. Hydrol. 1995, 172, 31–59. [Google Scholar] [CrossRef]
  76. Tziritis, E.; Skordas, K.; Kelepertsis, A. The use of hydrogeochemical analyses and multivariate statistics for the characterization of groundwater resources in a complex aquifer system. A case study in Amyros River basin, Thessaly, central Greece. Environ. Earth Sci. 2016, 75, 339. [Google Scholar] [CrossRef]
  77. Kumar, P.S.; Jegathambal, P.; James, E.J. Multivariate and geostatistical analysis of groundwater quality in Palar river basin. Int. J. Geol. 2011, 4, 108–119. [Google Scholar]
  78. Li, P.; Zhang, Y.; Yang, N.; Jing, L.; Yu, P. Major ion chemistry and quality assessment of groundwater in and around a mountainous tourist town of China. Expos. Health 2016, 8, 239–252. [Google Scholar] [CrossRef]
  79. Fisher, R.S.; Mulican, W.F.I. Hydrochemical evaluation of sodium-sulphate and sodium-chloride groundwater beneath the northern Chihuahuan desert, trans-Pecos, Texas USA. Hydrogeol. J. 1997, 10, 455–474. [Google Scholar]
  80. Sheikhy Narany, T.; Ramli, M.F.; Aris, A.Z.; Sulaiman, W.N.A.; Fakharian, K. Spatiotemporal variation of groundwater quality using integrated multivariate statistical and geostatistical approaches in Amol-Babol Plain, Iran. Environ. Monit. Assess. 2014, 186, 5797–5815. [Google Scholar] [CrossRef] [PubMed]
  81. Clark, I.D. Groundwater Geochemistry and Isotopes; CRC Press: Boca Raton, FL, USA, 2015. [Google Scholar]
  82. Rajmohan, N.; Elango, L. Identification and evolution of hydrogeochemical processes in the groundwater environment in an area of the Palar and Cheyyar River Basins, southern India. Environ. Geol. 2004, 46, 47–61. [Google Scholar] [CrossRef]
  83. Appelo, C.A.; Postma, D. Geochemistry, Groundwater and Pollution; Balkema: Rotterdam, The Netherlands, 1993. [Google Scholar]
  84. Güler, C.; Thyne, G.D. Hydrologic and geologic factors controlling surface and groundwater chemistry in Indian wells-Owens valley area, southeastern California, USA. J. Hydrol. 2004, 285, 177–198. [Google Scholar] [CrossRef]
  85. Tarki, M.; Dassi, L.; Hamed, Y.; Jedoui, Y. Geochemical and isotopic composition of groundwater in the Complex Terminal aquifer in southwestern Tunisia, with emphasis on the mixing by vertical leakage. Environ. Earth Sci. 2010, 64, 85–95. [Google Scholar] [CrossRef]
  86. Tijani, M.N. Hydrochemical assessment of groundwater in Moro area, Kwara State, Nigeria. Environ. Geol. 1994, 24, 194–202. [Google Scholar] [CrossRef]
  87. Richards, L.A. Diagnosis and Improvement of Saline and Alkaline Soils. Soil Sci. 1954, 64, 432. [Google Scholar] [CrossRef]
  88. Collins, R.; Jenkins, A. The Impact of Agricultural Land Use on Stream Chemistry in the Middle Hills of the Himalayas, Nepal. J. Hydrol. 1996, 185, 71–86. [Google Scholar] [CrossRef]
  89. Arslan, H. Spatial and temporal mapping of groundwater salinity using ordinary kriging and indicator kriging: The case of Bafra Plain, Turkey. Agric. Water Manag. 2012, 113, 57–63. [Google Scholar] [CrossRef]
  90. Ohmer, M.; Liesch, T.; Goeppert, N.; Goldscheider, N. On the optimal selection of interpolation methods for groundwater contouring: An example of propagation of uncertainty regarding inter-aquifer exchange. Adv. Water Resour. 2017, 109, 121–132. [Google Scholar] [CrossRef]
  91. Marlet, S.; Job, J.O. Processus et gestion de la salinite’ des sols. In Traité D’Irrigation, 2nd ed.; Tiercelin, J.R., Vidal, A., Eds.; Tec & Doc., Lavoisier: Paris, France, 2006. [Google Scholar]
Figure 1. Localization of the study area.
Water 14 00924 g001
Figure 2. Geology of the study area and sampling sites location.
Water 14 00924 g002
Figure 3. Dendrogram of Q-mode cluster.
Water 14 00924 g003
Figure 4. Stiff diagram for three water clusters.
Water 14 00924 g004
Figure 5. Piper diagram for water samples.
Water 14 00924 g005
Figure 6. Chadha’s diagram for three clusters.
Water 14 00924 g006
Figure 7. (a) 3D Variables projection on the factors plan (PC1 × PC2 × PC3); (b) Samples Projection plot on PC1 and PC2.
Water 14 00924 g007
Figure 8. Bivariate plots of: (a) Na+/Cl vs. EC; (b) Na+ vs. Cl; (c) (Ca2+ + Mg2+) vs. Σcations and (d) (Na+ + Cl) vs. Σcations.
Water 14 00924 g008aWater 14 00924 g008b
Figure 9. Bivariate plots of (a) (Ca2+ + Mg2+) versus HCO3, (b) (Ca2+ + Mg2+) versus (HCO3 + SO42), (c) (Ca2+ + Mg2+) versus (Cl + SO42), (d) Na+/Cl versus Cl, (e) (Ca2+ + Mg2+) versus Cl, (f) HCO 3 /(Cl + SO42), and (g) [(Na+ + K+) − Cl] versus [Ca2+ + Mg2+) − ( HCO 3 + SO42)].
Water 14 00924 g009aWater 14 00924 g009b
Figure 10. Saturated index of: (a) carbonates minerals; (b) Gypsum-Anyhydride; (c) Halite.
Water 14 00924 g010
Figure 11. US salinity diagram (a); Willox diagram (b).
Water 14 00924 g011aWater 14 00924 g011b
Figure 12. Spatial distribution of: (a) EC, (b) % Na, (c) SAR in WMCP.
Water 14 00924 g012aWater 14 00924 g012b
Figure 13. Spatial variation map of: (a) Factor 1; (b) Factor 2; (c) Factor 3; (d) Clusters in the WMCP.
Water 14 00924 g013aWater 14 00924 g013b
Table 1. Parameter’s value of the three principal water clusters.
VariablesUnitsCluster 1 (31 Samples)Cluster 2 (47 Samples)Cluster 3 (9 Samples)Ayers and Westcot (1994) [39]
MinMaxMeanSDMinMaxMeanSDMin.Max.MeanSD
Camg/L25198109.638.973292196.449.9186500366.232.8400
Mg4.7489.538.621.140241111.645.967415263.433.160
Na31.6190104.936.1110480242.285.9220590381.040.8919
K0.54.62.71.00132.52.4051.90.612
Cl72361214.976.8222.3919.5494.8174.2750937.51129.8113.71063
SO413361119.679.3117.3957479.7196.25804001077.897.6960
HCO3137427275.268.170683.2312.5142.593336221.328.4630
NO313.115064.931.5663.225.112.7052.11.6910
ECµS/cm80218261358.7282.9192636582725.9495.8455082305843.31100.93000
pH-7.057.857.360.206.808.317.50.46.87.517.200.228.5
Table 2. The score of PCA after Varimax rotation.
VariablesComponent Data Values
First ComponentSecond ComponentThird Component
EC0.9550.0060.093
Cl0.911−0.1780.148
Ca0.877−0.0230.212
SO40.867−0.1540.254
Mg0.863−0.2050.290
Na0.7960.154−0.055
pH−0.0600.983−0.041
HCO3−0.0710.957−0.195
K−0.0320.282−0.837
NO30.3940.0490.769
Initial Eigenvalues of variances in %48.08720.86115.578
Cumulative of variance %48.08768.94884.526
Table 3. Summary of minerals Saturation Index (SI) in groundwater using PHREEQC.
AnhydriteCalciteDolomiteGypsumHalite
Cluster 1
Min−3.11−1.02− 0.87−1.57−2.89
Max−1.210.911.052.05−0.99
Mean−1.840.080.220.29−1.62
SD0.390.390.390.700.39
Cluster 2
Min−1.76−0.89−0.75−1.37−1.54
Max−0.771.631.773.6−0.55
Mean−1.140.390.531.15−0.92
SD0.230.640.641.230.23
Cluster 3
Min−1.10−0.72−0.58−0.92−0.88
Max−0.530.540.681.42−0.31
Mean−0.710.080.230.63−0.50
SD0.170.420.430.800.17
Table 4. Sustenance of groundwater for irrigation based on EC, %Na and SAR.
ParametersRangeClassNumber of SamplesPercent
EC (µS/cm) (Wilox 1955) [68]C1 < 250Excellent00
250 < C2 < 750Good00
750 < C3 < 2250permissible4147.13
2250 < C4 < 5000Doubtful3944.83
C5 > 5000Unsuitable78.04
% Na (Wilox 1955) [68]0–20Excellent55.75
20–40Good6372.41
40–60Permissible1517.24
60–80Doubtful44.6
>80Unsuitable00
SAR (Richards 1954) [87]S1 < 10Excellent87100
10 < S2 < 18good00
18 < S3 < 26Doubtful00
S4 > 26unsuitable00
All cations are expressed in mmolc/L.
Table 5. Best-fitted semi-variogram models and cross-validation for OK of groundwater irrigation parameters and factors analysis.
Variogram ParametersPrediction Precision
ParametersTransformationModelNugget (C0)Partial Sill (C) ( C 0 C 0 + C ) × 100   ( % ) Spatial DependenceMeanRoot-Mean- Square Standardized Error
ECLogExponential0.01540.29274.99Strong0.1250.9441
%NaLogRational Quadratic0.04990.047151.44Moderate−0.1781.0283
SARLogSpherical0.07830.150634.21Moderate−0.0091.0440
Factor 1Original DataSpherical0.09680.99168.89Strong0.01321.1242
Factor 2Original DataSpherical0.80510.225278.14Weak−0.00730.9972
Factor 3Original DataSpherical0.13880.824714.40Strong−0.03621.0304
Publisher’s Note: MDPI stays neutral with regard to jurisdictional claims in published maps and institutional affiliations.

