
Effects of Distributions of Grass Strips on Soil Erosion in Spoil Tips
by
Yongcai Lou
1, 
Zhaoliang Gao
1,2,*,
Yonghong Li
1,
Guanfang Sun
1,
Tong Wu
2,
Yunfeng Cen
1 and
Bingni Su
1 1
State Key Laboratory of Soil Erosion and Dryland Farming on the Loess Plateau, Institute of Water and Soil Conservation, Northwest A & F University, Yangling, Xianyang 712100, China
2
Institute of Soil and Water Conservation, Chinese Academy of Sciences and Ministry of Water Resources, Yangling, Xianyang 712100, China
*
Author to whom correspondence should be addressed.
Water 2022, 14(6), 913; https://doi.org/10.3390/w14060913
Submission received: 24 January 2022
/
Revised: 7 March 2022
/
Accepted: 10 March 2022
/
Published: 15 March 2022
(This article belongs to the Special Issue Ecohydrological Response to Environmental Change)
Abstract
:The spatial distribution pattern of vegetation is of great significance to the prevention and control of soil erosion in spoil tips. The objective of this study was to evaluate the effects of spatial distributions of grass strips on soil erosion in spoil tips. A field runoff plot (20 m long, 1 m wide, and 0.5 m deep) was used for inflow simulation experiments under four inflow rate patterns (even, rising, falling, and rising–falling) and five grass strip patterns (patterns I–V). Results showed that the runoff reduction benefit (RRB) and soil loss reduction benefit (SLRB) of grass strip patterns were 12.23–49.62% and 12.92–80.54%, respectively. The optimal grass strip pattern was when the grass strips were distributed on a slope in bands (pattern V). In this pattern, the soil and water conservation effects were best, with RRB and SLRB of 43.87% and 58.09%, respectively. The grass strip patterns exhibited a significant time-limited effect on controlling soil erosion. The maximum amount of soil loss reduction for patterns II, III, IV, and V was 93.02, 84.30, 65.86, and 98.26 kg, respectively. Soil loss reduction caused by decreasing runoff (SRR) for grass strip patterns was the main factor controlling erosion. The efficiency coefficient of soil loss reduction caused by decreasing runoff for pattern V was higher than that for the other patterns. The grass strip pattern V (i.e., grass strips were distributed on a slope in bands) should be considered a priority in the prevention of soil erosion in spoil tips. This study can guide the configuration of vegetation control measures for soil and water loss in spoil tips.
1. Introduction
Discarded soils from production and construction projects that constitute spoil tips are the main sources of new soil and water loss in China [1]. Compared with the original landform, spoil tips have the characteristics of poor soil structure, steep slope, and weak erosion resistance, which easily lead to soil erosion under heavy rain conditions [2]. The soil and water losses from spoil tips reflect typical anthropogenically accelerated erosion [3], which has the characteristics of high intensity, wide range, and great damage and is an important factor restricting the sustainable development of the economy and society, endangering the health of the regional ecological environment, and causing environmental disasters [4,5,6]. Therefore, determining how to control soil erosion in spoil tips scientifically and effectively is a requisite for improving the ecological environment and a long-term and challenging job for scientists and engineers.
Spoil tips, as a unique anthropogenic landform, have a platform–steep slope structure with a significant upslope inflow. The water infiltration rate of the platform formed by heavy mechanical rolling is significantly reduced. Under rainfall conditions, the platform produces large, amounts of concentrated runoff preferentially over the slope, and concentrated runoff rapidly flows along the platform edge to the steep slope, thus causing severe slope erosion. Accordingly, the runoff from the platform is the main driving force for the slope erosion in the spoil tips [7,8]. The results of the study by Zhang et al. (2016) showed that downslope wash-scour erosion caused by upslope inflow from a compacted platform is an important contributor to the acceleration of soil erosion in spoil tips [9]. Upslope runoff is an agent of runoff energy transfer and sediment transport on a slope; runoff fundamentally changes the hydrological input conditions in the lower part of the slope, adjusts to distribute erosivity, changes the development process of slope soil erosion, and aggravates the degree of soil erosion on the slope in spoil tips [10]. Therefore, determining how to regulate the runoff from a platform scientifically is the key to preventing and controlling soil erosion in spoil tips.
Vegetation is considered the fundamental measure to control runoff and soil erosion through plant diversity, vertical vegetation structures, vegetation coverage, plant communities, and vegetation distribution patterns [11,12,13]. Bare patches act as “sources”, and vegetation patches act as “sinks” for intercepting runoff and sediment. Vegetation and bare patches form source–sink landscape patterns that can change the level of landscape connectivity, collect surface runoff, and transport sediment [14]. Unreasonable vegetation spatial distribution patterns may aggravate soil erosion, and different patterns are an important factor leading to differences in slope soil erosion [15]. Previous studies have investigated the change response of slope soil erosion to vegetation spatial patterns. The results of Shi et al. (2022) showed that the downslope vegetation pattern contributed more to the reduction in runoff and sediment than the upslope vegetation pattern [16]. Wang et al. (2021) concluded that the optimal soil and water conservation effect was obtained with a block-shaped mosaic vegetation pattern in a loess area [17]. Zhang et al. (2018) suggested that the optimal location of grass strips on convex hillslopes was 60% of the upslope length, with 7.35% and 62.93% reduction in runoff and sediment, respectively [18]. In addition, grass could achieve good erosion control benefits in a short time, compared with shrubs and trees [11,19]. Grass roots improve soil shear strength, increase soil organic matter, and effectively reduce soil detachment [20,21,22]. Grass surface cover can protect the soil surface from raindrop splashing [23]. Hence, grass planting is a great measure in controlling soil erosion in spoil tips. However, due to the complex and diverse vegetation spatial distribution patterns and subsurface conditions on slopes, as well as the coupling effect of multiple factors on soil erosion processes, the relationship between vegetation spatial distribution patterns and runoff–sediment processes remains unclear [24], with large variability and uncertainty. Therefore, determining how to optimize the slope vegetation spatial distribution pattern reasonably is the key to achieving effective control of soil erosion in spoil tips.
Here, the effects of distributions of grass strips on runoff and soil loss in spoil tips were studied. A field runoff plot experiment was conducted with the specific aims of evaluating the runoff and soil loss reduction effects of grass strip patterns, identifying the grass strip pattern with the best soil and water conservation effects, and exploring the effect of grass strips on sediment regulation capacity in spoil tips. We expect that the results from this study will provide scientific guidance for the configuration of vegetation control measures for soil erosion in spoil tips.
2. Materials and Methods
2.1. Study Area
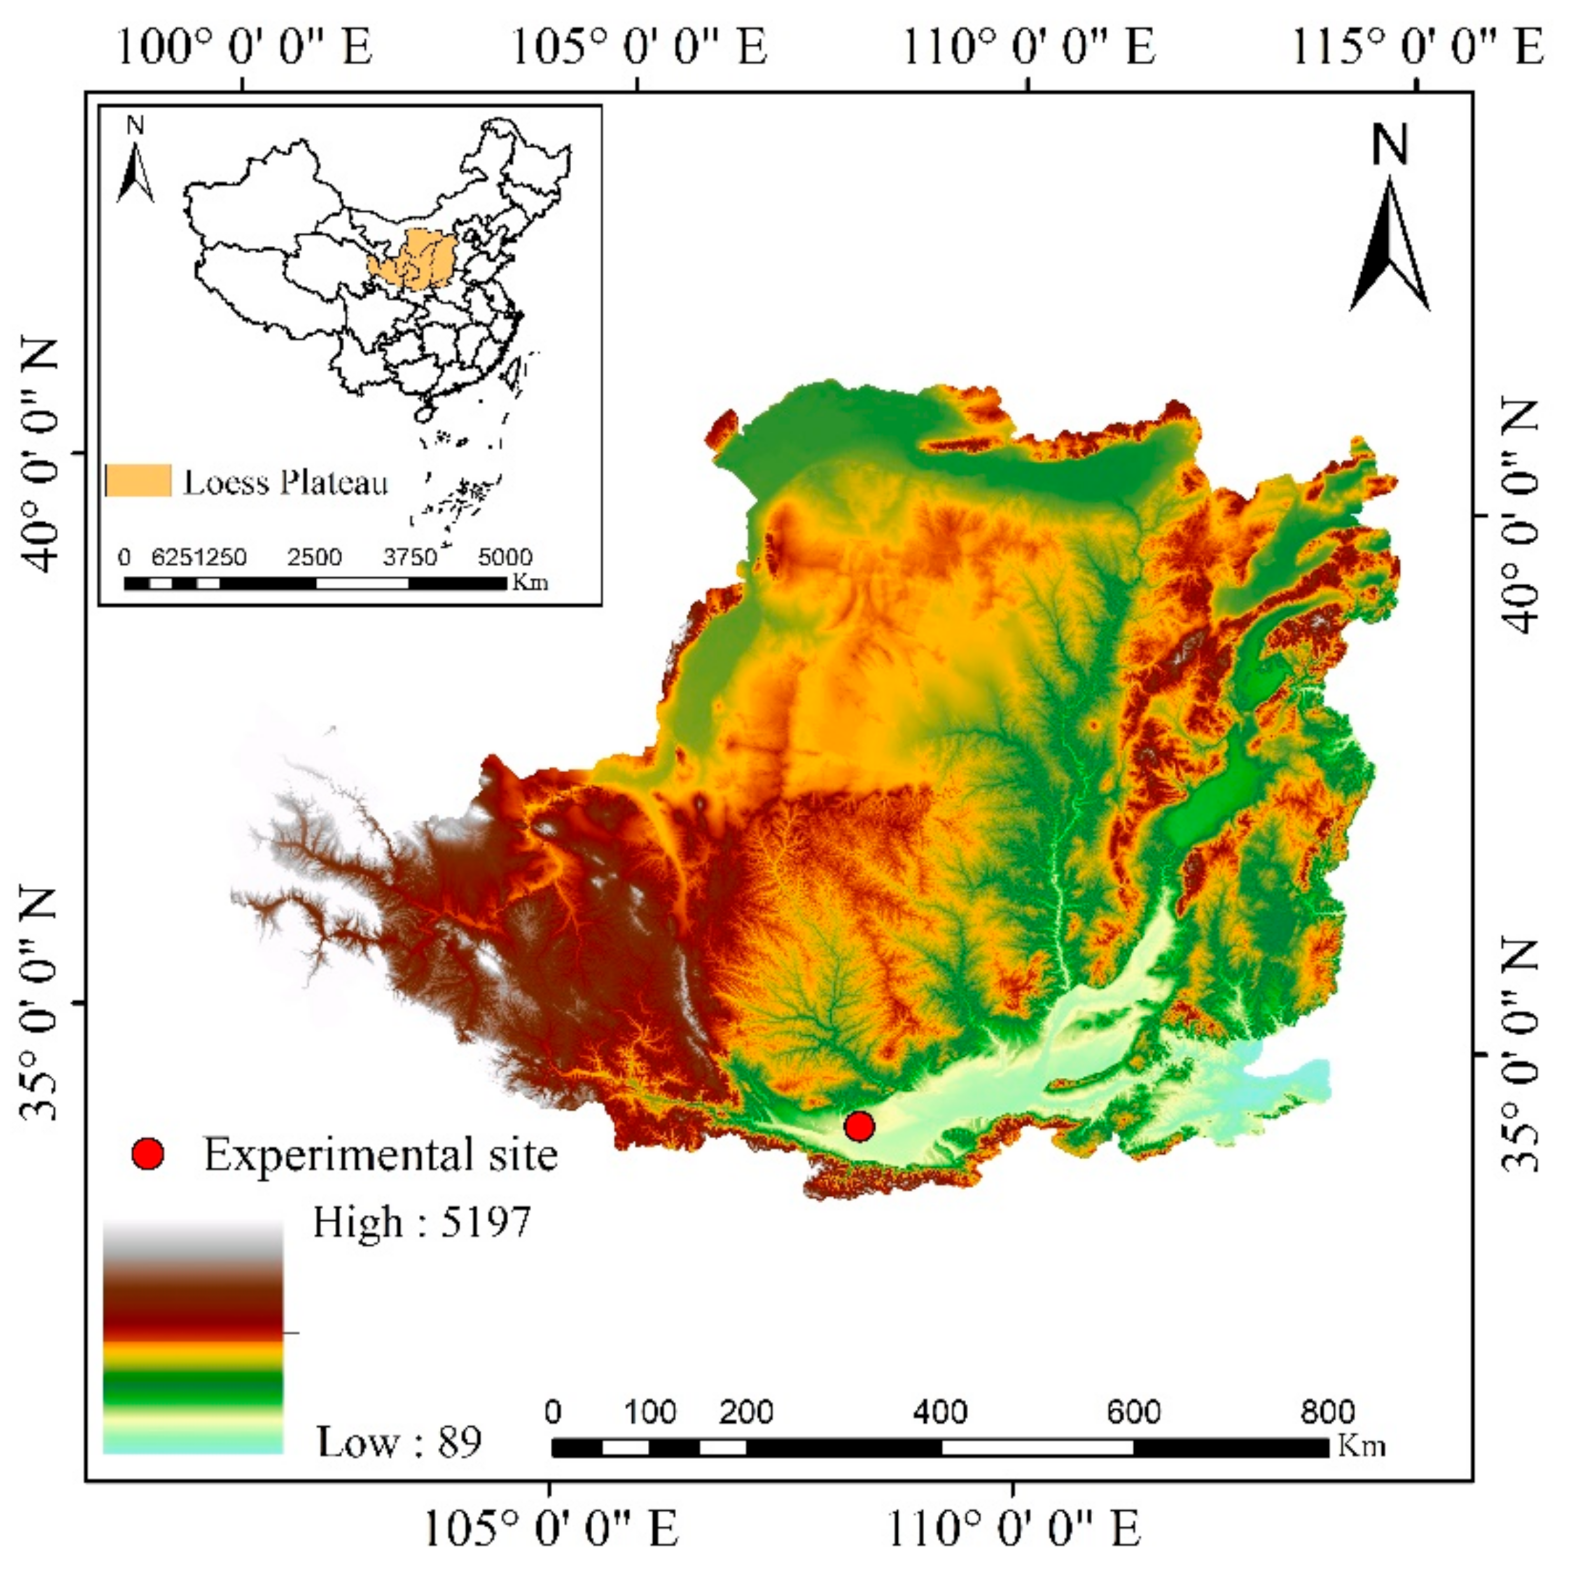
The field experiment was carried out at the Yangling Soil and Water Conservation Experimental Station of the Chinese Academy of Sciences on the Loess Plateau (107°59′36.12″ E, 34°19′24.84″ N) (Figure 1). The station is located in the warm temperate semi-humid continental monsoon climate zone. The average annual precipitation is 637.6 mm, with more than 60% falling from July to October. The average annual temperature is 12.9 °C. An experimental slope was built on an artificial excavation surface in contact with the parent soil.
2.2. Method
2.2.1. Soil Samples
The tested soil was collected from abandoned soil produced by excavating slope engineering projects. The soil used in this experiment was silty loam with 11.02% sand (50 μm–2 mm), 61.42% silt (50–2 μm), and 27.56% clay (<2 μm). To maintain the natural state of the soil, the soil was not passed through any sieve [10], but the organic litter layer, weeds, and gravel were removed from the soil.
2.2.2. Experimental Design
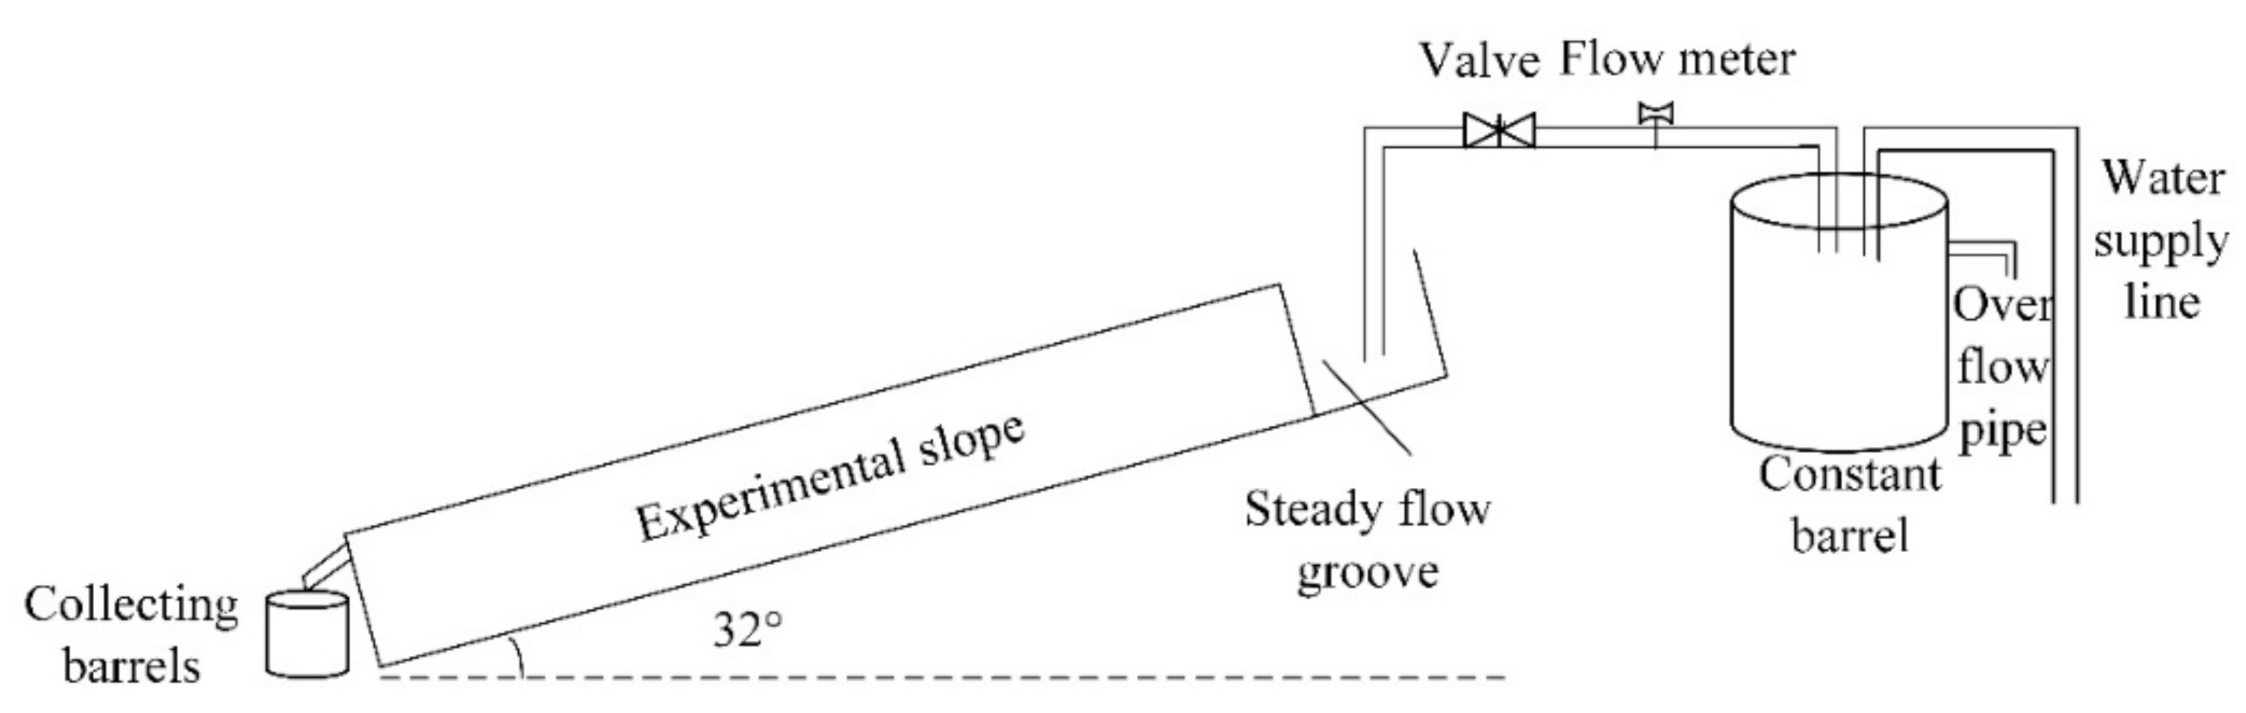
The field scouring experimental setup included a water supply line, a constant barrel, a valve, a flow meter, a steady flow groove, and collecting barrels (Figure 2). The experimental plot was 20 m in length, 1 m in width, and 0.5 m in depth. The inflow intensities could be adjusted through the valve opening sizes. The water was kept at a constant pressure to ensure a uniform flow. A steady flow groove (1.0 m length, 0.5 m width, and 0.3 m depth) was located at the plot top. The experimental plot slope was 32°, a common slope for spoil tips in the experimental region.
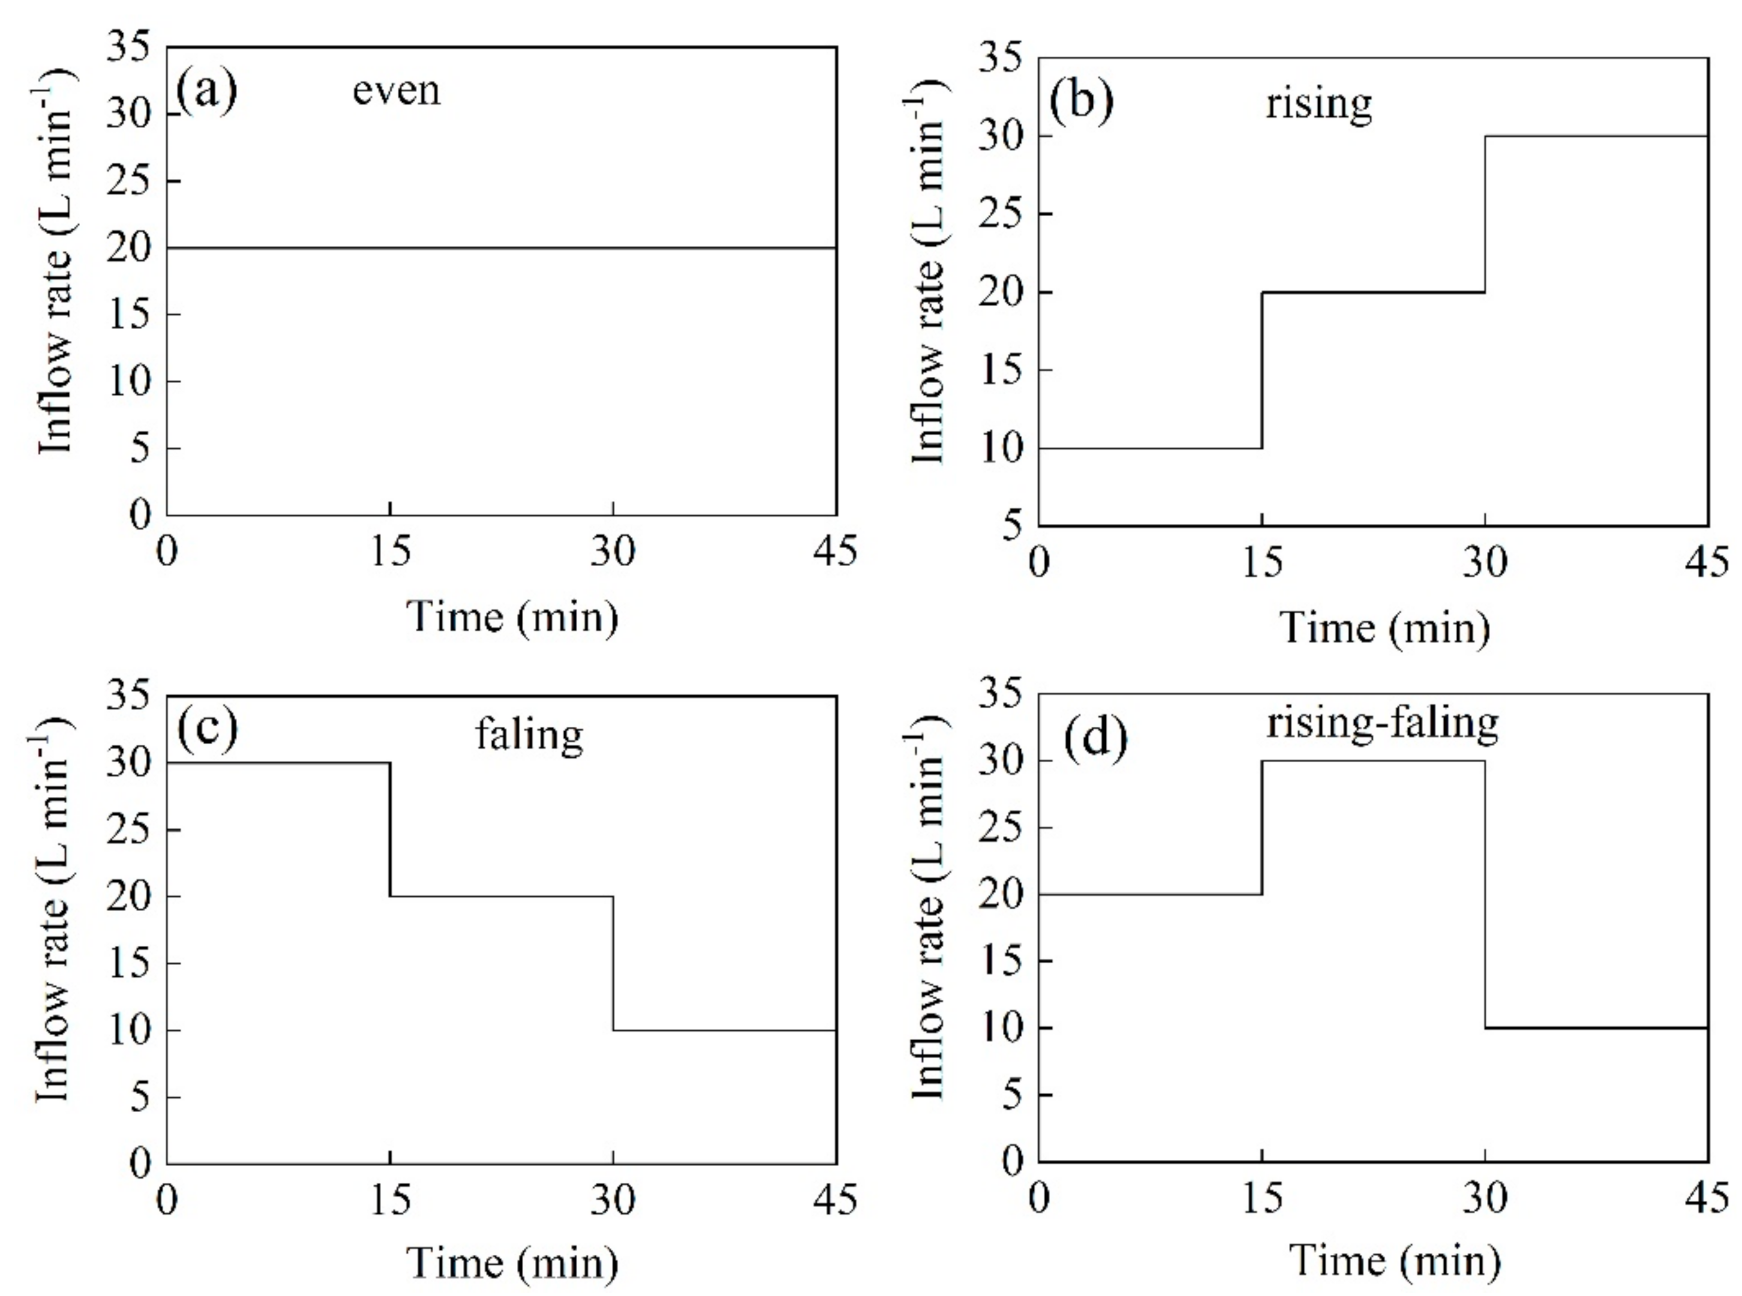
Given a constant total water amount (900 L), four inflow rate patterns—namely, even (Figure 3a), rising (Figure 3b), falling (Figure 3c), and rising–falling (Figure 3d)—were designed to reflect the time distribution characteristics of rainfall and the influence of underlying surface conditions on the confluence process indirectly [9]. The duration of the flow event was set to 45 min. The process of the flow event was divided into three stages: early period (0–15 min), intermediate period (15–30 min), and late period (30–45 min). The inflow rate was calculated and selected in accordance with previous tests and the unit discharge that occurred in the experimental region under the condition of a heavy rainstorm [25]. The four inflow rate patterns are shown in Figure 3. Before the start of each test, the desired inflow rate was calibrated 3 times, and the test could be carried out only when the error was less than ±5%.
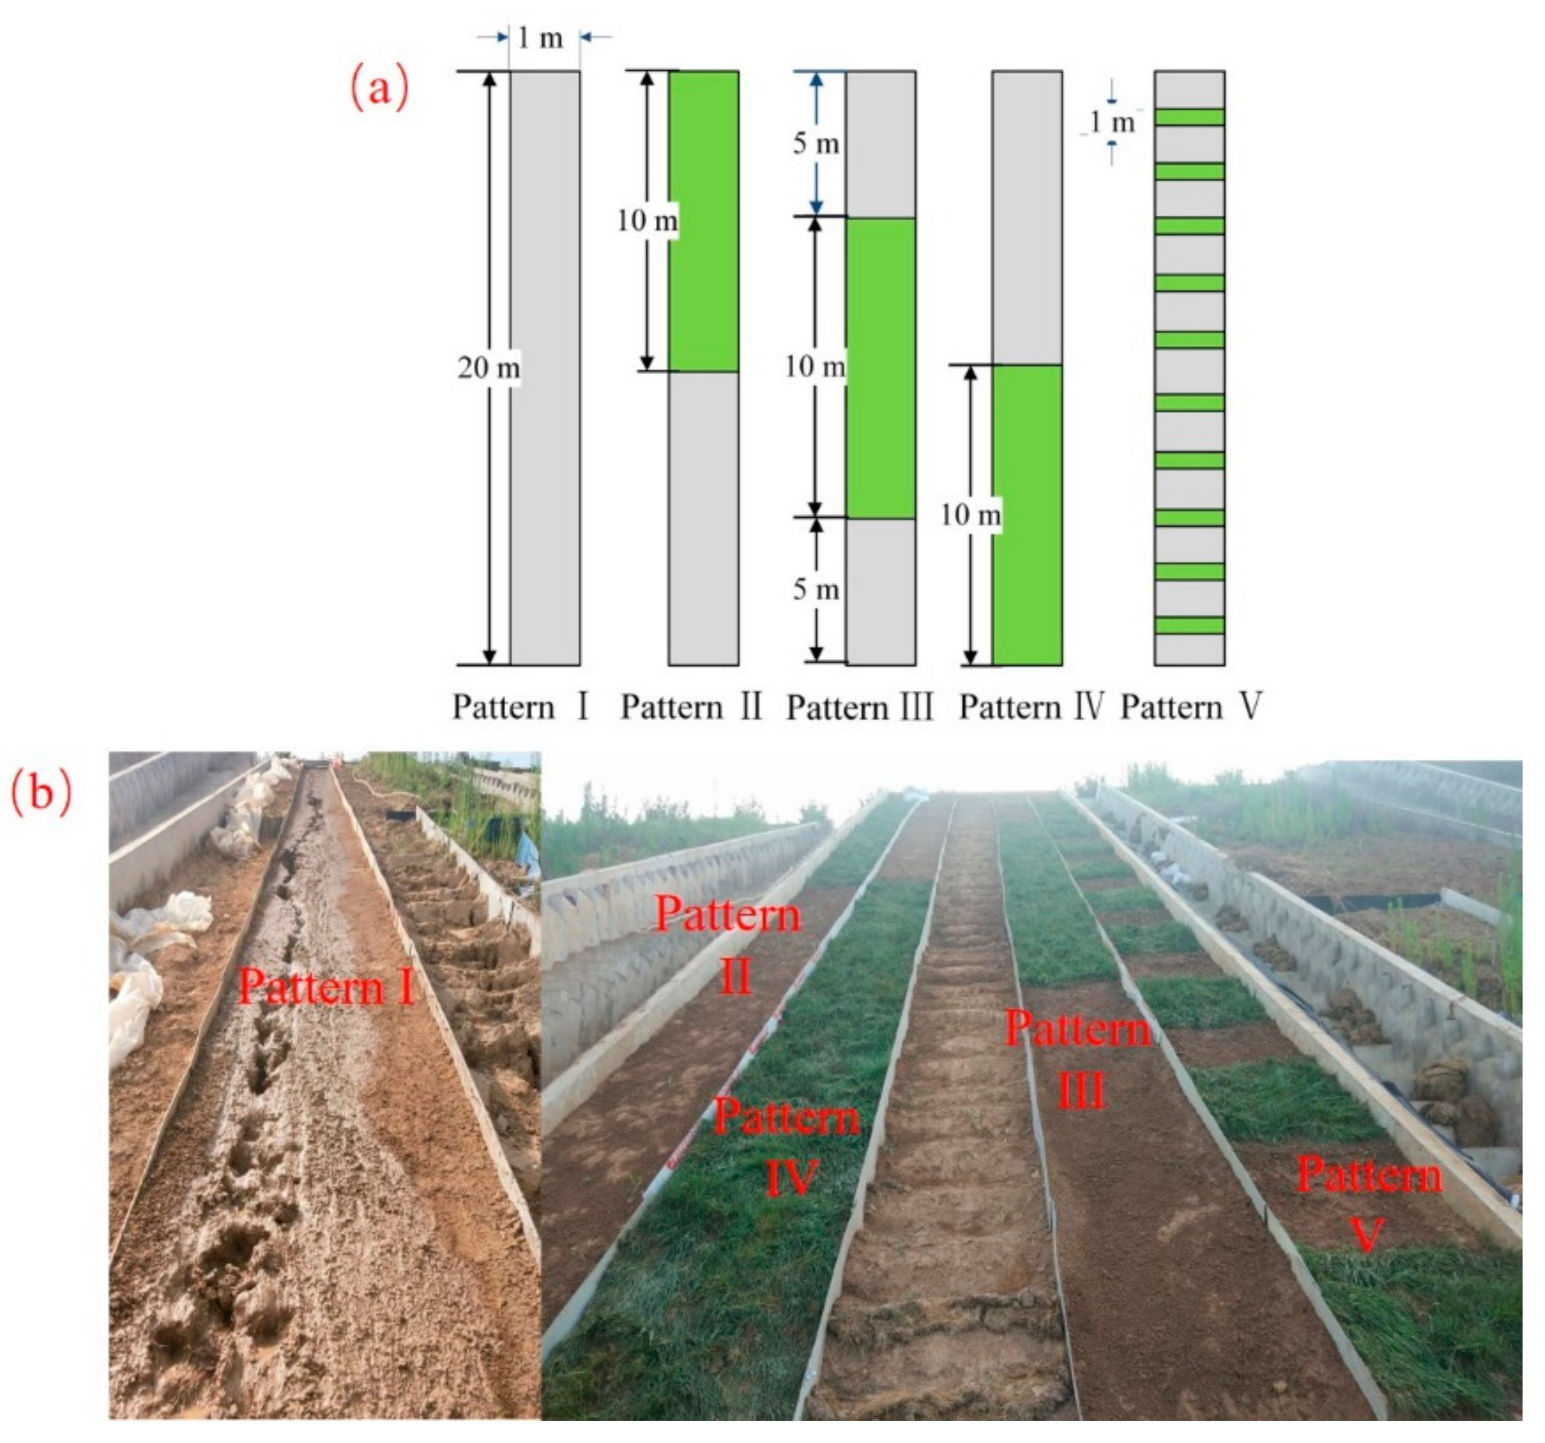
To simulate the spoil tips and ensure the consistency of the initial conditions of the slope, soil samples of 50 cm were placed into the runoff area via a tamping method. The soil bulk density was controlled at approximately 1.25 g cm−3, and the initial soil water content was controlled at approximately 22%. In the experiment, Bahraini grass (25%), Kentucky grass (25%), and Youmei grass (50%) were selected to form the grass strips. Field investigations demonstrated that these species are often used for engineering slope protection and greening. The sizes of the grass strips were 10 m × 1 m and 1 m × 1 m (Figure 4a). Thirty days before the experiment began, the grass strips were transplanted to the experimental plot to grow naturally. Soil erosion can be effectively controlled when vegetation cover reaches 50% [13]; therefore, the grass cover was set at 50% for this experiment. In this experiment, five spatial configurations of the grass strips included bare soil (pattern I), the upper slope (pattern II), the middle slope (pattern III), the lower slope (pattern IV), and bands (pattern V), which are shown in Figure 4b.
2.2.3. Measurements
For each experiment, the runoff production time was recorded with a stopwatch. Runoff samples were collected at 2 min (0–6 min) and 3 min (6–45 min) intervals, and the sampling times were also recorded with a stopwatch. The experimental slope was divided into five observation sections (parts 1–5) from the top to the bottom with intervals of 4 m. The surface flow velocity of each section was measured across a distance of 2.5 m by using a dye tracer (KMnO4) method. The mean velocity was obtained by multiplying the velocity by the correction factor of 0.75 [26]. After the experiment, the length, width, and depth of rills within each section were measured using a steel ruler to calculate the amount of rill erosion. In addition, runoff samples were weighed and left to stand for 24 h, and the supernatant was poured off. Then, the remaining sediment was left to dry at 105 °C to calculate the sediment yield. This process was repeated twice for each experiment.
2.2.4. Data Calculation and Analysis
The soil infiltration (i) was calculated as follows [27]:
where IR and RR are the inflow rate (L min−1) and runoff rate (L min−1), respectively.
The runoff reduction benefit (RRB) and soil loss reduction benefit (SLRB) were used to reflect the effect of vegetation patterns on slope erosion in spoil tips. The specific calculation formulas are as follows [11,28]:
where Rb and Rv are the runoff (L) for bare slopes and vegetated covered slopes, respectively; and SLb and SLv are the soil loss (kg) for bare slopes and vegetated covered slopes, respectively.
The process of sediment erosion driven by runoff is restricted by the amount of runoff and the flow–sediment relationship. The reduction in sediment yield on a slope under the effect of soil and water conservation measures can be separated into two parts: (1) the reduction in sediment yield caused by runoff variation (SRR) and (2) the reduction in sediment yield caused by flow–sediment relationship variation (SRS) [29,30,31]. Therefore, SRR and SRS were used to specify how grass strip patterns affect slope erosion in spoil tips. The specific calculation equation is as follows:
where ∆W is the total soil loss reduction (kg) after vegetation measures take effect; W1, Q1, and S1 are the soil loss (kg), runoff (m3), and sediment concentration (kg m−3) with bare slope, respectively; W2, Q2, and S2 are the soil loss (kg), runoff (m3), and sediment concentration (kg m−3) with vegetation measures, respectively. ∆Q is the runoff reduction (m3) after vegetation measures take effect. ∆S is the sediment concentration reduction (kg m−3) after vegetation measures take effect. S1∆Q is defined as the soil loss reduction caused by decreasing runoff (SRR, kg). Q2∆S is defined as the soil loss reduction caused by flow–sediment relationship changes (SRS, kg).
When ∆Q = Q1, ∆S = S1, Equation (4) can be rewritten as follows:
where S1Q1 and S1Q2 are the potential sediment reduction resulting from runoff variation (SRPR) and the potential sediment reduction resulting from flow–sediment relationship variation (SRPS), respectively; a and b are the efficiency coefficients.
All data analyses were performed using the SPSS16.0 software (IBM Corp., Armonk, NY, USA). All figures were plotted using the Origin 2021 software (OriginLab Corp., Northampton, MA, USA).
3. Results
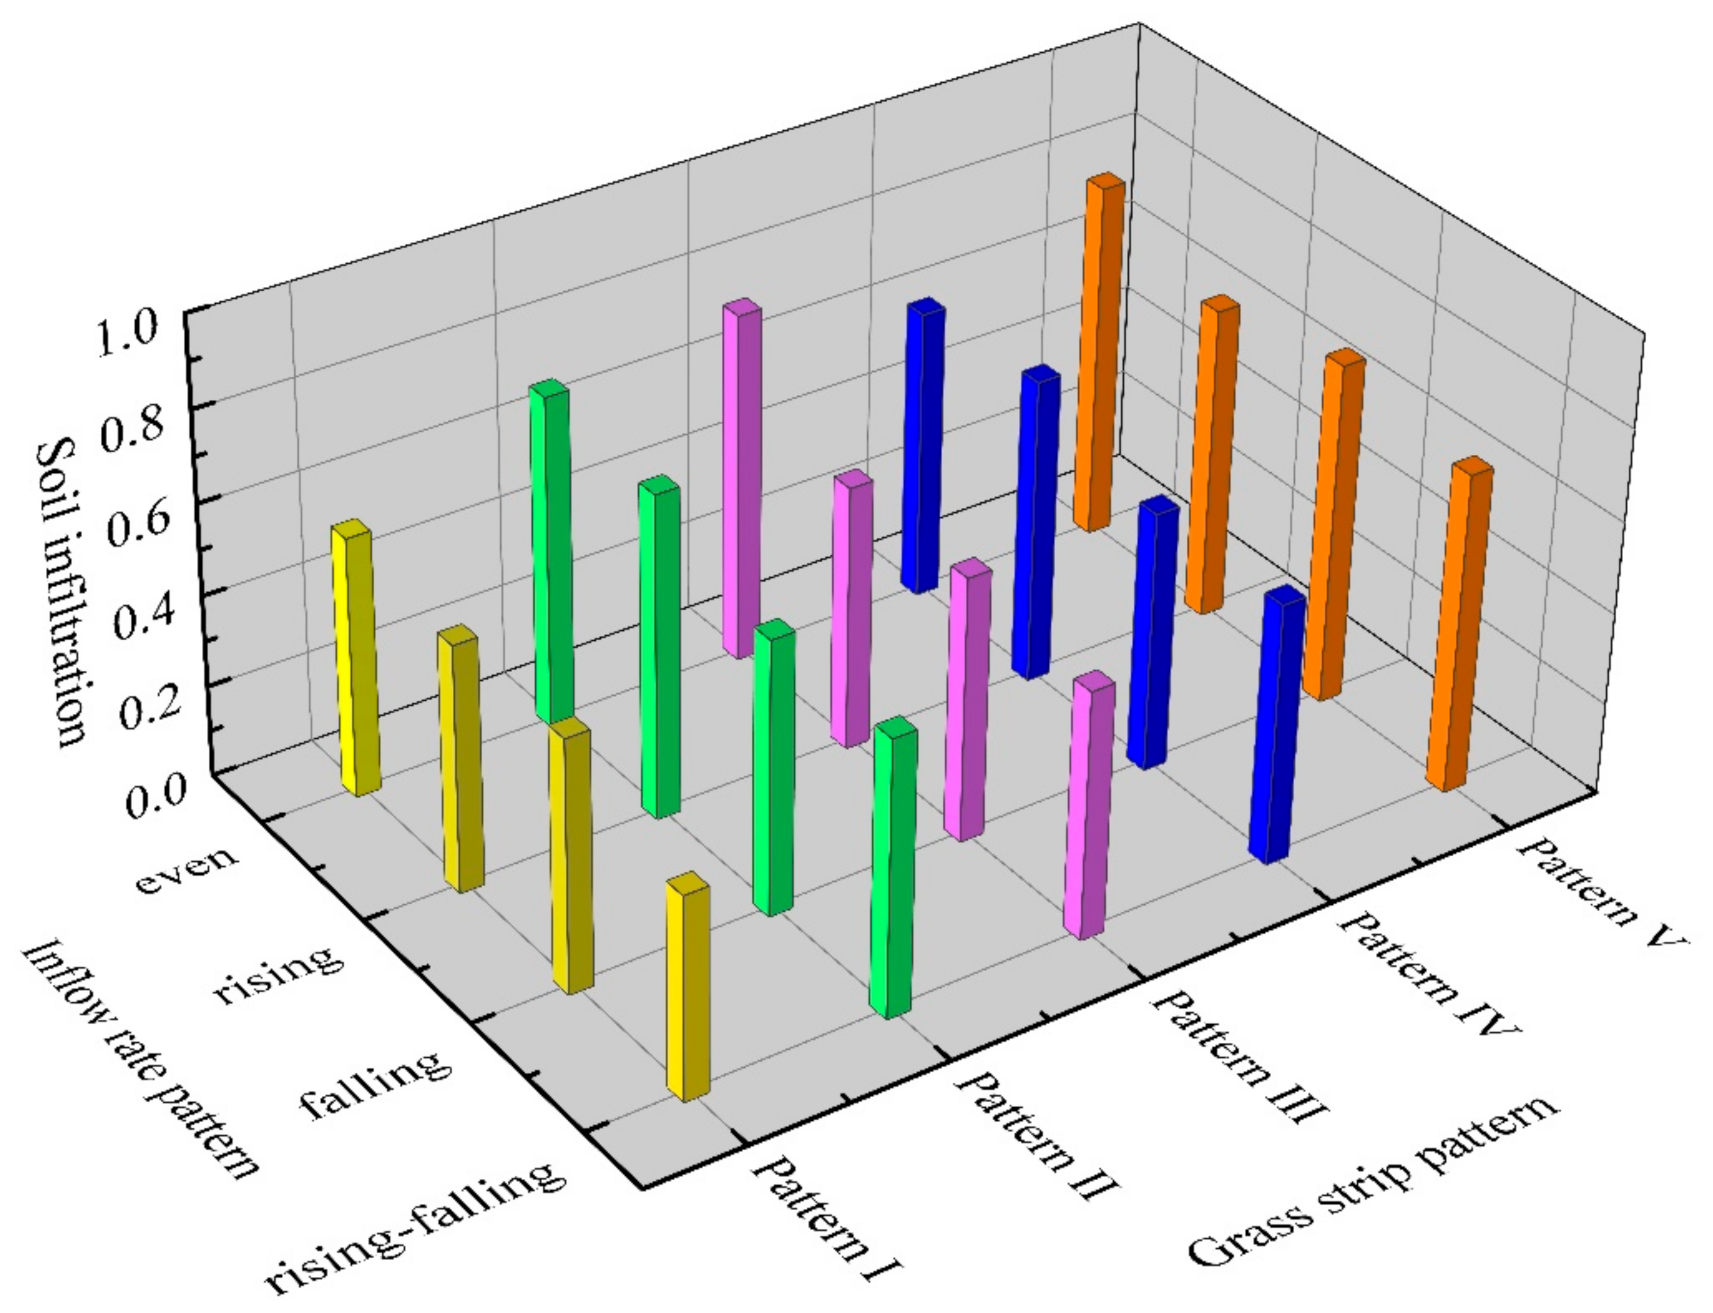
3.1. Soil Infiltration
To evaluate the effect of grass strip patterns on slope soil infiltration, Figure 5 shows the average soil infiltration rates for the different grass strip patterns throughout the experiment. The average soil infiltration rates for grass strip patterns I, II, III, IV, and V were 0.44–0.57, 0.60–0.73, 0.54–0.77, 0.57–0.67, and 0.69–0.79, respectively (Figure 5). The average soil infiltration rates of patterns II, III, IV, and V were all greater than those of pattern I (bare slope) because the grass strips distributed on the slope surface could effectively increase the flow resistance, prolong the residence time of runoff on the slope, and increase the soil infiltration. The average soil infiltration rate of pattern V (i.e., grass strips were distributed on the slope in bands) was the highest.
3.2. Runoff Rate and Soil Loss Rate
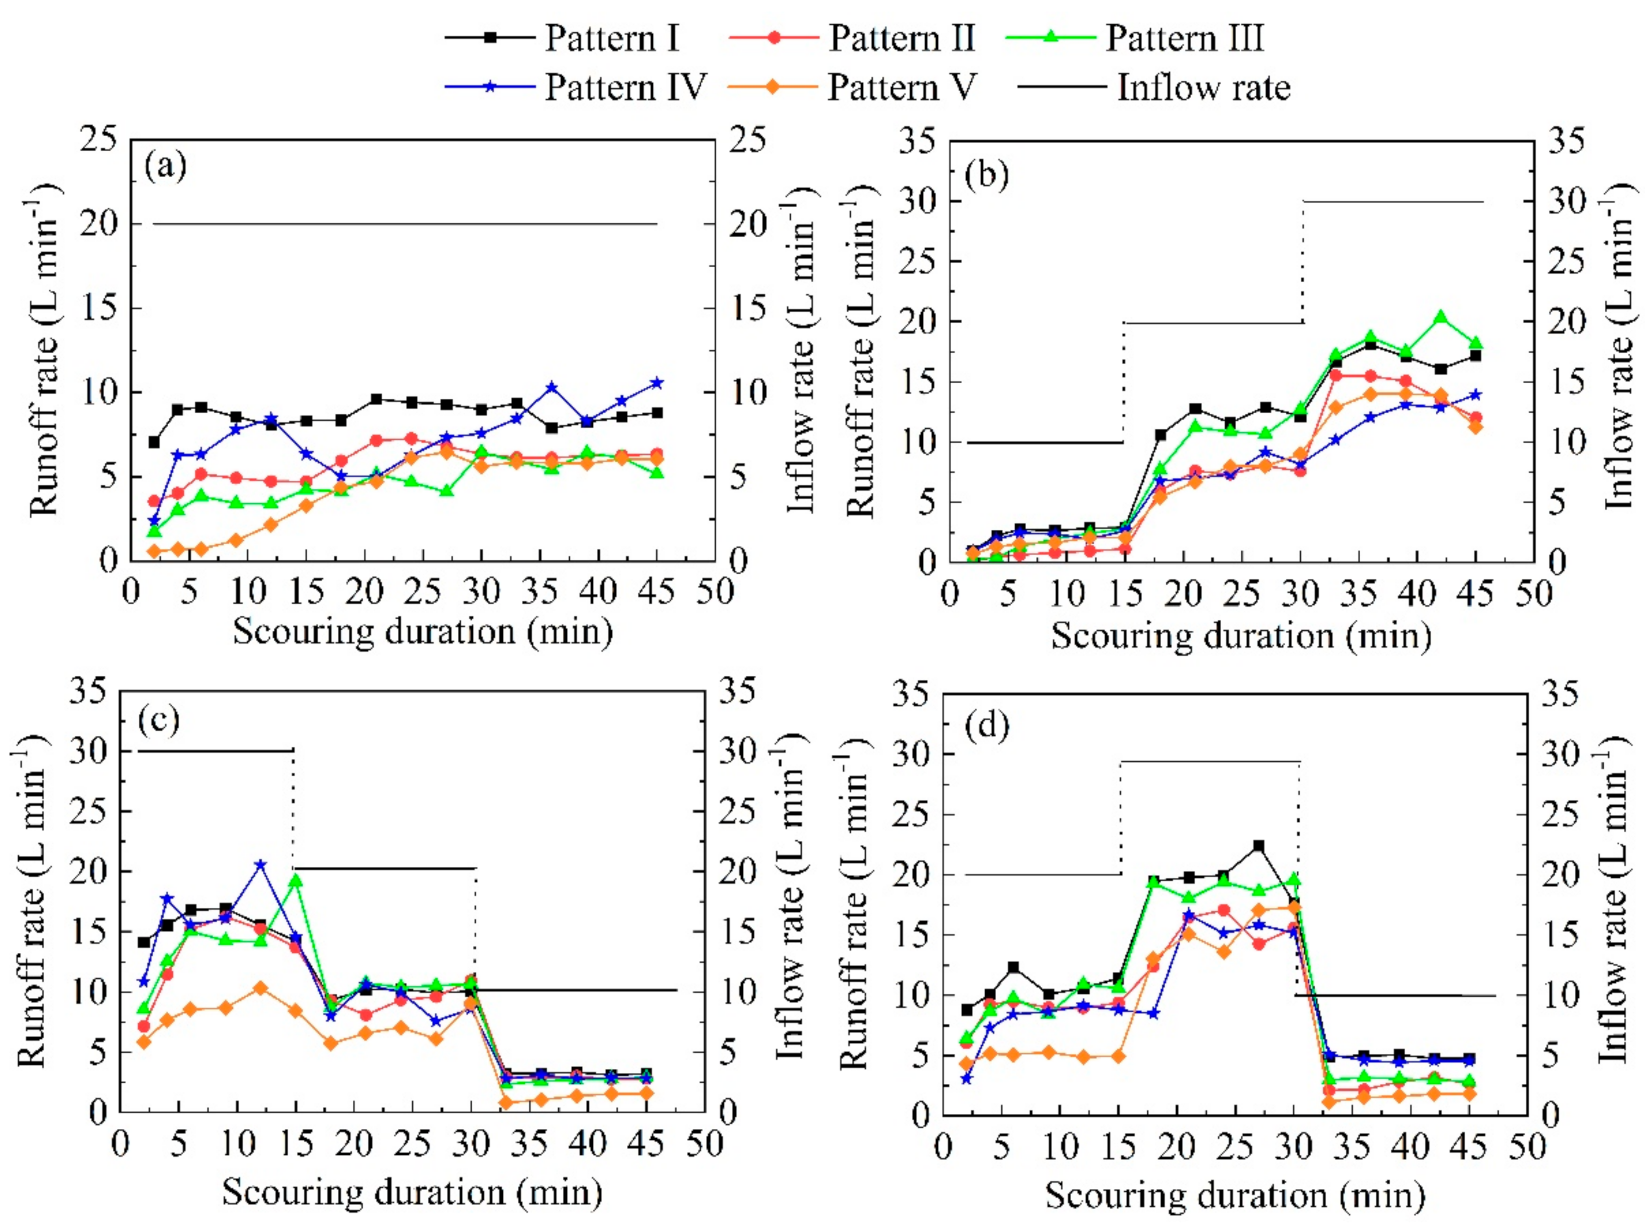
3.2.1. Runoff Rate
The runoff rates under different grass strip patterns are shown in Figure 6. Runoff rates varied significantly among the grass strip patterns with different inflow rates. With lengthened scouring duration, the runoff rates showed an increasing trend in the initial stage, then fluctuated, and finally tended to stabilize (Figure 6a). The changing trend of runoff rates with inflow rate was clear, i.e., they increased with increasing inflow rate and decreased with decreasing inflow rate (Figure 6b–d). These results indicated that changes in inflow rate patterns could cause changes in the soil infiltration capacity (Figure 5) and the redistribution of runoff with time. Regardless of the inflow rate pattern, the runoff rates of patterns II, III, IV, and V were less than that of pattern I (bare slope).
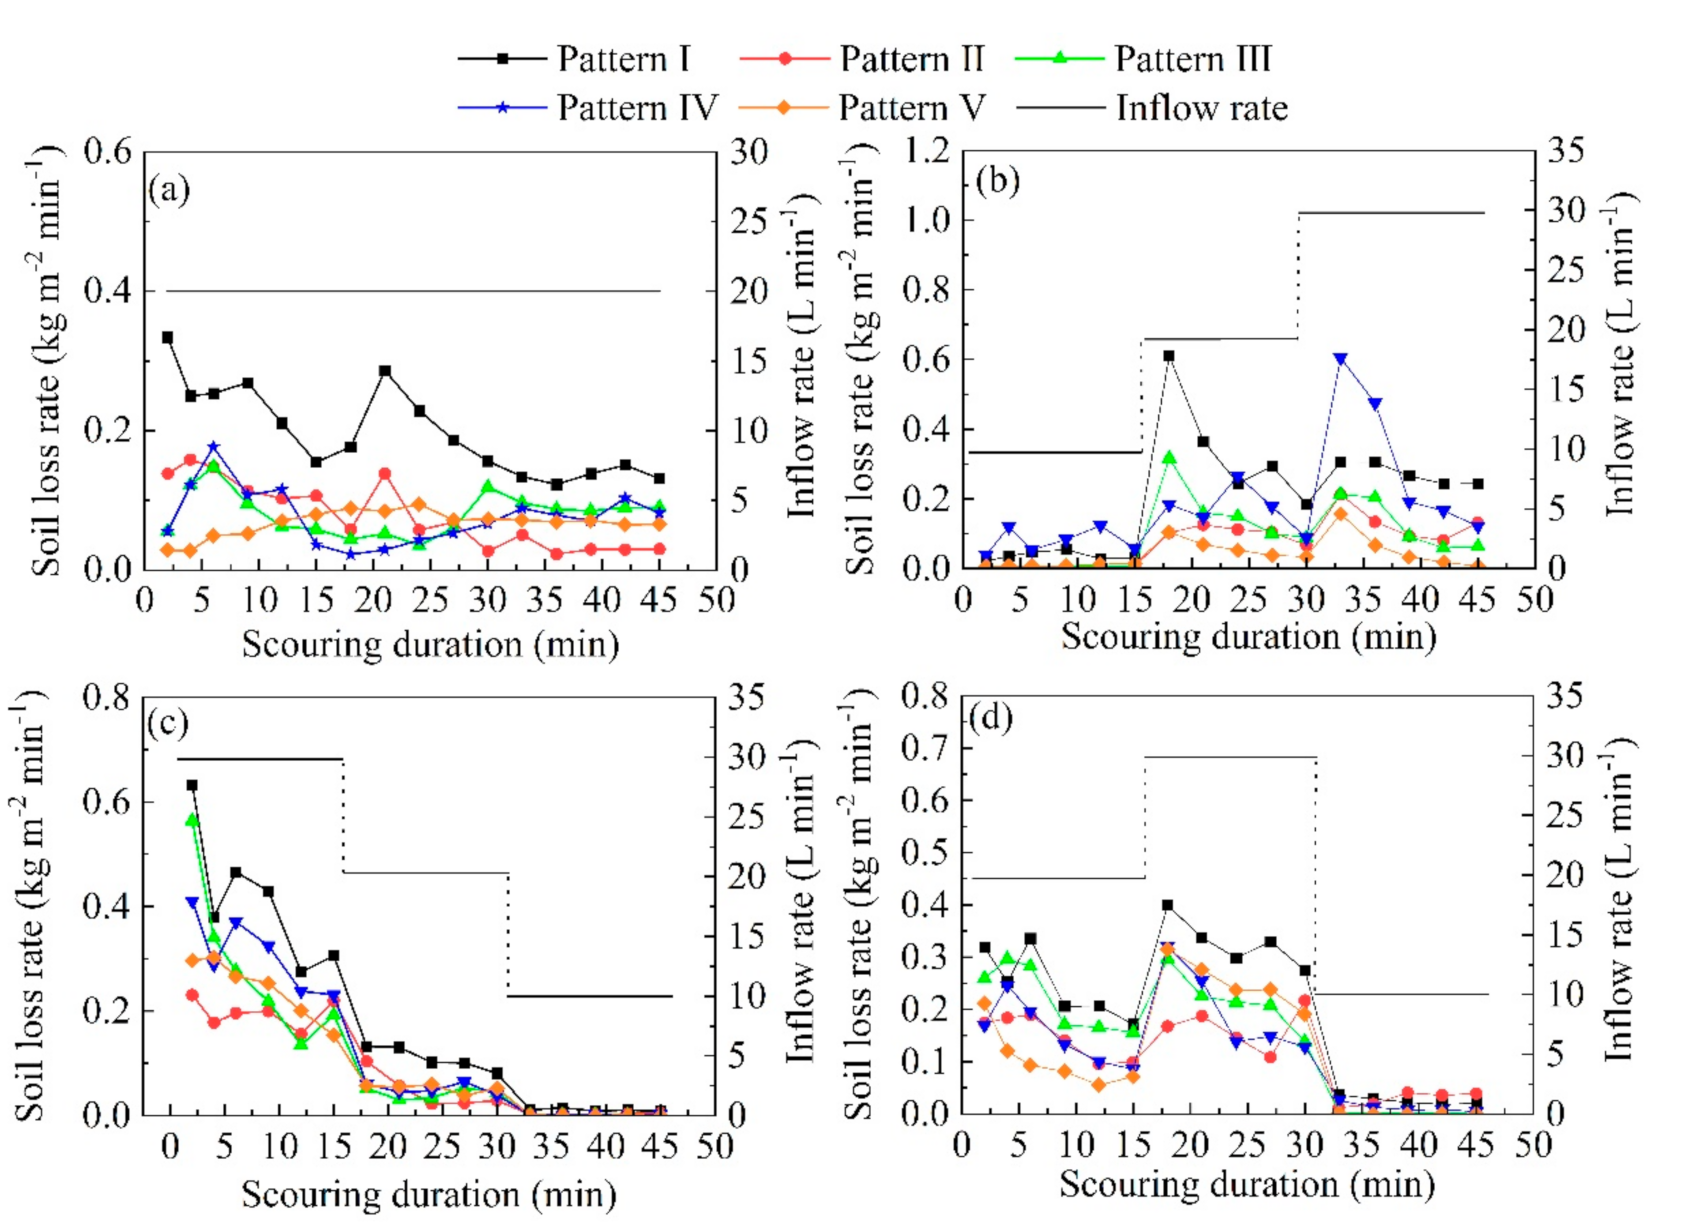
3.2.2. Soil Loss Rate
The soil loss rates for different grass strip patterns are shown in Figure 7. With lengthened scouring duration, the soil loss rates of patterns I, II, III, and IV showed fluctuating trends from 0 to 28 min and tended to stabilize from 28 min to 45 min. The soil loss rate process of pattern V was the most stable, changing in almost a straight line (Figure 7a). Similar to the runoff rate process, the changing trend of soil loss rates with inflow rate was clear, i.e., they increased with increasing inflow rate and decreased with decreasing inflow rate (Figure 7b–d). In general, regardless of the inflow rate, the soil loss rate of pattern I was higher than those of patterns II, III, IV, and V. Under the same grass strip pattern, the occurrence of peak flow and its time of occurrence led the runoff stripping capacity and sediment transport capacity to change (increased or decreased), which changed (accelerated or delayed) the timing of the transition from detachment-limited erosion to transport-limited erosion, resulting in the above process of soil loss rate change [9].
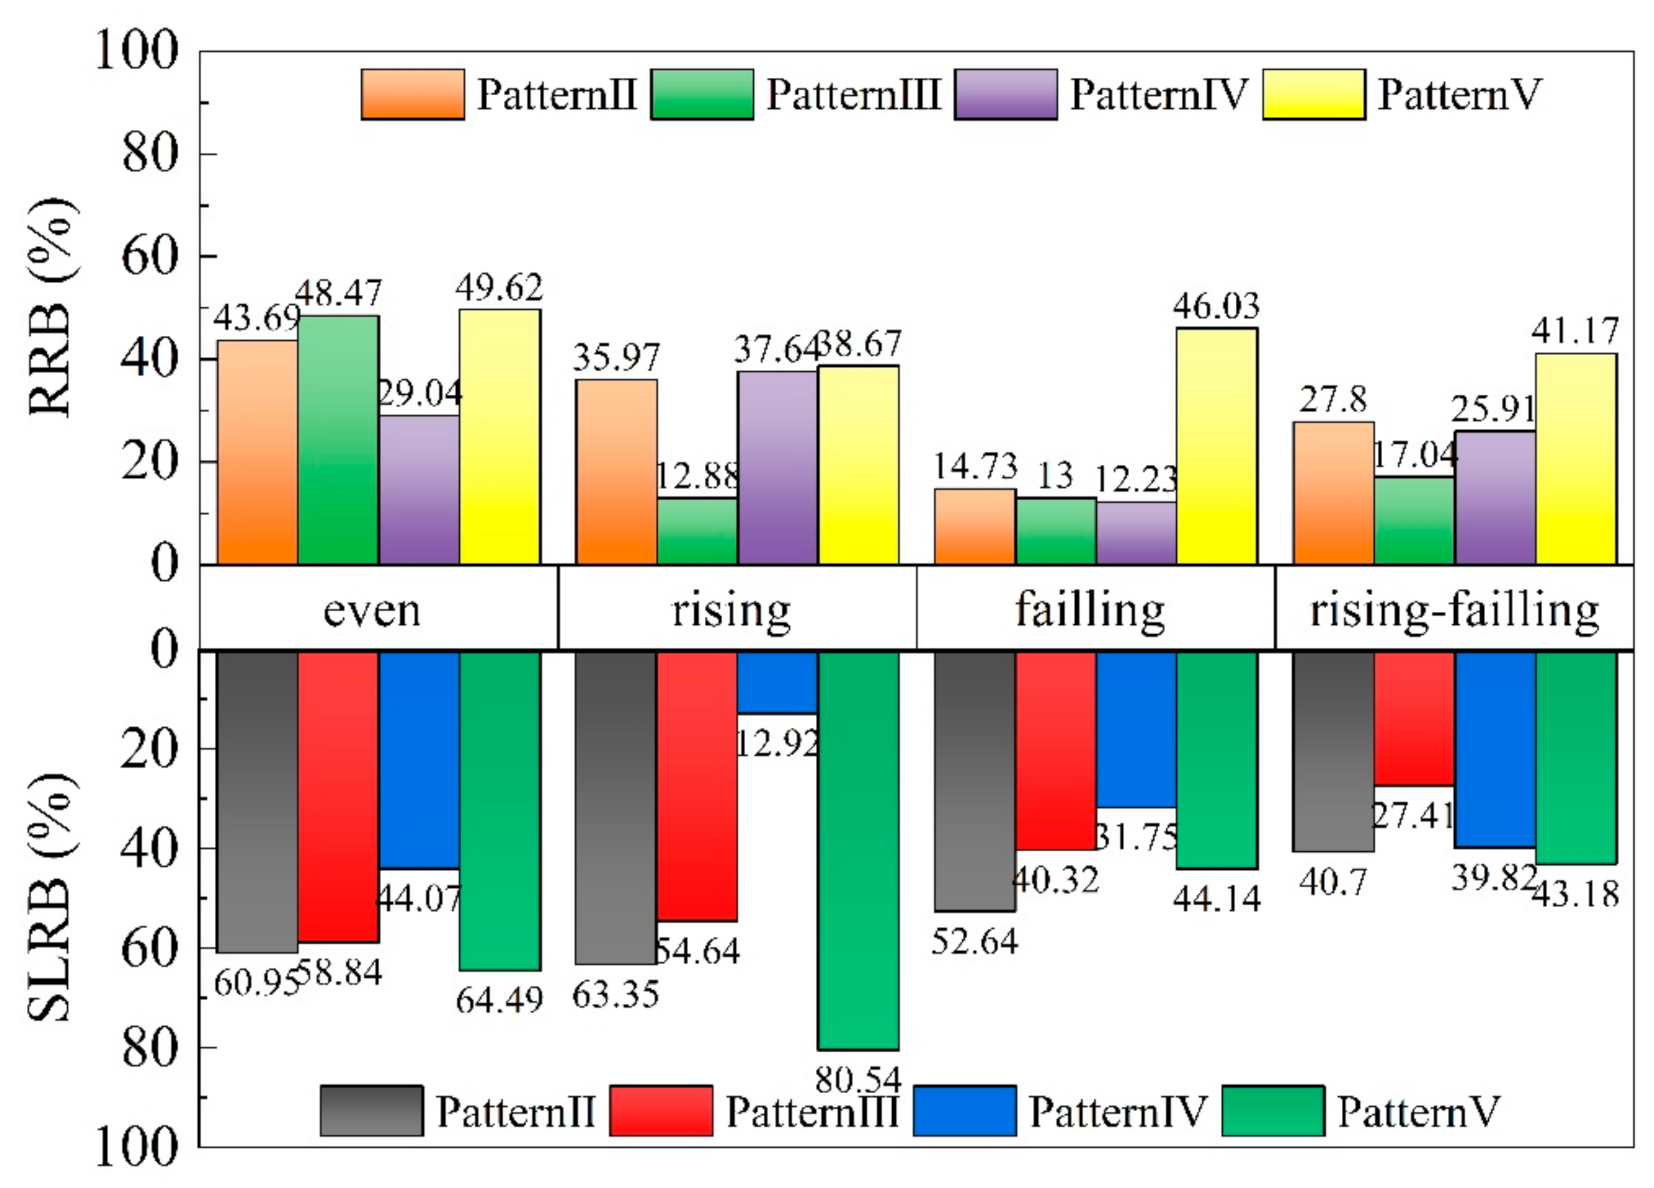
3.3. RRB and SLRB
Figure 8 shows the RRB and SLRB for different grass strip patterns. The RRBs of patterns II, III, IV, and V were 14.73–43.69%, 12.88–48.47%, 12.23–37.64%, and 38.67–49.62%, respectively (Figure 8). The average RRB of the grass strip patterns decreased as follows: pattern V > pattern II > pattern IV > pattern III. The SLRBs of patterns II, III, IV, and V were 40.70–63.35%, 27.41–58.84%, 12.92–44.07%, and 43.18–80.54%, respectively. The average SLRBs of grass strip patterns were similar to the average runoff reductions, with the sequence as follows: pattern V > pattern II > pattern III > pattern IV. In addition, the average SLRB of the grass strip patterns was higher than the average RRB. The above results indicated that the RRB and SLRB of pattern V were optimal under different inflow rate patterns when the grass strip was distributed on the slope in bands. Pattern V exhibited the best soil and water conservation effects and could reduce the average runoff and soil loss by 43.87% and 58.09%, respectively.
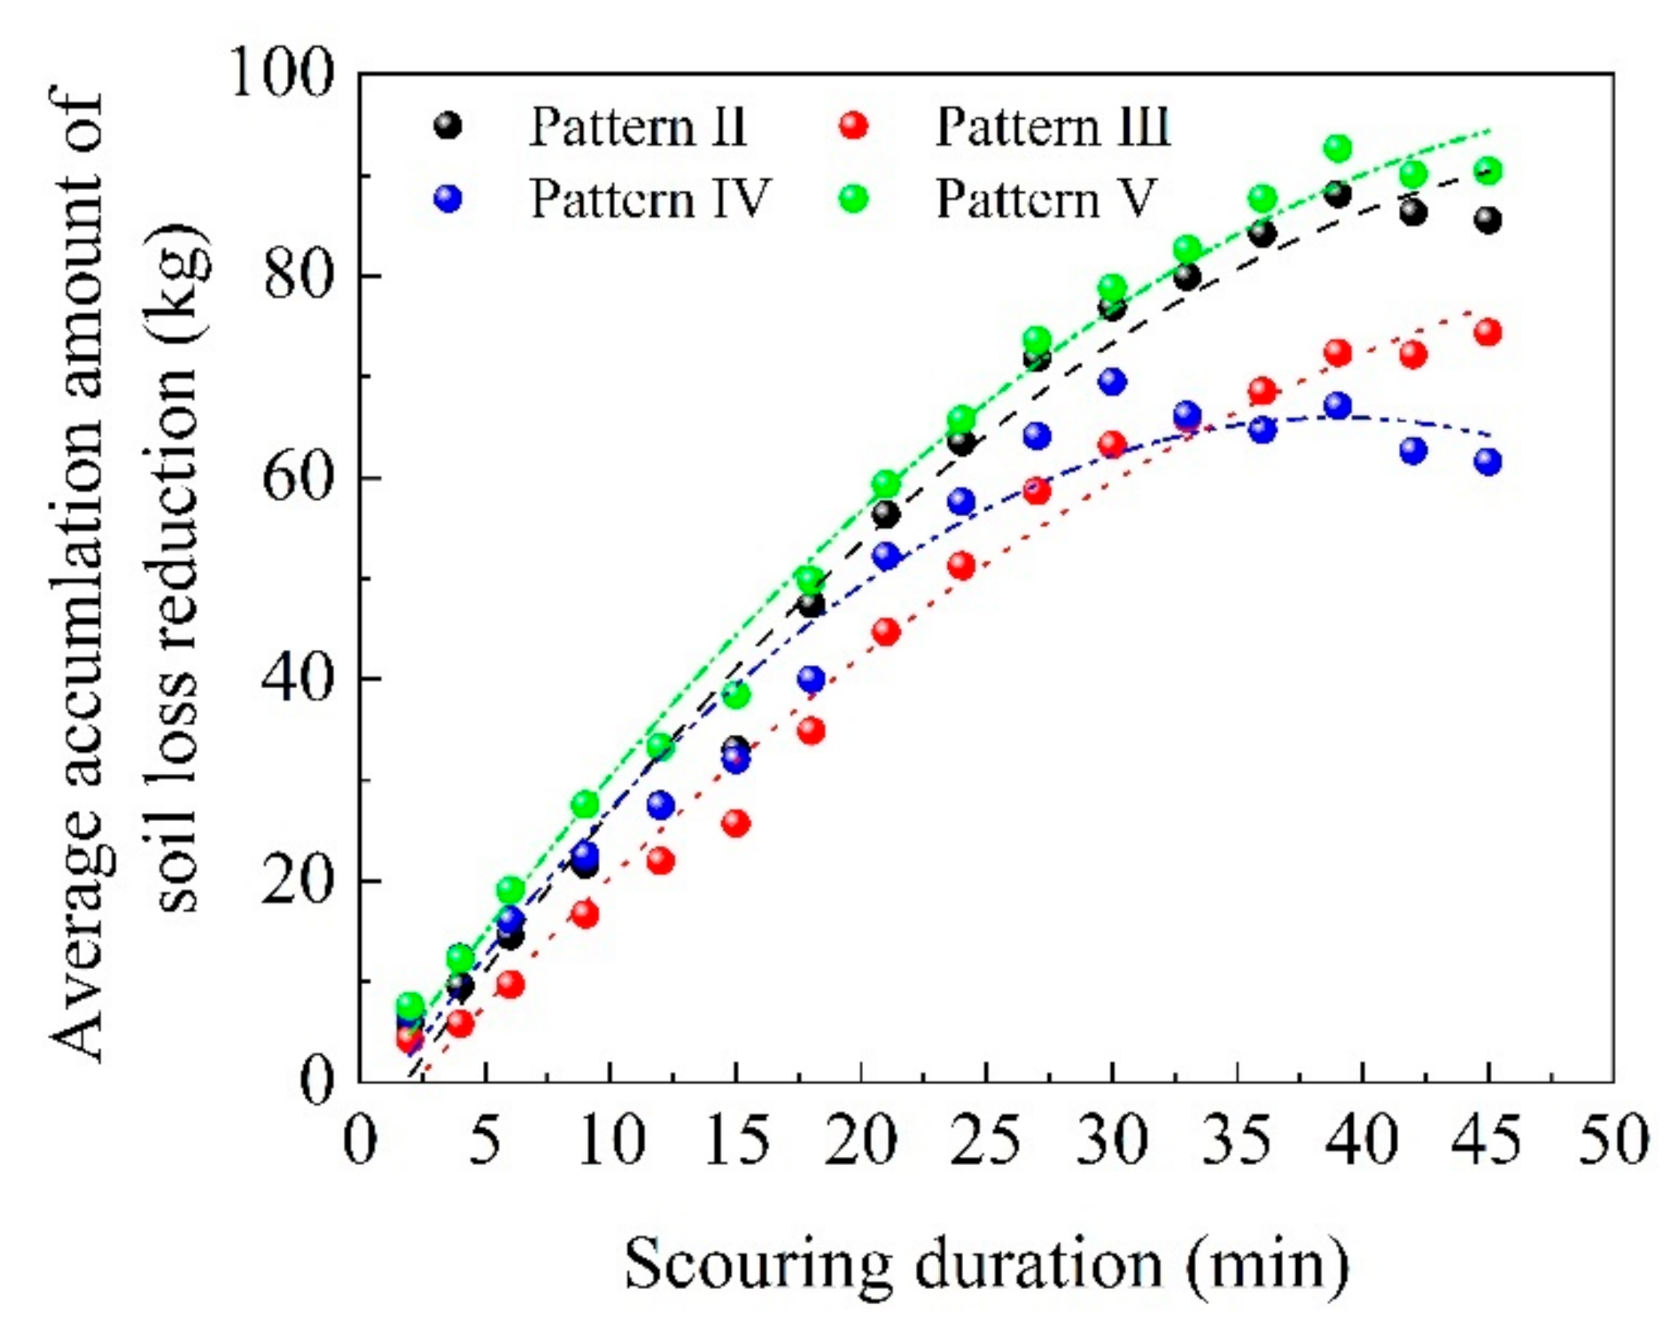
Regulation effects of soil and water conservation measures necessitate time scale analysis and evaluation. The preceding analysis indicated that the SLRB of grass strips was higher than the RRB, so the relationship between the average cumulative soil loss reduction and the scouring duration of different grass strip patterns was analyzed (Figure 9). The average cumulative soil loss reduction in patterns II, III, and V showed a rapid increase in the early stage and then stabilized with scouring duration. The average cumulative soil loss reduction in pattern IV decreased at the end of the experiment, i.e., the effect of soil loss reduction decreased.
Quadratic functions existed between the average cumulative soil loss reduction and scouring duration for patterns II, III, IV, and V, indicating maximum values for the cumulative soil loss reduction in the grass strips on the time scale (Table 1). The maximum values were related to the distribution patterns of the grass strips on the slope. For example, the average maximum cumulative soil loss reduction for pattern V (when the grass strip was distributed on the slope in bands) was 98.26 kg, which was higher than those for the other grass strip patterns (Table 1). In addition, these results indicated that the effect of the grass strip patterns on controlling soil erosion in spoil tips was time-limited.
3.4. Effects of Grass Strip Patterns on Sediment Regulation Capacity
To further analyze the sediment reduction benefits of different grass strip patterns on the slopes of spoil tips, the soil loss reduction caused by decreasing runoff (SRR), the soil loss reduction caused by flow–sediment relationship changes (SRS), and the corresponding efficiency coefficients of each were calculated in accordance with Equations (4) and (5) (Table 2). From Table 1, the SRRs of patterns II, III, IV, and V were 53.94, 38.78, 47.05, and 76.42 kg, respectively. The SRSs of patterns II, III, IV, and V were 43.27, 41.40, 15.87, and 26.25 kg, respectively. All SRRs were higher than SRSs (except for pattern II), indicating that runoff reduction to control soil erosion was the main reason for the grass strip patterns to regulate soil loss on the slopes of spoil tips. In addition, the efficiency coefficients of SRR under patterns IV and V were higher than those of SRS (a:b > 1), whereas the efficiency coefficients of SRS under pattern II and III conditions were lower than those of SRR (a:b < 1).
4. Discussion
The effect of grass on slope soil erosion can be evaluated mainly through two aspects. First, the aboveground part of grass could increase the roughness of the slope surface, slow down the flow velocity, improve the soil infiltration [32], and reduce the runoff energy [33,34]. Second, the underground part of grass can improve soil stability and shear strength to a certain extent [35,36]. The spatial distribution pattern of grass strips affected the soil infiltration (Figure 5) and sediment-carrying capacities of runoff, which changed the connectivity of runoff and sediment transport paths, contributing to the reduction in runoff and control of soil erosion, which is consistent with a previous study (i.e., [37]). When the inflow rate increased or the peak flow changed, the micro-geomorphological connectivity of different grass strip patterns was blocked; abrupt changes in slope runoff velocity increased, and the impact on slope runoff yield depended on the ability of grass strip to disperse runoff and change the runoff path and on the consistency between the relative positions of grass strip and the runoff path [38]. Therefore, changes in runoff and soil loss rate were observed (Figure 6 and Figure 7).
In this study, the RRBs of grass strip patterns II, III, IV, and V were 14.73–43.69%, 12.88–48.47%, 12.23–37.64%, and 38.67–49.62%, respectively (Figure 8); the SLRBs of patterns II, III, IV, and V were 40.70–63.35%, 27.41–58.84%, 12.92–44.07%, and 43.18–80.54%, respectively (Figure 8). Our results indicated that the different distributions and locations of grass strips on the slope were important reasons for the differences in soil erosion. The RRBs of grass strip patterns II, III, IV, and V were weaker than the SLRBs owing to the grass protection of soil and water by regulating runoff and sediment through direct sediment interception; consequently, sediment was intercepted by the surface vegetation canopy [39]. In other words, the function of grassland was based on direct sediment interception by the surface vegetation canopy to prevent soil erosion.
Pattern V exhibited the best soil and water conservation effects and could reduce the average runoff and soil loss by 43.87% and 58.09%, respectively. These results are similar to those in previous reports. For example, Valentin et al. (1999) suggested that a banded pattern is the best choice for vegetation restoration design in arid and semi-arid areas and can increase biomass and limit land degradation [40]. Raya et al. (2006) considered that vegetation strips can effectively reduce runoff and erosion, and different vegetation types have diverse effects [41]. However, Pan and Ma (2020) reported that the soil and water conservation effects of grass placed at the slope bottom were better than those of other patterns, mainly due to the control of rill formation and sediment deposition [37]. The reasons for the difference may be related to experimental conditions. Compared with the scouring condition, the rainfall condition required a certain time and slope length for the slope runoff to gather, and the runoff intensity at the slope bottom was often large, resulting in serious rill erosion [37,42]. In scouring experiments, runoff energy was greatest at the slope top; thus, rill erosion at the slope top tends to account for the greatest proportion of total erosion [43]. Zhang et al. (2016) also showed that downslope runoff scouring erosion caused by upslope inflow from a compacted platform is an important contributor to the acceleration of soil erosion in spoil tips [9]. Our results showed that pattern II (the grass strip was placed at the slope top) demonstrated better soil and water conservation effects and could reduce the average runoff and soil loss by 30.55% and 54.41%, respectively, second only to pattern V. The reason for this was that pattern II only intercepted sediment at the slope top. Although it had the effect of slowing the velocity and reducing the runoff, it had no effect at all on the runoff and sediment in the middle and lower parts of the slope. Compared with other grass strip patterns, pattern V could intercept slope runoff several times, thereby decreasing runoff velocity, increasing infiltration (its average value was the highest) (Figure 5), inhibiting rill development, and reducing the proportion of slope rill erosion. Therefore, the soil and water conservation effect was best when the grass strips were distributed on the slope in bands (pattern V).
Our results showed quadratic functions between the average cumulative soil loss reduction and scouring duration for patterns II, III, IV, and V, indicating that the effect of the grass strip patterns on controlling soil erosion in spoil tips was time-limited. This result is similar to that in a previous study (i.e., [43]). The reason for the time-limited effectiveness of different grass strips in controlling soil erosion may be related to the “sink–source” transition mechanism in the erosion process. In the initial stage of scouring, the aboveground canopy of the grass strips had a high sediment interception capacity, resulting in sediment deposition and becoming the “sink” area in the erosion process. As the scouring continued, the interception ability of the grass strips for runoff and sediment weakened. When runoff scouring the sediment deposited in the grass strips, the sediment content of the runoff increased, so the sediment deposited in the grass strips became the “source” area in the erosion process. Unfortunately, most studies have focused on the soil and water conservation effects of vegetation while neglecting the time effectiveness of the benefits (e.g., [32,44,45]). The time effectiveness of vegetation to control soil erosion will require a key interest in future studies. In addition, the grass strip patterns can be combined with engineering measures (e.g., level terrace and fish scale pit) in practical applications to avoid the transformation from “sink” to “source” and thus prolong the effectiveness of soil and water conservation of grass strips.
Runoff is the direct driver of slope erosion, and runoff regulation is the key to preventing and controlling soil erosion. The soil loss reduction caused by decreasing runoff (SRR) and soil loss reduction caused by changes in flow–sediment relationship (SRS) are two important aspects of soil and water conservation measures to regulate soil erosion [46]. Our results indicated that grass strip patterns mainly control slope erosion in spoil tips by SRR. The results of this study are consistent with those of a previous study (i.e., [46]). Grass strip pattern V gave full play to the role of the “retarding zone”; it alleviated the flow velocity, decreased the erosion degree of the runoff to the slope, and reduced erosion. In addition, the efficiency coefficient of SRR of pattern V was the largest. Hence, the grass strip pattern V (i.e., grass strips were distributed on a slope in bands) should be considered as a priority in the prevention of soil erosion in spoil tips.
5. Conclusions
The spatial distribution of vegetation is an important factor affecting slope erosion in spoil tips. The effects of different spatial distributions of grass strips (patterns II, III, IV, and V) on the slope erosion in spoil tips were analyzed under simulated scouring conditions.
The experimental results showed that the RRBs of grass strip patterns II, III, IV, and V were 14.73–43.69%, 12.88–48.47%, 12.23–37.64%, and 38.67–49.62%, respectively, and the SLRB values of patterns II, III, IV, and V were 40.70–63.35%, 27.41–58.84%, 12.92–44.07%, and 43.18–80.54%, respectively. The optimal grass strip pattern was when the grass strips were distributed on the slope in bands (pattern V). In this pattern, the soil and water conservation effects were best, with the runoff and soil loss average reduced by 43.87% and 58.09%, respectively. The grass strip patterns exerted a significant time-limited effect on controlling soil erosion. The maximum amount of soil loss reduction for patterns II, III, IV, and V was 93.02, 84.30, 65.86, and 98.26 kg, respectively. Soil loss reduction caused by decreasing runoff (SRR) for grass strip patterns was the main factor controlling erosion. The efficiency coefficient of soil loss reduction caused by decreasing runoff for pattern V was higher than that for the other patterns. The results revealed in this study could provide points of reference for the prevention and control of soil erosion in spoil tips.
Author Contributions
Conceptualization, Y.L. (Yongcai Lou) and Z.G.; methodology, Y.L. (Yongcai Lou) and Y.L. (Yonghong Li); formal analysis, G.S. and T.W.; software, Y.C. and B.S.; writing—original draft preparation, Y.L. (Yongcai Lou); writing—review and editing, all authors. All authors have read and agreed to the published version of the manuscript.
Funding
This research was supported by the National Natural Science Foundation of China (No. 41671283) and the 13th Five-Year National Key R&D Program of China (No. 2016YFC0501706-02).
Institutional Review Board Statement
Not applicable.
Informed Consent Statement
Not applicable.
Data Availability Statement
Not applicable.
Conflicts of Interest
The authors declare no conflict of interest.
References
- Niu, Y.B.; Gao, Z.L.; Li, Y.H.; Luo, K. Effect of rock fragment content on erosion processes of disturbed soil accumulation under field scouring conditions. J. Soils Sediments 2019, 19, 1708–1723. [Google Scholar] [CrossRef]
- Zhang, L.T.; Gao, Z.L.; Yang, S.W.; Li, Y.H.; Tian, H.W. Dynamic processes of soil erosion by runoff on engineered landforms derived from expressway construction: A case study of typical steep spoil heap. Catena 2015, 128, 108–121. [Google Scholar]
- Li, J.M.; Wang, W.L.; Guo, M.M.; Kang, H.L.; Wang, Z.G.; Huang, J.Q.; Sun, B.Y.; Wang, K.; Zhang, G.H.; Bai, Y. Effects of soil texture and gravel content on the infiltration and soil loss of spoil heaps under simulated rainfall. J. Soils Sediments 2020, 20, 3896–3908. [Google Scholar] [CrossRef]
- Borrelli, P.; Robinson, D.A.; Fleischer, L.R.; Lugato, E.; Ballabio, C.; Alewell, C.; Meusburger, K.; Modugno, S.; Schutt, B.; Ferro, V.; et al. An assessment of the global impact of 21st century land use change on soil erosion. Nat. Commun. 2017, 8, 2013. [Google Scholar] [CrossRef] [PubMed] [Green Version]
- Conforti, M.; Ietto, F. Influence of Tectonics and Morphometric Features on the Landslide Distribution: A Case Study from the Mesima Basin (Calabria, South Italy). J. Earth Sci. 2020, 31, 393–409. [Google Scholar] [CrossRef]
- Cerdà, A. Soil water erosion on road embankments in eastern Spain. Sci. Total Environ. 2007, 378, 151–155. [Google Scholar] [CrossRef]
- Lv, G.; Li, Y.; Ning, B.; Wei, Z.; Wang, D. Soil erosion process of platform-slope system of dump under heavy rain. J. China Coal Soc. 2021, 46, 1463–1476. [Google Scholar]
- Zheng, F.; Huang, C.; Norton, L.D. Vertical Hydraulic Gradient and Run-On Water and Sediment Effects on Erosion Processes and Sediment Regimes. Soil Sci. Soc. Am. J. 2000, 64, 4–11. [Google Scholar] [CrossRef]
- Zhang, L.T.; Gao, Z.L.; Li, Z.B.; Tian, H.W. Downslope runoff and erosion response of typical engineered landform to variable inflow rate patterns from upslope. Nat. Hazards 2016, 80, 775–796. [Google Scholar] [CrossRef]
- Niu, Y.; Wu, X.; Gao, Z.; Li, Y. Characteristics of soil erosion on engineering accumulation slope under the rainfall and inflow conditions. Trans. Chin. Soc. Agric. Eng. 2020, 36, 69–77. [Google Scholar]
- Zhu, P.; Zhang, G.; Wang, H.; Yang, H.; Zhang, B.; Wang, L. Effectiveness of typical plant communities in controlling runoff and soil erosion on steep gully slopes on the Loess Plateau of China. J. Hydrol. 2021, 602, 126714. [Google Scholar] [CrossRef]
- Hou, G.; Bi, H.; Huo, Y.; Wei, X.; Zhu, Y.; Wang, X.; Liao, W. Determining the optimal vegetation coverage for controlling soil erosion in Cynodon dactylon grassland in North China. J. Clean. Prod. 2020, 244, 118771. [Google Scholar] [CrossRef]
- Liu, J.; Gao, G.; Wang, S.; Jiao, L.; Wu, X.; Fu, B. The effects of vegetation on runoff and soil loss: Multidimensional structure analysis and scale characteristics. J. Geogr. Sci. 2018, 28, 59–78. [Google Scholar] [CrossRef] [Green Version]
- Mayor, Á.G.; Bautista, S.; Small, E.E.; Dixon, M.; Bellot, J. Measurement of the connectivity of runoff source areas as determined by vegetation pattern and topography: A tool for assessing potential water and soil losses in drylands. Water Resour. Res. 2008, 44, 1–13. [Google Scholar] [CrossRef]
- Feng, T.; Wei, W.; Chen, L.; Rodrigo-Comino, J.; Die, C.; Feng, X.; Ren, K.; Brevik, E.C.; Yu, Y. Assessment of the impact of different vegetation patterns on soil erosion processes on semiarid loess slopes. Earth Surf. Proc. Land. 2018, 43, 1860–1870. [Google Scholar] [CrossRef]
- Shi, P.; Li, P.; Li, Z.; Sun, J.; Wang, D.; Min, Z. Effects of grass vegetation coverage and position on runoff and sediment yields on the slope of Loess Plateau, China. Agric. Water Manag. 2022, 259, 107231. [Google Scholar] [CrossRef]
- Wang, H.; Zhang, J.; Sun, R.; Zhang, J. Effects of different vegetation slope patterns on infiltration and characteristics of runoff and sediment production in the loess area of western Shanxi Province, northern China. J. Beijing For. Univ. 2021, 43, 85–95. [Google Scholar]
- Zhang, X.; Li, P.; Li, Z.B.; Yu, G.Q.; Li, C. Effects of precipitation and different distributions of grass strips on runoff and sediment in the loess convex hillslope. Catena 2018, 162, 130–140. [Google Scholar] [CrossRef]
- Li, J.; Li, L.; Wang, Z.; Zhang, C.; Wang, Y.; Wang, W.; Zhang, G.; Huang, J.; Li, H.; Lv, X.; et al. The contributions of the roots, stems, and leaves of three grass species to water erosion reduction on spoil heaps. J. Hydrol. 2021, 603, 127003. [Google Scholar] [CrossRef]
- Hao, H.; Qin, J.; Sun, Z.; Guo, Z.; Wang, J. Erosion-reducing effects of plant roots during concentrated flow under contrasting textured soils. Catena 2021, 203, 105378. [Google Scholar] [CrossRef]
- Smith, D.J.; Wynn-Thompson, T.M.; Williams, M.A.; Seiler, J.R. Do roots bind soil? Comparing the physical and biological role of plant roots in fluvial streambank erosion: A mini-JET study. Geomorphology 2021, 375, 107523. [Google Scholar] [CrossRef]
- Liu, J.; Zhou, Z.; Liu, J.E.; Su, X. Effects of root density on soil detachment capacity by overland flow during one growing season. J. Soils Sediments 2022, 22, 1–11. [Google Scholar] [CrossRef]
- De Almeida, W.S.; Panachuki, E.; de Oliveira, P.T.S.; Da Silva Menezes, R.; Sobrinho, T.A.; de Carvalho, D.F. Effect of soil tillage and vegetal cover on soil water infiltration. Soil Tillage Res. 2018, 175, 130–138. [Google Scholar] [CrossRef]
- Fu, B.; Zhao, W.; Chen, L.; Liu, Z.; Lü, Y. Eco-hydrological effects of landscape pattern change. Landsc. Ecol. Eng. 2005, 1, 25–32. [Google Scholar] [CrossRef]
- Guo, T.L.; Wang, Q.J.; Li, D.Q.; Wu, L.S. Sediment and solute transport on soil slope under simultaneous influence of rainfall impact and scouring flow. Hydrol. Processes 2010, 24, 1446–1454. [Google Scholar] [CrossRef]
- Luk, S.H.; Merz, W. Use of the salt tracing technique to determine the velocity of overland flow. Soil Technol. 1992, 4, 289–301. [Google Scholar]
- Tian, P.; Xu, X.Y.; Pan, C.Z.; Hsu, K.L.; Yang, T.T. Impacts of rainfall and inflow on rill formation and erosion processes on steep hillslopes. J. Hydrol. 2017, 548, 24–39. [Google Scholar] [CrossRef]
- Zhao, X.; Huang, J.; Wu, P.; Gao, X. The dynamic effects of pastures and crop on runoff and sediments reduction at loess slopes under simulated rainfall conditions. Catena 2014, 119, 1–7. [Google Scholar] [CrossRef]
- Zhang, L.; Li, Z.; Wang, H.; Xiao, J. Influence of intra-event-based flood regime on sediment flow behavior from a typical agro-catchment of the Chinese Loess Plateau. J. Hydrol. 2016, 538, 71–81. [Google Scholar] [CrossRef]
- Zhang, J.; Zhang, X.; Li, R.; Chen, L.; Lin, P. Did streamflow or suspended sediment concentration changes reduce sediment load in the middle reaches of the Yellow River? J. Hydrol. 2017, 546, 357–369. [Google Scholar] [CrossRef]
- Zhang, J.; Gao, G.; Fu, B.; Zhang, L. Explanation of climate and human impacts on sediment discharge change in Darwinian hydrology: Derivation of a differential equation. J. Hydrol. 2018, 559, 827–834. [Google Scholar] [CrossRef]
- Li, C.; Pan, C. The relative importance of different grass components in controlling runoff and erosion on a hillslope under simulated rainfall. J. Hydrol. 2018, 558, 90–103. [Google Scholar] [CrossRef]
- Chang, E.; Li, P.; Li, Z.; Su, Y.; Zhang, Y.; Zhang, J.; Liu, Z.; Li, Z. The Impact of Vegetation Successional Status on Slope Runoff Erosion in the Loess Plateau of China. Water 2019, 11, 2614. [Google Scholar] [CrossRef] [Green Version]
- Quinton, J.N.; Edwards, G.M.; Morgan, R.P.C. The influence of vegetation species and plant properties on runoff and soil erosion: Results from a rainfall simulation study in south east Spain. Soil Use Manag. 1997, 13, 143–148. [Google Scholar] [CrossRef]
- Vannoppen, W.; Vanmaercke, M.; De Baets, S.; Poesen, J. A review of the mechanical effects of plant roots on concentrated flow erosion rates. Earth Sci. Rev. 2015, 150, 666–678. [Google Scholar] [CrossRef] [Green Version]
- Gyssels, G.; Poesen, J.; Bochet, E.; Li, Y. Impact of plant roots on the resistance of soils to erosion by water: A review. Prog. Phys. Geogr. Earth Environ. 2005, 29, 189–217. [Google Scholar] [CrossRef] [Green Version]
- Pan, C.Z.; Ma, L. How the spatial distribution of grass contributes to controlling hillslope erosion. Hydrol. Processes 2020, 34, 68–81. [Google Scholar] [CrossRef]
- Lou, Y.; Gao, Z.; Li, Y.; Qi, X.; Zhang, H.; Chen, Z.; Su, Y.; Feng, Z. Vegetation regulation on slopes of engineering accumulation under different upslope runoff patterns. Trans. CSAE 2019, 35, 144–153. [Google Scholar]
- Zhang, X.; Yu, G.Q.; Li, Z.B.; Li, P. Experimental Study on Slope Runoff, Erosion and Sediment under Different Vegetation Types. Water Resour. Manag. 2014, 28, 2415–2433. [Google Scholar] [CrossRef]
- Valentin, C.; D’Herbès, J.M.; Poesen, J. Soil and water components of banded vegetation patterns. Catena 1999, 37, 1–24. [Google Scholar] [CrossRef]
- Raya, A.M.; Zuazo, V.H.D.; Martínez, J.R.F. Soil erosion and runoff response to plant-cover strips on semiarid slopes (SE Spain). Land Degrad. Dev. 2006, 17, 1–11. [Google Scholar] [CrossRef]
- Jiang, F.S.; Zhan, Z.Z.; Chen, J.L.; Lin, J.S.; Wang, M.K.; Ge, H.L.; Huang, Y.H. Rill erosion processes on a steep colluvial deposit slope under heavy rainfall in flume experiments with artificial rain. Catena 2018, 169, 46–58. [Google Scholar] [CrossRef]
- Yang, S.; Gao, Z.L.; Li, Y.H.; Niu, Y.B.; Su, Y.; Wang, K. Erosion control of hedgerows under soils affected by disturbed soil accumulation in the slopes of loess plateau, China. Catena 2019, 181, 104079. [Google Scholar] [CrossRef]
- Zhou, Z.C.; Shangguan, Z.P. The effects of ryegrass roots and shoots on loess erosion under simulated rainfall. Catena 2007, 70, 350–355. [Google Scholar] [CrossRef]
- Pan, C.; Shangguan, Z.; Lei, T. Influences of grass and moss on runoff and sediment yield on sloped loess surfaces under simulated rainfall. Hydrol. Processes 2006, 20, 3815–3824. [Google Scholar] [CrossRef]
- Zhang, L.; Dong, J.; Yuan, L.; Zhu, Y.; Huang, Z.; Li, W.; Wang, H.; Tang, L.; Tian, H.; Gao, Z. Sediment-reducing benefits by runoff regulation under engineering measures in steep slope of abandoned soil deposits in Chinese loessial region. Trans. CSAE 2019, 35, 101–109. [Google Scholar]
Figure 1.
Location of the experimental site.

Figure 2.
Layout of the field scouring experimental setup.

Figure 3.
Inflow rate patterns designed for the experimental runoff plot: (a) even; (b) rising; (c) faling; (d) rising-faling.
Figure 3.
Inflow rate patterns designed for the experimental runoff plot: (a) even; (b) rising; (c) faling; (d) rising-faling.

Figure 4.
The experimental runoff plots showing the different distributions of grass strip: (a) diagram of plot designs; (b) grass strip pattern layouts and positions on the slope.
Figure 4.
The experimental runoff plots showing the different distributions of grass strip: (a) diagram of plot designs; (b) grass strip pattern layouts and positions on the slope.

Figure 5.
Average soil infiltration under different treatments.

Figure 6.
Changes in runoff rate under different inflow rates for different grass strip patterns: (a) even, (b) rising, (c) falling, and (d) rising–falling.
Figure 6.
Changes in runoff rate under different inflow rates for different grass strip patterns: (a) even, (b) rising, (c) falling, and (d) rising–falling.

Figure 7.
Changes in soil loss rate under different inflow rates for different grass strip patterns: (a) even, (b) rising, (c) falling, and (d) rising–falling.
Figure 7.
Changes in soil loss rate under different inflow rates for different grass strip patterns: (a) even, (b) rising, (c) falling, and (d) rising–falling.

Figure 8.
RRB and SLRB under different grass strip and inflow rate patterns.

Figure 9.
Relationship between average accumulation amount of soil loss reduction and scouring duration under different grass strip patterns.
Figure 9.
Relationship between average accumulation amount of soil loss reduction and scouring duration under different grass strip patterns.


Table 1.
Fitting equations of average accumulation amount of soil loss reduction with respect to scouring duration under different grass strip patterns.
Table 1.
Fitting equations of average accumulation amount of soil loss reduction with respect to scouring duration under different grass strip patterns.
| Grass Strip Patterns | Fitting Equation | R2 | p | Critical Value (min) | Maximum Value (kg) |
|---|---|---|---|---|---|
| Pattern II | y = −0.0341x2 + 3.6855x − 6.5607 | 0.9854 | <0.01 | 54.04 | 93.02 |
| Pattern III | y = −0.0229x2 + 2.8790x − 6.1825 | 0.9870 | <0.01 | 62.86 | 84.30 |
| Pattern IV | y = −0.0464x2 + 3.6087x − 4.3088 | 0.9676 | <0.01 | 38.89 | 65.86 |
| Pattern V | y = −0.0321x2 + 3.5932x − 2.2888 | 0.9920 | <0.01 | 55.97 | 98.26 |
Table 2.
SRR, SRR, and their corresponding efficiency coefficients for different grass strip patterns.
Table 2.
SRR, SRR, and their corresponding efficiency coefficients for different grass strip patterns.
| Grass Strip Patterns | SRR (kg) | SRS (kg) | a | b |
|---|---|---|---|---|
| Pattern II | 53.94 | 43.27 | 0.31 | 0.36 |
| Pattern III | 38.78 | 41.40 | 0.22 | 0.30 |
| Pattern IV | 47.05 | 15.87 | 0.27 | 0.12 |
| Pattern V | 76.42 | 26.25 | 0.43 | 0.26 |
Note: a is the efficiency coefficient of soil loss reduction caused by decreasing runoff, and b is the efficiency coefficient of soil loss reduction caused by changes in flow–sediment relationship.
Publisher’s Note: MDPI stays neutral with regard to jurisdictional claims in published maps and institutional affiliations. |
© 2022 by the authors. Licensee MDPI, Basel, Switzerland. This article is an open access article distributed under the terms and conditions of the Creative Commons Attribution (CC BY) license (https://creativecommons.org/licenses/by/4.0/).
Share and Cite
MDPI and ACS Style
Lou, Y.; Gao, Z.; Li, Y.; Sun, G.; Wu, T.; Cen, Y.; Su, B. Effects of Distributions of Grass Strips on Soil Erosion in Spoil Tips. Water 2022, 14, 913. https://doi.org/10.3390/w14060913
AMA Style
Lou Y, Gao Z, Li Y, Sun G, Wu T, Cen Y, Su B. Effects of Distributions of Grass Strips on Soil Erosion in Spoil Tips. Water. 2022; 14(6):913. https://doi.org/10.3390/w14060913
Chicago/Turabian StyleLou, Yongcai, Zhaoliang Gao, Yonghong Li, Guanfang Sun, Tong Wu, Yunfeng Cen, and Bingni Su. 2022. "Effects of Distributions of Grass Strips on Soil Erosion in Spoil Tips" Water 14, no. 6: 913. https://doi.org/10.3390/w14060913
Note that from the first issue of 2016, this journal uses article numbers instead of page numbers. See further details here.