
Characterizing the Groundwater Flow Regime in a Landslide Recharge Area Using Stable Isotopes: A Case Study of the Urbas Landslide Area in NW Slovenia


1
Geological Survey of Slovenia, Dimičeva ulica 14, 1000 Ljubljana, Slovenia
2
Environmental Protection, Faculty of Civil and Geodetic Engineering, University of Ljubljana, Jamova cesta 2, 1000 Ljubljana, Slovenia
*
Author to whom correspondence should be addressed.
Water 2022, 14(6), 912; https://doi.org/10.3390/w14060912
Submission received: 24 January 2022
/
Revised: 10 March 2022
/
Accepted: 11 March 2022
/
Published: 15 March 2022
(This article belongs to the Special Issue Isotope Fingerprints of Precipitation in Groundwater, Lakes and Rivers)
Abstract
:Slope stability strongly depends on the prevailing hydrological and hydrogeological conditions. The amount and intensity of precipitation and changing groundwater levels are important landslide triggering factors. Environmental tracers, including the chemical and stable isotope compositions of precipitation and groundwater, were used to gain insight into the groundwater dynamics of the Urbas landslide. The landslide is situated in a mountainous area with steep slopes and high precipitation amount and poses a high risk for the safety of the Koroška Bela settlement that lies downstream. The stable isotope analyses of oxygen-18 (18O) and deuterium (2H) in the precipitation and groundwater were used to estimate the groundwater mean residence time and the average altitude of the landslide recharge area. This information will help to plan and prioritize remedial landslide measures aiming to reduce the recharge of the landslide body and, thus, lower the risk of transformation of the sliding material into debris flow. The results of the chemical analysis of samples taken from springs and a piezometer show a Ca–HCO3 water type. This indicates low water–rock interaction in a landslide area composed of Upper Carboniferous and Permian clastic rocks and points to upper laying carbonate rocks and scree deposits as the main recharge area. Water samples for stable isotope analyses of δ18O and δ2H were collected from a rain gauge, springs, and a piezometer over a two-year period (2018–2020). The estimated mean recharge altitude of the groundwater at sampling points was from approximately 1700 to 1800 m a.s.l. with a mean residence time of 2–5 months.
Keywords:
landslide; groundwater; stable isotopes; oxygen-18; deuterium; hydrogeology; recharge dynamic1. Introduction
Rainfall is the main cause of slope failures in Slovenia [1,2]. Infiltrated water can contribute to the increase of pore pressures, higher saturation of the ground, and the rising of the groundwater table, all of which may cause slope failures [3]. In addition to the in situ infiltration, groundwater in the landslide can result from lateral flow or exfiltration from the bedrock [4,5]. Therefore, solid hydrogeological knowledge of a landslide assures a better understanding of its dynamics, better predictions of its behavior, and an optimized selection and better efficiency of remediation measures [6,7]. Interpretation of slope stability requires multiple sources of information, among other information on the aquifer’s structure, hydrodynamic parameters, and their spatial and temporal evolution related to slope deformation [6,8,9,10]. Recent studies on landslide hydrology and hydrogeology show extensive use of hydrogeochemical and water isotope methods for monitoring landslide development in space and time [11,12]. These methods can be used to determine the origin [13], the flow paths [11,14], the average recharge altitude [13], and residence time [15] of the groundwater within a landslide body. Using environmental tracers, such as stable oxygen and hydrogen isotopes that are not particularly affected by water–rock reactions at normal temperatures [16,17], proved very useful in identifying the hydrological factors contributing to landslides in mountainous areas [14]. Similarly, the content of major ions in groundwater samples can provide us with information about the chemical characteristics of the aquifer (e.g., water type and mineral weathering), which are important for a proper characterization of the hydrogeological conditions in the landslide body and its recharge area [18,19,20]. However, the interpretation of aquifer systems based only on their chemical characteristics may oversimplify or even miss important processes [21,22]. Isotopic geochemistry can provide additional information that can clarify more complex hydrogeochemical processes and help to characterize groundwater systems [22].
The main objective of the study was to determine the origin of the groundwater in the landslide area and obtain information on groundwater flow patterns and dynamics, which will serve to support the planning of remedial landslide measures. Due to the steep topography and difficult access, remedial measures in the landslide area must be carefully planned. Knowledge of hydrological conditions serves as a basis for prioritization of remedial measures and implementation of a stepwise approach that can help to rationalize costs of remedial activities in the study area. To achieve this, the average recharge altitude and mean residence time (MRT) of the Urbas springs are estimated based on the local precipitation and the small nearby (5 km away) springs of Malnež and Španov vrh.
The Study Area
The Urbas landslide (Figure 1) is situated in the Potoška planina area in NW Slovenia, in the Karavanke mountain range on the southern slopes of the Vajnež and Potoški Stol peaks. Several site investigations and monitoring projects have been carried out in recent years that have helped improve our knowledge about the landslide [23,24,25,26,27,28]. The landslide body extends over an area of some 180 m2 with steep slopes (generally from 30° to 70°) at altitudes of 1150–1300 m a.s.l. [23]. The sliding mass is composed of tectonically deformed and weathered Upper Carboniferous to Permian claystone, siltstone, sandstone, and conglomerate as well as various Permian and Triassic carbonate and clastic rocks covered with a large amount of talus material. This material originates from upper lying Triassic to Lower Jurassic carbonate rocks and the higher-lying Dachstein limestone [24,29]. Landslide source areas and their boundaries were determined based on engineering–geological mapping [27]. The landslide was characterized as a deep-seated rotational slide with the main sliding surface at approximately 15 m below the surface [27]. The depth of the main sliding surface was interpreted using inclinometer measurements. With Global Navigation Satellite System estimated annual horizontal surface displacements are close to 6 cm for the upper part of the landslide and more than 40 cm for its lower part [26].
The average annual precipitation height measured at the nearest meteorological station in Javorniški Rovt (longitude = 14.1012, latitude = 46.4572), located 2.8 km NW at an altitude of 939 m a.s.l. in the observation period 1981–2010 was 1950 mm with two peaks, with the main one in autumn and the second in spring [30]. On average, 110 days per year with snow cover were observed over the period 1961–2009 [31,32], with an average annual air temperature for the period 1981–2010 of 4–6°C [30]. At meteorological station Javorniški Rovt, the total snow height was 385 cm, 162 cm, and 91 cm in winters 2017/2018, 2018/2019, and 2019/2020, respectively. On average, the snow cover at the Zgornja Radovna meteorological station (longitude = 13.9427, latitude = 46.4282, elevation = 755 m a.s.l.), located 12 km SW last for 108 days a year [33]. The climate at the Kredarica meteorological station (longitude = 13.8489, latitude = 46.3787, elevation = 2513 m a.s.l.), located 21 km SW, is even more significantly affected by more than 260 days a year of snow cover [34].
The karst-fissured aquifers are developed in carbonate rocks that form the upper part of the landslide recharge area. The groundwater level within these aquifers is strongly related to precipitation amounts and is highly variable [23]. No springs are observed in this area, and it is assumed that the groundwater level is deep below the surface, especially during low hydrological conditions. Groundwater can also be found in sediments formed by slowly slipping material induced by landslides. This material is heterogeneous and generally of low hydraulic conductivity, and the groundwater table is observed a few meters below the surface.
The springs of Malnež and Španov vrh (Figure 1), located 5 km from the Urbas landslide, have small recharge areas (approximately 0.02 km2) and discharge less than 1 L/s.
Earlier investigations [23] identified that the landslide of Urbas could be mobilized as a debris flow, which is the greatest threat for the downstream settlement of Koroška Bela. This hazard is also confirmed by the fact that the settlement is built on sediments deposited by several debris flow events that occurred in the past [29]. An important condition required for debris flow initiation is the availability of a sufficient volume of water to bring the material to a state of almost complete saturation. To reduce the risk of debris flow development, water inflow into the landslide body must be limited.
The higher-laying carbonate rocks represent the largest part of the potential (topographic) water catchment area of the landslide. However, the pathways of the groundwater flows recharging the landslide cannot be certainly determined, and the role this lateral inflow on landslide stability has not been investigated in previous studies.
2. Materials and Methods
2.1. Water Sampling and Field Measurements
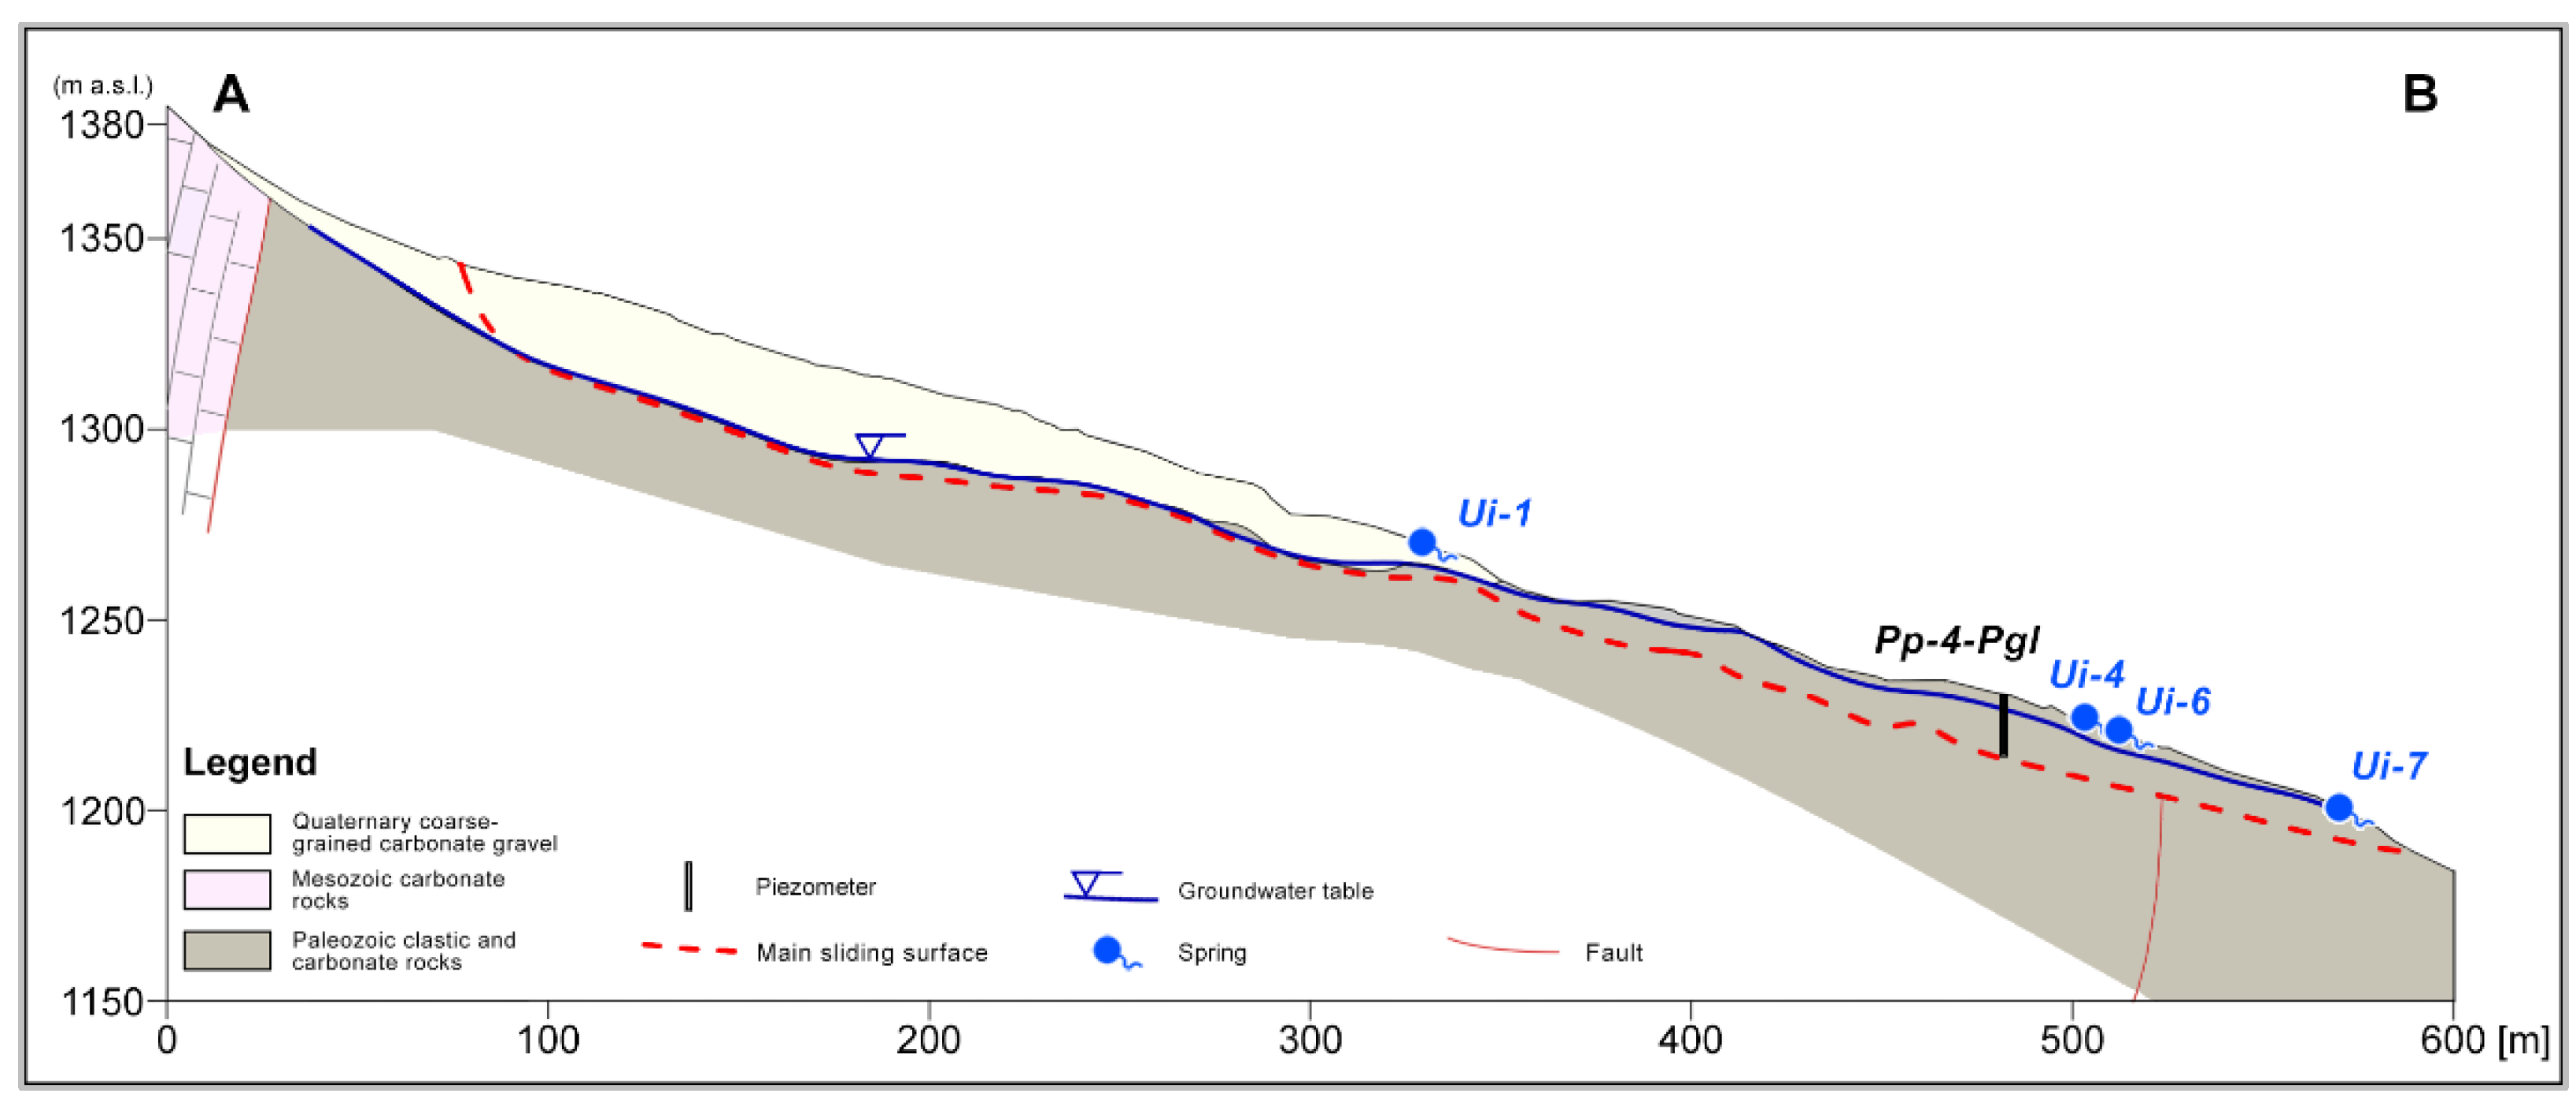
Sampling was carried out in the period June 2018–August 2020 and was not performed during the winter months due to the thick snow cover in the mountains and the associated risks (e.g., snow avalanches). A total of 20 samples were taken on the Urbas rain gauge; 23 on the springs Ui-1, Ui-4, and Ui-7; 22 on spring Ui-6. During the first monitoring period, when the location with all pumping and sampling equipment was still accessible, in order to conduct a more thorough examination of the deeper components of groundwater flow in a landslide body, water samples were also collected in piezometer Pp-4-Pgl in 2018 (Figure 1 and Figure 2). This piezometer, which is 15 m deep and perforated at the interval between 6 and 12 m, was drilled in 2017 (Figure 2).
The first water samples at springs Ui-1, Ui-4, Ui-6, and Ui-7 and piezometer Pp-4-Pgl were collected in June 2018. Analyses of major cations (i.e., Na+, K+, Ca2+, and Mg2+) and anions (i.e., Cl−, SO42−, NO3−, and HCO3−) were used to determine the hydrogeochemical water type. The water samples for this analysis were collected in a 1 L PE bottle, cooled, and transported to the laboratory the same day.
Precipitation and groundwater samples for δ18O and δ2H analyses was collected in 2018 (June–November), 2019 (July–December), and 2020 (May–August). Exceptionally, we collected samples three times in October 2019 and twice in June, July, and August 2020. The water samples for stable isotope analysis were collected in a 1 dL plastic bottle filled to the top and capped tightly [35] to prevent the evaporation and exchange of samples with atmospheric water vapor [36].
In situ measurements of temperature (T—°C), electrical conductivity (EC—µS/cm), pH value (pH), redox potential (Eh—mV), and dissolved oxygen (DO—mg/L) or oxygen content (O2—%) were conducted at each sampling using portable multimeters by manufacturer WTW pH/Cond 340i, SenTix ORP 900 and FDO 925 with an accuracy of ±0.01 (pH), ±0.5% (EC), ±0.1 °C (T), ±0.01 mg/L (O2), and ±0.1% (O2) [37,38,39].
2.2. Chemical and Isotopic Analysis
2.2.1. Analysis of Major Cations and Anions
The analysis was performed by the Water Supply Company Vodovod-Kanalizacija d.o.o., Ljubljana accredited laboratory. Major cations and anions were analyzed using an ion chromatograph Metrohm MIC-3, Switzerland measurement (coverage factor K = 2, reliability 95%).
2.2.2. Oxygen-18 and Deuterium analyses
The stable isotope analyses of δ18O and δ2H were performed using a laser isotopic analyzer Picarro L2130-I, by Picarro, Inc., Santa Clara, CA, USA based on wavelength-scanned cavity ring-down spectroscopy (WS-CRDS) with a precision of (1δ) 0.03/0.1% for δ18O/δ2H [40,41]. Performance of the isotope analysis was evaluated by IAEA Water Stable Isotope Intercomparation [42]. The individual water sample was injected using the Autosampler control software (A0325) into a vaporizer and measured five times. Due to the memory effect, the first three injections of each vial should be ignored. The memory effect was 99/98% for δ18O/δ2H after the 4th injection [41]. The result for each sample is represented as the average value of the fourth and fifth δ18O and δ2H measurements and corrected. The correction equation was determined based on the measurement of the primary standards USGS 46, 47, and 48 with known values [43,44,45] together with in-house standards calibrated periodically against primary USGS standards. Thus, the defined secondary standards were used to normalize the data and to monitor the drift between sample measurements. The Picarro L2130-I drift over 24 h was an almost imperceptible change in δ18O, while for δ2H there was a weak drift of ~0.2‰. Typical drift over 24 h without recalibration is 0.08‰ and 0.3‰ for δ18O and δ2H, respectively [41]. Stable isotopic composition of hydrogen and oxygen are normally reported as delta (δ) values in units of parts per thousand (‰) relative to a standard VSMOW:
where YZ is 18O or 2H, R denotes the ratio of the heavy (less abundant) to light (more abundant) isotope (e.g., 2H/1H, 18O/16O), and RX and RS are the ratios in the sample (x) and standard (s) [46].
δYZ (‰) = (RX/RS − 1)·1000
2.3. Statistical Data Analysis
Extreme values or outliers differ significantly from other measurements and may indicate measurement errors or measurement uncertainties. We used the Kolmogorov–Smirnov (KS) test [47] to test for normality of data distribution and identified outliers as data that deviated from the mean by more than three standard deviations (3σ) [48]. For non-normally distributed data (skewed distribution), we used a non-parametric method interquartile range rule (IQR) and identified outliers as data that were below Q1 − 1.5 IQR or above Q3 + 1.5 IQR [49].
2.4. Determination of Water Type
First, we determined the ion charge balance error (ICBE) [50] to check the accuracy of the chemical analysis results. The ideal value of ICBE is zero. Due to the fact of sampling and instrumental errors, such accuracy can be rarely achieved. Generally, a balance error in the range of ±10% is assumed as acceptable [51,52].
The water type or hydro-chemical facies show the effect of hydro-chemical processes in the subsurface [53] occurring between the minerals of lithologic formation and groundwater [54]. The calculations of water type were performed using the program AquaChem 2014.2 [55]. The increase in total dissolved solids concentration depends on the water–rock interaction and is controlled by the network of flow paths, the residence time of the water, and the mixing with older water [22,51].
2.5. Estimation of the Local Meteoric Water Line (LMWL)
The relationship between δ2H and δ18O values in natural meteoric waters from many parts of the world has been determined; thus, isotopic composition relative to ocean water displays a linear correlation over the entire range for waters that have not undergone excessive evaporation [56]. When the isotopic composition of precipitation samples from all over the world are plotted relative to each other on δ18O and δ2H plots, the data form a linear band that can be described by the global meteoric water line (GMWL) [36,56]:
(GMWL) δ2H = 8 · δ18O + 10
The distribution of water isotopic composition on a local scale is mostly controlled by the altitude effect and precipitation amount effect [57,58,59]. In order to assess groundwater recharge, the generated local meteoric water line (LMWL), based on the stable isotope composition of the local precipitation, is necessary [57].
According to the linear regression of δ18O and δ2H in local precipitation in Urbas, an estimated local meteoric water line can be given:
where m is the slope of the regression and b the intercept.
δ2H = m·δ18O + b
A regression model is a good fit to the data when the correlation coefficient is large (approaching 1), as the standard error is relatively small considering the magnitude of the data, and the p-value is small, approaching less than 0.0001 [60].
2.6. Average Recharge Altitude Calculation
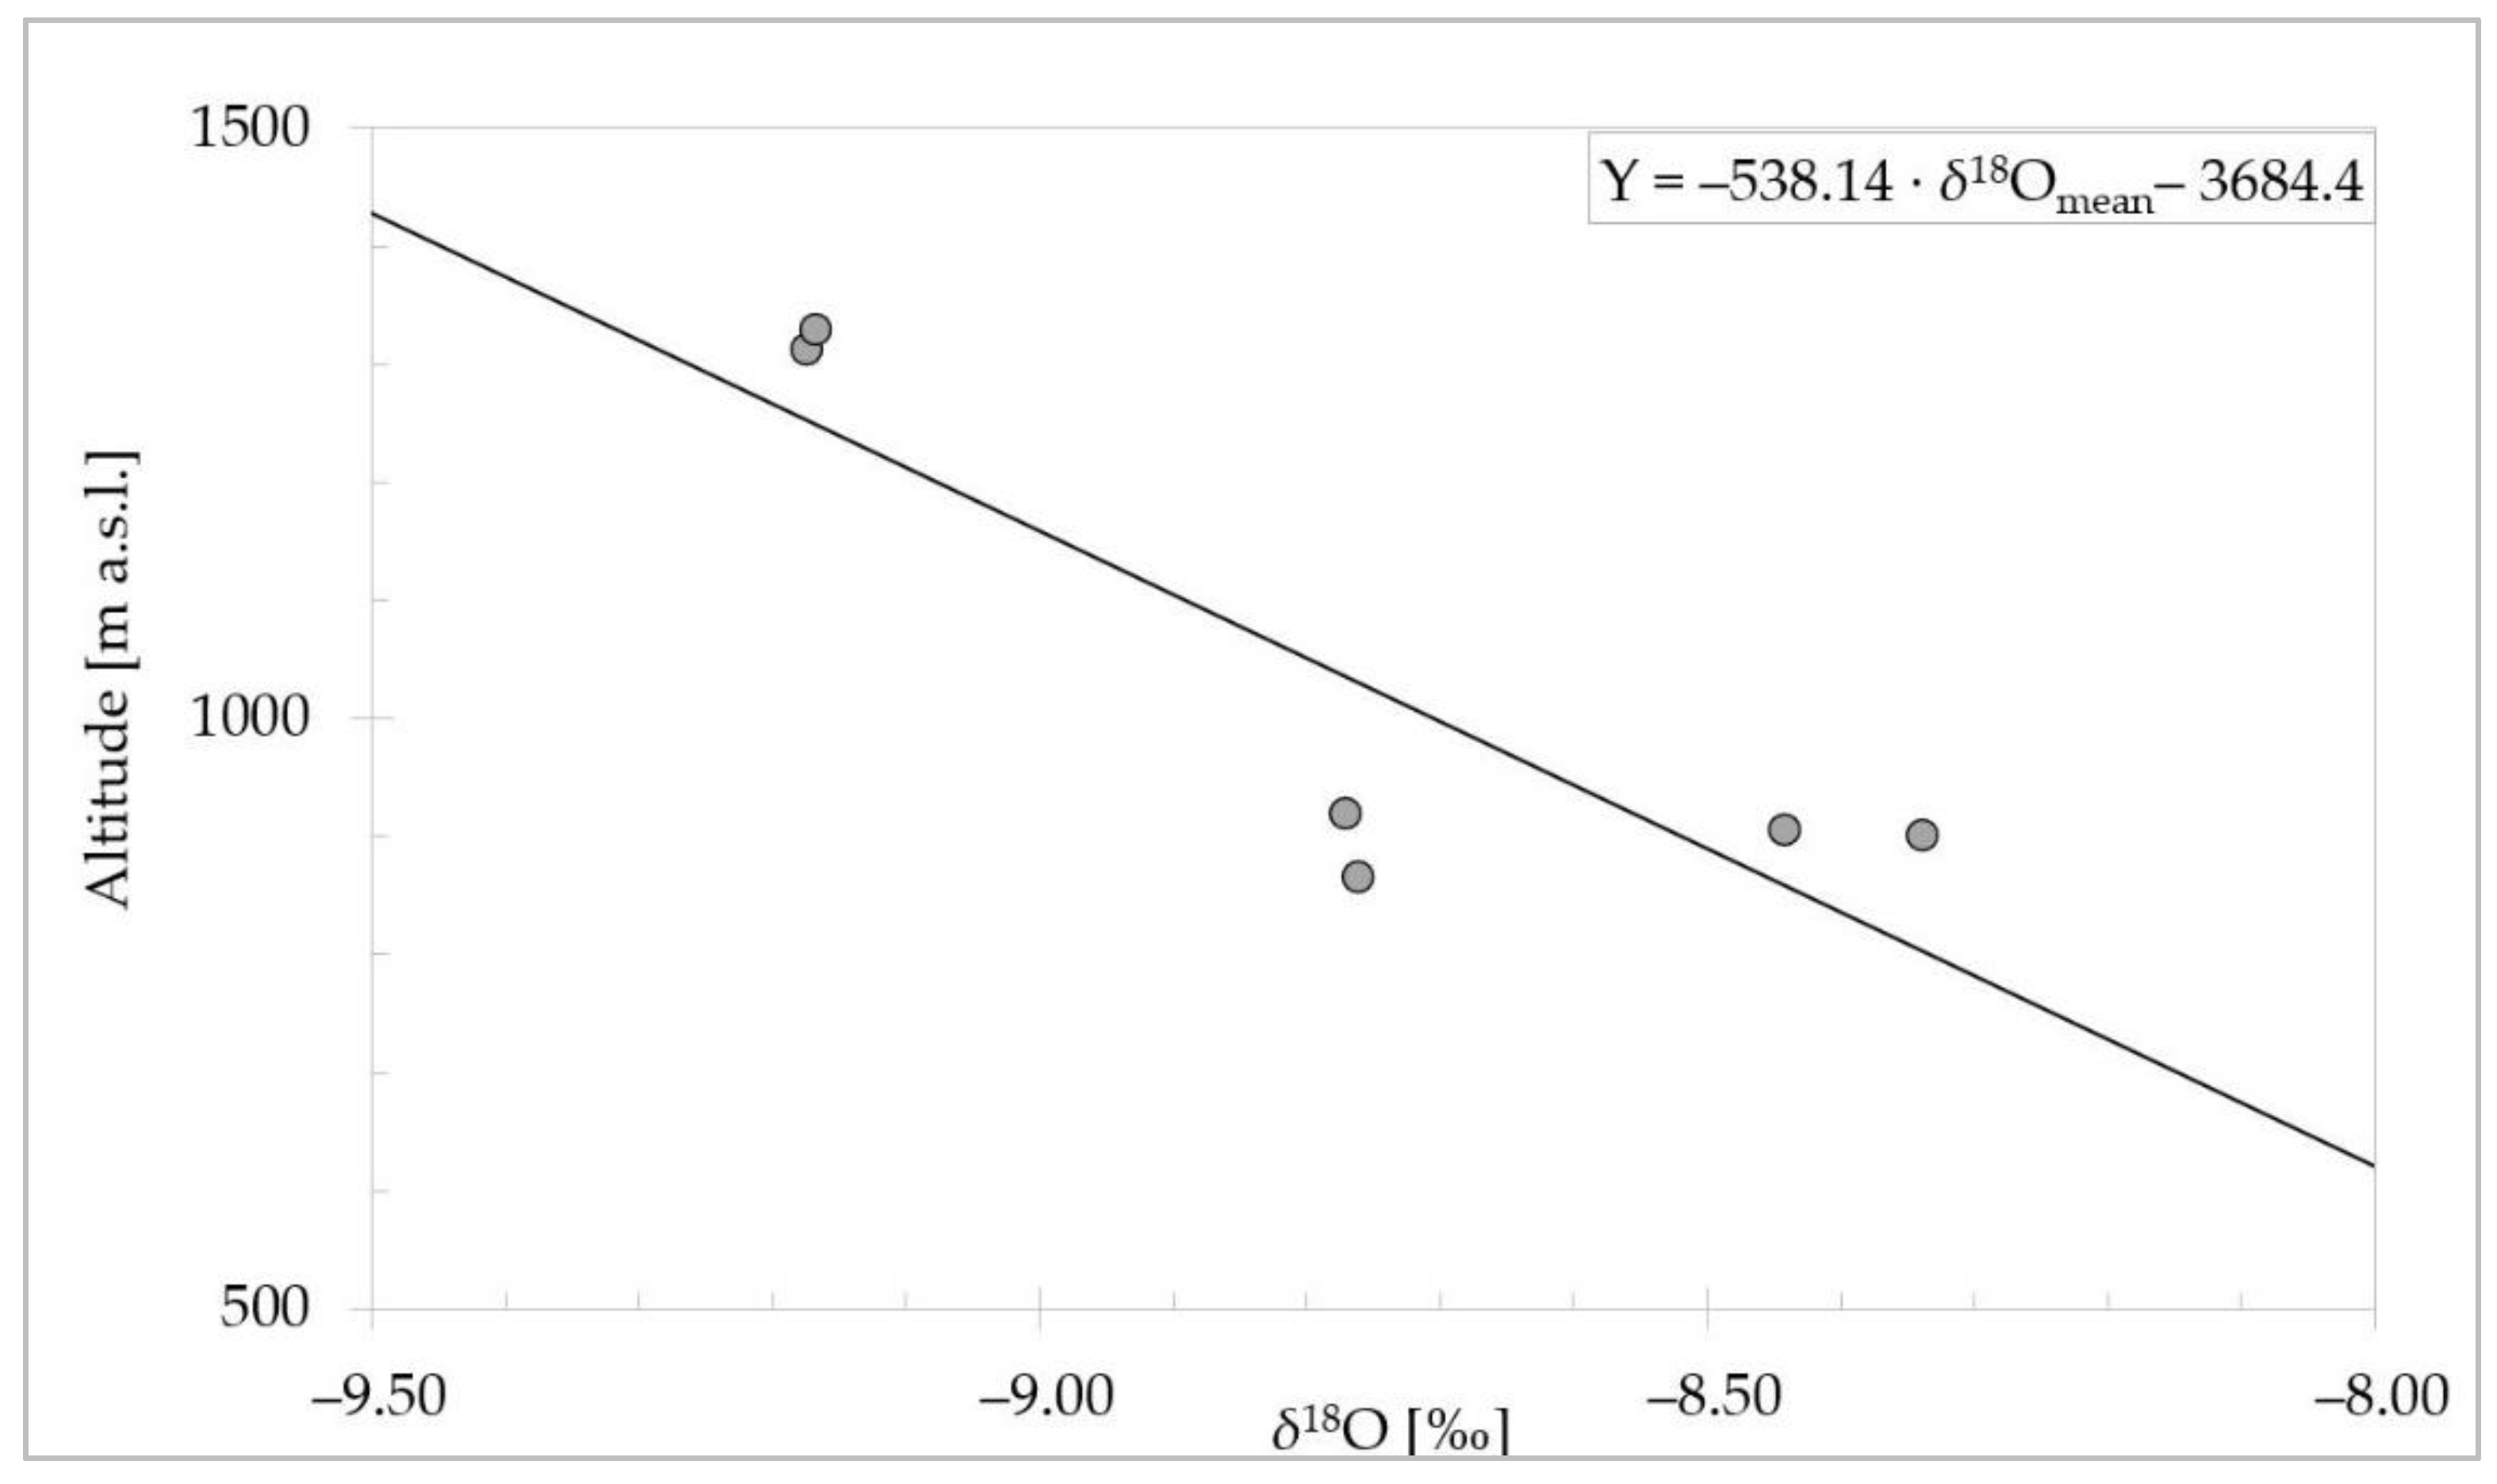
With increasing altitude, especially in mountainous regions, precipitation becomes depleted in heavy isotopes δ18O and δ2H [61]. The variation of stable isotope values of small springs as a function of altitude can be used to estimate the average recharge altitude for large springs [62]. For the estimations, it was hypothesized that the isotopic signature of small springs was due to a small recharge area corresponding to the isotopic signature of precipitation at the corresponding recharge altitude. Under this assumption, a simple linear model can be used to calculate local average recharge altitude (Y) [63]:
where m is the slope, and b is the intercept of the line. In a given study area, if water samples with known recharge altitude are available, the derived linear relationship (Equation (4)) can then be used to estimate the average recharge altitude of groundwater in a well or spring. Here, the water samples with estimated average recharge altitudes are considered to be the small springs (i.e., ČV-2, ČVi-4, Mi-14, Mi-28, Mi-32, and Mi-33; 0.1–1 L/s discharge) in the Španov vrh and Malnež areas. For each of these small springs, which were sampled on 5 August and 26 August 2020, the recharge area was determined based on topography, and the average altitude was calculated based on a digital elevation model. The groundwater residence times in the springs in Španov vrh and Malnež were much shorter compared to the residence times in the springs in the Urbas landslide. Therefore, we applied average δ18O values of samples collected in the Urbas landslide springs in the period from May to August 2020 to estimate the altitude effect on the Urbas landslide, which was the approximated groundwater residence time in these springs.
(Y) = m·δ18Omean + b
2.7. Seasonal Trends in δ18O Values
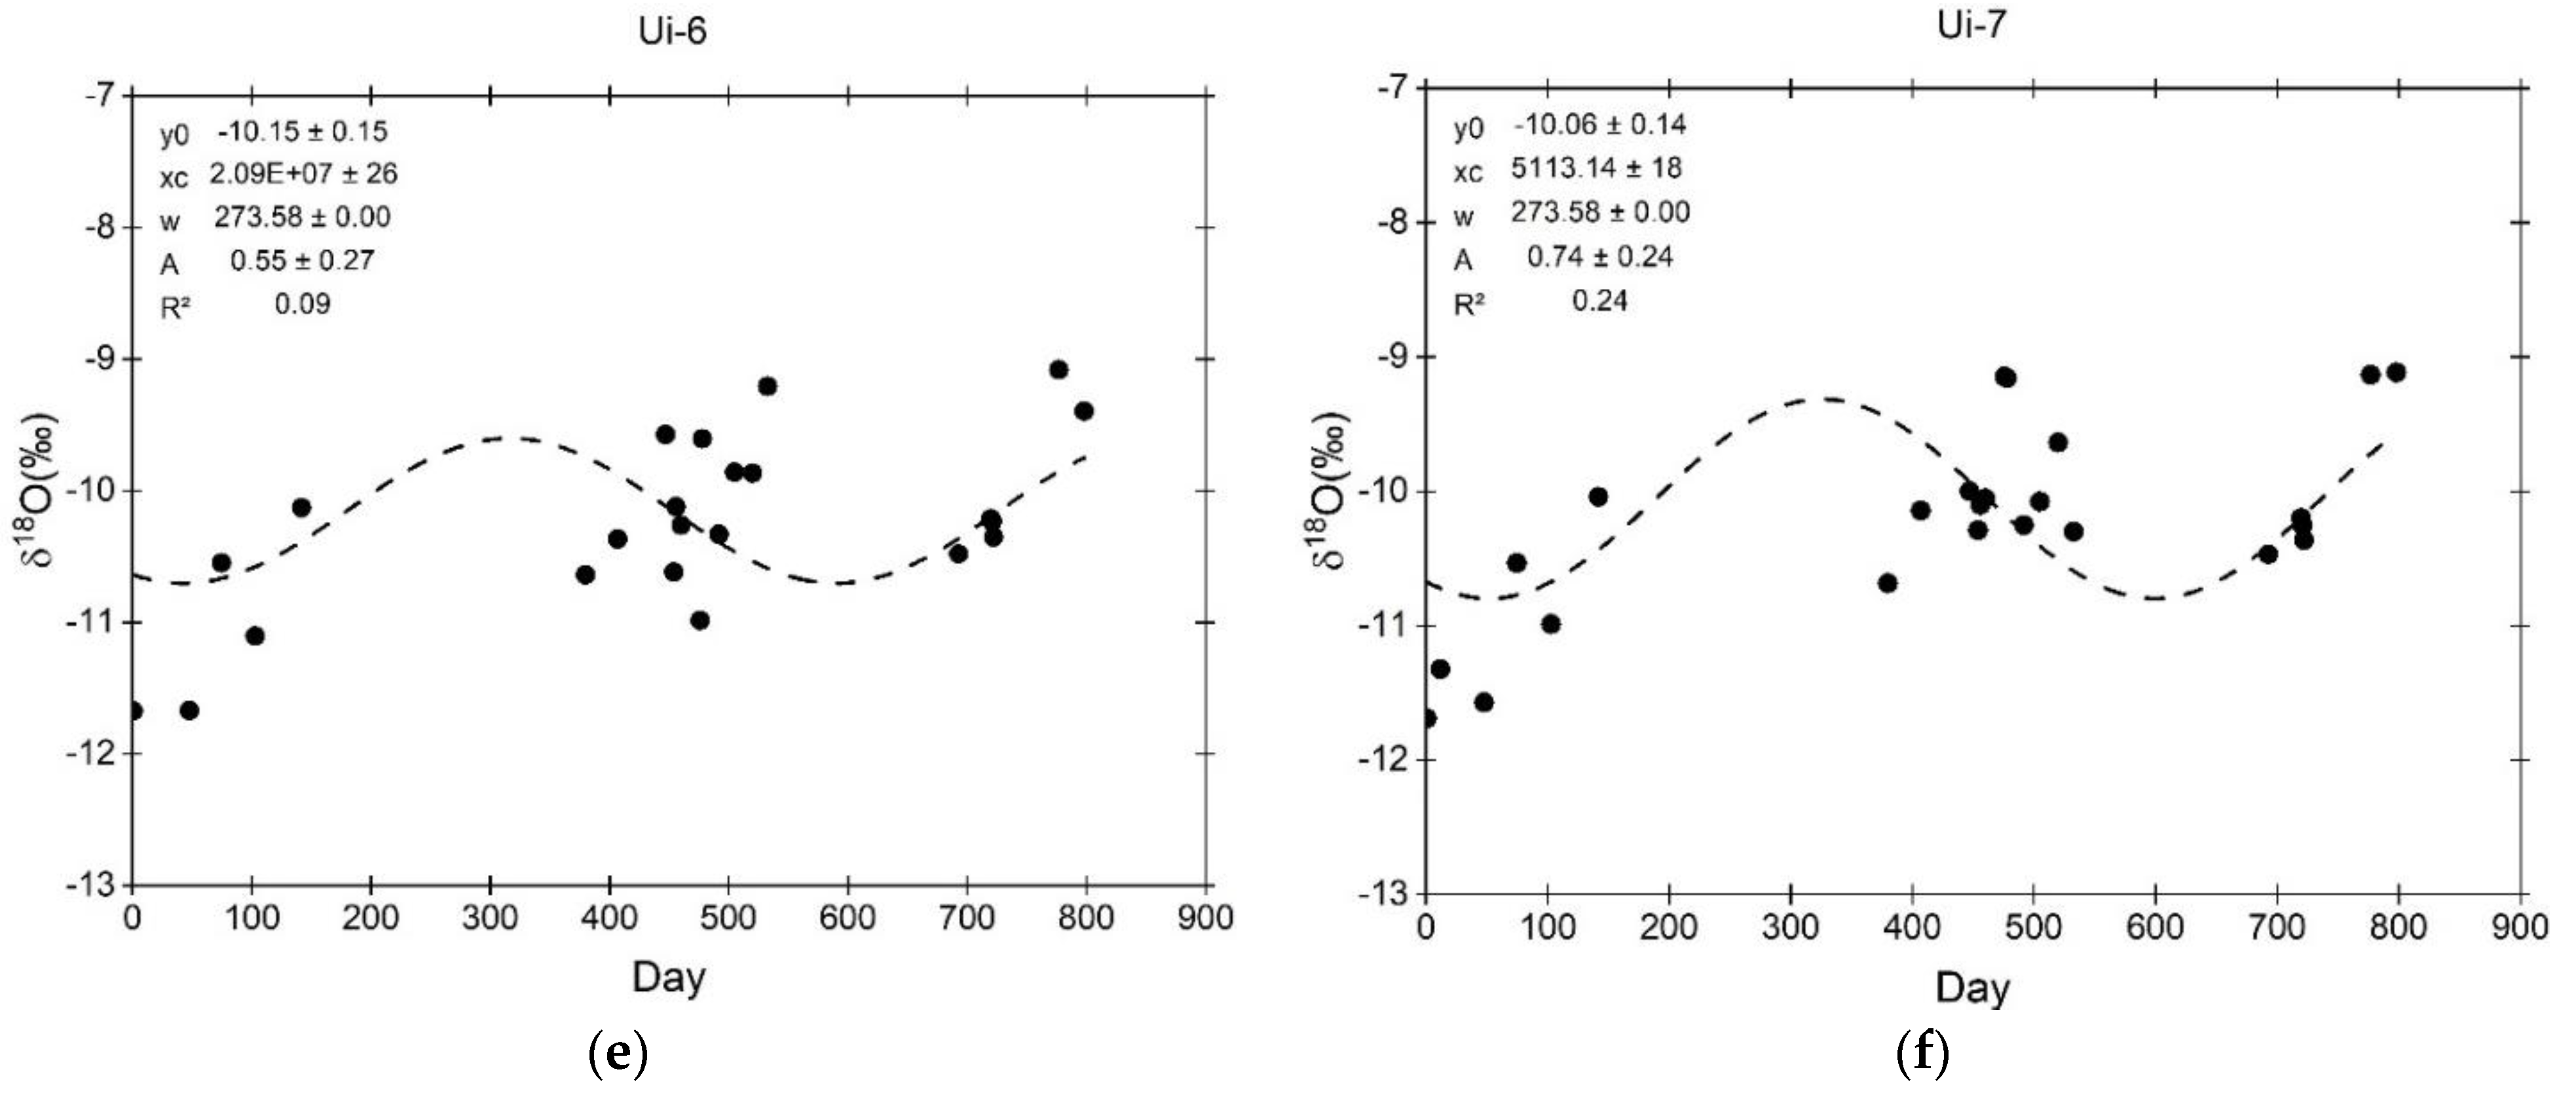
The annual variability of the isotope signal can be characterized by fitting a sinusoidal curve to the data [15]. Seasonal trends in the δ18O values were modeled using Origin Pro [66] through periodic regression analysis to fit seasonal sine wave curves to variations in the annual δ18O values of the precipitation and groundwater [48,49].
2.8. Estimation of Groundwater Residence Time
Isotopic analyses of δ18O and δ2H also enabled a rough estimation of groundwater MRT. Damping the amplitude of the isotopic curve represents a method for calculating MRTs, which is most often used for groundwater [15]. The following equation was used in the study area:
where C is the amplitude damping given as C = B/A, A is the amplitude of δ18O precipitation values, and B is that of δ18O values in the groundwater [15,67].
At the Urbas landslide, the isotopic composition of precipitation was determined by samples from the Urbas rain gauge and of groundwater by samples from springs Ui-1, Ui-4, Ui-6, and Ui-7. Because no water samples were collected at the rain gauge during winter, the δ18O amplitude for precipitation at Urbas does not include samples with a predominant snow component. We calculated the amount-weighted monthly mean values of δ 18O and δ 2H in precipitation at the Urbas landslide [46,68] for the samples collected more than once per month (three times in October 2019 and twice in June, July, and August 2020). Monthly δ18O precipitation data from the Zgornja Radovna meteorological station for the same observation period (2018–2020) were also used [69,70,71] to compare and evaluate the adequacy of the amplitude of δ18O precipitation values in the Urbas landslide.
3. Results and Discussion
3.1. Hydro-Chemical Facies of Water in the Recharge Area
The ion charge balance error (ICBE) of the water samples collected on 21 June 2008 (Table 1) was in the range of ±1% with a mean value of 0.82%, which was acceptably accurate. Concentrations of major ions in groundwater indicate low mineralized waters.
Electrical conductivity was between 175 (Ui-1) and 322 µS/cm (Pp-4-Pgl). Water temperature ranged from 3.9 to 6.9 °C and pH values from 7.9 to 8.3. Low mineralized water and high oxygen content (10.0–11.7 mg/L) suggest a shallow groundwater circulation path and short residence times.
The hydro-chemical facies of groundwater was Ca–HCO3. The evolution of rainwater to a Ca–HCO3 water type upon interaction with sediments and bedrock typically occurs relatively rapidly [22]. Ca2+ and HCO3− ions dominated, indicating weathering calcite [18,51]. Low K+, Na+, Cl−, NO3−, and SO42− ion content also indicates pure carbonate recharge conditions. The most significant differences among samples were observed in SO42−, where slightly higher concentrations were analyzed in Pp-4-Pgl (3.30 mg/L), Ui-4 (3.45 mg/L), and Ui-7 (3.84 mg/L) than in Ui-1 (<1.50 mg/L) and Ui-6 (1.89 mg/L). However, the SO42− concentrations were still within the range of geogenic origin and could also be an indicator of shallow groundwater circulation.
Only Pp-4-Pgl from all of the water samples showed some discrepancy, especially considering values of electrical conductivity. This suggests a higher mineralization of groundwater, which is very likely due to the deeper groundwater flow path in the piezometer.
3.2. Data Statistical Analysis
Basic statistical analysis (Table 2), including the Kolmogorov–Smirnov and the Shapiro–Wilk test; mean, minimum, and maximum values; were calculated to describe the variations in the data [46]. Statistical analyses for all stable isotope data showed that no outliers were found [72,73].
The precipitation sampling regime and the calculated amount-weighted monthly mean values of δ18O and δ2H in precipitation are represented in the Supplementary Materials (Table S1).
3.3. Stable Isotope Composition of Local Precipitation
The stable isotope composition of δ18O and δ2H in precipitation were included in the determination of the local meteoric water line (LMWL) using linear regression analyses.
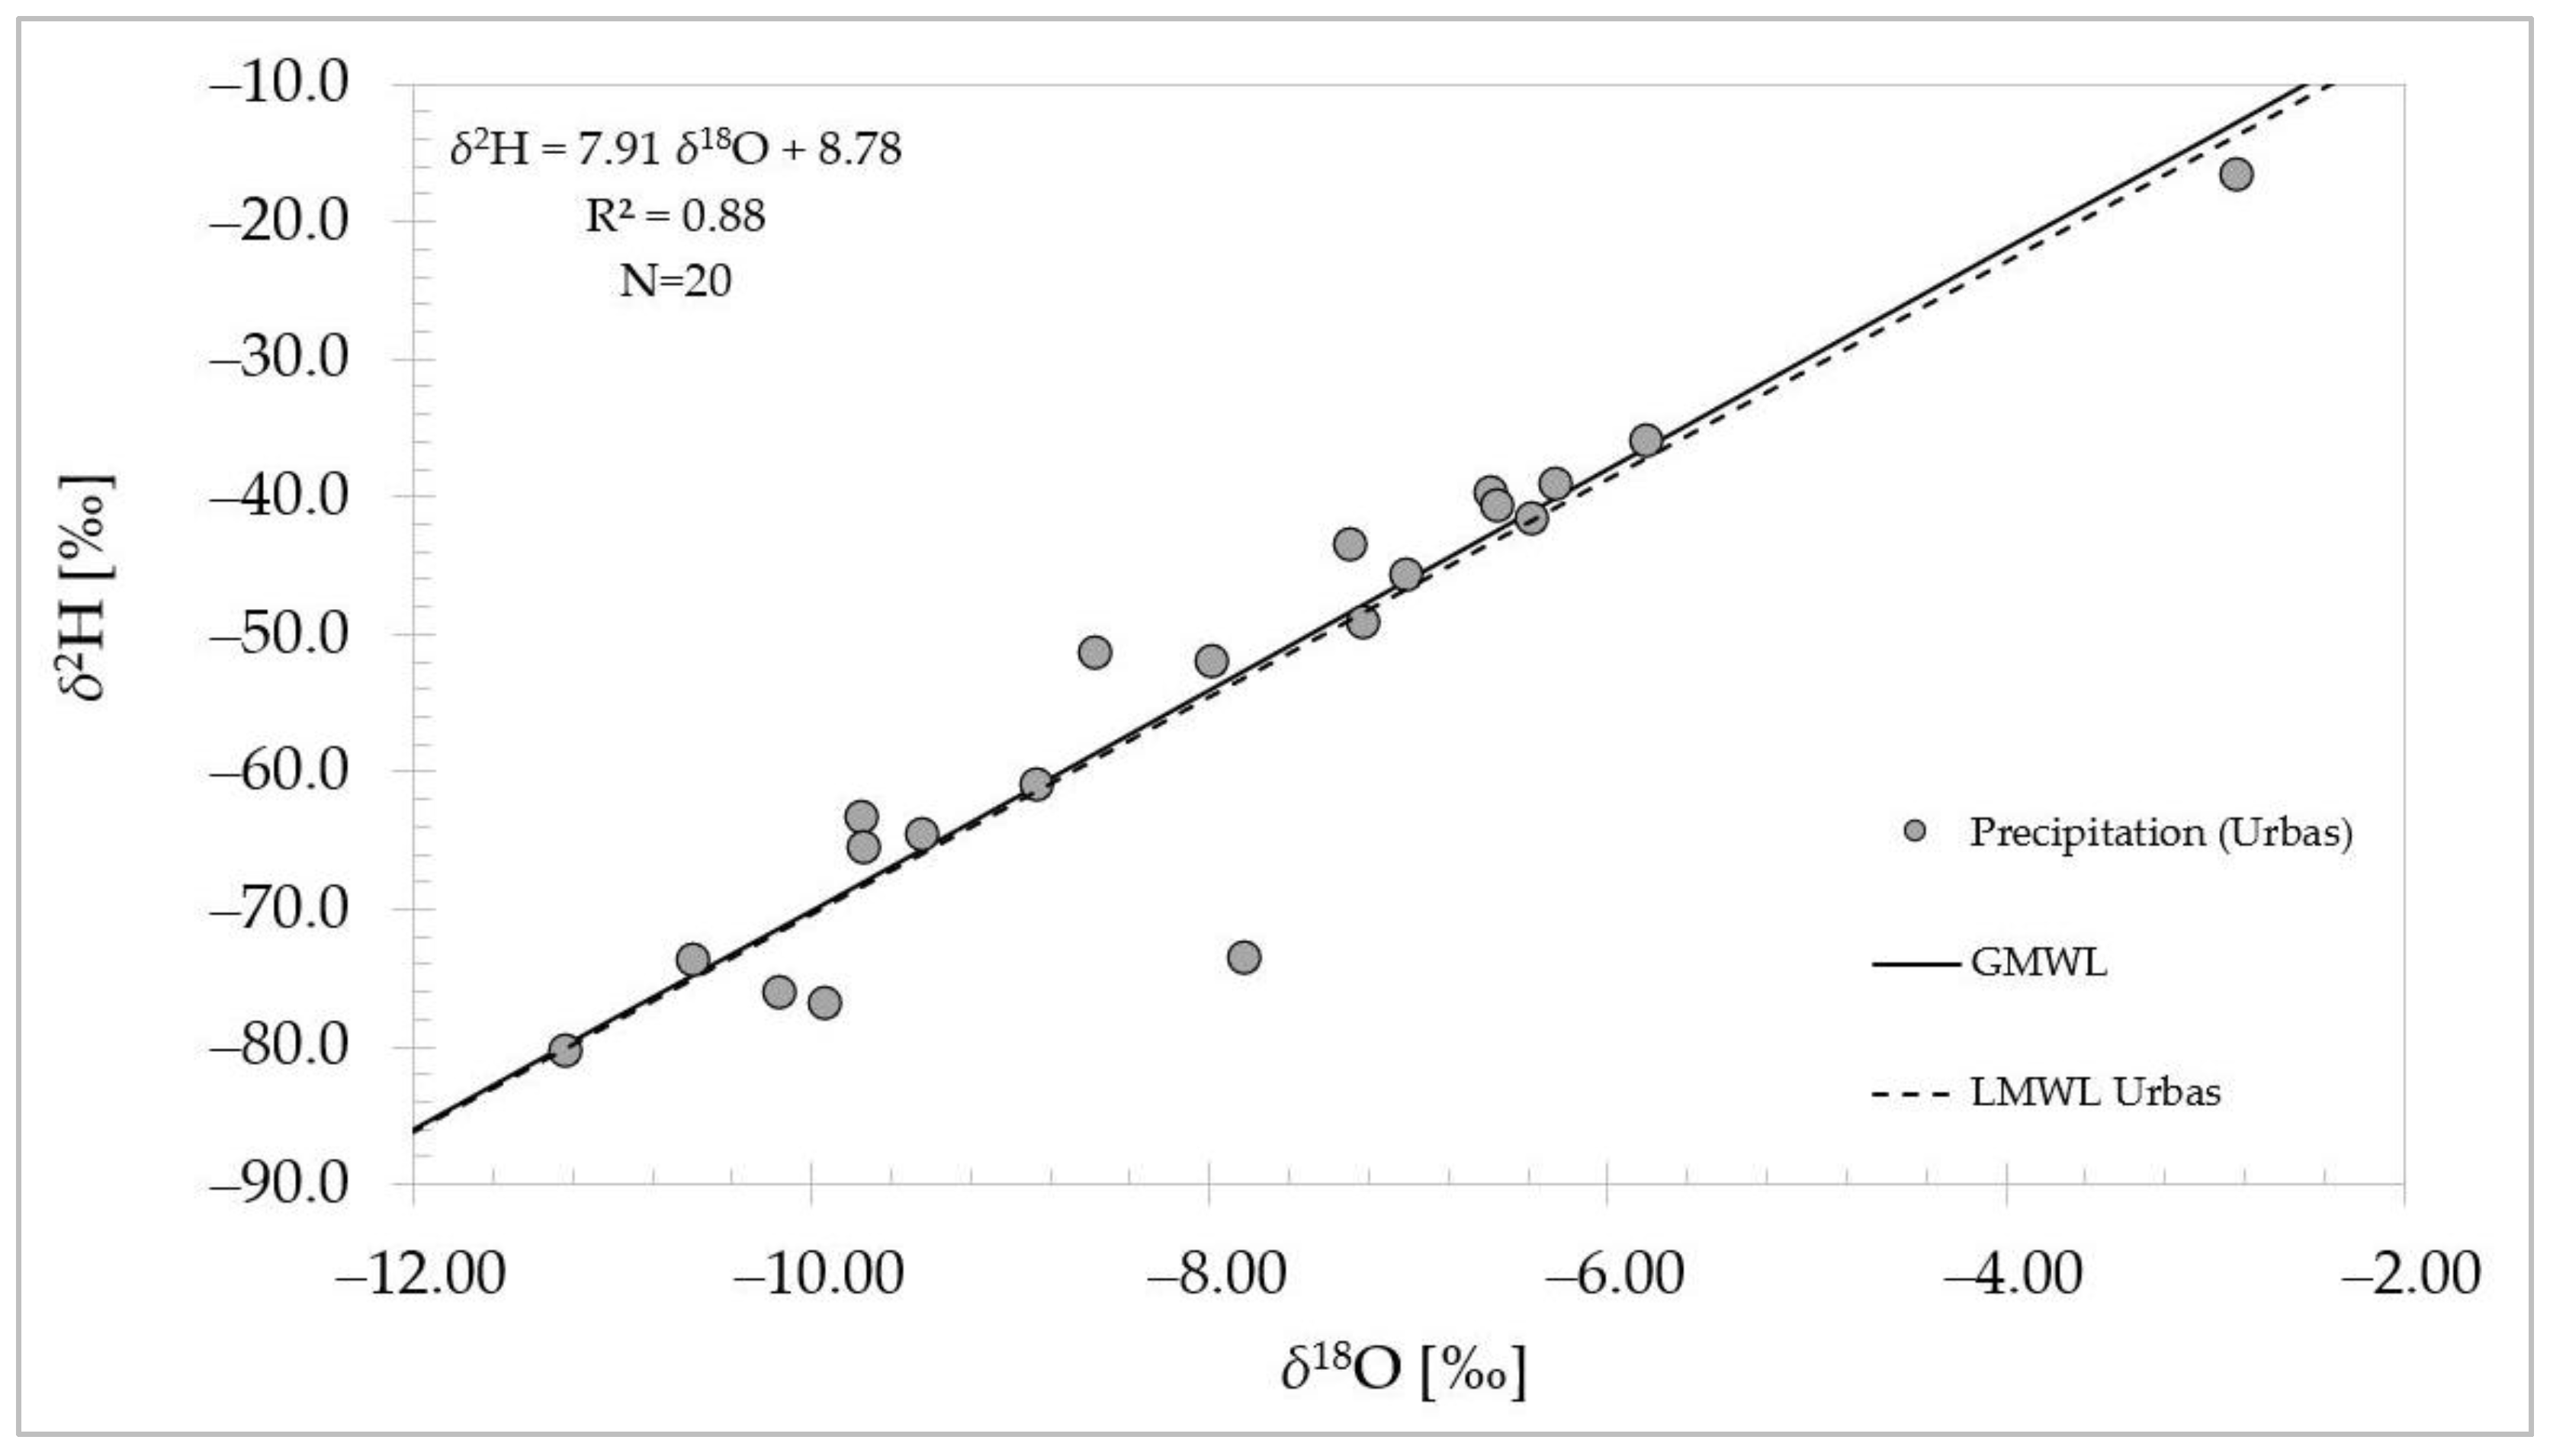
The LMWL in the Urbas landslide recharge area was estimated with the equation (LMWL) δ2H = 7.91·δ18O + 8.78 (R2 = 0.88) (Figure 3).
3.4. Stable Isotope Composition of the Groundwater Samples
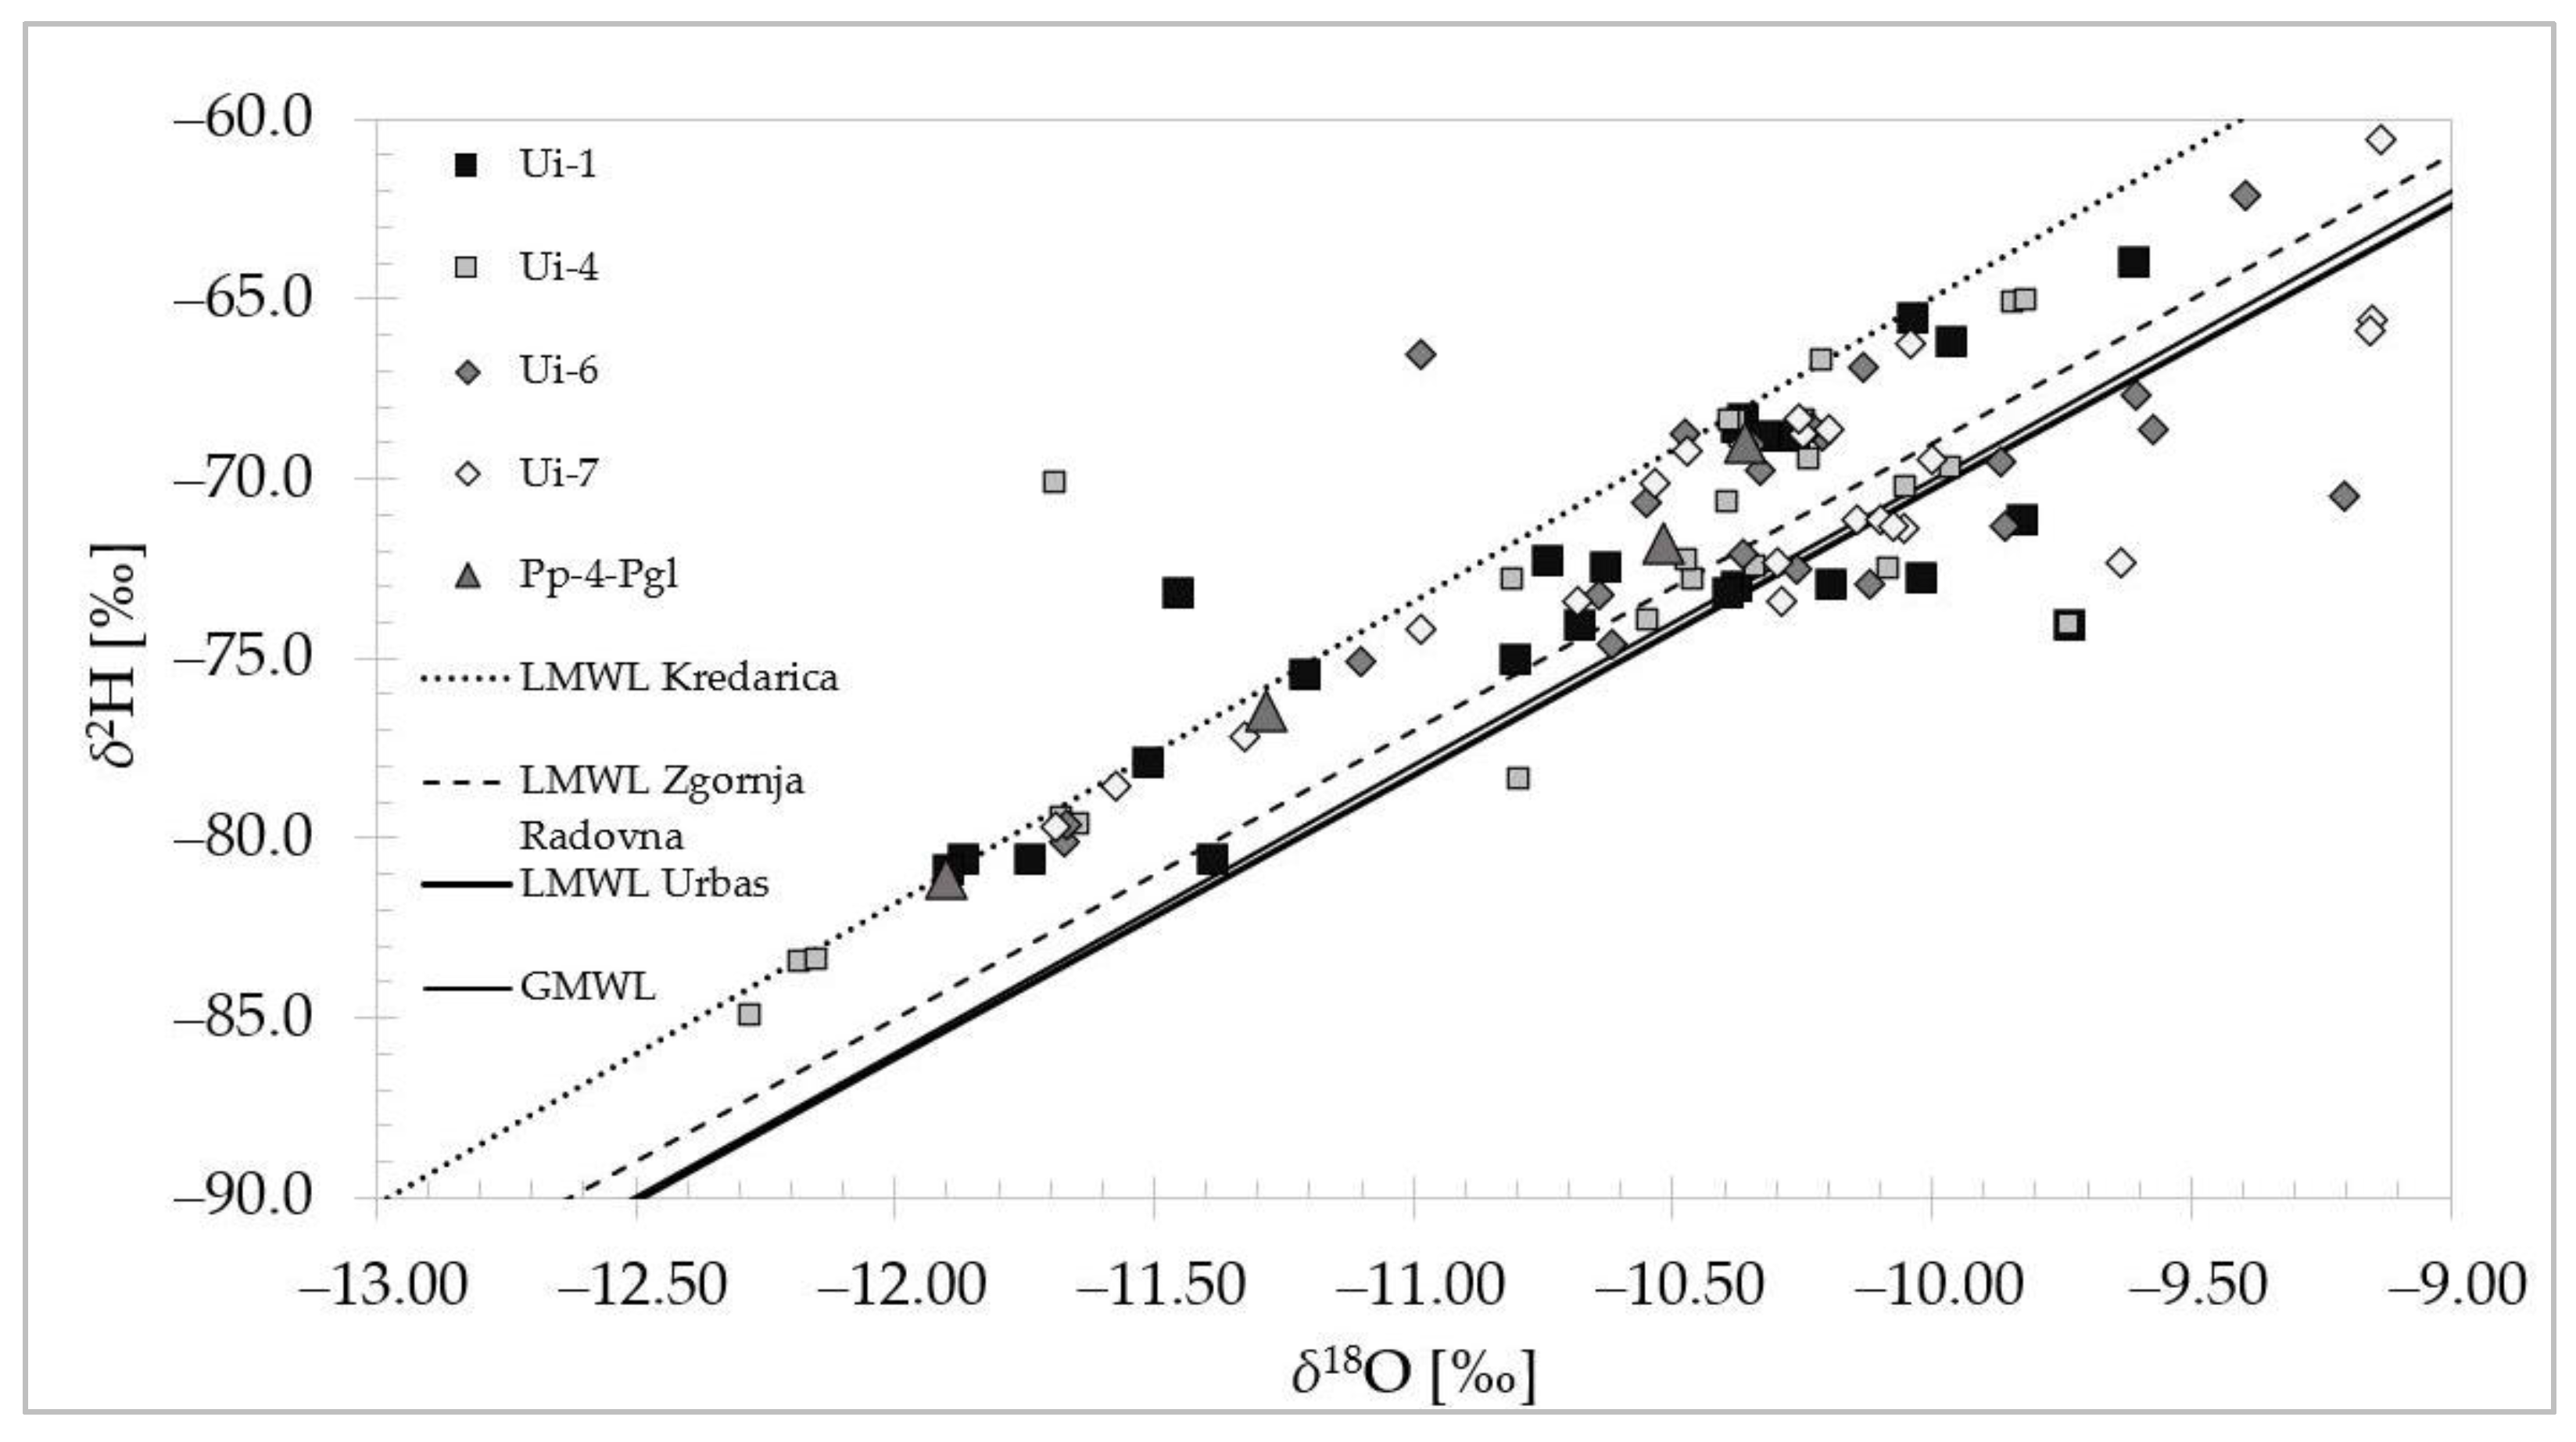
The LMWL for Kredarica (δ2H = 8.4·δ18O + 19) and Zgornja Radovna (δ2H = 8·δ18O + 11) [69] and GMWL [56] proved to be a meaningful comparison of the precipitation and groundwater isotopic composition also at the local level (Figure 4).
In 2018, snow cover at Javorniški Rovt was present till 7 April in 2019 until 7 May and 2020 till 3 April [30]. The investigated area was influenced by air masses of different origins that caused noticeable spatial and seasonal variability in the meteorological parameters [74]. As in the nearby Radovna Valley [64,65], a complex mixing of maritime and continental air masses were recorded.
3.5. Average Recharge Altitude of Springs
Table 3 shows the mean values of δ18O and δ2H and the estimated average recharge altitude (Y) of springs in Španov vrh and Malnež area, calculated based on the digital elevation model. The altitude and isotopic composition from these small springs were then plotted to compute the linear relationship (Equation (4)), as was then used to estimate the average recharge altitude (Figure 5) of the springs in the Urbas landslide area.
The estimated altitude effect in the Urbas landslide area was −0.18‰ δ18O/100 m calculated based on data from six small springs. It was comparable to the altitude effect defined for the nearby Radovna Valley [64,65] and Bled area [75] (−0.11‰ δ18O/100 m), for the Slovenian Alps and Coastal region (−0.25‰ δ18O/100 m), and the altitude effect on precipitation across the Adriatic–Pannonian region (−0.12‰ δ18O/100 m) [76].
We checked the adequacy of using measured δ18O values from the small springs for estimating the altitude effect by comparing δ18O values from springs in Španov vrh and Malnež with the other small spring M-1 (629 m a.s.l.) near Bled, approximately 7.5 km SW of Urbas, where the sampling period also included samples from August 2020 [77]. Seven water samples in the M-1 spring were collected between 2019 and 2021 accounting for different water conditions and analyzed with the same method—laser isotopic analyzer Picarro L2130-i. The δ18O values measured in August in spring M-1 was approximately at the 67th percentile and was only 0.09‰ higher than its mean value [77]. Due to the small recharge area in these small springs in Španov vrh and Malnež, the variation in δ18O was likely to be small, as also suggested by the analysis of the spring M-1. Based on their estimated average recharge altitudes, the springs in the Urbas area can be classified into two groups: the Ui-6 and Ui-7 have an estimated average altitude of recharge (Y) below 1700 m a.s.l. and the Ui-1 and Ui-4 above 1700 m a.s.l. (Table 4).
3.6. Estimated Mean Residence Time of Springs
Variations in the δ18O values in the precipitation and groundwater were modeled in Origin Pro [66] using the automatic fitting of seasonal sine wave curves (Figure 6). The best sinusoidal fit between the observed and modeled values provided an amplitude (Table 5) for groundwater MRT estimation according to Equation (5).
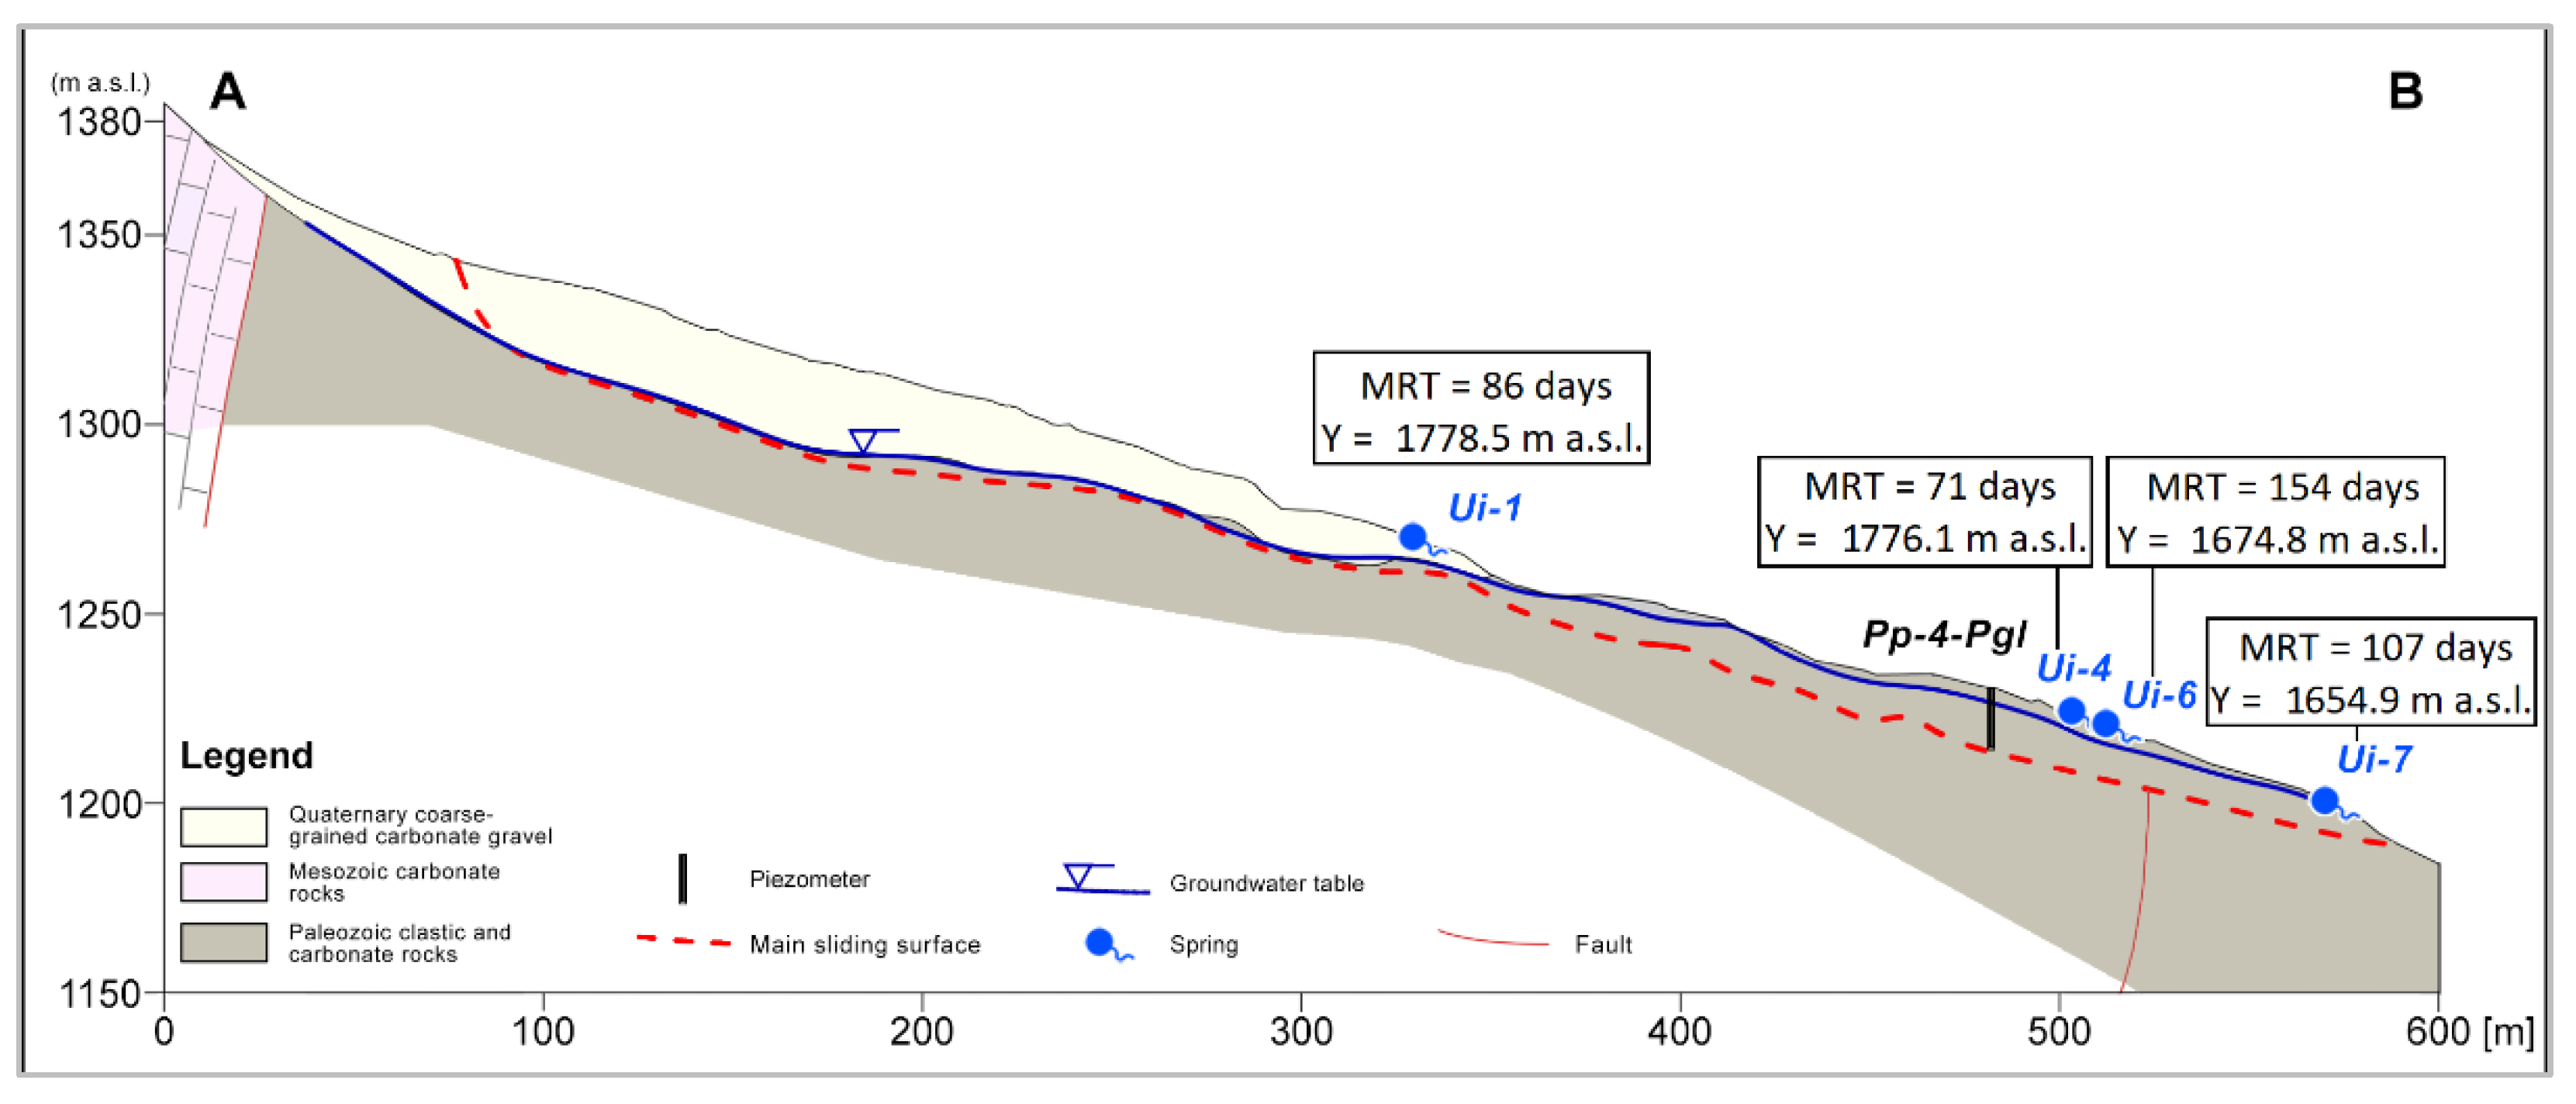
The shortest MRTs of the springs in the Urbas landslide area were estimated at Ui-4 (71 days) and Ui-1 (86 days). These springs were situated at the lower boundary of the quaternary course-grained carbonate gravel deposits (Figure 1 and Figure 7).
These coarse-grained deposits are highly permeable, and groundwater flow occurs at the contact of these deposits with underlying low permeable clastic deposits. Due to the steep slopes of the lithological boundary, groundwater flow recharging the springs is relatively fast and prevails over slow groundwater flow in deeper parts of the recharge area. The estimated MRTs of groundwater in springs Ui-6 (154 days) and Ui-7 (107 days) are longer compared to the aforementioned springs Ui-4 and Ui-1. This could be attributed to their downslope position and partly, especially in the case of spring Ui-6, to the higher share of slow groundwater flow originating from low permeable clastic deposits that prevail in the lower part of the landslide body.
4. Conclusions
In this study, major ions and stable isotopes δ18O and δ2H were used to characterize the groundwater flow regime in the Urbas landslide area. An attempt was made to evaluate the main flow components and their residence times. The results demonstrated that the stable isotope method can be used as an effective tool in evaluating mountain landslides such as Urbas, where the high topographic gradient in the recharge area produces a significant altitude effect on the isotopic compositions of water. As a result, they can also be applied to help better understand hydrological processes in steep, difficult-to-access terrain where the performance of hydrogeological field investigation methods is limited. In such terrain, which is typical of landslide-prone areas, regular sampling can rarely be caried out and uncertainties in results are difficult to avoid. However, the combination of the presented methods provided complementary results that formed a solid basis for the interpretation of hydrogeological conditions in the catchment area of the studied landslide. This demonstrates the potential of the presented approach for the study of landslide-prone areas in similar geological and topographic environments.
The spatial distribution of precipitation in this region is highly dependent on the elevation and exposure of the slopes and surrounding mountain ridges of the Julian Alps and Karavanks. The estimated average recharge altitude of springs originating at the landslide ranges from approximately 1700 to 1800 m a.s.l., with mean residence times ranging from 2 to 5 months. The estimated average recharge altitudes indicate the different origin of groundwaters in springs Ui-1 and Ui-4, compared to springs Ui-6 and Ui-7. In the first case, the average recharge area is located at a higher altitude. The same classification of springs can be implied based on mean residence time. The mean residence time of water in springs Ui-1 and Ui-4, is shorter. Very fast groundwater flow is the result of steep slopes and highly conductive channels and fissures in the uppermost carbonate rocks and the very high permeability of coarse-grained carbonate. Thus, the groundwater occurring in these springs is mainly the result of lateral inflow from Mesozoic and Quaternary carbonate rocks in the upper part of the recharge area. In springs Ui-6 and Ui-7, portions of locally infiltrated rainfall are higher. Due to the low permeability of Paleozoic clastic deposits, the groundwater flow in the lower part of the landslide is slow and mean residence time is longer.
The results of this study can expand the pool of results of recent stable isotopes application studies cited in this article, thus supporting knowledge of the dynamics of stable isotopes δ18O and δ2H in groundwater and precipitation in the region. For the purposes of planning and optimizing prevention measures, prioritizing the capture of water from springs Ui-1 and Ui-4 is suggested. This measure could significantly reduce the recharge of the landslide body and contribute to the decrease in pore pressures, groundwater table, and saturation of landslide-prone material, all of which can lead to the increased stability of the studied landslide and significantly reduce the risk of transformation of the landslide material into debris flow.
Supplementary Materials
The following supporting information can be downloaded at: https://www.mdpi.com/article/10.3390/w14060912/s1, Table S1: Isotopic composition of precipitation and amount-weighted monthly mean values of δ18O and δ2H in precipitation (Rain gauge Urbas).
Author Contributions
Conceptualization, L.S., K.K. and M.J.; methodology, L.S. and K.K.; formal analysis, K.K.; investigation, L.S., K.K. and M.J.; data curation, K.K. and L.S.; writing—original draft preparation, K.K.; writing—review and editing, L.S. and M.J.; visualization, K.K.; supervision, M.J.; project administration, M.J.; funding acquisition, M.J. All authors have read and agreed to the published version of the manuscript.
Funding
This research was funded by the Division for Rehabilitation after Natural and Other Disasters of the Ministry of the Environment and Spatial Planning of the Republic of Slovenia (2550-19-42001) and by the Slovenian Research Agency (research core funding Groundwaters and Geochemistry (P1-0020).
Institutional Review Board Statement
Not applicable.
Informed Consent Statement
Not applicable.
Data Availability Statement
Data is contained within the article or Supplementary Materials.
Acknowledgments
The authors wish to thank Simona Adrinek for the help with statistical analysis and Simon Mozetič for help with cartography.
Conflicts of Interest
The authors declare no conflict of interest.
References
- Auflič, M.J.; Šinigoj, J.; Krivic, M.; Podboj, M.; Peternel, T.; Komac, M. Landslide prediction system for rainfall induced landslides in Slovenia (Masprem). Geologija 2016, 59, 259–271. [Google Scholar] [CrossRef]
- Jordanova, G.; Gariano, S.L.; Melillo, M.; Peruccacci, S.; Brunetti, M.T.; Jemec Auflič, M. Determination of Empirical Rainfall Thresholds for Shallow Landslides in Slovenia Using an Automatic Tool. Water 2020, 12, 1449. [Google Scholar] [CrossRef]
- Sidle, R.; Greco, R.; Bogaard, T. Overview of Landslide Hydrology. Water 2019, 11, 148. [Google Scholar] [CrossRef] [Green Version]
- Peng, T.-R.; Wang, C.-H.; Hsu, S.-M.; Chen, N.-C.; Su, T.-W.; Lee, J.-F. Use of stable water isotopes to assess sources and influences of slope groundwater on slope failure. Hydrol. Processes 2012, 26, 345–355. [Google Scholar] [CrossRef]
- Mebrahtu, T.K.; Banning, A.; Girmay, E.H.; Wohnlich, S. The effect of hydrogeological and hydrochemical dynamics on landslide triggering in the central highlands of Ethiopia. Hydrogeol. J. 2021, 29, 1239–1260. [Google Scholar] [CrossRef]
- Malet, J.P.; van Asch, T.W.J.; van Beek, R.; Maquaire, O. Forecasting the behaviour of complex landslides with a spatially distributed hydrological model. Nat. Hazards Earth Syst. Sci. 2005, 5, 71–85. [Google Scholar] [CrossRef] [Green Version]
- Matsuura, S.; Asano, S.; Okamoto, T. Relationship between rain and/or meltwater, pore-water pressure and displacement of a reactivated landslide. Eng. Geol. 2008, 101, 49–59. [Google Scholar] [CrossRef]
- François, B.; Tacher, L.; Bonnard, C.; Laloui, L.; Triguero, V. Corrigendum: Numerical modelling of the hydrogeological and geomechanical behaviour of a large slope movement: The Triesenberg landslide (Liechtenstein). Can. Geotech. J. 2009, 46, 1009. [Google Scholar] [CrossRef] [Green Version]
- Padilla, C.; Onda, Y.; Iida, T.; Takahashi, S.; Uchida, T. Characterization of the groundwater response to rainfall on a hillslope with fractured bedrock by creep deformation and its implication for the generation of deep-seated landslides on Mt. Wanitsuka, Kyushu Island. Geomorphology 2014, 204, 444–458. [Google Scholar] [CrossRef]
- Ponziani, F.; Pandolfo, C.; Stelluti, M.; Berni, N.; Brocca, L.; Moramarco, T. Assessment of rainfall thresholds and soil moisture modeling for operational hydrogeological risk prevention in the Umbria region (central Italy). Landslides 2011, 9, 229–237. [Google Scholar] [CrossRef]
- Deiana, M.; Cervi, F.; Pennisi, M.; Mussi, M.; Bertrand, C.; Tazioli, A.; Corsini, A.; Ronchetti, F. Chemical and isotopic investigations (δ18O, δ2H, 3H, 87Sr/86Sr) to define groundwater processes occurring in a deep-seated landslide in flysch. Hydrogeol. J. 2018, 26, 2669–2691. [Google Scholar] [CrossRef]
- Sajinkumar, K.S.; Unnikrishnan Warrier, C.; Muraleedharan, C.; Shahul Hameed, A.; Rani, V.R.; Pradeepkumar, A.P.; Sundarajan, P. A study on landslides and subsurface piping, facilitated by dykes, using vertical electrical sounding and δO18 and δH2 stable isotopes. Bull. Eng. Geol. Environ. 2017, 76, 1297–1306. [Google Scholar] [CrossRef]
- Marc, V.; Bertrand, C.; Malet, J.-P.; Carry, N.; Simler, R.; Cervi, F. Groundwater-Surface waters interactions at slope and catchment scales: Implications for landsliding in clay-rich slopes. Hydrol. Processes 2017, 31, 364–381. [Google Scholar] [CrossRef]
- Peng, T.-R.; Wang, C.-H.; Lai, T.-C.; Ho, F.S.-K. Using hydrogen, oxygen, and tritium isotopes to identify the hydrological factors contributing to landslides in a mountainous area, central Taiwan. Environ. Geol. 2007, 52, 1617–1629. [Google Scholar] [CrossRef]
- Niinikoski, P.I.; Hendriksson, N.M.; Karhu, J.A. Using stable isotopes to resolve transit times and travel routes of river water: A case study from southern Finland. Isot. Environ. Health Stud. 2016, 52, 380–392. [Google Scholar] [CrossRef] [PubMed]
- Fritz, P. River waters. In Stable Isotope Hydrology: Deuterium and Oxygen-18 in the Water Cycle; Gat, J.R., Gonfiantini, R., Eds.; IAEA: Vienna, Austria, 1981; pp. 111–130. [Google Scholar]
- McCarthy, K.A.; McFarland, W.D.; Wilkinson, J.M.; White, L.D. The dynamic relationship between ground water and the Columbia River: Using deuterium and oxygen-18 as tracers. J. Hydrol. 1992, 135, 1–12. [Google Scholar] [CrossRef]
- Lipfert, G.; Reeve, A. Characterization of Three Water Types in a Fractured Schist, High Arsenic, Watershed in Maine; University of Maine: Orono, ME, USA, 2004; pp. 638–646. [Google Scholar]
- Chebotarev, I.I. Metamorphism of natural waters in the crust of weathering-1. Geochim. et Cosmochim. Acta 1955, 8, 22–48. [Google Scholar] [CrossRef]
- Driscoll, F.G. Groundwater and Wells; U.S. Filter/Johnson Screens: St. Paul, MN, USA, 1995. [Google Scholar]
- Gibbs, J.R. Mechanisms controling world water chemisty. Science 1970, 80, 1088–1090. [Google Scholar] [CrossRef] [PubMed]
- Marandi, A.; Shand, P. Groundwater chemistry and the Gibbs Diagram. Appl. Geochem. 2018, 97, 209–212. [Google Scholar] [CrossRef]
- Janža, M.; Serianz, L.; Šram, D.; Klasinc, M. Hydrogeological investigation of landslides Urbas and Čikla above the settlement of Koroška Bela (NW Slovenia). Geologija 2018, 61, 191–203. [Google Scholar] [CrossRef]
- Peternel, T.; Jež, J.; Milanič, B.; Markelj, A.; Jemec Auflič, M. Engineering-geological conditions of landslides above the settlement of Koroška Bela (NW Slovenia). Geologija 2018, 61, 177–189. [Google Scholar] [CrossRef]
- Bezak, N.; Sodnik, J.; Maček, M.; Jurček, T.; Jež, J.; Peternel, T.; Mikoš, M. Investigation of potential debris flows above the Koroška Bela settlement, NW Slovenia, from hydro-technical and conceptual design perspectives. Landslides 2021, 18, 3891–3906. [Google Scholar] [CrossRef]
- Šegina, E.; Peternel, T.; Urbančič, T.; Realini, E.; Zupan, M.; Jež, J.; Caldera, S.; Gatti, A.; Tagliaferro, G.; Consoli, A.; et al. Monitoring Surface Displacement of a Deep-Seated Landslide by a Low-Cost and near Real-Time GNSS System. Remote Sens. 2020, 12, 3375. [Google Scholar] [CrossRef]
- Peternel, T.; Šegina, E.; Zupan, M.; Jemec Auflič, M.; Jež, J. Preliminary Result of Real-Time Landslide Monitoring in the Case of the Hinterland of Koroška Bela, NW Slovenia. In Understanding and Reducing Landslide Disaster Risk; Springer International Publishing: Berlin/Heidelberg, Germany, 2021; pp. 459–464. [Google Scholar]
- Jemec Auflič, M.; Mikoš, M.; Verbovšek, T. Advances in Ladslide Research. In Proceedings of the 3rd Regional Symposium on Landslides in the Adriatic Balcan Region, Ljubljana, Slovenia, 11–13 October 2017. [Google Scholar]
- Jež, J.; Mikoš, M.; Trajanova, M.; Kumelj, Š.; Budkovič, T.; Bavec, M. Koroška Bela alluvial fan—The result of the catastrophic slope events; Karavanke Mountains, NW Slovenia). Geologija 2008, 51, 219–227. [Google Scholar] [CrossRef]
- SEA. Annual Data (1981–2019) at Javorniški Rovt. Available online: http://meteo.arso.gov.si/met/sl/app/webmet/#webmet==8Sdwx2bhR2cv0WZ0V2bvEGcw9ydlJWblR3LwVnaz9SYtVmYh9iclFGbt9SaulGdugXbsx3cs9mdl5WahxXYyNGapZXZ8tHZv1WYp5mOnMHbvZXZulWYnwCchJXYtVGdlJnOn0UQQdSf (accessed on 20 November 2021).
- Črepinšek, Z.; Kunšič, A.; Kralj, T.; Kajfež-Bogataj, L. Precipitation analysis of the wider area of the Triglav national park for the period 1961–2009. Acta Agric. Slov. 2011, 97, 295–304. [Google Scholar]
- Kunšič, A. Precipitation Analysis of the Wider Area of the Triglav National Park. Graduation Thesis, University of Ljubljana, Ljubljana, Slovenia, 2011. [Google Scholar]
- SEA. Environmental Atlas of Slovenia. Available online: http://gis.arso.gov.si/atlasokolja/profile.aspx?id=Atlas_Okolja_AXL@ARSO&culture=en-US (accessed on 10 January 2022).
- Vreča, P.; Brenčič, M.; Sinjur, I.; Vertačnik, G.; Volk, M.; Ortar, J.; Torkar, A.; Stibilj, V.; Pavšek, M. Izotopska sestava padavin in snega na območju Julijskih Alp in Karavank. In Proceedings of the Raziskave iz Področja Geodezije in Geofizike—18. Strokovno Srečanje Slovenskega Združenja za Geodezijo in Geofiziko, Ljubljana, Slovenia, 29 January 2013. [Google Scholar]
- Aggarwal, P.K.; Araguas, L.; Garner, W.A.; Groening, M.; Kulkarni, K.M. Sampling Procedures for Isotope Hydrology. 2009, p. 8. Available online: http://www-naweb.iaea.org/napc/ih/documents/other/Sampling%20booklet%20web.pdf (accessed on 23 January 2022).
- Kendall, C.; McDonnell, J.J. Isotope Tracers in Catchment Hydrology; Elsevier Science: Amsterdam, The Netherlands, 1998. [Google Scholar]
- WTW. Manual WTW ph.Cond 340i; ba52312e; WTW: Weilheim, Germany, 2004. [Google Scholar]
- WTW. Manual WTW FDO 925; ba75898defs01; WTW: Weilheim, Germany, 2010. [Google Scholar]
- WTW. Manual WTW SenTiX ORP. Pt. Au. Ag.; ba75741defs01; WTW: Weilheim, Germany, 2008. [Google Scholar]
- Picarro. Operation, Maintenance and Troubleshooting L2140-i, L2130-i or L2120-i Analyzer and Peripherals—User’s Manual; Picarro: Santa Clara, CA, USA, 2015; p. 2. [Google Scholar]
- Picarro. Picarro L2130-i Isotopic Water Analyzer. Available online: http://www.ebd.csic.es/lie/PDF/Picarro_L2130-i_Isotopic_Water_Analyzer.pdf (accessed on 20 November 2021).
- IAEA. WICO 2020 δ¹⁸O /δ²H Intercomparison Test Laboratory Report; IAEA: Vienna, Austria, 2020; p. 8. [Google Scholar]
- USGS. Report of Stable Isotopic Composition Reference Material USGS46 Ice Core Water (Hydrogen and Oxygen Isotopes in Water); United State Geological Survey-Reston Stable Isotope Laboratory: Reston, VA, USA, 2019; p. 3. [Google Scholar]
- USGS. Report of Stable Isotopic Composition Reference Material USGS47 Lake Louise Drinking Water (Hydrogen and Oxygen Isotopes in Water); United States Geological Survey-Reston Stable Isotope Laboratory: Reston, VA, USA, 2019. [Google Scholar]
- USGS. Report of Stable Isotopic Composition Reference Material USGS48 Puerto Rico Precipitation (Hydrogen and Oxygen Isotopes in Water); United States Geological Survey-Reston Stable Isotope Laboratory: Reston, VA, USA, 2020. [Google Scholar]
- Vreča, P.; Krajcar Bronić, I.; Leis, A.; Brenčič, M. Isotopic composition of precipitation in Ljubljana (Slovenia). Geologija 2008, 51, 169–180. [Google Scholar] [CrossRef]
- Drezner, Z.; Turel, O.; Zerom, D. A Modified Kolmogorov–Smirnov Test for Normality. Commun. Stat. Simul. Comput. 2010, 39, 693–704. [Google Scholar] [CrossRef] [Green Version]
- Bliss, C. Statistics in Biology; McGraw-Hill Book Co.: New York, UY, USA, 1970; Volume 2. [Google Scholar]
- Rodgers, P.; Soulsby, C.; Waldron, S.; Tetzlaff, D. Using stable isotope tracers to assess hydrological flow paths, residence times and landscape influences in a nested mesoscale catchment. Hydrol. Earth Syst. Sc. 2005, 9, 139–155. [Google Scholar] [CrossRef] [Green Version]
- Lentech. Water Analysis Accuracy Tester. Available online: https://www.lenntech.com/calculators/accuracy/accuracy-water-analysis.htm (accessed on 23 January 2022).
- Ahmed, M.F.; Waqas, U.; Khan, M.S.; Rashid, H.M.A.; Saqib, S. Evaluation and classification of water quality of glacier-fed channels using supervised learning and water quality index. Water Environ. J. 2021, 35, 1174–1191. [Google Scholar] [CrossRef]
- Domenico, P.A.; Schwartz, F.W. Physical and Chemical Hydrogeology; Wiley: New York, NY, USA, 1998. [Google Scholar]
- Sajil Kumar, P.J. Interpretation of groundwater chemistry using piper and hadha`s diagrams: A comparative study from perambalur taluk. Elixir Geosci. 2013, 54, 12208–12211. [Google Scholar]
- Ravikumar, P.; Somashekar, R.K.; Prakash, K.L. A comparative study on usage of Durov and Piper diagrams to interpret hydrochemical processes in groundwater from SRLIS river basin, Karnataka, India. Elixir Earth Sci. 2015, 80, 31073–31077. [Google Scholar]
- Waterloo. AquaChem 2014.2. A Professional Application for Water Quality Data Analysis. Plotting. Reporting. And Modelling. Demonstration Guide; Waterloo Hydrogeologic: Waterloo, ON, Canada, 2014; p. 67. [Google Scholar]
- Craig, H. Isotopic Variations in Meteoric Waters. Science 1961, 133, 1702–1703. [Google Scholar] [CrossRef] [PubMed]
- Durowoju, O.S.; Odiyo, J.O.; Ekosse, G.-I.E. Determination of isotopic composition of rainwater to generate local meteoric water line in Thohoyandou, Limpopo Province, South Africa. Water SA 2019, 45, 183–189. [Google Scholar] [CrossRef] [Green Version]
- Yurtsever, Y.; Araguas, L.A. Environmental isotope applications in hydrology: An overview of the IAEA’s activities, experiences, and prospects. In Proceedings of the Tracers in Hydrology (Proceedings of the Yokohama Symposium), Yokohama, Japan, 21–23 July 1993. [Google Scholar]
- Benjamin, L.; Knobel, L.L.; Hall, F.L.; Cecil, L.D.; Green, J.R. Development of a Local Meteoric Water Line for Southeastern Idaho, Western Wyoming, and South-Central Montana; USGS: New York, NY, USA, 2004; 23p. [Google Scholar]
- Helsel, D.R.; Hirsch, R.M. Statistical Methods in Water Resources; USGS: New York, NY, USA, 1992; 522p. [Google Scholar]
- Dansgaard, W. Stable isotopes in precipitation. Tellus XVI 1964, 4, 33. [Google Scholar]
- Jefferson, A.; Grant, G.; Rose, T. Influence of volcanic history on groundwater patterns on the west slope of the Oregon High Cascades. Water Resour. Res. 2006, 42, 1–15. [Google Scholar] [CrossRef] [Green Version]
- Roses, T.P.; Davisson, M.L.; Criss, R.E. Isotope hydrology of voluminous cold springs in fractured rock from an active volcanic region, northeastern California. J. Hydrol. 1996, 179, 207–236. [Google Scholar] [CrossRef]
- Torkar, A. Analysis of Groundwater Outflow through Springs in Fluvioglacial Intergranular Aquifers. Ph.D. Thesis, University of Ljubljana, Ljubljana, Slovenia, 2016. [Google Scholar]
- Torkar, A.; Brenčič, M.; Vreča, P. Chemical and isotopic characteristics of groundwater-dominated Radovna River (NW Slovenia). Environ. Earth Sci. 2016, 75, 1296. [Google Scholar] [CrossRef]
- OriginLab. OriginPro; OriginLab Corporation: Northampton, MA, USA, 2019. [Google Scholar]
- Burgman, J.O.; Calles, B.; Weatman, F. Conclusions from a ten year study of oxygen-18 in precipitation and runoff in Sweden. In Isotope Techniques in Water Resources Development; International Atomic Energy Agency: Vienna, Austria, 1987; pp. 579–590. [Google Scholar]
- Aggarwal, P.; Gourcy, L.; Birks, J.; Edwards, T.; Gibson, J. GNIP Maps and Animations. Available online: http://www-naweb.iaea.org/napc/ih/documents/userupdate/Waterloo/ (accessed on 23 January 2022).
- IJS. SLONIP-Slovenian Network of Isotopes in Precipitation. Available online: https://slonip.ijs.si/accounts/login/?next=/data/6 (accessed on 6 December 2021).
- Vreča, P.; Kanduč, T.; Kocman, D.; Lojen, S.; Robinson, J.; Štrok, M. Slovenska mreza opazovanj izotopske sestave padavin (SLONIP). In Proceedings of the Drugi Slovenski Kongres o Vodah, Podčetrtek, Slovenia, 19–20 April 2017. [Google Scholar]
- Serianz, L.; Cerar, S.; Vreča, P. Using stable isotopes and major ions to identify recharge characteristics of the Alpine groundwater-flow dominated Triglavska Bistrica River. Geologija 2021, 64, 205–220. [Google Scholar] [CrossRef]
- Davis, J.C. Statistics and Data Analysis in Geology; Wiley: New York, NY, USA, 2002. [Google Scholar]
- McLeod, S.A. Introduction to the Normal Distribution (Bell Curve). Simply Psychology. Available online: https://www.simplypsychology.org/normal-distribution.html (accessed on 22 November 2021).
- Kastelec, D. Use of Universal Kriging for Objective Spatial Interpolation of Average Yearly Precipitation in Slovenia; Zbornik Biotehniške fakultete Univerze v Ljubljani: Kmetijstvo, Ljubljana, 1999; pp. 301–314. [Google Scholar]
- Serianz, L.; Rman, N.; Brenčič, M. Hydrogeochemical Characterization of a Warm Spring System in a Carbonate Mountain Range of the Eastern Julian Alps, Slovenia. Water 2020, 12, 1427. [Google Scholar] [CrossRef]
- Mezga, K. Natural Hydrochemical Background and Dynamics of Groundwater in Slovenia. Ph.D. Thesis, University of Nova Gorica, Nova Gorica, Slovenia, 2014. [Google Scholar]
- Serianz, L. Hydrogeological Analysis of Thermal Water Outflow from a Carbonate Aquifer in the Eastern Part of the Julian Alps. Ph.D. Thesis, University of Ljubljana, Ljubljana, Slovenia, 2022. [Google Scholar]
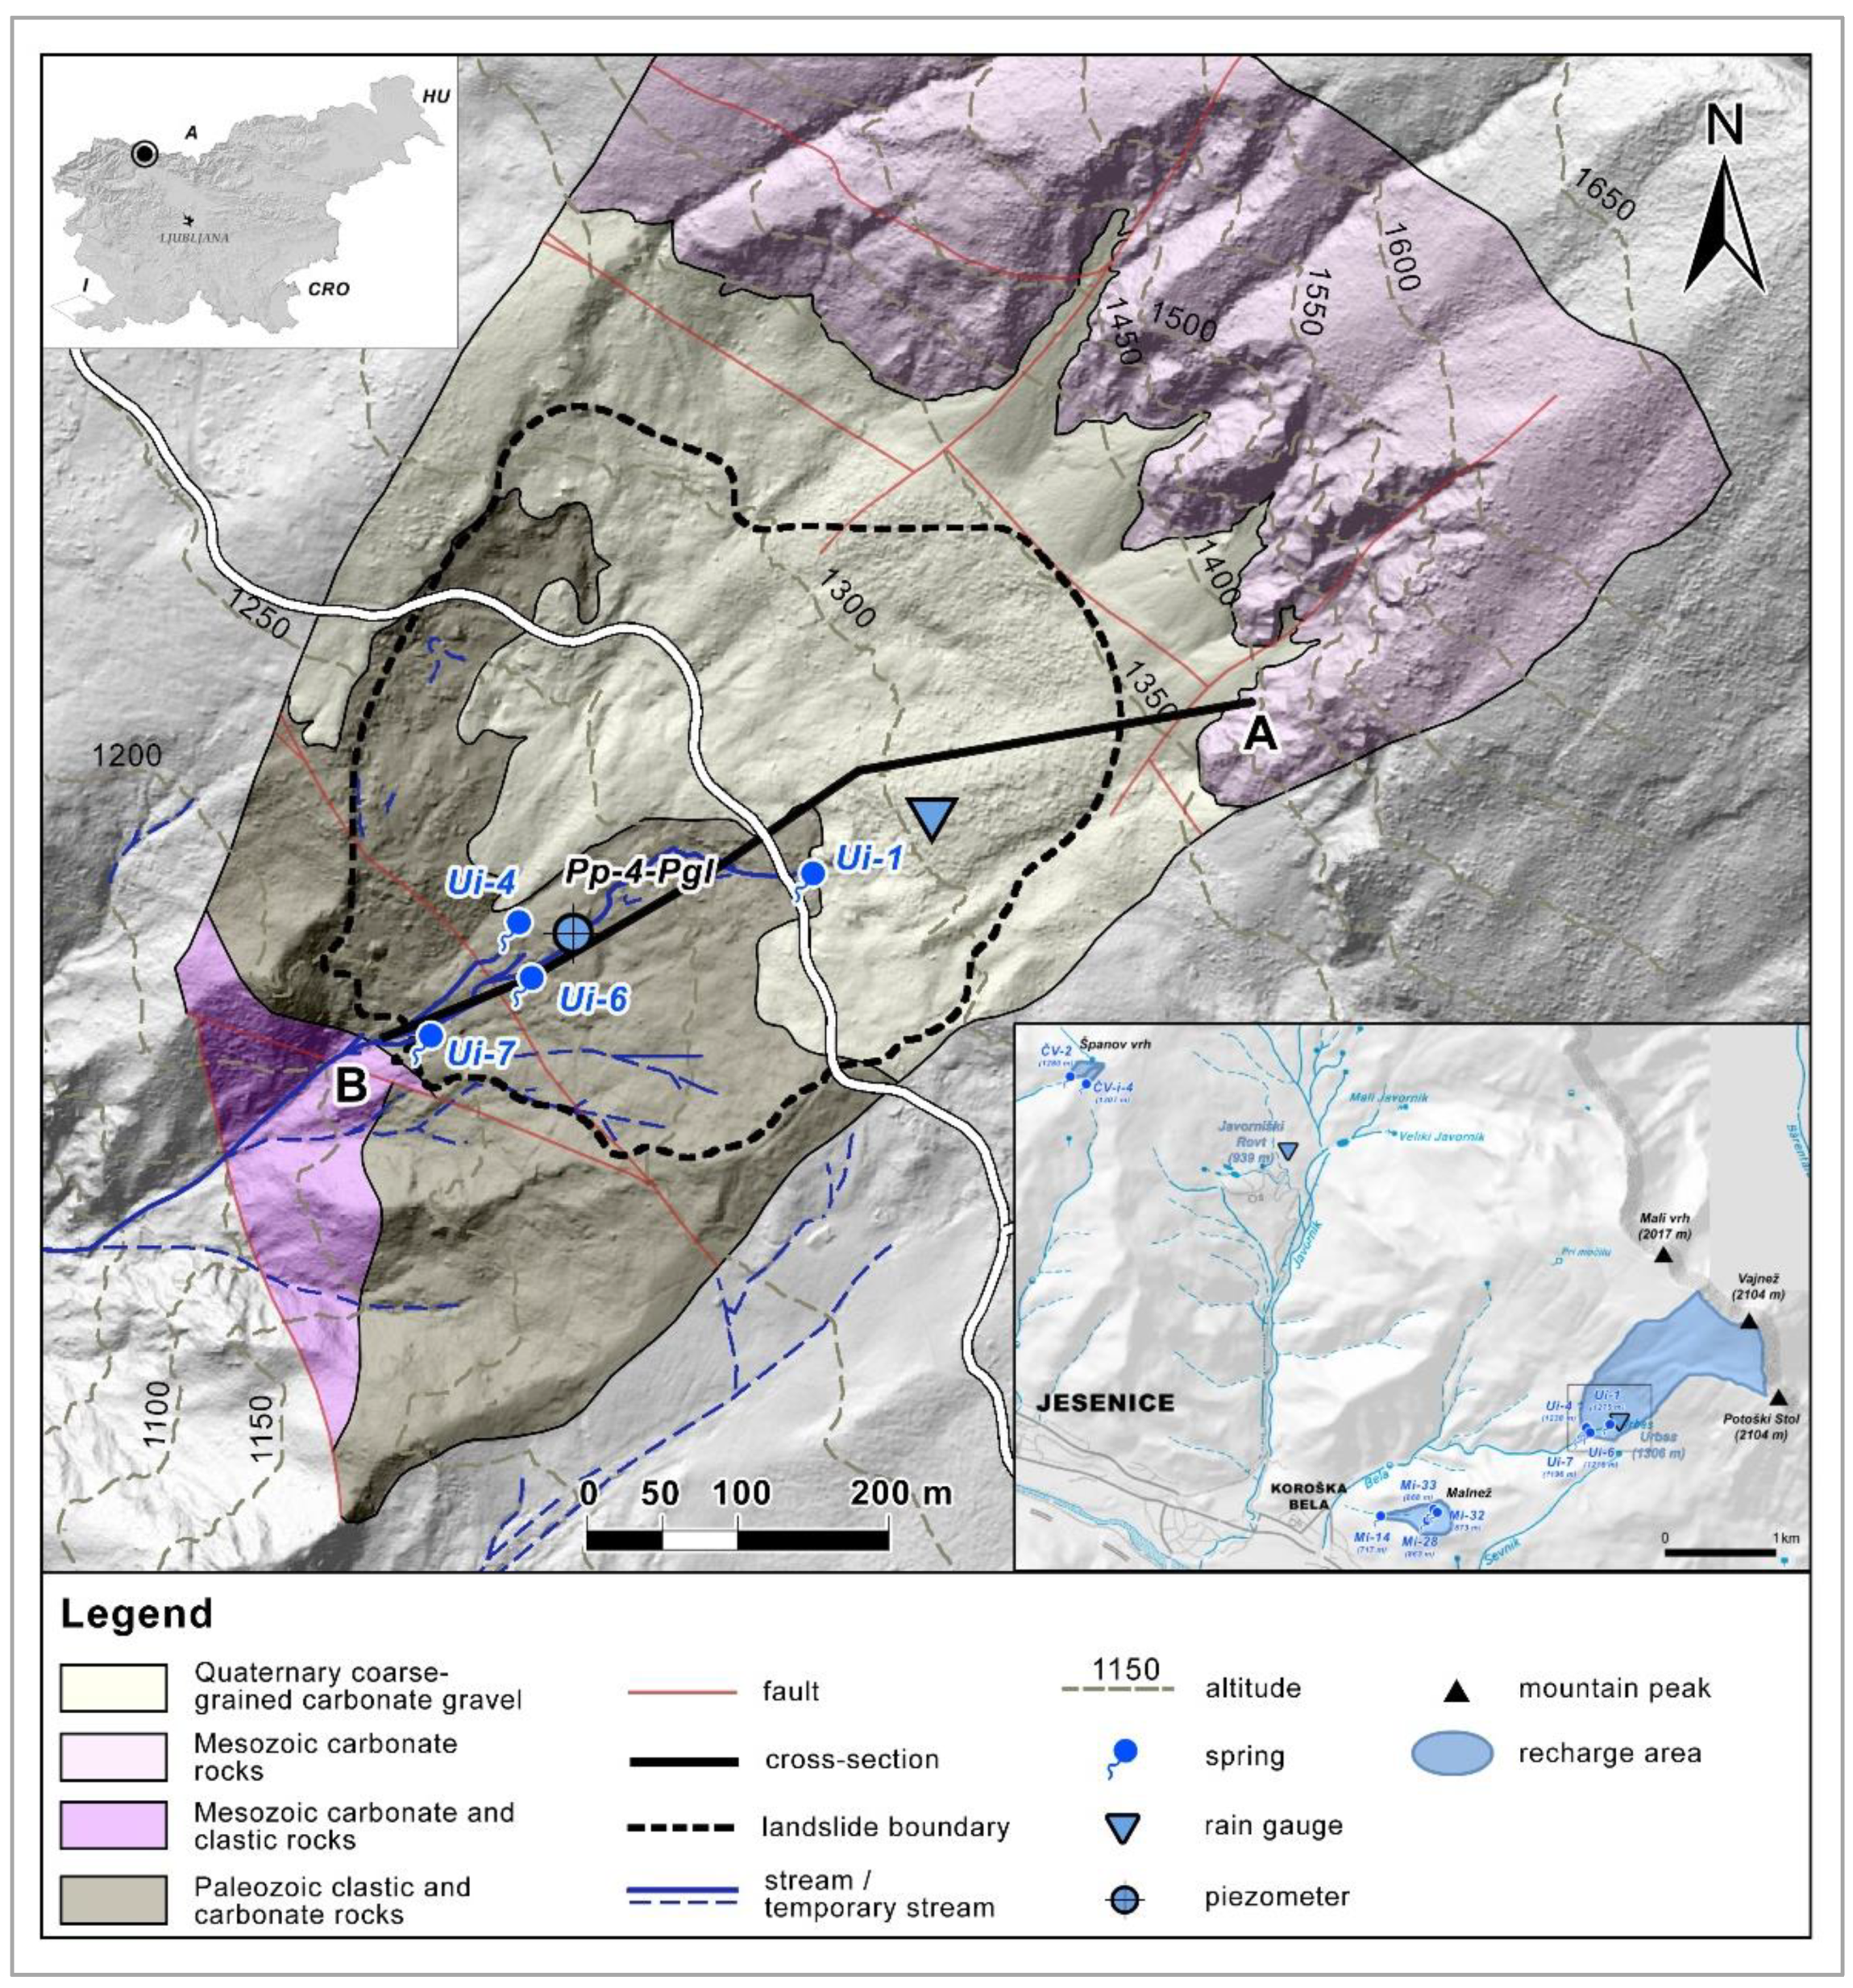
Figure 1.
Geological map of the Urbas study area with landslide boundary (modified after [27]), sampling points, and cross-section (Figure 2).

Figure 2.
Cross-section (A–B cross-section is shown on Figure 1) of the Urbas landslide.
Figure 2.
Cross-section (A–B cross-section is shown on Figure 1) of the Urbas landslide.

Figure 3.
Estimated local meteoric water line.

Figure 4.
Comparison of the LMWL of Urbas with the LMWL of Kredarica and Zgornja Radovna.

Figure 5.
Average recharge altitude estimation.

Figure 6.
Seasonal sine wave fit between observed and modeled δ18O values in precipitation: rain gauge Urbas—weighted (a); rain gauge Zgornja Radovna (b); water in springs Ui-1 (c), Ui-4 (d), Ui-6 (e), and Ui-7 (f).
Figure 6.
Seasonal sine wave fit between observed and modeled δ18O values in precipitation: rain gauge Urbas—weighted (a); rain gauge Zgornja Radovna (b); water in springs Ui-1 (c), Ui-4 (d), Ui-6 (e), and Ui-7 (f).


Figure 7.
Cross-section (Figure 1) of the Urbas landslide.
Figure 7.
Cross-section (Figure 1) of the Urbas landslide.


Table 1.
Physico-chemical field parameters and major ions in groundwater measured on 21 June 2018.
| Sampling Point | Ui-1 (1275.4 m a.s.l.) | Pp-4-Pgl (1229.7 m a.s.l.) | Ui-4 (1237.45 m a.s.l.) | Ui-6 (1218.5 m a.s.l.) | Ui-7 (1195.8 m a.s.l.) |
|---|---|---|---|---|---|
| Object type | spring | piezometer | spring | spring | spring |
| T (°C) | 3.9 | 6.4 | 5.2 | 5.1 | 6.6 |
| EC (µS/cm) | 175 | 322 | 217 | 211 | 235 |
| pH (/) | 8.3 | 8.1 | 7.9 | 7.9 | 8.0 |
| DO (mg/L) | 11.9 | 10.0 | 11.0 | 11.3 | 10.7 |
| O2 (%) | 105.3 | 94 | 100 | 102.4 | 100.4 |
| Eh (mV) | 347 | 365 | 469 | 440 | 442 |
| Na+ (mg/L) | 1.0 | 1.4 | 1.4 | 1.1 | 1.5 |
| K+ (mg/L) | <0.25 * | 0.32 | 0.31 | <0.25 * | 0.35 |
| Ca2+ (mg/L) | 32 | 38 | 40 | 39 | 44 |
| Mg2+ (mg/L) | 4.5 | 5.6 | 5.5 | 5.5 | 5.7 |
| HCO3− (mg/L) | 123 | 143 | 150 | 143 | 157 |
| SO42− (mg/L) | <1.50 * | 3.30 | 3.45 | 1.89 | 3.84 |
| Cl− (mg/L) | <0.75 * | <0.75 * | <0.75 * | <0.75 * | <0.75 * |
| NO3− (mg/L) | <2.2 * | <2.2 * | <2.2 * | <2.2 * | <2.2 * |
| ICBE (%) | 1.14 | 0.31 | 0.82 | 0.78 | 1.05 |
| Hydro-chemical facies | Ca–HCO3 | Ca–HCO3 | Ca–HCO3 | Ca–HCO3 | Ca–HCO3 |
* LOQ.
Table 2.
Basic statistics of the isotopic composition of springs.
| Number of Samples | Mean | Median | Minimum | Maximum | SD | |
|---|---|---|---|---|---|---|
| Ui-1 | ||||||
| δ18O (‰) | 24 | −10.64 | −10.39 | −11.90 | −9.61 | 0.69 |
| δ2H (‰) | 24 | −72.9 | −73.0 | −80.9 | −64.0 | 4.82 |
| Ui-4 | ||||||
| δ18O (‰) | 24 | −10.68 | −10.39 | −12.27 | −9.74 | 0.80 |
| δ2H (‰) | 24 | −73.0 | −72.4 | −84.9 | −65.0 | 5.71 |
| Ui-6 | ||||||
| δ18O (‰) | 23 | −10.28 | −10.26 | −11.68 | −9.08 | 0.68 |
| δ2H (‰) | 23 | −70.4 | −69.7 | −80.1 | −59.7 | 4.64 |
| Ui-7 | ||||||
| δ18O (‰) | 24 | −10.23 | −10.22 | −11.69 | −9.11 | 0.70 |
| δ2H (‰) | 24 | −70.3 | −70.6 | −79.7 | −59.7 | 4.80 |
Table 3.
Mean values of δ18O and δ2H and the altitude of the small springs in Španov vrh and Malnež area.
Table 3.
Mean values of δ18O and δ2H and the altitude of the small springs in Španov vrh and Malnež area.
| Sampling Point | Number of Samples | Location | Altitude (m a.s.l.) | Estimated Y (m a.s.l.) | δ18Omean (‰) | δ2Hmean (‰) |
|---|---|---|---|---|---|---|
| ČV-2 | 2 | Španov vrh | 1280.0 | 1311.9 | −9.17 | −59.4 |
| ČVi-4 | 2 | Španov vrh | 1307.0 | 1328.5 | −9.17 | −59.8 |
| Mi-14 | 2 | Malnež | 717.1 | 865.1 | −8.76 | −57.8 |
| Mi-28 | 2 | Malnež | 862.7 | 918.5 | −8.77 | −58.2 |
| Mi-32 | 2 | Malnež | 873.0 | 905.0 | −8.44 | −55.7 |
| Mi-33 | 2 | Malnež | 867.5 | 899.7 | −8.34 | −54.9 |
Table 4.
Estimated average recharge altitude (Y) of springs in the Urbas landslide.
| Spring | Number of Samples | Altitude (m a.s.l.) | δ18Omean (‰) | (Y) (m a.s.l.) |
|---|---|---|---|---|
| Ui-1 | 6 | 1275.40 | −10.15 | 1778.5 |
| Ui-4 | 6 | 1237.45 | −10.15 | 1776.1 |
| Ui-6 | 6 | 1218.50 | −9.96 | 1674.8 |
| Ui-7 | 6 | 1195.80 | −9.92 | 1654.9 |
Table 5.
Estimated MRT of water in springs in the Urbas landslide.
| Sampling Point | Object Type | Amplitude | R2 | MRT (Years) Based on Urbas | MRT (Years) Based on Zgornja Radovna |
|---|---|---|---|---|---|
| Urbas | Rain gauge | 2.66 | 0.21 | - | p |
| Zgornja Radovna | Rain gauge | 2.07 | 0.42 | ||
| Ui-1 | Spring | 0.88 | 0.35 | 0.23 | 0.32 |
| Ui-4 | Spring | 1.00 | 0.38 | 0.19 | 0.27 |
| Ui-6 | Spring | 0.55 | 0.09 | 0.42 | 0.56 |
| Ui-7 | Spring | 0.74 | 0.24 | 0.29 | 0.40 |
Publisher’s Note: MDPI stays neutral with regard to jurisdictional claims in published maps and institutional affiliations. |
© 2022 by the authors. Licensee MDPI, Basel, Switzerland. This article is an open access article distributed under the terms and conditions of the Creative Commons Attribution (CC BY) license (https://creativecommons.org/licenses/by/4.0/).
Share and Cite
MDPI and ACS Style
Koren, K.; Serianz, L.; Janža, M. Characterizing the Groundwater Flow Regime in a Landslide Recharge Area Using Stable Isotopes: A Case Study of the Urbas Landslide Area in NW Slovenia. Water 2022, 14, 912. https://doi.org/10.3390/w14060912
AMA Style
Koren K, Serianz L, Janža M. Characterizing the Groundwater Flow Regime in a Landslide Recharge Area Using Stable Isotopes: A Case Study of the Urbas Landslide Area in NW Slovenia. Water. 2022; 14(6):912. https://doi.org/10.3390/w14060912
Chicago/Turabian StyleKoren, Katja, Luka Serianz, and Mitja Janža. 2022. "Characterizing the Groundwater Flow Regime in a Landslide Recharge Area Using Stable Isotopes: A Case Study of the Urbas Landslide Area in NW Slovenia" Water 14, no. 6: 912. https://doi.org/10.3390/w14060912
Note that from the first issue of 2016, this journal uses article numbers instead of page numbers. See further details here.