Article

Variation in the Structure and Composition of Bacterial Communities within Drinking Water Fountains in Melbourne, Australia

by
Warren Evan Blyth
*,
Esmaeil Shahsavari
,
Arturo Aburto-Medina
,
Andrew S. Ball
and
Andrew Mark Osborn
School of Science College of Science, Technology, Engineering and Maths, RMIT, Bundoora, VIC 3083, Australia
*
Author to whom correspondence should be addressed.
Water 2022, 14(6), 908; https://doi.org/10.3390/w14060908
Submission received: 27 January 2022 / Revised: 7 March 2022 / Accepted: 11 March 2022 / Published: 14 March 2022

Abstract

:
Modern drinking water distributions systems (DWDSs) have been designed to transport treated or untreated water safely to the consumer. DWDSs are complex environments where microorganisms are able to create their own niches within water, biofilm or sediment. This study was conducted on twelve drinking fountains (of three different types, namely types A, B and C) within the Melbourne (Australia) city area with the aim to (i) characterize the water quality and viable and total counts at each fountain, (ii) compare the differences in the structure and diversity of the bacterial community between bulk water and biofilm and (iii) determine differences between the bacterial communities based on fountain type. Samples of water and biofilm were assessed using both culture-dependent and culture-independent techniques. Heterotrophic plate counts of water samples ranged from 0.5 to 107.5 CFU mL−1, and as expected, total cell counts (cells mL−1) were, on average, 2.9 orders of magnitude higher. Based on the mean relative abundance of operational taxonomic units (OTUs), ANOSIM showed that the structure of the bacterial communities in drinking water and biofilm varied significantly (R = 0.58, p = 0.001). Additionally, ANOSIM showed that across fountain types (in water), the bacterial community was more diverse in fountain type C compared to type A (p < 0.001) and type B (p < 0.001). 16S rRNA next-generation sequencing revealed that the bacterial communities in both water and biofilm were dominated by only seven phyla, with Proteobacteria accounting for 71.3% of reads in water and 68.9% in biofilm. The next most abundant phylum was Actinobacteria (10.4% water; 11.7% biofilm). In water, the genus with the highest overall mean relative abundance was Sphingomonas (24.2%), while Methylobacterium had the highest mean relative abundance in biofilm samples (54.7%). At the level of genus and higher, significant differences in dominance were found across fountain types. In water, Solirubrobacterales (order) were present in type C fountains at a relative abundance of 17%, while the mean relative abundance of Sphingomonas sp. in type C fountains was less than half that in types A (25%) and B (43%). In biofilm, the relative abundance of Sphingomonas sp. was more than double in type A (10%) fountains compared to types B (4%) and C (5%), and Sandarakinorhabdus sp. were high in type A fountains (6%) and low in types B and C (1%). Overall this research showed that there were significant differences in the composition of bacterial communities in water and biofilm from the same site. Furthermore, significant variation exists between microbial communities present in the fountain types, which may be related to age. Long-established environments may lead to a greater chance of certain bacteria gaining abilities such as increased disinfection resistance. Variations between the structure of the bacterial community residing in water and biofilm and differences between fountain types show that it is essential to regularly test samples from individual locations to determine microbial quality.

1. Introduction

Modern drinking water distributions systems (DWDSs) have been designed to transport treated or untreated water safely to the consumer. There is understandably an expectation that such potable water is chemically and biologically safe for consumption. However, DWDSs are complex environments where microorganisms are able to create their own niches within water, biofilm or sediment [1]. There are many factors that affect the structure and composition of DWDS microbial communities, including season [2,3], hydraulic conditions [4], water age [5] and pipe material [6,7,8]. In water distribution systems, up to 95% of biomass resides within “slime” or “biological deposits” more commonly known as biofilms [9]. Biofilms are assemblages made up of microbial cells and extracellular polymeric substances (EPSs) comprising a mixture of cells, polysaccharides and proteins [10,11]. Biofilms function to provide a scaffold which contributes to the protection of microorganisms from such hazards as predation, disinfection and shear forces. However, with the inevitable degradation of some of the biofilm, bacterial cells can also be mobilized into the bulk water stream [12] by abrasion, grazing, erosion or sloughing of cells from pipe surfaces [13]. Consequently, it is important when investigating the microbiology of a DWDS that both water and biofilm are included in the research.
Historically, results from heterotrophic plate counts (HPCs) have been used to assess microbial water quality within DWDSs. Increasingly, researchers are looking for methods that more accurately assess both the overall numbers and composition of the microbial community within drinking water. These include culture-independent methods such as direct cell counts [14,15], flow cytometry [16,17] and high-throughput sequencing of 16S rRNA genes [18,19]. In particular, sequencing of rRNA genes has been used to determine the identity and relative abundance of microorganisms present in many studies. Results have been reported from such diverse environments as treatment plants [20,21,22,23], water meters [24,25] and pipe surfaces [26]. In a study on a WTP in Southeast China, multidimensional scaling (MDS) analysis of water and biofilm samples showed that the compositions of bacterial communities in chlorinated water were significantly different compared to biofilms collected at different stages of the treatment process and that Nitrospira sp. were present at higher relative abundances in biofilm compared to bulk water [27]. In another study, high-throughput sequencing of 16S rRNA genes was used to explore bacterial communities associated with biofilm collected from disassembled water meters from two private households associated with the Urbana–Champaign DWDS (Illinois, USA). Results showed that the bacterial communities were unique in composition and diversity between the individual meters [24]. While similar studies provide valuable knowledge concerning bacterial communities within WTPs, DWDSs and biofilm, there are no studies comparing the structure of the bacterial community within bulk water and biofilm in public drinking water fountains.
Research investigating microorganisms within drinking water in Australia has addressed environments including recreational parks [28], groundwater bores [29], private water tanks [30,31], water catchments [32,33,34] and DWDSs [35] and has often focussed on specific pathogenic microorganisms including Escherichia coli [35], Cryptosporidium and Giardia [33,36] and nontuberculous Mycobacterium species [37,38,39] rather than investigating the composition of the entire community via high-throughput sequencing technologies. Clearly, an appropriate investigation into the identity and relative abundance of bacteria residing in water sourced from point-of-use locations (fountains) is necessary. The outcomes of this research will improve the consumer’s and the water industry’s understanding of the composition of bacterial communities which inhabit point-of-use locations such as drinking water fountains. Additionally, this research will demonstrate that microbial water quality is affected by network infrastructure and how water treatment regime is a significant selection criterion for particular taxa. Finally, the knowledge of the make-up of the bacterial community will allow local and state water authorities to assess their own networks and potentially introduce strategic network and maintenance procedures to ensure control of the microbiology of drinking water.
Across the Melbourne city area (~15.1 km2) there are approximately 100 drinking water fountains [40]. With a mean of 6.6 fountains/km2, access to safe drinking water compares well with major European cities such as Zurich, Switzerland (8.0 fountains/km2) [41]. While it would have been desirable to have sampled all of these fountains, it was determined that the logistics of such a task prohibited such a large sample size. Consequently, the current study was conducted on 12 drinking fountains within the Melbourne city area. Both bulk water and biofilm samples were taken, and the composition of bacterial communities was determined by sequencing 16S rRNA genes via the Miseq high-throughput DNA platform.
The overall aims included: (i) characterizing the water quality and viable and total counts within the product at the point of use, (ii) comparing the differences in the structure and diversity of the bacterial community between bulk water and biofilm and (iii) determining differences between bacterial community compositions based on fountain type.

2. Materials and Methods

2.1. Sampling

Water supplied to drinking fountains originates from three reservoirs: Silvan, Sugarloaf and Greenvale (Figure S1). Before delivery into the distribution system, water passes through the Winneke treatment plant where coagulation/flocculation, sand filtration, gas chlorination and pH adjustment occur and finally fluoride is added in the form of fluorosilicic acid [42]. Sampling was undertaken across fountains of three different types. Types “A” and “B” were first installed in 2014, while type “C” fountains have been in use since 1996 [43] (Figure 1B). At each of the sampling locations (Figure 1, Table S1), biofilm was directly sampled from the fountain nozzle using a sterile cotton tip prior to collection of bulk water. Only one biofilm sample was taken as it was deemed most, if not all, biological matter would have been collected the first time. The cotton tip was immediately placed into a QIAGEN Powerwater bead-beating tube for later DNA extraction. From each fountain, four consecutive replicates of bulk water were taken for microbiological, molecular and water quality analysis, in which 500 mL of water for each replicate was deposited into sterile sampling bags (Labplas Twirl’em, Ste-Julie, QC, Canada). From each replicate, individual Falcon tubes (50 mL) were filled with water for heterotrophic plate counts, ion chromatography and total counts. The bags and tubes were then placed into a cooler containing ice. Additionally, physicochemical measurements including temperature, conductivity, pH and dissolved oxygen were taken using a 556 MPS portable multiparameter instrument (YSI Life Sciences, Yellow Spring, OH, USA). Turbidity and measurements from the multiparameter device were then recorded, and samples were returned to the laboratory and processed within four hours.

2.2. Processing of Biofilm and Water Samples

Within three hours of collection, water replicates (3 mL, n = 4) were sterilized by passing through 0.22 µm Millex-GP filter units (Merck Millipore, Cork, Ireland) into 10 mL sterile tubes. These samples were then stored at −20 °C until subsequent analysis. Upon returning to the laboratory, biofilm samples were placed directly into the −20 °C freezer.

2.2.1. Anion and Cation Determination

The samples were later thawed and analyzed using a Dionex ICS-1100 ion chromatography system (Thermo Scientific, Waltham, MA, USA). The concentrations of anions, namely chloride, fluoride, nitrate, sulfate, phosphate, nitrite and bromide, were determined using the IonPac AS22-Fast Analytical Column (Dionex, Scoresby, VIC, Australia) with a standard flow rate of 1.2 mL min−1 and a 10 min cycle. The concentrations of cations, namely ammonium, lithium, sodium, potassium, magnesium and calcium, were determined using the IonPac CS12A-5 µm column (Dionex, Scoresby, VIC, Australia) which has a standard flow rate of 0.5 mL min−1 and a 13 min cycle.

2.2.2. Coliform/Escherichia coli

The presence/absence and numbers of coliforms and Escherichia coli bacteria were determined by Standard Method 9223 Enzyme Substrate Coliform Test (Standard Methods, 2016), using the Colilert commercial enzyme-substrate liquid-broth medium (IDEXX Laboratories, Inc., Westbrook, ME, USA) which detects and enumerates these indicator organisms by the most probable number method (MPN).

2.2.3. Viable Counts

The number of heterotrophic bacteria was determined via the pour plate method to allow direct comparisons with results obtained by City West Water. For each replicate (n = 4), 2 × 1 mL aliquots were deposited onto separate plate count agar (PCA) plates (Amyl Media, Dandenong, VIC, Australia). The plate count was determined under two different incubation conditions: 37 °C for two days and 22 °C for three days. At the time of sampling, City West Water [44] determined total plate count at 37 °C, while historically, incubation at 22 °C for 3 days has been used to provide information regarding the level of nutritional substances that may be available to bacteria [45] and has been recommended in the ADWG guidelines [46].

2.2.4. Total Cell Counts

Total microbial counts in water samples were determined using the green-fluorescent nucleic acid stain SYTO9 (ThermoFisher Scientific, Scoresby, VIC, Australia). An aliquot (25 µL) of a 50 µM SYTO9 solution was added to 25 mL of each drinking water replicate (n = 4) and left to incubate at room temperature in the dark for 20 min. The 25 mL samples were then filtered through 0.2 µm/47 mm diameter, black Cyclopore track-etched membranes (Whatman, Florham Park, NJ, USA). The membranes were then removed from the filter housing, placed into 50 mm Petri dishes and stored in the dark at −20 °C prior to cell counts. A sterile scalpel was used to bisect each 47 mm diameter membrane twice to produce quarters. One quarter was mounted onto a microscope slide with a coverslip and viewed at 1000× magnification with immersion oil. The number of fluorescing cells present was then counted from 20 fields of view (FOVs) using a Leica DM2500 microscope (Leica Microsystems Inc., Buffalo Grove, IL, USA), and then the mean number of cells per FOV was converted to cells mL−1.

2.2.5. DNA Extraction, PCR Amplification and Sequencing

The bead-beating tubes containing the filter membranes (water samples) or tips (biofilm samples) were removed from the freezer and allowed to thaw for 10 min. Nucleic acids were extracted using the Powerwater nucleic acid extraction procedure (QIAGEN, Hilden, Germany). The procedure was followed closely except for one step: following the addition of 1 mL of reagent No. 1, bead-beading tubes were agitated (in groups of six) with a desktop vortex machine for 10 min.
Amplification of bacterial DNA was achieved using the polymerase chain reaction (PCR), which has been a valuable molecular investigation process since the 1970s [47]. More recently, PCR has become an important tool regarding the identification of individuals who may be infected with the COVID-19 virus [48]. PCR amplification of 16S rRNA genes from DNA samples was performed using a T100 Thermocycler (BIO-RAD, Gladesville, NSW, Australia) in a total volume of 25 µL comprising 12.5 µL master mix (GeneWorks, Thebarton, SA, Australia), 8.5 µL of water, 40 nM forward primer (MiSeq FP–5′–TCGTCGGCAGCGTCAGATGTGTATAAGAGACAGCCTACGGGNGGCWGCAG-3′), 40 nM reverse primer (MiSeq RP–5′–GTCTCGTGGGCTCGGAGATGTGTATAAGAGACAGGACTACHVGGGTATCTAATCC–3′) and 2 µL of extracted DNA. The PCR cycle was 95 °C for 3 min; 30 cycles of 95 °C for 30 s, 55 °C for 30 s and 72 °C for 30 s; and then 72 °C for 5 min. PCR amplicons (~530 bp) were visualized by agarose gel electrophoresis. Along with test samples, three negative controls (sterile water (400 mL), cotton bud tip (biofilm blank) and a filter membrane) were processed using the DNA extraction kit as per test samples and were subjected to the same PCR as test samples. Sequencing of 16S rRNA genes was performed on a Miseq instrument (Illumina, Scoresby, Australia). After initial amplification of the 16S rRNA genes, the samples were purified using AMPure XP beads (Beckman Coulter Genomics, MN, USA) to remove primers and primer dimers. Nextera XT adapters (Illumina, CA, USA) were then attached via a second PCR; 5 µL of each sample was combined with 5 µL of each index primer, 25 µL of 2× KAPA HiFi HotStart ReadyMix (KAPA Biosystems, Wilmington, MA, USA) and 10 µL of water. The program settings were the same as those of the original PCR, except there were only 8 cycles. After a second purifying PCR clean-up step, identical to the first, each amplicon in the library was quantified using a Qubits 2.0 Fluorometer (Life Technologies, Carlsbad, CA, USA). Individual samples were then diluted to a minimum of 4 nM and were then pooled. The pooled library was then denatured and sequenced on a MiSeq instrument.

2.3. Statistical Analysis

DNA sequences from all three sampling times were processed concurrently through the Genome-Wide Haplotyping (GHap) [49] bioinformatics pipeline to remove poor-quality reads, including short reads and chimeras. Within this pipeline, the sequences were then clustered into operational taxonomic units (OTUs) with a similarity cut-off of 97%. Sequences were then aligned to 16S rRNA gene sequences using the Ribosomal Database Project (RDP) [50] database and an OTU table was created. The estimated number of OTUs was calculated using the Chao1 metric [51], and the alpha-diversity was determined using the Shannon–Weiner diversity index [52] and Pielou’s evenness [53]. Nonmetric multidimensional scaling and ANOSIM analyses were conducted using the Plymouth Routines in Multivariate Ecological Research (PRIMER) version 7.0.12 [54] program.

3. Results

3.1. Chemical and Microbiological Characteristics of Fountain Drinking Water

The mean viable count from 2-day incubation was 34 ± 7 CFU mL−1 (range: 0–162 CFU mL−1), while at 3-day incubation the mean count was 56 ± 10 CFU mL−1 (range: 0–280 CFU mL−1) (Table 1). Results from the determination of the concentration of coliforms showed 10.4% of replicates with greater than 300 cells 100 mL−1 (mean: 92.5 ± 54.7 cells 100 mL−1). Follow-up testing of new water samples from the associated water fountains failed to detect the presence of coliforms. Additionally, there were no subsequent positive results for the presence of Escherichia coli. In contrast to viable counts, total cell counts were significantly greater. Across the 12 drinking water fountains, the mean total count was 6.1 × 10⁴ cells mL−1 (range: 4.2 × 10³ to 4.3 × 10⁵ cells mL−1). Comparisons with plate counts show total counts were, on average, 3.0 (2 days at 37 °C) and 2.7 (3 days at 22 °C) orders of magnitude greater depending on incubation conditions. Measurements of the four water quality parameters and concentrations of eight ions and hardness are summarized in Table 1. Water turbidity was also determined; however, nearly 100% of measurements were below the level of detection (0.01 NTU) (data not shown). Results from all physicochemical measurements were below maximum guideline values.

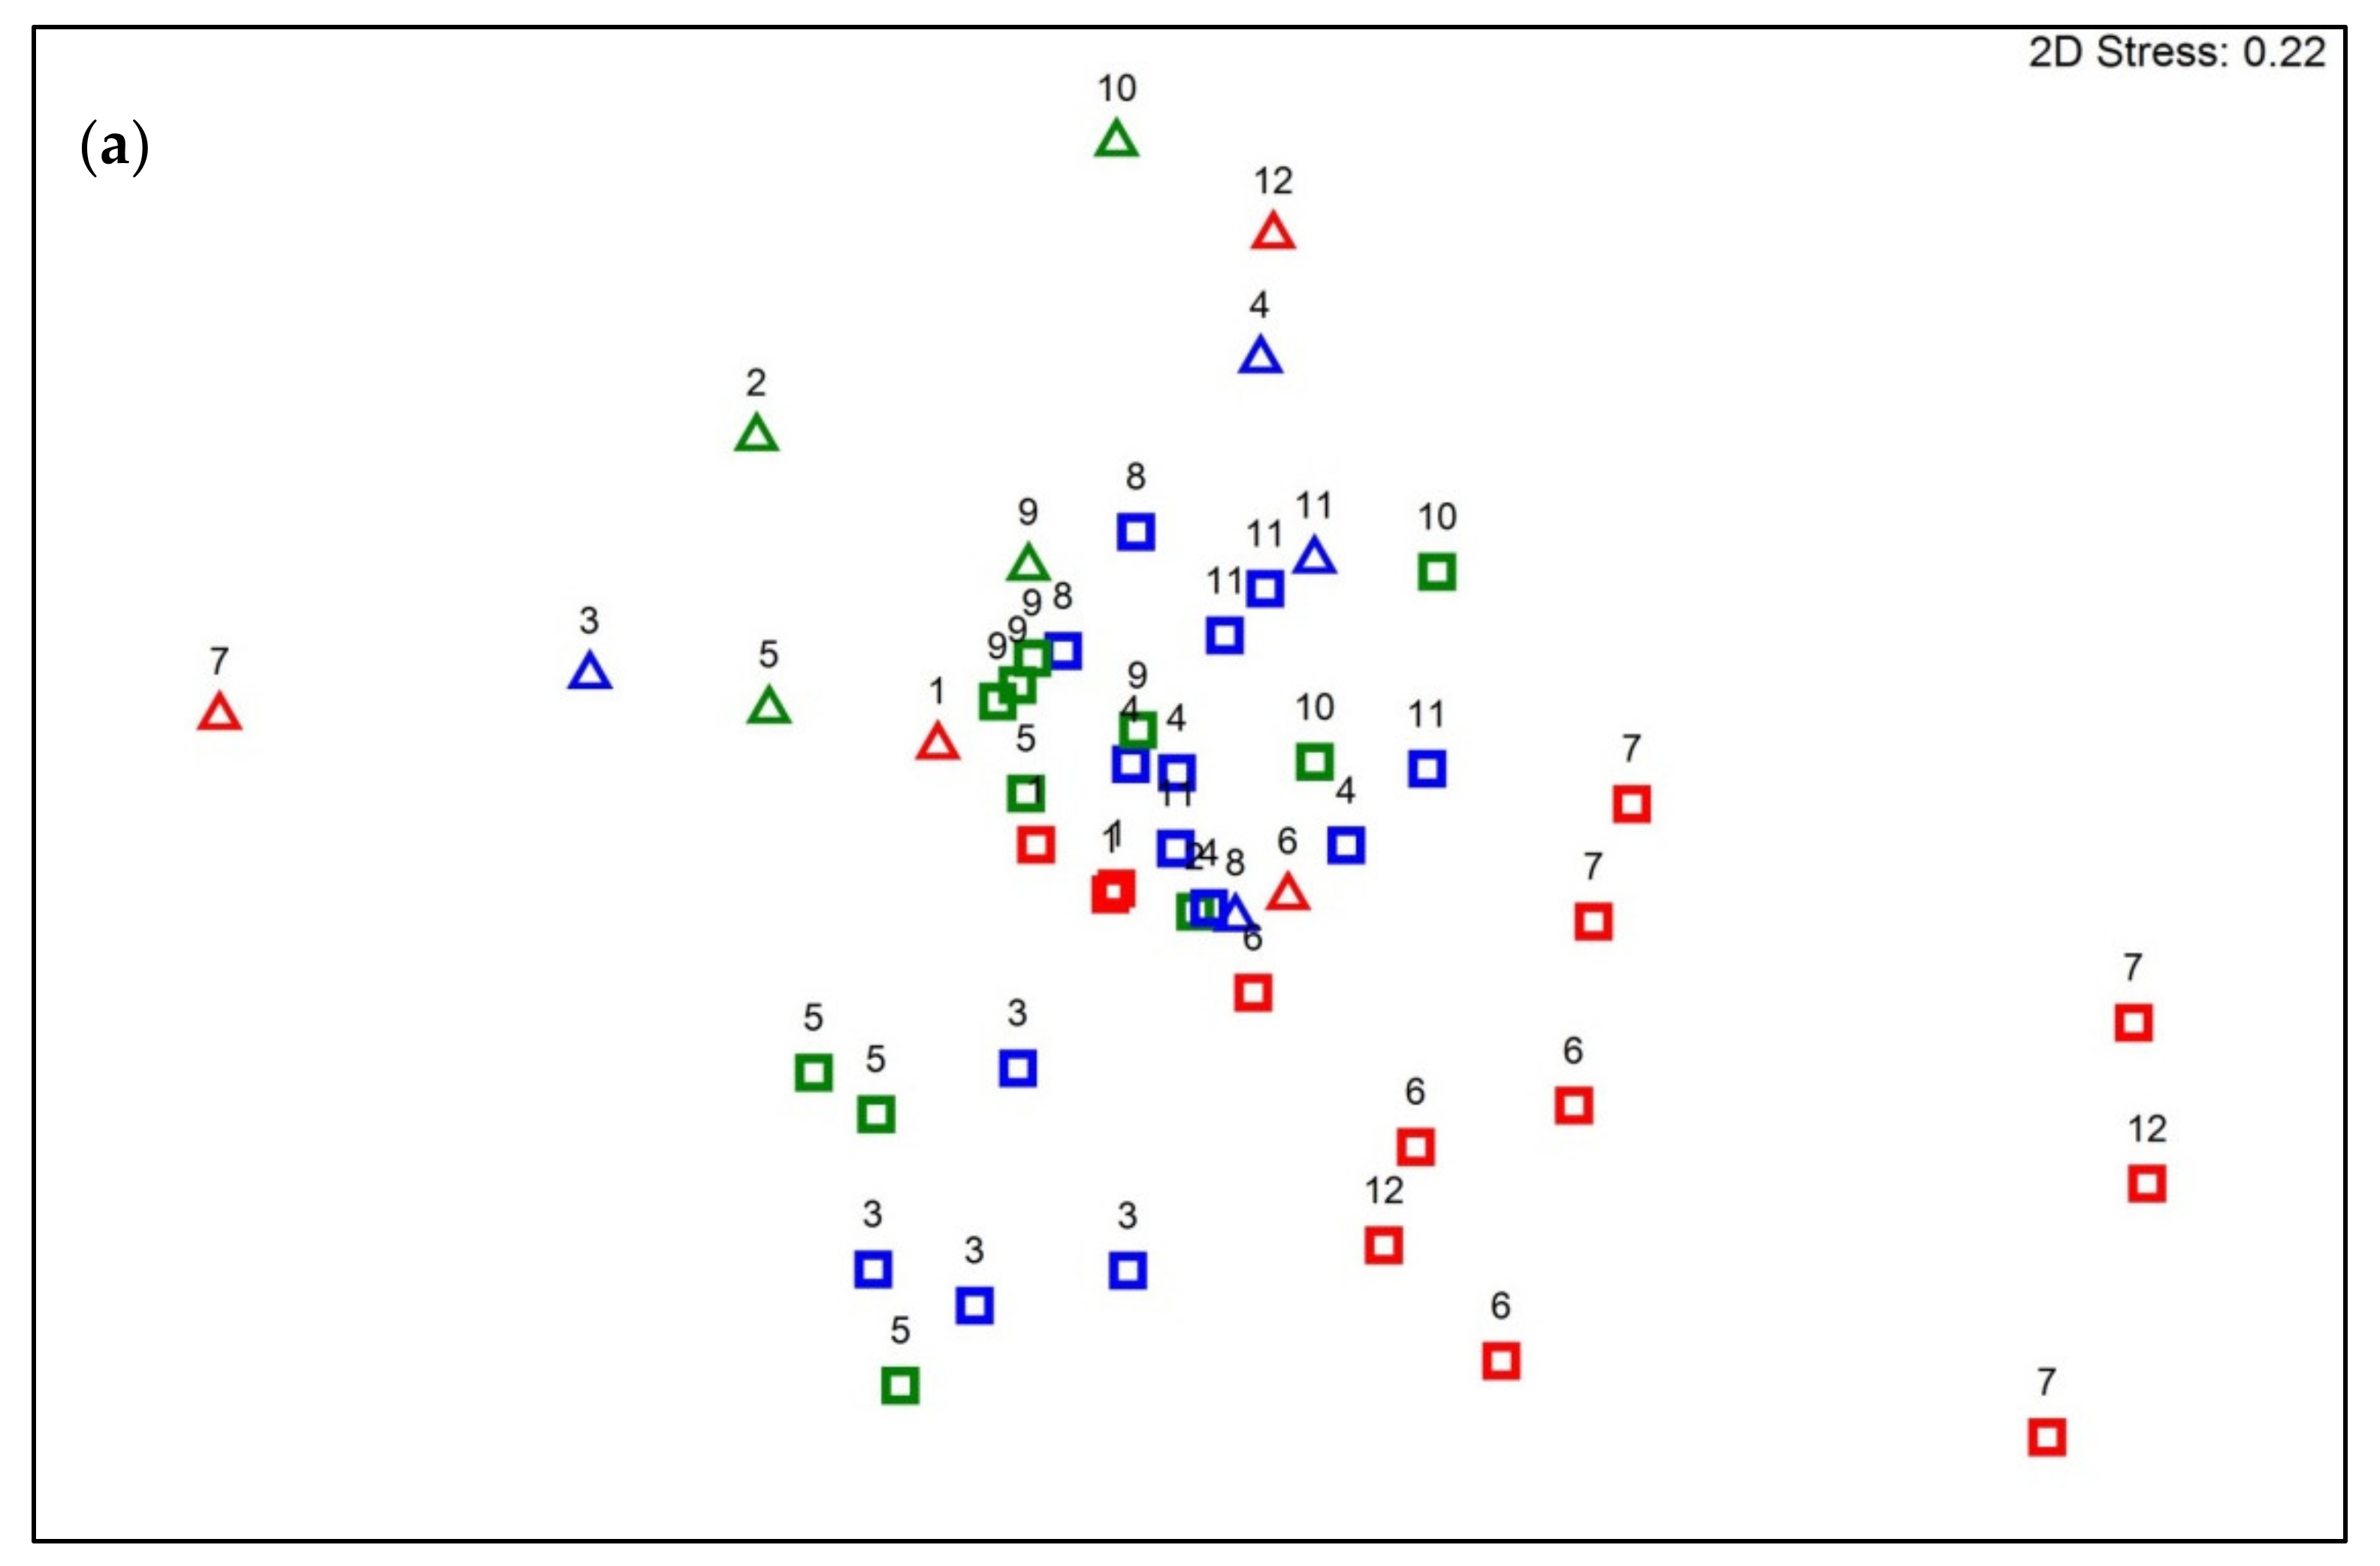
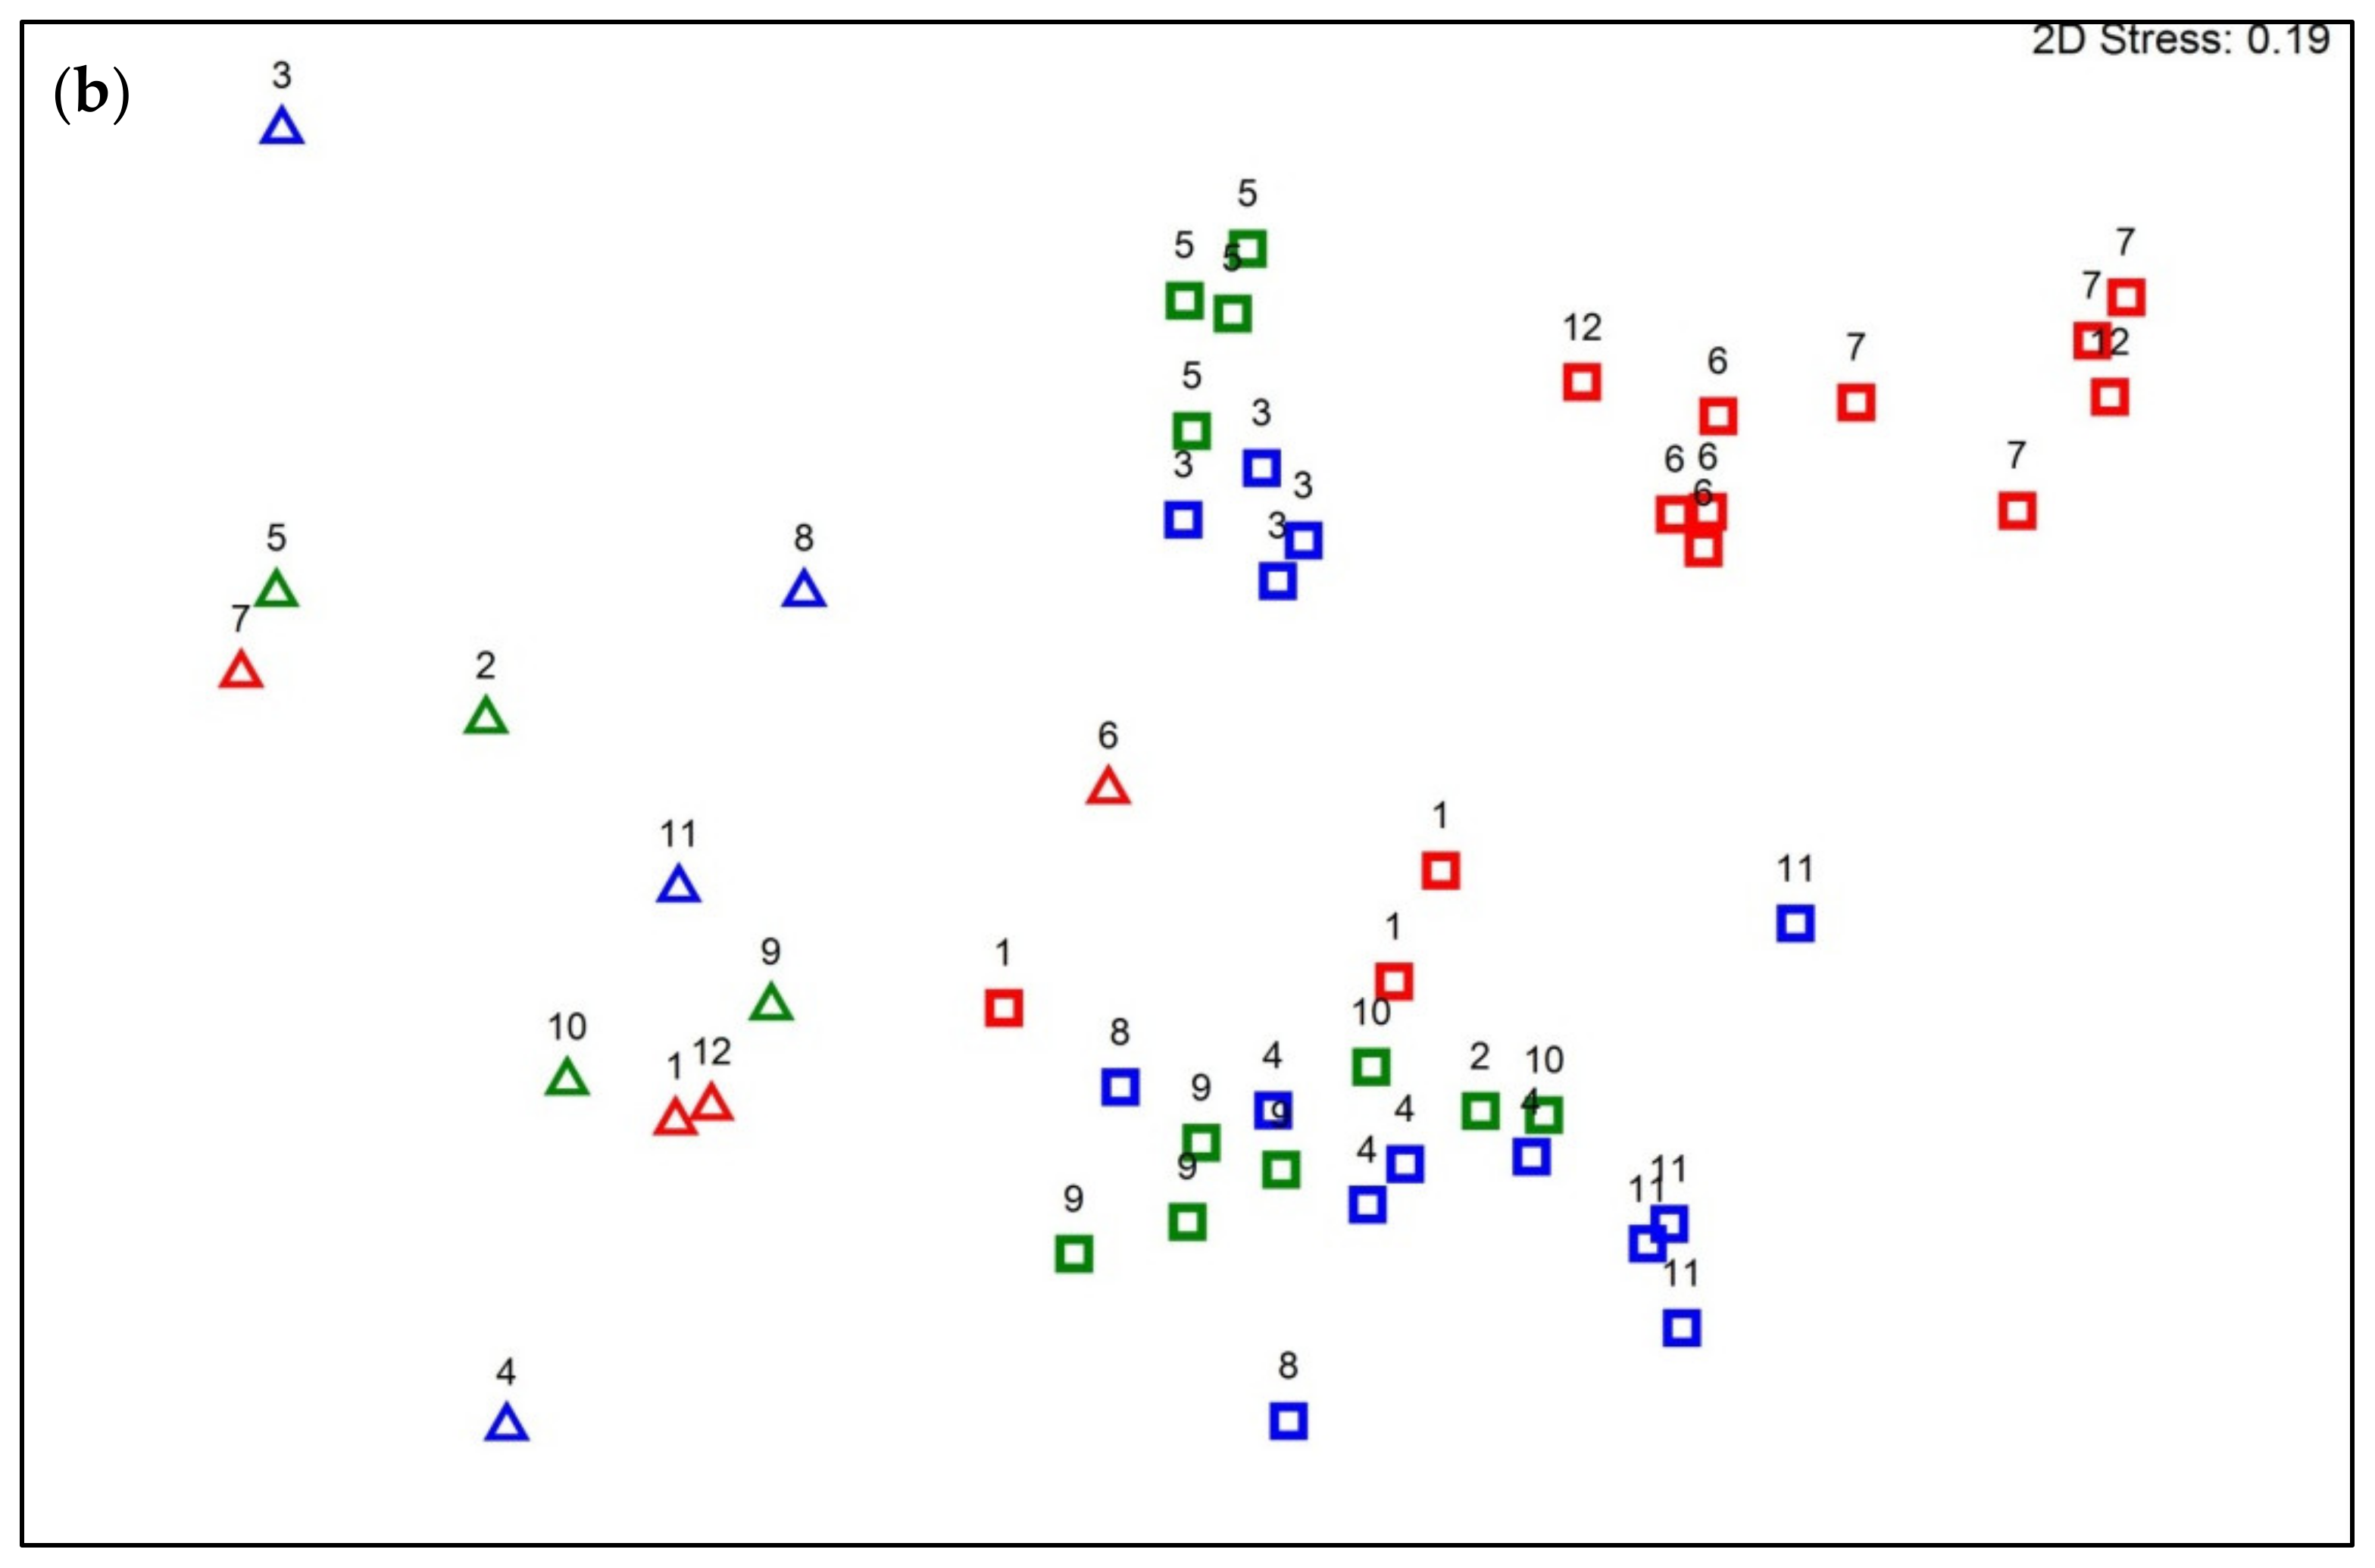
3.2. Diversity and Structure of Fountain Communities in Water and Biofilm

DNA sequencing of PCR-amplified 16S rRNA genes produced a total of 3.21 million quality reads which were assigned to water (n = 38), biofilm (n = 12) and negative controls (n = 3). For water and biofilm replicates, the mean numbers of reads were 61,303 ± 7989 and 70,865 ± 10,047, respectively. After chloroplast sequence reads and singletons were removed, a total of 3463 operational taxonomic units (OTUs) defined at 97% identity were recorded across all samples. In water samples, a total of 3286 OTUs were identified, compared with 577 OTUs identified in biofilm. Of these OTUs, 12.2% (n = 423) were detected in both water and biofilm samples, whilst 82.7% of OTUs (n = 2863) were only found in water and 4.0% of OTUs (n = 136) were found only in biofilm. Estimates of diversity, namely observed OTUs, Chao1 estimates and Shannon–Weiner indices (Table 2), showed there were substantial differences between types of sample (water vs. biofilm), between fountain types and between individual fountains. The observed number of OTUs varied greatly between individual fountains, with the mean number of OTUs being higher in water (394 ± 64) than in biofilms (113 ± 16). In water samples, the number of OTUs ranged from 79 (fountain 2) to 1199 (fountain 12), while the range of observed OTUs within biofilm samples ranged from 45 (fountain 8) to 251 (fountain 7). Analysis of the mean number of OTUs across fountain types (in water) showed that the bacterial community was more diverse in fountain type C compared to type A (p < 0.001) and type B (p < 0.001). In biofilm communities, individual t-tests showed that there were no significant differences between the mean numbers of OTUs between fountain types (p > 0.05).
The Shannon diversity index (SDI) of the bacterial communities varied greatly, ranging from 1.08 (fountain 2) to 4.51 (fountain 12) with a mean of 2.86 ± 0.16 in water samples and from 0.29 (fountain 4) to 2.83 (fountain 7) (mean = 1.50 ± 0.23) for biofilm. For fountain type, the mean SDI (in water samples) was 2.23 (type A), 2.64 (type B) and 3.62 (type C). Individual t-tests showed that the mean SDI was significantly higher for type C fountains (in water) than for both type A (p < 0.001) and type B (p = 0.01) fountains while there were no significant differences in mean SDI between fountains A and B (p = 0.23). In biofilm, the mean SDI values (fountain type) were 1.46 (type A), 1.07 (type B) and 1.97 (type C), with t-tests showing no significant differences (p > 0.05) in SDI between fountain types.
In water and biofilm samples, 1% of the OTUs detected accounted for 73.9% and 79.6% of total reads, respectively. In water samples, there was a high proportion of OTUs that were detected in less than 50% of fountain samples, and their OTUs had a mean relative abundance of between 10−2 and 10−5 (1526 OTUs, 46.4%) (Figure S2a). In biofilms, there were 210 OTUs (36.4%) which were detected within less than 50% of fountain samples and that had relative abundances of <0.01 (Figure S2b).
ANOSIM tests showed that the structures of the bacterial communities in drinking water and biofilm varied significantly from each other (R = 0.58, p = 0.001). Water (squares) and biofilm (triangles) samples were largely separated, except for the biofilm sample from fountain 6 (Figure 2). Negative controls were also separate from the water and biofilm samples, except for one water replicate from fountain 8 (not shown). Overall, significant differences were seen between communities in different fountains (ANOSIM; R = 0.94, p = 0.001). When fountain type and sample type were considered, communities in water samples from fountain type C (fountains 6, 7 and 12) clustered together and away from the other water samples. ANOSIM indicated there was a significant difference between communities with respect to fountain type, R = 0.53 (p = 0.001). All fountain type comparisons between water and biofilm showed test ANOSIM R ≥ 0.65 and p-values < 0.01 indicating significant differences in these communities. ANOSIM also showed that the bacterial communities (in water) at fountain type C were significantly different from those in both fountain types A (R = 0.57, p = 0.001) or B (R = 0.48, p = 0.001). In contrast, in biofilm, there were no significant differences between fountain type pairs (R < 0.00, p > 0.54).

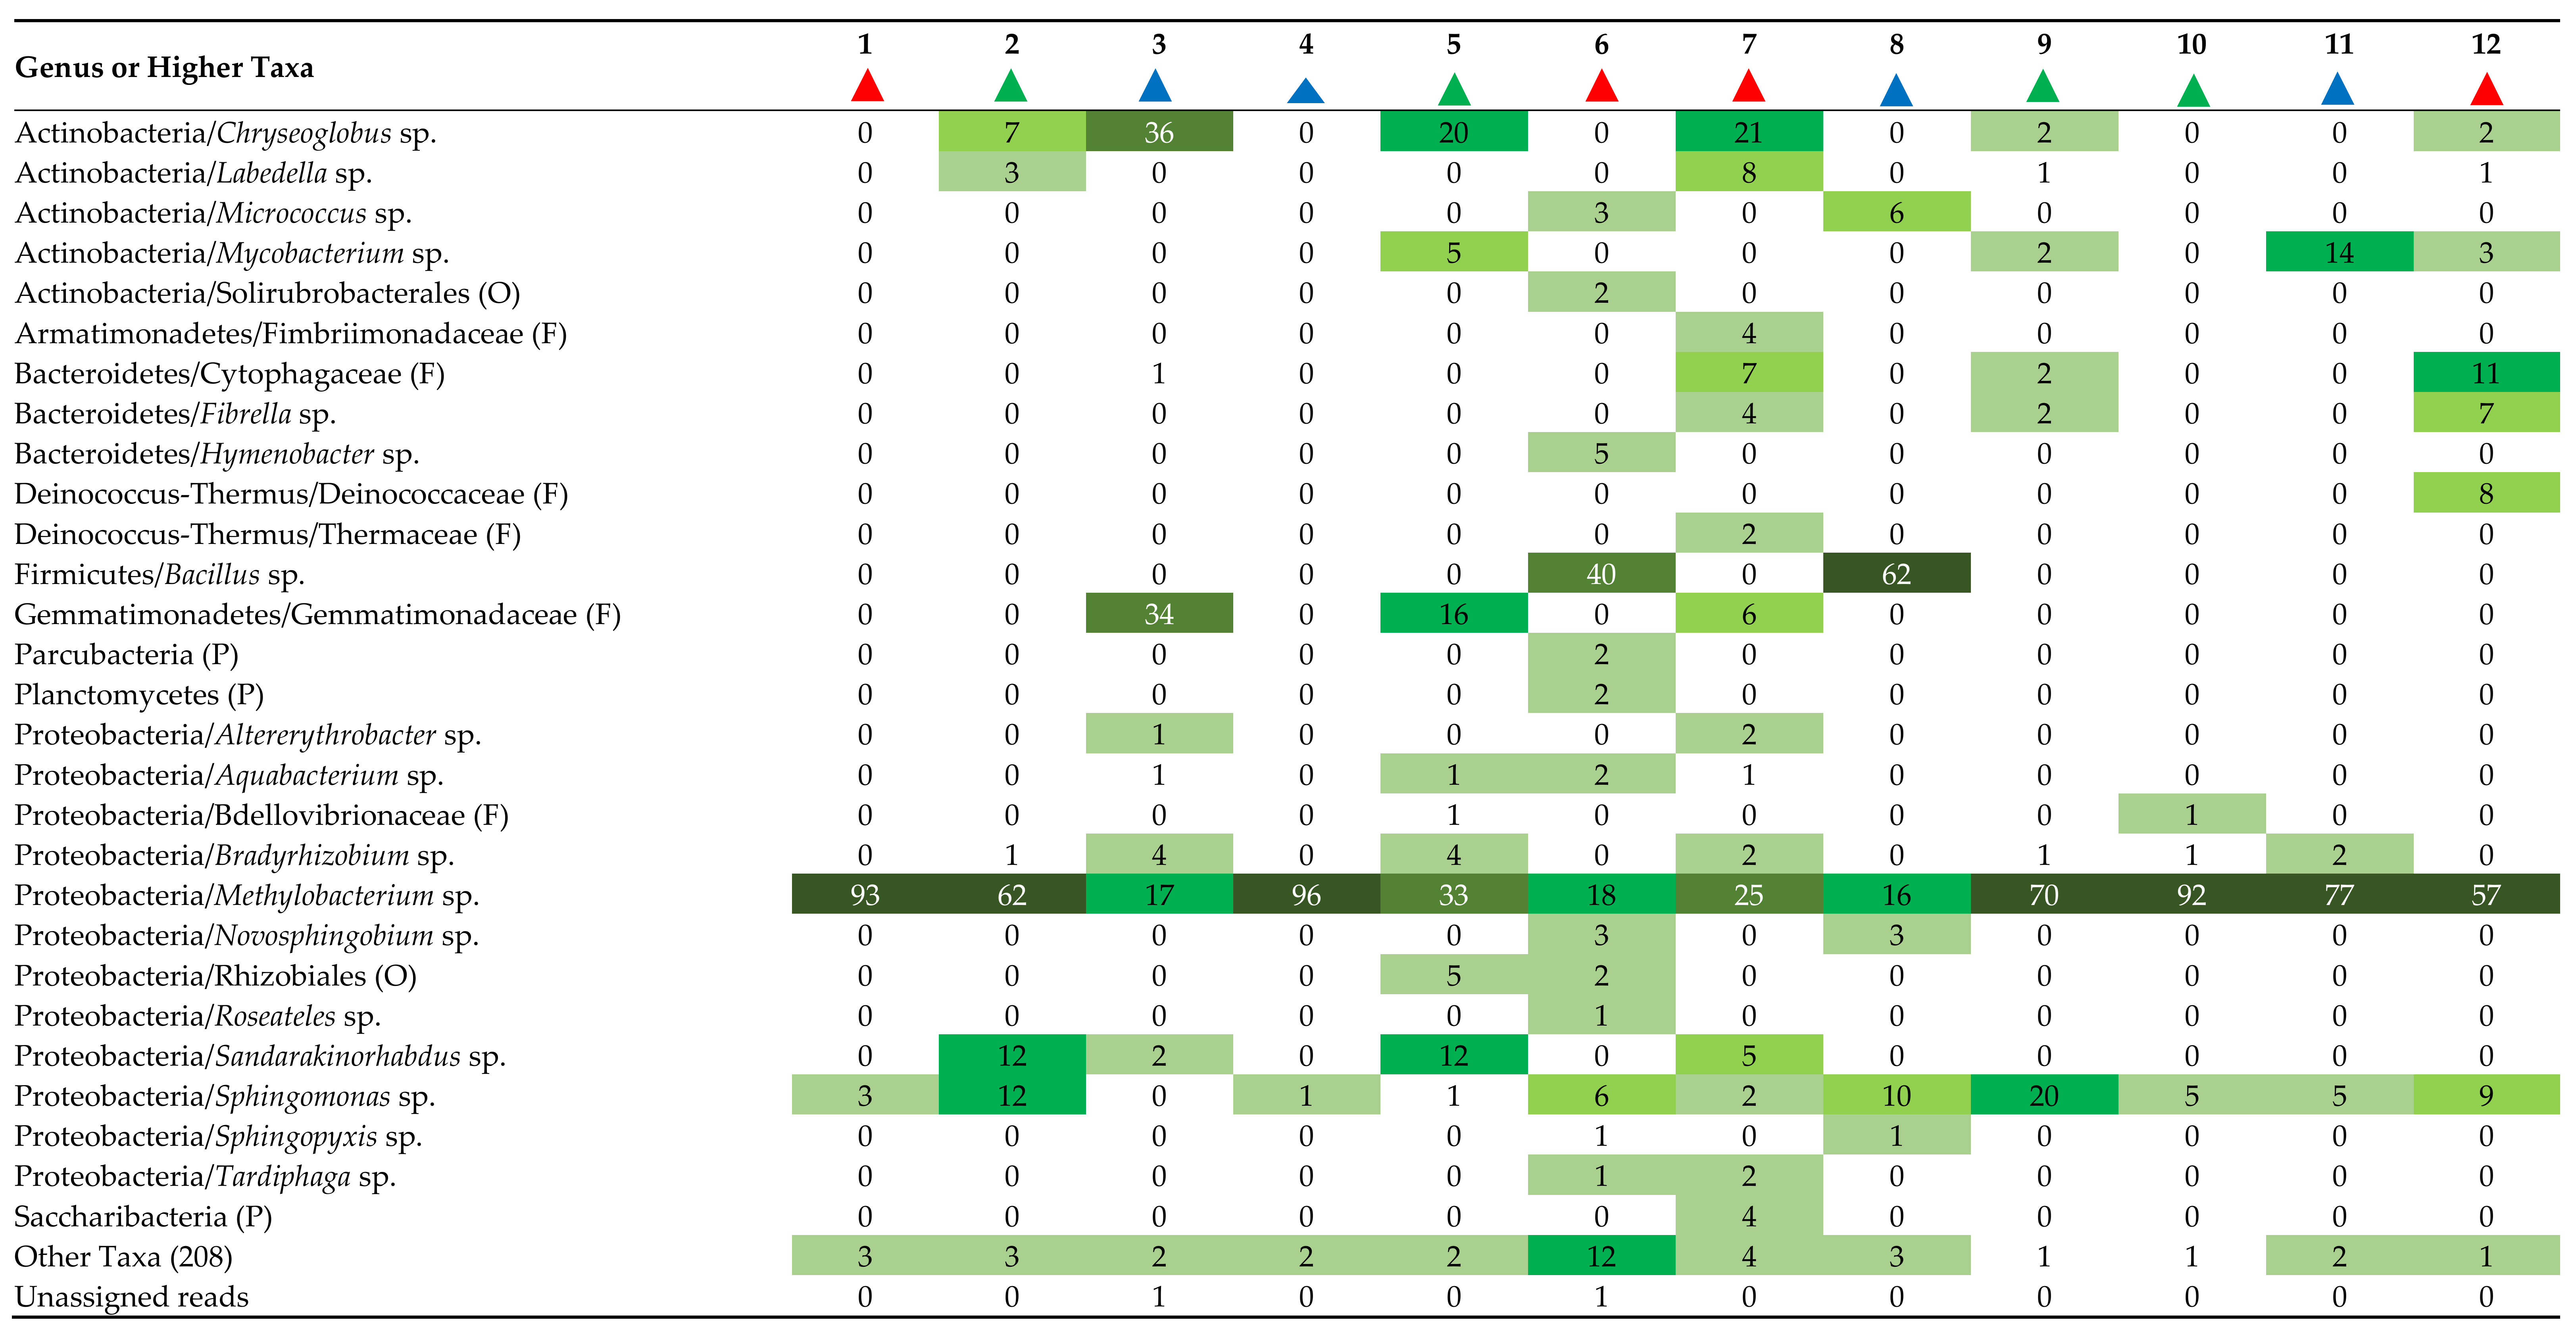
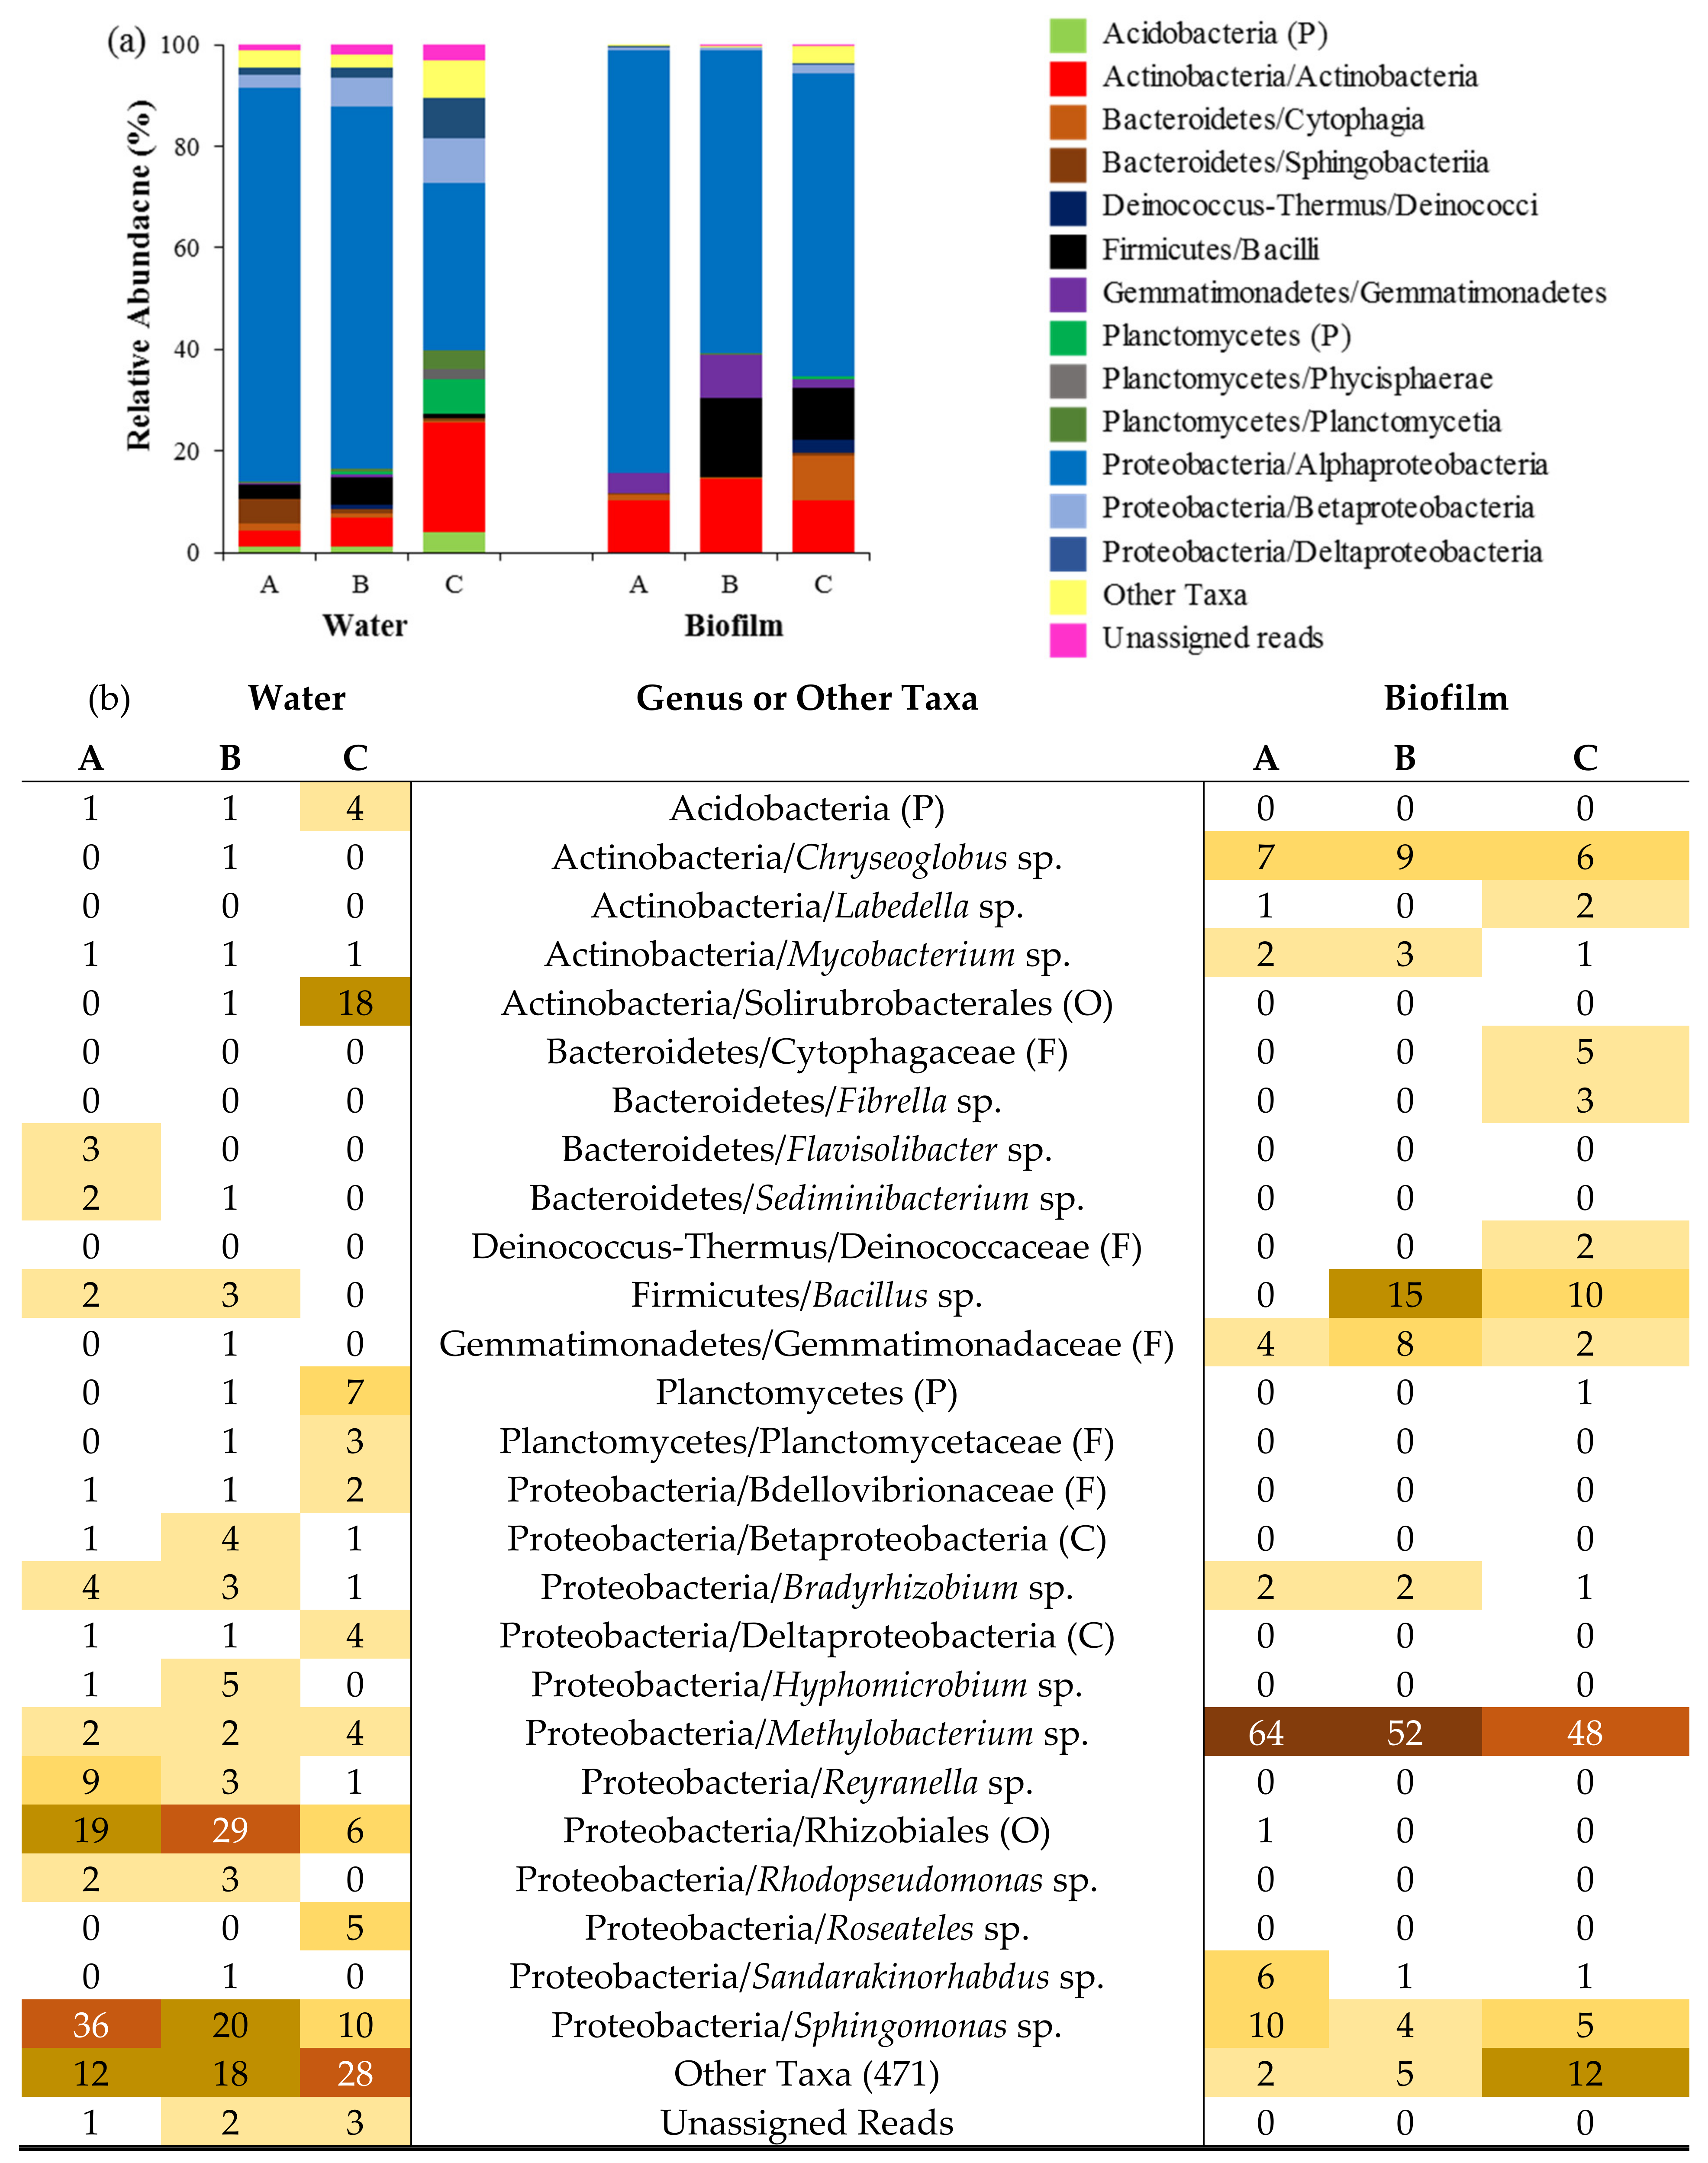
3.3. Composition of Fountain Drinking Water and Biofilm Communities

Nearly 100% of all OTUs could be identified at the phylum level, with the assignment of OTUs to lower taxonomic levels of 93.7% (class), 89.6% (order), 70.5% (family) and 63.0% (genus). Overall, the bacterial communities in both water and biofilm were dominated by only seven phyla comprising 96.6% and 98.1% of OTUs, respectively. The most dominant phylum was Proteobacteria, which accounted for 71.3% of reads in water and 68.9% in biofilm. The next most abundant phyla were Actinobacteria (10.4% water; 11.7% biofilm), Firmicutes (3.1% water; 8.8% biofilm), Planctomycetes (4.7% water; 0.3% biofilm), Bacteroidetes (3.4% water; 3.7% biofilm), Acidobacteria (2.3% water; 0.1% biofilm) and Gemmatinonadetes (0.4% water; 4.7% biofilm).
At the class level (Figure 3a), Alphaproteobacteria had the highest mean relative abundance (64.5%) across all fountains and sample types, ranging from 14.4% to 98.2%, while the next most dominant class was Actinobacteria (class) with a mean relative abundance of 7.8% and a range from 0.0% to 36.9%. The third most abundant class was Bacilli with a total mean relative abundance of 5.8% and relative abundances of 2.9% and 8.8% for water and biofilm, respectively. In water samples, the mean relative abundance of Thermoleophilia was 6.6%, compared to 0.2% in biofilm, with high relative abundances at fountains 6 (28.6%), 7 (22.9%) and 12 (15.5%). In addition, the mean relative abundance of Betaproteobacteria in water samples was 6.2% compared to 0.9% for biofilm samples. The relative abundance of this class was higher in water samples from fountains 3 (18.4%), 7 (19.3%) and 12 (9.2%). Water samples at certain fountains also contained relatively high proportions of OTUs belonging to classes within the Planctomycetes phylum. For example, in fountains 6, 7 and 12, the relative abundance of Planctomycetia (class) was 4.3%, 2.9% and 8.2%, respectively, while in biofilm the relative abundance of Planctomycetia was less than 0.5%. There were also isolated occurrences of high relative abundances for other classes (in water) such as Chitinophagia (13.4%, fountain 5), Deinococci (5.2%, fountain 8) and Nitrospira (2.2%, fountain 3). In contrast to water, there were instances of high relative abundance of other certain classes of bacteria within biofilm at individual fountains. For example, Gemmatimonadetes (class) had a mean relative abundance of 4.7% in biofilm and was detected only in fountains 3 (33.8%), 5 (16.4%) and 7 (6.3%). Another class that was detected at high relative abundance at certain fountains (in biofilm) was Cytophagia; at fountains 6, 7, 9 and 12, the relative abundances of this class were 5.1%, 11.8%, 3.9% and 18.3%, respectively. Additionally, Actinobacteria (class) were present in biofilms at high mean relative abundances in fountains 3 (36.8%), 5 (25.8%) and 7 (29.2%). Finally, OTUs assigned to Rhizobiales (order) bacteria were dominant in both water and biofilm where the mean relative abundances were 30.0% (range 9.5–71.5%) and 57.2% (range 16.3–96.5%), respectively.
Overall, 63.0% of OTUs were identified at the genus level defined as identity ≥ 95% [55] to sequences in the RDP database. For water, across all fountains, 63.7% of OTUs were identified at the genus level with considerable variation between sites, ranging from 16.7% to 95.2%, while the identification of OTUs at genus level in biofilm samples was higher (mean = 89.8%), ranging from 63.7% to 99.7%. Across all fountains and sample types, 342 distinct genera were identified; 97.7% of these genera were identified within water samples and 47.4% in biofilm. The proportion of shared genera between water and biofilm was 45% (n = 154), while 52.6% (n =180) of genera were present only within water samples, and 2.3% (n = 8) of genera were detected only in biofilm samples.
The genera with the highest overall mean relative abundance across all fountains and sample types included Methylobacterium (28.7%), Sphingomonas (15.2%), Bacillus (5.1%), Chryseoglobus (3.9%), Reyranella (1.8%) and Bradyrhizobium (1.8%). In water, Sphingomonas sp. had the highest mean relative abundance (24.2%), while Methylobacterium sp. had the highest mean relative abundance in biofilm samples (54.7%). In both water and biofilm, a small number of genera accounted for a high percentage of total reads. In water samples, only 9 out of 334 OTUs (2.7%) identified to genus level had a mean relative abundance of ≥1%, but they comprised 41.0% of total reads and 78.8% of genera reads (Figure 3b). Similarly, in biofilm samples, only 9 out of 162 OTUs (5.6%) defined at the genus level had a mean relative abundance of ≥1%, but they constituted 84.8% of total reads and 94.4% of reads identified to genus level.
At the genus level, substantial differences were seen between the composition of the bacterial communities at individual fountains and with respect to sample type. Certain genera (and higher taxa) were most abundant within certain fountains and sample types. For example, Sphingomonas spp. were present in high proportions (≥5%) in all water samples (Figure 4) except at sites 7, 11 and 12, whereas in biofilm (Figure 5), the relative abundance of Sphingomonas was ≤5% at 7 out 12 fountain sites, with the highest values occurring at fountains 2 (12%), 8 (10%) and 9 (20%). Other taxa that were detected at high relative abundances in water samples at particular fountains included Planctomycetes (20.5%, fountain 7; 17.7%, fountain 12), Solirubrobacterales (28.6%, fountain 6; 22.9%, fountain 7; 15.5%, fountain 12), Reyranella sp. (8.7%, fountain 3; 25.5%, fountain 5) and Roseateles sp. (14.0%, fountain 7; 4.9%, fountain 12).
In biofilms, Methylobacterium (genus) were most abundant in the bacterial communities, with a mean relative abundance of 54.7 ± 9.1% and a range from 17% to 96%, followed by Sphingomonas sp. (mean: 6.3 ± 1.7%, range: 0.3–20.5%). Certain other taxa were present at high relative abundances in biofilms at specific sites, including Gemmatimonadaceae (family) at fountains 3 (33.8%), 5 (16.4%) and 7 (6.3%); Deinococcaceae (family) at fountain 12 (8.4%); and Chryseoglobus spp. at fountains 2 (7.4%), 3 (36.3%), 5 (20.3%) and 7 (20.8%). In addition, Mycobacterium sp. (13.7%, fountain 11), Bacillus sp. (40.0%, fountain 6; 61.7%, fountain 8) and Sandarakinorhabdus sp. (11.6%, fountain 2; 11.8%, fountain 5) showed incidences of high relative abundance.

3.4. Variation in Bacterial Community Composition between Different Fountain Types

When the distribution of OTUs was considered across fountain types, a small number of taxa were detected at a high proportion from fountains of each type and had a high mean relative abundance (Figure S3). Fountain type C had a greater proportion of OTUs with a frequency of ≥50% for water samples than type A or B (Figure S3). In biofilm, the proportion of OTUs with a frequency of ≥50% was higher in type A fountains when compared to type B or C.
Analysis of the bacterial community at the class level showed that Alphaproteobacteria had the highest mean relative abundance (64.5%) across fountain types for both water and biofilm. In water samples, the relative abundance of Alphaproteobacteria was substantially lower in type C fountains (34.0%) compared to types A (82.0%) and B (68.4%). Relative abundance data also showed other substantial differences between fountain type C and types A and B. In type C fountains, there was a total relative abundance of 12.2% associated with classes belonging to the Planctomycetes phylum, while in types A and B the relative abundances were less than 1%. Type C fountains showed a much higher relative abundance of the class Thermoleophilia (16.7%) compared to types A (0.1%) and B (0.8%), also showing a much higher relative abundance of Deltaproteobacteria (8.0%) compared to types A (2.3%) and B (1.7%). In biofilm, the overall differences between fountain types showed a higher relative abundance of Bacilli (class) in types B (15.8%) and C (10.4%), whilst this class was absent in type A, and a higher relative abundance of Cytophagia in type C (8.8%) and lower relative abundances in types A (1.2%) and B (0.2%). Finally, in both water and biofilms, the relative abundance of OTUs assigned to Rhizobiales (order) was significantly high but variable. The mean relative abundance (in water) was 30.1%, 42.4% and 16.5% for fountain types A, B and C, respectively. In biofilms, the proportions of Rhizobiales were higher across fountain types A (67.5%), B (53.6%) and C (50.5%).
At the genus or higher level (Figure 6), there were some examples of differences in dominance across fountain types. In water, Solirubrobacterales (order) were present in type C fountains at a relative abundance of 18.2% while relative abundance was less than 1% in types A and B. The relative abundance of the genus Reyranella in type A fountains was 9.4% compared to 2.7% and 1.4% in types B and C, and the relative abundance of the genus Roseateles was 5.1% in type C fountains and less than 0.5% in types A and B. In addition, the mean relative abundance of Sphingomonas sp. in type C (9.8%) fountains was less than half that of types A (36.1%) and B (19.6%). In biofilm, the relative abundance of Sphingomonas sp. was almost double in type A (9.6%) fountains compared to relative abundance in types B (4.1%) and C (5.1%), and Sandarakinorhabdus sp. was more abundant in type A fountains (6%) than in type B and C fountains (1%). Finally, it was evident that Chryseoglobus sp. had a constant presence within biofilms regardless of fountain type: A (7.3%), B (9.1%) and C (5.7%).

4. Discussion

4.1. Diversity and Structure of Fountain Communities in Water and Biofilm

Key outcomes described in the results demonstrated significant variation in bacterial communities between bulk water and biofilm samples taken from the same drinking water fountain. Diversity matrices including Chao1 and Shannon diversity index indicated that communities within water samples were more diverse than those in biofilms. Furthermore, there was significant variation in the composition of bacterial communities between sample types, with Sphingomonas sp. being most dominant in bulk water and Methylobacterium sp. having the highest mean relative abundance in biofilms. The results also showed that the composition of bacterial communities varied greatly between individual fountains, which suggests that site-specific communities are unique. Additionally, at fountains 1, 8, 11 and 12, MDS plots showed differences between the composition of biological replicates from the same fountain. A possible reason for such variation could be that in the earlier replicates, shear forces washed out biofilm-residing bacteria from internal fountain infrastructure. This may have led to subsequent replicates being devoid of biofilm bacteria and thus containing a greater proportion of waterborne bacteria.
Regarding fountain type, both diversity matrices and the composition of the bacterial community were found to be consistently different in type C fountains compared to both type A and type B fountains. In water samples, both the number of OTUs detected and the Shannon diversity index (SDI) in this study were higher than those in tap water samples taken from a chlorinated DWDS in China [56], while in a study on tap water from an office building in Finland, the number of OTUs was lower than that in Melbourne fountains and the range of SDI was similar. The same study in Finland also analyzed the communities within biofilm extracted from pipes of different materials and showed that the mean and range of the Chao1-estimated number of OTUs were similar (210–240) to those of the current study and the SDI was higher (2.3–3.7) than that of the current study [57]. Conversely, other research on biofilm from chlorinated water from the Ohio River, Ohio (USA), showed the mean and range of OTUs and mean SDI were similar to and higher than those reported in the current study, respectively [58].

4.2. Composition of Fountain Drinking Water and Biofilm Communities

Prior research has shown that the structure of bacterial communities associated with drinking water is influenced by such factors as disinfection regime, source water, sampling location and sample type [59]. The current research demonstrated that bacterial communities differ greatly between water and biofilm sampled from drinking water fountains. Taxa such as Sphingomonas sp., Rhizobiales (order), Solirubrobacterales (order) and Reyranella sp. dominated water samples, while Methylobacterium sp., Bacillus sp, Chryseoglobus sp. and Gemmatimonadaceae (family) were more influential in biofilms. Comparisons to similar water/biofilm studies based on 16S rRNA gene sequencing show that within each environment the make-up of the bacterial community is unique. For example, in research conducted on biofilm collected from drinking water distribution pipes in Florida (USA), it was found that up to 95.5% of bacteria detected belonged to Methylomonas species [26], whereas in the current study this genus was not detected at all.
In this research, the order Rhizobiales exhibited relative abundances greater than 10% in 9 out of 12 sites in bulk water and in all biofilm samples. It is possible that the unidentified genera within these samples may be closely related to undocumented Bradyrhizobium, Hyphomicrobium or Methylobacterium species which are members of the Rhizobiales order and are present at significantly high relative abundances in water and biofilm. This suggests that the dominance by certain related types of bacteria may be greater than first thought. Rhizobiales were also found in high relative abundances (26.6%) along with Sphingomonas sp. (9.2%), Gemmataceae (family) (4.8%) and Nitrosomonas sp. (15.0%) in research conducted on chlorinated water sampled from a DWDS in South Africa [3]). In the majority of the 12 fountains in Melbourne, Sphingomonas sp. were dominant, which concurs with similar research on chlorinated drinking water systems [3,57,60], while in other studies on chlorinated water, the relative abundance of Sphingomonas was low or the genus was absent [21,61,62]. Research on biofilm showed that the detection of Sphingomonas species varied from high (46–96% [63], 30–72% [7], max 20% [64]) to low (0.12–0.63% [65], 0.04–4.43% [66]) or completely absent [26,58,67]. One of the main reasons for the common presence of Sphingomonas spp. in biofilm is that members of this genus are known to proliferate at a range of temperatures. In research conducted on biofilm samples from water meters and taps (in Sweden), 38 Sphingomonas isolates were identified. Thirty-three of these isolates grew on trypticase soy broth agar (TSBA) at 5 °C, while 33 isolates grew at 37 °C on the same media [68]. In other research, it was determined that the potentially pathogenic species Sphingomonas paucimobilis showed a strong biofilm-producing capability due to its ability to thrive in chlorinated systems and its potential for inhibiting the growth of competitor biofilm [69]. In the drinking water fountain biofilm, the most abundant genus detected was Methylobacterium, which was also dominant in research conducted on biofilm samples taken from business premises in Finland [57]. However, in results from other studies, the relative abundance of Methylobacterium was much lower (<5%) [67] or absent [65,70]. Research by Tsagkari et al. (2017) sought to understand why Methylobacterium spp. were often dominant in drinking-water-associated communities. Results indicated that Methylobacterium spp strongly promoted biofilm growth when inoculated into mixed microbial communities. Bacterial aggregation was enhanced in stagnant conditions upon an inoculation of only 1%. Additionally, by utilizing a rotating annular reactor, it was shown that there was a high aggregation of bacteria promoted by turbulent flow compared to laminar flow. The results of this research showed that Methylobacterium spp. are important components in the formation and maintenance of drinking water biofilms [71].
Chryseoglobus sp. were detected in biofilms at fountains 3, 5 and 7 at greater than 20% relative abundance. Except at fountain 2 (biofilm), the relative abundance of this genus was <2% at other sites, while being less than 1.2% in water samples. Chryseoglobus belongs to the Microbacteriaceae family, first isolated from a water-cooling system in the Republic of Korea in 2010 [72]. Research concerning Chryseoglobus spp. is limited; however, it is interesting to note that other genera such as Labedella and Micrococcus belong to the same family and were also important contributors to the taxa within biofilms at some individual fountains in the current study. Gemmatimonadaceae (family) were also highly abundant in biofilms at the same three fountains, as was Chryseoglobus sp. Recent research has linked members of this family with biodegradation of organophosphate flame retardants [73], chitin degradation [74] and nitrogen removal from a wastewater treatment plant [75]. Further research or close scrutiny of existing datasets may explain the reasons for the co-occurrence of these two taxa.
In this study, Mycobacterium spp. were detected in relative abundances as high as 13.7% in biofilm (fountain 11). In prior research, this genus has often been reported in both water and biofilm samples in substantial proportions. In a study sampling DWDSs across Arkansas and Louisiana (USA), the relative abundance of Mycobacterium sp. was as high as 53% [76], while in another study, relative abundances were as high as 59% in samples from a DWDS in Florida [26]. Finally, this genus was the most abundant bacteria in all biofilm samples taken from pipes associated with a DWDS in Minnesota (USA) [77]. While leprosy and tuberculosis, caused by Mycobacterium leprae and Mycobacterium tuberculosis, respectively, are not transmitted through water sources, it has been known for decades that nontuberculous Mycobacterium (NTM) bacteria can act as opportunistic pathogens which may affect immunocompromised individuals [78,79]. For example, it was determined that Mycobacterium paragordonae was the likely cause of an infection of a patient with continuous kidney dialysis treatment [80]. Another species, Mycobacterium kansasii, has often been associated with pulmonary infections of patients who have risk factors such as silicosis, HIV and chronic obstructive pulmonary disease (COPD) [39]. Mycobacterium species have also been associated with the presence of free-living amoebae (FLA) [81,82] and resistance to disinfectants. FLA within drinking water systems mostly feed on bacteria by phagocytosis. Some studies have demonstrated that NTM are able to resist predation and in fact may use FLA for protection and replication. For instance, a study on Paris (France) tap water observed that 88% of FLA cultures contained high numbers of NTM [83]. Additionally, in a study on a WTP in Jiangsu Province (China), quantitative PCR was used to determine Mycobacterium spp. concentrations at different stages of the process. The authors concluded Mycobacterium cells were not effectively removed by chlorine disinfection at the treatment plant [84].
Along with Mycobacterium sp., there are other genera that have acquired chlorine resistance due to extended exposure to chlorinated drinking water. Both Sphingomonas [85] and Methylobacterium [86,87] are known to outcompete other bacteria due to their ability to grow in low-nutrient (oligotrophic) environments, and there is increasing evidence describing their chlorine resistance. Analysis of hospital tap water from Japan showed that several species within the Sphingomonadaceae family, including Sphingomonas sp., Novosphingobium sp. and Sphingopyxis sp., were resistant to exposure to typical DWDS levels of chlorine [79]. In another study by Furuhata et al. (2011), Methylobacterium aquaticum strains were tested for their resistance to chlorine; in treated tap water and in the natural environment, some of the strains showed moderate chlorine resistance, which the authors inferred was due to some natural resistance encoded within the genome of this species [88]. Regarding biofilms, research in South Korea found that Methylobacterium spp. isolates also showed chlorine resistance and that Sphingomonas sp. were prominent founders of biofilms due to their oligotrophic characteristics [89,90].

4.3. Variation in Bacterial Community Composition between Different Fountain Types

Across the three fountain types, there were significant differences in the structure of the bacterial community at the class level for both water and biofilm samples. As in most prior studies, Alphaproteobacteria were the most dominant class in both sample types. However, in type C fountains (water), the relative abundance of this class was much lower, while taxa such as Acidobacteria, Planctomycetes, Thermoleophilia and Deltaproteobacteria were more dominant than in types A and B. This study is unique in that it has investigated the bacterial community simultaneously associated with both water and biofilm at public drinking water fountains. Consequently, direct comparisons to similar research are problematic. However, a proxy is to compare the structure of the bacterial community between different points across a similar drinking water distribution system. In a DWDS in Southeast China, tap water was sampled from four points of increasing distance from the treatment plant. Analysis of the bacterial community showed that in finished water leaving the water treatment plant (WTP), the relative abundances of Proteobacteria and Bacteroidetes were 84.1% and 14.1%, respectively; as the water aged, the relative abundance of Proteobacteria increased to >95% while that of Bacteroidetes declined to close to zero. In addition, it was found that both the number of OTUs, Chao1 estimate, and the Shannon diversity index increased with distance from the treatment plant. At the genus level, it was found that the relative abundance of Sphingomonas species ranged from 2.7% to 8.5%, while the mean relative abundance was substantially higher in the current study [56]. These outcomes suggest that once the bulk water leaves the WTP it is subject to the conditions within distribution system which ultimately cause substantial changes to the structure of the bacterial community.
Two of the most prominent taxa to dominate water samples from fountain type C were Solirubrobacterales (order) and Planctomycetes (phylum). The mean relative abundance (%) of unclassified Solirubrobacterales bacteria was nearly 17% in type C fountains. Currently, there are only four genera assigned to this order [91], which suggests further investigation regarding sequencing and potential culturing is necessary to explain the extent to which this order has contributed to the type C fountain community. The proportion of Planctomycetes (phylum) bacteria at type C fountains (relative abundance (RA) > 12%) was also significantly higher than that at types A (RA < 0.2%) and B (RA < 2%). At the family level, Planctomycetaceae (RA ~ 2.5%) and Tepidisphaeraceae (RA ~ 2.0%) were the most dominant Planctomycetes bacteria in fountain type C water samples. Planctomycetes have been detected in freshwater, sediment, soil and marine environments [92]. Currently, there are 35 Planctomycetes species described, with most being within the Planctomycetaceae family, while there is only one species assigned to Tepidisphaeraceae [93]. In contrast to the current study, Planctomycetes were not detected in chlorination-associated water samples from China [27,56,94] or in a spatial–temporal study of DWDSs in Paris [95]. Furthermore, biofilm samples taken from a water treatment plant in Guangdong province (China) comprised up to 40% Planctomycetes, while Planctomycetes were absent in water samples [21]. Finally, in a study on a WTP in Wujiang District (China), the relative abundance (%) of Planctomycetes in drinking water was <2%, while being up to 27% in associated biofilms [84].
A possible reason for the higher diversity in the bacterial communities at type C fountains, when compared to types A and B, may be the substantially longer time these fountains have been in use. Over time, bacterial communities within biofilms may diversify due to a maturating of established biofilm present in nearby DWDS pipes and the fountain infrastructure itself. For example, Douterelo et al. (2014) found that species richness and diversity increased over 28 days as the amount of biofilm material increased in an in situ DWDS [96]. Given time, those slow-growing microorganisms may gain a footing in the stable environment provided within biofilms. Long water-stagnation periods have been linked to increased numbers of bacteria [97,98] and changes in community composition [96]. For example, a study conducted within university campus buildings in Champaign, Illinois (USA), found that increased water-stagnation time closely correlated with an increase in total cell counts and a decrease in residual chlorine concentration [99]. In other research on building plumbing, analysis of results indicated that bacterial communities within samples subjected to 8-day stagnation contained 6–13 more phyla compared to influent samples. The authors suggested that there was potential seeding of bulk water from the mature pipe biofilm. Additionally, it was also thought that due to stagnation, rare OTUs were able to grow above the minimum detection limit [18].

5. Conclusions

This research has demonstrated that there are significant differences in the composition of the bacterial communities which reside in water and biofilm from the same fountain. Furthermore, while there were some taxa that were dominant at all individual fountains (Sphingomonas sp. and Methylobacterium sp.), the overall bacterial communities differed greatly between sites in both composition and diversity. Regarding fountain type, the greatest differences between fountain types were between type C fountains and types A and B. Interestingly, type C fountains had significantly higher number of OTUs and Shannon diversity index, which suggests that their bacterial communities were much more diverse and complex than those in type A and B fountains. Bacterial communities are strongly influenced by the age of the fountain. More research needs to be instigated to determine if older, established communities are more diverse compared to new or young environments. Long-established environments may lead to a greater chance of certain bacteria gaining abilities such as increased disinfection resistance and biofilm establishment characteristics. Variation between the structures of the bacterial communities residing in water and biofilm and differences between fountain types show that it is essential to regularly test samples from individual locations to determine the presence of opportunistic pathogens and allow water authorities to take appropriate action, which may include cleaning, maintenance or replacement of older fountains.

Supplementary Materials

The following supporting information can be downloaded at: https://www.mdpi.com/article/10.3390/w14060908/s1, Figure S1: Frequency of detection and relative abundance of OTUs in drinking water (n = 38) and biofilms (n = 12) across fountain types; Table S1: Precise locations of drinking water fountains.

Author Contributions

Conceptualization, W.E.B., A.S.B., A.M.O.; formal analysis, W.E.B., A.S.B., A.M.O.; investigation, W.E.B., E.S., A.A.-M.; resources, A.S.B., A.M.O.; data curation, W.E.B., E.S., A.A.-M.; writing—original draft preparation, W.E.B., A.S.B., A.M.O.; writing—review and editing, W.E.B., A.S.B., A.M.O.; visualization, W.E.B.; supervision, A.S.B., A.M.O.; project administration, A.S.B., A.M.O.; funding acquisition, A.S.B. All authors have read and agreed to the published version of the manuscript.

Funding

Australian Research Training Program Scholarship.

Institutional Review Board Statement

Not applicable.

Informed Consent Statement

Not applicable.

Conflicts of Interest

The authors declare no conflict of interest.

References

  1. Husband, P.S.; Boxall, J.B. Asset deterioration and discolouration in water distribution systems. Water Res. 2011, 45, 113–124. [Google Scholar] [CrossRef] [PubMed]
  2. Pinto, A.J.; Schroeder, J.; Lunn, M.; Sloan, W.; Raskin, L. Spatial-Temporal Survey and Occupancy-Abundance Modeling to Predict Bacterial Community Dynamics in the Drinking Water. Microbiome 2014, 5, e01135-14. [Google Scholar] [CrossRef] [PubMed] [Green Version]
  3. Potgieter, S.; Pinto, A.; Sigudu, M.; du Preez, H.; Ncube, E.; Venter, S. Long-term spatial and temporal microbial community dynamics in a large-scale drinking water distribution system with multiple disinfectant regimes. Water Res. 2018, 139, 406–419. [Google Scholar] [CrossRef] [PubMed] [Green Version]
  4. Douterelo, I.; Sharpe, R.L.; Boxall, J.B. Influence of hydraulic regimes on bacterial community structure and composition in an experimental drinking water distribution system. Water Res. 2013, 47, 503–516. [Google Scholar] [CrossRef]
  5. Sekar, R.; Deines, P.; Machell, J.; Osborn, A.M.; Biggs, C.A.; Boxall, J.B. Bacterial water quality and network hydraulic characteristics: A field study of a small, looped water distribution system using culture-independent molecular methods. J. Appl. Microbiol. 2012, 112, 1220–1234. [Google Scholar] [CrossRef]
  6. Liu, R.; Zhu, J.; Yu, Z.; Joshi, D.; Zhang, H.; Lin, W.; Yang, M. Molecular analysis of long-term biofilm formation on PVC and cast iron surfaces in drinking water distribution system. J. Environ. Sci. 2014, 26, 865–874. [Google Scholar] [CrossRef]
  7. Ren, H.; Wang, W.; Liu, Y.; Liu, S.; Lou, L.; Cheng, D.; He, X.; Zhou, S.; Fu, L.; Liu, J.; et al. Pyrosequencing analysis of bacterial communities in biofilms from different pipe materials in a city drinking water distribution system of East China. Appl. Microbiol. Biotechnol. 2015, 99, 10713–10724. [Google Scholar] [CrossRef]
  8. Asghari, F.B.; Jaafari, J.; Yousefi, M.; Mohammadi, A.A.; Dehghanzadeh, R. Evaluation of water corrosion, scaling extent and heterotrophic plate count bacteria in asbestos and polyethylene pipes in drinking water distribution system. Hum. Ecol. Risk Assess. Int. J. 2018, 24, 1138–1149. [Google Scholar] [CrossRef]
  9. Flemming, H.-C.; Percival, S.L.; Walker, J.T. Contamination potential of biofilms in water distribution systems. Water Sci. Technol. Water Supply 2002, 2, 271–280. [Google Scholar] [CrossRef]
  10. Wingender, J.; Neu, T.; Flemming, H.-C. (Eds.) What are Bacterial extracellular polymer substances? In Bacterial Extracellular Polymer Substances; Springer: Berlin/Heidelberg, Germany, 1999; pp. 1–19. [Google Scholar]
  11. Fish, K.E.; Osborn, A.M.; Boxall, J.B. Biofilm structures (EPS and bacterial communities) in drinking water distribution systems are conditioned by hydraulics and influence discolouration. Sci. Total Environ. 2017, 593–594, 571–580. [Google Scholar] [CrossRef]
  12. Douterelo, I.; Jackson, M.; Solomon, C.; Boxall, J. Spatial and temporal analogies in microbial communities in natural drinking water biofilms. Sci. Total Environ. 2017, 581–582, 277–288. [Google Scholar] [CrossRef]
  13. Davies, D.G. Biofilm Dispersion. In Biofilm Highlights; Flemming, H.-C., Wingender, J., Szewzyk, U., Eds.; Springer: Berlin/Heidelberg, Germany, 2011; pp. 1–28. [Google Scholar]
  14. Homonnay, Z.G.; Torok, G.; Makk, J.; Brumbauer, A.; Major, E.; Marialigeti, K.; Toth, E. Bacterial communities in the collection and chlorinated distribution sections of a drinking water system in Budapest, Hungary. J. Basic Microbiol. 2014, 54, 729–738. [Google Scholar] [CrossRef]
  15. Vaz-Moreira, I.; Nunes, O.C.; Manaia, C.M. Ubiquitous and persistent Proteobacteria and other Gram-negative bacteria in drinking water. Sci. Total Environ. 2017, 586, 1141–1149. [Google Scholar] [CrossRef]
  16. Prest, E.I.; El-Chakhtoura, J.; Hammes, F.; Saikaly, P.E.; van Loosdrecht, M.C.; Vrouwenvelder, J.S. Combining flow cytometry and 16S rRNA gene pyrosequencing: A promising approach for drinking water monitoring and characterization. Water Res. 2014, 63, 179–189. [Google Scholar] [CrossRef]
  17. Lautenschlager, K.; Hwang, C.; Liu, W.-T.; Boon, N.; Koster, O.; Vrouwenvelder, H.; Hammes, F. A microbiology-based multi-parametric approach towards assessing biological stability in drinking water distribution networks. Water Res. 2013, 47, 3015–3025. [Google Scholar] [CrossRef] [Green Version]
  18. Ji, P.; Parks, J.; Edwards, M.A.; Pruden, A. Impact of Water Chemistry, Pipe Material and Stagnation on the Building Plumbing Microbiome. PLoS ONE 2015, 10, e0141087. [Google Scholar] [CrossRef] [Green Version]
  19. Mi, Z.; Dai, Y.; Xie, S.; Chen, C.; Zhang, X. Impact of disinfection on drinking water biofilm bacterial community. J. Environ. Sci. 2015, 37, 200–205. [Google Scholar] [CrossRef]
  20. Li, C.; Ling, F.; Zhang, M.; Liu, W.T.; Li, Y.; Liu, W. Characterization of bacterial community dynamics in a full-scale drinking water treatment plant. J. Environ. Sci. 2017, 51, 21–30. [Google Scholar] [CrossRef]
  21. Hou, L.; Zhou, Q.; Wu, Q.; Gu, Q.; Sun, M.; Zhang, J. Spatiotemporal changes in bacterial community and microbial activity in a full-scale drinking water treatment plant. Sci. Total Environ. 2018, 625, 449–459. [Google Scholar] [CrossRef]
  22. Oh, S.; Hammes, F.; Liu, W.T. Metagenomic characterization of biofilter microbial communities in a full-scale drinking water treatment plant. Water Res. 2018, 128, 278–285. [Google Scholar] [CrossRef]
  23. Choi, Y.; Cha, Y.; Kim, B. Characteristics of Bacterial Communities in Biological Filters of Full-Scale Drinking Water Treatment Plants. J. Microbiol. Biotechnol. 2019, 29, 91–104. [Google Scholar] [CrossRef]
  24. Hong, P.-Y.; Hwang, C.; Ling, F.; Andersen, G.L.; LeChevallier, M.W.; Liu, W.-T. Pyrosequencing Analysis of Bacterial Biofilm Communities in Water Meters of a Drinking Water Distribution System. Appl. Environ. Microbiol. 2010, 76, 5631–5635. [Google Scholar] [CrossRef] [Green Version]
  25. Ling, F.; Hwang, C.; Le Chevallier, M.S.; Anderson, G.K.; Liu, W.-T. Core-satellite populations and seasonality of water meter biofilms in a metropolitan drinking water distribution system. Int. Soc. Microb. Ecol. 2016, 10, 582–595. [Google Scholar] [CrossRef] [Green Version]
  26. Kelly, J.J.; Minalt, N.; Culotti, A.; Pryor, M.; Packman, A. Temporal variations in the abundance and composition of biofilm communities colonizing drinking water distribution pipes. PLoS ONE 2014, 9, e98542. [Google Scholar] [CrossRef] [Green Version]
  27. Xu, J.; Tang, W.; Ma, J.; Wang, H. Comparison of microbial community shifts in two parallel multi-step drinking water treatment processes. Appl. Microbiol. Biotechnol. 2017, 101, 5531–5541. [Google Scholar] [CrossRef]
  28. Jaravani, F.D.; Durrheim, D.; Byleveld, P.; Oelgemoeller, M.; Judd, J. Drinking water safety in recreational parks in northern New South Wales, Australia. Australas. J. Environ. Manag. 2015, 22, 432–445. [Google Scholar] [CrossRef]
  29. Kaestli, M.; O’Donnell, M.O.; Rose, M.; Webb, J.R.; Mayo, M.; Currie, B.J.; Gibb, K. Opportunistic pathogens and large microbial diversity detected in source-to-distribution drinking water of three remote communities in Northern Australia. PLoS Negl. Trop. Dis. 2019, 13, e0007672. [Google Scholar] [CrossRef] [Green Version]
  30. Ahmed, W.; Staley, C.; Hamilton, K.A.; Beale, D.J.; Sadowsky, M.J.; Toze, S.; Haas, C.N. Amplicon-based taxonomic characterization of bacteria in urban and peri-urban roof-harvested rainwater stored in tanks. Sci. Total Environ. 2017, 576, 326–334. [Google Scholar] [CrossRef]
  31. Chubaka, C.E.; Whiley, H.; Edwards, J.W.; Ross, K.E. Microbiological Values of Rainwater Harvested in Adelaide. Pathogens 2018, 7, 21. [Google Scholar] [CrossRef] [Green Version]
  32. Hampton, J.; Spencer, P.B.S.; Elliot, A.D.; Thompson, R.C.A. Prevalence of Zoonotic Pathogens from Feral Pigs in Major Public Drinking Water Catchments in Western Australia. EcoHealth 2006, 3, 103–108. [Google Scholar] [CrossRef] [Green Version]
  33. Koehler, A.V.; Haydon, S.R.; Jex, A.R.; Gasser, R.B. Cryptosporidium and Giardia taxa in faecal samples from animals in catchments supplying the city of Melbourne with drinking water (2011 to 2015). Parasites Vectors 2016, 9, 1–14. [Google Scholar] [CrossRef] [PubMed] [Green Version]
  34. Zahedi, A.; Odgers, T.; Ball, A.; Watkinson, A.; Robertson, I.; Ryan, U. Longitudinal analysis of Giardia duodenalis assemblages in animals inhabiting drinking water catchments in New South Wales and Queensland–Australia (2013–2015). Sci. Total Environ. 2020, 718, 1–8. [Google Scholar] [CrossRef] [PubMed]
  35. Blyton, M.D.; Gordon, D.M. Genetic Attributes of E. coli Isolates from Chlorinated Drinking Water. PLoS ONE 2017, 12, e0169445. [Google Scholar] [CrossRef] [PubMed]
  36. Nolan, M.J.; Jex, A.R.; Koehler, A.V.; Haydon, S.R.; Stevens, M.A.; Gasser, R.B. Molecular-based investigation of Cryptosporidium and Giardia from animals in water catchments in southeastern Australia. Water Res. 2013, 47, 1726–1740. [Google Scholar] [CrossRef]
  37. Marshall, H.M.; Carter, R.; Torbey, M.J.; Minion, S.; Tolson, C.; Sidjabat, H.E.; Thomson, R.M. Mycobacterium lentiflavum in drinking water supplies, Australia. Emerg. Infect. Dis. 2011, 17, 395–402. [Google Scholar] [CrossRef]
  38. Thomson, R.M.; Carter, R.; Tolson, C.; Coulter, C.; Huygens, F.; Hargreaves, M. Factors associated with the isolation of Nontuberculous mycobacteria (NTM) from a large municipal water system in Brisbane, Australia. BMC Microbiol. 2013, 13, 89. [Google Scholar] [CrossRef] [Green Version]
  39. Thomson, R.; Tolson, C.; Huygens, F.; Hargreaves, M. Strain variation amongst clinical and potable water isolates of M. kansasii using automated repetitive unit PCR. Int. J. Med. Microbiol. 2014, 304, 484–489. [Google Scholar] [CrossRef]
  40. City of Melbourne. Explore Melbourne/Interactive Maps. 2018. Available online: http://maps.melbourne.vic.gov.au/?_ga=2.185820137.1309982183.1538480420–1070169282.1522717709 (accessed on 24 July 2018).
  41. Hoy, M. (Cartographer). Fountains in Zurich. 2016. Available online: http://skyplan.ch/maps/zurich-water/ (accessed on 17 April 2016).
  42. CWW (City West Water). Drinking Water Quality Report 2019. City West Water. 2019. Available online: https://www.citywestwater.com.au/about_us/reports_publications/drinking_water_quality_report.aspx (accessed on 7 January 2020).
  43. City of Melbourne. Melbourne, Australia. Drinking Water Fountain Instillation Information. 2018. (Personal correspondence via telephone on 15 February 2019).
  44. CWW (City West Water). Drinking Water Quality Report 2017. City West Water. 2017. Available online: https://www.citywestwater.com.au/sites/default/files/attachments/drinking_water_quality_report_2017.pdf (accessed on 17 February 2022).
  45. WHO. Heterotrophic Plate Counts and Drinking-Water Safety. 2003. Available online: https://www.who.int/water_sanitation_health/dwq/HPCFull.pdf (accessed on 16 February 2022).
  46. ADWG. Australian Drinking Water Guidelines 2018 Version 3.5. 2019. Available online: https://www.nhmrc.gov.au/about-us/publications/australian-drinking-water-guidelines#block-views-block-file-attachments-content-block-1 (accessed on 11 December 2019).
  47. Woese, C.R.; Fox, G.E. Phylogenetic structure of the prokaryotic domain: The primary kingdoms. Evolution 1977, 74, 5088–5090. [Google Scholar] [CrossRef] [Green Version]
  48. Treibel, T.A.; Manisty, C.; Burton, M.; McKnight, A.; Lambourne, J.; Augusto, J.B.; Couta-Parada, X.; Cutino-Moguel, T.; Noursadeghi, M.; Moon, J.C. COVID-19: PCR screening of asymptomatic healthcare workers at London hospital. Lancet 2020, 395, 1608–1610. [Google Scholar] [CrossRef]
  49. Utsunomiya, Y.T.; Milanesi, M.; Utsunomiya, A.T.; Ajmone-Marsan, P.; Garcia, J.F. GHap: An R package for genome-wide haplotyping. Bioinformatics 2016, 32, 2861–2862. [Google Scholar] [CrossRef] [Green Version]
  50. Cole, J.R.; Wang, W.; Fish, J.A.; Chai, B.; McGarrell, D.M.; Sun, Y.; Tiedje, J.M. Ribosomal Database Project: Data and tools for high throughput rRNA analysis. Nucleic Acids Res. 2014, 42, 633–642. [Google Scholar] [CrossRef] [Green Version]
  51. Chao, A. Nonparametric Estimation of the Number of Classes in a Population. Scandinavian J. Stat. 1984, 11, 265–270. [Google Scholar]
  52. Shannon, C.E. A mathematical theory of communication. Bell Syst. Tech. J. 1948, 27, 379–423. [Google Scholar] [CrossRef] [Green Version]
  53. Pielou, E.C. The Measurement of Diversity in Different Types of Biological Collections. J. Theor. Biol. 1966, 13, 131–144. [Google Scholar] [CrossRef]
  54. Clarke, K.; Warwick, R. Primer-6 Computer Program. Natural Environment Research Council, Plymouth; Quest Research Limited: Auckland, New Zealand, 2015. [Google Scholar]
  55. Schloss, P.D.; Handelsman, J. Introducing DOTUR, a computer program for defining operational taxonomic units and estimating species richness. Appl. Environ. Microbiol. 2005, 71, 1501–1506. [Google Scholar] [CrossRef] [Green Version]
  56. Wang, F.; Li, W.; Li, Y.; Zhang, J.; Chen, J.; Zhang, W.; Wu, X. Molecular analysis of bacterial community in the tap water with different water ages of a drinking water distribution system. Front. Environ. Sci. Eng. 2018, 12, 1–10. [Google Scholar] [CrossRef]
  57. Inkinen, J.; Jayaprakash, B.; Santo Domingo, J.W.; Keinanen-Toivola, M.M.; Ryu, H.; Pitkanen, T. Diversity of ribosomal 16S DNA- and RNA-based bacterial community in an office building drinking water system. J. Appl. Microbiol. 2016, 120, 1723–1738. [Google Scholar] [CrossRef]
  58. Revetta, R.P.; Gomez-Alvarez, V.; Gerke, T.L.; Santo Domingo, J.W.; Ashbolt, N.J. Changes in bacterial composition of biofilm in a metropolitan drinking water distribution system. J. Appl. Microbiol. 2016, 121, 294–305. [Google Scholar] [CrossRef] [Green Version]
  59. Bautista-de Los Santos, Q.M.; Schroeder, J.L.; Sevillano-Rivera, M.C.; Sungthong, R.; Ijaz, U.Z.; Sloan, W.T.; Pinto, A.J. Emerging investigators series: Microbial communities in full-scale drinking water distribution systems–a meta-analysis. Environ. Sci. Water Res. Technol. 2016, 2, 611–634. [Google Scholar] [CrossRef]
  60. Shi, P.; Jia, S.; Zhang, X.X.; Zhang, T.; Cheng, S.; Li, A. Metagenomic insights into chlorination effects on microbial antibiotic resistance in drinking water. Water Res. 2013, 47, 111–120. [Google Scholar] [CrossRef]
  61. Huang, K.; Zhang, X.X.; Shi, P.; Wu, B.; Ren, H. A comprehensive insight into bacterial virulence in drinking water using 454 pyrosequencing and Illumina high-throughput sequencing. Ecotoxicol. Environ. Saf. 2014, 109, 15–21. [Google Scholar] [CrossRef]
  62. Gomez-Alvarez, V.; Humrighouse, B.W.; Revetta, R.P.; Santo Domingo, J.W. Bacterial composition in a metropolitan drinking water distribution system utilizing different source waters. J. Water Health 2015, 13, 140–151. [Google Scholar] [CrossRef] [Green Version]
  63. Zhang, M.; Liu, W.; Nie, X.; Li, C.; Gu, J.; Zhang, C. Molecular Analysis of Bacterial Communities in Biofilms of a Drinking Water Clearwell. Microbes Environ. 2012, 27, 443–448. [Google Scholar] [CrossRef] [Green Version]
  64. Douterelo, I.; Fish, K.E.; Boxall, J.B. Succession of bacterial and fungal communities within biofilms of a chlorinated drinking water distribution system. Water Res. 2018, 141, 74–85. [Google Scholar] [CrossRef]
  65. Wu, H.; Zhang, J.; Mi, Z.; Xie, S.; Chen, C.; Zhang, X. Biofilm bacterial communities in urban drinking water distribution systems transporting waters with different purification strategies. Appl. Microbiol. Biotechnol. 2015, 99, 1947–1955. [Google Scholar] [CrossRef]
  66. Gerrity, D.; Arnold, M.; Dickenson, E.; Moser, D.; Sackett, J.D.; Wert, E.C. Microbial community characterization of ozone-biofiltration systems in drinking water and potable reuse applications. Water Res. 2018, 135, 207–219. [Google Scholar] [CrossRef]
  67. Li, X.; Wang, H.; Hu, C.; Yang, M.; Hu, H.; Niu, J. Characteristics of biofilms and iron corrosion scales with ground and surface waters in drinking water distribution systems. Corros. Sci. 2015, 90, 331–339. [Google Scholar] [CrossRef]
  68. Koskinen, R.; Ali-Vehmas, T.; KaÈmpfer, P.; Laurikkala, M.; Tsitko, I.; Kostya, E.; Atroshi, F.; Salkinoja-Salonen, M. Characterization of Sphingomonas isolates from Finnish and Swedish drinking water distribution systems. J. Appl. Microbiol. 2020, 89, 687–696. [Google Scholar] [CrossRef]
  69. Gusman, V.; Medic, D.; Jelesic, Z.; Mihajlovic-Ukropina, M. Sphingomonas paucimobilis as a Biofilm Producer. Arch. Biol. Sci. 2012, 64, 1327–1331. [Google Scholar] [CrossRef]
  70. Sun, H.; Shi, B.; Bai, Y.; Wang, D. Bacterial community of biofilms developed under different water supply conditions in a distribution system. Sci. Total Environ. 2014, 472, 99–107. [Google Scholar] [CrossRef]
  71. Tsagkari, E.; Keating, C.; Couto, J.M.; Sloan, W.T. A Keystone Methylobacterium Strain in BiofilmFormation in Drinking Water. Water 2017, 9, 778. [Google Scholar] [CrossRef]
  72. Baik, K.S.; Park, S.C.; Kim, H.J.; Lee, K.H.; Seong, C.N. Chryseoglobus frigidaquae gen. nov., sp. nov., a novel member of the family Microbacteriaceae. Int. J. Syst. Evol. Microbiol. 2010, 60, 1311–1316. [Google Scholar] [CrossRef] [PubMed] [Green Version]
  73. Fang, Y.; Vanzin, G.; Cupples, A.M.; Strathmann, T.J. Influence of terminal electron-accepting conditions on the soil microbial community and degradation of organic contaminants of emerging concern. Sci. Total Environ. 2020, 706, 1–16. [Google Scholar] [CrossRef] [PubMed]
  74. Hui, C.; Jiang, H.; Liu, B.; Wei, R.; Zhang, Y.; Zhang, Q.; Zhao, Y. Chitin degradation and the temporary response of bacterial chitinolytic communities to chitin amendment in soil under different fertilization regimes. Sci. Total Environ. 2020, 705. [Google Scholar] [CrossRef]
  75. Jia, S.; Wu, J.; Ye, L.; Zhao, F.; Li, T.; Zhang, X.-X. Metagenomic assembly provides a deep insight into the antibiotic resistome alteration induced by drinking water chlorination and its correlations with bacterial host changes. J. Hazard. Mater. 2019, 379, 1–9. [Google Scholar] [CrossRef]
  76. Holinger, E.P.; Ross, K.A.; Robertson, C.E.; Stevens, M.J.; Harris, J.K.; Pace, N.R. Molecular analysis of point-of-use municipal drinking water microbiology. Water Res. 2014, 49, 225–235. [Google Scholar] [CrossRef]
  77. Gomez-Smith, C.K.; LaPara, T.M.; Hozalski, R.M. Sulfate Reducing Bacteria and Mycobacteria Dominate the Biofilm Communities in a Chloraminated Drinking Water Distribution System. Environ. Sci. Technol. 2015, 49, 8432–8440. [Google Scholar] [CrossRef]
  78. Vaerewijck, M.J.; Huys, G.; Palomino, J.C.; Swings, J.; Portaels, F. Mycobacteria in drinking water distribution systems: Ecology and significance for human health. FEMS Microbiol. Rev. 2005, 29, 911–934. [Google Scholar] [CrossRef]
  79. Furuhata, K.; Kato, Y.; Goto, K.; Saitou, K.; Sugiyama, J.-I.; Hara, M.; Fukutama, M. Identification of Yellow-Pigmented Bacteria Isolated from Hospital Tap Water in Japan and their Chlorine Resistance. Biocontrol Sci. 2007, 12, 39–46. [Google Scholar] [CrossRef] [Green Version]
  80. Cheung, C.Y.; Cheng, N.H.Y.; Ting, W.M.; Chak, W.L. Mycobacterium paragordonae: A rare cause of peritonitis in a peritoneal dialysis patient. Clin. Nephrol. 2017, 88, 371–372. [Google Scholar] [CrossRef]
  81. Corsaro, D.; Pages, G.S.; Catalan, V.; Loret, J.F.; Greub, G. Biodiversity of amoebae and amoeba-associated bacteria in water treatment plants. Int. J. Hyg. Environ. Health 2010, 213, 158–166. [Google Scholar] [CrossRef]
  82. Lu, J.; Struewing, I.; Vereen, E.; Kirby, A.E.; Levy, K.; Moe, C.; Ashbolt, N. Molecular Detection of Legionella spp. and their associations with Mycobacterium spp., Pseudomonas aeruginosa and amoeba hosts in a drinking water distribution system. J. Appl. Microbiol. 2015, 120, 509–521. [Google Scholar] [CrossRef]
  83. Delafont, V.; Mougari, F.; Cambau, E.; Joyeux, M.; Bouchon, D.; Hechard, Y.; Moulin, L. First evidence of amoebae-mycobacteria association in drinking water network. Environ. Sci. Technol. 2014, 48, 11872–11882. [Google Scholar] [CrossRef]
  84. Li, Q.; Yu, S.; Li, L.; Liu, G.; Gu, Z.; Liu, M.; Ye, Y.; Xia, Q.; Ren, L.; Li, Q.; et al. Microbial Communities Shaped by Treatment Processes in a Drinking Water Treatment Plant and Their Contribution and Threat to Drinking Water Safety. Front. Microbiol. 2017, 8, 1–16. [Google Scholar] [CrossRef] [Green Version]
  85. Ohta, H.; Hattori, R.; Ushiba, Y.; Mitsui, H.; Ito, M.; Watanabe, H.; Tonosaki, A.; Hattori, T.; Ohta, H.; Hattori, R.; et al. Sphingomonas oligophenolica sp. nov., a halo-and organo-sensitive oligotrophic bacterium from paddy soil that degrades phenolic acids at low concentrations. Int. J. Syst. Evol. Microbiol. 2004, 5, 2185–2190. [Google Scholar] [CrossRef]
  86. Nikitin, D.I.; Tashtemirova, M.A.; Pitriuk, I.A.; Oranskaia, M.S.; Nikitin, L.E. High resistance of some oligotrophic bacteria to ionizing radiation. Mikrobiologiya 1993, 62, 1064–1071. [Google Scholar]
  87. Slabova, O.I.; Nikitin, D.I. Influence of the incubation temperature on the reaction of oligotrophic bacteria to stress. Microbiology 2003, 73, 758–762. [Google Scholar] [CrossRef]
  88. Furuhata, K.; Banzai, A.U.; Kawakami, Y.; Ishizaki, N. Genotyping and Chlorine-Resistance of Methylobacterium aquaticum Isolated from Water Samples in Japan. Biocontrol 2011, 16, 103–107. [Google Scholar] [CrossRef] [Green Version]
  89. Park, S.-K.; Kim, Y.-K.; Oh, Y.-S.; Choi, S.-C. Growth kinetics and chlorine resistance of heterotrophic bacteria isolated from young biofilms formed on a model drinking water distribution system. Korean J. Microbiol. 2015, 51, 355–363. [Google Scholar] [CrossRef]
  90. Gulati, P.; Ghosh, M. Biofilm forming ability of Sphingomonas paucimobilis isolated from community drinking water systems on plumbing materials used in water distribution. J. Water Health 2017, 15, 942–954. [Google Scholar] [CrossRef] [Green Version]
  91. NCBI. Taxonomy Browser. Solirubrobacterales. 2019. Available online: https://www.ncbi.nlm.nih.gov/Taxonomy/Browser/wwwtax.cgi (accessed on 18 February 2020).
  92. Wiegand, S.; Jogler, M.; Boedeker, C.; Pinto, D.; Vollmers, J.; Rivas-Marin, E.; Kohn, T.; Peeters, S.H.; Heuer, A.; Rast, P.; et al. Cultivation and functional characterization of 79 planctomycetes uncovers their unique biology. Nat. Microbiol. 2020, 5, 126–140. [Google Scholar] [CrossRef]
  93. Wiegand, S.; Jogler, M.; Jogler, C. On the maverick Planctomycetes. FEMS Microbiol. Rev. 2018, 42, 739–760. [Google Scholar] [CrossRef] [Green Version]
  94. Liu, L.; Xing, X.; Hu, C.; Wang, H.; Lyu, L. Effect of sequential UV/free chlorine disinfection on opportunistic pathogens and microbial community structure in simulated drinking water distribution systems. Chemosphere 2019, 219, 971–980. [Google Scholar] [CrossRef]
  95. Perrin, Y.; Bouchon, D.; Delafont, V.; Moulin, L.; Hechard, Y. Microbiome of drinking water: A full-scale spatio-temporal study to monitor water quality in the Paris distribution system. Water Res. 2019, 149, 375–385. [Google Scholar] [CrossRef]
  96. Douterelo, I.; Sharpe, R.L.; Boxall, J.B. Bacterial community dynamics during the early stages of biofilm formation in a chlorinated experimental drinking water distribution system: Implications for drinking water discolouration. J. Appl. Microbiol. 2014, 117, 286–301. [Google Scholar] [CrossRef] [Green Version]
  97. Lautenschlager, K.; Boon, N.; Wang, Y.; Egli, T.; Hammes, F. Overnight stagnation of drinking water in household taps induces microbial growth and changes in community composition. Water Res. 2010, 44, 4868–4877. [Google Scholar] [CrossRef]
  98. Lipphaus, P.; Hammes, F.; Kotzsch, S.; Green, J.; Gillespie, S.; Nocker, A. Microbiological tap water profile of a medium-sized building and effect of water stagnation. Environ. Technol. 2014, 35, 620–628. [Google Scholar] [CrossRef]
  99. Ling, F.; Whitaker, R.; Le Chevallier, M.W.; Liu, W.T. Drinking water microbiome assembly induced by water stagnation. ISME J. 2018, 12, 1520–1531. [Google Scholar] [CrossRef] [Green Version]
Figure 1. Map showing the location of the 12 sampling points and fountain types (A) ( Water 14 00908 i001), (B) ( Water 14 00908 i002) and (C) ( Water 14 00908 i003
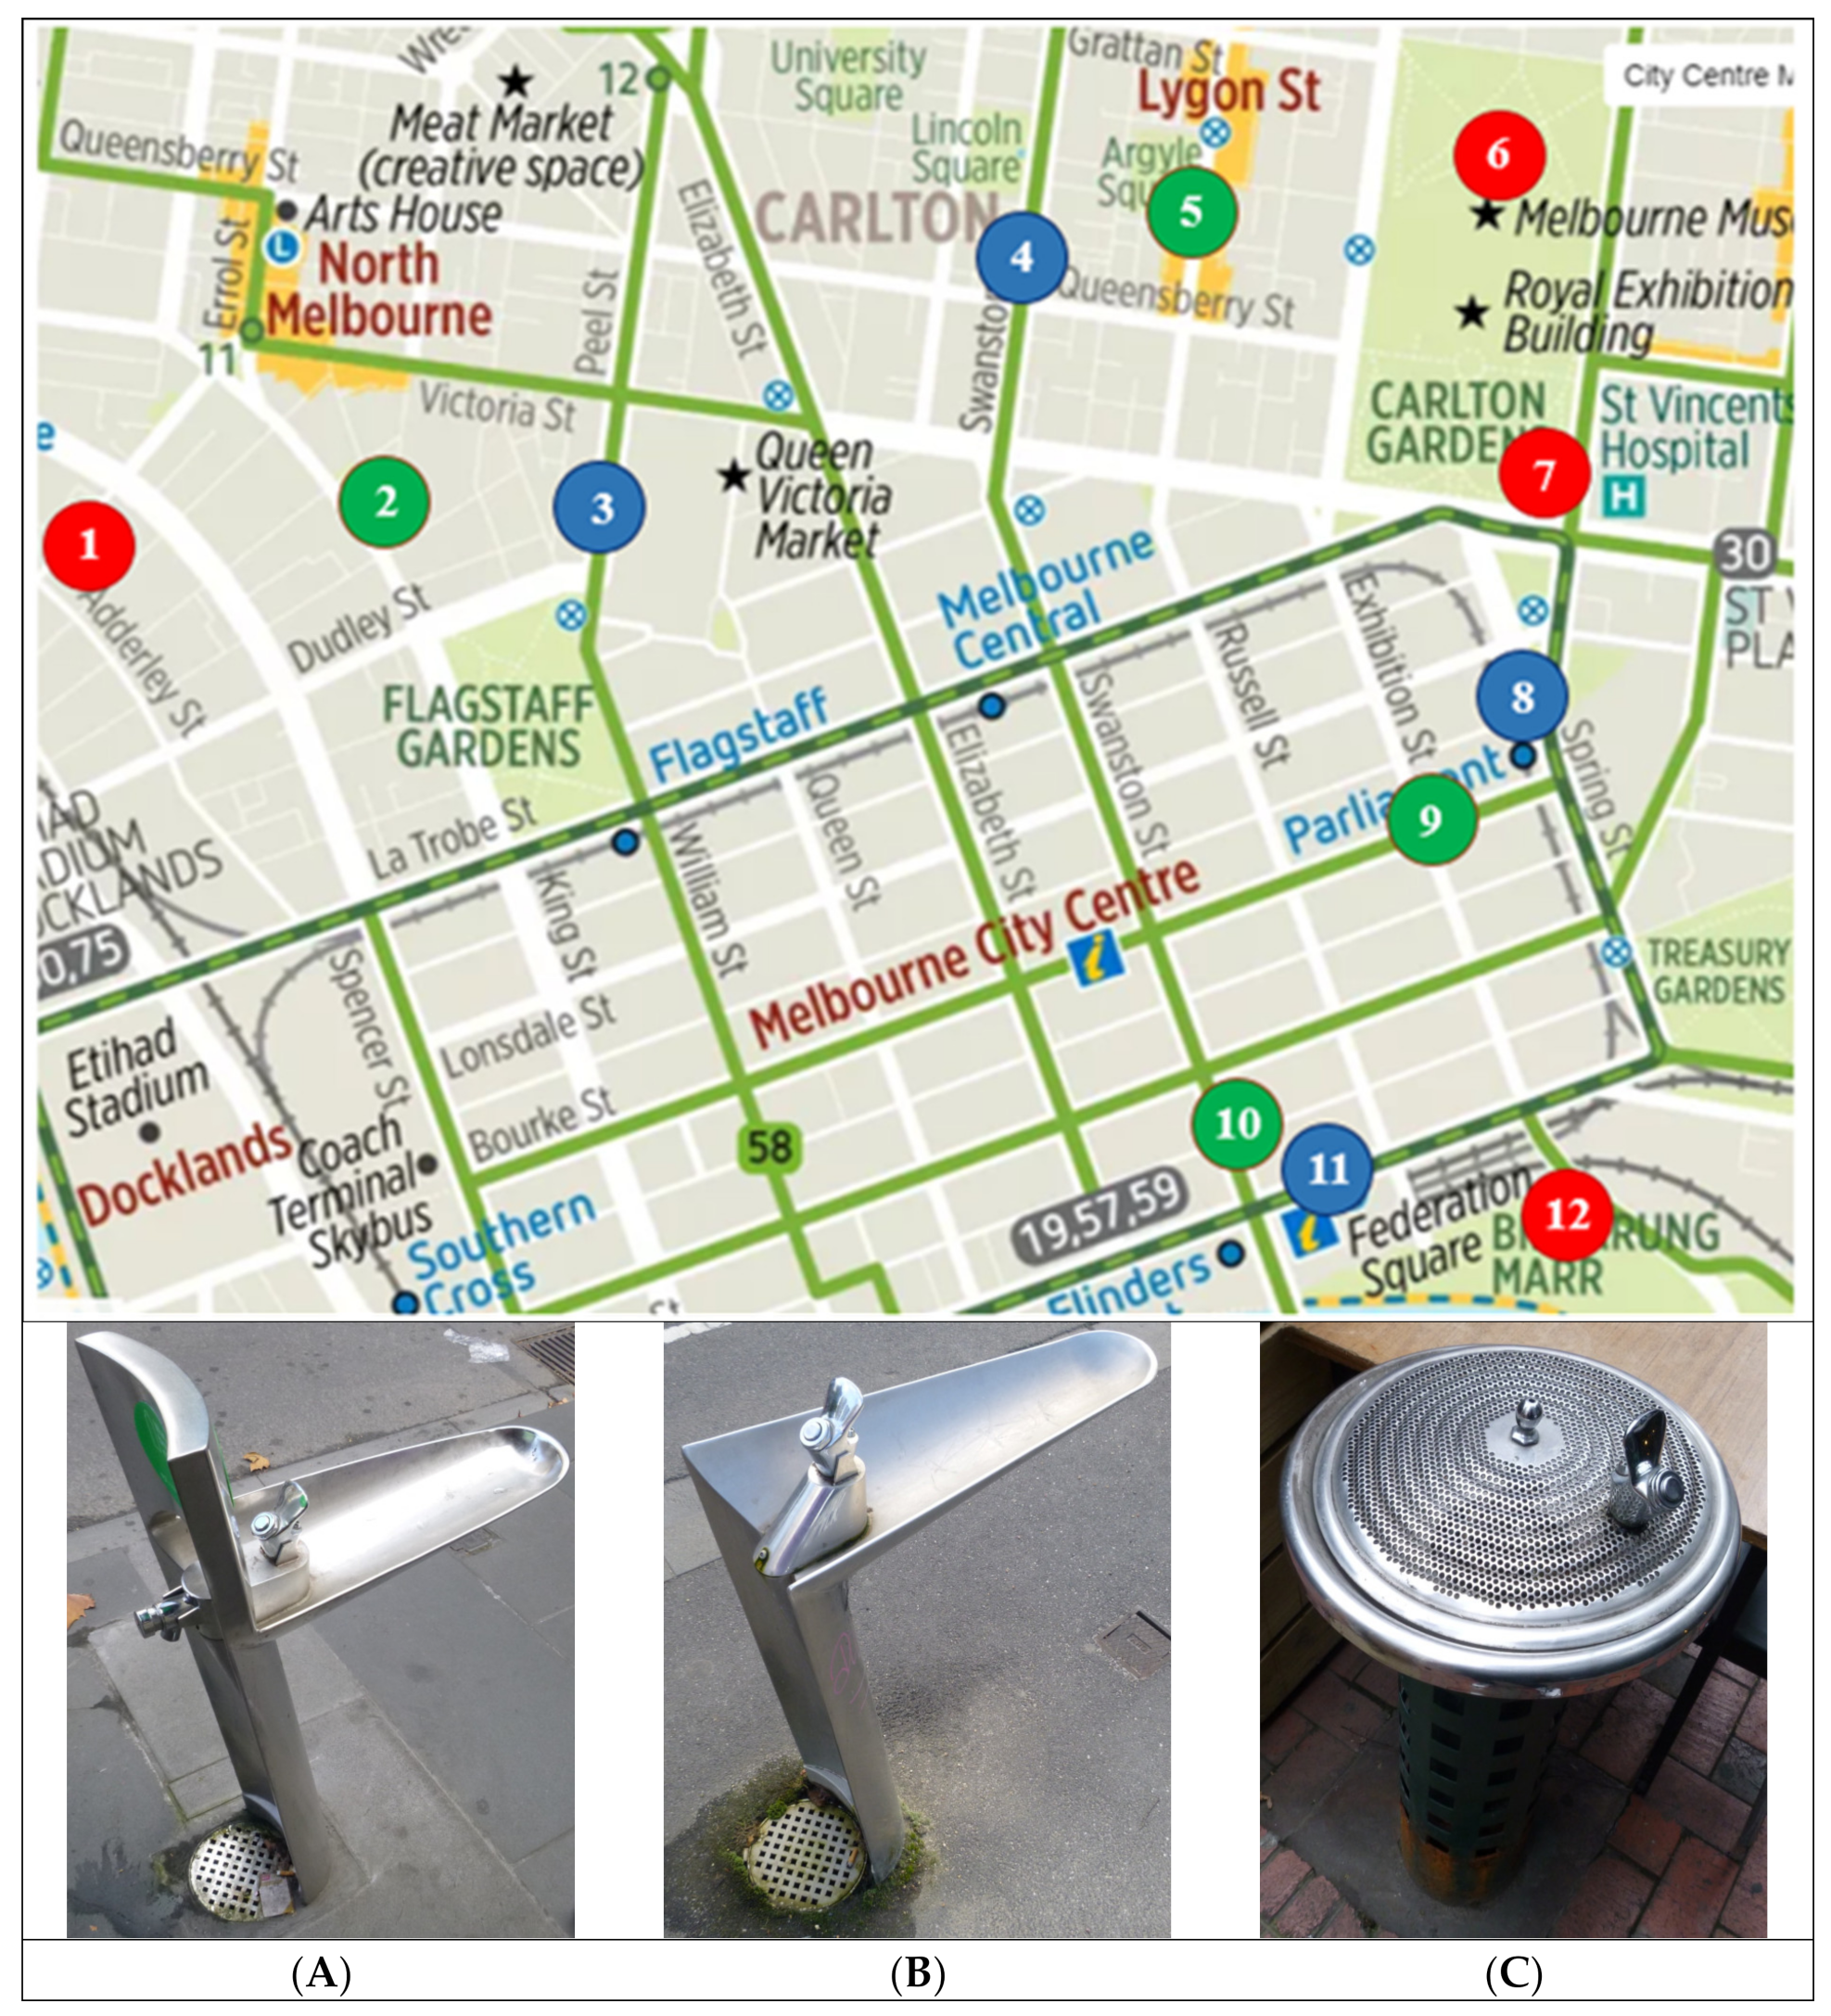
) [40] and images of the three fountain types (A), (B) and (C) (left–right).
Water 14 00908 g001
Figure 2. Nonmetric multidimensional scaling (MDS) analyses showing the similarity/dissimilarity between sampling sites and sample types using two different matrices: (a) Jaccard (presence/absence of each OTU) and (b) Bray–Curtis (relative abundance of each OTU). Matrices were determined from OTUs at 97% identity. Numbers represent fountain numbers (see Figure 1). Sample types are water (squares) and biofilm (triangles). Fountain types are indicated by color: (A) green, (B) blue and (C) red.
Water 14 00908 g002aWater 14 00908 g002b
Figure 3. Variation in bacterial composition between drinking water (squares) and biofilm (triangles) and between individual fountains and fountain types: (a) variation at class level where fountain types are shown in color: type A (green), type B (blue) and type C (red); (b) variation at genus level for the most abundant taxa for water (n = 12 fountains) and biofilm (n = 12 fountains). Vertical axis labels represent phylum/genus and error bars indicate standard error.
Water 14 00908 g003
Figure 4. Heatmap showing the distribution of bacteria at the genus level and at higher taxa levels in water from drinking water fountains. The letters in brackets correspond to family (F), order (O), class (C) and phylum (P). The numbers indicate the relative abundance (%) of each taxon at each site. Fountain types are A (green), B (blue) and C (red).
Water 14 00908 g004
Figure 5. Heatmap showing the distribution of bacteria at the genus level and at higher taxa levels in biofilm from drinking water fountains. The letters in brackets correspond to family (F), order (O), class (C) and phylum (P). The numbers indicate the relative abundance (%) of each taxon at each site. Fountain types are A (green), B (blue) and C (red).
Water 14 00908 g005
Figure 6. Variation in bacterial community composition within water and biofilm between fountain types (A, B and C). (a) Variation in relative abundance (%) of phyla and classes. (b) Heatmap showing the relative abundance (%) of bacteria at the genus level and at higher taxa levels within fountain types for biofilm and water. The letters in brackets correspond to family (F), order (O), class (C) and phylum (P). The numbers indicate the mean relative abundance.
Water 14 00908 g006
Table 1. Physicochemical and microbiological parameters measured in drinking water.
ParameterMeasurementGuideline Value [45]
HPC at 22 °C (CFU mL−1)56 ± 101000
HPC at 37 °C (CFU mL−1)34 ± 71000
Total cell counts (CFU mL−1)6.1 × 10⁴ ± 2.0 × 10⁴NA
Coliforms (cells 100 mL−1)92.5 ± 54.7NA
Escherichia coli (cells 100 mL−1)nd%100 at zero cells mL−1
pH6.85 ± 0.156.5–8.5
Conductivity (µS cm−1)109.4 ± 4.4~900 µS cm−1
Temperature (°C)21.46 ± 0.42NA
Dissolved oxygen (mg L−1)6.60 ± 0.44NA
Sodium (mg L−1)10.96 ± 0.50180 mg L−1
Potassium (mg L−1)1.67 ± 0.09NA
Magnesium (mg L−1)2.52 ± 0.11NA
Calcium (mg L−1)7.52 ± 0.32NA
Fluoride (mg L−1)0.98 ± 0.011.5 mg L−1
Chloride (mg L−1)22.43 ± 0.22250 mg L−1
Nitrate (mg L−1)2.44 ± 0.0450 mg L−1
Sulfate (mg L−1)9.59 ± 0.38250 mg L−1
Hardness as CaCO3 (mg L−1)18.78 ± 0.80200 mg L−1
Table 2. Numbers of sequence reads and diversity indices for water and biofilm samples from drinking water fountains. For all samples, means ± SE are shown with replicates as indicated.
Fountain TypeSample TypeReadsObserved OTUsChao1 EstimatesShannon Diversity Index
A ()Water52,253 ± 10,243139 ± 19193 ± 232.23 ± 0.18
B ()Water46,318 ± 7269234 ± 49288 ± 552.64 ± 0.26
C ()Water85,097 ± 18,477782 ± 116862 ± 1243.62 ± 0.23
Mean 61,303 ± 9945394 ± 64457 ± 742.86 ± 0.16
A ()Biofilm97,961 ± 15,886100 ± 14197 ± 391.46 ± 0.34
B ()Biofilm62,159 ± 13,74582 ±2 2147 ± 271.07 ± 0.26
C ()Biofilm52,476 ± 13,423157 ± 28206 ± 311.97 ± 0.46
Mean 70,865 ± 10,047113 ± 16183 ± 201.50 ± 0.23
Publisher’s Note: MDPI stays neutral with regard to jurisdictional claims in published maps and institutional affiliations.

