
Hydrogeomorphologic Mapping of the Transboundary San Pedro Aquifer: A Tool for Groundwater Characterization

Abstract
:1. Introduction
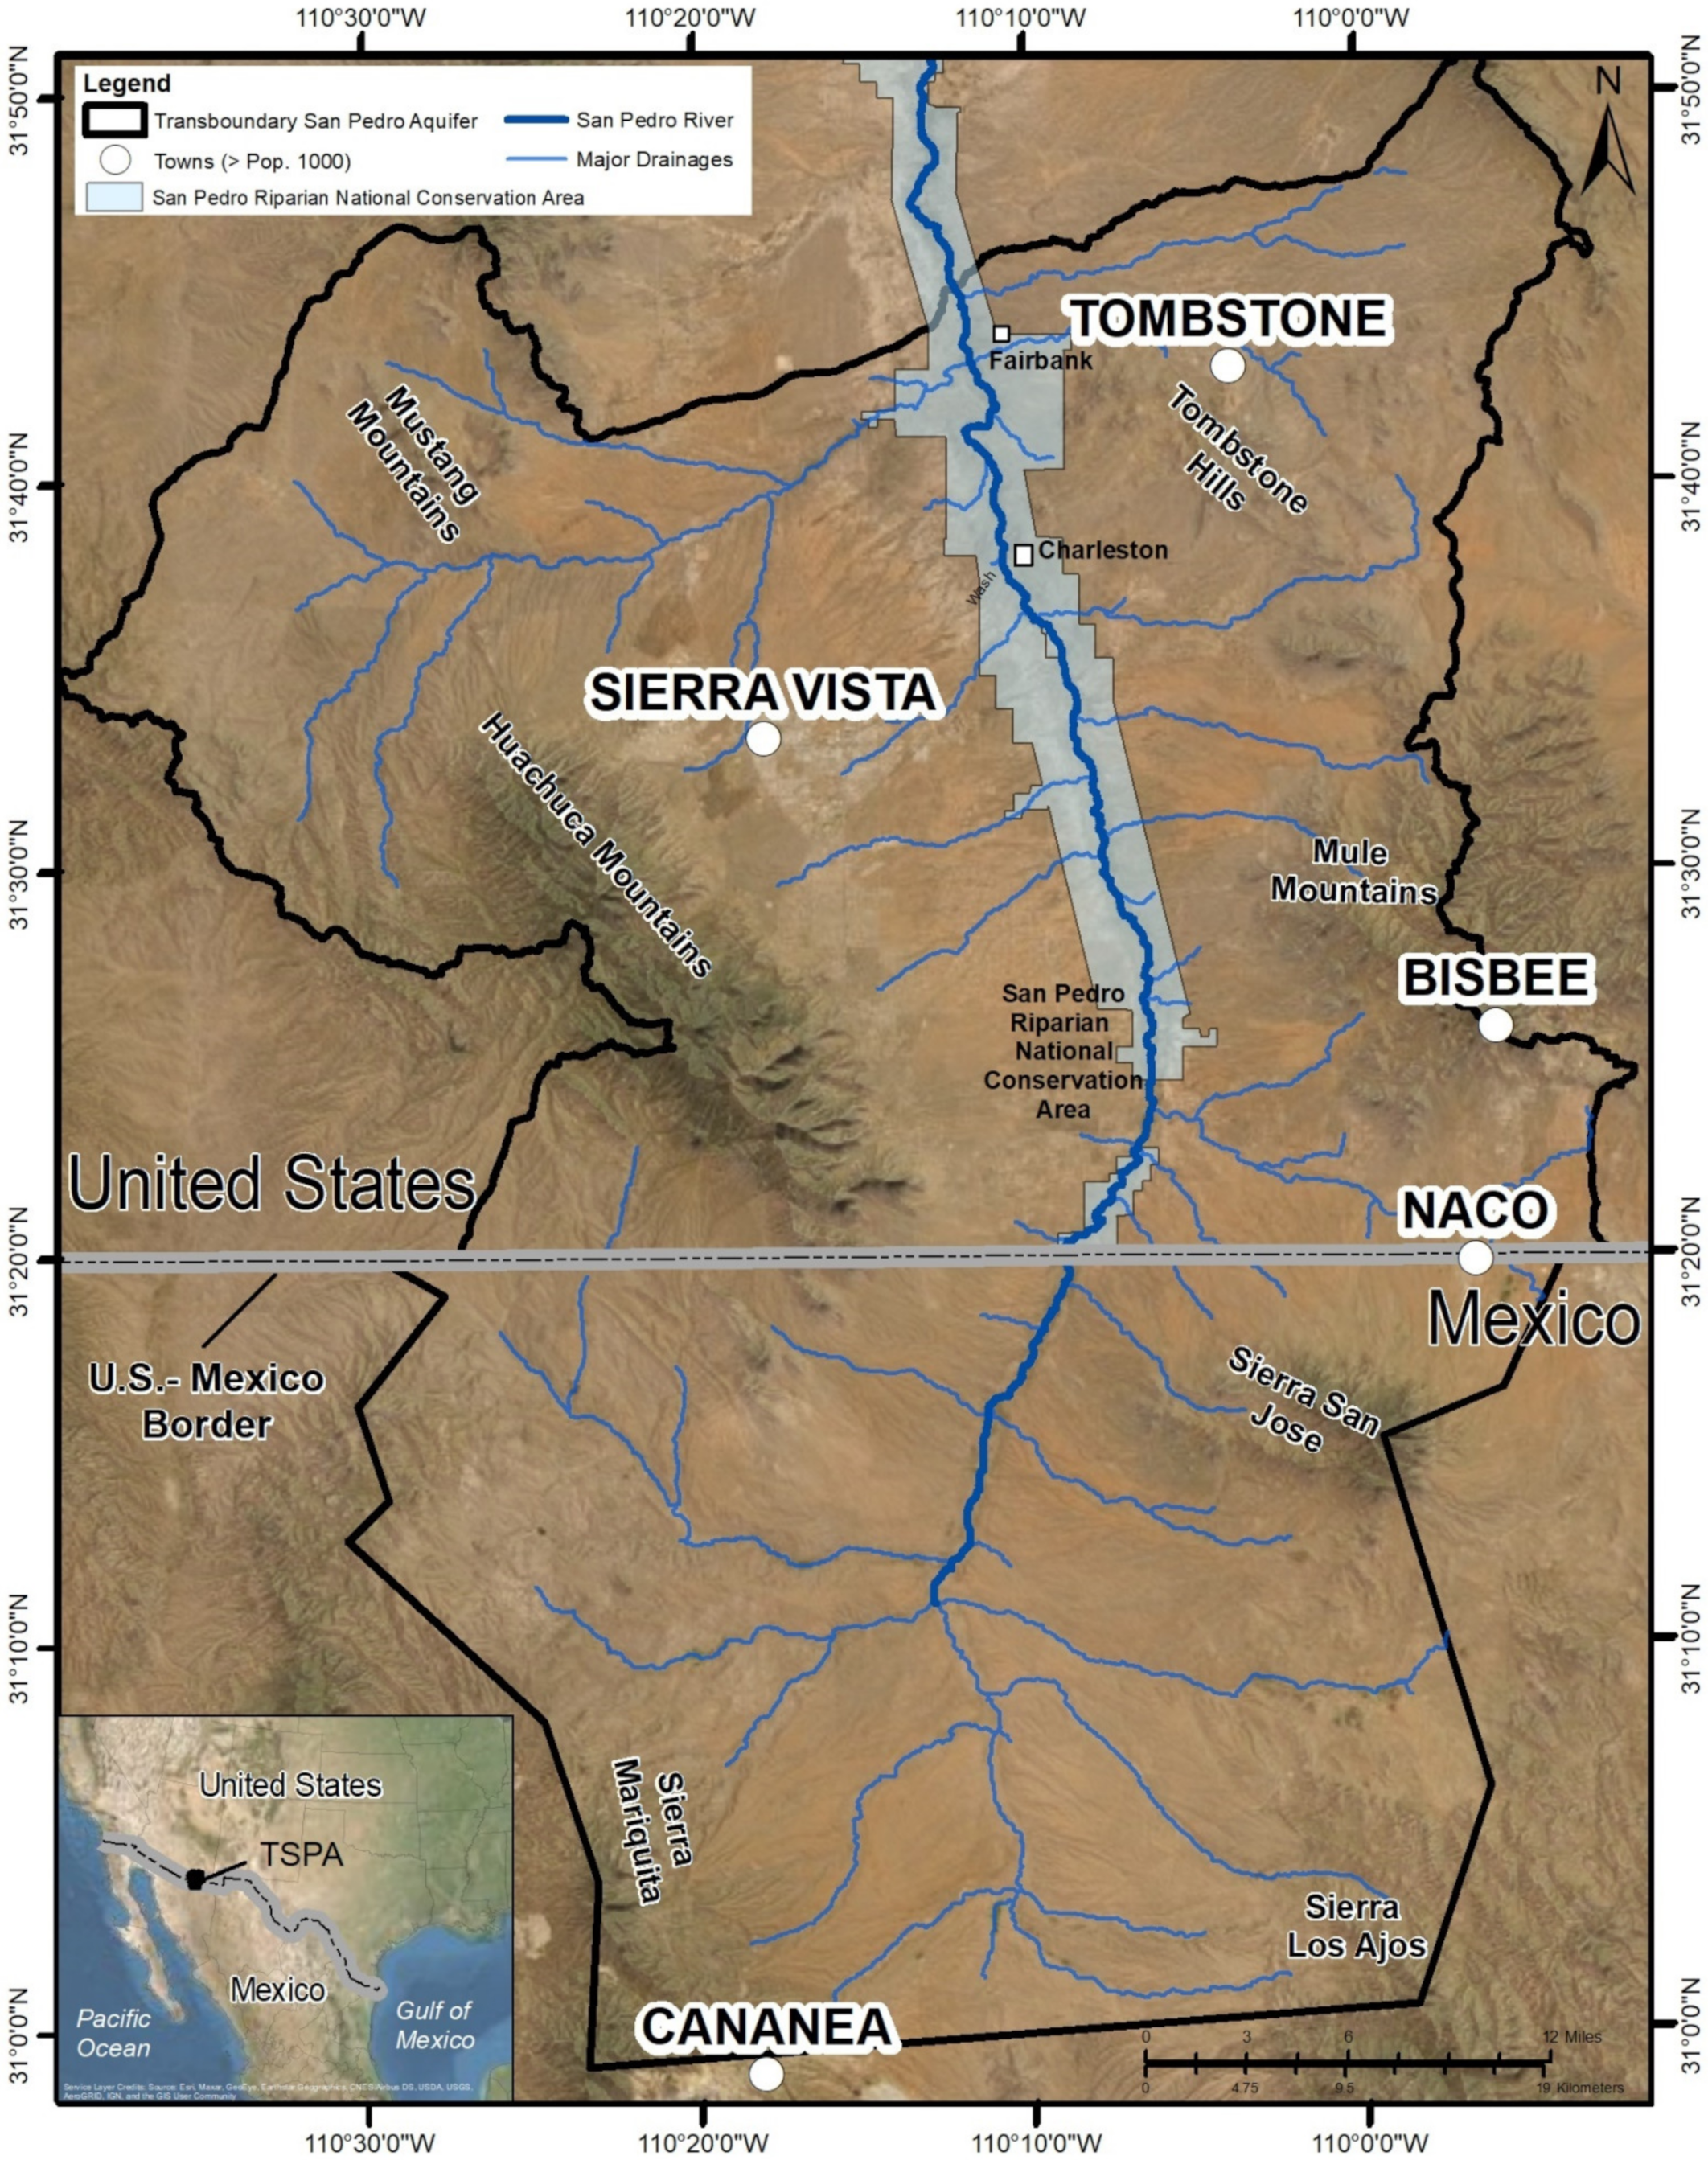
2. Study Area
3. Materials and Methods
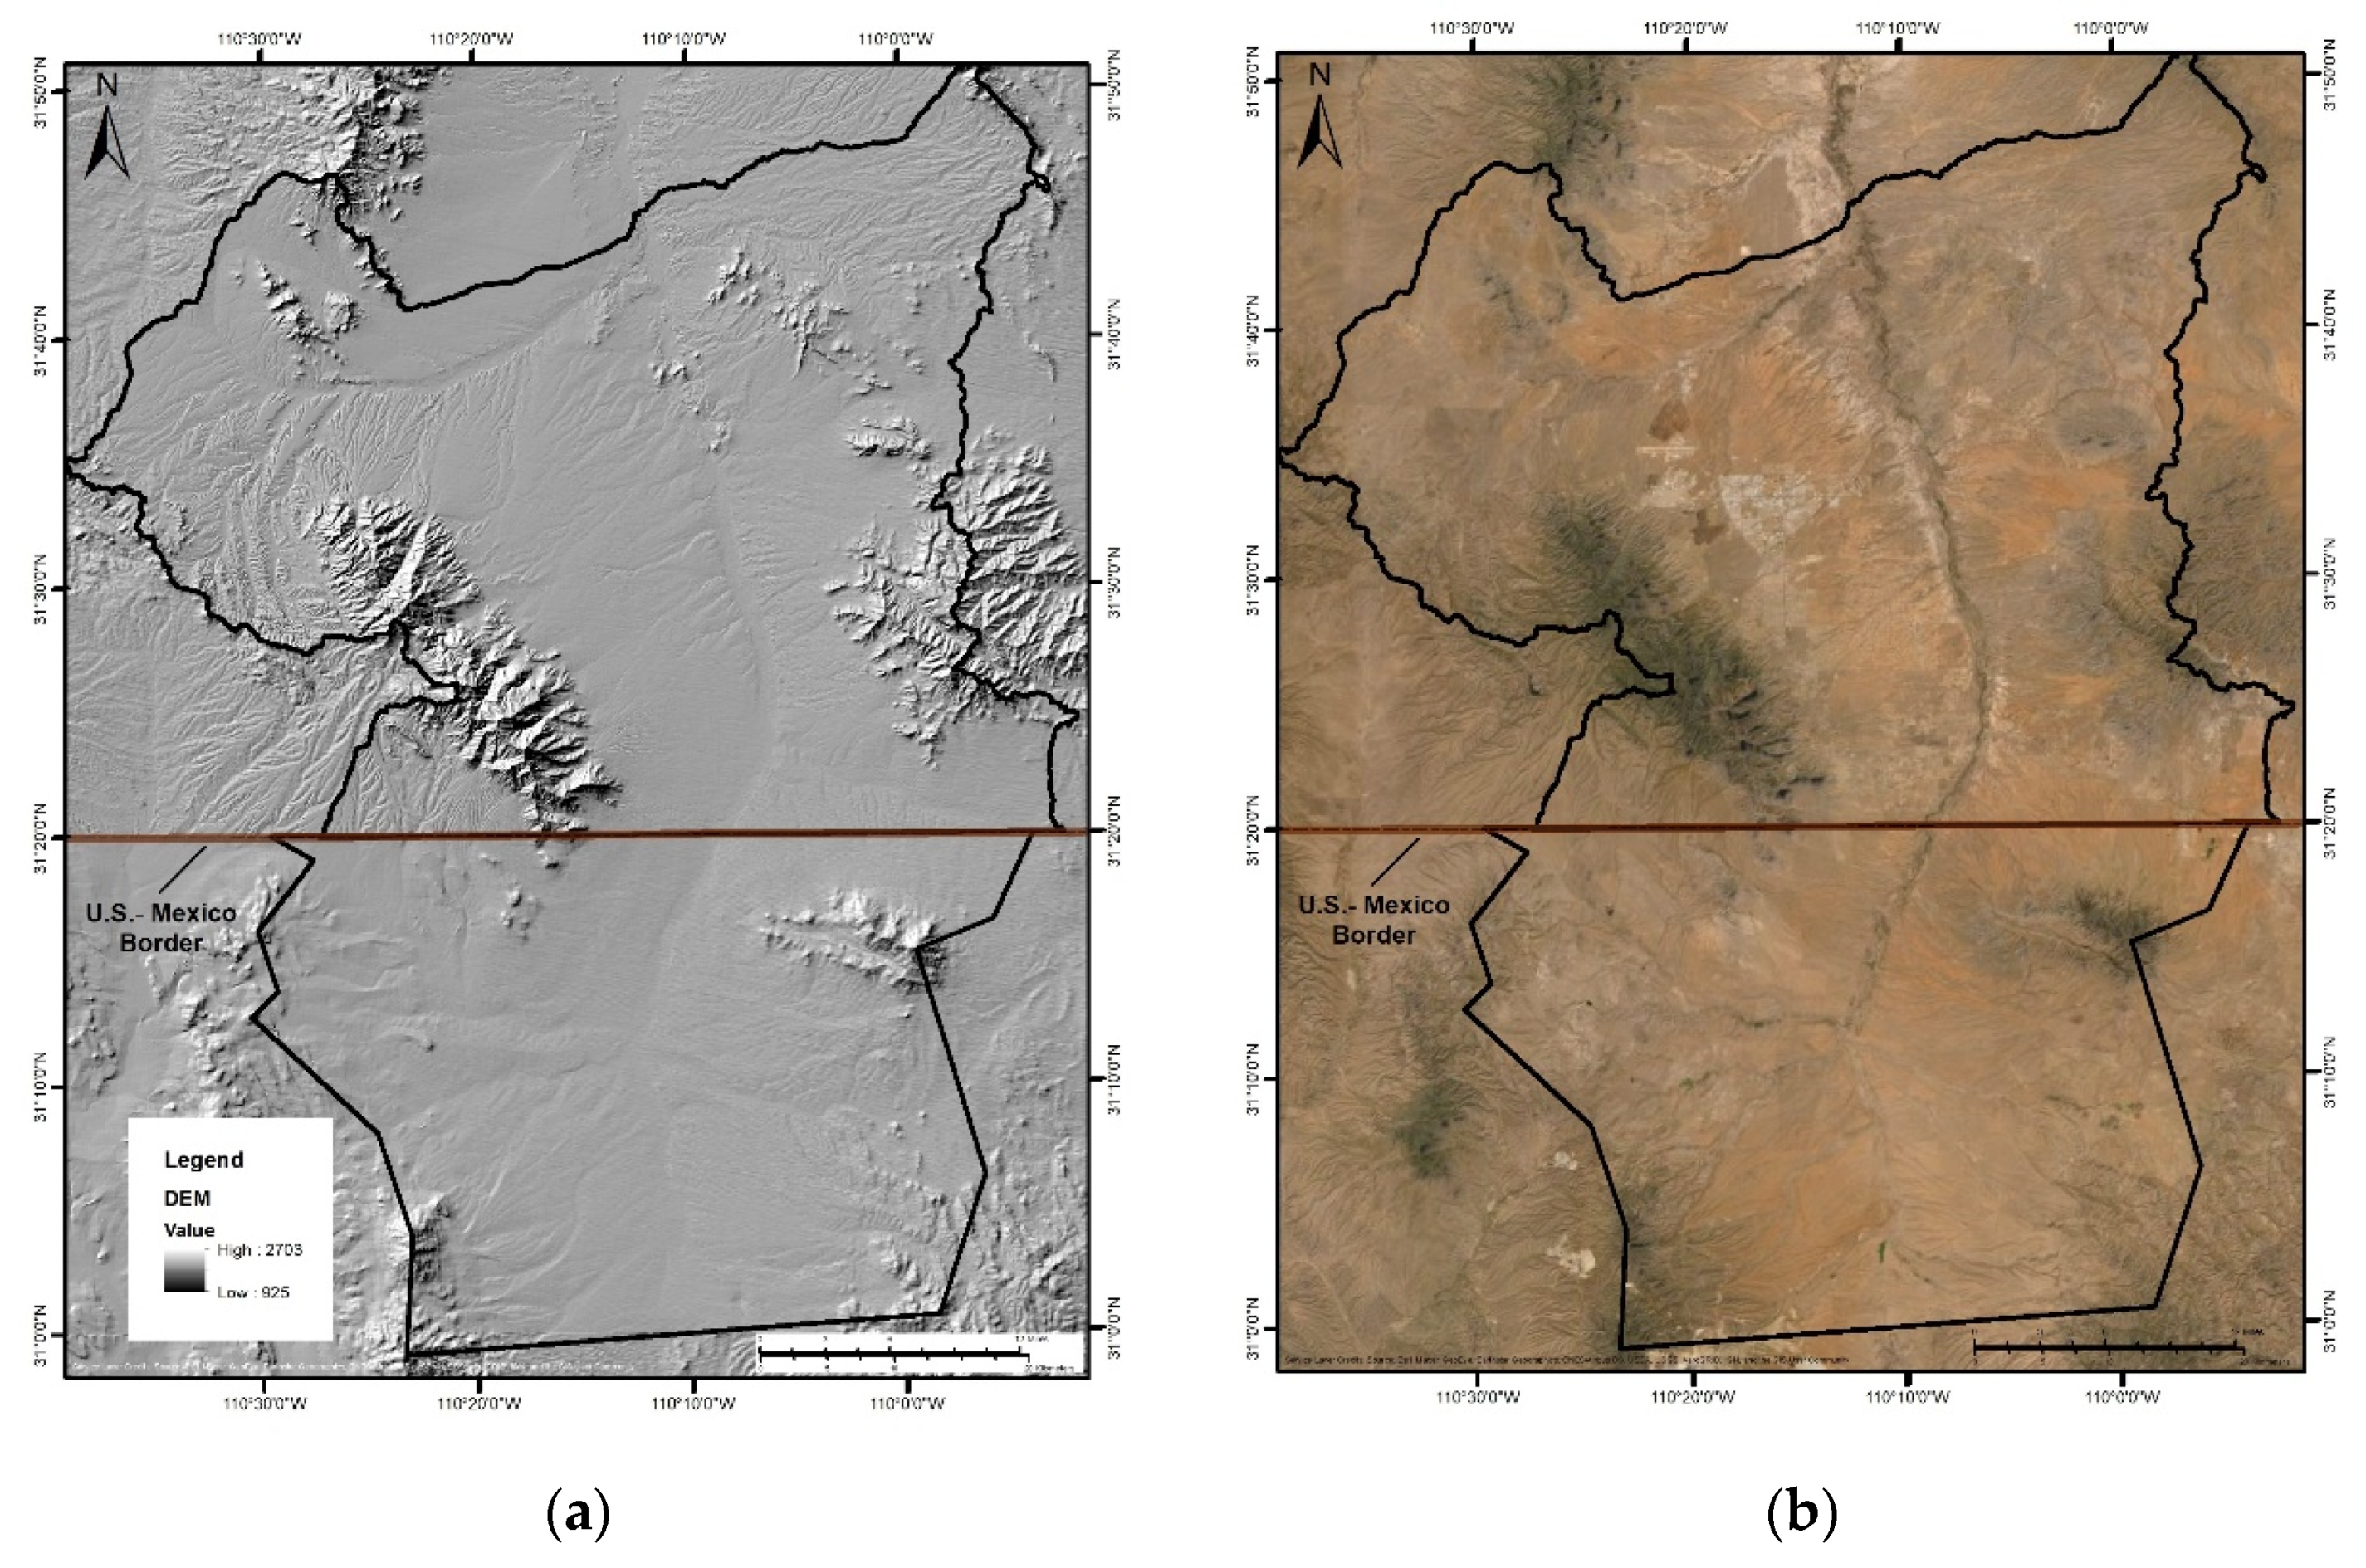
3.1. Topographic Characterization (Landform Identification)
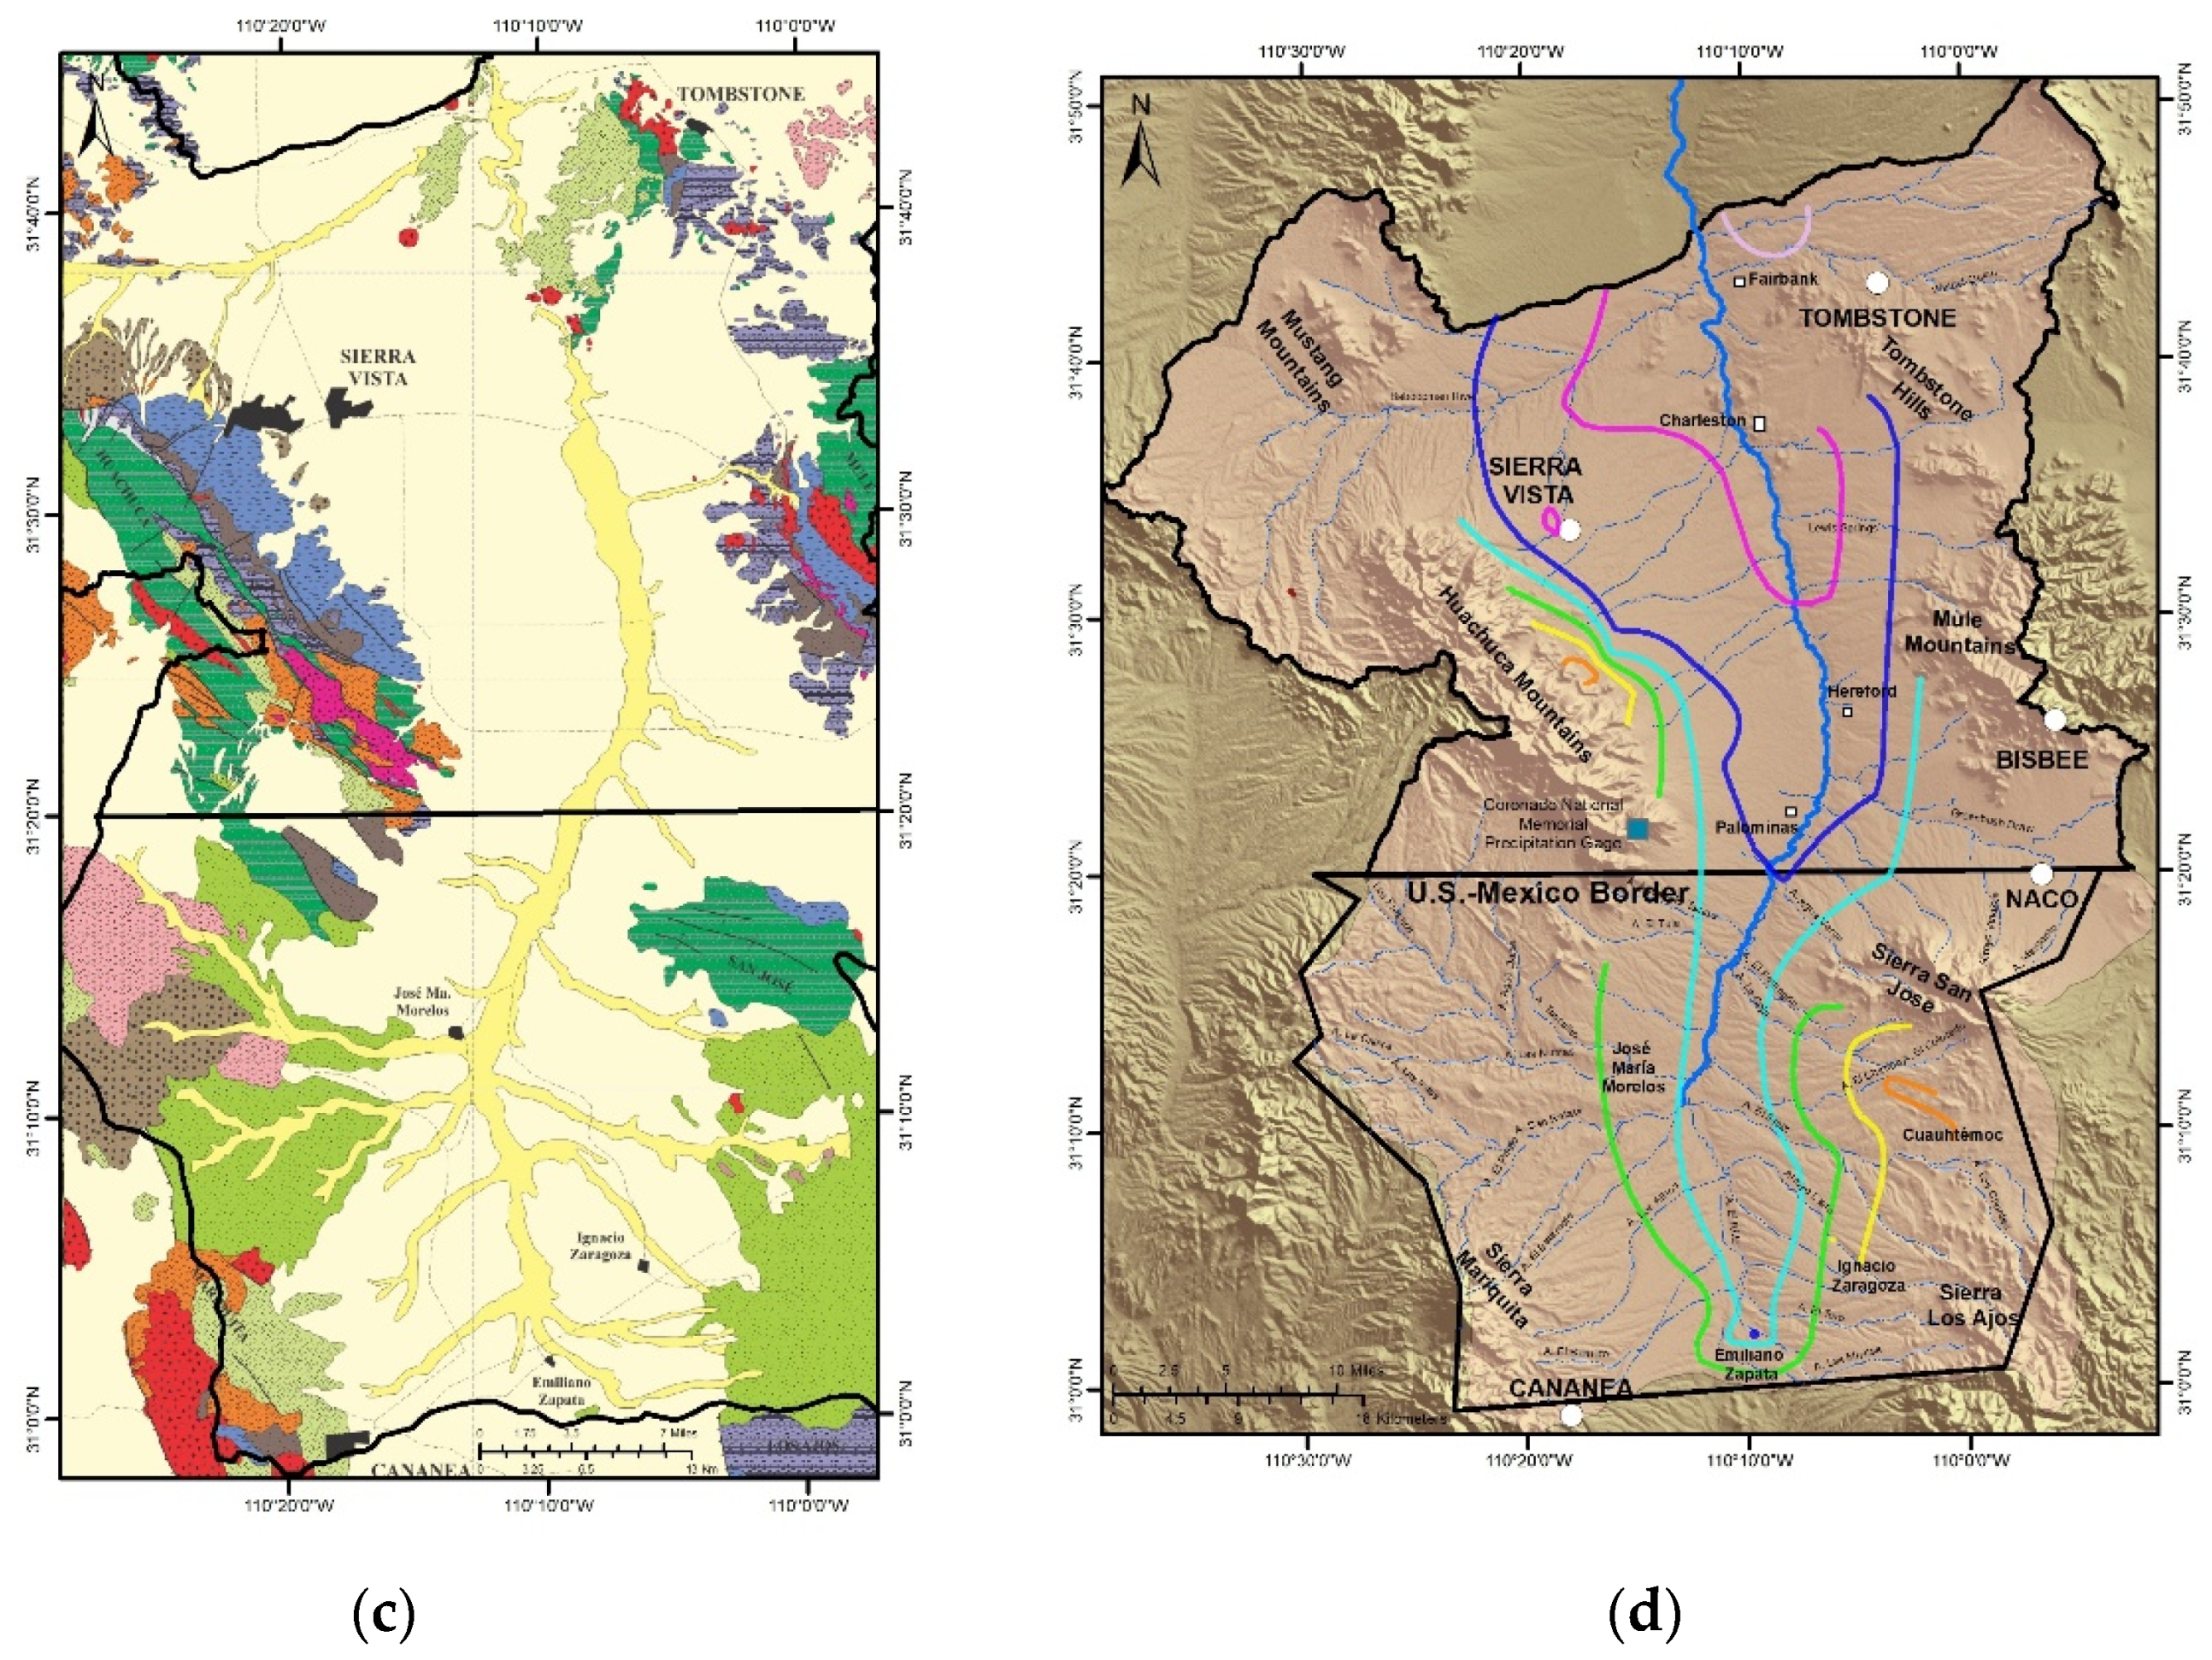
3.2. Geologic Characterization
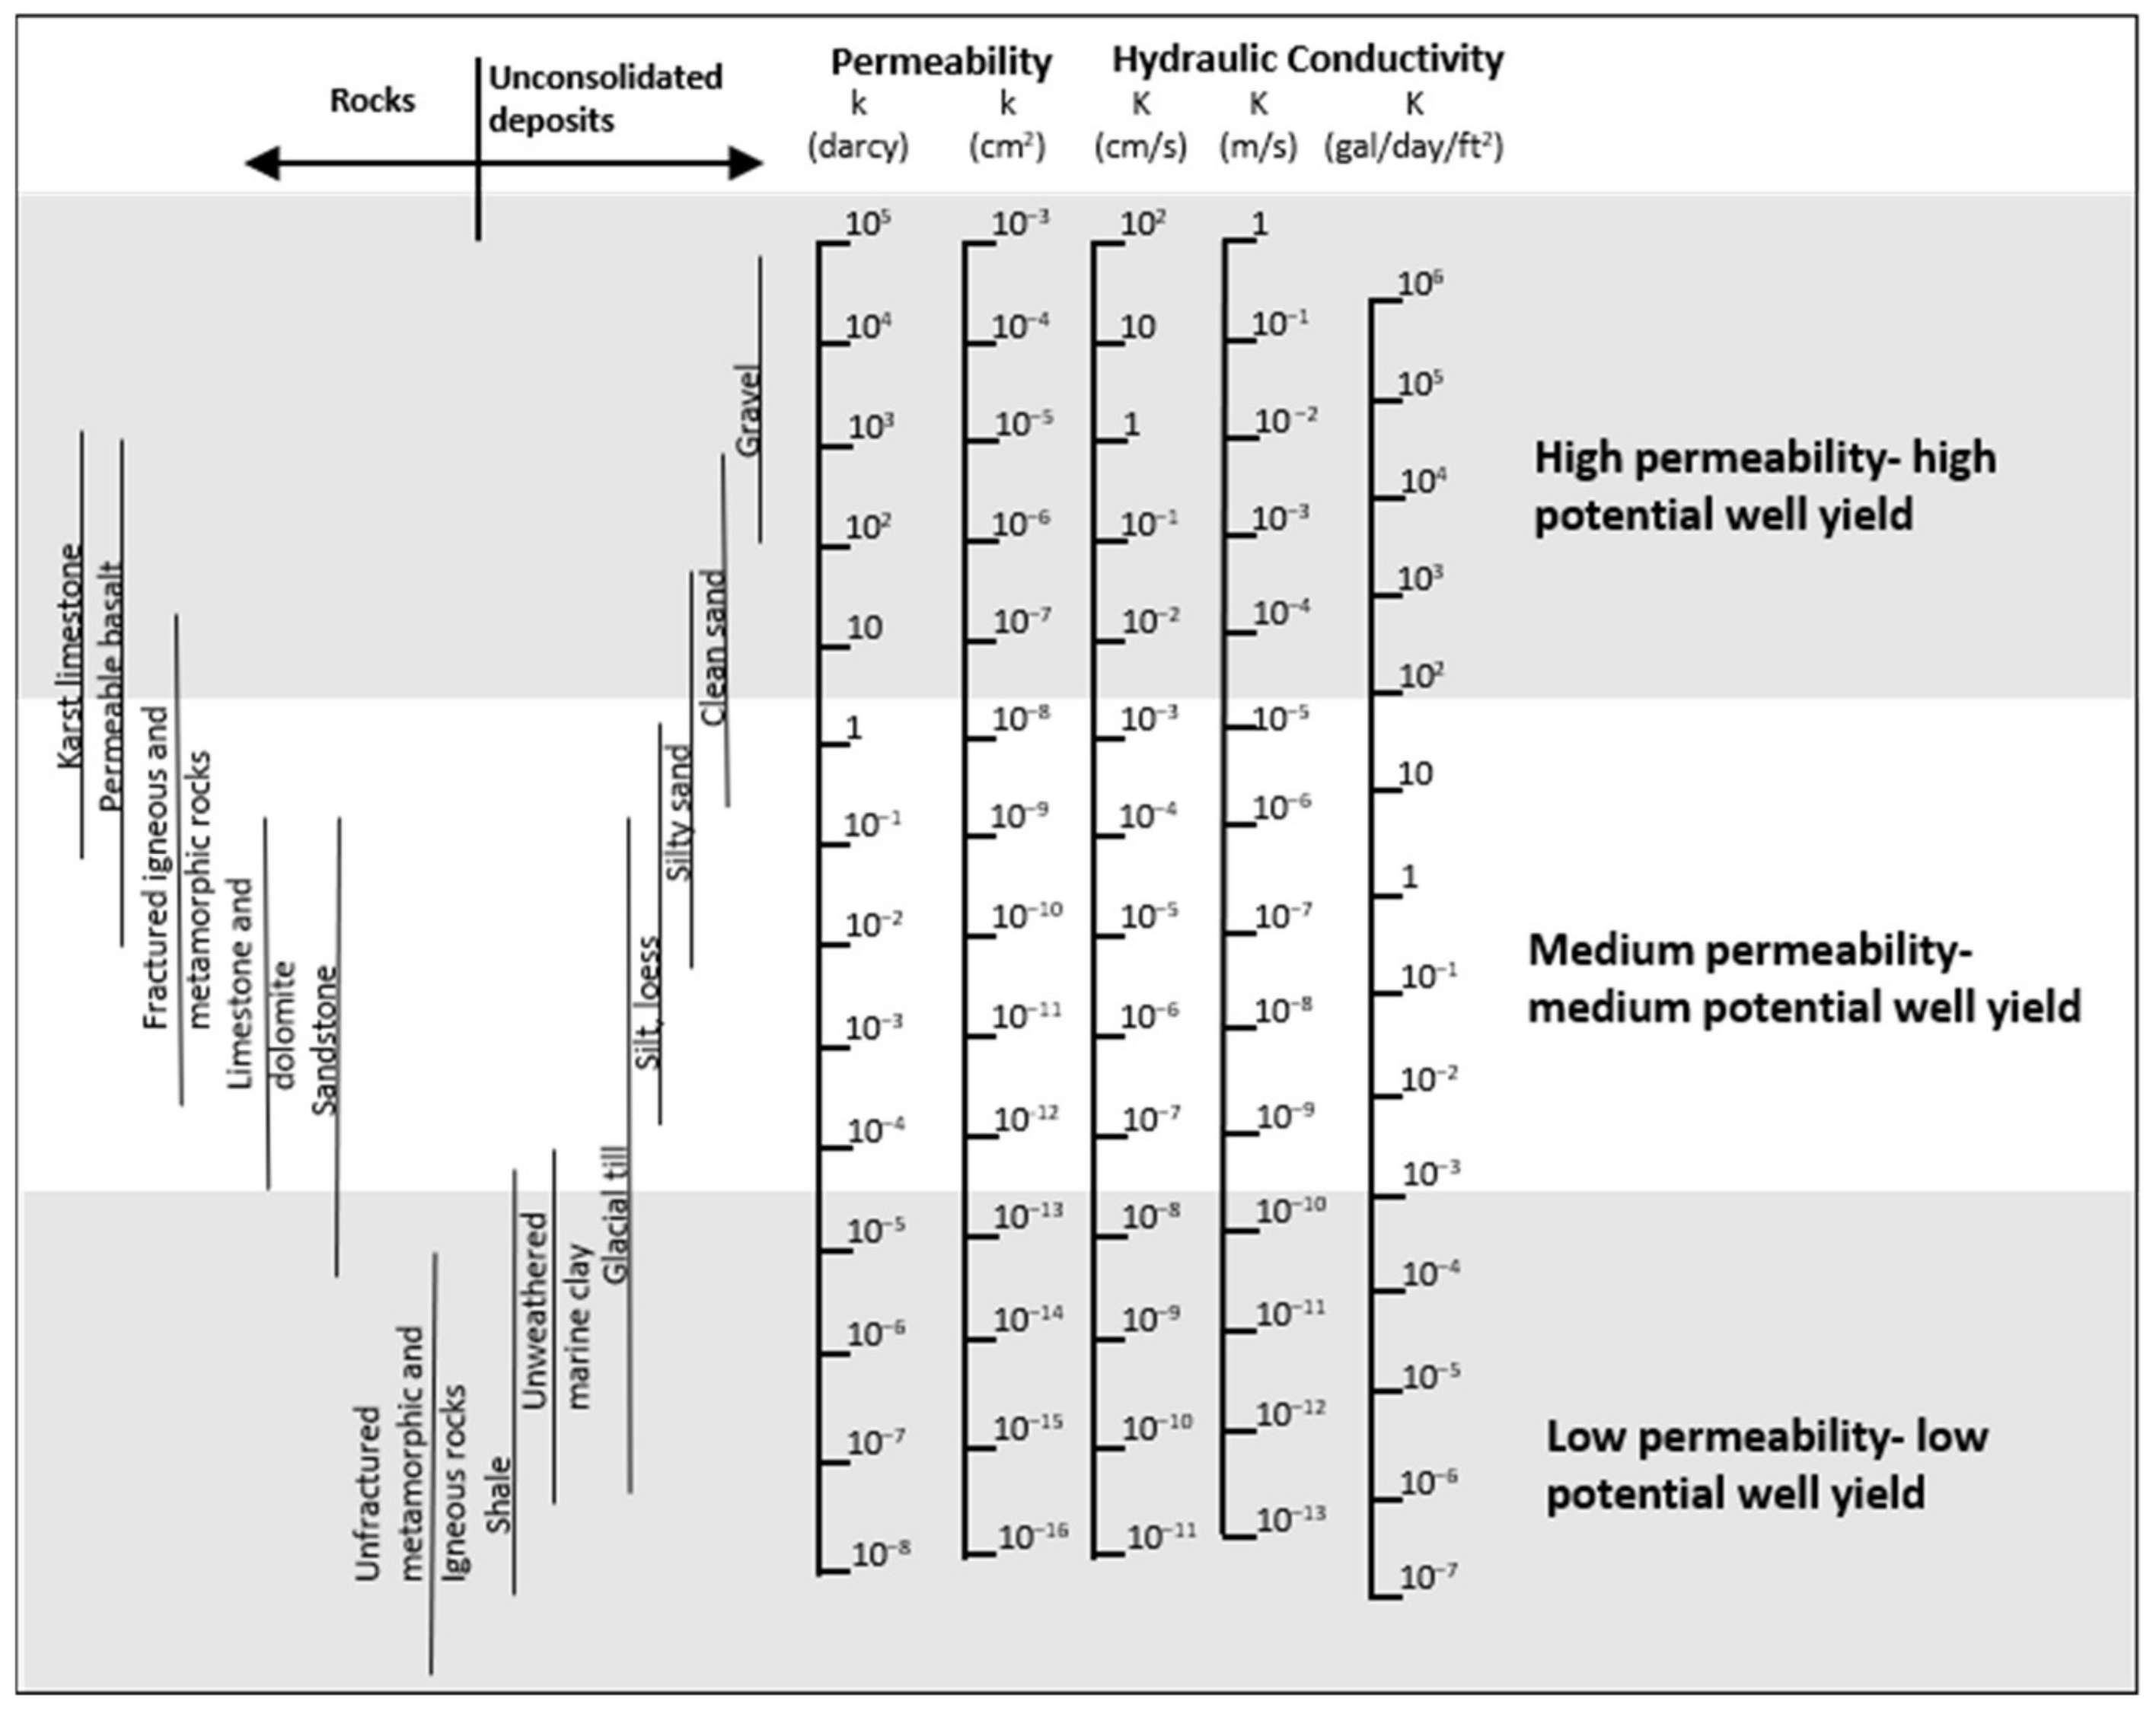
3.3. Hydrological and Hydrogeological Information
4. Results
5. Discussion and Conclusions
Author Contributions
Funding
Institutional Review Board Statement
Informed Consent Statement
Data Availability Statement
Acknowledgments
Conflicts of Interest
References
- Teixeira, J.; Chaminé, H.I.; Marques, J.E.; Gomes, A.; Carvalho, J.M.; Albertí, A.P.; Rocha, F.T. Integrated approach of hydrogeomorphology and gis mapping to the evaluation of ground water resources: An example from the hydro-mineral system of caldas da cavaca, nw portugal. In Proceedings of the 33rd International Geological Congress, Oslo, Norway, 6–14 August 2008 . [Google Scholar]
- Fetter, C.W. Applied Hydrogeology; Pearson: London, UK, 2000. [Google Scholar]
- Freeze, R.A.; Cherry, J.A. Groundwater; Prentice-Hall: Hoboken, NJ, USA, 1979. [Google Scholar]
- Surrette, M.; Allen, D.M.; Journeay, M. Regional evaluation of hydraulic properties in variably fractured rock using a hydrostructural domain approach. Hydrogeol. J. 2007, 16, 11. [Google Scholar] [CrossRef]
- Teixeira, J.; Chaminé, H.I.; Carvalho, J.M.; Pérez-Alberti, A.; Rocha, F.T. Hydrogeomorphological mapping as a tool in groundwater exploration. J. Maps 2013, 9, 263–273. [Google Scholar] [CrossRef]
- Gutiérrez Anguamea, G.A. Metodología para la Elaboración del Mapa Hidrogeomorfológico de la Cuenca del Rio Asunción. Master’s Thesis, Universidad de Sonora, Hermosillo, Mexico, 2013. [Google Scholar]
- Gutiérrez Anguamea, G.A.; Minjárez Sosa, J.I.; Oroz Ramos, L.A. Mapa Hidrogeomorfológico del Estado de Sonora; CONAGUA: Hermosillo, Mexico, 2015. [Google Scholar]
- Babar, M. Hydrogeomorphology: Fundamentals, Applications and Techniques; New India Publishing Agency: New Delhi, India, 2005. [Google Scholar]
- Leopold, L.B. Field data: The interface between hydrology and geomorphology, scientific basis of water-resource management. In Studies in Geophysics; The National Academies Press: Cambridge, MA, USA, 1982. [Google Scholar]
- Scheidegger, A.E. Hydrogeomorphology: Review. J. Hydrol. 1973, 20, 193–215. [Google Scholar] [CrossRef]
- Sidle, R.C.; Onda, Y. Hydrogeomorphology: Overview of an emerging science. Hydrol. Processes 2004, 18, 597–602. [Google Scholar] [CrossRef]
- Gregory, K.J. Hydrogeomorphology: How applied should we become? Prog. Phys. Geogr. 2016, 3, 84–101. [Google Scholar] [CrossRef]
- Barrera, F.B.; Borja, C.; Núñez, M.F.; Lama, A. Dinámica hidrogeomorfológica e impacto antrópico en la cuenca del arroyo del partido (NW del Parque Nacional de Doñana, Huelva, España): Evaluación de procesos actuales. Cuatern. Geomorfol. Rev. Soc. Española Geomorfol. Asoc. Española Para Estud. Cuatern. 2009, 23, 45–64. [Google Scholar]
- Arnaud-Fassetta, G.; Cossart, E.; Fort, M. Hydro-geomorphic hazards and impact of man-made structures during the catastrophic flood of June 2000 in the Upper Guil catchment (Queyras, Southern French Alps). Geomorphology 2005, 66, 41–67. [Google Scholar] [CrossRef]
- Verstappen, H.T.; van Zuidam, R.A. The ITC System of Geomorphologic Survey: A Basis for the Evaluation of Natural Resources and Hazards; ITC Publication: Murarrie, Australia, 1981. [Google Scholar]
- Guida, D.; Cuomo, A.; Palmieri, V. Using object-based geomorphometry for hydro-geomorphological analysis in aMediterranean research catchment. Hydrol. Earth Syst. Sci. 2016, 20, 3493–3509. [Google Scholar] [CrossRef] [Green Version]
- Kudrna, K.; Šindelářová, M. Principles of hydrogeomorphology as a basic precondition for solution of territorial structure of unitary system of agricultural, forest and water management zákony hydrogeomorfologie jako základní předpoklad pro řešení teritoriální struktury unitární soustavy zemědělského, lesního a vodního hospodářství. J. Cent. Eur. Agric. 2006, 7, 669–676. [Google Scholar]
- Chaminé, H.I.; Carvalho, J.M.; Teixeira, J.; Freitas, L. Role of hydrogeological mapping in groundwater practice: Back to basics. Eur. Geol. J. 2015, 40, 34–42. [Google Scholar]
- Sanchez, R.; Rodriguez, L. Transboundary Aquifers between Baja California, Sonora and Chihuahua, Mexico, and California, Arizona and New Mexico, United States: Identification and Categorization. Water 2021, 13, 2878. [Google Scholar] [CrossRef]
- IBWC. Joint Report of the Principal Engineers Regarding the Joint Cooperative Process United States-Mexico for the Transboundary Aquifer Assessment Program; International Boundary and Water Comission: El Paso, TX, USA, 2009. [Google Scholar]
- Tapia-Villaseñor, E.M.; Megdal, S.B. The U.S.-Mexico Transboundary Aquifer Assessment Program as a Model for Transborder Groundwater Collaboration. Water 2021, 13, 530. [Google Scholar] [CrossRef]
- Callegary, J.B.; Megdal, S.B.; Tapia Villaseñor, E.M.; Petersen-Perlman, J.D.; Minjárez Sosa, I.; Monreal, R.; Gray, F.; Grijalva Noriega, F. Findings and lessons learned from the assessment of the Mexico-United States transboundary San Pedro and Santa Cruz aquifers: The utility of social science in applied hydrologic research. J. Hydrol. Reg. Stud. 2018, 20, 60–73. [Google Scholar] [CrossRef]
- Petersen-Perlman, J.D.; Albrecht, T.R.; Tapia-Villaseñor, E.M.; Varady, R.G.; Megdal, S.B. Science and Binational Cooperation: Bidirectionality in the Transboundary Aquifer Assessment Program in the Arizona-Sonora Border Region. Water 2021, 13, 2364. [Google Scholar] [CrossRef]
- Callegary, J.B.; Minjarez, I.; Tapia Villaseñor, E.M.; dos Santos, P.; Monreal Saavedra, R.; Grijalva Noriega, F.J.; Scott, C.A.; Megdal, S.B.; Oroz Ramos, L.A.; Rangel Medina, M.; et al. Binational Study of the Transboundary San Pedro Aquifer; International Boundary and Water Comission: El Paso, TX, USA, 2016. [Google Scholar]
- Tapia-Villaseñor, E.M.; Shamir, E.; Megdal, S.B.; Petersen-Perlman, J.D. Impacts of Variable Climate and Effluent Flows on the Transboundary Santa Cruz Aquifer. JAWRA J. Am. Water Resour. Assoc. 2020, 56, 409–430. [Google Scholar] [CrossRef]
- The Nature Conservancy. San Pedro River; The Nature Conservancy: Arlington, VA, USA, 2022. [Google Scholar]
- Minjarez Sosa, I.; Monreal Saavedra, R.; Rangel Medina, M.; Grijalva Noriega, F.; Ochoa Granillo, A.; Tapia Villaseñor, E.M.; Ramírez Días, L.L.; Cirett Galán, S.; Moncada García, G.; Montijo González, A. Actividades Hidrogeológicas en el Acuífero Río San Pedro, Estado de Sonora, Primera Etapa; Universidad de Sonora, CILA, CONAGUA: Hermosillo, Mexico, 2011. [Google Scholar]
- CONAGUA. Actualización de la Disponibilidad Media Anual de Agua en el Acuífero Río San Pedro (2616), Estado de Sonora; Diario Oficial de la Federación: Ciudad de México, Mexico, 2015.
- Instituto Nacional de Estadística y Geografía (INEGI). Censo de Población y Vivienda 2010; INEGI: Ciudad de México, Mexico, 2010; Available online: https://www.inegi.org.mx/programas/ccpv/2010/ (accessed on 30 September 2021).
- Instituto Nacional de Estadística y Geografía (INEGI). Censo de Población y Vivienda 2020; INEGI: Ciudad de México, Mexico, 2020; Available online: https://www.inegi.org.mx/programas/ccpv/2020/ (accessed on 30 September 2021).
- United States Census Bureau. Census Bureau QuickFacts: Sierra Vista City, Arizona—Tucson City, Arizona. 2022. Available online: https://www.census.gov/quickfacts/fact/table/sierravistacityarizona,tucsoncityarizona/BZA210219 (accessed on 30 September 2021).
- CONAGUA. Consulta a la Base de Datos del Registro Público de Derechos de Agua (REPDA). Available online: https://www.gob.mx/conagua/acciones-y-programas/consulta-la-base-de-datos-del-repda (accessed on 12 May 2021).
- Watershed Management Group; City of Sierra, V. A Stormwater Action Plan for Sierra Vista. 2016. Available online: https://verderiver.org/wp-content/uploads/2017/07/stormwater-action-plan-for-sierra-vista.pdf (accessed on 30 September 2021).
- Esri; Maxar; GeoEye; Earthstar Geographics; CNES/Airbus DS; USDA; USGS; AeroGRID; IGN; GIS User Community. World Map. 2021. Available online: https://services.arcgisonline.com/ArcGIS/rest/services/World_Imagery/MapServer (accessed on 30 September 2021).
- Farr, T.G.; Rosen, P.A.; Caro, E.; Crippen, R.; Duren, R.; Hensley, S.; Kobrick, M.; Paller, M.; Rodriguez, E.; Roth, L.; et al. The Shuttle Radar Topography Mission. Rev. Geophys. 2007, 45, RG2004. [Google Scholar] [CrossRef] [Green Version]
- Panizza, M. Environmental Geomorphology. Developments in Earth Surface Processes; Elsevier: Amsterdam, The Netherlands, 1996; Volume 4. [Google Scholar]
- Muñoz Jiménez, J. Paisaje y geosistema, una aproximación desde la geografía física. In Seminario “Paisaje y Medio Ambiente”; Universidad de Valladolid, Secretariado de Publicaciones e Intercambio Editorial: Valladolid, Spain, 1996. [Google Scholar]
- García-Romero, A. An Evaluation of Forest Deterioration in the Disturbed Mountains of Western Mexico City. Mt. Res. Dev. 2002, 22, 270–277. [Google Scholar] [CrossRef]
- Tapia, V.G.; Lopez, B. Mapeo geomorfológico analítico de la porción central de la Cuenca de México: Unidades morfogenéticas a escala 1:100,000. Rev. Mex. Cienc. Geológicas 2002, 19, 50–65. [Google Scholar]
- Lugo Hubp, J. Diccionario Geomorfológico; Instituto de Geografía, Universidad Nacional Autónoma de México: Ciudad de México, Mexico, 1989. [Google Scholar]
- Córdova, C. Cartografía Geomorfológica en Escala Pequeña del Occidente de la República Mexicana. Bachelor’s Thesis, Facultad de Filosofía y Letras, Universidad Autónoma de México, Ciudad de México, Mexico, 1988. [Google Scholar]
- Castany. Tratado Práctico de las Aguas Subterráneas. Primera Parte. Elementos de Hidrología de Superficie; Ed. Omega: Barcelona, Spain, 1971. [Google Scholar]
- Pedroza, V.; Gutierrez, M.; Le Roux, J.; Hernández, E.; Vasquez, J.P. Estudio Comparativo del Coeficiente de Permeabilidad K. Available online: https://biblioteca.sernageomin.cl/opac/DataFiles/14905_v2_pp_238_240.pdf (accessed on 30 September 2021).
- Díaz, E.J.; Contreras, N.M.; Pinto, J.E.; Velandia, F.; Morales, C.J.; Hincapie, G. Evaluación hidrogeológica preliminar de las unidades geológicas de la mesa de los santos, santander. Boletín Geol. 2009, 31, 10. [Google Scholar]
- LeGrand, H. Geology and Ground Water in the Statesville Area; North Carolina Department Conservation Development, Divison Mineral Resources: Raleigh, NC, USA, 1954. [Google Scholar]
- UNESCO. International Legend for Hidrogeological Maps; UNESCO: Paris, France, 1983. [Google Scholar]


| Town | Population |
|---|---|
| Sierra Vista | 45,308 |
| Tombstone | 1209 |
| Naco | 6064 |
| Bisbee | 5203 |
| Cananea | 39,451 |
| Total | 97,235 |
| Legend | Lithostratigraphic Units | Description |
|---|---|---|
 | Precambrian Igneous-Metamorphic Complex | Igneous and metamorphic rocks |
 | Early Paleozoic Sedimentary Unit | Localized outcrops of detrital-carbonate rocks within the Mexican portion of the TSPA |
 | Late Paleozoic Sedimentary Unit | Limestone and sandstone exposed in most topographic highs in the TSPA |
 | Jurassic Felsic Volcano-Sedimentary | Intercalation of volcanic rocks, sandstones, agglomerates, basalt flows, sills, and intermediate composition |
 | Jurassic Intrusive Complex | Intrusive hypabyssal bodies mainly exposed on the U.S. side of the TSPA |
 | Late Jurassic–Early Cretaceous Sedimentary Unit | Conglomerate, sandstone, shale, and limestone from the Bisbee Group |
 | Late Cretaceous Sedimentary Unit (KsVs, Ks) | Sedimentary sequences |
 | Cretaceous–Paleocene Volcano-Sedimentary Unit | Rhyolitic clastic and volcanic rocks |
 | Tertiary–Cretaceous Intrusive Complex | Intrusive felsic rocks |
 | Tertiary Felsic Volcanic Unit | Rhyolitic rocks from the west-central portion of the TSPA |
 | Tertiary Volcano-Sedimentary Unit | Continental rocks, mainly conglomerates with intercalations of sandstone and tuff |
 | Plio–Quaternary Sedimentary Unit | Coarse sediments (gravels and sands) distributed within the center of the TSPA |
 | Alluvium | Gravel, sands, silts, and clay. |
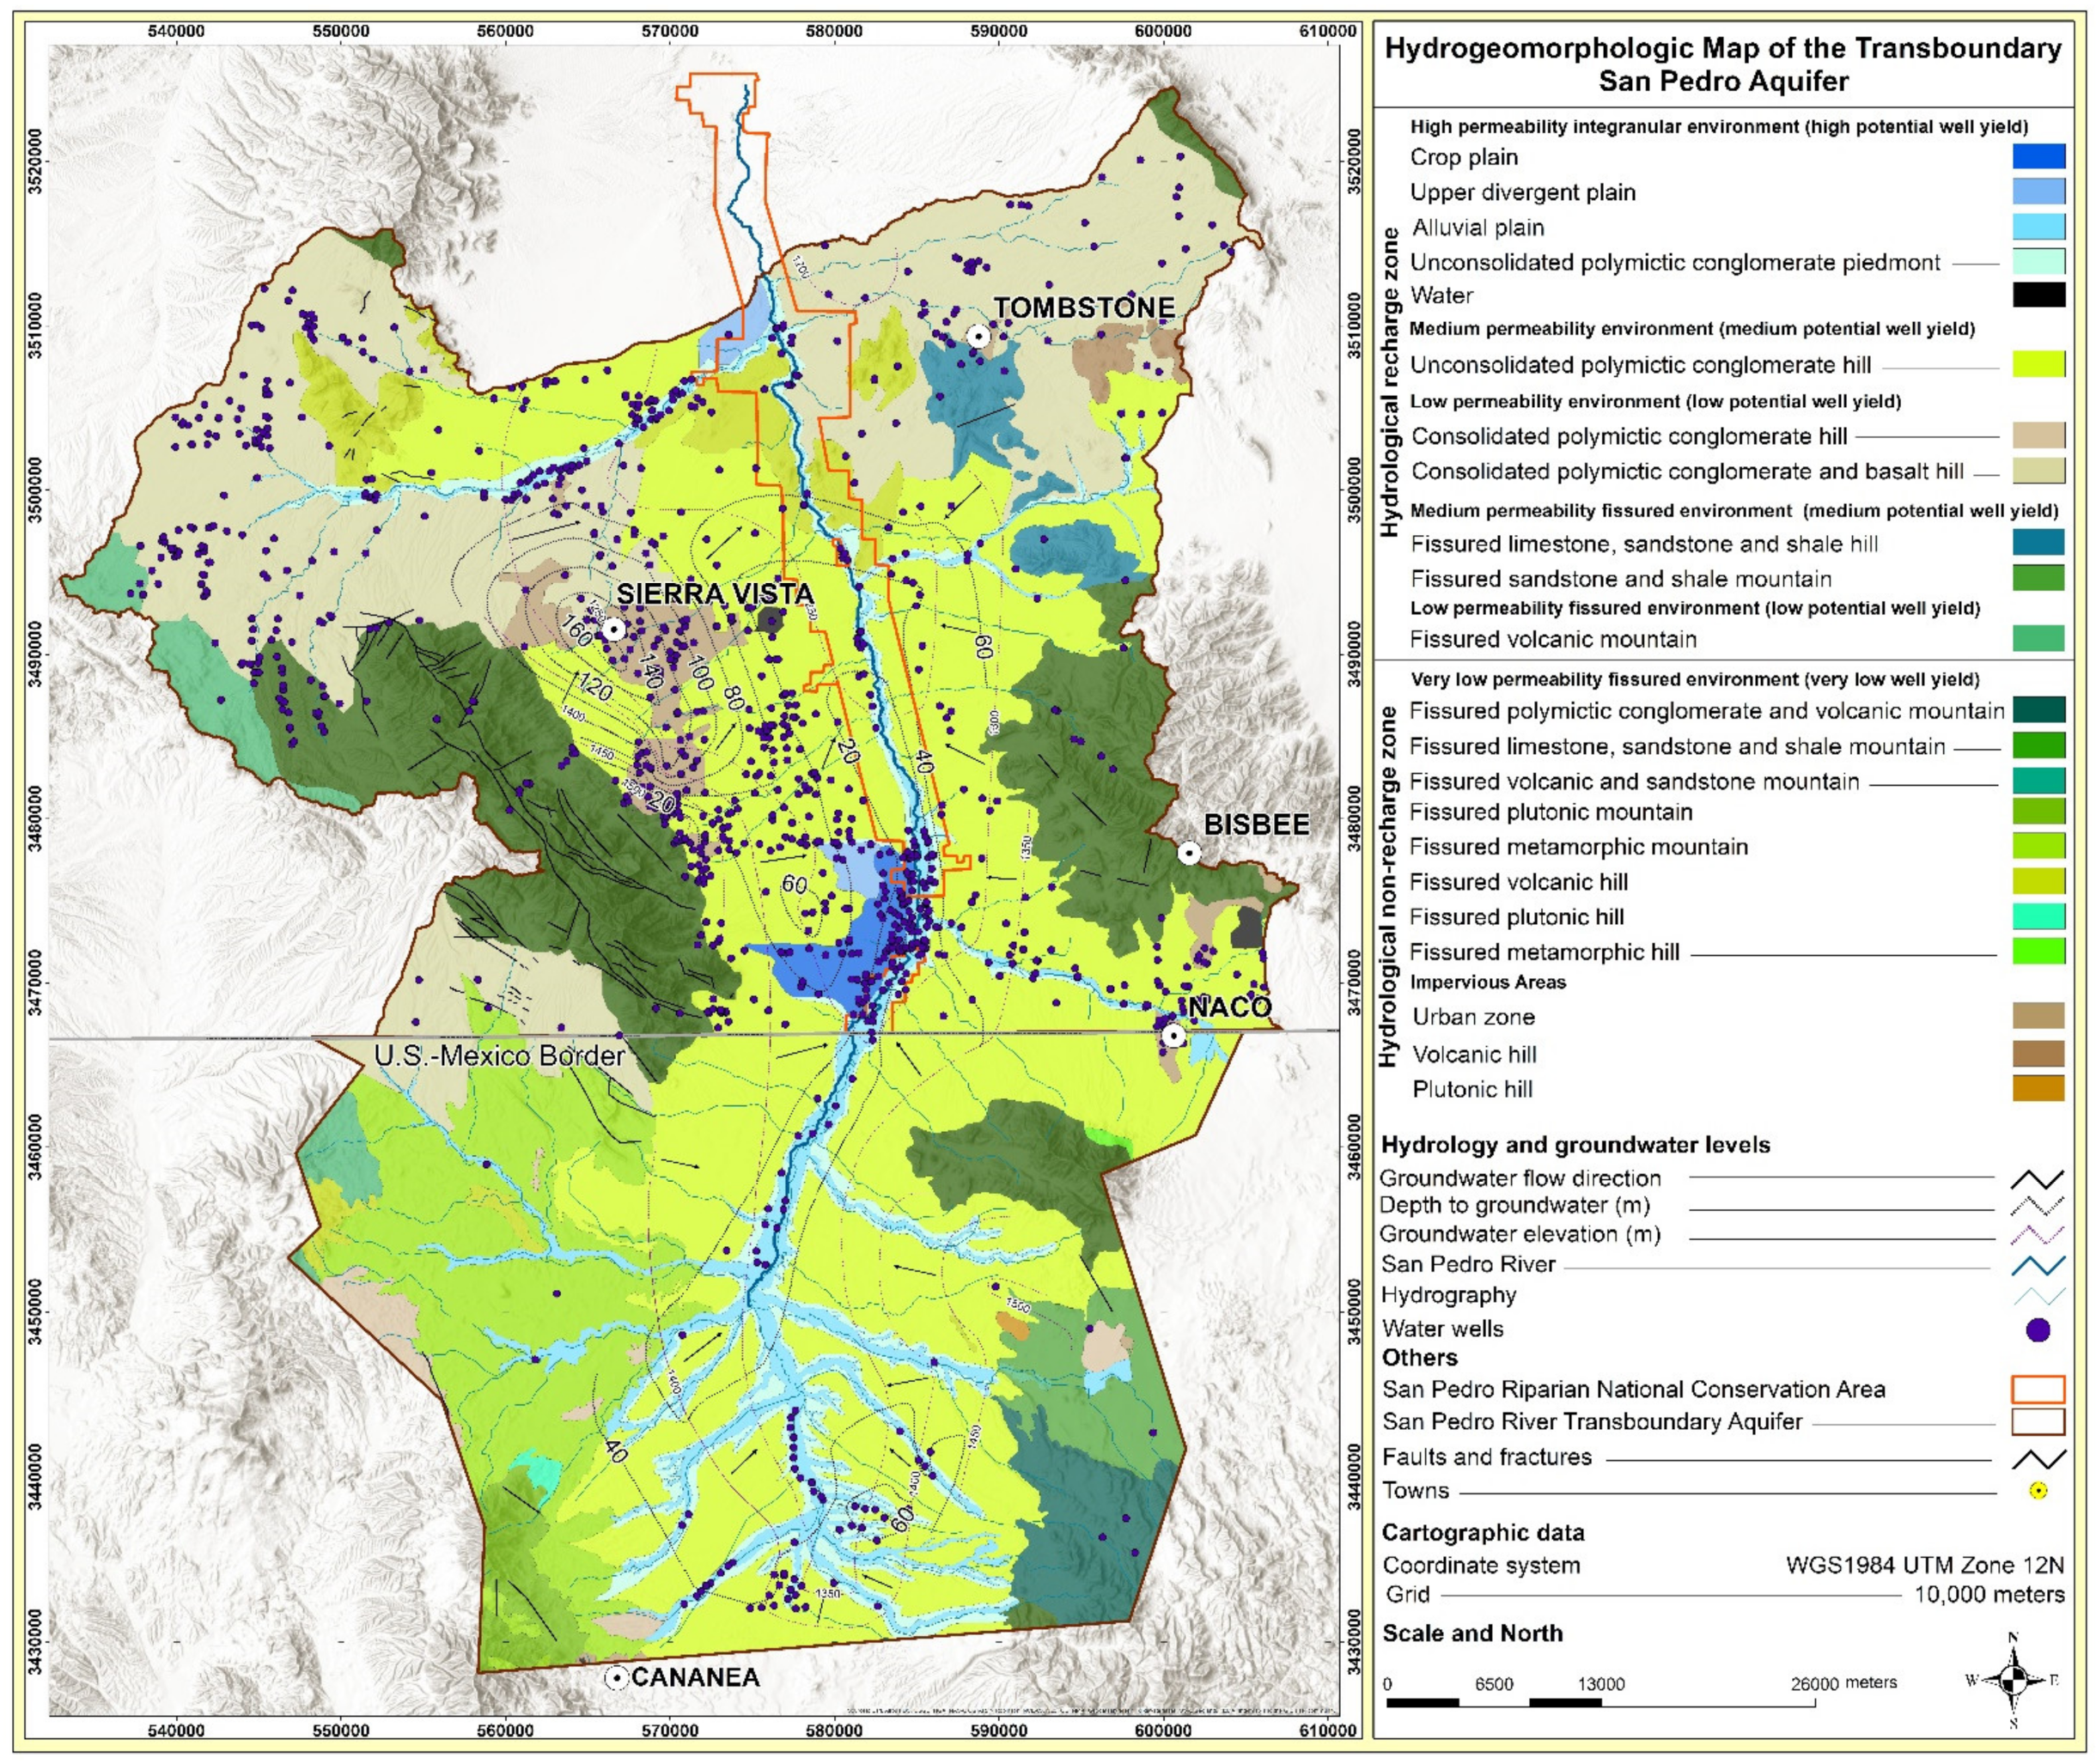
| Recharge/Non-Recharge | Unit | Description |
|---|---|---|
| Discharge Zone | High permeability intergranular environment (high potential well yield) | Crop plain |
| Upper divergent plain | ||
| Alluvial plain | ||
| Unconsolidated polymictic conglomerate piedmont | ||
| Water | ||
| Medium permeability environment (medium potential well yield) | Unconsolidated polymictic conglomerate hill | |
| Low permeability environment (low potential yield) | Consolidated polymictic conglomerate hill | |
| Consolidated polymictic conglomerate and basalt hill | ||
| Recharge Zone | Medium permeability fissured environment (medium potential well yield) | Fissured limestone, sandstone, and shale hill |
| Fissured sandstone and shale mountain | ||
| Low permeability fissured environment (low potential well yield) | Fissured volcanic mountain | |
| Very low permeability fissured environment (very low potential well yield) | Fissured polymictic conglomerate and volcanic mountain | |
| Fissured limestone, sandstone, and shale mountain | ||
| Fissured volcanic and sandstone mountain | ||
| Fissured plutonic mountain | ||
| Fissured metamorphic mountain | ||
| Fissured volcanic hill | ||
| Fissured plutonic hill | ||
| Fissured metamorphic hill | ||
| Impervious Areas | Urban zone | |
| Volcanic hill | ||
| Plutonic hill | ||
Publisher’s Note: MDPI stays neutral with regard to jurisdictional claims in published maps and institutional affiliations. |
© 2022 by the authors. Licensee MDPI, Basel, Switzerland. This article is an open access article distributed under the terms and conditions of the Creative Commons Attribution (CC BY) license (https://creativecommons.org/licenses/by/4.0/).
Share and Cite
Sosa, J.I.M.; Gutiérrez Anguamea, G.A.; Monreal, R.; Grijalva Noriega, F.J.; Tapia-Villaseñor, E.M. Hydrogeomorphologic Mapping of the Transboundary San Pedro Aquifer: A Tool for Groundwater Characterization. Water 2022, 14, 906. https://doi.org/10.3390/w14060906
Sosa JIM, Gutiérrez Anguamea GA, Monreal R, Grijalva Noriega FJ, Tapia-Villaseñor EM. Hydrogeomorphologic Mapping of the Transboundary San Pedro Aquifer: A Tool for Groundwater Characterization. Water. 2022; 14(6):906. https://doi.org/10.3390/w14060906
Chicago/Turabian StyleSosa, José Ismael Minjárez, Grisel Alejandra Gutiérrez Anguamea, Rogelio Monreal, Francisco Javier Grijalva Noriega, and Elia M. Tapia-Villaseñor. 2022. "Hydrogeomorphologic Mapping of the Transboundary San Pedro Aquifer: A Tool for Groundwater Characterization" Water 14, no. 6: 906. https://doi.org/10.3390/w14060906