Article

Spatial Distribution of Ciliate Assemblages in a Shallow Floodplain Lake with an Anaerobic Zone

1
Department of Invertebrate Fauna and Systematics, Schmalhausen Institute of Zoology NAS of Ukraine, 01030 Kyiv, Ukraine
2
Faculty of Technical Systems and Energy Efficient Technologies, Sumy State University, 40007 Sumy, Ukraine
3
Faculty of Natural Sciences and Geography, Sumy Makarenko State Pedagogical University, 40002 Sumy, Ukraine
4
State Institution of Higher Education ‘UzhNU’, Narodna Square, 3, Transcarpathian Region, 88000 Uzhhorod, Ukraine
5
Faculty of Technology Fundamentals, Lublin University of Technology, 20-618 Lublin, Poland
6
Faculty of Environmental Engineering, Lublin University of Technology, 20-618 Lublin, Poland
*
Authors to whom correspondence should be addressed.
Water 2022, 14(6), 898; https://doi.org/10.3390/w14060898
Submission received: 31 December 2021 / Revised: 27 February 2022 / Accepted: 7 March 2022 / Published: 13 March 2022
(This article belongs to the Special Issue Lake Ecology and Restoration)

Abstract

:
The spatial distribution of ciliate assemblages was studied in a shallow floodplain lake with a sharp division of space by oxygen conditions. The surface zone occupied by the “carpet” of Lemna trisulca and L. minor was characterized by a large daily amplitude of oxygen content with periodic exceeding of 100% of saturation; the underlying water layer was characterized by microaerobic conditions throughout most of the year, with seasonal deviations towards oxygen-free conditions (in winter and mid-summer) or increased oxygen content (before freezing and after ice melt); stable oxygen-free conditions were maintained in the bottom layer of water and at the bottom of the lake. There were 111 species of ciliated protozoa recorded in the lake. The ciliated protozoa were clearly structured and formed three almost non-overlapping assemblages in terms of species composition, which retained their isolation during all seasons of the year. On the basis of the analysis performed using the R indicspecies package, species of ciliated protozoa were identified as indicators of conditions with different oxygen regimes, which are determined by the level of organic pollution and the distribution of photosynthetic organisms.

1. Introduction

Changes in the water regime and morphology of rivers in Europe as a result of human activities have led to the loss of their natural seasonal cycles and hydrological characteristics [1,2,3,4,5]. The absence of flooding and economic development of floodplains has not only reduced the number of floodplain reservoirs but also altered the characteristics of their ecosystem. One of the consequences of disrupting the regular connection of floodplain reservoirs to the river channel is the degradation of their biodiversity [6,7]. In floodplain lakes that have lost their connection with the river channel for a long time due to its regulation, stable stratification is formed, oxygen deficiency is observed in the bottom water layers, whereas siltation and shoaling processes are progressing. The consequence of siltation and stratification is the development of persistent anaerobic processes in floodplain lakes, resulting in further reduction of diversity [7,8,9]. At the same time, floodplain lakes with persistent anaerobic bottom sediments (sapropel) become a source of greenhouse gases, primarily CO2, methane, and also hydrogen sulfide [10,11,12,13]. Ultimately, such bodies of water not only lose their essential function of maintaining the biodiversity of the river ecosystem but also become an additional source of atmospheric pollution. The production of greenhouse gases is mainly associated with the functioning of microorganisms from anaerobic bottom sediments, that is, sapropel, in such water bodies [13,14,15]. The assemblages of ciliated protozoa are very specific in such lakes; in freshwater ecosystems, they are represented by a significant number of species, including anaerobic ones [16,17,18]. The composition of ciliated protozoan assemblages in different habitats is influenced by water chemistry, nutrient availability [19,20,21,22], and especially by oxygen concentration and its dynamics [23,24,25]. Ciliated protozoa play an important role in the aquatic ecosystem as consumers of bacteria, flagellates, and periphytic algae, keeping most bacteria in an exponential growth phase [26,27].
At the same time, shallow lakes with significant anaerobic zones usually lose a significant part of the animals intolerant to oxygen-free or micro-oxygenated conditions. As a rule, there are no fish and the diversity of invertebrates is extremely low. In such a situation, the problem of assessing the quality of the aquatic environment arises. Usually, the assessment of the aquatic environment involves information on fish, macrophytes, phytobenthos, phytoplankton, and macroinvertebrates [28]. At the same time, most of the above-mentioned groups cannot be fully developed in the water bodies of the above-mentioned type, which puts them out of brackets when assessing the quality of the aquatic environment in such reservoirs. Such water bodies are simultaneously an important component of river ecosystems.
The aim of this work was to describe the results of studies of the spatial distribution of ciliate protozoa assemblages under the conditions of a shallow floodplain lake and the relationship of this distribution with oxygen gradients existing in different parts of the lake volume. An attempt was made to estimate the quality of the environment on the basis of indicator ciliate species responding to the oxygen content. In the future, this can be used for the bioindication of the trophic status of water bodies and become a useful tool for clarifying the assessment of water quality in water bodies of various types, especially with stable anaerobic conditions.

2. Materials and Methods
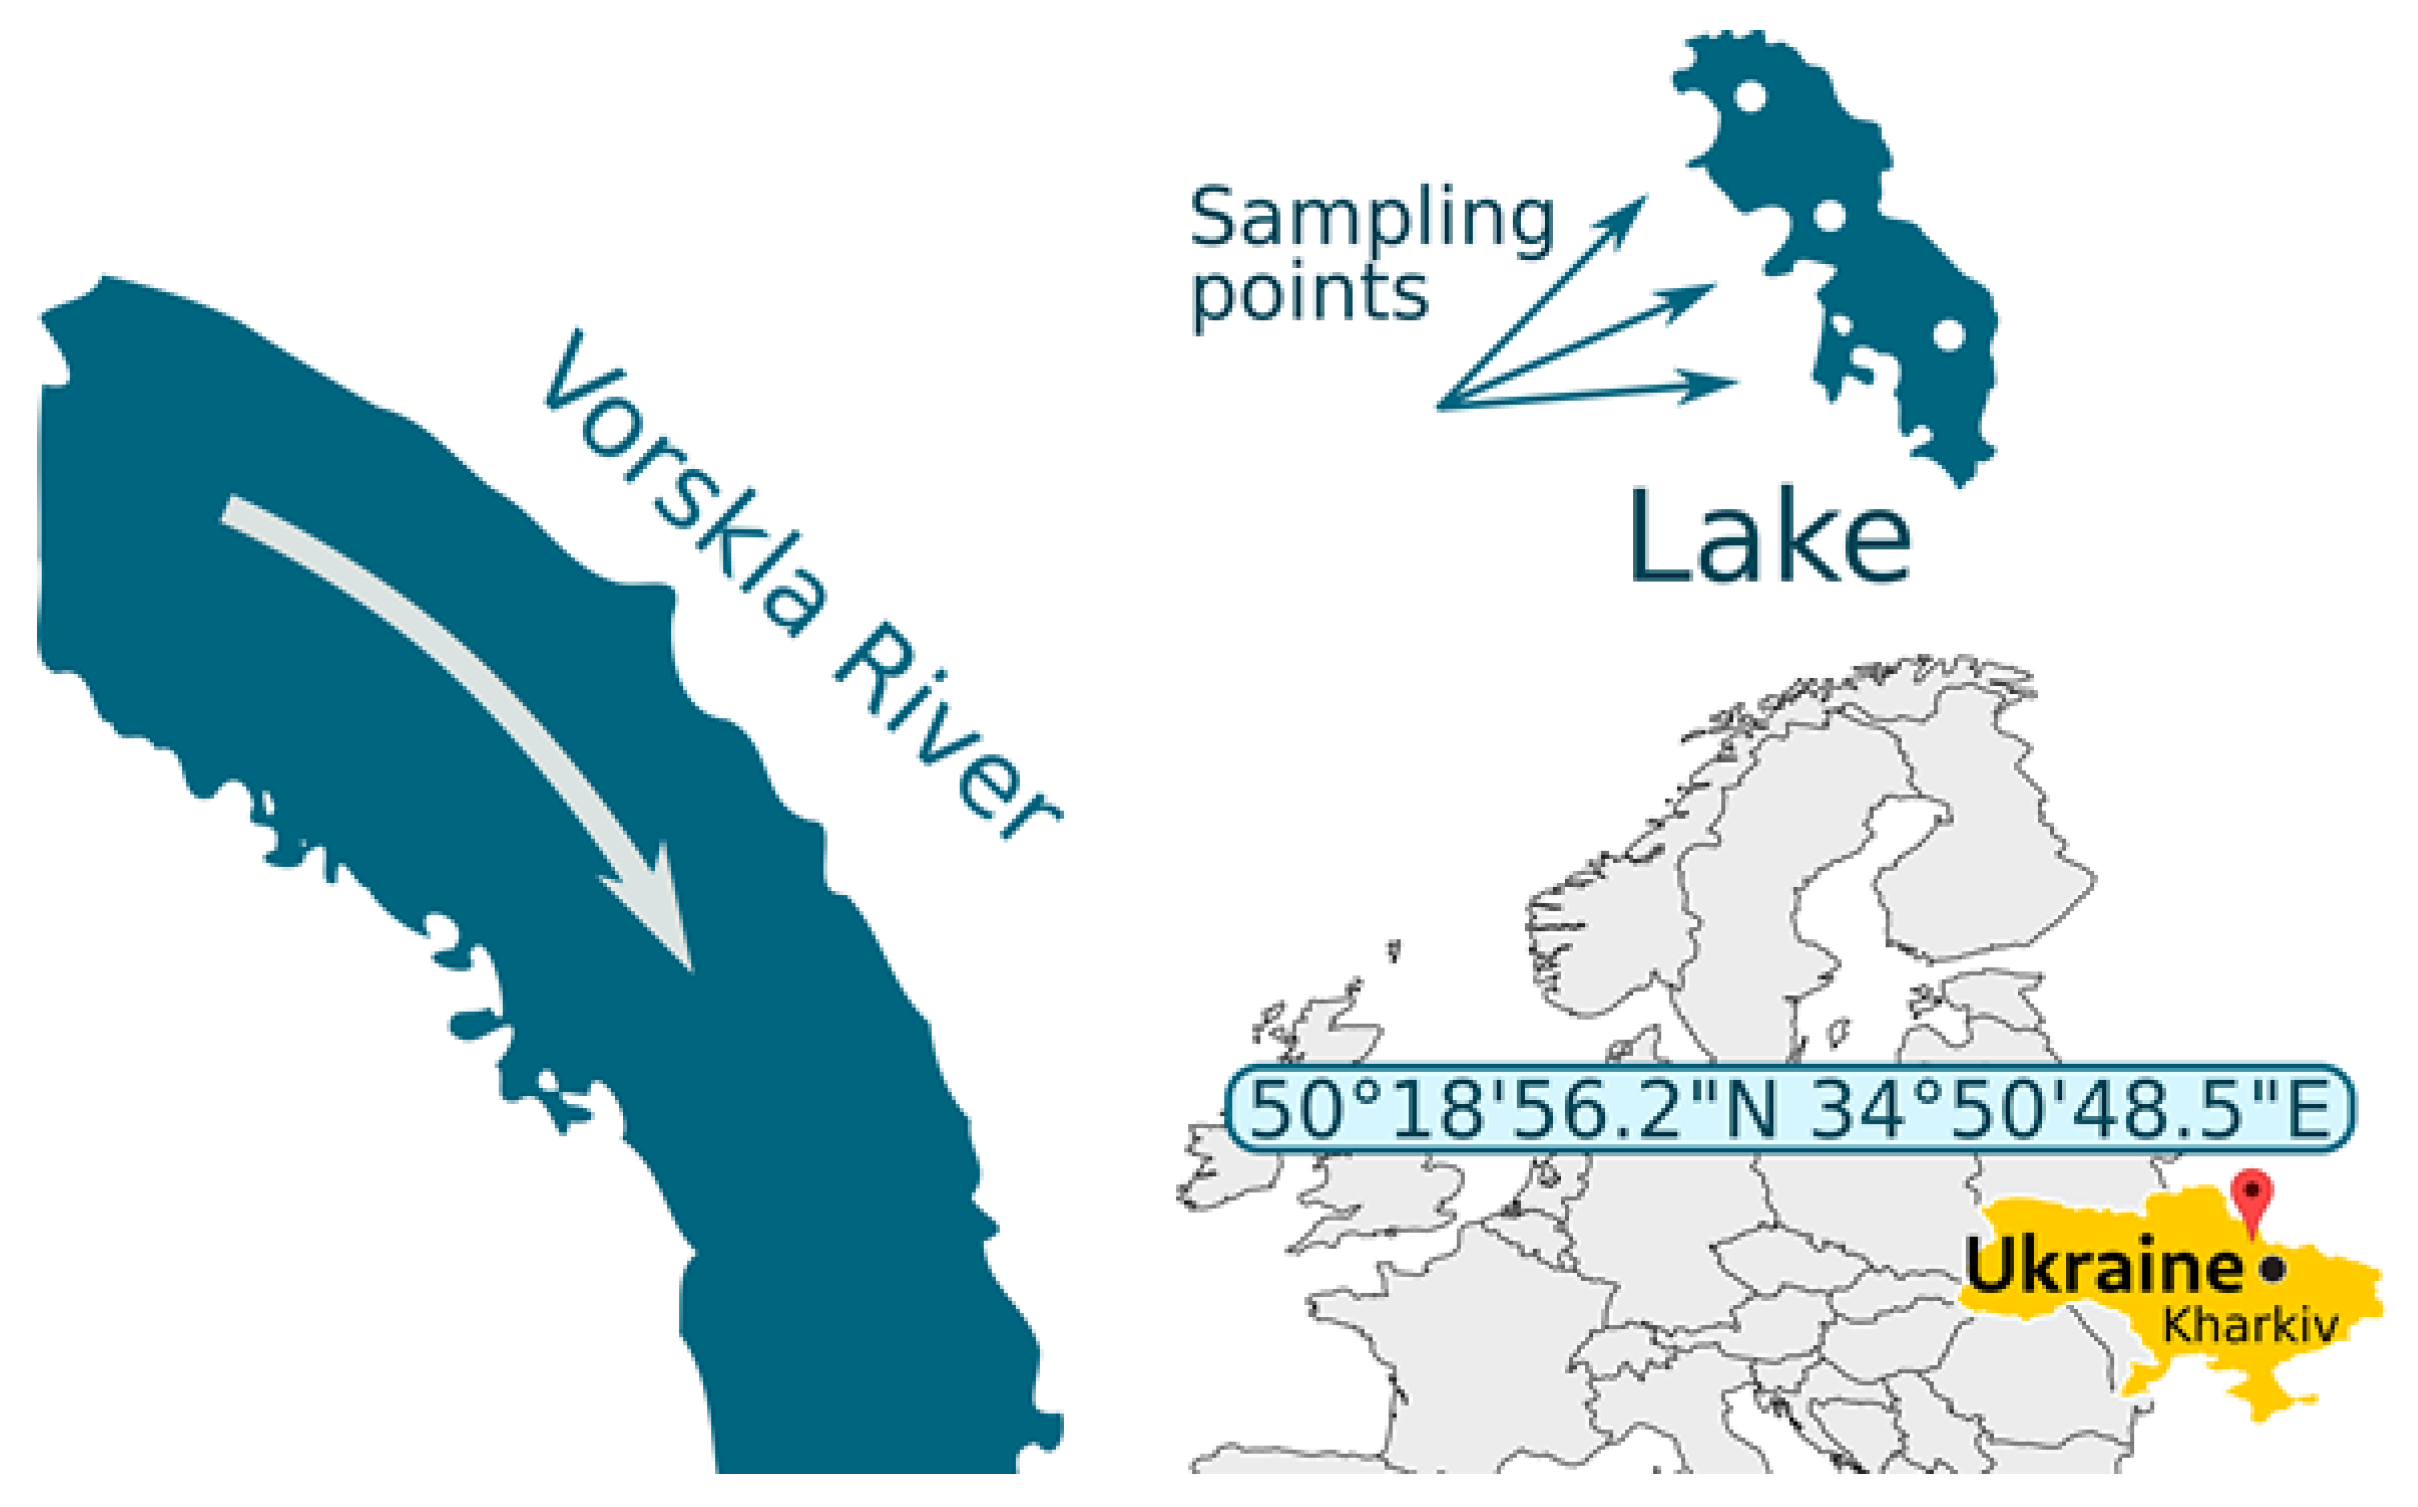
2.1. Study Area

The floodplain lake, which is located on the left bank of the Vorskla River in the Sumy Region (Ukraine) near Okhtyrka town, was studied for a year (Figure 1).
By origin, the lake is a fragment of the old Vorskla river bed. This fragment of the channel has existed as a lake for over 70 years. In the mid-20th century, this lake received wastewater, which significantly increased its trophic status. Currently, the lake receives no runoff, but its trophic status remains high. Table 1 shows the morphometric characteristics of the lake. The lake is located at a distance of about 200 m from the main river channel. In summer, it does not dry up despite its shallow depth; in dry periods, the depth may decrease to 1 m. The surface of the lake is almost completely covered by a 10–15 cm thick “carpet of duckweed” of Lemna trisulca L. with a small amount of Lemna minor L. Some physical and chemical characteristics of the habitats in the lake are summarized in Table 2.

2.2. Habitats

Despite the shallow depth, there is a sharp division of habitats in the lake by temperature and oxygen regime.
The surface layer of duckweed is stable during most of the year—from April to December; during winter, some of the duckweed sink to the bottom and some are frozen into the ice. In this layer, the temperature and oxygen regime are characterized by greater seasonal and daily range as compared to the underlying layers. The oxygen content in the daytime can exceed 100% of the saturation.
In the water column, the dissolved oxygen content varies between the duckweed layer and the bottom, but the conditions remained microaerobic most of the time. During the period when the lake is covered by a layer of duckweed, the oxygen content here is 0–2 mg/L. Here, an increase in the oxygen content is observed before and after the establishment of ice cover (at the beginning of winter and spring—during these two relatively short intervals the water surface is free from the cover formed by a layer of Lemna in summer and by a layer of ice in winter). For the period of ice cover, anoxia encompasses the entire water column in the lake.
The sapropel layer is steadily retained from the bottom at a height of 1 m, where stable anaerobic conditions are preserved throughout the year.

2.3. Data Collection and Sample Processing

Temperature and O2 content were measured using a HACH HQ40d portable multimeter. The measurements were carried out in situ in steps from the bottom, every 0.2 m, which allowed establishing the zone of delimitation of oxygen-and oxygen-free water layers.
The samples for ciliate counting were taken during the one-year period from September to September once a month. In three points of the lake, samples were taken in each of the habitat types: plants, water layer under plants, and bottom sediments, that is, sapropel. After processing, data from these three sampling points were averaged (Figure 1). The samples from the water column were taken with a 1-L Ruttner barometer. The bottom samples were taken with a microbentometer [29].
The samples of sapropel were taken so that the tank was filled to the top and there was no air layer between the lid and the sample. The plant samples were taken with glass cylinders. The cylinder was dipped into Lemna trisulca thickets, plants were carefully pushed inside the cylinder with tweezers, and then the cylinder was closed on both sides with plugs [25]. In the laboratory, the samples were stored in the refrigerator at +5 °C before and during processing. The tanks with anaerobic samples were opened only during sampling for microscopy. The water samples containing dissolved oxygen and plant samples were stored with the lid open. The samples were processed within a few hours after sampling.
The samples from the oxygen-containing layer of water and sapropel were processed in a 1-mL counting chamber at magnifications ×28 and ×56. Five to seven mL samples were treated successively. The plant samples were treated in two steps. Sessile forms of ciliates on the surface of 5 fragments of Lemna trisulca and Lemna minor were counted in filtered water in a Petri dish. In order to count the free-swimming forms, the sample was stirred with a glass rod in a beaker and after stirring, 1 mL of water was taken with an automatic pipette. Ciliates were counted in 5–7 sub-samples of 1 mL in a counting chamber.
Each time before the beginning of quantitative studies, the species composition of ciliated protozoa was studied. Preliminary samples were taken in each habitat and in vivo species identification was performed using an Olympus CX41 microscope in transmitted light, as well as using dark-field and phase contrast methods. The identification of ciliated protozoa is based on cell shape, peculiarities of the ciliary apparatus structure, macronucleus morphology, position of contractile vacuoles, number of pellicular striae (for Vorticella spp.), and a number of other characters. Modern microscopic techniques offer good opportunities for species identification. In order to facilitate visual identification, protozoa were placed in a solution of oxyprolcellulose, which significantly slows down their movement and allows us to see the peculiarities of their structure. This slowing down of the velocity of movement allows a good view of the essential details of the structure and location of the ciliary apparatus (Figure 2a) and the shape and position of the macronucleus (Figure 2b). In cases where the macronucleus was not visible in transmitted light (Figure 3a), the phase contrast method was used (Figure 3b). In those rare cases when macronuclei were not manifested, they were stained with methylene green, and silver staining techniques were used to demonstrate infraciliature (ciliary pattern) and the silverline system (lines revealed by silver nitrate, connecting basal bodies and other cortical organelles) (Figure 4a,b) [30]. Species (morphospecies) identification was based on Foissner and Berger [18], Foissner et al. [31,32,33,34], Jankowski [35], Kahl [36,37,38,39], and others.
Protozoa were counted under an Opta-Tech binocular loupe in a modified Bogorov’s counting chamber in which a 1 mL sub-sample was placed. Due to the sinuous shape of the chamber groove, 1 mL of the sub-sample was distributed into eight compartments (Figure 5). When viewing the sub-sample at low magnification (×28 to ×56), the researcher sees the entire width of the sulcus, and the depth of field allows covering the entire volume of the sub-sample part within the field of view. The sequential processing of individual camera compartments avoids double counting.

2.4. Statistical Analysis

The data on the aquatic plant species were processed using R 4.1.2 “Bird Hippie” version [40] with the tidyverse package [41]; t-SNE [42,43] was performed using the Rtsne package [44], whereas nonmetric multidimensional scaling (NMDS) was performed using the metaMds function from the vegan package [45]. Indicator species search for biotopes and oxygen conditions was carried out using the indicspacies package [46]. The method combines the species relative abundance (specificity) with the relative frequency of occurrence (fidelity) of the species in different habitats. The indicator values arrange the species in groups and give them indicator values between 0 and 1. Shannon’s and Simpson’s indices were calculated using the BiodiversityR package [47].

3. Results

As a result of studies of ciliated protozoa in the floodplain lake, 111 species from 81 genera, 24 orders and 11 classes were found according to Lynn guide [48].
Among morphological groups—swimming, crawling, and attached—the swimming forms prevailed with 63 species. The crawling forms were somewhat less diverse (26 species) and the least number of species was observed for attached forms (5 species). Representatives of Armophorea from genera Caenomorpha, Ludio, Brachonella, Metopus and representatives of Plagiopylea from genera Plagiopyla, Discomorphella, Epalxella, Pelodinium, Saprodinium were separated into special morphogroup—spiral forms (17 species).
According to the division of ciliated protozoa into ecological (behavioral) groups, 10 oxyphilic species, 11 euryoxyphilic species, 28 microoxyphilic species were identified in the lake, 21 anoxyphilic or anaerobic, and 6 species that reach higher densities under activated sludge conditions than in natural habitats—“activated sludge species” [25,49]. For 35 of the recorded species, ecological priorities have not been determined yet.
Under the conditions of oxygen-free sediments, 47 species of ciliates were detected during the entire study period. The maximum number of species was observed in autumn (31 species) and the minimum in spring (13 species). In winter and summer, 20 and 21 species were recorded, respectively.
Under the conditions of free water with micro-oxygenated conditions, bordering on one side with sapropel, and on the other side with a layer of duckweed, a total of 52 species were detected, the maximum number (28 species) in autumn, and the minimum number in spring (9 species). In winter and summer, 23 and 18 species were recorded, respectively.
Among plants, in contrast to other habitats, the number of species changed insignificantly during the whole vegetation period, from spring to autumn (spring: 33 species, summer: 30 species, autumn: 36 species). The number of species decreased significantly in winter (12 species), when the duckweed layer was destroyed and most of the duckweed was lowered to the bottom, and some was frozen into the ice. The total number of species detected under the conditions of the layer of duckweed during the study period amounted to 68.
Figure 6 shows the t-SNE based on the quantitative representation of positions of the studied habitats. The sapropel samples form a distinct group and do not overlap with the samples from the water column and vegetation.
Figure 7 presents the t-SNE of distribution of ciliates in the gradient of O2 content—from its complete absence to hyperaerobic conditions—giving a picture of positioning of habitats. As can be seen from the diagram, two types of conditions: anaerobic, observed in sapropel, and hyperaerobic, among plants, are clearly separated. The aerobic and microaerobic conditions, observed in the layer of water between the sapropel and plants, did not stand out as a special group and are positioned as an intermediate group between sapropel and plants.
Thus, the distribution of ciliated species in the lake volume gives a fairly good idea of the division of the water body hyperspace into zones (Figure 6). It is well noticeable that the micro-oxygenated zone overlaps with the macrophytes and sapropel zones. At the same time, the overlap with the plant zone is greater, which can be explained by the presence of oxygen in the water layer under the plants. The positioning of samples according to oxygen conditions also does not show the water layer as a separate group. The points corresponding to water were located in the zone between the sapropel and plants (Figure 7).
The distribution of species with different ecological priorities on the diagram (Figure 8) looks rather disordered. The species with different ecomorphological characteristics do not form separate groups but form rather a continuum in the oxygen gradient. However, there is a tendency for the species from the microoxyphilic group to be broadly positioned throughout the diagram, while euryoxyphiles and anaerobes are located in different parts of the diagram.
The data on the abundance of more than 100 species of ciliate protozoa, some of which have unspecified ecological priorities, can give insufficiently pronounced separation of samples by habitat types. It is generally accepted to identify indicator species that have pronounced preferences with respect to habitats and/or environmental conditions. Using the indicspecies package, the species whose preferences correspond to three habitats: sapropel, water, and aquatic plants were found and shown in Table 3. As might be expected, the indicators of microoxyphilic conditions were not numerous, since this habitat has rather blurred boundaries, judging by the ciliates present in it. However, the fact of their presence is important because it informs about the existence of ciliate protozoa characteristic of it.
Figure 9 shows the t-SNE habitats on the basis of indicator species of ciliated protozoa. As can be seen, the indicators rather confidently confirm the presence of three habitats; the water column looks like a link between the sapropel and plants. The clear separation of plants and sapropel is associated with the contrast in the content of dissolved oxygen: its absence in the sapropel and its periodic oversaturation in the water surrounding the plants. The intermediate position of water samples is also understandable, because here too the limiting factor is O2, and the ciliates of this habitat, regardless of the degree of tolerance to the content of oxygen, is breathing oxygen.
An analysis of the species composition and density of ciliated populations using the NMDS method shows the separation of habitats even more clearly. As can be seen from Figure 10, in the oxygen gradient, the habitats and species were positioned as three rather separate groups. The first group on the left is located in the oxygen-free zone, which can be seen from its position relative to the oxygen concentration isolines. The group of species and the area of plant habitat are predominant in the area with an oxygen content higher than 8 mg/L. Most species whose priority habitat is the oxygen-containing water column were located within concentrations O2 of 2–5 mg/L. Thus, Figure 10 provides information on species preferences for both habitats and water oxygen concentrations.
Figure 11 is similar to the previous one, with the difference that it only shows the position of the indicator species that were selected. It allows seeing more clearly the position of exactly these species with respect to both habitats and oxygen conditions. It should be noted that although the conditions in the layer of water between plants and sapropel were predominantly microaerobic, with O2 concentrations around 2 mg/L, the indicator species of this habitat have a wider range of tolerance to oxygen content, from 2 to 5 mg/L.

4. Discussion

One of the probable directions of events during eutrophication of water bodies, primarily of the lentic type, may be the formation of anaerobic bottom sediments—sapropel and stratification of the water body by oxygen conditions. One of the scenarios of anaerobic processes development can be the situation described in this article. At the same time, it is almost impossible to assess the water quality according to the protocols of the Water Framework Directive, relying on such indicators as macrophytes, phytoplankton and phytobenthos, macrobenthos and fish [28], and the question of how to implement it remains open.
Simultaneously, in such water bodies, there is a complexly organized assemblage of ciliated protozoa and, what is especially important, under both aerobic and anaerobic conditions. Consequently, the diversity and quantitative development of ciliated protozoa can be an important indicator not only of the presence of anoxia zones but taking into account all the species present, can be part of the indication system. However, it must be recognized that protozoa are proven good indicators of aquatic quality [31,32,33,34,50,51,52]. Prior to the second half of the 20th century, however, anaerobic metabolism was not as extensively studied as it is now [17,53,54]. For this reason, the saprobic systems did not emphasize anaerobic species [55,56]. Foissner’s works mention anaerobic species among the indicators of the polysaprobic zone [31,32,33,34]. However, with this approach, anaerobic species appear to be indicators of high pollution levels, while their development is not related to pollution as such, but to stable anaerobic conditions in which another type of biochemical process is realized. This makes the assessment of the quality of the aquatic environment on the basis of oxygen-consuming organisms, as indicators of trophicity, insufficient and requires enhancement taking into account the presence of anaerobic zones. The use of protozoa as indicators was considered as a very promising direction of bioindication of aquatic ecosystems, since protozoa are represented by the widest variety of species and communities, covering the whole range of conditions in water bodies, including oxygen-free zones.
In the studied lake, unusually sharp differences were observed between oxygen-containing and oxygen-free zones, which was caused by a significant volume of the sapropel layer. Taking into account the depth of the lake not exceeding 1.4 m, the sapropel layer was from 1 m to 1.1 m. In the near-surface layer of water, occupied mainly by submerged plants of Lemna trisulca, the oxygen content varied within significant limits, and in the day time its concentration could significantly exceed 100% of physical saturation. The layer of water between the oxygen-free layer and the layer of floating plants was insignificant, and the oxygen content ranged from 0 to 2 mg/L. The distribution of protozoa under these conditions is of considerable interest, as species with different ecological preferences are forced to position themselves under the conditions of contrasting oxygen distribution, unambiguously determining their priorities. First of all, it should be noted that based on the quantitative and qualitative composition of ciliates, the lake volume was reliably divided into two habitats those with dissolved oxygen, water among plants and oxygen-free, sapropel.
NMDS confidently divided the habitats into three distinct areas corresponding to sapropel, plants, and the layer of water between them (Figure 10). It can be seen that the protozoan splits into two assemblages, which are grouped under anaerobic and aerobic conditions.
Under anoxic conditions (sapropel) and among plants, the rank-abundance dominance curves are best described by Zipf’s law model, which can be seen from the values of the Akaike information criterion (AIC) (Figure 12a,b). According to Su 2018 [57], who analyzed about 20,000 species abundance distributions (SADs) in both aquatic and terrestrial ecosystems, the overall distribution pattern in almost all cases approximately follows Zipf’s law. Thus, the SADs in sapropel and plants fit this typical pattern.
The number of species oriented to microaerobic conditions is limited. The specificity of conditions between the duckweed layer and the sapropel is also reflected in the character of SAD (Figure 13). Here, SAD best fits the “Pre-emption” model, also known as geometric series or Motomura model. It is believed that this type of distribution is characteristic of species-poor habitats, in which species exist under unstable conditions. This quite objectively reflects the situation in the water layer between floating plants and sapropel in the considered case.
The presence of well-defined factor preferences in many species allowed identifying a number of indicators, the presence of which reflects the dynamic stability of oxygen conditions along the vertical of the lake. As one would expect, the minimum number of indicator species was identified for microaerobic conditions.
The development of protozoa under conditions of lake hypertrophy and formation of anaerobic zones becomes the only promising indicator in terms of assessing the state of the aquatic environment, which allows making evaluative judgments about the situation. Moreover, with their help, the degree of anaerobic processes development and water quality in the aerobic layers of the reservoir can be assessed using the same scale based on the indicator species of protozoa and their quantitative development in the continuum of oxygen and oxygen-free conditions.
The scale based on the indicator species of protozoa can be a supplement to the standard system of assessing the quality of aquatic environments focused on water bodies with aerobic conditions, since protozoa, unlike meso- and macro-forms, are present in the entire space of water bodies as a continuous series of ecomorphs. Under anaerobic zones formed in high-trophic water bodies, the use of protozoa as indicators becomes the most adequate solution to the problem of assessing the quality of the aquatic environment using a single criterion. Thus, the introduction of protozoan indicators into the system of environmental quality assessment makes it possible to easily identify the presence of stable anaerobic zones in water bodies and assess their volume, which is not possible when using standard indicators, oxybionts.

5. Conclusions

In a small shallow floodplain lake, a sharp division of space into zones with different oxygen regimes was observed, in which well-structured and almost non-overlapping assemblages of ciliated protozoa, retaining their distinctiveness during all seasons of the year, were formed. The distribution of protozoa in these conditions is of considerable interest, since the species with different ecological preferences are forced to exist under conditions of contrasting oxygen distribution, which unambiguously reveals their priorities. The presence of isolated assemblages of ciliated protozoa made it possible to identify the indicator species for oxygen-contained and oxygen-free conditions. Under anaerobic conditions, a sufficiently high diversity of ciliated protozoa is observed, which makes them very promising indicators for zoning water bodies in which stable anaerobic zones are formed.

Author Contributions

Conceptualization, R.B. and G.Ł.; methodology, R.B. and T.K.; software, Y.D., R.B. and E.Ł; validation, R.B. and G.Ł.; formal analysis, R.B., E.Ł. and G.Ł.; investigation, R.B. and T.K.; resources, R.B., T.K. and G.Ł.; data curation, R.B., T.K., Y.D., J.S.-C., E.Ł. and G.Ł.; writing—original draft preparation, R.B., T.K. and Y.D.; writing—review and editing, R.B., T.K., Y.D., V.P., J.S.-C., E.Ł., J.Z. and G.Ł.; visualization, R.B., Y.D. and T.K.; supervision, R.B. and G.Ł. All authors have read and agreed to the published version of the manuscript.

Funding

This research received no external funding.

Institutional Review Board Statement

Not applicable.

Informed Consent Statement

Not applicable.

Data Availability Statement

Data is contained within the article.

Acknowledgments

The authors are much obliged to the anonymous reviewers for their valuable comments.

Conflicts of Interest

The authors declare no conflict of interest.

References

  1. Acreman, M.; Dunbar, M.J. Defining environmental river flow requirements—A review. Hydrol. Earth Syst. Sci. 2004, 8, 861–876. [Google Scholar] [CrossRef]
  2. Babko, R.; Kuzmina, T. Effect of dams on hydrological parameters and the structure of benthic molluscs: Case study in Dnieper river Basin. Ecohydrol. Hydrobiol. 2009, 9, 159–164. [Google Scholar] [CrossRef]
  3. Poff, N.L.; Zimmerman, J.K.H. Ecological responses to altered flow regimes: A literature review to inform the science and management of environmental flows. Freshw. Biol. 2010, 55, 194–205. [Google Scholar] [CrossRef]
  4. Belletti, B.; Rinaldi, M.; Buijse, A.D.; Gurnell, A.M.; Mosselman, E. A review of assessment methods for river hydromorphology. Environ. Earth Sci. 2015, 73, 2079–2100. [Google Scholar] [CrossRef]
  5. Grizzetti, B.; Pistocchi, A.; Liquete, C.; Udias, A.; Bouraoui, F.; Van De Bund, W. Human pressures and ecological status of European rivers. Sci. Rep. 2017, 7, 205. [Google Scholar] [CrossRef] [PubMed] [Green Version]
  6. Ward, J.V.; Tockner, K.; Schiemer, F. Biodiversity of floodplain river ecosystems: Ecotones and connectivity1. Regul. Rivers Res. Manag. 1999, 15, 125–139. [Google Scholar] [CrossRef]
  7. Weilhoefer, C.L.; Pan, Y.; Eppard, S. The effects of river floodwaters on floodplain wetland water quality and diatom assemblages. Wetlands 2008, 28, 473–486. [Google Scholar] [CrossRef]
  8. Robinson, G.G.C.; Gurney, S.E.; Goldsborough, L.G. The primary productivity of benthic and planktonic algae in a prairie wetland under controlled water-level regimes. Wetlands 1997, 17, 182–194. [Google Scholar] [CrossRef]
  9. Stromberg, J.C.; Fry, J.; Patten, D.T. Marsh development after large floods in an alluvial, arid-land river. Wetlands 1997, 17, 292–300. [Google Scholar] [CrossRef]
  10. Cole, J.J.; Prairie, Y.T.; Caraco, N.F.; McDowell, W.H.; Tranvik, L.J.; Striegl, R.G.; Duarte, C.M.; Kortelainen, P.; Downing, J.A.; Middelburg, J.J.; et al. Plumbing the Global Carbon Cycle: Integrating Inland Waters into the Terrestrial Carbon Budget. Ecosystems 2007, 10, 172–185. [Google Scholar] [CrossRef] [Green Version]
  11. Tranvik, L.J.; Downing, J.A.; Cotner, J.B.; Loiselle, S.A.; Striegl, R.G.; Ballatore, T.J.; Dillon, P.; Finlay, K.; Fortino, K.; Knoll, L.B.; et al. Lakes and reservoirs as regulators of carbon cycling and climate. Limnol. Oceanogr. 2009, 54, 2298–2314. [Google Scholar] [CrossRef] [Green Version]
  12. Bastviken, D.; Tranvik, L.J.; Downing, J.A.; Crill, P.M.; Enrich-Prast, A. Freshwater Methane Emissions Offset the Continental Carbon Sink. Science 2011, 331, 50. [Google Scholar] [CrossRef] [PubMed] [Green Version]
  13. Grasset, C.; Mendonça, R.; Villamor Saucedo, G.; Bastviken, D.; Roland, F.; Sobek, S. Large but variable methane production in anoxic freshwater sediment upon addition of allochthonous and autochthonous organic matter. Limnol. Oceanogr. 2018, 63, 1488–1501. [Google Scholar] [CrossRef] [PubMed]
  14. Sobek, S.; Durisch-Kaiser, E.; Zurbrügg, R.; Wongfun, N.; Wessels, M.; Pasche, N.; Wehrli, B. Organic carbon burial efficiency in lake sediments controlled by oxygen exposure time and sediment source. Limnol. Oceanogr. 2009, 54, 2243–2254. [Google Scholar] [CrossRef] [Green Version]
  15. Sobek, S.; Delsontro, T.; Wongfun, N.; Wehrli, B. Extreme organic carbon burial fuels intense methane bubbling in a temperate reservoir. Geophys. Res. Lett. 2012, 39, L01401. [Google Scholar] [CrossRef] [Green Version]
  16. Finlay, B. An anaerobic protozoon, with symbiotic methanogens, living in municipal landfill material. FEMS Microbiol. Lett. 1991, 85, 169–179. [Google Scholar] [CrossRef] [Green Version]
  17. Fenchel, T. Methanogenesis in marine shallow water sediments: The quantitative role of anaerobic protozoa with endosymbiotic methanogenic bacteria. Ophelia 1993, 37, 67–82. [Google Scholar] [CrossRef]
  18. Foissner, W.; Berger, H. A user-friendly guide to the ciliates (Protozoa, Ciliophora) commonly used by hydrobiologists as bioindicators in rivers, lakes, and waste waters, with notes on their ecology. Freshw. Biol. 1996, 35, 375–482. [Google Scholar] [CrossRef]
  19. Primc-Habdija, B.; Habdija, I.; Plenković-Moraj, A. Tufa deposition and periphyton overgrowth as factors affecting the ciliate community on travertine barriers in different current velocity conditions. Hydrobiologia 2001, 457, 87–96. [Google Scholar] [CrossRef]
  20. Wickham, S.A.; Nagel, S.; Hillebrand, H. Control of epibenthic ciliate communities by grazers and nutrients. Aquat. Microb. Ecol. 2004, 35, 153–162. [Google Scholar] [CrossRef] [Green Version]
  21. Gong, J.; Song, W.; Warren, A. Periphytic ciliate colonization: Annual cycle and responses to environmental conditions. Aquat. Microb. Ecol. 2005, 39, 159–170. [Google Scholar] [CrossRef] [Green Version]
  22. Mieczan, T. Periphytic ciliates in littoral zone of three lakes of different trophic status. Polish J. Ecol. 2005, 53, 489–501. [Google Scholar]
  23. Fenchel, T.; Finlay, B. Oxygen and the spatial structure of microbial communities. Biol. Rev. 2008, 83, 553–569. [Google Scholar] [CrossRef] [PubMed]
  24. Fenchel, T. Protozoa and oxygen. Acta Protozool. 2014, 53, 3–12. [Google Scholar] [CrossRef]
  25. Babko, R.; Kuzmina, T.; Danko, Y.; Szulzyk-Cieplak, J.; Łagód, G. Oxygen gradients and structure of the ciliate assemblages in floodplain lake. Water 2020, 12, 2084. [Google Scholar] [CrossRef]
  26. Sleigh, M.A.; Baldock, B.M.; Baker, J.H. Protozoan communities in chalk streams. Hydrobiologia 1992, 248, 53–64. [Google Scholar] [CrossRef]
  27. Primc-Habdija, B.; Habdija, I.; Radanović, I. Seasonal changes in trophic structure of periphytic ciliates in relation to discharge regime. SIL Proc. 1922–2010 1998, 26, 1116–1119. [Google Scholar] [CrossRef]
  28. European Parliament, C. Directive 2000/60/EC of the European Parliament and of the Council of 23 October 2000 establishing a framework for Community action in the field of water policy. Off. J. Eur. Parliam. 2000, L327, 1–82. [Google Scholar]
  29. Babko, R. Microbenthometer for protistological studies. Hydrobiol. J. 1989, 25, 78–80. (In Russian) [Google Scholar]
  30. Foissner, W. Basic light and scanning electron microscopic methods for taxonomic studies of ciliated protozoa. Eur. J. Protistol. 1991, 27, 313–330. [Google Scholar] [CrossRef]
  31. Foissner, W.; Blatterer, H.; Berger, H.; Kohmann, F. Taxonomische und Ökologische Revision der Ciliaten des Saprobiensystems. Band I: Cyrtophorida, Oligotrichida, Hypotrichida, Colpodea; Informationsberichte des Bayer; Landesamtes für Wasserwirtschaft: Deggendorf, Germany, 1991; pp. 1–478.
  32. Foissner, W.; Berger, H.; Kohmann, F. Taxonomische und Ökologische Revision der Ciliaten des Saprobiensystems. Band II: Peritrichida, Heterotrichida, Odontostomatida; Informationsberichte des Bayer; Landesamtes für Wasserwirtschaft: Deggendorf, Germany, 1992; pp. 1–502.
  33. Foissner, W.; Berger, H.; Kohmann, F. Taxonomische und Ökologische Revision der Ciliaten des Saprobiensystems. Band III: Hymenostomatida, Prostomatida, Nassulida; Informationsberichte des Bayer; Landesamtes für Wasserwirtschaft: Deggendorf, Germany, 1994; pp. 1–548.
  34. Foissner, W.; Berger, H.; Blatterer, H.; Kohmann, F. Taxonomische und Ökologische Revision der Ciliaten des Saprobiensystems. Band IV: Gymnostomatea, Loxodes, Suctoria; Informationsberichte des Bayer; Landesamtes für Wasserwirtschaft: Deggendorf, Germany, 1995; pp. 1–540.
  35. Jankowski, A.W. Morphology and evolution of Ciliophora. III. Diagnoses and phylogenesis of 53 sapropelebionts, mainly of the order Heterotrichida. Arch. Protistenkd. 1964, 107, 185–194. [Google Scholar]
  36. Kahl, A. Urtiere oder Protozoa I: Wimpertiere oder Ciliata (Infusoria) 1. Allgemeiner Teil und Prostomata. Tierwelt Dtl. 1930, 18, 1–180. [Google Scholar]
  37. Kahl, A. Urtiere oder Protozoa I: Wimpertiere oder Ciliata (Infusoria) 2. Holotricha außer den im 1. Teil behandelten Prostomata. Tierwelt Dtl. 1931, 21, 181–398. [Google Scholar]
  38. Kahl, A. Urtiere oder Protozoa I: Wimpertiere oder Ciliata (Infusoria) 3. Spirotricha. Tierwelt Dtl. 1932, 25, 399–650. [Google Scholar]
  39. Kahl, A. Urtiere oder Protozoa I: Wimpertiere oder Ciliata (Infusoria) 4. Peritricha und Chonotricha. Tierwelt Dtl. 1935, 30, 651–886. [Google Scholar]
  40. Team R Development Core. R: A Language and Environment for Statistical Computing; The R Project for Statistical Computing: Vienna, Austria, 2021; Volume 2, Available online: https://www.R-project.org (accessed on 11 January 2022).
  41. Wickham, H.; Averick, M.; Bryan, J.; Chang, W.; McGowan, L.; François, R.; Grolemund, G.; Hayes, A.; Henry, L.; Hester, J.; et al. Welcome to the Tidyverse. J. Open Source Softw. 2019, 4, 1686. [Google Scholar] [CrossRef]
  42. Van Der Maaten, L.; Hinton, G.E. Visualizing High-Dimensional Data Using t-SNE. J. Mach. Learn. Res. 2008, 9, 2579–2605. [Google Scholar]
  43. Van Der Maaten, L. Accelerating t-SNE using tree-based algorithms. J. Mach. Learn. Res. 2015, 15, 3221–3245. [Google Scholar]
  44. Krijthe, J.H. Rtsne: T-Distributed Stochastic Neighbor Embedding Using a Barnes-Hut Implementation. 2016. Available online: https://github.com/jkrijthe/Rtsne (accessed on 15 December 2021).
  45. Oksanen, J.; Kindt, R.; Legendre, P.; O’Hara, B.; Simpson, G.L.; Solymos, P.M.; Stevens, M.H.H.; Wagner, H. Community Ecology Package. R package version 2.4-2. Community Ecol. Packag. 2019, 2.5-6, 190. [Google Scholar]
  46. De Cáceres, M.; Legendre, P. Associations between species and groups of sites: Indices and statistical inference. Ecology 2009, 90, 3566–3574. [Google Scholar] [CrossRef]
  47. Kindt, R.; Coe, R. Tree Diversity Analysis; A Manual and Software for Common Statistical Methods for Ecological and Biodiversity Studies; World Agroforestry Centre: Nairobi, Kenya, 2005; p. 196. [Google Scholar]
  48. Lynn, D.H. The Ciliated Protozoa: Characterization, Classification, and Guide to the Literature, 3rd ed.; Lynn, D.H., Ed.; Springer: Dordrecht, The Netherlands, 2008; ISBN 9781402082399. [Google Scholar]
  49. Babko, R.V. Communities of Free-Living Ciliated Protozoa (Chromista, Ciliophora) of Continental Waters. Ph.D. Thesis, Institute of Hydrobiology, National Academy of Sciences of Ukraine, Kyiv, Ukraine, 2019. (In Ukrainian). [Google Scholar]
  50. Fenchel, T. Ecology of Protozoa; Brock/Springer Series in Contemporary Bioscience; Springer: Berlin/Heidelberg, Germany, 1987; ISBN 978-3-662-06819-9. [Google Scholar]
  51. Finlay, B.J.; Esteban, G.F. Freshwater protozoa: Biodiversity and ecological function. Biodivers. Conserv. 1998, 7, 1163–1186. [Google Scholar] [CrossRef]
  52. Lawrence, J.R.; Swerhone, G.D.W.; Wassenaar, L.I.; Neu, T.R. Effects of selected pharmaceuticals on riverine biofilm communities. Can. J. Microbiol. 2005, 51, 655–669. [Google Scholar] [CrossRef] [PubMed]
  53. Finlay, B.J.; Esteban, G.F.; Fenchel, T. Protozoan diversity: Converging estimates of the global number of free-living ciliate species. Protist 1998, 149, 29–37. [Google Scholar] [CrossRef]
  54. Finlay, B.J.; Esteban, G.F.; Olmo, J.L.; Tyler, P.A. Global distribution of free-living microbial species. Ecography 1999, 22, 138–144. [Google Scholar] [CrossRef]
  55. Kolkwitz, R.; Marsson, M. Ökologie der tierischen Saprobien. Beiträge zur Lehre von der biologischen Gewässerbeurteilung. Int. Rev. der Gesamten Hydrobiol. und Hydrogr. 1909, 2, 126–152. [Google Scholar] [CrossRef] [Green Version]
  56. Sládeček, V. System of Water Analysis from the Biologica Point of View. Arch. Fuer Hydrobiol. Beih. 1973, 7, 114–137. [Google Scholar]
  57. Su, Q. A general pattern of the species abundance distribution. PeerJ 2018, 2018, e5928. [Google Scholar] [CrossRef]
Figure 1. Map of geographical location and configuration of the lake.
Water 14 00898 g001
Figure 2. Litonotus lamella in transmitted light after retardation: (a) ventral rows of cilia; (b) macronucleus.
Water 14 00898 g002
Figure 3. (a) Vorticella octava in transmitted light; (b) Vorticella convallaria—phase contrast.
Water 14 00898 g003
Figure 4. (a) temporary preparation, macronucleus of Vorticella convallaria stained with methylene green; (b) basal bodies of Plagiocampa rouxi.
Water 14 00898 g004
Figure 5. Modified Bogorov’s chamber for protozoa counting, 1 mL volume.
Water 14 00898 g005
Figure 6. The t–SNE of habitats based on the abundance of ciliated protozoa.
Water 14 00898 g006
Figure 7. The t–SNE of habitats according to the four levels of dissolved oxygen content (ana, anaerobic; micro, microaerobic; aero, aerobic; haero, hyperaerobic) with superimposed information on the corresponding habitats.
Water 14 00898 g007
Figure 8. The t–SNE of ciliate species based on habitat distribution (sapropel, water, plants). Ecomorphs of ciliates: ana, anaerobic; asl, “activated sludge” group; euo, euryoxyphilic; mio, microoxyphilic; oxy, oxyphilic; unk, species with unknown preferences.
Water 14 00898 g008
Figure 9. The t–SNE of habitats based on the abundance of indicator species.
Water 14 00898 g009
Figure 10. NMDS of habitats based on the abundance of ciliates with superimposed oxygen gradient (isolines whose width is proportional to the O2 concentration indicated next to the isoline). Areas occupied by samples belonging to one of the three habitats—sapropel, water, and plants—are marked in color.
Water 14 00898 g010
Figure 11. NMDS of habitats based on the abundance of ciliated species with superimposed oxygen gradient (isolines whose width is proportional to the O2 concentration indicated next to the isoline). Only indicator species are shown. The areas occupied by the samples belonging to one of the three habitats—sapropel, water, and plants—are marked in color.
Water 14 00898 g011
Figure 12. Rank-Abundance Dominance curves with 5 model fits: brokenstick, preemption, log-Normal, Zipf, and Zipf-Mandelbrot. (a)—anaerobic conditions; (b)—aerobic conditions (among plants). AIC, Akaike information criterion.
Water 14 00898 g012
Figure 13. Rank-Abundance Dominance plot for water species with 5 model fits: brokenstick, preemption, log-Normal, Zipf, and Zipf-Mandelbrot. AIC, Akaike information criterion.
Water 14 00898 g013
Table 1. Morphological characteristics of the lake.
ParametersValues
Area, m23.006
Length, m112.9
Maximum width, m33.0
Maximum depth, m1.5
Table 2. Physical and chemical characteristics of the habitats in the lake. T—Temperature and O—dissolved content—minimum and maximum values for the season; PI—Permanganate Index—mean for the season ± SD.
HabitatsT, °CO2, mg/LPI, mg O2/L
Among duckweed (L. trisulca and L. minor)
Winter00.0–7.028.6 ± 1.1
Spring5–144.0–7.041.1 ± 5.4
Summer18.5–25.57.0–10.337.4 ± 7.1
Autumn2–132.4–5.745.4 ± 5.2
Water under a layer of duckweed
Winter00.0–7.216.1 ± 1.4
Spring5.0–10.11.0–7.021.1 ± 2.7
Summer10.5–17.00.0–1.518.9 ± 2.1
Autumn4.0–8.20.0–0.719.4 ± 3.6
Sapropel
Winter00.048.4 ± 4.1
Spring0.0–10.00.054.1 ± 3.8
Summer9.1–16.00.052.0 ± 2.7
Autumn4.0–9.20.061.7 ± 5.6
Table 3. List of ciliate species—indicators of habitats: sapropel, water, and plant layer. The column “stat” gives the indicator value of the species in fractions of one. This indicator value is equal to the square root of the product of parameters A and B. “A” is an estimate of the probability that if a given species is found, the habitat is of that type. “B” is the probability of finding a species in a habitat of that group.
SpeciesABStatp-Value
Sapropel
Apsiktrara gracilis1110.001
Brachonella campanula1110.001
Cristigera setosa0.982410.9910.001
Plagiopyla nasuta0.932210.9660.001
Epalxella mirabilis0.94970.92310.9360.001
Rhagadostoma completum0.784210.8860.001
Metopus caudatus10.76920.8770.001
Lagynus elegans0.97190.76920.8650.001
Metopus es0.92760.76920.8450.001
Caenomorpha medusula0.91560.76920.8390.001
Vasicola ovum0.99210.61540.7810.001
Brachonella spiralis0.77590.76920.7730.001
Saprodinium dentatum10.53850.7340.001
Urocentrum turbo10.53850.7340.001
Caenomorpha uniserialis10.46150.6790.002
Ludio parvulus10.46150.6790.003
Metopus striatus10.46150.6790.005
Vegetation
Urotricha furcata0.852110.9230.001
Vorticella campanula10.80.8940.001
Holosticha pullaster0.763310.8740.001
Euplotopsis affinis0.9590.73330.8390.001
Vorticella convallaria0.83610.80.8180.001
Oxytricha setigera10.60.7750.001
Paramecium bursaria10.60.7750.001
Paraurotricha discolor10.60.7750.001
Euplotes patella10.53330.730.001
Water
Askenasia volvox10.33330.5770.01
Astylozoon faurei10.33330.5770.009
Disematostoma buetschlii10.33330.5770.012
Monodinium balbianii10.33330.5770.012
Tintinnidium fluviatile10.33330.5770.009
Urotricha pelagica10.33330.5770.009
Publisher’s Note: MDPI stays neutral with regard to jurisdictional claims in published maps and institutional affiliations.

