
Assessment of Environmental Water Requirement Allocation in Anthropogenic Rivers with a Hydropower Dam Using Hydrologically Based Methods—Case Study


Abstract
:1. Introduction
2. Materials and Methods
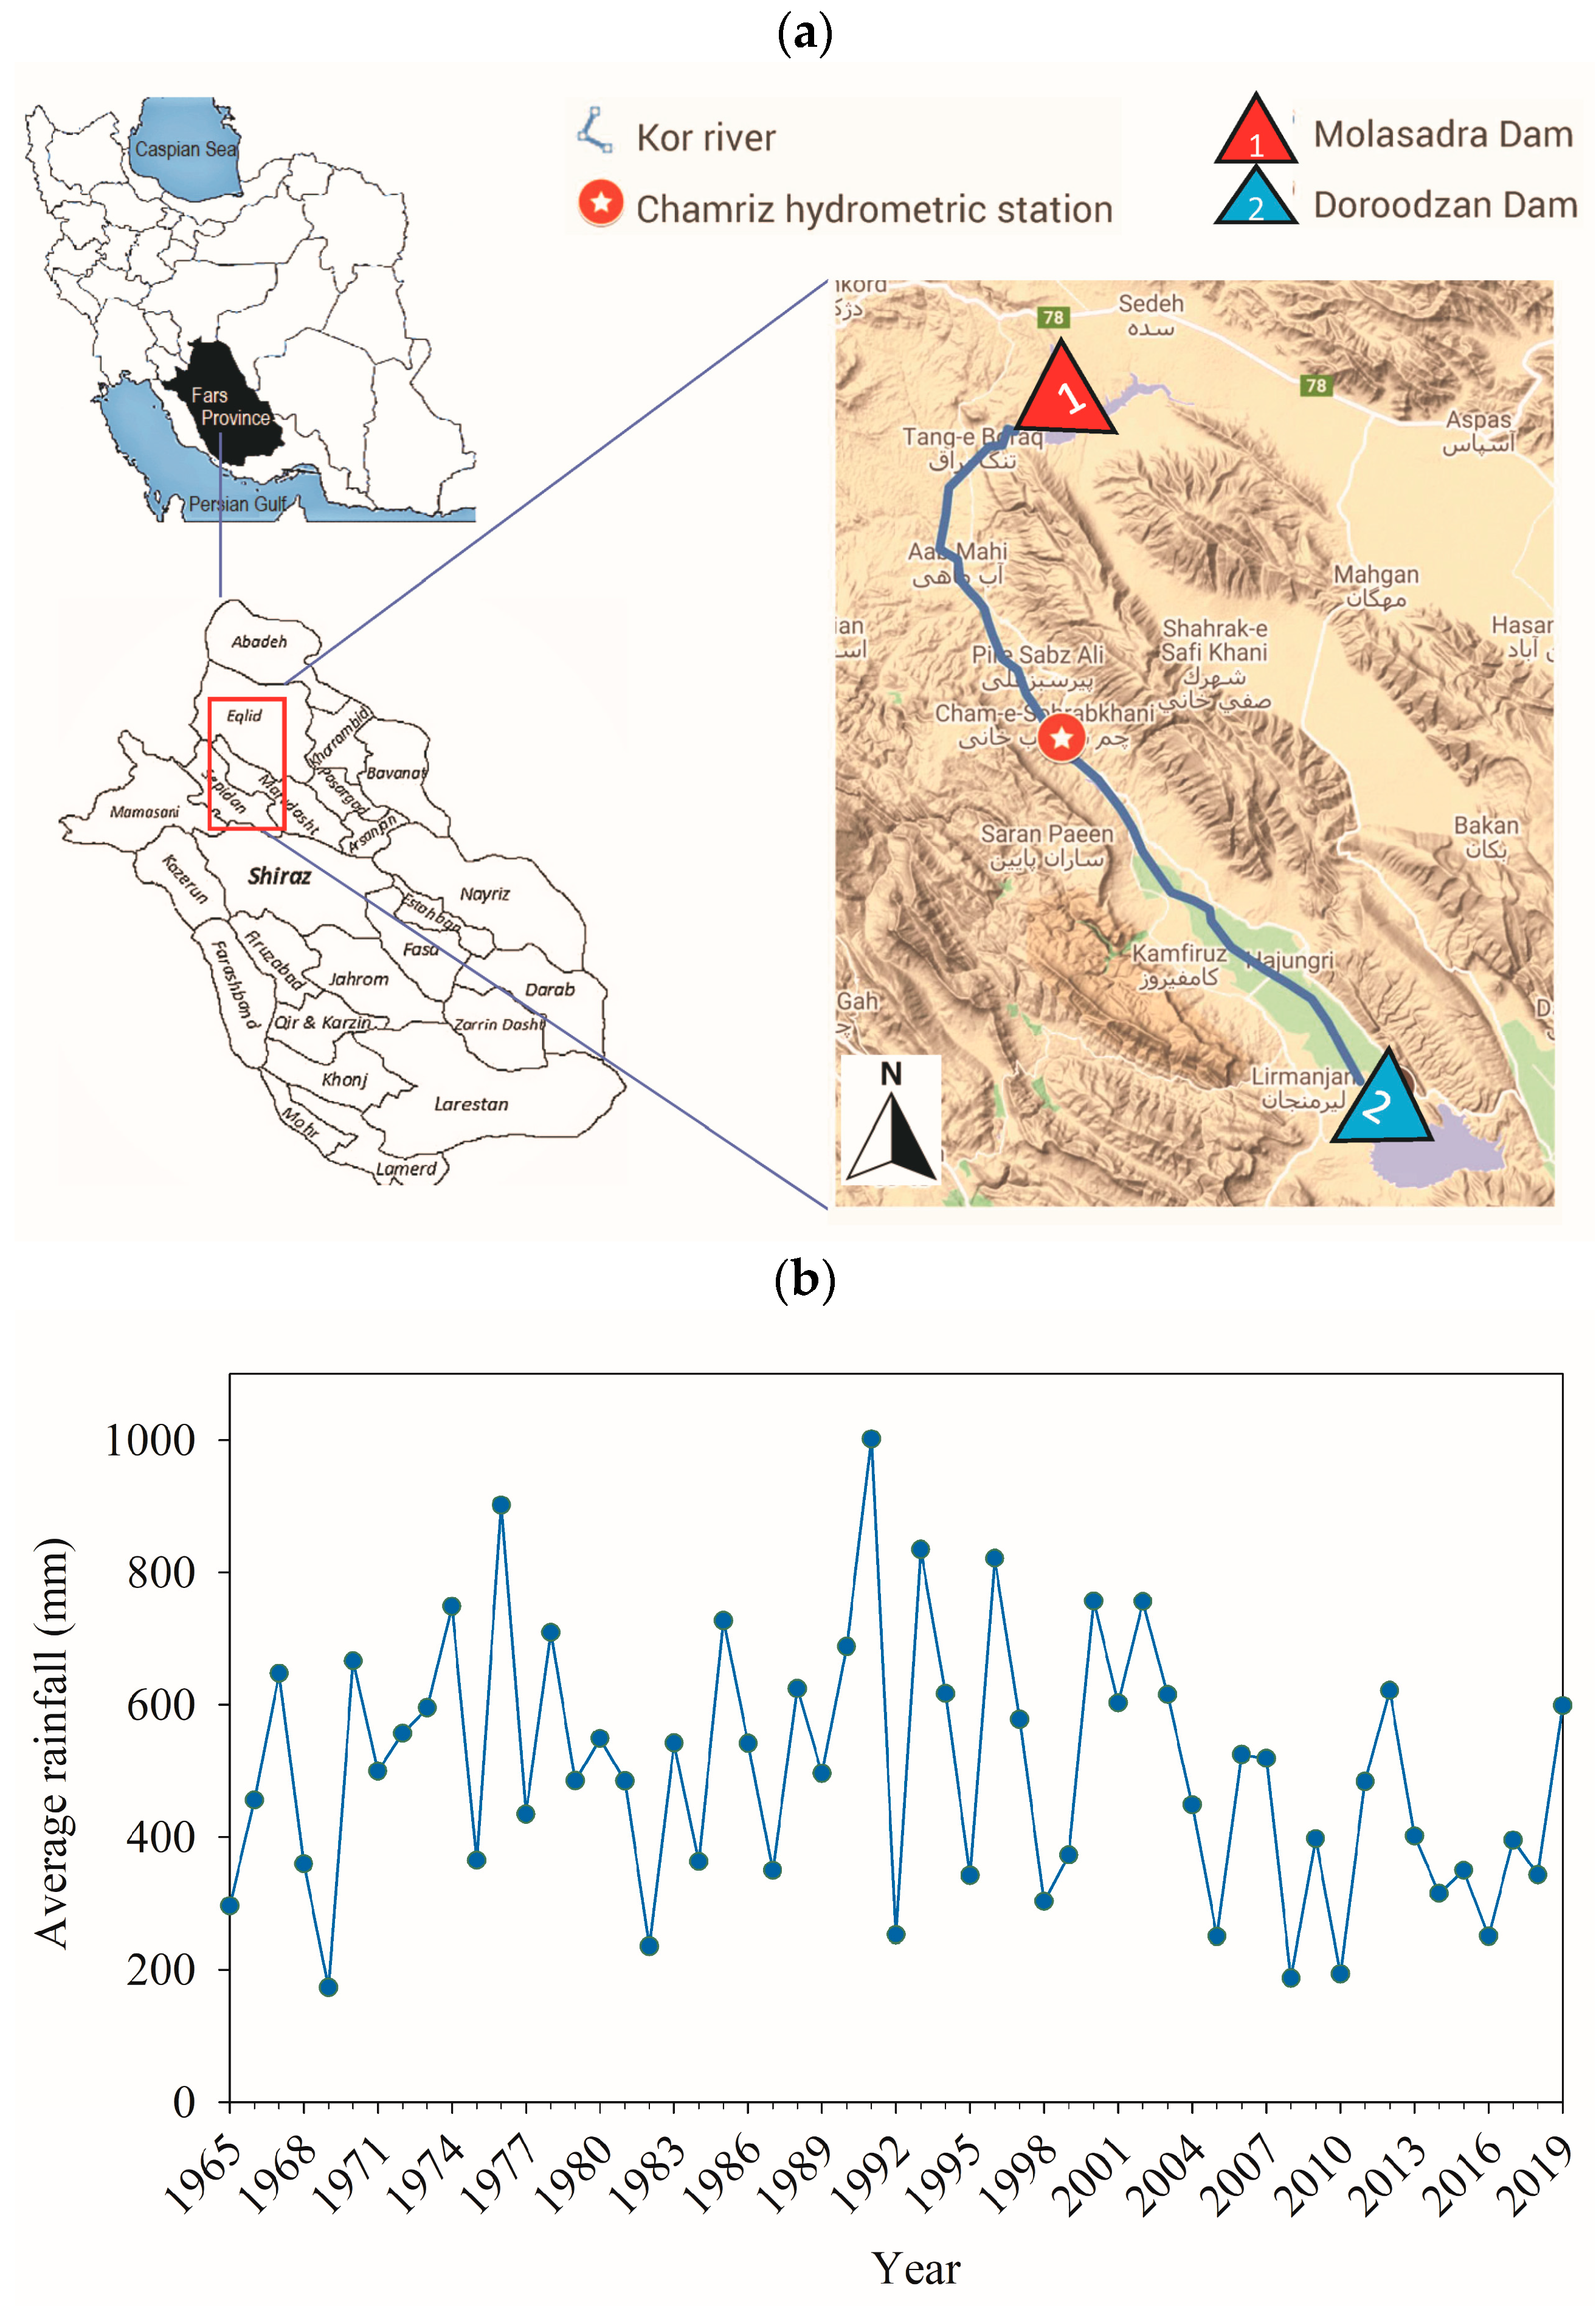
2.1. Study Area Description
2.2. Data Description
2.3. Methods of Data Analysis

| Method | Description | Advantages | Disadvantages | Sources |
|---|---|---|---|---|
| Tennant and Modified Tennant | -Also known as the Montana Method -Based on testing on 11 rivers -EWR values are recommended based on percentages of MAF | -Simple -Low-cost -Fast -Requires low data -No field works -Adaptability to wet and dry seasons in each region | -Considers only the physical suitability of the habitat -Highly dependent on degree of professional judgement -Not applicable to high gradient rivers (>1% slope) -Not suitable for rivers with varying flow regime -the percentages need to be re-calculated for each region | [26,46,66,67,68] |
| Tessman | -Considers flow variations on a monthly basis | -Easy to implement -Applicable for rivers with varying hydrological regimes -No field work | -Low accuracy in low-flow periods -Highly dependent on degree of professional judgement | [69,70] |
| Smakhtin | -Uses a combination of HFR as flood events and LFR as minimum water requirements for fish and other aquatic organisms as a percentage of MAF. | -Easy to implement -Low-cost -No field works | -Highly dependent on degree of professional judgement | [70,71] |
| Flow duration indices | -Express the percent of time definite flows will be corresponded or exceeded over different time scales -Shows the full range of river flows from low flows to floods as well as the relationship between flow magnitude and frequency. | -Fast -Easy to implement -Inexpensive -Better fits to different geographical regions -Daily, weekly, or monthly discharge data can be used -Provide stable hydrologic conditions that would therefore be beneficial to aquatic habitat | -Low reliability especially during low flows -Highly dependent on degree of professional judgement -Harmful effects on stream biota by application of high flows | [68,71,72] |
| Low-flow indices | -Based on more than 50% exceedance obtained from FDC for daily discharge data -Involves a statistical low-flow frequency analysis of the minimum mean daily flow during a given period of 7 days within a 2- or 10-year return period | -Simple -Low cost -Habitat preservation during low-flow seasons -Maintaining water quality under the effect of wastewater | -Low reliability -Not recommended for the variable flow regimes | [62,70,72,73] |
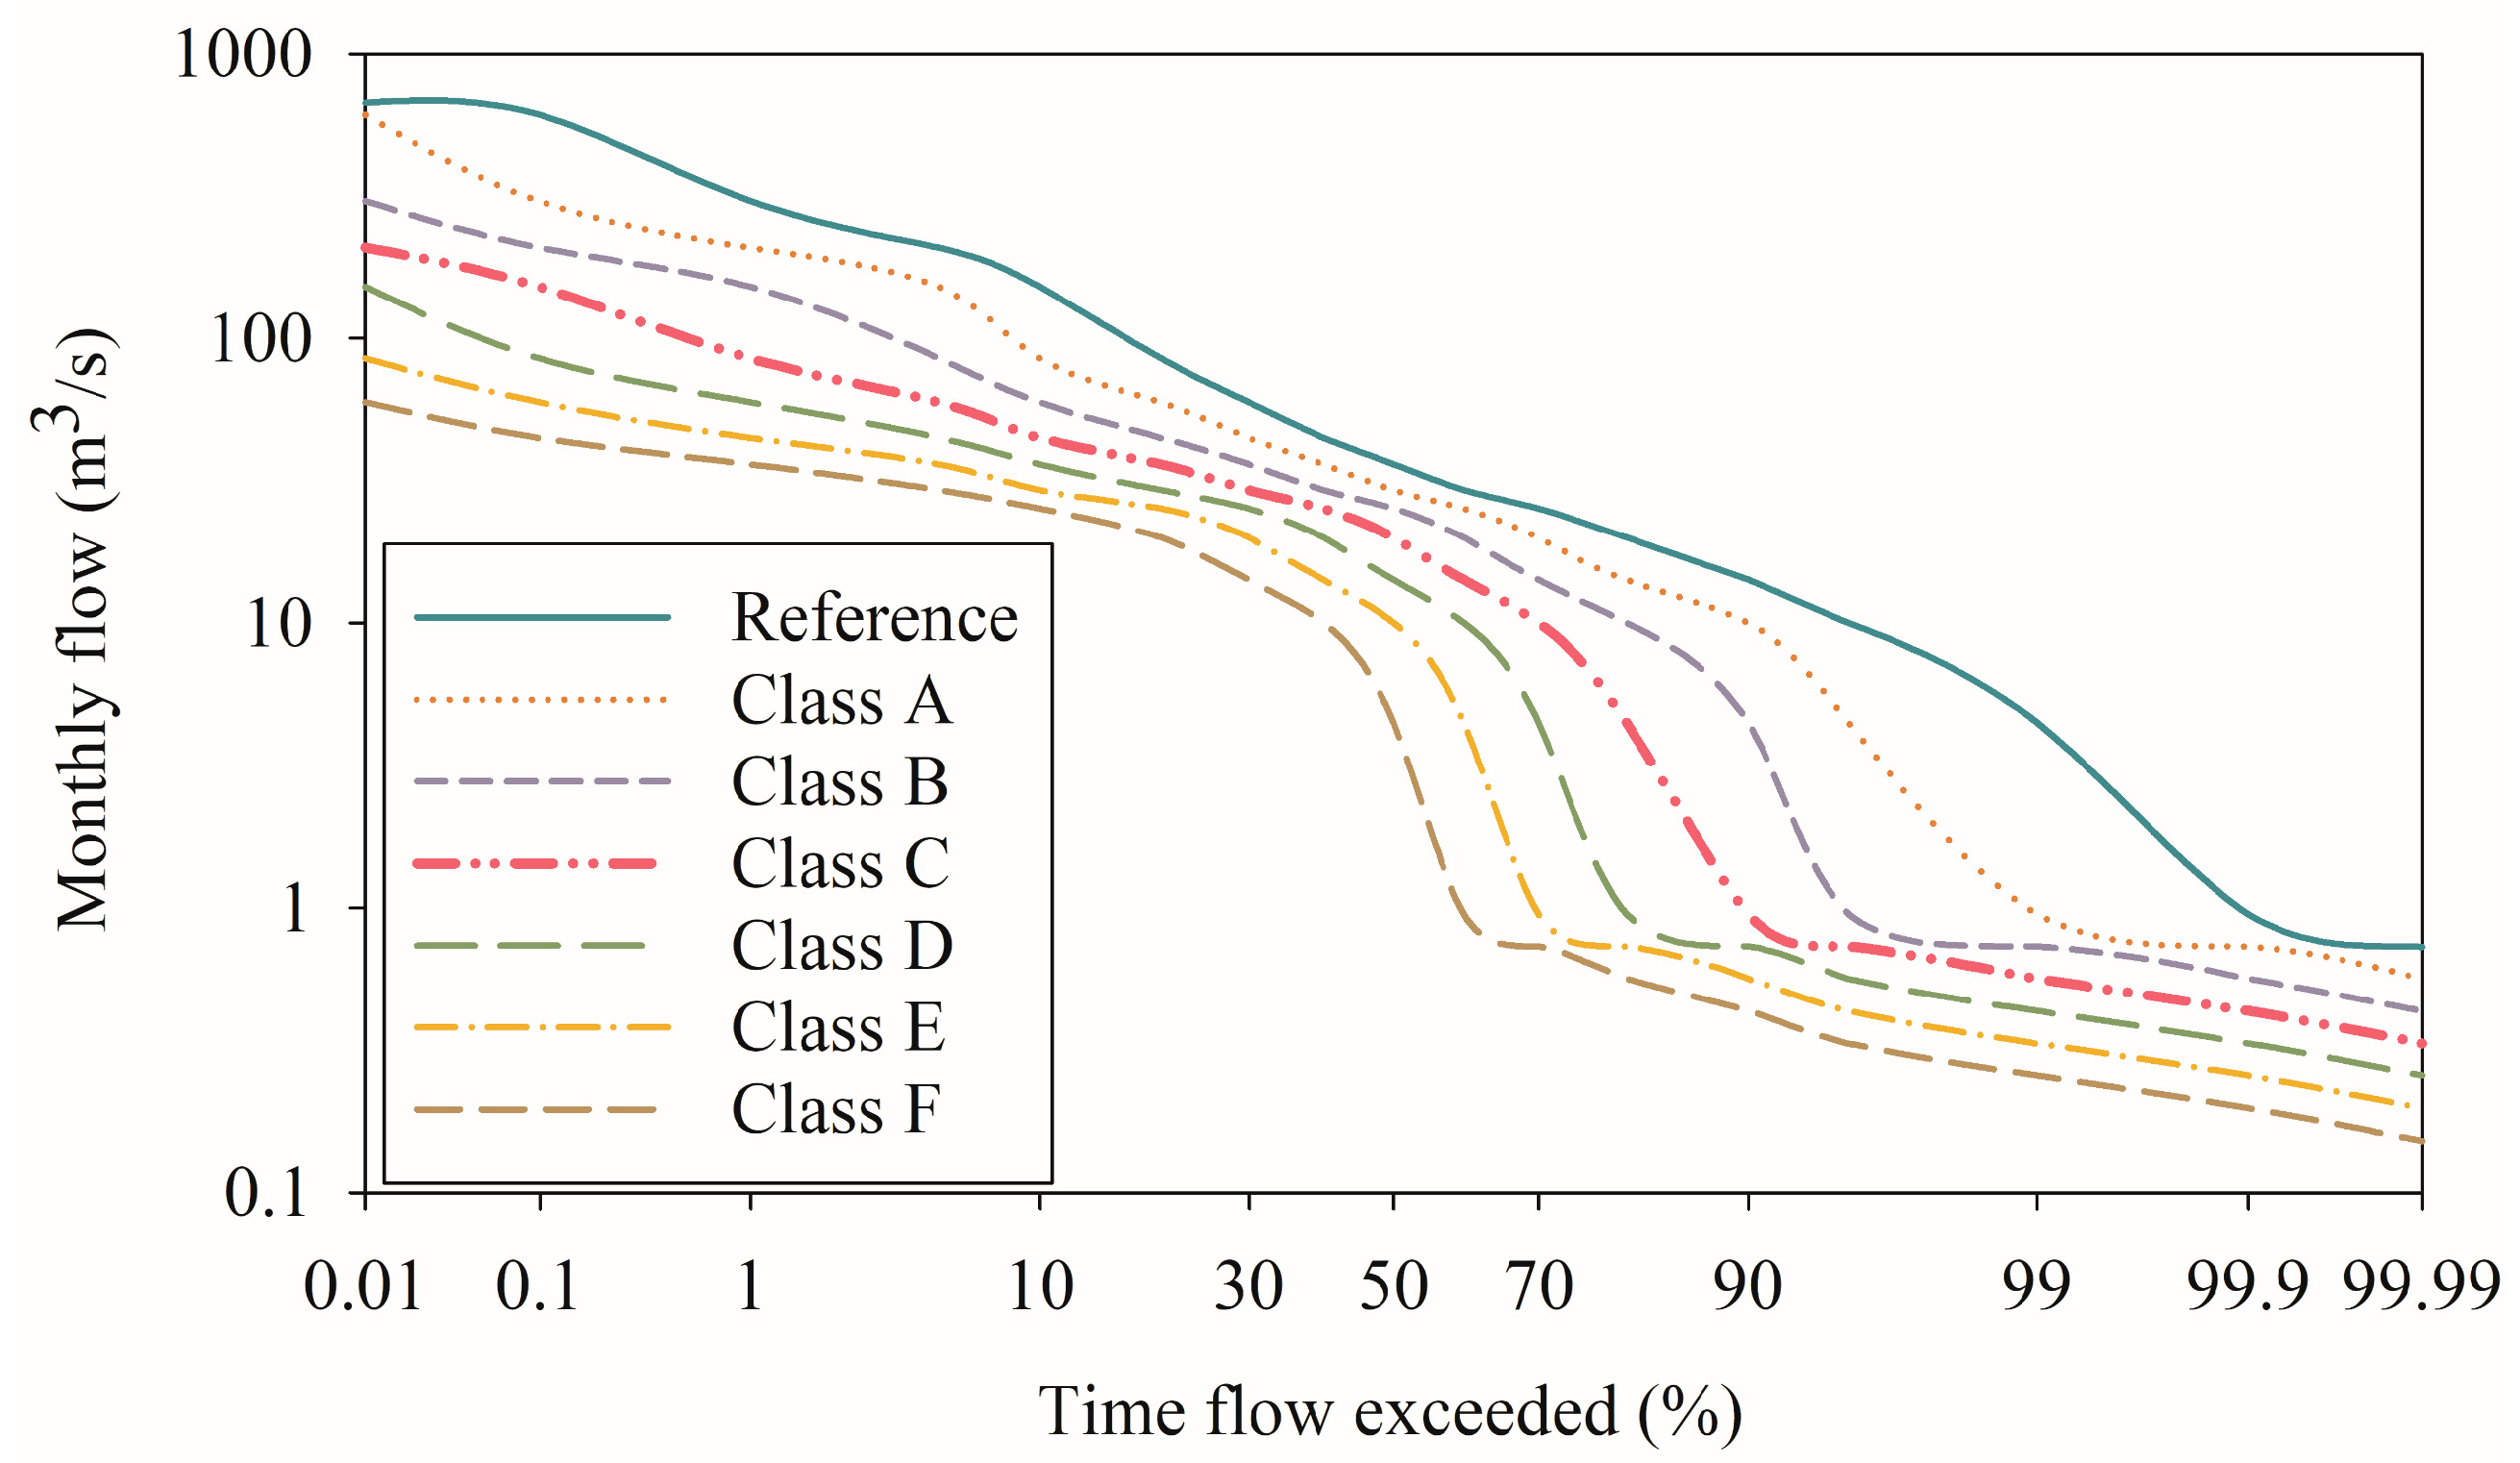
| FDC shifting | -Uses monthly flow data -Includes four subsequent steps -An environmental management class should be defined based on ecological conditions and management perspective | -Better fits to different geographical regions -Desktop method -Can be implemented using a free software package | -Highly dependent on degree of professional judgement | [64] |
| DRM | -Defines four classes of environmental management -Assumes that EWR increases with increasing base flow contribution and decreases with increasing flow variability. | -Based on monthly flow data which are more readily available or accessible in developing countries. | -Highly dependent on degree of professional judgement -parameter values must be modified for each region | [64,74] |
| RVA | -Based on the time series of natural daily flows in a given area, thirty-two hydrological parameters, which reflect different aspects of flow variability including magnitude, duration, frequency and timing are estimated. -Calculates EWR as a range between the 25th and 75th monthly flow percentile using non-parametric analyses or as a range of mean monthly flow using parametric analyses | -Can be implemented as a desktop tool. -Gauged or modelled daily flows can be used | -The number of parameters used is too large | [74,75,76,77] |
3. Results
4. Discussion
5. Conclusions
Author Contributions
Funding
Institutional Review Board Statement
Informed Consent Statement
Data Availability Statement
Acknowledgments
Conflicts of Interest
References
- Ghorbani, M.K.; Afshar, A.; Hamidifar, H. River water quality management using a fuzzy optimization model and the NSFWQI index. Water SA 2021, 47, 45–53. [Google Scholar] [CrossRef]
- Nikitina, O.I.; Dubinina, V.G.; Bolgov, M.V.; Parilov, M.P.; Parilova, T.A. Environmental Flow Releases for Wetland Biodiversity Conservation in the Amur River Basin. Water 2020, 12, 2812. [Google Scholar] [CrossRef]
- Ghorbani, M.K.; Afshar, A.; Hamidifar, H.; Reddy, M.J. A fuzzy multi-objective multiple-pollutant model for rivers using an ant colony algorithm. Proc. Inst. Civ. Eng. Water Manag. 2021, 1–16. [Google Scholar] [CrossRef]
- Hamidifar, H.; Omid, M.H.; Keshavarzi, A. Longitudinal dispersion in waterways with vegetated floodplain. Ecol. Eng. 2015, 84, 398–407. [Google Scholar] [CrossRef]
- Poff, N.L.; Zimmerman, J.K.H. Ecological responses to altered flow regimes: A literature review to inform the science and management of environmental flows. Freshw. Biol. 2010, 55, 194–205. [Google Scholar] [CrossRef]
- Hu, W.; Wang, G.; Deng, W.; Li, S. The influence of dams on ecohydrological conditions in the Huaihe River basin, China. Ecol. Eng. 2008, 33, 233–241. [Google Scholar] [CrossRef]
- Chen, A.; Wu, M.; McClain, M.E. Classifying Dams for Environmental Flow Implementation in China. Sustainability 2019, 12, 107. [Google Scholar] [CrossRef] [Green Version]
- Gierszewski, P.J.; Habel, M.; Szmańda, J.; Luc, M. Evaluating effects of dam operation on flow regimes and riverbed adaptation to those changes. Sci. Total Environ. 2020, 710, 136202. [Google Scholar] [CrossRef]
- Beckers, F.; Inskeep, C.; Haun, S.; Schmid, G.; Wieprecht, S.; Noack, M. High spatio-temporal resolution measurements of cohesive sediment erosion. Earth Surf. Process. Landf. 2020, 45, 2432–2449. [Google Scholar] [CrossRef]
- Kortmann, R. Cyanobacteria in Reservoirs: Causes, Consequences, Controls. J. N. Engl. Water Assoc. 2015, 129, 73–90. [Google Scholar]
- Lima, I.B.T.; Ramos, F.M.; Bambace, L.A.W.; Rosa, R.R. Methane Emissions from Large Dams as Renewable Energy Resources: A Developing Nation Perspective. Mitig. Adapt. Strateg. Glob. Chang. 2007, 13, 193–206. [Google Scholar] [CrossRef]
- Wu, M.; Chen, A.; Zhang, X.; McClain, M.E. A Comment on Chinese Policies to Avoid Negative Impacts on River Ecosystems by Hydropower Projects. Water 2020, 12, 869. [Google Scholar] [CrossRef] [Green Version]
- Ruan, Q.; Wang, F.; Cao, W. Conflicts in Implementing Environmental Flows for Small-Scale Hydropower Projects and Their Potential Solutions—A Case from Fujian Province, China. Water 2021, 13, 2461. [Google Scholar] [CrossRef]
- Renöfält, B.M.; Jansson, R.; Nilsson, C. Effects of hydropower generation and opportunities for environmental flow management in Swedish riverine ecosystems. Freshw. Biol. 2010, 55, 49–67. [Google Scholar] [CrossRef]
- Greimel, F.; Schülting, L.; Graf, W.; Bondar-Kunze, E.; Auer, S.; Zeiringer, B.; Hauer, C. Hydropeaking impacts and mitigation. In Riverine Ecosystem Management: Science for Governing towards a Sustainable Future; Schmutz, S., Sendzimir, J., Eds.; Springer Aquatic Ecology Series: Cham, Switzerland, 2021; pp. 91–110. [Google Scholar]
- Kuriqi, A.; Pinheiro, A.N.; Sordo-Ward, A.; Garrote, L. Influence of hydrologically based environmental flow methods on flow alteration and energy production in a run-of-river hydropower plant. J. Clean. Prod. 2019, 232, 1028–1042. [Google Scholar] [CrossRef]
- Batalla, R.J.; Gómez, C.M.; Kondolf, G.M. Reservoir-induced hydrological changes in the Ebro River basin (NE Spain). J. Hydrol. 2004, 290, 117–136. [Google Scholar] [CrossRef]
- Lawrence, J.E.; Skold, M.E.; Hussain, F.A.; Silverman, D.R.; Resh, V.H.; Sedlak, D.L.; Luthy, R.G.; McCray, J.E. Hyporheic Zone in Urban Streams: A Review and Opportunities for Enhancing Water Quality and Improving Aquatic Habitat by Active Management. Environ. Eng. Sci. 2013, 30, 480–501. [Google Scholar] [CrossRef]
- Horne, A.C.; Kaur, S.; Szemis, J.M.; Costa, A.M.; Nathan, R.; Webb, J.A.; Stewardson, M.J.; Boland, N. Active Management of Environmental Water to Improve Ecological Outcomes. J. Water Resour. Plan. Manag. 2018, 144, 04018079. [Google Scholar] [CrossRef]
- Johnson, H.; Peat, M.; Swirepik, J. Active management of environmental water in the Murray–Darling Basin. In Ecohydrology from Catchment to Coast; Hart, B.T., Bond, N.R., Byron, N., Pollino, C.A., Stewardson, M.J., Eds.; Elsevier: Murray-Darling Basin, Australia, 2021; pp. 203–226. [Google Scholar]
- Poff, N.L.; Richter, B.d.; Arthington, A.H.; Bunn, S.E.; Naiman, R.J.; Kendy, E.; Acreman, M.; Apse, C.; Bledsoe, B.P.; Freeman, M.C.; et al. The ecological limits of hydrologic alteration (ELOHA): A new framework for developing regional environmental flow standards. Freshw. Biol. 2010, 55, 147–170. [Google Scholar] [CrossRef] [Green Version]
- Tavassoli, H.R.; Tahershamsi, A.; Acreman, M. Classification of natural flow regimes in Iran to support environmental flow management. Hydrol. Sci. J. 2014, 59, 517–529. [Google Scholar] [CrossRef] [Green Version]
- Dyson, M.; Bergkamp, G.; Scanlon, J. Flow: The Essentials of Environmental Flows, 2nd ed.; Spence, C., Bos, E., Eds.; IUCN: Gland, Switzerland, 2008. [Google Scholar]
- Acreman, M. Environmental flows—Basics for novices. Wiley Interdiscip. Rev. Water 2016, 3, 622–628. [Google Scholar] [CrossRef] [Green Version]
- Tharme, R.E. A global perspective on environmental flow assessment: Emerging trends in the development and application of environmental flow methodologies for rivers. River Res. Appl. 2003, 19, 397–441. [Google Scholar] [CrossRef]
- Tennant, D.L. Instream Flow Regimens for Fish, Wildlife, Recreation and Related Environmental Resources. Fisheries 1976, 1, 6–10. [Google Scholar] [CrossRef]
- Richter, B.; Baumgartner, J.; Wigington, R.; Braun, D. How much water does a river need? Freshw. Biol. 1997, 37, 231–249. [Google Scholar] [CrossRef] [Green Version]
- Shieh, C.-L.; Guh, Y.-R.; Wang, S.-Q. The application of range of variability approach to the assessment of a check dam on riverine habitat alteration. Environ. Geol. 2006, 52, 427–435. [Google Scholar] [CrossRef]
- Shokoohi, A.; Hong, Y. Using hydrologic and hydraulically derived geometric parameters of perennial rivers to determine minimum water requirements of ecological habitats (case study: Mazandaran Sea Basin—Iran). Hydrol. Process. 2011, 25, 3490–3498. [Google Scholar] [CrossRef]
- Ge, J.; Peng, W.; Huang, W.; Qu, X.; Singh, S.K. Quantitative Assessment of Flow Regime Alteration Using a Revised Range of Variability Methods. Water 2018, 10, 597. [Google Scholar] [CrossRef] [Green Version]
- Książek, L.; Woś, A.; Florek, J.; Wyrębek, M.; Młyński, D.; Wałęga, A. Combined use of the hydraulic and hydrological methods to calculate the environmental flow: Wisloka river, Poland: Case study. Environ. Monit. Assess. 2019, 191, 1–17. [Google Scholar] [CrossRef] [PubMed] [Green Version]
- Mishra, S.K.; Amrit, K.; Pandey, R.P. Correlation between Tennant method and Standardized Precipitation Index for predicting environmental flow condition using rainfall in Godavari Basin. Paddy Water Environ. 2019, 17, 515–521. [Google Scholar] [CrossRef]
- Yang, W.; Yang, Z. Integrating ecosystem-service tradeoffs into environmental flows decisions for Baiyangdian Lake. Ecol. Eng. 2014, 71, 539–550. [Google Scholar] [CrossRef]
- Suwal, N.; Kuriqi, A.; Huang, X.; Delgado, J.; Młyński, D.; Walega, A. Environmental Flows Assessment in Nepal: The Case of Kaligandaki River. Sustainability 2020, 12, 8766. [Google Scholar] [CrossRef]
- Rowiński, P.M.; Okruszko, T.; Radecki-Pawlik, A. Environmental hydraulics research for river health: Recent advances and challenges. Ecohydrol. Hydrobiol. 2022, 22. [Google Scholar] [CrossRef]
- Bounds, R.L.; Lyons, B.W. Existing Reservoir and Stream Management Recommendations—Statewide Minimum Streamflow Recommendations; Texas Parks and Wildlife Department: Austin, TX, USA, 1979.
- Hughes, D.A.; Hannart, P. A desktop model used to provide an initial estimate of the ecological instream flow requirements of rivers in South Africa. J. Hydrol. 2003, 270, 167–181. [Google Scholar] [CrossRef]
- Belmar, O.; Velasco, J.; Martinez-Capel, F. Hydrological Classification of Natural Flow Regimes to Support Environmental Flow Assessments in Intensively Regulated Mediterranean Rivers, Segura River Basin (Spain). Environ. Manag. 2011, 47, 992–1004. [Google Scholar] [CrossRef] [Green Version]
- Karimi, S.; Salarijazi, M.; Ghorbani, K.; Heydari, M. Comparative assessment of environmental flow using hydrological methods of low flow indexes, Smakhtin, Tennant and flow duration curve. Acta Geophys. 2021, 69, 285–293. [Google Scholar] [CrossRef]
- Młyński, D.; Operacz, A.; Wałęga, A. Sensitivity of methods for calculating environmental flows based on hydrological characteristics of watercourses regarding the hydropower potential of rivers. J. Clean. Prod. 2020, 250, 119527. [Google Scholar] [CrossRef]
- Hairan, M.H.; Jamil, N.R.; Azmai, M.N.A.; Looi, L.J.; Camara, M. Environmental Flow Assessment of a Tropical River System Using Hydrological Index Methods. Water 2021, 13, 2477. [Google Scholar] [CrossRef]
- Mostafavi, S.; Yasi, M. Evaluation of Environmental Flows in Rivers Using Hydrological Methods (Case study: The Barandozchi River- Urmia Lake Basin). Water Soil 2015, 29, 1219–1231. [Google Scholar] [CrossRef]
- Salinas-Rodríguez, S.A.; Sánchez-Navarro, R.; Barrios-Ordóñez, J.E. Frequency of occurrence of flow regime components: A hydrology-based approach for environmental flow assessments and water allocation for the environment. Hydrol. Sci. J. 2020, 66, 193–213. [Google Scholar] [CrossRef]
- Poff, N.L.; Tharme, R.E.; Arthington, A.H. Evolution of Environmental Flows Assessment Science, Principles, and Methodologies. In Water for the Environment: From Policy and Science to Implementation and Management; Horne, A., Webb, A., Stewardson, M., Richter, B., Acreman, M., Eds.; Elsevier Inc.: Amsterdam, The Netherlands, 2017; pp. 203–236. [Google Scholar] [CrossRef]
- Opperman, J.J.; Kendy, E.; Tharme, R.E.; Warner, A.T.; Barrios, E.; Richter, B.D. A Three-Level Framework for Assessing and Implementing Environmental Flows. Front. Environ. Sci. 2018, 6, 76. [Google Scholar] [CrossRef]
- Orth, D.J.; Maughan, O.E. Evaluation of the Incremental Methodology for Recommending Instream Flows for Fishes—Orth—1982—Transactions of the American Fisheries Society—Wiley Online Library. Trans. Am. Fish. Soc. 1982, 111, 413–445. [Google Scholar] [CrossRef]
- Mazvimavi, D.; Madamombe, E.; Makurira, H. Assessment of environmental flow requirements for river basin planning in Zimbabwe. Phys. Chem. Earth Parts A/B/C 2007, 32, 995–1006. [Google Scholar] [CrossRef]
- Abebe, W.B.; Tilahun, S.A.; Moges, M.M.; Wondie, A.; Derseh, M.G.; Nigatu, T.A.; Mhiret, D.A.; Steenhuis, T.S.; Van Camp, M.; Walraevens, K.; et al. Hydrological Foundation as a Basis for a Holistic Environmental Flow Assessment of Tropical Highland Rivers in Ethiopia. Water 2020, 12, 547. [Google Scholar] [CrossRef] [Green Version]
- Keshavarzi, A.; Hamidifar, H.; Ball, J.E. Bed morphology in vegetated estuarine river with mild-curved meander bend. Hydrol. Sci. J. 2016, 61, 2033–2049. [Google Scholar] [CrossRef] [Green Version]
- Acreman, M.; Arthington, A.H.; Colloff, M.J.; Couch, C.; Crossman, N.D.; Dyer, F.; Overton, I.; Pollino, C.A.; Stewardson, M.J.; Young, W. Environmental flows for natural, hybrid, and novel riverine ecosystems in a changing world. Front. Ecol. Environ. 2014, 12, 466–473. [Google Scholar] [CrossRef] [Green Version]
- Hamidifar, H.; Keshavarzi, A.; Rowiński, P.M. Influence of Rigid Emerged Vegetation in a Channel Bend on Bed Topography and Flow Velocity Field: Laboratory Experiments. Water 2020, 12, 118. [Google Scholar] [CrossRef] [Green Version]
- Talukdar, S.; Pal, S. Impact of dam on inundation regime of flood plain wetland of punarbhaba river basin of barind tract of Indo-Bangladesh. Int. Soil Water Conserv. Res. 2017, 5, 109–121. [Google Scholar] [CrossRef]
- Xu, W.; Fan, X.; Ma, J.; Pimm, S.L.; Kong, L.; Zeng, Y.; Li, X.; Xiao, Y.; Zheng, H.; Liu, J.; et al. Hidden Loss of Wetlands in China. Curr. Biol. 2019, 29, 3065–3071.e2. [Google Scholar] [CrossRef] [PubMed] [Green Version]
- Rezaee, A.; Bozorg-Haddad, O.; Chu, X. Reallocation of water resources according to social, economic, and environmental parameters. Sci. Rep. 2021, 11, 1–13. [Google Scholar] [CrossRef] [PubMed]
- Kubrak, J.; Kiczko, A.; Kubrak, E. Case Study: Forecasting the Lower Vistula Bed Deformation without and with Development of Dam Cascade. Water 2021, 13, 2142. [Google Scholar] [CrossRef]
- Rezaeianzadeh, M.; Stein, A.; Cox, J.P. Drought forecasting using Markov chain model and artificial neural networks. Water Resour. Manag. 2016, 30, 2245–2259. [Google Scholar] [CrossRef]
- Imani, S.; Farokhnia, A.; Morid, S.; Roozbahani, R. Spatio-temporal Analysis of Temperature and Precipitation Trends in Tashk-Bakhtegan Watershed. Amirkabir J. Civ. Eng. 2021, 52, 2931–2944. [Google Scholar] [CrossRef]
- Soheili, E.; Malekinezhad, H.; Ekhtesasi, M.R. Analysis of the trend of meteorological and hydrological droughts in semi-arid regions of Iran (Case study: Doroodzan Dam basin). Desert Manag. 2017, 9, 31–45. [Google Scholar] [CrossRef]
- Jedari-Eyvazi, J.; Moghimi, E.; Yamani, M.; Mohammadi, H.; Isaei, A.R. Effects of Ecogeomorphological Parameters on Chemical Water Quality Case Study: Kor River and Doroodzan Dam Lake. Geogr. Environ. Plan. 2010, 21, 17–32. [Google Scholar]
- Hamidifar, H.; Keshavarzi, A.; Truong, P. Enhancement of river bank shear strength parameters using Vetiver grass root system. Arab. J. Geosci. 2018, 11, 611. [Google Scholar] [CrossRef]
- Ebrahimi, M.; Taherianfard, M. Concentration of four heavy metals (cadmium, lead, mercury, and arsenic) in organs of two cyprinid fish (Cyprinus carpio and Capoeta sp.) from the Kor River (Iran). Environ. Monit. Assess. 2010, 168, 575–585. [Google Scholar] [CrossRef] [PubMed]
- Pyrce, R. Hydrological Low Flow Indices and Their Uses; Watershed Science Centre: Peterborough, ON, Canada, 2004. [Google Scholar]
- Smakhtin, V.; Anputhas, M. An Assessment of Environmental Flow Requirements of Indian River Basins; International Water Management Institute: Colombo, Sri Lanka, 2006. [Google Scholar]
- Shaeri Karimi, S.; Yasi, M.; Eslamian, S. Use of hydrological methods for assessment of environmental flow in a river reach. Int. J. Environ. Sci. Technol. 2012, 9, 549–558. [Google Scholar] [CrossRef] [Green Version]
- DWAF. White Paper on a National Water Policy for South Africa; South Africa, Department of Water Affairs and Forestry: Pretoria, South Africa, 1997; Volume 27, ISBN 0621177075.
- Mann, J.L. Instream Flow Methodologies: An Evaluation of the Tennant Method for Higher Gradient Streams in the National Forest System Lands in the Western U.S.; Colorado State University Libraries: Fort Collins, CO, USA, 2006. [Google Scholar]
- Matthews, R.C., Jr.; Bao, Y. Alternative instream flow assessment methodologies for warm water river systems. In Proceedings of the Warmwater Fisheries Symposium; Cooper, J.L., Hamre, R.H., Eds.; USDA Forest Service: Scottsdale, AZ, USA, 1991; pp. 189–196. [Google Scholar]
- Arthington, A.H. Environmental Flows: Saving Rivers in the Third Millennium; University of California Press: Berkeley, CA, USA, 2012; Volume 4, ISBN 9780520273696. [Google Scholar]
- Estes, C.C. Annual Summary of Alaska Department of Fish and Game Instream Flow Reservation Applications; Alaska Department of Fish and Game, Division of Sport Fish: Anchorage, AK, USA, 1995.
- Pastor, A.V.; Ludwig, F.; Biemans, H.; Hoff, H.; Kabat, P. Accounting for environmental flow requirements in global water assessments. Hydrol. Earth Syst. Sci. 2014, 18, 5041–5059. [Google Scholar] [CrossRef] [Green Version]
- Smakhtin, V.U.; Revenga, C.; Doll, P. Taking into Account Environmental Water Requirements in Global-Scale Water Resources Assessments; Water Resources Assessments: Colombo, Sri Lanka, 2004. [Google Scholar]
- Caissie, D.; El-Jabi, N. Comparison and regionalization of hydrologically based instream flow techniques in Atlantic Canada. Can. J. Civ. Eng. 1995, 22, 235–246. [Google Scholar] [CrossRef]
- Karakoyun, Y.; Dönmez, A.H.; Yumurtacı, Z. Comparison of environmental flow assessment methods with a case study on a runoff river–type hydropower plant using hydrological methods. Environ. Monit. Assess. 2018, 190, 722. [Google Scholar] [CrossRef] [PubMed]
- Smakhtin, V.U.; Shilpakar, R.L.; Hughes, D.A. Hydrology-based assessment of environmental flows: An example from Nepal. Hydrol. Sci. J. 2006, 51, 207–222. [Google Scholar] [CrossRef] [Green Version]
- Armstrong, D.S.; Richards, T.A.; Parker, G.W. Assessment of Habitat, Fish Communities, and Streamflow Requirements for Habitat Protection, Ipswich River, Massachusetts, 1998–1999; Ipswich River: Ipswich, MA, USA, 2001. [Google Scholar]
- Richter, B.D.; Davis, M.M.; Apse, C.; Konrad, C. A Presumptive Standard For Environmental Flow Protection. River Res. Appl. 2012, 28, 1312–1321. [Google Scholar] [CrossRef]
- Acreman, M.; Dunbar, M.J. Defining environmental river flow requirements—A review. Hydrol. Earth Syst. Sci. 2004, 8, 861–876. [Google Scholar] [CrossRef]
- Iran Ministry of Energy. Guideline for Finding Aquatic Ecosystems Environmental Water Requirement; Iran Ministry of Energy: Tehran, Iran, 2012.
- Ahmadi, M.H.; Yousefi, H.; Farzin, S.; Rajabpour, R. Management of water resources and demands in Mulla Sadra, Doroodzan and Sivand Dams located in Bakhtegan-Maharlou watershed. Iran-Watershed Manag. Sci. Eng. 2018, 12, 33–41. [Google Scholar]
- Davari, A.; Bagheri, A.; Mohammad-Vali-Samani, J. Assessing Environmental Flow Regime In Kor River: A Holistic Approach Using System Dynamics Modeling. Iran Water Resour. Res. 2020, 15, 68–91. [Google Scholar]
- Sheykhi, V.; Moore, F.; Sakeri, A. Characterization and Quality Index of Kor River Water. Environ. Sci. 2014, 12, 103–114. [Google Scholar]
- TNC. Indicators of Hydrological Alteration Version 7.1 User’s Manual; TNC: Arlington, VA, USA, 2009. [Google Scholar]
- Zhang, Q.; Xiao, M.; Liu, C.-L.; Singh, V.P. Reservoir-induced hydrological alterations and environmental flow variation in the East River, the Pearl River basin, China. Stoch. Environ. Res. Risk Assess. 2014, 28, 2119–2131. [Google Scholar] [CrossRef]
- Greenwood, M.J.; McIntosh, A.R. Flooding impacts on responses of a riparian consumer to cross-ecosystem subsidies. Ecology 2008, 89, 1489–1496. [Google Scholar] [CrossRef] [PubMed]
- Death, R.G.; Fuller, I.C.; Macklin, M.G. Resetting the river template: The potential for climate-related extreme floods to transform river geomorphology and ecology. Freshw. Biol. 2015, 60, 2477–2496. [Google Scholar] [CrossRef]
- Williams, G.P.; Wolman, M.G. Downstream Effects of Dams on Alluvial Rivers; United States Government Printing Office: Washington, DC, USA, 1984; Volume 1286.
- Collier, M.; Webb, R.H.; Schmidt, J.C. Dams and Rivers: A Primer on the Downstream Effects of Dams. Circular 1126; US Geological Survey: Tucson, AZ, USA, 1996; 94p. [CrossRef]
- Guo, H.; Hu, Q.; Zhang, Q.; Feng, S. Effects of the Three Gorges Dam on Yangtze River flow and river interaction with Poyang Lake, China: 2003–2008. J. Hydrol. 2012, 416–417, 19–27. [Google Scholar] [CrossRef]
- Marcinkowski, P.; Grygoruk, M. Long-Term Downstream Effects of a Dam on a Lowland River Flow Regime: Case Study of the Upper Narew. Water 2017, 9, 783. [Google Scholar] [CrossRef] [Green Version]
- Sajedipour, S.; Zarei, H.; Oryan, S. Estimation of environmental water requirements via an ecological approach: A case study of Bakhtegan Lake, Iran. Ecol. Eng. 2017, 100, 246–255. [Google Scholar] [CrossRef]
- Hamidifar, H.; Zanganeh-Inaloo, F. Determination of Minimum Water Requirement of the Bakhtegan Wetland Using a New Hydrological Index. In Proceedings of the 11th International River Engineering Conference, Ahvaz, Iran, 29–31 January 2019; Sajadi, S.M., Ed.; Shahid Chamran University: Ahvaz, Iran, 2019. [Google Scholar]
- Hejazizadeh, Z.; Ashofteh, P.; Fatahi, E.; Gholampour, Z. Analysis of streamflow changes under climate change using rainfall-runoff model in the Kor River basin. J. Geogr. Sci. 2015, 11, 31–47. [Google Scholar]
- Bagheri, M.H.; Bagheri, A.; Sohooli, G.A. Analysis of Changes in the Bakhtegan Lake Water Body under the Influence of Natural and Human Factors. Iran Water Resour. Res. 2016, 12, 1–11. [Google Scholar]
- Bunn, S.e.; Arthington, A.h. Basic Principles and Ecological Consequences of Altered Flow Regimes for Aquatic Biodiversity. Environ. Manag. 2002, 30, 492–507. [Google Scholar] [CrossRef] [PubMed] [Green Version]
- Harper, M.; Rytwinski, T.; Taylor, J.J.; Bennett, J.R.; Smokorowski, K.E.; Cooke, S.J. How do changes in flow magnitude due to hydroelectric power production affect fish abundance and diversity in temperate regions? A systematic review protocol. Environ. Evid. 2020, 9, 1–11. [Google Scholar] [CrossRef]
- Hellawell, J.M. Biological Indicators of Freshwater Pollution and Environmental Management; Springer: London, UK; New York, NY, USA, 1986. [Google Scholar]
- Wang, Y.; Wang, D.; Lewis, Q.W.; Wu, J.; Huang, F. A framework to assess the cumulative impacts of dams on hydrological regime: A case study of the Yangtze River. Hydrol. Process. 2017, 31, 3045–3055. [Google Scholar] [CrossRef]
- Poff, N.L.R.; Allan, J.D.; Bain, M.B.; Karr, J.R.; Prestegaard, K.L.; Richter, B.D.; Sparks, R.E.; Stromberg, J.C. The natural flow regime: A paradigm for river conservation and restoration. Bioscience 1997, 47, 769–784. [Google Scholar] [CrossRef]
- Li, T.; Pasternack, G.B. Revealing the diversity of hydropeaking flow regimes. J. Hydrol. 2021, 598, 126392. [Google Scholar] [CrossRef]
- Heiler, G.; Hein, T.; Schiemer, F.; Bornette, G. Hydrological connectivity and flood pulses as the central aspects for the integrity of a river-floodplain system. Regul. Rivers Res. Manag. 1995, 11, 351–361. [Google Scholar] [CrossRef]
- Ward, J.V.; Stanford, J.A. Ecological connectivity in alluvial river ecosystems and its disruption by flow regulation. Regul. Rivers Res. Manag. 1995, 11, 105–119. [Google Scholar] [CrossRef]
- Hosseini, A.; Sotoudeh, E.; Mousavi, Z.; Mohammadi, M.; Abbaszadeh, A. Reproductive biology of Capoeta capoeta intermedia (Cyprinidae, Teleostei) in Shapour River (Bushehr province), Iran. J. Anim. Res. 2017, 30, 1–14. [Google Scholar]


| Description of Flows | Recommended EWR (% of MAF) | Recommended EWR (m3/s) | ||
|---|---|---|---|---|
| October–March | April–September | October–March | April–September | |
| Flushing or maximum | 200 | 200 | 52.62 | 52.62 |
| Optimum range | 60–100 | 60–100 | 15.79–26.31 | 15.79–26.31 |
| Outstanding | 40 | 60 | 10.52 | 15.79 |
| Excellent | 30 | 50 | 7.89 | 13.16 |
| Good | 20 | 40 | 5.26 | 10.52 |
| Fair or degrading | 10 | 30 | 2.63 | 7.89 |
| Poor or minimum | 10 | 10 | 2.63 | 2.63 |
| Severe degradation | <10 | <10 | <2.63 | <2.63 |
| Month | MMF | MAF | Tenant | Tessman | FDC Shifting | DRM | Flow Duration Indices | RVA | |||
|---|---|---|---|---|---|---|---|---|---|---|---|
| Traditional | Modified | Q50 | Q90 | Q95 | |||||||
| October | 10.13 | 26.31 | 2.63 | 2.63 | 10.13 | 5.00 | 5.34 | 8.95 | 6.31 | 6.07 | 8.10 |
| November | 12.96 | 26.31 | 2.63 | 2.63 | 10.53 | 6.30 | 5.75 | 11.01 | 6.68 | 6.28 | 7.55 |
| December | 24.32 | 26.31 | 2.63 | 2.63 | 10.53 | 11.00 | 6.42 | 16.15 | 10.78 | 10.38 | 10.19 |
| January | 33.63 | 26.31 | 2.63 | 2.63 | 13.45 | 13.90 | 7.60 | 20.06 | 12.48 | 11.95 | 14.15 |
| February | 42.07 | 26.31 | 2.63 | 7.89 | 16.83 | 15.70 | 8.38 | 33.82 | 15.51 | 13.83 | 15.36 |
| March | 56.76 | 26.31 | 2.63 | 7.89 | 22.71 | 19.50 | 9.97 | 45.48 | 20.5 | 18.20 | 22.50 |
| April | 57.02 | 26.31 | 7.89 | 7.89 | 22.81 | 19.50 | 11.88 | 46.95 | 24.66 | 22.61 | 31.64 |
| May | 30.43 | 26.31 | 7.89 | 7.89 | 12.17 | 12.20 | 9.50 | 24.71 | 12.02 | 10.85 | 31.94 |
| June | 15.81 | 26.31 | 7.89 | 2.63 | 10.53 | 8.00 | 8.14 | 12.92 | 6.50 | 5.91 | 15.05 |
| July | 12.03 | 26.31 | 7.89 | 2.63 | 10.53 | 6.30 | 4.30 | 10.28 | 6.40 | 6.04 | 10.71 |
| August | 10.60 | 26.31 | 7.89 | 2.63 | 10.53 | 5.40 | 4.11 | 9.22 | 6.17 | 5.89 | 9.24 |
| September | 9.98 | 26.31 | 7.89 | 2.63 | 9.98 | 5.00 | 3.81 | 8.64 | 5.67 | 5.40 | 8.66 |
| MAF | 10% MAF | 20% MAF | 30% MAF | LFR | HFR | EWR |
|---|---|---|---|---|---|---|
| 26.31 | 2.63 | 5.26 | 7.89 | 15.13 | 0 | 15.13 |
| Indices | Q70 | Q75 | Q80 | Q85 | Q90 | Q95 |
|---|---|---|---|---|---|---|
| Flow (m3/s) | 18.41 | 17.51 | 16.66 | 15.87 | 15.13 | 14.42 |
| Environmental Management Class | Class A | Class B | Class C | Class D | Class E | Class F |
|---|---|---|---|---|---|---|
| EWR (% of MAF) | 69.7 | 49.9 | 36.4 | 27.2 | 20.4 | 15.0 |
| EWR (m3/s) | 18.3 | 13.1 | 9.6 | 7.2 | 5.4 | 3.9 |
| Probability Distribution | Error (%) |
|---|---|
| Normal | 0.59 |
| Log-normal | 0.80 |
| Pearson type III | 0.51 |
| Log-Pearson type III | 1.21 |
| Gumbel | 0.65 |
| 7Q2 | 7Q10 | ||
|---|---|---|---|
| Flow (m3/s) | Percent of MAF (%) | Flow (m3/s) | Percent of MAF (%) |
| 7.2 | 27.3 | 10.7 | 40.6 |
| Environmental Management Class | A | A/B | B | B/C | C | C/D | D |
|---|---|---|---|---|---|---|---|
| EWR (% of MAF) | 64.40 | 51.90 | 40.80 | 33.20 | 25.50 | 20.80 | 16.20 |
| EWR (m3/s) | 16.94 | 13.65 | 10.73 | 8.73 | 6.71 | 5.47 | 4.26 |
| Month | Before Dam Construction | After Dam Construction | RVA Boundaries | |||||
|---|---|---|---|---|---|---|---|---|
| Ave. | Min. | Max. | Ave. | Min. | Max. | Lower | Upper | |
| October | 9.38 | 5.25 | 22.40 | 4.49 | 0.77 | 24.05 | 8.10 | 11.12 |
| November | 9.30 | 4.90 | 22.40 | 3.02 | 1.64 | 23.90 | 7.55 | 10.72 |
| December | 11.44 | 6.20 | 29.60 | 4.87 | 3.29 | 36.60 | 10.19 | 13.58 |
| January | 16.00 | 6.90 | 71.00 | 5.42 | 2.66 | 20.50 | 14.15 | 21.19 |
| February | 24.00 | 7.52 | 83.00 | 7.79 | 3.47 | 40.70 | 15.36 | 29.28 |
| March | 33.10 | 12.75 | 113.70 | 18.95 | 4.08 | 57.10 | 22.50 | 48.56 |
| April | 53.20 | 130 | 134.00 | 13.6 | 3.07 | 35.00 | 31.64 | 66.40 |
| May | 42.90 | 8.38 | 108.00 | 13.95 | 3.39 | 43.40 | 31.94 | 53.72 |
| June | 19.70 | 2.25 | 77.60 | 5.28 | 2.92 | 27.30 | 15.05 | 25.22 |
| July | 11.92 | 3.40 | 43.50 | 5.22 | 1.00 | 14.35 | 10.71 | 16.02 |
| August | 10.66 | 3.10 | 33.10 | 9.24 | 0.61 | 37.50 | 9.236 | 12.64 |
| September | 9.88 | 3.40 | 22.70 | 6.38 | 0.11 | 10.70 | 8.66 | 11.39 |
| Month | Tenant | Tessman | FDC Shifting | DRM | Flow Duration Indices | RVA | DEWR | Average | |||
|---|---|---|---|---|---|---|---|---|---|---|---|
| Trad. | Modi. | Q50 | Q90 | Q95 | |||||||
| October | 61.21 | 61.21 | −49.41 | 26.03 | 21.24 | −32.01 | 6.93 | 10.47 | −19.47 | 33.33 | 9.58 |
| November | 71.29 | 71.29 | −14.96 | 31.43 | 37.23 | −20.20 | 27.07 | 31.44 | 17.58 | 33.33 | 28.02 |
| December | 72.40 | 72.40 | −10.49 | −15.52 | 32.63 | −69.46 | −13.12 | −8.92 | −6.93 | 66.67 | 5.89 |
| January | 78.91 | 78.91 | −7.86 | −11.57 | 39.05 | −60.87 | −0.08 | 4.17 | −13.47 | 55.56 | 11.91 |
| February | 87.97 | 63.92 | 23.05 | 28.26 | 61.68 | −54.64 | 29.08 | 36.76 | 29.77 | 22.22 | 33.98 |
| March | 89.37 | 68.10 | 8.17 | 21.20 | 59.68 | −83.91 | 17.10 | 26.41 | 9.02 | 22.22 | 23.90 |
| April | 63.04 | 63.04 | −6.84 | 8.63 | 44.36 | −119.91 | −15.50 | −5.90 | −48.20 | 55.56 | −1.92 |
| May | 39.35 | 39.35 | 6.46 | 6.13 | 26.98 | −89.93 | 7.61 | 16.60 | −145.50 | 22.22 | −10.33 |
| June | −19.18 | 60.27 | −59.06 | −20.92 | −22.96 | −95.17 | 1.81 | 10.73 | −127.34 | 66.67 | −30.20 |
| July | 6.29 | 68.76 | −25.06 | 24.99 | 48.93 | −22.09 | 23.99 | 28.27 | −27.20 | 33.33 | 14.10 |
| August | −10.20 | 63.27 | −47.07 | 24.58 | 42.60 | −28.77 | 13.83 | 17.74 | −28.99 | 44.44 | 5.22 |
| September | −40.64 | 53.12 | −77.90 | 11.05 | 32.09 | −54.01 | −1.07 | 3.74 | −54.37 | 55.56 | −14.22 |
| Average | 41.65 | 63.64 | −21.75 | 11.19 | 35.29 | −60.91 | 8.14 | 14.29 | −34.59 | ||
| Method | Description | EWR | EWR |
|---|---|---|---|
| (% of MAF) | (m3/s) | ||
| Tennant | October–March | 10 | 2.63 |
| April–September | 30 | 7.89 | |
| Tennant Modified | February–May | 30 | 7.89 |
| June–January | 10 | 2.63 | |
| Tessman | 51 | 13.39 | |
| Smakhtin | 58 | 15.13 | |
| Flow duration indices | Q70 | 70 | 18.41 |
| Q75 | 67 | 17.51 | |
| Q80 | 63 | 16.66 | |
| Q85 | 60 | 15.87 | |
| Q90 | 58 | 15.13 | |
| Q95 | 55 | 14.42 | |
| Low-flow indices | 7Q10 | 40.6 | 10.65 |
| 7Q2 | 27.3 | 7.17 | |
| FDC shifting | Class C | 36.4 | 9.60 |
| DRM | Class C | 25.5 | 7.10 |
| RVA | Low RVA limit | 59 | 15.42 |
Publisher’s Note: MDPI stays neutral with regard to jurisdictional claims in published maps and institutional affiliations. |
© 2022 by the authors. Licensee MDPI, Basel, Switzerland. This article is an open access article distributed under the terms and conditions of the Creative Commons Attribution (CC BY) license (https://creativecommons.org/licenses/by/4.0/).
Share and Cite
Hamidifar, H.; Akbari, F.; Rowiński, P.M. Assessment of Environmental Water Requirement Allocation in Anthropogenic Rivers with a Hydropower Dam Using Hydrologically Based Methods—Case Study. Water 2022, 14, 893. https://doi.org/10.3390/w14060893
Hamidifar H, Akbari F, Rowiński PM. Assessment of Environmental Water Requirement Allocation in Anthropogenic Rivers with a Hydropower Dam Using Hydrologically Based Methods—Case Study. Water. 2022; 14(6):893. https://doi.org/10.3390/w14060893
Chicago/Turabian StyleHamidifar, Hossein, Farzaneh Akbari, and Paweł M. Rowiński. 2022. "Assessment of Environmental Water Requirement Allocation in Anthropogenic Rivers with a Hydropower Dam Using Hydrologically Based Methods—Case Study" Water 14, no. 6: 893. https://doi.org/10.3390/w14060893