Article

Driving Factors of Total Organic Carbon in Danjiangkou Reservoir Using Generalized Additive Model

1
International Joint Laboratory of Watershed Ecological Security of Middle Route Project of South-North Water Diversion in Henan Province, College of Water Resource and Environment Engineering, Nanyang Normal University, Nanyang 473061, China
2
Nanyang Branch Bureau of Construction and Administration Bureau of South-to-North Water Division Project, Nanyang 473000, China
3
Department of Environmental Sciences, University of California, Riverside, CA 92521, USA
4
Department of Botany and Plant Sciences, University of California, Riverside, CA 92521, USA
*
Author to whom correspondence should be addressed.
Water 2022, 14(6), 891; https://doi.org/10.3390/w14060891
Submission received: 24 January 2022 / Revised: 22 February 2022 / Accepted: 10 March 2022 / Published: 12 March 2022
(This article belongs to the Special Issue Recent Progress in CO2 Emission from the World’s Rivers)

Abstract

:
Dynamic changes in total organic carbon (TOC) concentration in lakes and reservoirs affect the functions of aquatic ecosystems and are a key component of water quality management, especially in drinking water sources. The Danjiangkou Reservoir is the water source area of the Middle Route Project of the South-to-North Water Diversion in China. Its water quality is of critical importance to the safety of water diversion. TOC concentration and other environmental factors at 19 sampling sites in the Danjiangkou Reservoir were investigated quarterly during 2020–2021 to explore the differences at the spatio-temporal scales. A generalized additive model (GAM) was used to analyze the environmental factors correlated with the observed spatio-temporal variations of TOC concentration. The results showed that the comprehensive trophic level index (TLI) of the Danjiangkou Reservoir was under the state of intermediate nutrition, and the water quality was overall good. In terms of temporal patterns, TOC concentration was higher in both spring and summer and lower in other seasons. Spatially, TOC concentrations were found in descending order from the site of outlet, Han reservoir, entrance of reservoir, and Dan reservoir. The single-factor GAM model showed that TOC correlated with different environmental factors across spatio-temporal scales. Water temperature (WT), permanganate index (CODMn), and ammonia nitrogen (NH4+-N) were significantly correlated with TOC in autumn, but only total nitrogen (TN) and transparency (SD) were significant in winter. Spatially, WT, chemical oxygen demand (COD), NH4+-N, TN, and conductivity (Cond) correlated with TOC in the Dan reservoir, but WT, COD, NH4+-N, total phosphorus (TP), and chlorophyll a (Chl.a) were significant in the Han reservoir. The multi-factor GAM model indicated that the environmental factors correlated with TOC concentration were mainly WT, TN, Cond, CODMn, and TP, among which WT and Cond showed a significant linear relationship with TOC concentration (edf = 1, p < 0.05), while TN, CODMn, and TP had a significant nonlinear relationship with TOC concentration (edf > 1, p < 0.05). Comprehensive trophic level index (TLI) and TOC concentration revealed a highly significant correlation (R2 = 0.414, p < 0.001). Therefore, the GAM model could well explain the environmental factors associated with the spatio-temporal dynamics of TOC concentration, providing a reference for the evaluation of water quality and research on the carbon cycle in similar inland reservoirs.

1. Introduction

The South-to-North Water Diversion Project is the world’s largest inter-basin water diversion project [1]. It is a major component of the strategic infrastructure for optimizing water resources and protecting and improving livelihoods in China. As the water source area of the South-to-North Water Diversion Project, the Danjiangkou Reservoir provides water supply to more than 40 cities and 140 million people in the water receiving area. Therefore, the protection of water quality and aquatic ecosystem health in the Danjiangkou Reservoir is extremely important, which is an important part of the ecological management of major rivers in China [2]. Previous studies on the Danjiangkou Reservoir mainly focused on the evaluation of water quality, the structural characteristics of phytoplankton and zooplankton communities [3,4,5,6,7,8], but rarely on organic carbon.
Total organic carbon (TOC) is an important indicator of the degree of organic carbon-containing pollution in aquatic bodies. TOC refers to the carbon content of organic matter dissolved or suspended in water (expressed as mass concentration), including dissolved organic carbon (DOC) and particulate organic carbon (POC) [9]. TOC mainly comes from photosynthesis of phytoplankton, death of plankton and degradation of excreta, large inputs of terrestrial organic matter, and natural dissolution of lake sediments, which interact with the ecological environment and constrain each other [10]. Compared with other indicators of water quality, TOC analysis has the advantages of high speed, high accuracy, and less hazardous waste, and it is not affected by potential substances in the detection process [11]. Organic carbon in water is the largest reservoir of active organic carbon in the biosphere [12], playing an important role in the carbon cycle of lakes and reservoirs [13], which has generated increasing attention on TOC. Using three-dimensional kriging analysis on sediment TOC and field measurements in Cedar and Ortega Rivers, Florida, USA, it was found that the southern part of the Ortega River received more TOC, while almost all of the hydrocarbons entered into the Cedar River [14]. Analyzing the distribution of TOC and the influencing aspects in the Daya Bay, Pearl River, China, it was shown that TOC was mainly impacted by seasonal input of river runoff, phytoplankton, and petroleum [15]. By contrasting the effects of hydrologic characteristics on the sources and spatio-temporal characteristics of organic carbon in Paldang Lake and Chungju Lake in Korea, meteorologic and hydrologic controls strongly influenced the source and spatio-temporal dynamics of lacustrine organic carbon [16].
Previous research on TOC in water bodies has mainly focused on oceans, shallow lakes, and rivers, but least on inland deep-water and river-type reservoirs. The Danjiangkou Reservoir is a subtropical deep-water reservoir. As the largest source of drinking water for a population of 140 million people, the safety of its water quality is particularly important. This study was conducted through a seasonal survey of TOC concentration at 19 sampling sites in the Danjiangkou Reservoir to investigate the spatio-temporal distribution of TOC and the driving factors behind this distribution. Considering the complexity of the relationship between TOC concentration and environmental factors, GAM models were used to analyze these correlations. The broader goal of this project was to provide further insight into the carbon cycle in freshwater reservoirs and basic guidelines for establishing water quality evaluation systems for similar reservoirs.

2. Materials and Methods
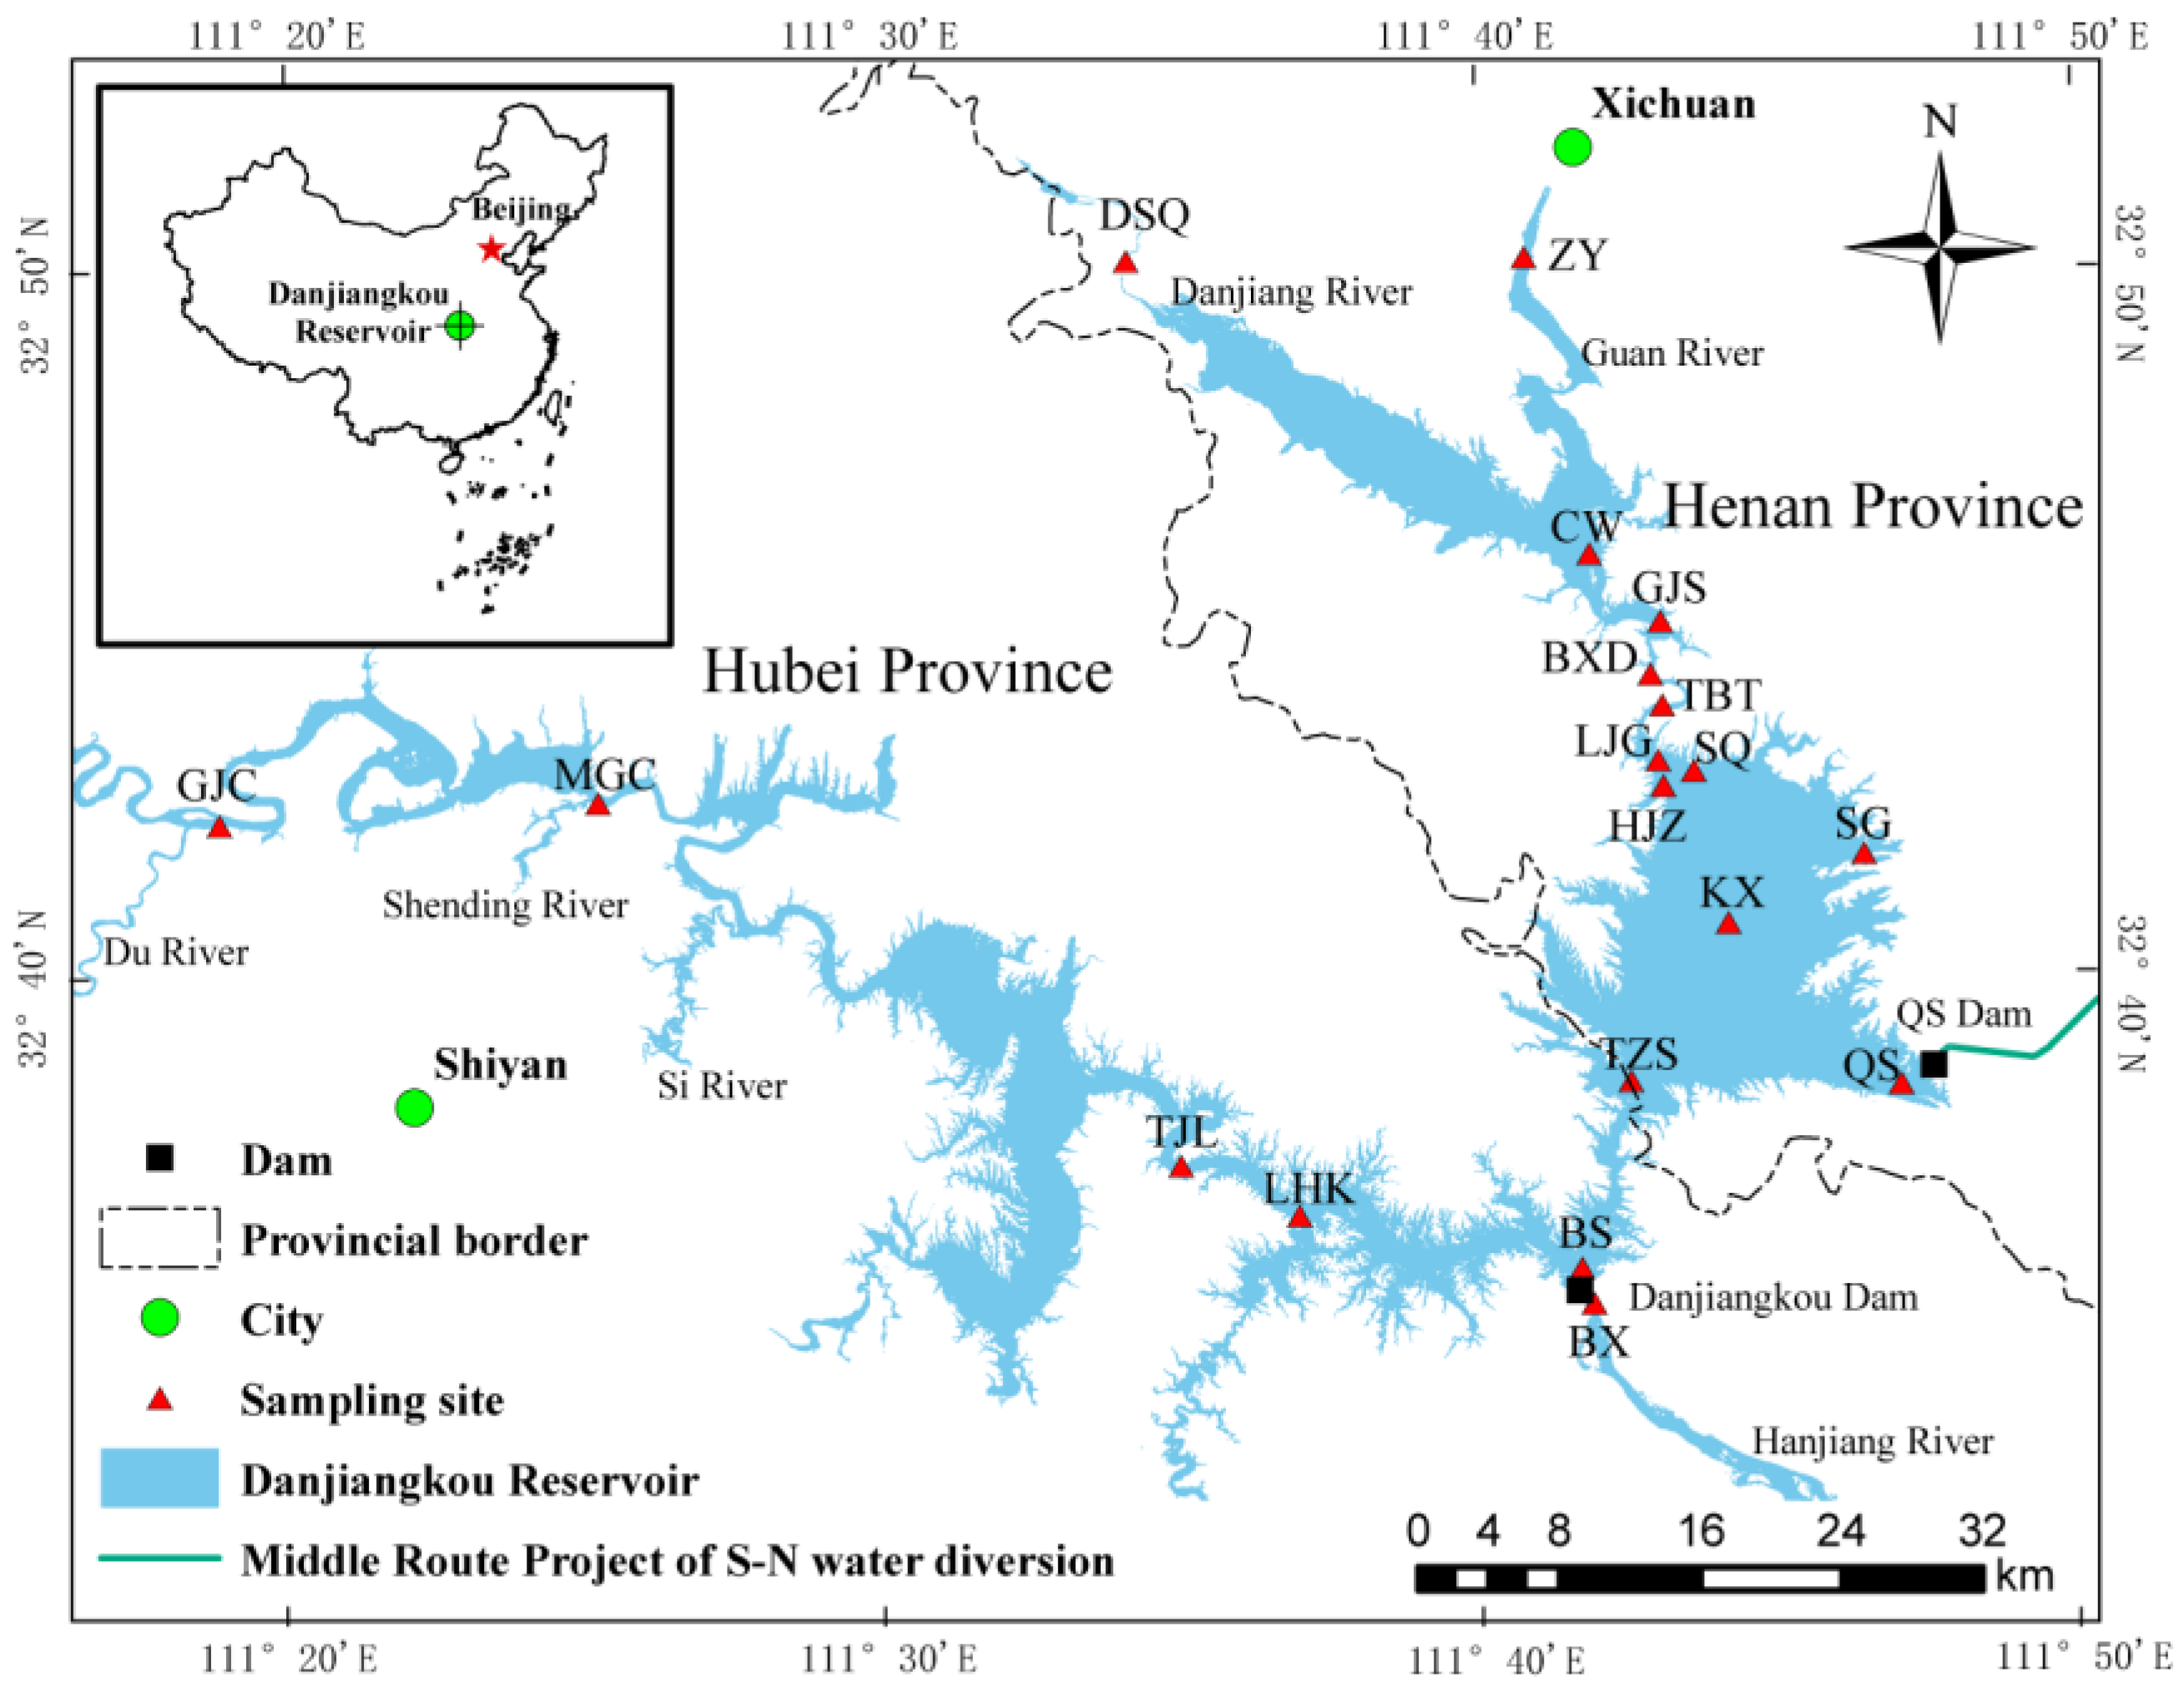
2.1. Study Area

The Danjiangkou Reservoir is in the city of Danjiangkou in Hubei Province and Xichuan County in Henan Province. It provides water supply, flood control, and power generation services [17]. The reservoir area is in a subtropical monsoon climate, with four distinct seasons and abundant rainfall. Composed of Han and Dan reservoirs [18], the Danjiangkou Reservoir is the largest artificial freshwater lake in Asia with a basin area of 9.5 × 10⁴ km, a normal storage level of 157 m, a total reservoir capacity of 174.5 × 10⁸ m3, and a reservoir area of 1050 km2.
According to the geographical characteristics of the Danjiangkou Reservoir and the degree of human activities, 19 typical sampling sites were set up in the Danjiangkou Reservoir (Figure 1). There were 13 sampling sites in Dan Reservoir: Zhangying (ZY), Dashiqiao (DSQ), Caowan (CW), Guojiashan (GJS), Baxiandong (BXD), Taibaitan (TBT), Heijizui (HJZ), Lijiagou (LJG), Shiqiao (SQ), Songgang (SG), Kuxin (KX), Qushou (QS), and Taizishan (TZS). The ZY and DSQ sites are located near the entrance of Dan Reservoir at the Guan and Danjiang Rivers, respectively, and QS is near the intake of the head of the Middle Route of the South-to-North Water Diversion Project. There were five sampling sites in Han Reservoir: the dam (BS), below the Longhekou (LHK), Tianjialing (TJL), Magou Village (MGC), and Gongjia Village (GJC). The LHK and MGC sites are located at the entrance of Han Reservoir. There was one sampling site located 100 m downstream of the Danjiangkou Dam: below the dam (BX).

2.2. Sample Collection and Determination

Samples of TOC and environmental factors were collected in May (spring), July (summer), October (autumn) 2020, and January (winter) 2021. A columnar water sampler was used to collect 2 L samples at 0~50 cm surface water, which were stored at low temperature, protected from light, and brought back to the laboratory for analysis.
TOC was determined using a total organic carbon analyzer (Jena multi N/C3100, Germany), with reference to the environmental protection standard “Water quality—Determination of total organic carbon—Combustion oxidation nondispersive infrared absorption method” (HJ501-2009) [19].
Water quality parameters such as water temperature (WT), pH, electrical conductivity (Cond), and dissolved oxygen (DO) were measured on-site using a YSI handheld multi-parameter instrument (Model YSI 6920, YSI Incorporated, Yellow Springs, OH, USA). Transparency (SD) was determined with a Secchi disk. Total phosphorus (TP), total nitrogen (TN), ammonium nitrogen (NH4+-N), nitrate nitrogen (NO3-N), chemical oxygen demand (COD), permanganate index (CODMn), and chlorophyll a (Chl.a) were determined in the laboratory with reference to the “water and wastewater monitoring analytical methods” (fourth edition) [20].

2.3. Data Processing and Analysis

2.3.1. Data Processing

Statistics and analysis of the basic data were performed with Microsoft Excel 2019. The spatio-temporal distribution of TOC was visually presented with ArcGis 10.2. Principal component analysis (PCA), changes in monitored values of 12 environmental variables over space and time were evaluated by analysis of variance (ANOVA), and the GAM model was composed on the R 3.6.2 software “vegan” [21], “ggplot2,” and “mgcv” [22] packages.

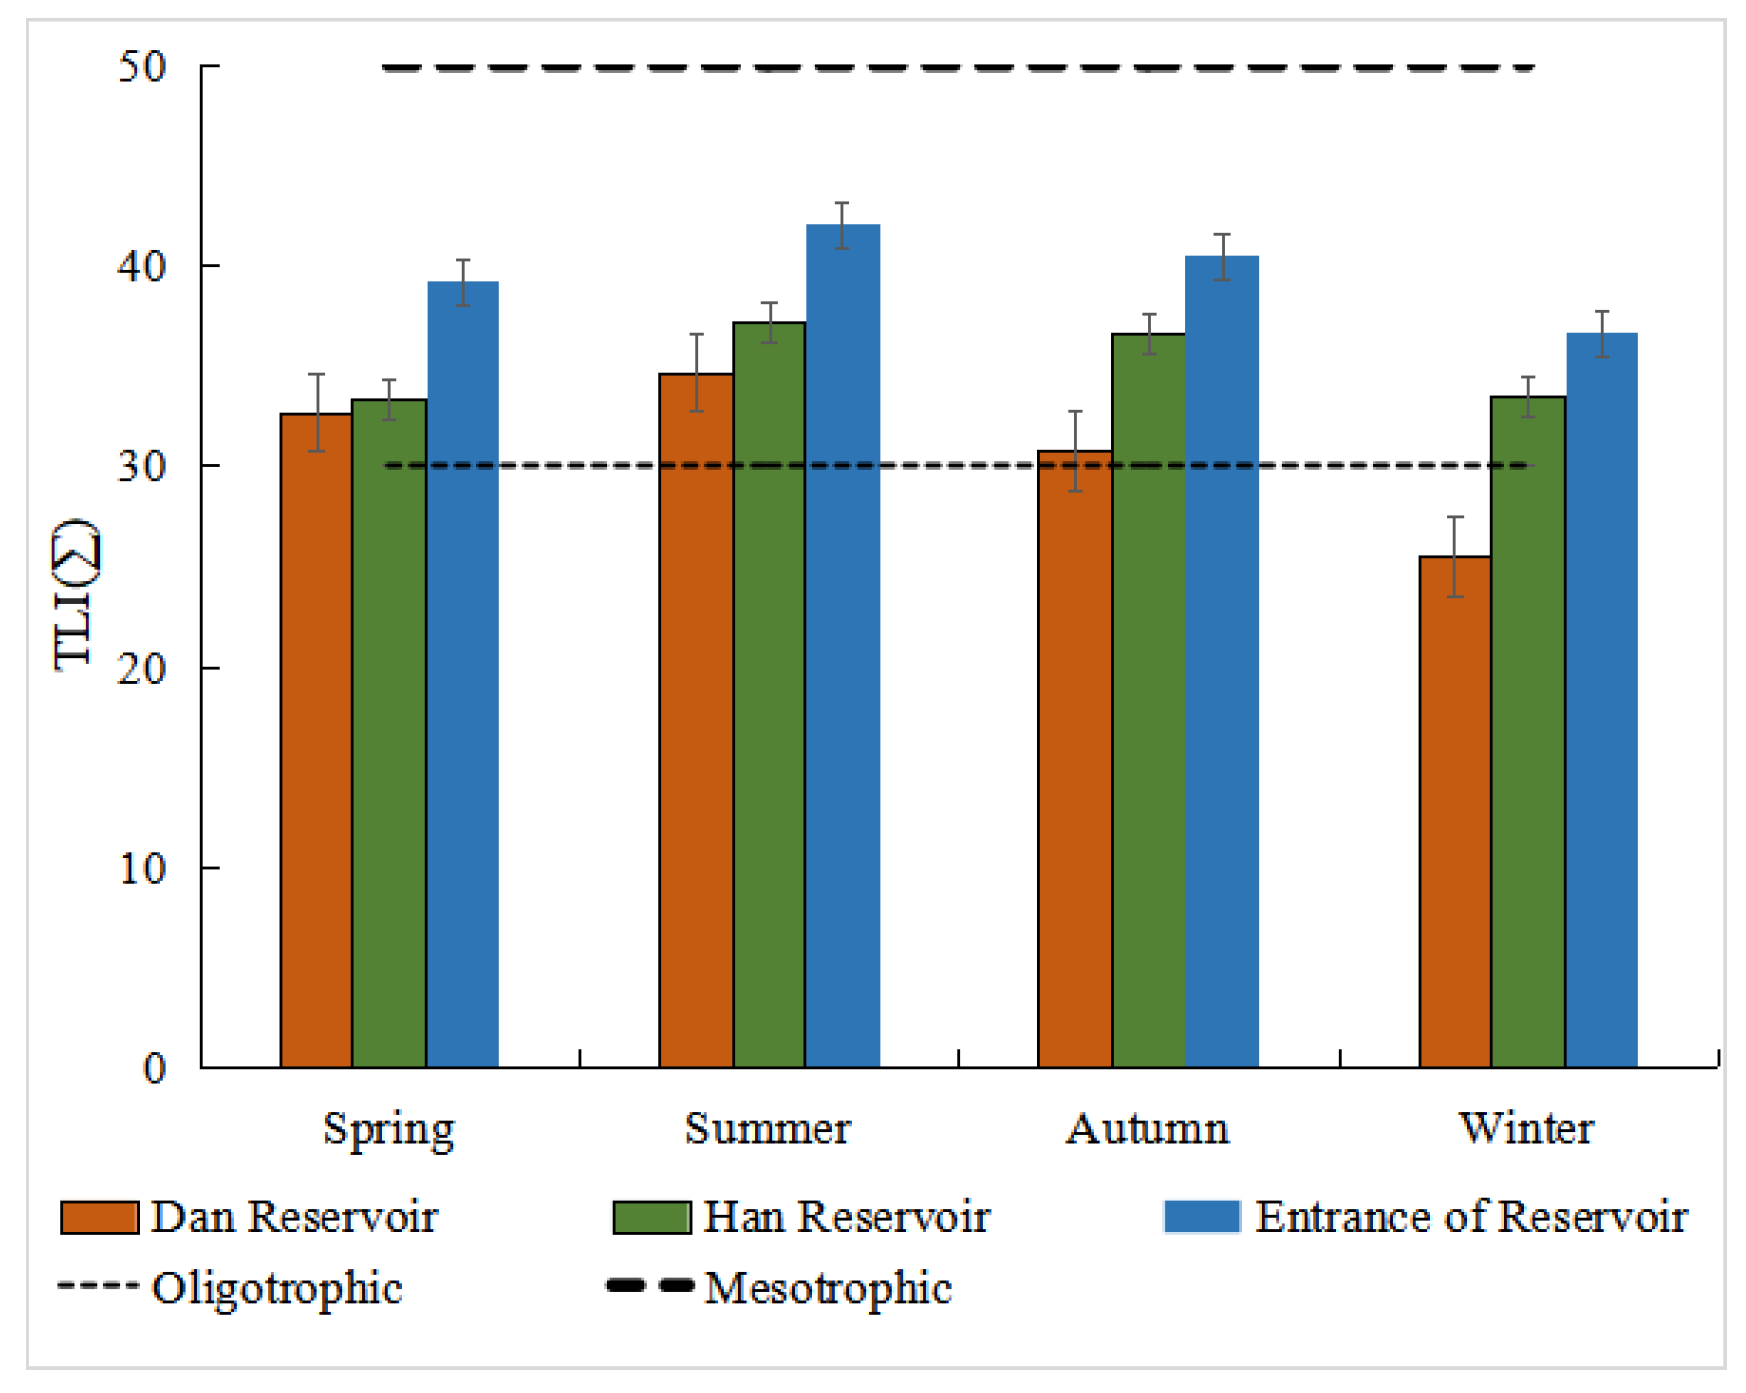
2.3.2. Comprehensive Nutrient Status Evaluation of Water Quality

The comprehensive trophic level index (TLI) was adopted to evaluate the trophic status of the Danjiangkou Reservoir [23,24]. The index is based on Chl.a, TP, TN, SD, and CODMn as the evaluation indicators. The calculation formula is:
T L I ( ) = j = 1 m W j T L I ( j )
where TLI(Σ) is the comprehensive trophic state index Wj is the weight corresponding to the parameter j, TLI(j) represents the trophic state index of the parameter j, and m is the number of evaluation parameters. A series of numbers from 0 to 100 was used to classify the trophic status of the lakes, as shown in Table 1.

2.3.3. Generalized Additive Model (GAM)

The GAM model is an extension of the generalized linear model, which provides insight into the relationship between response variables and explanatory variables and determines the importance of each explanatory variable by building a non-parametric model [25]. It has been applied to various research areas such as agriculture and ecology, especially for the analysis of monitoring data [26]. The GAM model used a connection function to establish the relationship between the response variable (TOC concentration) and explanatory variables (environmental factors). The general formula is:
s ( μ ) = a 0 + i = 1 k f i ( x i ) + ε i
where s (μ) is the link function, a0 is the constant intercept term, fi (xi) is i variable interpreted by the non-parametric smoothing function, k is the total number of explanatory variables, and εi is a random variable that obeys normal distribution.
After the basic model was constructed, the model variables were selected according to the Akaike information criterion (AIC), and the best explanatory variables were screened out [27]. The smaller the AIC, the better the model fit. The estimated degrees of freedom (d.f.) were used to determine whether the dependent variable was linearly related to the respective variable (d.f. = 1, represents a linear relationship between the environmental factor and TOC concentration, and the larger d.f. value, the more obvious nonlinear relationship). The p-value was used to determine the significance level of statistical results. The variance explanation rate (deviance explained) was the model’s interpretation rate of the overall change of the dependent variable.

3. Results

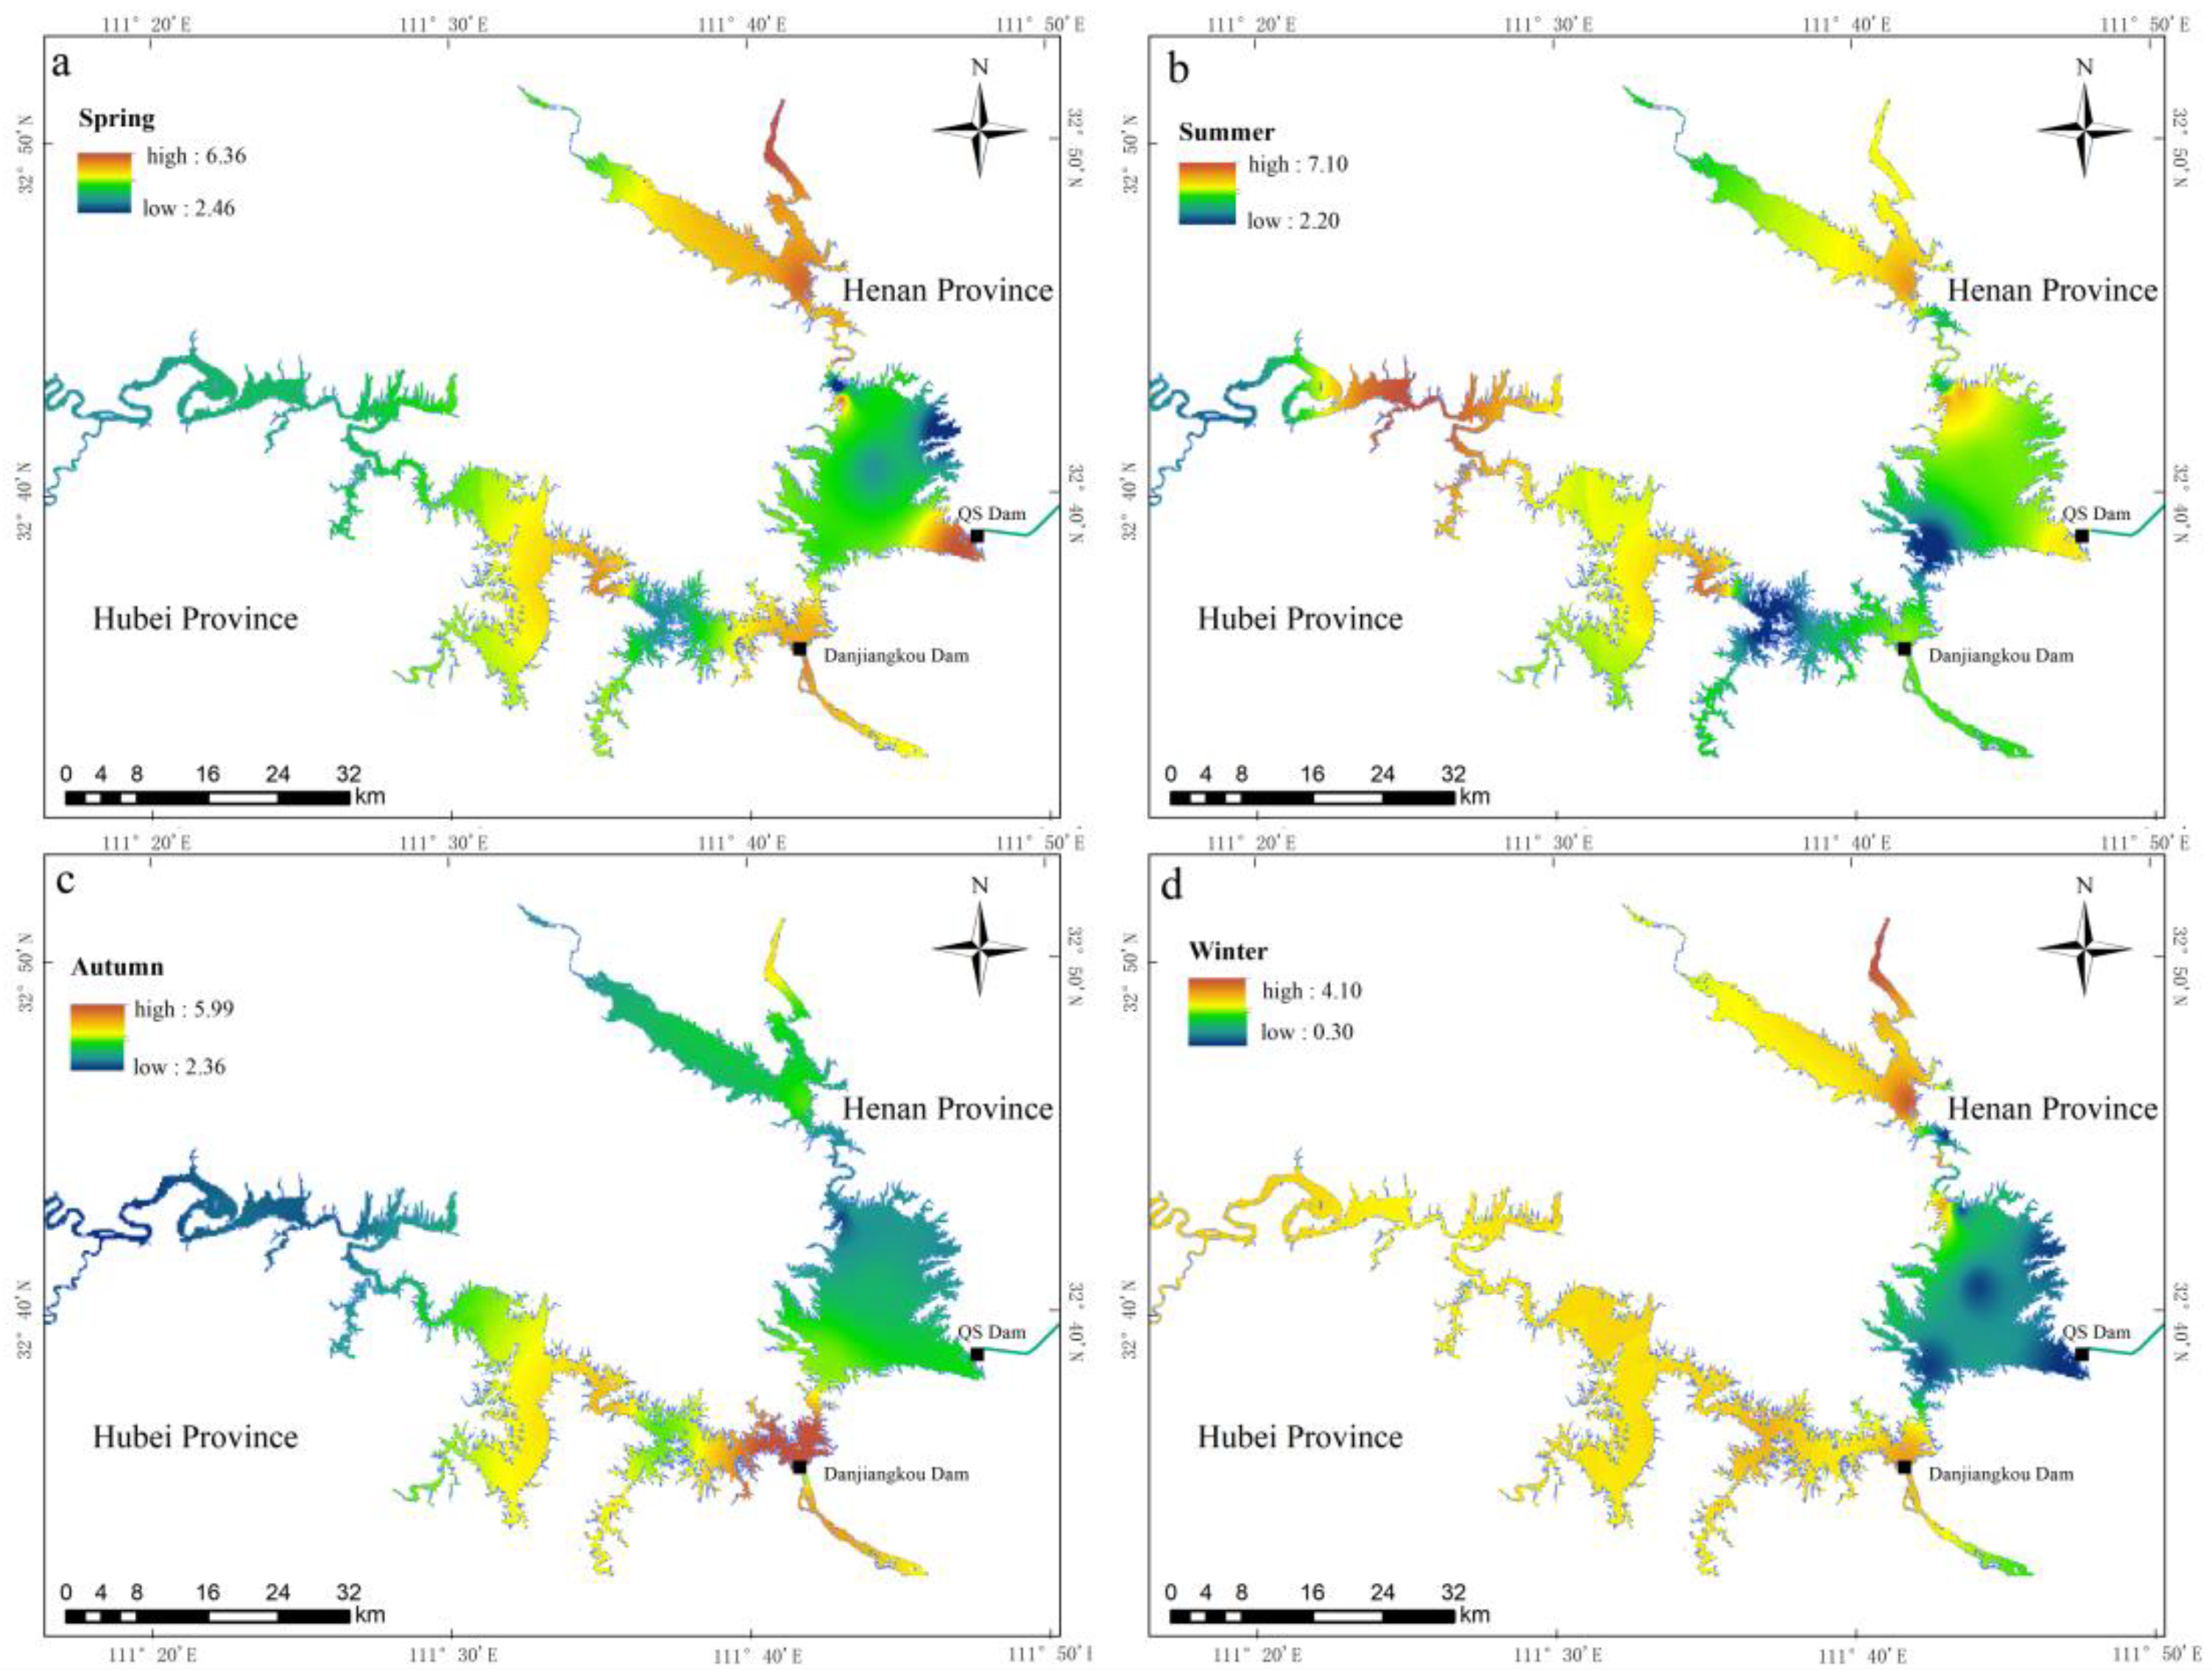
3.1. Spatio-Temporal Characteristics of TOC Concentration

The spatio-temporal characteristics of TOC concentration in surface water of the Danjiangkou Reservoir from May 2020 to January 2021 are shown in Figure 2. TOC concentration ranged between 0.29 and 7.10 mg/L (mean = 3.77 mg/L). The minimum value occurred at QS site in January 2021, while the maximum value was at site MGC in July 2020. TOC concentration was higher in spring and summer and lower in autumn and winter. In spring, TOC concentration was between 2.46 and 6.36 mg/L. The highest value appeared at ZY and the lowest value at HJZ (Figure 2a). In summer, TOC concentration was higher at CW, ZY wharf, and inflow tributaries of Han reservoir. The highest value (7.10 mg/L) appeared at MGC site, and the lowest value (2.19 mg/L) appeared at LHK site (Figure 2b). In autumn, TOC concentrations ranged from 2.36 to 5.99 mg/L. Except for the highest value at BS (5.99 mg/L), the overall difference was slight (Figure 2c). In winter, TOC concentration ranged from 0.29 to 4.10 mg/L and showed low values in the main body of Dan reservoir, with the lowest value (0.29 mg/L) at QS (Figure 2d). Taken as a whole, TOC concentrations from largest to smallest were the Danjiangkou reservoir outlet, Han reservoir, the entrance of Danjiangkou reservoir, and Dan reservoir. TOC concentration was higher in upstream tributaries except in autumn. At Han Reservoir, TOC concentration was higher at Danjiangkou dam except in summer.

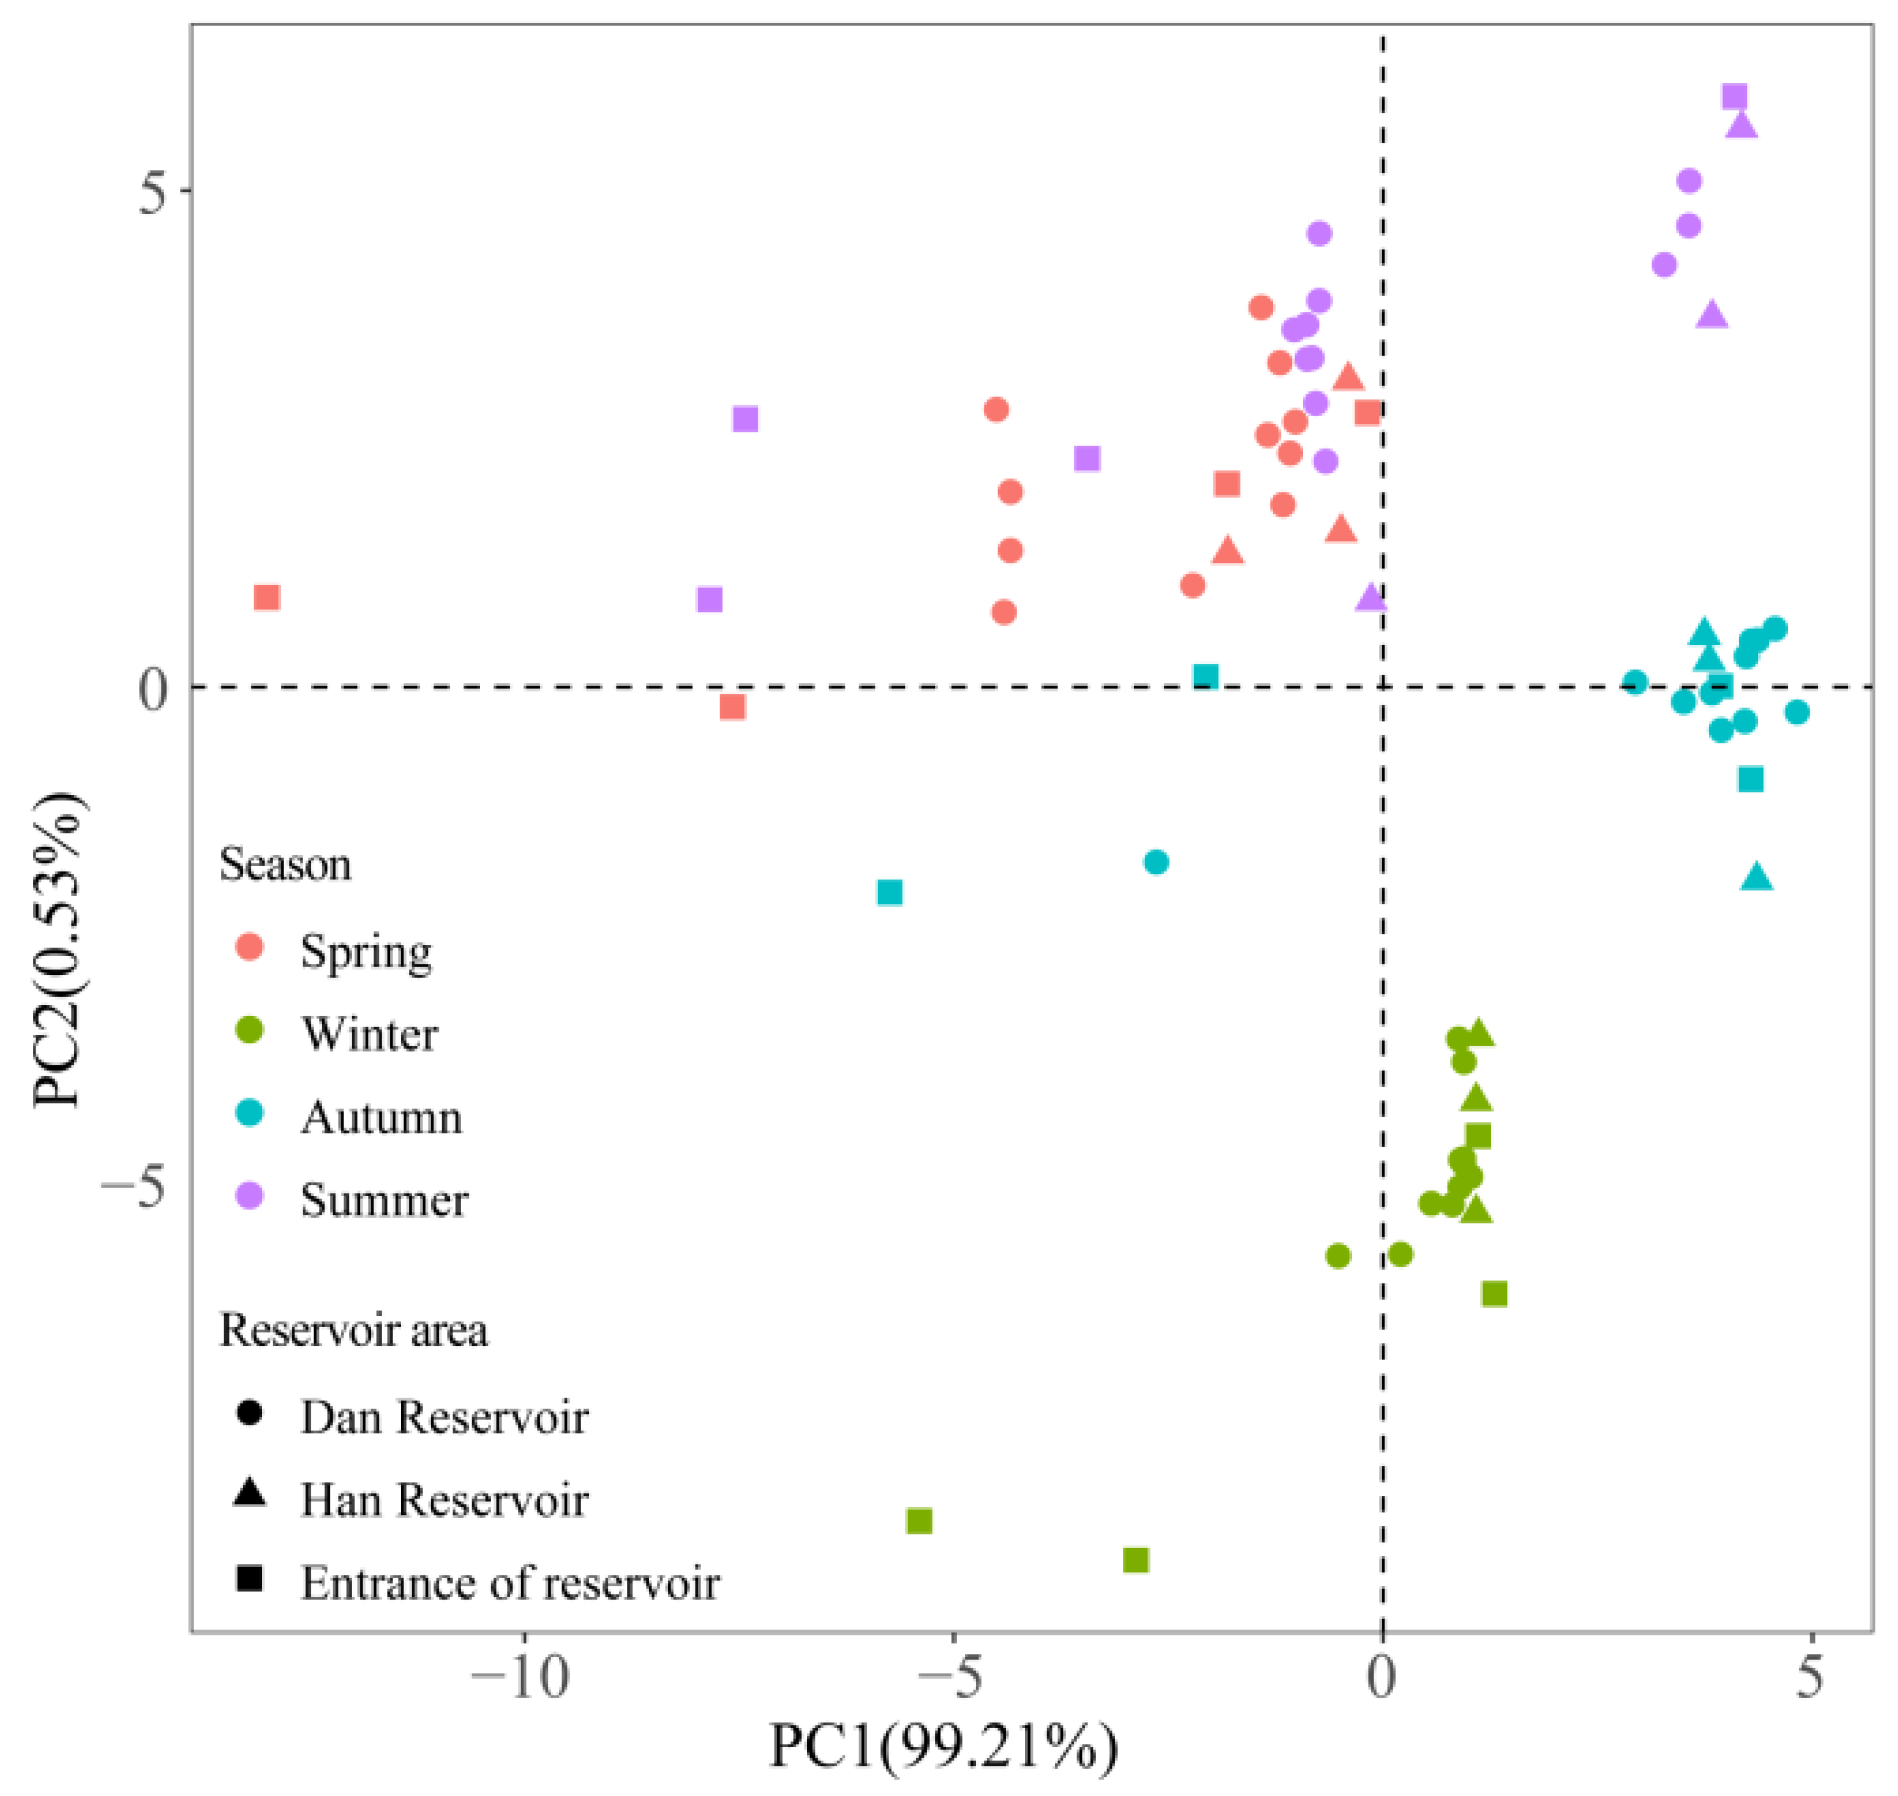
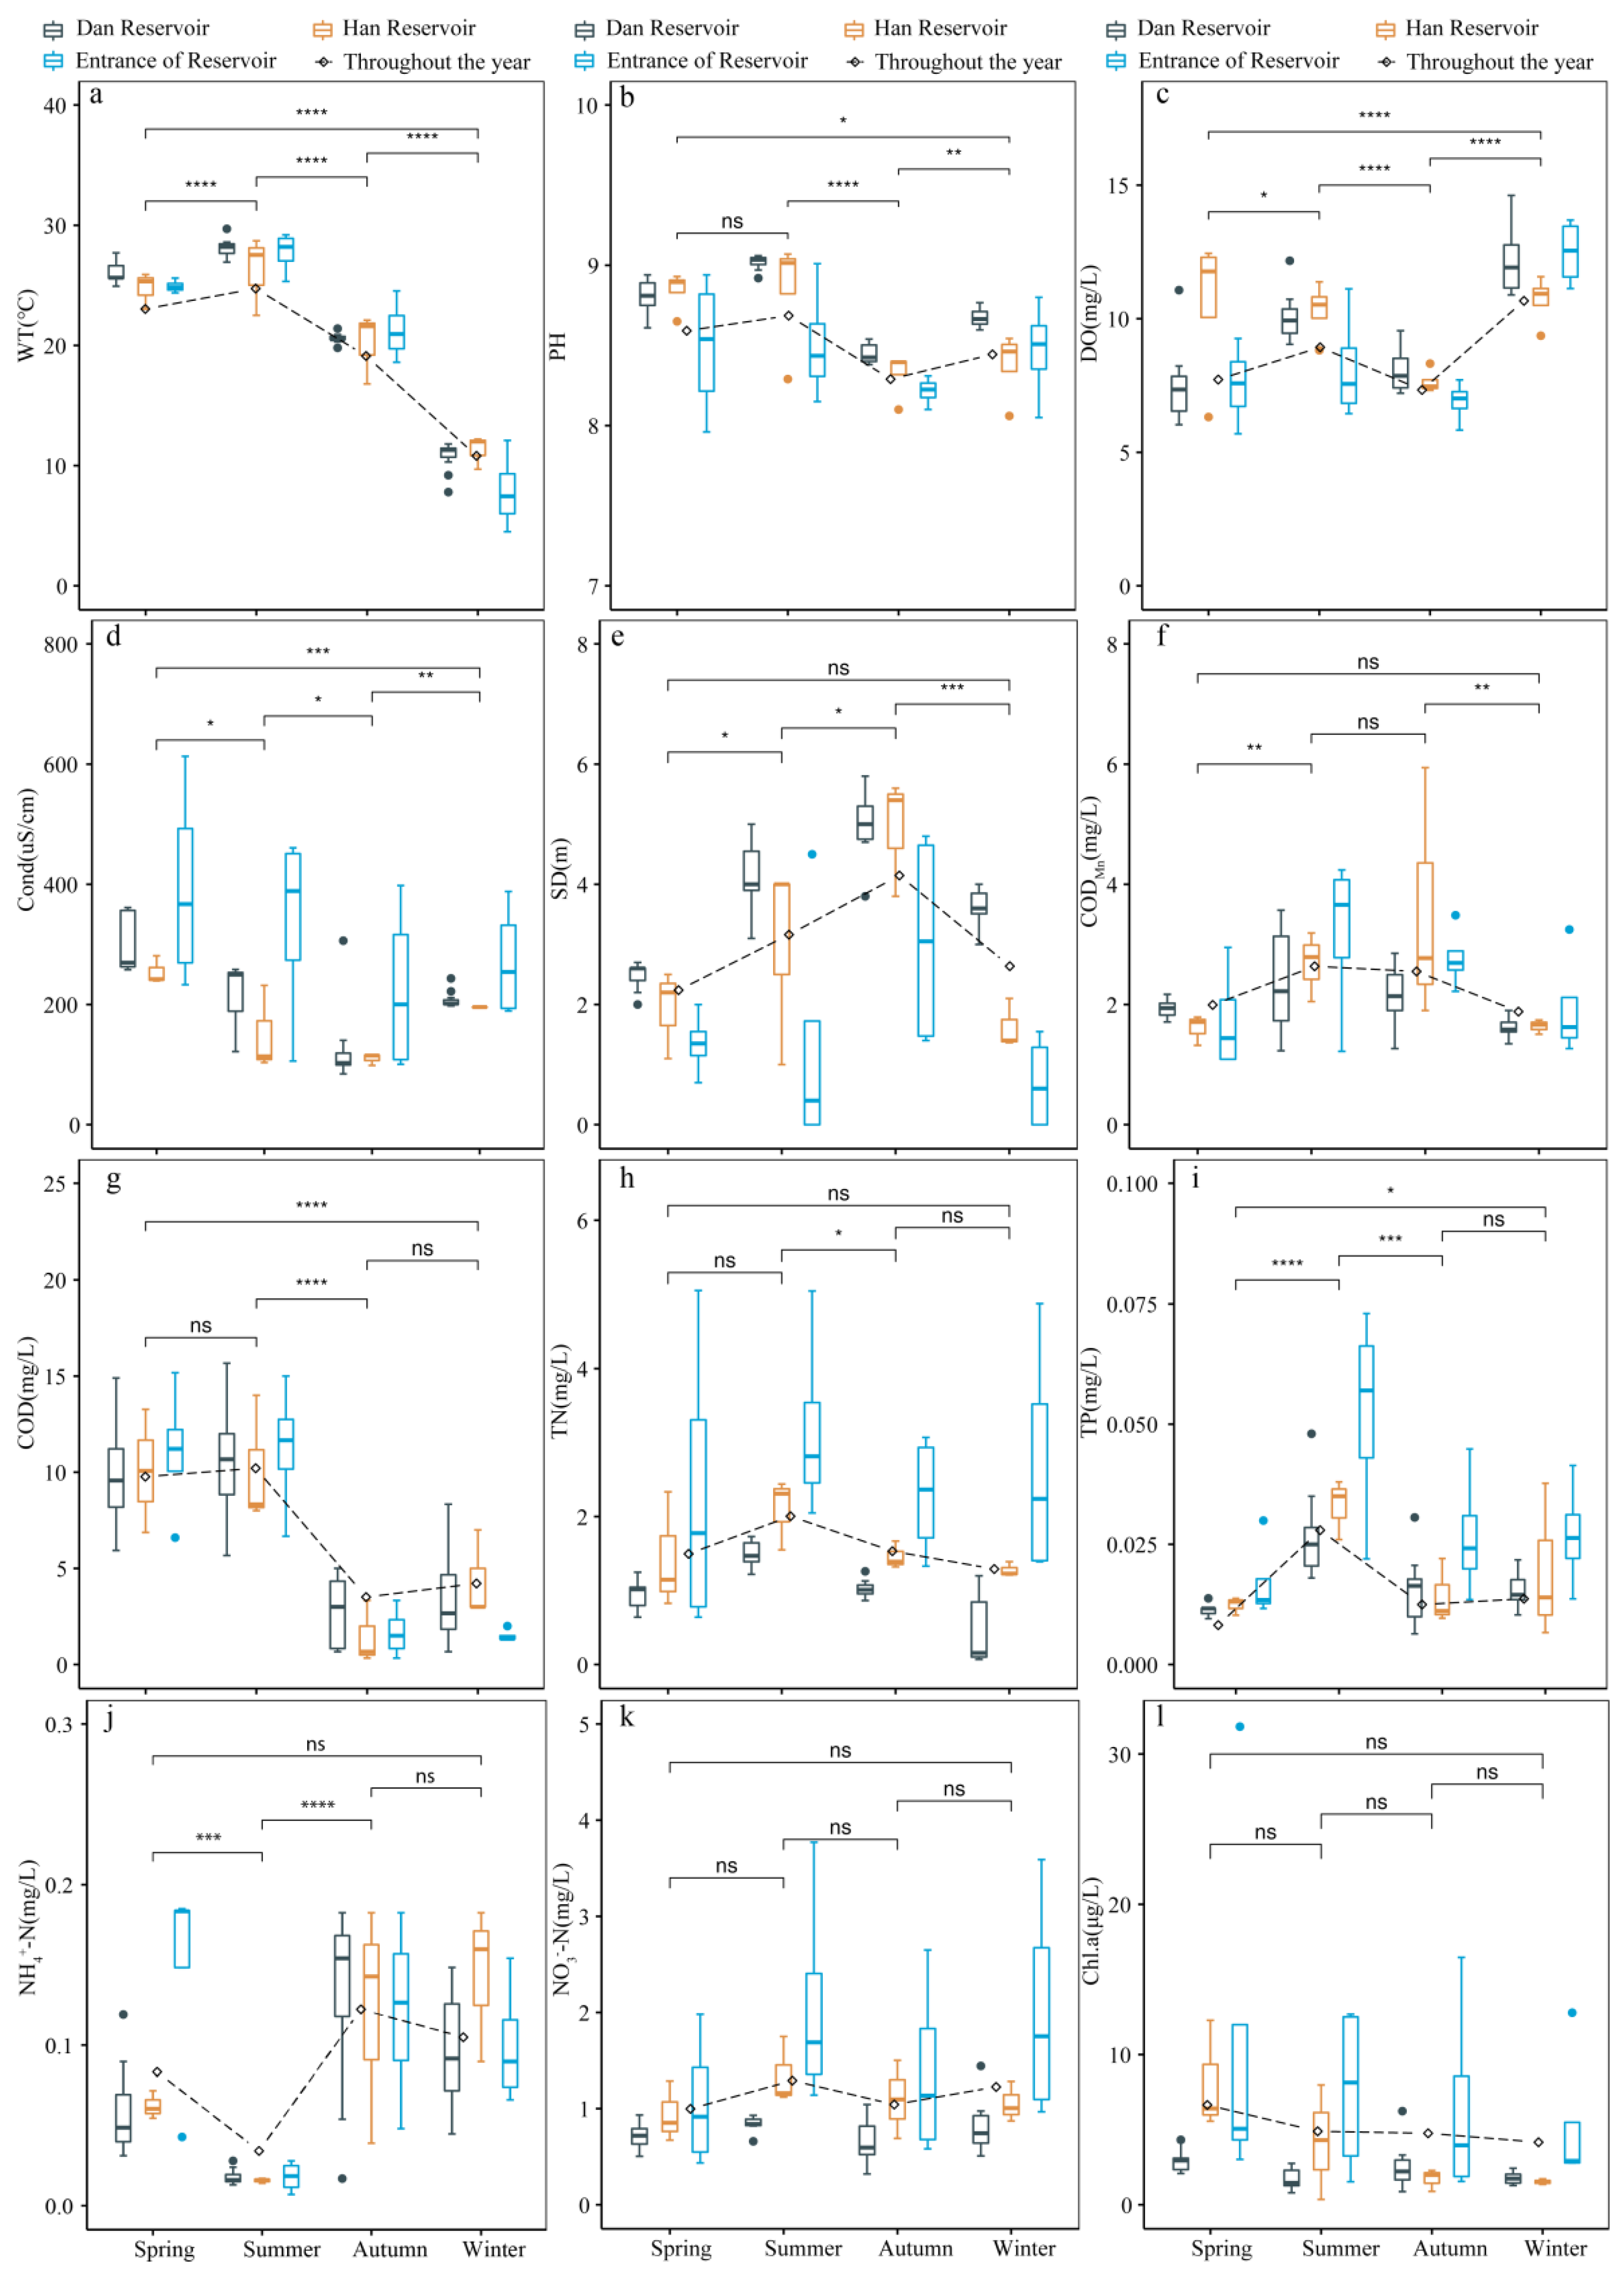
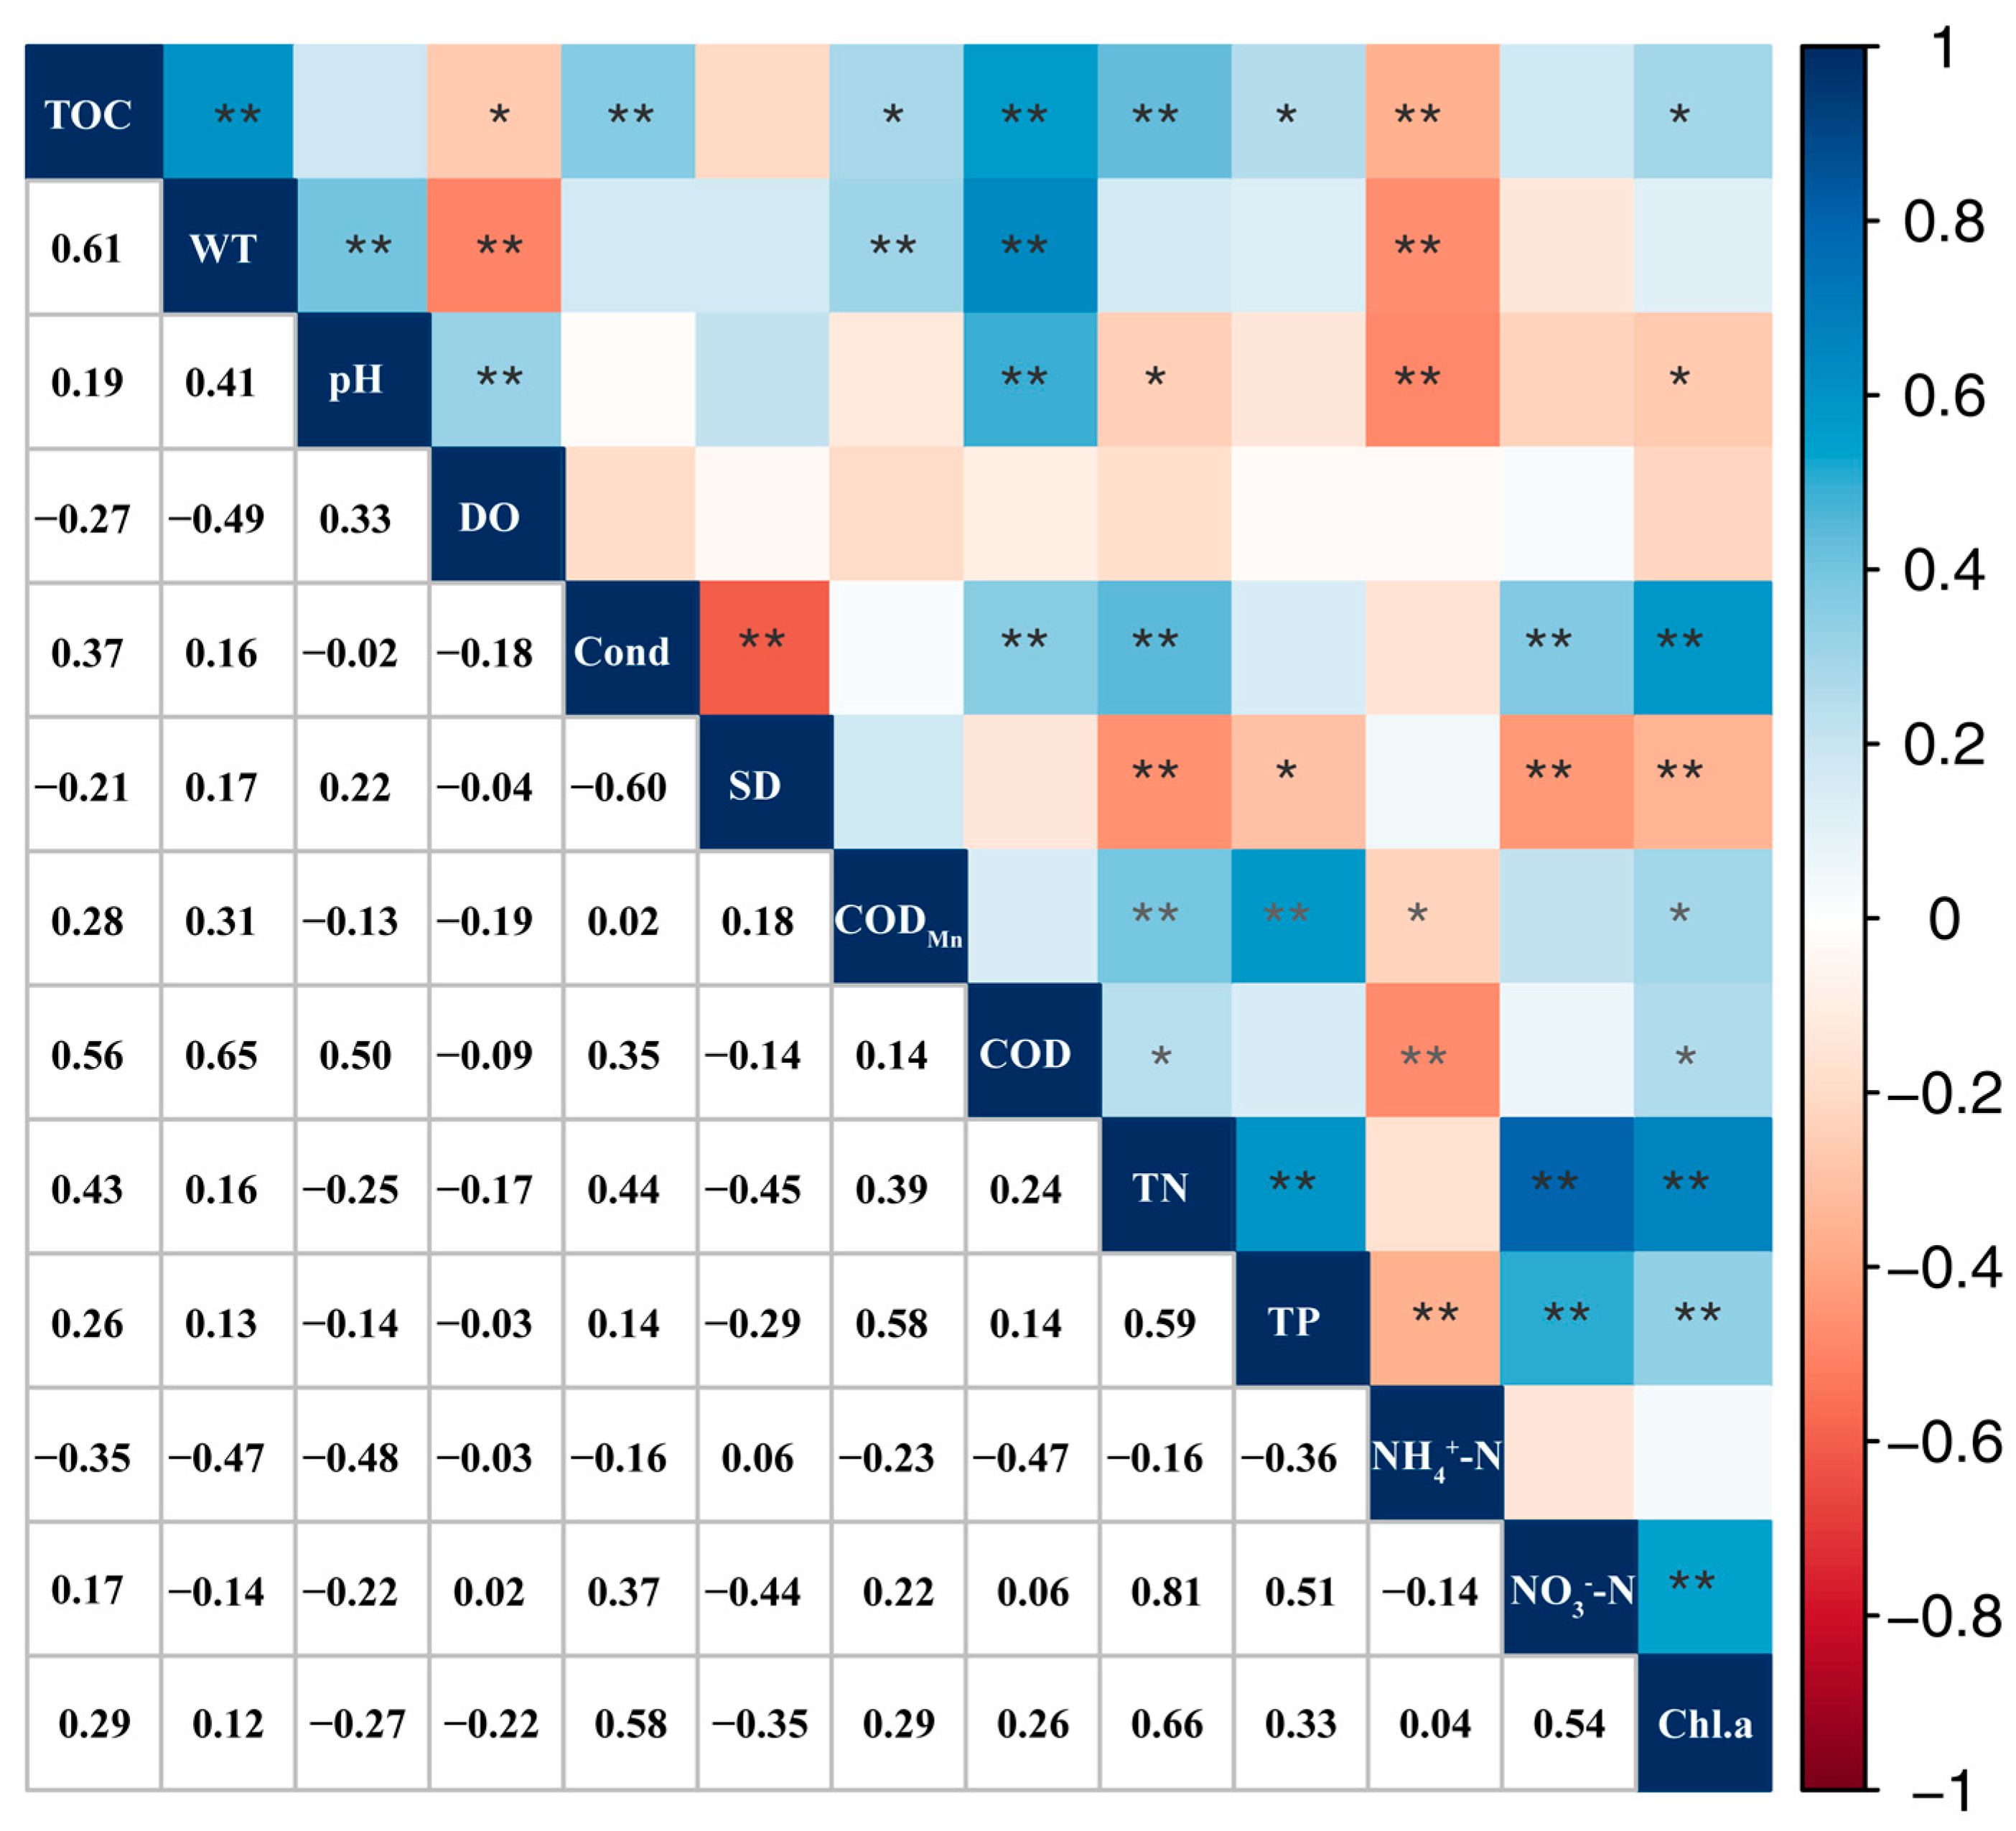
3.2. Spatio-Temporal Analysis of Environmental Factors

Some environmental factors were found to be strongly correlated with TOC concentration [28]. The PCA ranking analysis of environmental factors (Figure 3) showed that the explanatory axis 1 was 99.21%, and the explanatory axis 2 was 0.53%. The difference between spring and summer was not significant, but autumn and winter were clearly segregated in PC1 vs. PC2 space. Different reservoir zones (Dan and Han Reservoirs, and the entrance) of environmental factors all had aggregation phenomenon, and the entrance of reservoir was different from Dan reservoir and Han reservoir, and the phenomenon of aggregation in Dan and Han reservoirs was obvious except in summer.
Temporal trends of water quality parameters from May 2020 to January 2021 by location in the Danjiangkou Reservoir are shown in Figure 4. The parameters WT, pH, DO, Cond, SD, CODMn, COD, TN, TP, and NH4+-N showed evident seasonal variations (p < 0.05). WT tended to be higher in spring and summer and lower in autumn and winter (Figure 4a). The pH range (7.96–9.07) was weakly alkaline as a whole, reaching the maximum value in summer, with the greatest difference between summer and autumn (p < 0.0001)(Figure 4b). The maximum DO was found at the SQ site in winter (14.62 mg/L), and the minimum at DSQ in spring (5.69 mg/L), a significant (p < 0.0001) seasonal difference (Figure 4c). The variation range of Cond was 84.57~613.00 uS/cm, with a significant difference between spring and autumn (p < 0.0001)(Figure 4d). SD reached its maximum in autumn, with a significant difference between autumn and winter (p < 0.0001)(Figure 4e). CODMn was high in summer and autumn and low in spring and winter (Figure 4f). The COD varied from 0.33 to 15.67 mg/L, high in spring and summer and low in autumn and winter (Figure 4g). The mean TN concentration reached the maximum (1.97 mg/L) in summer and the minimum (1.07 mg/L) in winter, with no significant difference in spring and autumn (Figure 4h). The TP varied at 0.01~0.07 mg/L, reaching the maximum in summer, with a significant difference between spring and summer (p < 0.0001)(Figure 4i). There was seasonally no significant difference of NO3-N and Chl.a (p > 0.05)(Figure 4k,l).
The parameters pH, Cond, SD, TN, TP, NO3-N, and Chl.a had significant spatial differences (p < 0.05). Significant differences in Cond, SD, TN, NO3-N, and Chl.a were found between Dan and Han reservoirs and the entrance of the reservoir (p < 0.05). The mean of SD was highest in the Dan Reservoir, lower in the Han Reservoir, and lowest at the entrance of the reservoir. The average values of other environmental indicators were all highest at the entrance of the reservoir. The reason might be that the entrance of the reservoir was located in a residential area, which had strong anthropogenic interference, resulting in low water clarity. The pH and TP at the entrance of the reservoir were significantly different from Dan Reservoir (p < 0.05) but not significantly different from Han Reservoir.
The eutrophication of the Danjiangkou Reservoir was evaluated according to the lake and reservoir nutrition evaluation standard (Figure 5). The overall water quality was under the mesotrophic state, except that the Dan Reservoir was under the oligotrophic state in winter. The TLI value was arranged in ascending order from Dan Reservoir to Han Reservoir and the entrance of the reservoir. The TLI minimum value (25.52) was found in the Dan Reservoir in winter, and the maximum value (42.05) was present at the entrance of the reservoir in summer.

3.3. GAM Model Analysis of TOC Concentration and Environmental Factors

3.3.1. Single-Factor GAM Model Analysis

Each of the 12 environmental factors (WT, pH, DO, Cond, SD, CODMn, COD, TN, TP, NH4+-N, NO3-N, and Chl.a) was selected as the explanatory variable; in turn, TOC concentration was used as the response variable, and a spline smoothing function was used to construct a GAM model. The effect and significance of each explanatory variable on the response variable and the fit of the model were analyzed with respect to the spatio-temporal domain of the monitoring program.
Because the impact of environmental factors on TOC concentration was not significant in spring and summer, the analysis was confined to autumn and winter (Table 2 and Table 3). In autumn, environmental factors (WT, pH, CODMn, and NH4+-N) had significant non-linear relationships with TOC concentration (d.f. > 1, p < 0.05), among which WT, CODMn, and NH4+-N explained a higher amount of the deviance (98.5%, 78.6%, and 95.2%, respectively) and produced larger R2 values (0.958, 0.765, and 0.896, respectively). In winter, TN and TOC concentration had significant non-linear relationships with TOC (d.f. > 1, p < 0.05), the deviance explained was higher (97.8%), and R2 was larger (0.970). A significant linear relationship between SD and TOC concentration (d.f. = 1, p < 0.05) was also found in the winter season.
Scale analysis, the Danjiangkou Reservoir was divided into Dan Reservoir and Han Reservoir. The GAM model fitting results for the Dan Reservoir were obtained by AIC value and model fitting degree (Table 4). WT, pH, Cond, COD, and TN had highly significant non-linear relationships with TOC concentrations (d.f. > 1, p < 0.001), and DO, CODMn, NH4+-N had significant non-linear relationships with TOC concentration (d.f. > 1, p < 0.05). Among the environmental factors, WT, TN, and Cond (60%, 62.9%, and 72.7%, respectively) contributed more to the explanation of the variation of TOC concentration, followed by COD and pH (44.2% and 48.4%, respectively). The smallest contribution to the explanation of the variation in TOC concentration was by NO3-N (1.31%).
The fitting results of the Han Reservoir model include the AIC value and the model fitting degree of the GAM model (Table 5). From the F-test, it was concluded that TP and TOC concentration showed a highly significant non-linear correlation (d.f. > 1, p < 0.001) and CODMn showed a significant non-linear relationship with TOC concentration (d.f. > 1, p < 0.05), where WT, COD, NH4+-N, and Chl.a had significant linear relationships with TOC concentration (d.f. = 1, p < 0.05). The largest contribution to the explained variation of TOC concentration was TP (91.7%) with a good model fit (R2 = 0.824), followed by CODMn, DO, and SD (57.6%, 35.8%, and 31.3%, respectively). Among the measured environmental factors, the least contribution to the explanation of the variation in TOC concentration was pH (5.44%).

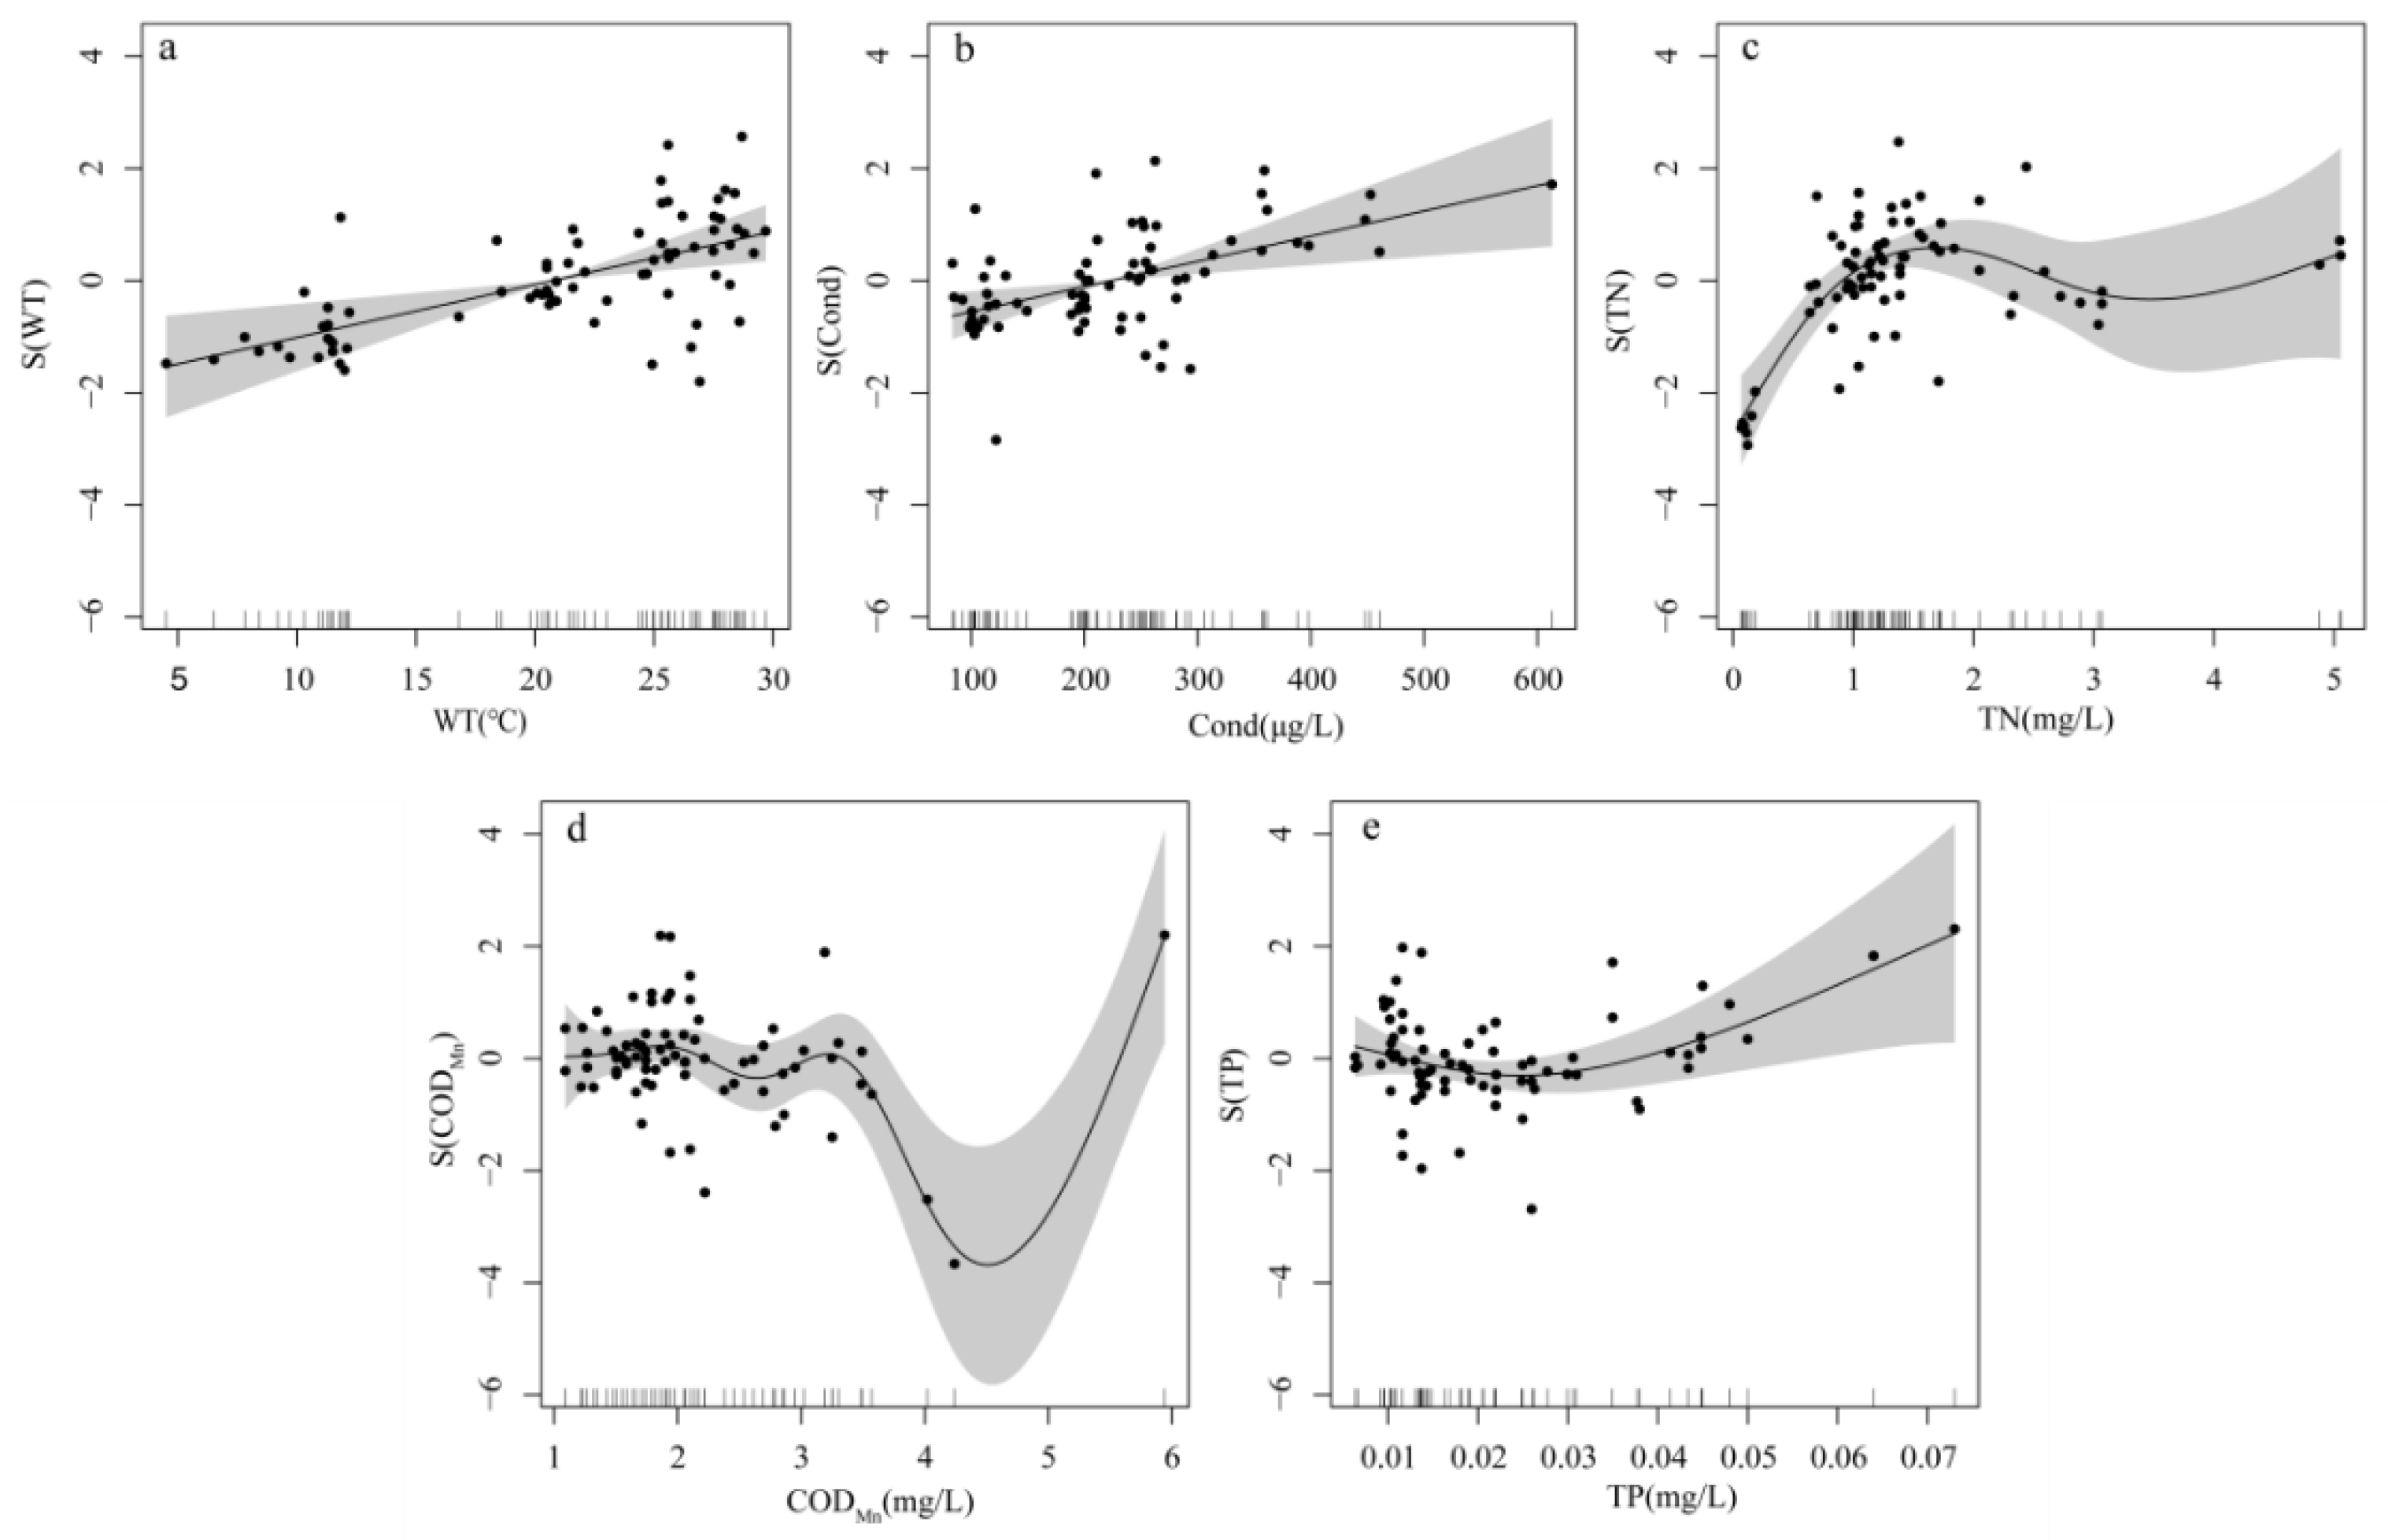
3.3.2. Multi-Factor GAM Model Analysis of TOC Concentration and Environmental Factors

The selected explanatory variables were tested for co-linearity before multi-factor correlation analysis to eliminate model estimation distortion. If the Pearson correlation coefficient between the explanatory variables was greater than 0.8, one of any two explanatory variables could be removed during model construction [29,30]. After analysis of person correlation coefficient, TN and NO3-N were found to be potentially co-linear (correlation coefficient is 0.81); thus, TN was selected because it was more highly correlated with TOC, and NO3-N was removed from the model. The significance test yielded significant correlations (p < 0.05) between TOC concentration and WT, DO, Cond, CODMn, COD, TN, TP, NH4+-N, and Chl.a concentrations, and no significant correlations (p > 0.05) with pH, SD, and NO3-N (Figure 6).
The principle of the selection of explanatory variables in the GAM model was to select explanatory variables that were strongly correlated with the response variable. After single-factor GAM model analysis and elimination of co-linearity, nine environmental factors (WT, Cond, COD, TN, NH4+-N, CODMn, DO, TP, and Chl.a) were taken as necessary explanatory variables, and TOC concentration was used as the response variable. The GAM model was constructed by smoothing function to analyze the correlation between TOC concentration and multiple influencing factors. When the essential explanatory variables were incorporated into the GAM model in turn, it was found that the AIC values of the model continued to become smaller, indicating that the fit of the model was also gradually improved (R2 = 0.732), and the contribution to the explanation of TOC concentration changes was 79.5% (Table 6). Therefore, the nine environmental factors were eventually retained as explanatory variables, among which WT and Cond had significant linear relationships with TOC (d.f. = 1, p < 0.05), while TN, CODMn, and TP had significant nonlinear relationship (d.f. > 1, p < 0.05). The order of F-values fitted to the model, from large to small, was WT, TN, Cond, CODMn, and TP.
After the development of the multi-factor GAM model, we obtained the effect plots of WT, Cond, TN, CODMn, and TP on TOC concentration. WT and Cond had positive linear correlations with TOC concentration, where TOC increased with increasing values of the explanatory variables. The variation area of WT values and Cond values was mainly among 5~12 °C and 20~30 °C (Figure 7a), and less than 400 μg/L (Figure 7b), respectively. When TN values were lower than 3 mg/L, there was a tendency to increase and then decrease. However, above 3 mg/L, it had a positive correlation with TOC concentration (Figure 7c). When the CODMn value was 1–3.5 mg/L, TOC concentration did not change significantly. After that, TOC concentration showed a trend of first decreasing and then increasing (Figure 7d). TOC concentration became larger as the TP value increased (Figure 7e).

4. Discussion

4.1. Spatio-Temporal Distribution of TOC Concentration

As a measure of the total organic matter contained in a water sample, TOC can be a comprehensive indicator of the degree of organic contamination of water bodies. The United Nations Economic Commission for Europe countries use TOC as an indicator parameter during the evaluation of drinking water [31], and TOC was also introduced into the “Standards for drinking water quality“ (GB/T5749-2006) with the limit value of 5 mg/L in China. In this study, TOC concentration in the Danjiangkou Reservoir was monitored, and the range of variation was 0.29–7.10 mg/L, with a mean value of 3.77 mg/L. Although TOC content was high in some areas, the total TOC concentration was lower than the limit value and met the demand of the drinking water.
In terms of seasonal variation, the average TOC concentration in the Danjiangkou Reservoir was sorted in descending order of spring, summer, autumn, and winter. It had the characteristics of higher in the warm season and lower in the cold season. The result of our research was consistent with those obtained in different seasons of Daya Bay seawater. It was also pointed out that the TOC value of source water greatly fluctuates with the seasonal changes [32]. TOC concentrations were the highest in spring, potentially reflecting the fact that the average phytoplankton biomass in the Danjiangkou Reservoir is highest in spring and lowest in winter [4]. With sufficient light in spring and WT increasing, the growth of phytoplankton and biological activity accelerates, including the decomposition of suspended organic matter, increasing soluble carbon and TOC concentrations. TOC concentration in summer was lower than that in spring, which might be due to the influence of continuous rainfall in the upper reaches of the Hanjiang River beginning in the middle of July, causing more water inflow into the Danjiangkou Reservoir and the dilution of TOC. High rates of nutrients consumed by phytoplankton compared to in summer limits the growth of phytoplankton in autumn, which in turn decreases the production of DOC, resulting in the decrease in TOC concentration [33]. In winter, the decrease in water temperature and light decreases biological activity, and TOC concentrations reach the lowest value. TOC concentration in winter was also the lowest in 13 small forest lakes in Finland [34]. Furthermore, this study was limited to the surface waters of the Danjiangkou Reservoir, where concentrations of TOC were also likely impacted by changes in stratification and mixing of the reservoir water column between seasons, which should be investigated further.
From the spatial distribution characteristics, the average TOC concentration of the Danjiangkou Reservoir was sorted in descending order from the outlet, Han reservoir, the entrance of the reservoir, and Dan Reservoir. The shoreline of Han reservoir is long and narrow with many tributaries, the surrounding area is mountainous and hilly, and the aquatic system is developed with rising water levels, so the drainage area delivering exogenous nutrients through surface runoff is vast, causing the phytoplankton biomass to be larger than that of Dan Reservoir [4]. The integrated trophic state index of the aquatic body in the Han Reservoir was significantly higher than that in the Dan Reservoir [2]. As a result, the TOC concentration in the Han reservoir was higher than that in the Dan Reservoir. In addition, the TOC concentration at the entrance of Dan Reservoir was higher than that at the entrance of Han Reservoir, probably because the entrance area of Dan Reservoir is a traditional agricultural area with less surface vegetation, which is susceptible to the influence of seasonal runoff on the surface scouring. The Danjiangkou Reservoir is significantly influenced by upstream water and human activities in the surrounding area [2]. The BX site located at the entrance is a water conservancy scenic area with the Danjiangkou Water conservancy hub as the core, which was strongly disturbed by human activities and had the maximum TOC concentration. In the study of the spatio-temporal distribution of TOC in East Lake, it was also found that TOC content would increase during the peak tourism season [9], which may be a future issue of concern as recreation use of the Danjiangkou Reservoir increases.
The spatio-temporal distribution characteristics of TOC concentration in the Danjiangkou Reservoir were mainly influenced by light, rainfall, surface runoff, biological activities, and agricultural and human activities. The average TOC concentration for each site concentration met the requirements of the drinking water. However, some sites were found to have persistently high TOC concentrations. In particular, the ZY site was affected by serious soil erosion, dense adjacent population with a large production of domestic pollution, and the MV site was at the mouth of the Shending River [35]. It was suggested that the watershed erosion control should be strengthened, the area of vegetation increased, the ecological effect of the riparian zone maintained, and the pollution of the agricultural surface source controlled [36] in order to reduce the impact of human activities on reservoir water quality, especially TOC, and ensure the safety of water supply.

4.2. Driving Factors Affecting TOC Concentration

TOC is an important indicator of water quality, and the concentration and distribution of TOC in lakes and reservoirs are correlated with several factors [16,37,38,39]. The results of single-factor and multi-factor GAM model analysis showed that the main physical environmental factors affecting TOC concentration in the Danjiangkou Reservoir were WT, pH, Cond, and SD, and the main dissolved constituents were CODMn, COD, TN, TP, and NH4+-N, as well as indicators that could respond to the primary productivity of water bodies (Chl.a).
WT was the main influencing factor of TOC in autumn. In the analysis of the annual multi-factor GAM model, there was a significant linear relationship between WT and TOC concentration, and TOC concentration increased with the increase in WT value. This was consistent with the findings of East Lake [9] and Erhai Lake [10]. The study on the Shuibuya reservoir also showed a direct relationship between DOC and WT [40]. Higher WT allows the decomposition of organic matter and increases enzymatic activity in organisms, leading to the proliferation of algae and microorganisms and increased secretion of DOC, resulting in an increase in TOC concentration. pH had a certain effect on TOC concentration in autumn. Previously, it was found that pH was the main factor influencing phytoplankton biomass in the Danjiangkou Reservoir, and phytoplankton was the main source of TOC production [4], so pH indirectly influences TOC concentration. The change of Cond could reflect the eutrophication degree in the reservoir. The electrical conductivity is mainly reflected by the type and concentration of ions dissolved in the water body and the water temperature [41]. In this study, conductivity was the water quality parameter most highly correlated with TOC in Dan Reservoir. The multi-factor GAM model showed that TOC concentration also increased with the increase in electrical conductivity. Contrary to the results of East Lake [9], the reason is that Danjiangkou Reservoir and East Lake were affected by different environmental factors. The possible reason for the positive correlation between electrical conductivity and TOC concentration in this study was that conductivity was the driving force affecting the distribution of phytoplankton community in Danjiangkou and was previously found to be the main environmental factor influencing phytoplankton composition in Dan reservoir in winter, spring, and summer [42]. Factors such as increased consumption of phytoplankton growth and increased metabolites caused to increase TOC concentration. SD only had some effects on TOC concentration in winter. The low WT in winter decreased phytoplankton photosynthesis and bioactivity, which in turn affected the variation of TOC concentration [43].
The multivariate GAM model analysis in this study showed that CODMn was the environmental factor most highly correlated with TOC concentration in Danjiangkou surface waters. This is unsurprising because CODMn is a commonly used indicator to reflect the status of organic pollution, and many studies have shown a good correlation between CODMn and TOC concentration [44,45,46,47]. This is consistent with the results of TOC and CODMn in the surface water of the Dandong section of the Yalu River [48]. COD was the main influencing factor of TOC concentration in Dan reservoir. The increase in COD is a result of eutrophication in the aquatic body.
Nitrogen and phosphorus nutrients promote the growth of phytoplankton, and the photosynthesis of organic carbon by plants influenced the changes of eutrophication and TOC concentration [49]. The analysis of the multi-factor GAM model in this study showed that both TN and TP were significantly and positively correlated with TOC, while TN was the main influencing factor of TOC in Dan Reservoir and TP was the main influencing factor of TOC in Han Reservoir in the single-factor GAM model. Previously, TN and TP have been identified as the main factors affecting the cell density of phytoplankton in the Danjiangkou Reservoir [50], while the Han Reservoir was found to be more affected by phosphorus pollution [42]. The analysis of the single-factor GAM model showed that NH4+-N had a significant effect on TOC concentration in both Dan and Han reservoirs. There was a significantly positive correlation between TOC and NH4+-N in Erhai Lake [10]. NH4+-N had a direct effect on water quality [1].
Chl.a was an important indicator of the primary productivity of aquatic bodies and a major indicator of the eutrophication degree of aquatic bodies. With the increase in Chl.a, the photosynthesis of phytoplankton was enhanced, and the secretion produced by phytoplankton was also increased, which could lead to the increase in TOC concentration. The analysis of the single-factor GAM model showed that Chl.a had a good correlation with TOC concentration in Han reservoir, but there was no significant correlation in Dan reservoir. The reason was that Chl.a concentration often showed the highest at the dam water, and the general trend was increasing from northeast to southwest, with Han reservoir being larger than that in Dan reservoir [51]. The phytoplankton biomass was greater in the Han reservoir than that in the Dan reservoir [4].

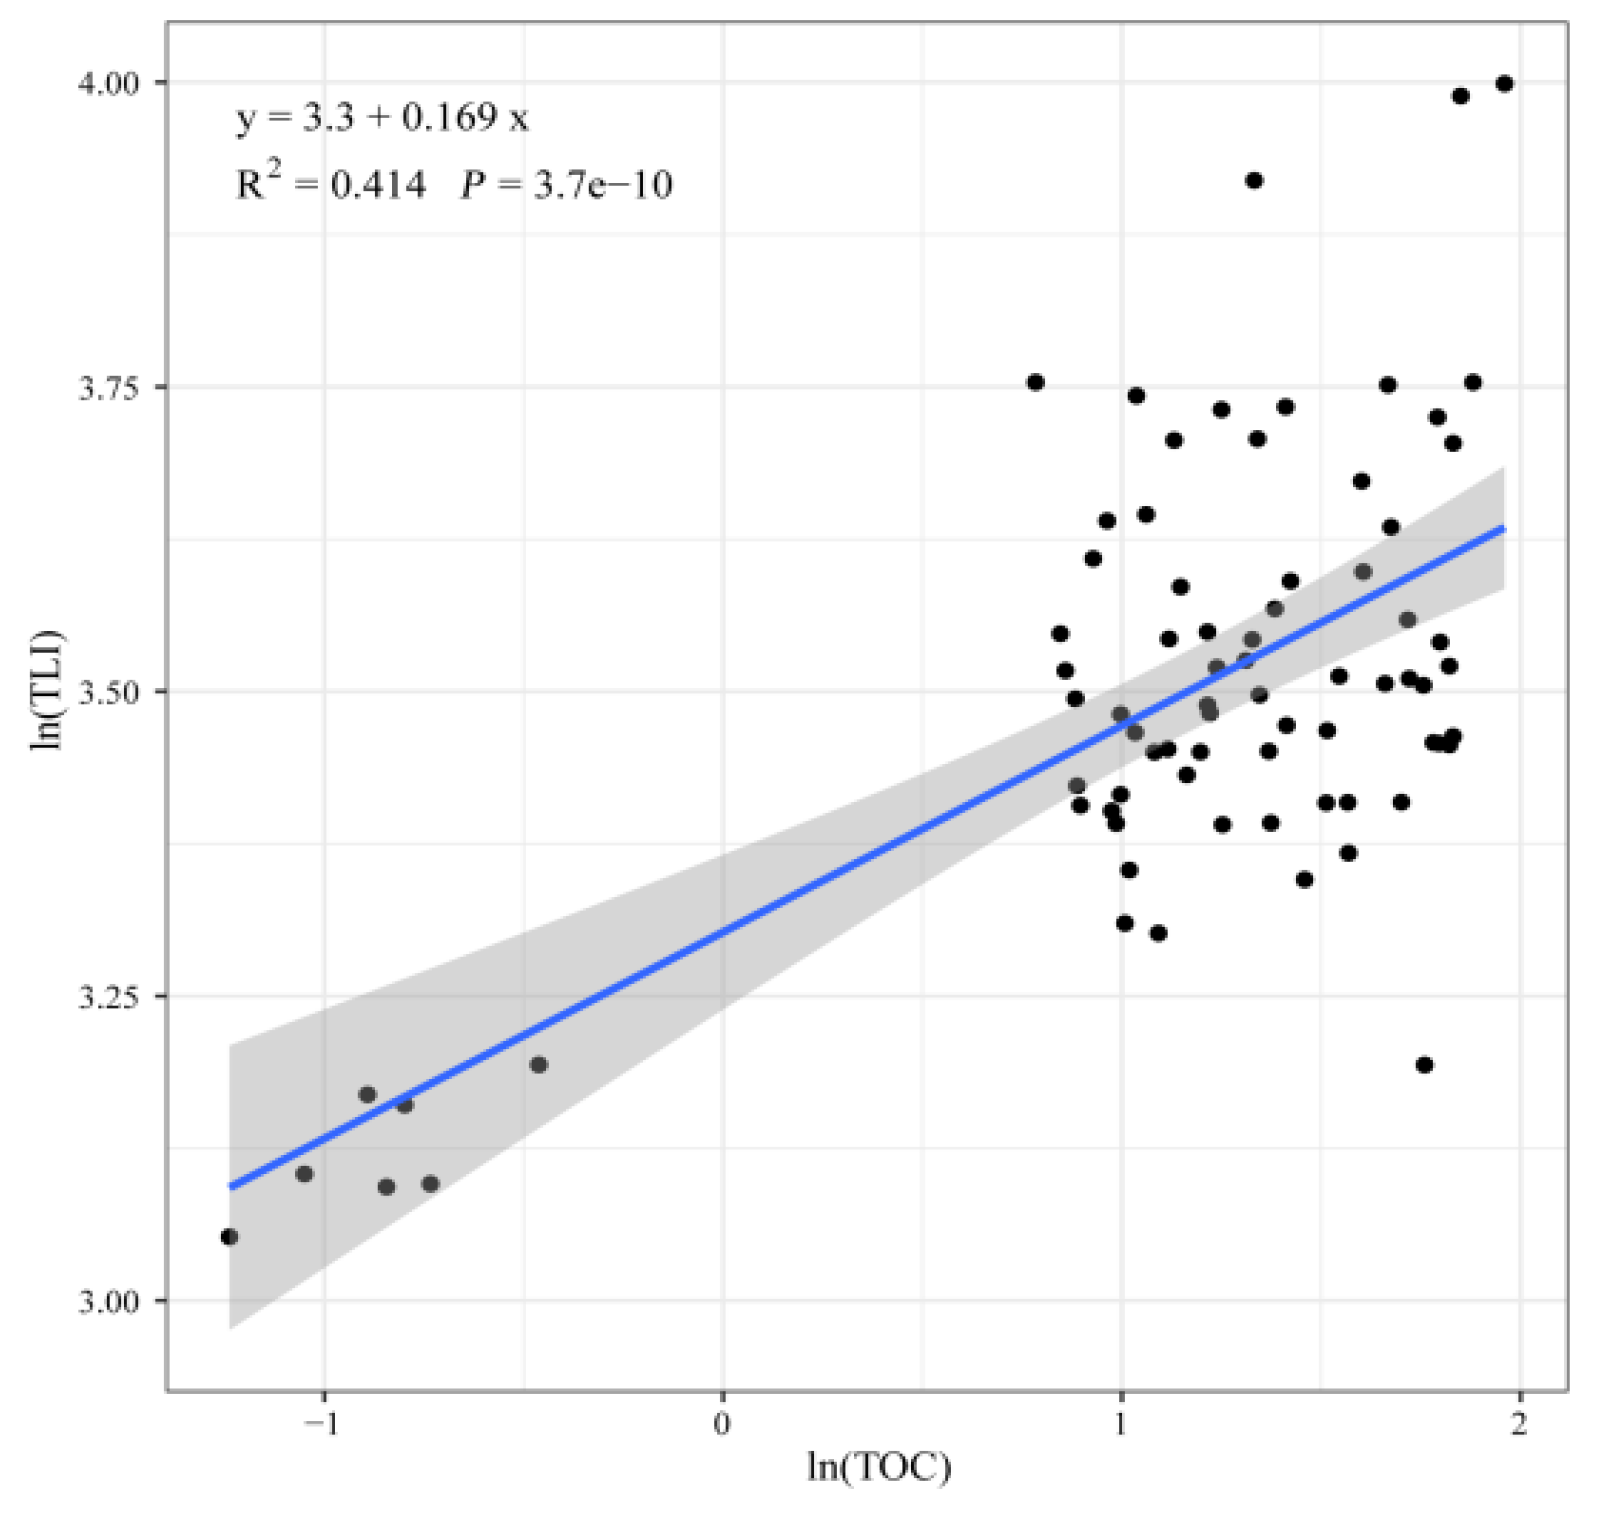
4.3. Evaluation of Water Quality in Large Drinking Water Reservoirs and the Relationship with TOC Concentration

The TLI(Σ) based on five indicators (Chl.a, TP, TN, SD, and CODMn) with Chl.a as the core has been widely used during the eutrophication assessment of lakes and reservoirs [52]. The water quality of the Danjiangkou Reservoir was under the mesotrophic state, which was consistent with the evaluation results of the water quality in Danjiangkou Reservoir by Guo [51], Wan [53], and Zhang [54]. The TLI value from small to large was Dan Reservoir, Han Reservoir, and the entrance of reservoir. The comprehensive nutrient state of the Danjiangkou Reservoir was higher in the Han reservoir than in the Dan reservoir, and the tail area was higher than the head area [2]. The minimum TLI value occurs in the Dan reservoir area in winter. This might be due to the fact that the overall development of the Danjiangkou Reservoir catchment area was low and less influenced by industry. In addition, the short duration of light and low biological activity in winter resulted in lower Chl.a concentration, leading to the decrease in its nutritional status.
The maximum value of TLI was found in the inlet area in summer, maybe because of many traditional agricultural areas in the reservoir area, greatly affected by the surface runoff. On the other hand, it had a large rainfall in summer and increased organic pollutants entering the reservoir area with water flow [55], leading to a higher nutritional status. Linear regression analysis between TLI and TOC concentration revealed (Figure 8) a highly significant correlation (R2 = 0.414, p < 0.001), indicating that TOC could be used as a key factor for water quality evaluation in the Danjiangkou Reservoir. With different hydrological characteristics in Korea, a strong correlation between TOC concentrations and environmental factors was also found, which could be regarded as a key factor in the management of water quality [16].

5. Conclusions

(1)
Strong spatio-temporal patterns of TOC concentration were found in the surface waters of the Danjiangkou Reservoir. Concentrations tended to decrease from spring to summer, autumn, and winter. The highest concentrations of TOC were found in Han reservoir, then the entrance of the reservoir and Dan Reservoir.
(2)
Through the analysis of the single factor GAM model, the driving factors of TOC concentration varied with time and location. The main environmental factors affecting TOC concentration were temporally WT, CODMn, and NH4+-N in autumn, but TN and SD in winter. In the Dan Reservoir, the main environmental factors affecting TOC concentration were WT, COD, NH4+-N, TN, and Cond, while WT, COD, NH4+-N, TP, and Chl.a explained the most variability of TOC in the Han reservoir.
(3)
By the multi-factor GAM model, the environmental factors affecting TOC concentration were mainly WT, Cond, TN, CODMn, and TP, among which WT showed a significant linear relationship with both Cond value and TN, CODMn, and TP had a significant nonlinear relationship.
(4)
The water quality of the Danjiangkou Reservoir was under the mesotrophic state, and the average value of TOC concentration met the demand for drinking water. TOC parameter could be regarded as a key factor in the management of water quality.
(5)
This study was limited to the evaluation of surface waters of the Danjiangkou Reservoir. Future studies should investigate differences in water quality parameters throughout the water column.

Author Contributions

Conceptualization, Y.J. and Y.L.; methodology, Y.J., Y.L. and B.L.; software, Y.J. and Y.Z.; validation, Y.J. and Y.L.; formal analysis, Y.J. and Y.Z.; investigation, M.Q., Y.Y., and X.C.; resources, K.H.; data curation, Z.C.; writing—original draft preparation, Y.J., K.H., and Y.L.; writing—review and editing, M.D., A.G. and B.L.; visualization, Y.J. and Y.Z.; supervision, Y.L.; project administration, Y.L.; funding acquisition, Y.L. All authors have read and agreed to the published version of the manuscript.

Funding

This study was funded by the National Natural Science Foundation of China (No.51879130) and the higher discipline innovation and talent introduction base of Henan Province (No.CXJD2019001).

Informed Consent Statement

All authors agreed with the content and gave explicit consent to submit.

Data Availability Statement

Not applicable.

Acknowledgments

We are grateful to the International Joint Laboratory of Watershed Ecological Security of Middle Route Project of South-North Water Diversion in Henan Province, which provided the experiment platform.

Conflicts of Interest

The authors declare no conflict of interest.

References

  1. Dong, G.; Hu, Z.; Liu, X.; Fu, Y.; Zhang, W. Spatio-temporal variation of total nitrogen and ammonia nitrogen in the water source of the middle route of the South-To-North Water Diversion Project. Water 2020, 12, 2615. [Google Scholar] [CrossRef]
  2. Zhao, K.; Yang, W.; Sha, J.; Shang, Y.; Li, X. Spatial characteristics of nutrient status in Danjiangkou Reservoir. Environ. Sci. Technol. 2020, 43, 51–58. [Google Scholar]
  3. Yan, X.; Zhang, Y.; Li, Y.; Jiang, Y.; Cui, Z.; Gao, X.; Wu, N.; Nicola, F.; Han, X. Hydrologic and physicochemical factors co-drive seasonal changes of phytoplankton during dynamic water diversion processes in the Danjiangkou Reservoir. J. Lake Sci. 2021, 33, 1350–1363. [Google Scholar]
  4. Wang, Y.; Chen, L.; Niu, Y.; Yu, H.; Luo, M. Spatio-temporal variation in phytoplankton community and its influencing factors in Danjiangkou Reservoir. J. Lake Sci. 2016, 28, 1057–1065. [Google Scholar]
  5. Zhang, L.; Yin, W.; Wang, C.; Zhang, A.; Zhang, H.; Zhang, T.; Ju, F. Untangling microbiota diversity and assembly patterns in the world’s largest water diversion canal. Water Res. 2021, 204, 117617. [Google Scholar] [CrossRef] [PubMed]
  6. Zheng, B.-H.; Chen, Z.-J.; Li, Y.-Y.; Fohrer, N.; Zhang, Y.; Wu, D.-Y.; Yan, X.-Y.; Li, B.-L. Structural characteristics and driving factors of the planktonic eukaryotic community in the Danjiangkou Reservoir, China. Water 2020, 12, 3499. [Google Scholar] [CrossRef]
  7. Chi, S.; Zhao, X.; Gao, S.; Zhang, A.; Hu, J.; Li, S.; Hu, J.; Dong, F. The spatial distribution pattern of autumn macroinvertebrates in relation to environmental factors in Danjiangkou Reservoir. Acta Ecol. Sin. 2021, 41, 1229–1241. [Google Scholar]
  8. Hu, Y.; Peng, Y.; Li, R.; Huang, J.; Zhou, Z.; Hu, S.; Wang, Y.; Qiu, G. Plankton diversity and community characteristics in Danjiangkou Reservoir based on environmental DNA metabarcoding. J. Lake Sci. 2021, 33, 1650–1659. [Google Scholar]
  9. Zhang, Z.; Meng, P.; Xu, G.; He, Y.; Zhang, Z.; Jiang, Y. Temporal and spatial distribution of total organic carbon and its influence factors in east lake. Environ. Sci. Technol. 2013, 36, 110–114. [Google Scholar]
  10. Huang, Y.; Dou, S.; Yang, S.; Gao, D.; Zhang, K.; Dong, Q. Spatial-temporal distribution characteristics and influencing factors of total organic carbon in Erhai Lake. Environ. Sci. Surv. 2021, 40, 17–24. [Google Scholar]
  11. Lee, J.; Lee, S.; Yu, S.; Rhew, D. Relationships between water quality parameters in rivers and lakes: BOD 5, COD, NBOPs, and TOC. Environ. Monit. Assess. 2016, 188, 252. [Google Scholar] [CrossRef] [PubMed]
  12. Hedges, J.; Oades, J. Comparative organic geochemistries of soils and marine sediments. Org. Geochem. 1997, 27, 319–361. [Google Scholar] [CrossRef]
  13. Carsten, M.; Neal, M.; M, P.A.; Don, M.; Handong, Y.; Jan, W.; P, S.J.; Richard, B. Inferring past trends in lake water organic carbon concentrations in Northern Lakes using sediment spectroscopy. Environ. Sci. Technol. 2017, 51, 13248–13255. [Google Scholar]
  14. Ouyang, Y.; Zhang, J.E.; Ou, L.-T. Temporal and spatial distributions of sediment total organic carbon in an estuary river. J. Environ. Qual. 2006, 35, 93–100. [Google Scholar] [CrossRef] [PubMed]
  15. Jiang, Z.; Huang, X.; Zhang, J. Temporal and spatial distribution of total organic carbon and its influence aspects in the Daya Bay. Acta Oceanol. Sin. 2009, 31, 91–98. [Google Scholar]
  16. Park, H.-K.; Byeon, M.-S.; Shin, Y.-N.; Jung, D.-I. Sources and Spatial and Temporal Characteristics of Organic Carbon in Two Large Reservoirs with Contrasting Hydrologic Characteristics; John Wiley & Sons: Hoboken, NJ, USA, 2009. [Google Scholar]
  17. Lin, L.; Pan, X.; Zhang, S.; Li, D.; Zhai, W.; Wang, Z.; Tao, J.; Mi, C.; Li, Q.; Crittenden, J.C. Distribution and source of micro-plastics in China’s second largest reservoir-Danjiangkou Reservoir. J. Environ. Sci. China 2021, 102, 74–84. [Google Scholar] [CrossRef] [PubMed]
  18. Liu, L.; Peng, W.; Wu, L.; Liu, L. Water quality assessment of Danjiangkou Reservoir and its tributaries in China. In IOP Con-ference Series: Earth and Environmental Science; IOP Publishing: Bristol, UK, 2018; Volume 112. [Google Scholar]
  19. HJ 501-2009; Water Quality. Determination of Total Organic Carbon. Combustion Oxidation Nondispersive Infrared Absorption Method. Ministry of Environmental Protection: Beijing, China, 2009.
  20. State Environmental Protection Administration. Monitoring and Analysis Methods of Water Waste Water, 4th ed.; Environmental Science Press: Beijing, China, 2002.
  21. Oksanen, J.; Blanchet, F.G.; Kindt, R.; Legendre, P.; Minchin, P.R.; O’Hara, R.B.; Simpson, G.L.; Solymos, P.; Stevens, M.H.H.; Wagner, H. Vegan: Community Ecology Package. 2020. Available online: https://CRAN.R-project.org/package=vegan (accessed on 24 January 2022).
  22. Wood, S.N. Fast stable restricted maximum likelihood and marginal likelihood estimation of semiparametric generalized linear models. J. R. Stat. Soc. Ser. B Stat. Methodol. 2011, 73, 3–36. [Google Scholar] [CrossRef] [Green Version]
  23. Wang, M.; Liu, X.; Zhang, J. Evaluate method and classification standard on lake eutrophication. Environ. Monit. China 2002, 18, 47–49. [Google Scholar]
  24. Jin, X.; Tu, Q. Code for Investigation of Lake Eutrophication, 2nd ed.; China Environmental Science Press: Beijing, China, 1990. [Google Scholar]
  25. Pearce, J.L.; Beringer, J.; Nicholls, N.; Hyndman, R.; Tapper, N. Quantifying the influence of local meteorology on air quality using generalized additive models. Atmos. Environ. 2010, 45, 1328–1336. [Google Scholar] [CrossRef]
  26. Dou, J.; Xia, R.; Zhang, K.; Zou, L.; Song, J.; TA, L. Application progress of non-parametric models in the field of river and lake eutrophication research. Res. Environ. Sci. 2021, 34, 1928–1940. [Google Scholar]
  27. Akaike, H. A new look at the statistical model identification. IEEE Trans. Autom. Control 1974, 19, 716–723. [Google Scholar] [CrossRef]
  28. Li, Q.; Chen, H.; Luo, Z.; Ren, L.; Huang, X. In Analysis of spatial and temporal variability of total organic carbon in the Yarlung Tsangpo River Basin, 2019. In Proceedings of the China Environmental Science Society Annual Science and Technology Conference, Xi’an, China, 23 August 2019; p. 11. [Google Scholar]
  29. He, X.; Lin, Z. Interactive effects of the influencing factors on the changes of PM 2.5 concentration based on GAM model. Environ. Sci. 2017, 38, 22–32. [Google Scholar]
  30. Fan, Y.; Jiang, W.; Liu, B.; Chang, W.; Wu, Z. Temporal microcystin dynamics of the source water and finished water in a waterworks of Lake Taihu. J. Lake Sci. 2018, 30, 25–33. [Google Scholar]
  31. Marjo, P.; Ari, L.; Samuli, L.; Sirpa, P. Predicting the export and concentrations of organic carbon, nitrogen and phosphorus in boreal lakes by catchment characteristics and land use: A practical approach. Ambio 2016, 45, 933–945. [Google Scholar]
  32. Fu, Y.; Jiang, S.; Feng, L.; Chen, X. TOC Monitoring and Water Quality Assessment of Drinking Water and Source Water in the Main City of Chongqing from 2017 to 2018. Guangdong Chem. Ind. 2020, 47, 140–141. Available online: www.gdchem.com (accessed on 24 January 2022).
  33. Yang, H. Studies on Carbon Cycling and Budget in East Lake; Graduate School of Chinese Academy of Sciences (Institute of Geodesy and Geophysics): Shenzhen, China, 2004. [Google Scholar]
  34. Vuorenmaa, J.; Forsius, M.; Mannio, J. Increasing trends of total organic carbon concentrations in small forest lakes in Finland from 1987 to 2003. Sci. Total Environ. 2006, 365, 47–65. [Google Scholar] [CrossRef] [PubMed]
  35. Wang, W.; Gao, P.; Li, J.; Zhou, Y. Water quality assessment and trend analysis of typical tributaries of Danjiangkou Reservoir. Water Resour. Prot. 2016, 32, 127–130. [Google Scholar]
  36. Zhang, L.; Wu, M.; Wang, Y. Study on countermeasures for water quality security of the Danjiangkou Reservoir. China Water Resour. 2018, 01, 44–47. [Google Scholar]
  37. Wetzel, R.G. Limnology: Lake and River Ecosystems; Eos Transactions American Geophysical Union; Gulf Professional Publishing: Houston, TX, USA, 2001; Volume 21, 2, pp. 1–9. [Google Scholar]
  38. Mcknight, D.; Andrews, E.D.; Spaulding, S.A.; Aiken, G.R. Aquatic fulvic acids in algal-rich Antarctic ponds. Limnol. Oceanogr. 1994, 39, 1972–1979. [Google Scholar] [CrossRef]
  39. Onstad, G.D.; Canfield, D.; Quay, P.D.; Hedges, J.I. Sources of particulate organic matter in rivers from the continental USA: Lignin phenol and stable carbon isotope compositions. Geochim. Cosmochim. Acta 2000, 64, 3539–3546. [Google Scholar] [CrossRef]
  40. Zhao, D.; Xiao, X.; Wang, Z.; Tan, D.; Chen, Y. Spatial and tactical disruption of carbon conduction in surface water from the Shuibuya Reservoir. Resour. Environ. Yangtze Basin 2017, 26, 304–313. [Google Scholar]
  41. Li, Q.; Lin, Q.; Han, B. conductivity distribution of water supply reservoirs in Guangdong province. Ecol. Environ. 2005, 14, 16–20. [Google Scholar]
  42. Tan, X.; Xia, X.-L.; Cheng, X.-L.; Zhang, Q.-F. Temporal and spatial pattern of phytoplankton community and its biodiversity indices in the Danjiangkou Reservoir. Huan Jing Ke Xue 2011, 32, 2875–2882. [Google Scholar] [PubMed]
  43. Zhang, G. Spatial-temporal distribution of chlorophyll-a and its correlation with environment factors in Dongting Lake. Environ. Monit. China 2016, 32, 84–90. [Google Scholar]
  44. Räike, A.; Kortelainen, P.; Mattsson, T.; Thomas, D. 36year trends in dissolved organic carbon export from Finnish rivers to the Baltic Sea. Sci. Total Environ. 2012, 435–436, 188–201. [Google Scholar] [CrossRef]
  45. Sarkkola, S.; Koivusalo, H.; Laurén, A.; Kortelainen, P.; Mattsson, T.; Palviainen, M.; Piirainen, S.; Starr, M.; Finér, L. Trends in hydrometeorological conditions and stream water organic carbon in boreal forested catchments. Sci. Total Environ. 2009, 408, 92–101. [Google Scholar] [CrossRef] [PubMed]
  46. Rene, E.R.; Saidutta, M.B. Prediction of water quality indices by regression analysis and artificial neural networks. Int. J. Environ. Res. 2008, 2, 183–188. [Google Scholar]
  47. Wang, H.; Tang, M.; Fang, P. Relationship between TOC and CODMn of surface water. Meteorol. Hydrol. Mar. Instrum. 2010, 27, 93–96. [Google Scholar]
  48. Liang, T. Discussion on the relationship between TOC and permanganate index in surface of Yalujiang River. Environ. Monit. China 2010, 26, 6–8. [Google Scholar]
  49. Smith, V.H. Responses of estuarine and coastal marine phytoplankton to nitrogen and phosphorus enrichment. Limnol. Oceanogr. 2006, 51, 377–384. [Google Scholar] [CrossRef] [Green Version]
  50. Dong, L.; Wu, M.; Lin, L.; Tao, J. Influence of the middle route of south-to-north water transfer project on the characteristics of community structure of planktonic algae in Danjiangkou Reservoir. Environ. Sci. Technol. 2021, 44, 1–7. [Google Scholar]
  51. Guo, S.; Wang, X.; Han, P.; Zheng, B.; Jiang, Y.; Guo, K.; Han, X.; Li, B.; Gao, X.; Yuying, L. Spatiotemporal characteristics of layered chlorophyll a concentration and influencing factors in Danjiangkou Reservoir. J. Lake Sci. 2021, 33, 366–376. [Google Scholar]
  52. Zou, W.; Zhu, G.; Cai, Y.; Xu, H.; Zhu, M.; Gong, Z.; Zhang, Y.; Qin, B. The limitations of comprehensive trophic level index (TLI) in the eutrophication assessment of lakes along the middle and lower reaches of the Yangtze River during summer season and recommendation for its improvement. J. Lake Sci. 2020, 32, 36–47. [Google Scholar]
  53. Wan, Y.; Zhang, L.; Fu, X.; Jin, H. Assessment of eutrophication degree and its prevention in Danjiangkou Reservoir. J. Beijing Norm. Univ. Nat. Sci. 2020, 56, 275–281. [Google Scholar]
  54. Zhang, X.; Xiong, J.; Cheng, J.; Yao, Z.; Chen, Y. Application of fuzzy mathematics for evaluation of eutrophication in Danjiangkou Reservoir. Environ. Monit. China 2017, 33, 99–105. [Google Scholar]
  55. Sun, S.; Wu, M.; Liao, Q.; Lu, X. Halogenation activity of organics in natural water. J. Huazhong Univ. Sci. Technol. 2001, 29, 98–100. [Google Scholar]
Figure 1. Distribution map of sampling sites in the Danjiangkou Reservoir.
Water 14 00891 g001
Figure 2. Spatio-temporal distribution of TOC concentration in the Danjiangkou Reservoir: (a) spring, (b) summer, (c) autumn, and (d) winter.
Water 14 00891 g002
Figure 3. PCA of environmental factors of the Danjiangkou Reservoir in different seasons and different reservoir areas.
Water 14 00891 g003
Figure 4. Seasonal variation of environmental factors in the Danjiangkou Reservoir: (a) WT, (b) pH, (c) DO, (d) Cond, (e) SD, (f) CODMn,, (g) COD, (h) TN, (i) TP, (j) NH4+-N, (k) NO3-N, (l) Chl.a; ns denotes p > 0.05; * indicates p < 0.05; ** denotes p < 0.01; *** denotes p < 0.001; **** denotes p < 0.0001.
Water 14 00891 g004
Figure 5. Spatio-temporal characteristics of the integrated trophic state index in the Danjiangkou Reservoir.
Water 14 00891 g005
Figure 6. Correlation analysis of TOC concentration and environmental factors in the Danjiangkou Reservoir.
Water 14 00891 g006
Figure 7. Effect of major environmental factors on the change of TOC concentration in the Danjiangkou Reservoir: (a) WT, (b) Cond, (c) TN, (d) CODMn, (e) TP. The solid line in the figure indicates the smoothed fit of the explanatory variables to TOC concentration, the shaded area indicates the point-by-point standard deviation of the fitted additivity function (that is, the upper and lower limits of the confidence interval), the horizontal coordinates indicate the observed values of the explanatory variables, and the vertical coordinates indicate the smoothed fit of the explanatory variables to TOC concentration.
Water 14 00891 g007
Figure 8. Linear regression analysis of TLI and TOC concentration.
Water 14 00891 g008
Table 1. Classification of nutritional status of lakes (reservoirs).
TLI(Σ)Trophic State
TLI(Σ) < 30Oligotrophic
30 ≤ TLI(Σ) ≤ 50Mesotrophic
50 < TLI(Σ) ≤ 60Lightly eutrophic
60 < TLI(Σ) ≤ 70Moderately eutrophic
TLI(Σ) > 70Severely eutrophic
Table 2. GAM model analysis of TOC concentration and environmental factors in the Danjiangkou Reservoir in Autumn.
Environmental
Factor
d.f.Ref.d.f.Fp-ValueDeviance Explained (%)R2
WT11.53011.93035.5600.000148 ***98.500.958
pH1.8261.9705.5390.0235 *39.800.330
DO1.0001.0000.0790.7820.46−0.054
Cond1.0001.0000.6340.4373.59−0.021
SD1.5801.8240.6350.53710.700.021
CODMn1.6081.84734.7804.91 × 10−6 ***78.600.765
COD1.0001.0000.3880.5422.23−0.035
TN1.6021.8420.9090.32016.200.080
TP1.4571.7050.3000.6737.56−0.006
NH4+-N9.61610.50014.9400.000382 ***95.200.896
NO3-N1.0001.0000.0620.8060.37−0.055
Chl.a1.0001.0000.1950.6641.14−0.047
Note: Variables with significant influences are indicated by: * p < 0.05 and *** p < 0.001 (same below).
Table 3. GAM model analysis of TOC concentration and environmental factors in the Danjiangkou Reservoir in Winter.
Environmental Factord.f.Ref.d.f.Fp-ValueDeviance Explained (%)R2
WT1.0001.0001.8580.1919.850.046
pH1.0001.0000.7150.4104.04−0.016
DO3.6254.3311.2110.35132.600.156
Cond1.0001.0001.9960.17610.500.052
SD1.0001.0005.4440.032 *24.300.198
CODMn2.6903.1711.3790.27726.500.136
COD1.0001.0000.4800.4982.74−0.030
TN4.5934.885119.600<2 × 10⁻¹⁶ ***97.800.970
TP1.0001.0003.4700.080.17.000.121
NH4+-N1.0291.0572.3180.15112.500.072
NO3-N1.0001.0003.1030.096.15.400.105
Chl.a1.0001.0002.7750.11414.000.090
For the spatialNoNote: Variables with significant influences are indicated by: * p < 0.05 and *** p < 0.001.
Table 4. GAM model analysis of TOC concentration and environmental factors in the Dan Reservoir.
Environmental
Factor
d.f.Ref.d.f.Fp-ValueDeviance Explained (%)R2
WT2.8082.97223.340<2 × 10⁻¹⁶ ***60.000.577
pH6.4137.7474.9140.000 ***48.400.410
DO5.4536.3053.0370.016 *31.800.236
Cond8.5288.91512.030<2 × 10⁻¹⁶ ***72.700.672
SD1.0001.0003.5600.0626.800.049
CODMn6.2907.2092.5920.025 *33.000.236
COD1.9502.34215.8402.63 × 10−6 ***44.200.420
TN6.4047.6869.358<2 × 10⁻¹⁶ ***62.900.575
TP8.68010.2002.0160.05337.300.245
NH4+-N1.8401.9746.4980.006 **20.300.173
NO3-N1.0001.0000.6620.4201.31−0.007
Chl.a1.0001.0003.4670.0696.480.046
Note: Variables with significant influences are indicated by: * p < 0.05, ** p < 0.01, and *** p < 0.001.
Table 5. GAM model analysis of TOC concentration and environmental factors in Han Reservoir.
Environmental
Factor
d.f.Ref.d.f.Fp-ValueDeviance Explained (%)R2
WT1.0001.0005.3550.030 *19.600.159
pH1.2311.4090.8280.5265.440.001
DO5.9547.2820.8180.58635.800.134
Cond1.8742.3141.9220.16820.800.138
SD5.1846.2590.8950.52431.300.113
CODMn6.1617.1242.7300.042 *57.600.421
COD1.0001.0005.4120.030 *19.700.161
TN1.4301.7063.4980.09320.400.152
TP12.1812.828.8340.001 ***91.700.824
NH4+-N1.0001.0006.7930.016 *23.600.201
NO3-N2.1452.5122.2250.09327.000.195
Chl.a1.0001.0005.1140.034 *18.900.152
Note: Variables with significant influences are indicated by: * p < 0.05 and *** p < 0.001.
Table 6. GAM model analysis of TOC concentration and environmental factors in the Danjiangkou Reservoir.
Environmental
Factor
d.f.Ref.d.f.Fp-Value
WT1111.4680.00129 **
Cond119.4460.00324 **
COD1.0211.0411.6020.20214
TN3.6934.359.9972.98 × 10−6 ***
NH4+-N110.0330.85677
CODMn5.5595.9113.5580.00330 **
DO113.9430.05187
TP2.3942.9752.970.04632 *
Chl.a110.070.79199
Note: Variables with significant influences are indicated by: * p < 0.05, ** p < 0.01, and *** p < 0.001.
Publisher’s Note: MDPI stays neutral with regard to jurisdictional claims in published maps and institutional affiliations.

