
Development of a New Multivariate Composite Drought Index for the Blue Nile River Basin


1
Water Resources Research Institute, National Water Research Center, Cairo 113621, Egypt
2
Irrigation and Hydraulics Department, Faculty of Engineering, Cairo University, Giza 12316, Egypt
*
Authors to whom correspondence should be addressed.
Water 2022, 14(6), 886; https://doi.org/10.3390/w14060886
Submission received: 1 February 2022
/
Revised: 4 March 2022
/
Accepted: 7 March 2022
/
Published: 11 March 2022
(This article belongs to the Special Issue Modelling of Floods and Droughts under a Changing Climate)
Abstract
:Drought is a slow-onset phenomenon that evolves over a season or even years. Drought affects people more than any other natural disaster due to its widespread and significant negative impacts. Population growth and associated water demand add further stress on water resources, especially in periods of drought. Drought indices represent a single value resulting from processing a considerable amount of data. These indices provide a short message to stakeholders to adapt water resource management strategies. Since drought results from interconnected phenomena, designing a composite drought index that includes several drought indices can accurately capture drought events. Drought assessment over a large-scale basin (e.g., the Blue Nile) is a challenging objective that has not been deeply tackled before except for small portions of the basin. This paper assessed droughts over the whole basin by evaluating meteorological, agricultural, and hydrological drought indices. The calculated drought indices (Standardized Runoff Index (SRI), Standardized Precipitation Index (SPI), and standardized soil moisture index (SSI)) in addition to the development of a new standardized evapotranspiration index (sETI) are jointly integrated into a novel composite drought index for the Blue Nile (BNI). The optimal weights for SPI, SRI, sETI, and SSI were 0.33, 0.26, 0.2, and 0.19, respectively, in the designed BNI.
1. Introduction
Most human activities rely on water resources. Anything changing their availability would make water resource managers concerned and could lead to instability for any community. Drought is one of the most extreme natural events that humankind draws particular attention to, especially with its complexity and vague onset. Drought is described as less-than-average available water resources in the form of precipitation, groundwater recharge, or stream runoff. Additionally, drought results from a mix of physical and human factors [1]. Although flood and hurricanes have a beginning, end, and severe impacts on infrastructures, drought is a slow-onset phenomenon that evolves over a season or even years. Moreover, it affects people more than any other form of natural disaster with little impact on infrastructure [2].
It is difficult to provide a unified definition of drought. As of yet, no universal definition has been agreed upon by scientists, related disciplines, or policymakers [3,4,5], nor has it been defined strictly in terms of climate variability [6]. As a result, many definitions of drought were developed based on the type of drought. Even in the 1980s, Wilhite et al. [7] reported that over 150 drought definitions had been officially published. In fact, it is challenging to adapt definitions developed for a specific region to another since the definitions demonstrate the region’s characteristics, whether they are climatic features or human-induced activities. Moreover, drought is more than just a lack of precipitation climate variability. Otherwise, most arid and semi-arid regions would be under permanent drought conditions. Due to the seriousness of the impacts of drought, the number of published studies that discuss droughts and their impacts increased rapidly. Orimoloye et al. [8] indicated that 1171 articles were published on drought in Africa over the last 100 years, specifically from 1921 to 2021. South Africa had the highest rate of publications with 453 published papers, then Egypt with about 187 articles, while Ethiopia and Sudan had approximately 59 and 20 articles, respectively. The consequences of drought could be significant on the environment and economy, which can go far beyond the immediately affected areas. Its impacts vary from disturbance of ecosystem function and low agricultural productivity to famine that could lead to mass migration. Additionally, the situation’s severity depends on how much people rely on one source over the other and their needs. After that, if the drought continues, many sectors will be affected and suffer consequences. The impacts of droughts extend to affect the mental health of people and are connected to feelings of disgrace, hopelessness, anxiety, depression, and suicidal thoughts in drought-prone areas [9]. According to the World Meteorological Organization (WMO), between 1967 and 1991, around 1.4 billion people were influenced by drought, and 1.3 million people died as a result of drought-related causes, both direct and indirect [10]. The GAR Special Report on Drought 2021 [11] showed that droughts have directly affected at least 1.5 billion people and caused global economic losses of at least 124 billion United States Dollars during the period from 1998 to 2017.
Unfortunately, the rapidity of the drought propagation in a system is not the same as that of recovery when the dry period ends. Return to normal situations is determined by several factors such as drought duration, drought severity, and the amount of precipitation received after the dry period has ended. Moreover, it depends on the source itself and its characteristics. On the other hand, we also cannot ignore the effects of interactions between humans and the environment on drought propagation and recovery. Social, environmental, and economic conditions are affected by drought and could be the main drivers of worsening or lessening drought severity as well. There are some studies that propose inclusive drought management and preparedness plans. Orimoloye et al. [12] studied ecosystem services and their contributions to drought management in South Africa. The authors found that in addition to technical drought assessment, the mechanism between the human interactions and the ecosystem should be understood and taken into consideration. Also, ecosystem-based approaches reduce the effects of drought while also providing a healthy environment. As a further matter, climate change is projected to have serious implications for water resources. It is expected that extreme weather events, such as droughts, floods, and heatwaves, will increase further both in frequency and impact under a projected warmer atmosphere [13,14]. Further, any slight change in climate norms could significantly affect societies. A recent review of the findings of drought studies in the last decade indicated that the real impact of climate change on drought recurrence was not well examined on a regional or global scale. Extensive efforts are still required to investigate and forecast potential drought episodes in the future [15]. Thus, there is a crucial need for drought assessment and monitoring mechanisms to minimize loss due to drought.
Drought indices represent a specific number derived from a massive quantity of data. This simple source of information makes it simple to convey the crucial message to a wide range of audiences and actors, including decision-makers, stakeholders, policy-makers, and end-users. A drought index can illustrate one parameter such as precipitation or stream discharge, or combine diverse meteorological, agricultural, and hydrological characteristics like temperature, soil moisture, and groundwater level. Some researchers provided literature reviews and classifications of the available drought indices. Richard and Heim [16] gave an inclusive review of twentieth-century drought indices used in the United States. Keyantash and Dracup [2] applied the weighting system to evaluate 14 of the most prominent indices and ranked them in terms of usefulness for assessing drought severity based on six criteria. Quiring [17] focused on the commonly used meteorological drought indices within the United States, described their strengths and weaknesses, and recommended the most appropriate ones for monitoring meteorological drought. Zargar et al. [18] gave a comprehensive review of more than 100 drought indices, highlighted their differences, and examined the trends in their development. Kchouk et al. [19] investigated 32 drought indices that cover meteorological, hydrological, and agricultural drought types, but the authors did not include composite drought indices. Bhaga et al. [20] discussed the characteristics and limitations of some drought indices that use remote sensing data and had been applied in Sub-Saharan Africa. The review showed that the indices varied in their accuracies from one region to another due to shadows in mountainous areas, pixel mixing, and cloud cover.
The drought indices rely on two categories of calculations (water balance and time series statistical analysis) [21]. The water balance indices require a variety of meteorological and physical parameters, and their major limitations are the requirement of many input parameters and complicated calculations. The statistical analysis indices need one parameter or, rarely, two parameters. These indices’ major limitation is that they do not fully comply with the essential requirements of drought definition. They struggle to show drought persistence, and they need long time series as input. However, all of the most commonly used drought indices are found in this category. A bibliometric analysis of drought monitoring and prediction studies in Africa from 1980 to 2020 was carried out [22]. The analysis showed that analysis techniques and tools had evolved from simple statistics to the usage of geospatial tools such as remote sensing, geographical information system models, and, more recently, machine learning. Machine learning models are a subset of artificial intelligence and have shown effectiveness in the drought prediction process [23,24]. They become more common in the field of estimation time series modeling and are capable of giving reliable mathematical formulations for identifying behavioural patterns in complicated systems [25,26,27,28].
Droughts are influenced by various elements, including water supply and demand and hydrological and socioeconomic conditions. Hence, many academics have proposed to develop a combined index that integrates the current and already-developed indices rather than producing a new single drought index [3,18,21,29,30,31,32,33]. In the mid-2000s, composite drought indices became popular [34]. In the most recent studies, Sepulcre et al. [35] developed a composite drought indicator that incorporates the anomalies of the fraction of absorbed photosynthetically active radiation (fAPAR), soil moisture anomalies, and SPI to produce a three-level warning system for precipitation shortfall and deficit in soil moisture with combination with a reduction in vegetation production. To overcome the problem of missing monitoring systems for operational drought in Kenya, Balint et al. [21] produced a combined drought index using precipitation deficit index (PDI), temperature deficit index (TDI), and vegetation deficit index (VDI). In order to design a reliable index for assessing agricultural drought in India, Vyas et al. [32] used high temporal normalized differences vegetation index (NDVI) and rainfall from Indian geostationary meteorological satellites to build a remote sensing-based index. The adapted methodology was based on the qualitatively assigned relative weight. Kulkarni et al. [36] developed an integrated agro-climatological drought index for Marathwada in India using SPI, land surface temperature (LST), soil moisture (SM), and normalized difference vegetation index (NDVI). Han et al. [37] used a machine learning technique to develop a new combined drought monitoring index (CDMI) for monitoring agricultural droughts from NDVI, LST, evapotranspiration (ET), and the Tropical Rainfall Measuring Mission rainfall data (TRMM).
Because of the historical recurrence of dry periods that have faced the Blue Nile (BN), drought assessment research activities in the BN have intensified in recent years. Ali et al. [38] performed a review of drought indices that were found in peer-reviewed articles and used to assess droughts over the BN up to 2019. The review showed that most of the studies focused on meteorological drought by using the SPI to investigate its capabilities to capture the historical droughts of the entire basin. Amin, et al. [39] focused their research on the Blue Nile Basin (BN) and the Atbara River from 1961 to 1990 and from 2021 to 2050 for the future. The authors used two reference rainfall datasets, namely the rainfall data set provided by the Climatic Research Unit (CRU) and the rainfall reanalysis data set (ERA40) provided by the European Center for Medium-Range Weather Forecasting), in order to investigate the impact of climate change on drought risk. Although drought probability was similar in both datasets, the rainfall from ERA40 was overestimated compared to the rainfall from CRU. The SPI was used in both investigations to detect previous droughts. Bayissa et al. [40] used 14 rainfall stations as an indication for long records (1953–2009) and 23 rainfall stations for short records (1975–2009) to investigate the effect of the different record lengths on drought classifications. Next, they used the SPI to inspect the occurrence and distribution of droughts across the Upper Blue Nile (UBN). The research results revealed that data length has only a minor impact on SPI values and, as a result, drought categorization. The SPI captured drought episodes throughout the 1970s, 1980s, 1990s, and 2000s. Additionally, the authors declared that there is no significant trend for droughts in the region. Khadr [41] obtained the same conclusion using the SPI to measure the extent and trend of historical metrological droughts on temporal and geographical features for the 49 years (1960–2008) using 22 rainfall gauges for the UBN. With the same date range as the previous study, the Hidden Markov Model (HMM) was used to forecast droughts using the SPI in the short-medium period over the UBN [42]. With sufficient precision, the model could anticipate the monthly SPI roughly 7 months in advance, and it could be utilized as a drought early warning tool. On the other hand, the accuracy of predicting falls as the advance time grows. Bayissa et al. [43] used the Z-Score index for the UBN. The 3-month Z-Score values were calculated using Climate Hazards Group InfraRed Precipitation with Stations (CHIRPS) v2.0 during the wet kiremit season from 1983 to 2015. Droughts in the 1980s, 1990s, and 2010s were all documented by the index. Zaroug et al. [44] explored the El Niño index to examine the relationship between it and the UBN’s outflow over 48 years, beginning in 1965. According to the findings, there is a strong link between the timing of El Niño and La Niña events and the occurrence of floods and droughts. Particularly, if El Niño starts in June–August or July–September, there is an 80% chance of drought and an 83 percent chance if it starts in April–June. The authors, however, stated that the findings are based on only six El Niño incidents and that further research is needed. Dutra et al. [45] applied the SPI to five African basins, including the BN, to test the capacity of an integrated drought monitoring and seasonal forecasting system to anticipate up to a 5-month lead time based on precipitation forecasts collected from seasonal climate prediction systems. The authors discovered that the lack of climate data in the examined basins hindered verifying and monitoring droughts in those basins. On the other hand, the Blue Nile had better predictability for seasonal projections. Moreover, the accuracy of seasonal forecasts is influenced by the quality of precipitation products. Awadallah et al. [46] studied the probability of drought occurrence using 130 long streamflow time series at Aswan. To prevent the impact of outliers, the authors combined the linear moments (L-moments) with a segmentation approach for parameter estimation. They separated the White Nile inflow contribution while monitoring the Blue Nile and Atbara seasonality. They discovered that the fluctuation in the flow asserted the Hurst phenomenon, and the findings recorded the drought times of the 1980s with verification of the flow series’ non-stationarity. Bayissa et al. [47] compared six drought indicators to define the historic droughts and their characteristics in the UBN, following a new route toward employing more than one index to analyze droughts. In order to calculate these six indices, they used a variety of data from 1970 to 2010. It was found that meteorological indicators accurately depict drought in shorter months than agriculture indices. In contrast, the maximum drought duration was higher in meteorological indices than in the agricultural indices. This is because agricultural indices include other inputs impacted by wet periods between two droughts. In general, the agricultural drought was influenced differently by the meteorological drought in distinct ways, both in terms of time and space, and the hydrological drought lasted longer, even at smaller time scales. Dilnesa [48] looked at droughts along the Blue Nile in the east Gojjam region during the period 1984–2014 using the SPI, streamflow drought index (SDI), and reconnaissance drought index (RDI). The data used (precipitation and streamflow) were from ground base stations. All indices indicated severe drought during the 1980s, which agreed with similar studies. Mulualem et al. [49] attempted to forecast the standardized precipitation evapotranspiration index (SPEI) by building seven data-driven artificial neural network (ANN) prediction models that included sea surface temperatures (SST), Pacific decadal oscillation (PDO), southern oscillation index (SOI), Indian Ocean dipole (IOD), potential evapotranspiration (PET), maximum and minimum temperature, and rainfall datasets. The study was done on the UBN for the period 1986–2015. Statistical evaluations of the different models revealed that integrating large-scale climatic indices in the models produced accurate results in predicting the SPEI values. Taye et al. [50] compared the performance of remote sensing rainfall CHIRPSv2, and the MSWEPv2 (Multi-Source Weighted-Ensemble Precipitation version 2) for analyzing the monthly SPI over UBN for 38 years over period 1981–2018. The results were validated by ground gauges over the basin. CHIRPSv2 had better results based on statistical analysis with MSWEPv2 and was used in SPI calculations. Drought has neither a declining nor a rising linear trend in terms of frequency and magnitude which was declared in previous studies.
The trials toward producing new indices over the region were limited. Bayissa [51] used the principal component analysis (PCA) technique and impact-based random search optimization to develop impact-based combined drought indices to monitor crop yields anomalies over the UBN. He concluded that the combined drought index, which was created using impact-based random weights, corresponded well with the four crop yield anomalies studied: teff, barley, maize, and sorghum. Meanwhile, the combined drought index established using PCA might predict years with negative crop production anomalies just as effectively. Kebede et al. [52] produced two new drought indices from precipitation, potential evapotranspiration, and temperature, considering both with and without El Niño sea surface temperature as input for the UBN. The two indices are MVDIstS, which considered sea surface temperature (SST) among the meteorological variables, and MVDIstS, which did not consider SST. Different statistical approaches are used to illustrate the accuracy of the established drought indicators with the observational SPI. Both indices illustrated a similar trend to the SPI throughout various time frames and magnitudes.
This study is inspired by the fact that there is a lack of an appropriate drought assessment for the Blue Nile, and most of the previous studies only focused on the meteorological drought over the UBN, which is a sub-catchment of the Blue Nile. In this context, the availability of an adequate drought assessment tool will significantly contribute to essential aspects of the region’s plans such as water security, food security, hazard management, and risk reduction.
This research aims to develop a composite drought index (CDI) that will contribute to the drought assessment over the Blue Nile and integrates the information included in different drought indices for better monitoring of the drought events over the basin. This will help develop a drought preparedness plan for the downstream countries.
2. Materials and Methods
2.1. Study Area
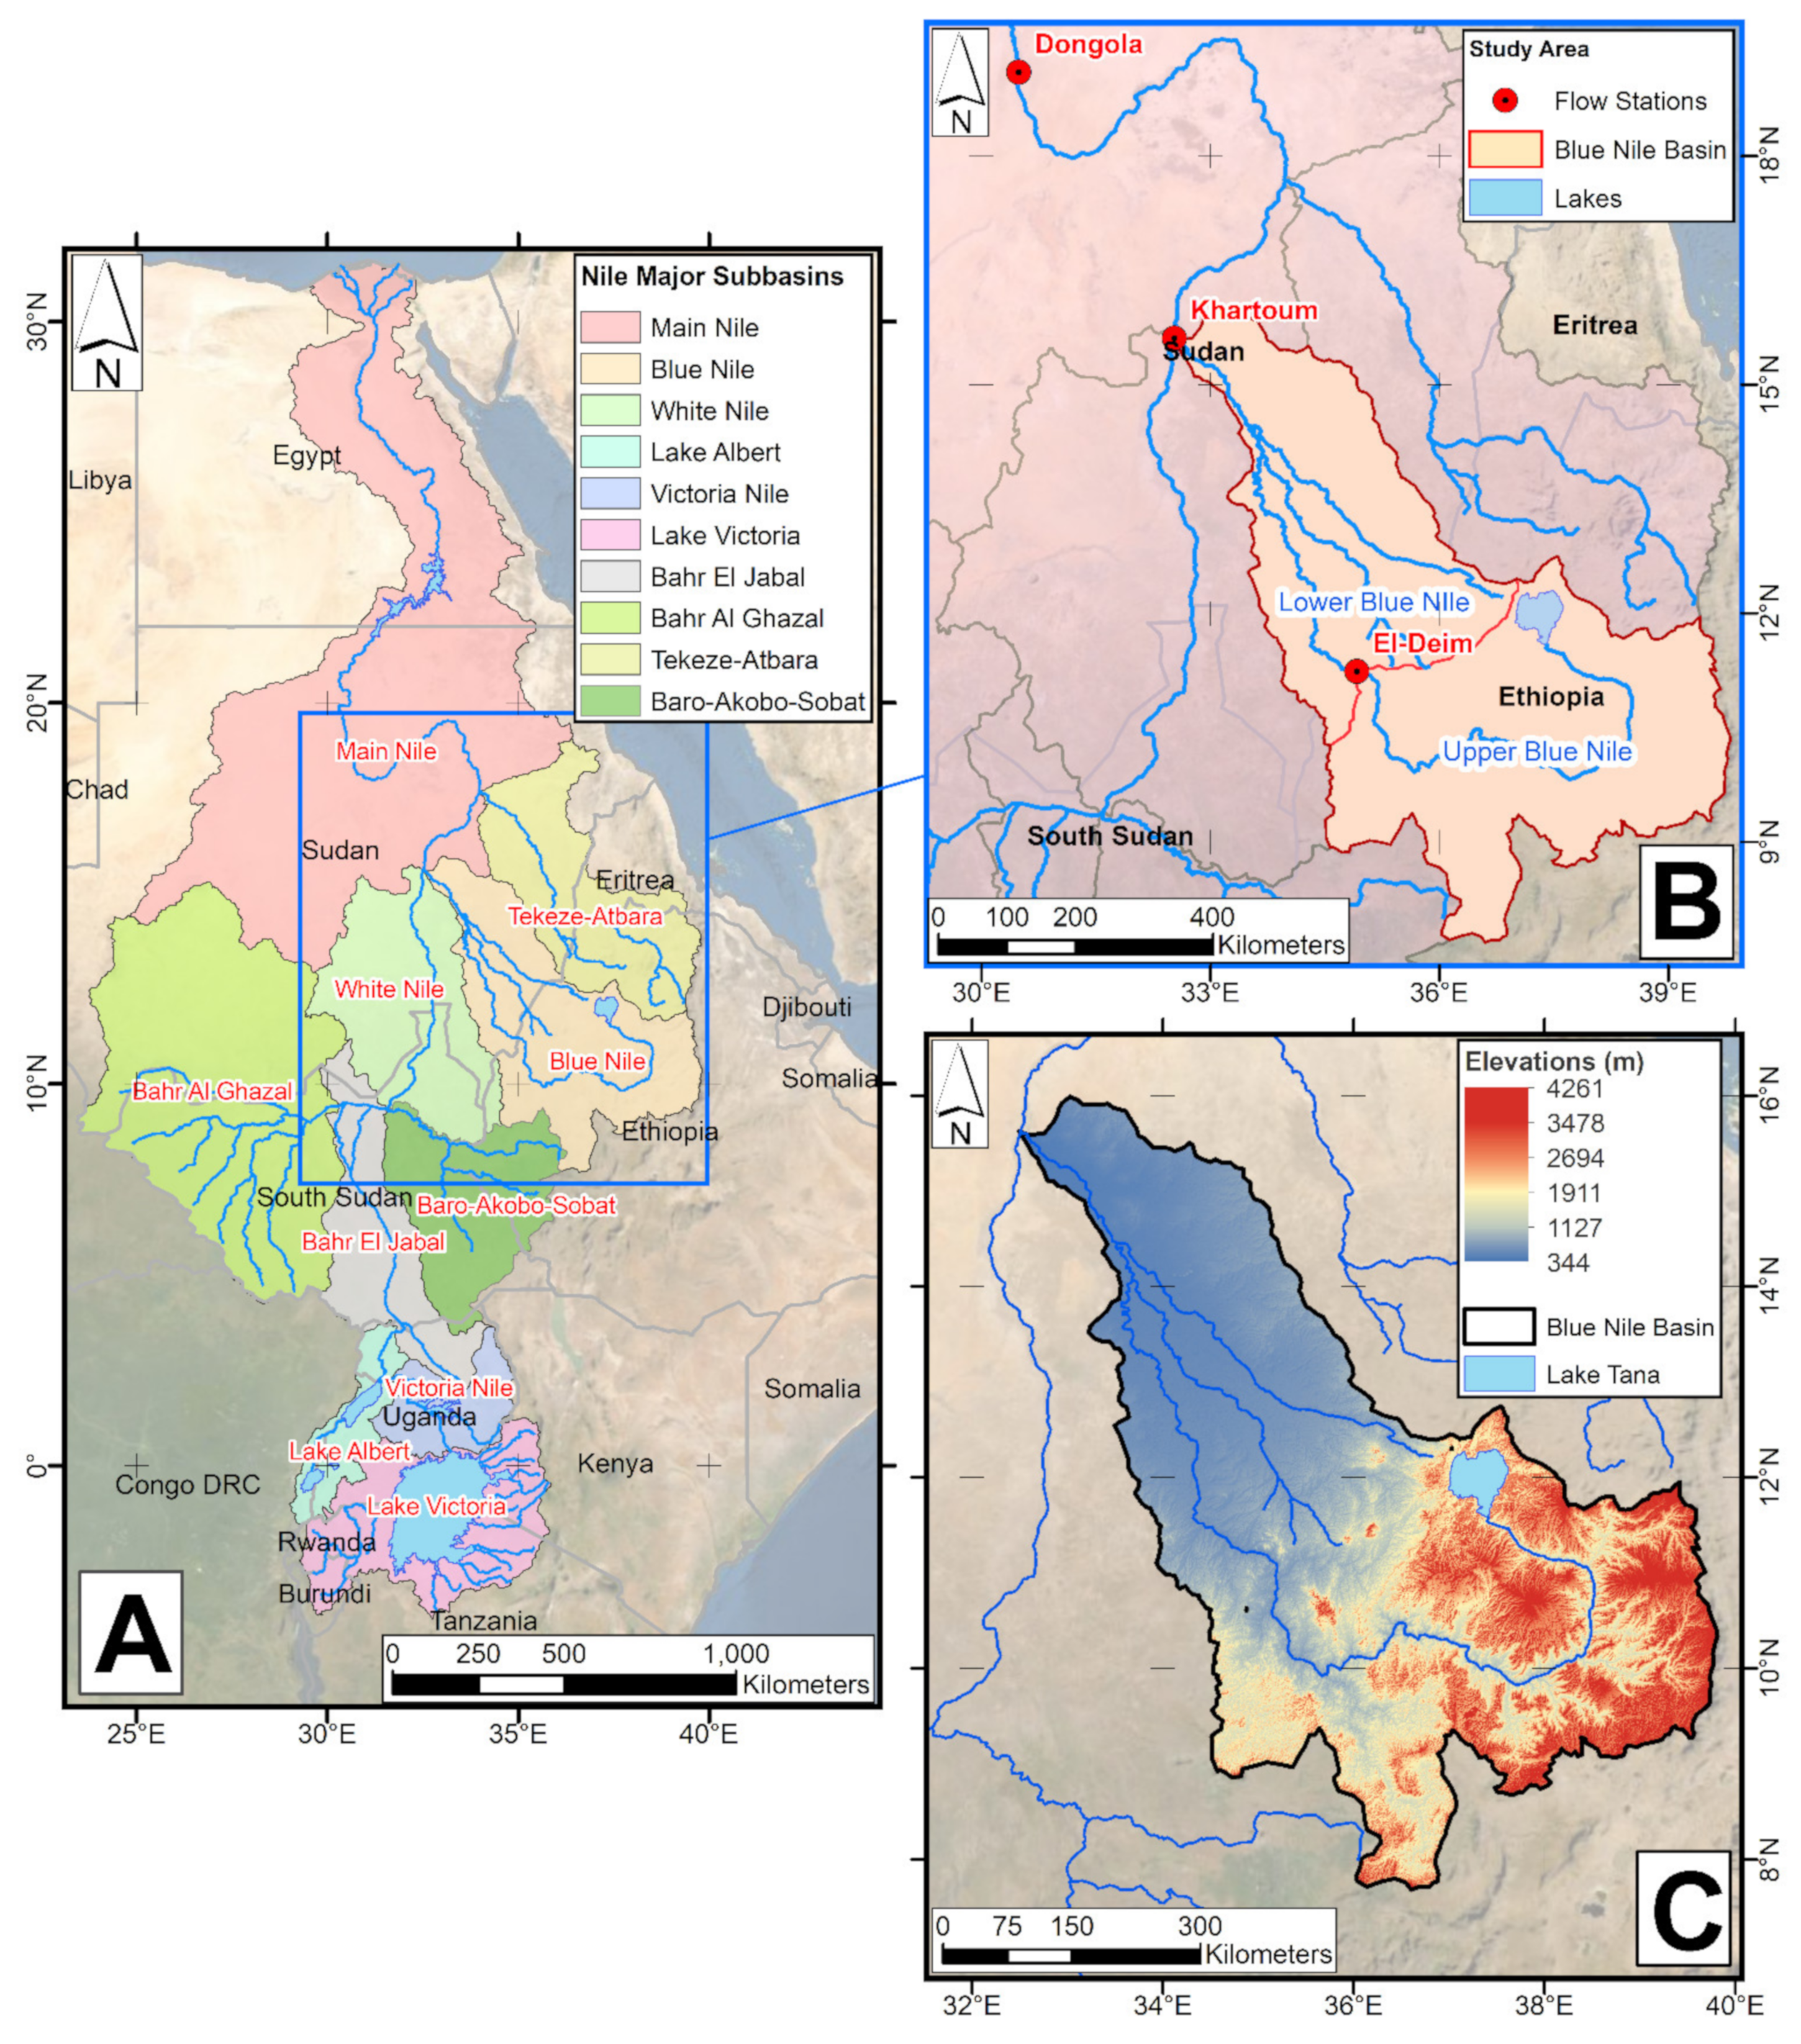
The Blue Nile (BN) is the main tributary of the Nile with a significant contribution (about 60%) of the whole flow volume of the Nile River Basin [53]. It runs from the little Abbey, identified as its source, which flows into Lake Tana and continues its path through the Ethiopian highlands to cross the Sudanese border at EL-Diem. Thereafter, it continues its journey until it joins the White Nile in Khartoum. The BN is positioned between longitudes 32°30′ E and 39°49′ E, and latitudes 7°40′ N and 16°2′ N. Figure 1 shows the major sub-basins of the Nile River, Blue Nile basin topography based on the 30 m STRM DEM Model, and the locations of the flow stations. It is visible that the BN has two distinguishing characteristics. The flat region is downstream of the basin in Sudan, and it is known as the Lower Blue Nile Basin (LBN). The hilly and steep areas in Ethiopia are the Upper Blue Nile (UBN). According to the DEM model, the lowest point is about 344 m above sea level (asl) at Khartoum, and the highest point has an altitude of 4260 m asl found in the highlands of the Ethiopian section.
The region is characterized by heavy rainfall, which greatly impacts essential aspects of life in the region. Drought assessment research activities in the region have increased in recent years because of the occurrence of dry circumstances in history in recent decades. The International Disaster-Emergency Events Database (EM-DAT) and Drought Early Warning Forecasting (DEWFORA) project reported that in the last years, there have been several periods of drought in Ethiopia and Sudan, which contributed to food-insecure conditions and, in consequence, led to human displacement and massive economic damage.
2.2. Data
Due to the difficulty of direct drought measures, several response parameters have been employed to monitor droughts statistically. To distinguish drought events, parametric measures are frequently compared to normal values or average values throughout time, either percentiles or indices. These responsive characteristics can be obtained from ground measurement, earth observation techniques, or hydrological models. The input data must be acquired reliably before any statistical study can be conducted. To develop a composite drought index, four input parameters were used. These parameters were precipitation, discharge, soil moisture, and evapotranspiration. The following sections describe each dataset.
2.2.1. Ground Data
- Discharge (Q)
The discharge data for this study were obtained at some key locations (Khartoum and El Diem). The data have a monthly time step and are used to determine the standardized runoff drought index (SRI). The data have relatively long records from 1966 until 2019. The station locations are shown in Figure 1. The locations of the stations are representative for the basin and capture changes in streamflow discharge.
2.2.2. Remote Sensing Data
- Precipitation (P)
The Climate Hazards Group Infrared Precipitation with Stations (CHIRPS) satellite rainfall product is employed to depict the meteorological components of drought. It was developed by the U.S. Geological Survey (USGS) and the Climate Hazards Center (CHC) at the University of California, Santa Barbara. CHIRPS data results from satellite images merged with in situ ground gauges to generate a gridded time series of rainfall [54]. The data were obtained from this link (www.chc.ucsb.edu/data/chirps. Accessed 16 February 2022). It has a fine spatial resolution of about 5 km (0.05°) and a long temporal coverage from 1981 to February 2022, over 40 years of monthly data. Using CHIRPS data has many advantages. CHIRPS is constantly updated and offers superior geographical coverage and temporal resolution. It showed high performance and accuracy for African basins, in particular the Nile [43,50,55,56]. The data records used to calculate the standardized precipitation index (SPI) were from 1981 to July 2020. The sample of data for the BN is shown in Figure 2.
2.2.3. Land Data Assimilation Model
- Evapotranspiration (ET)
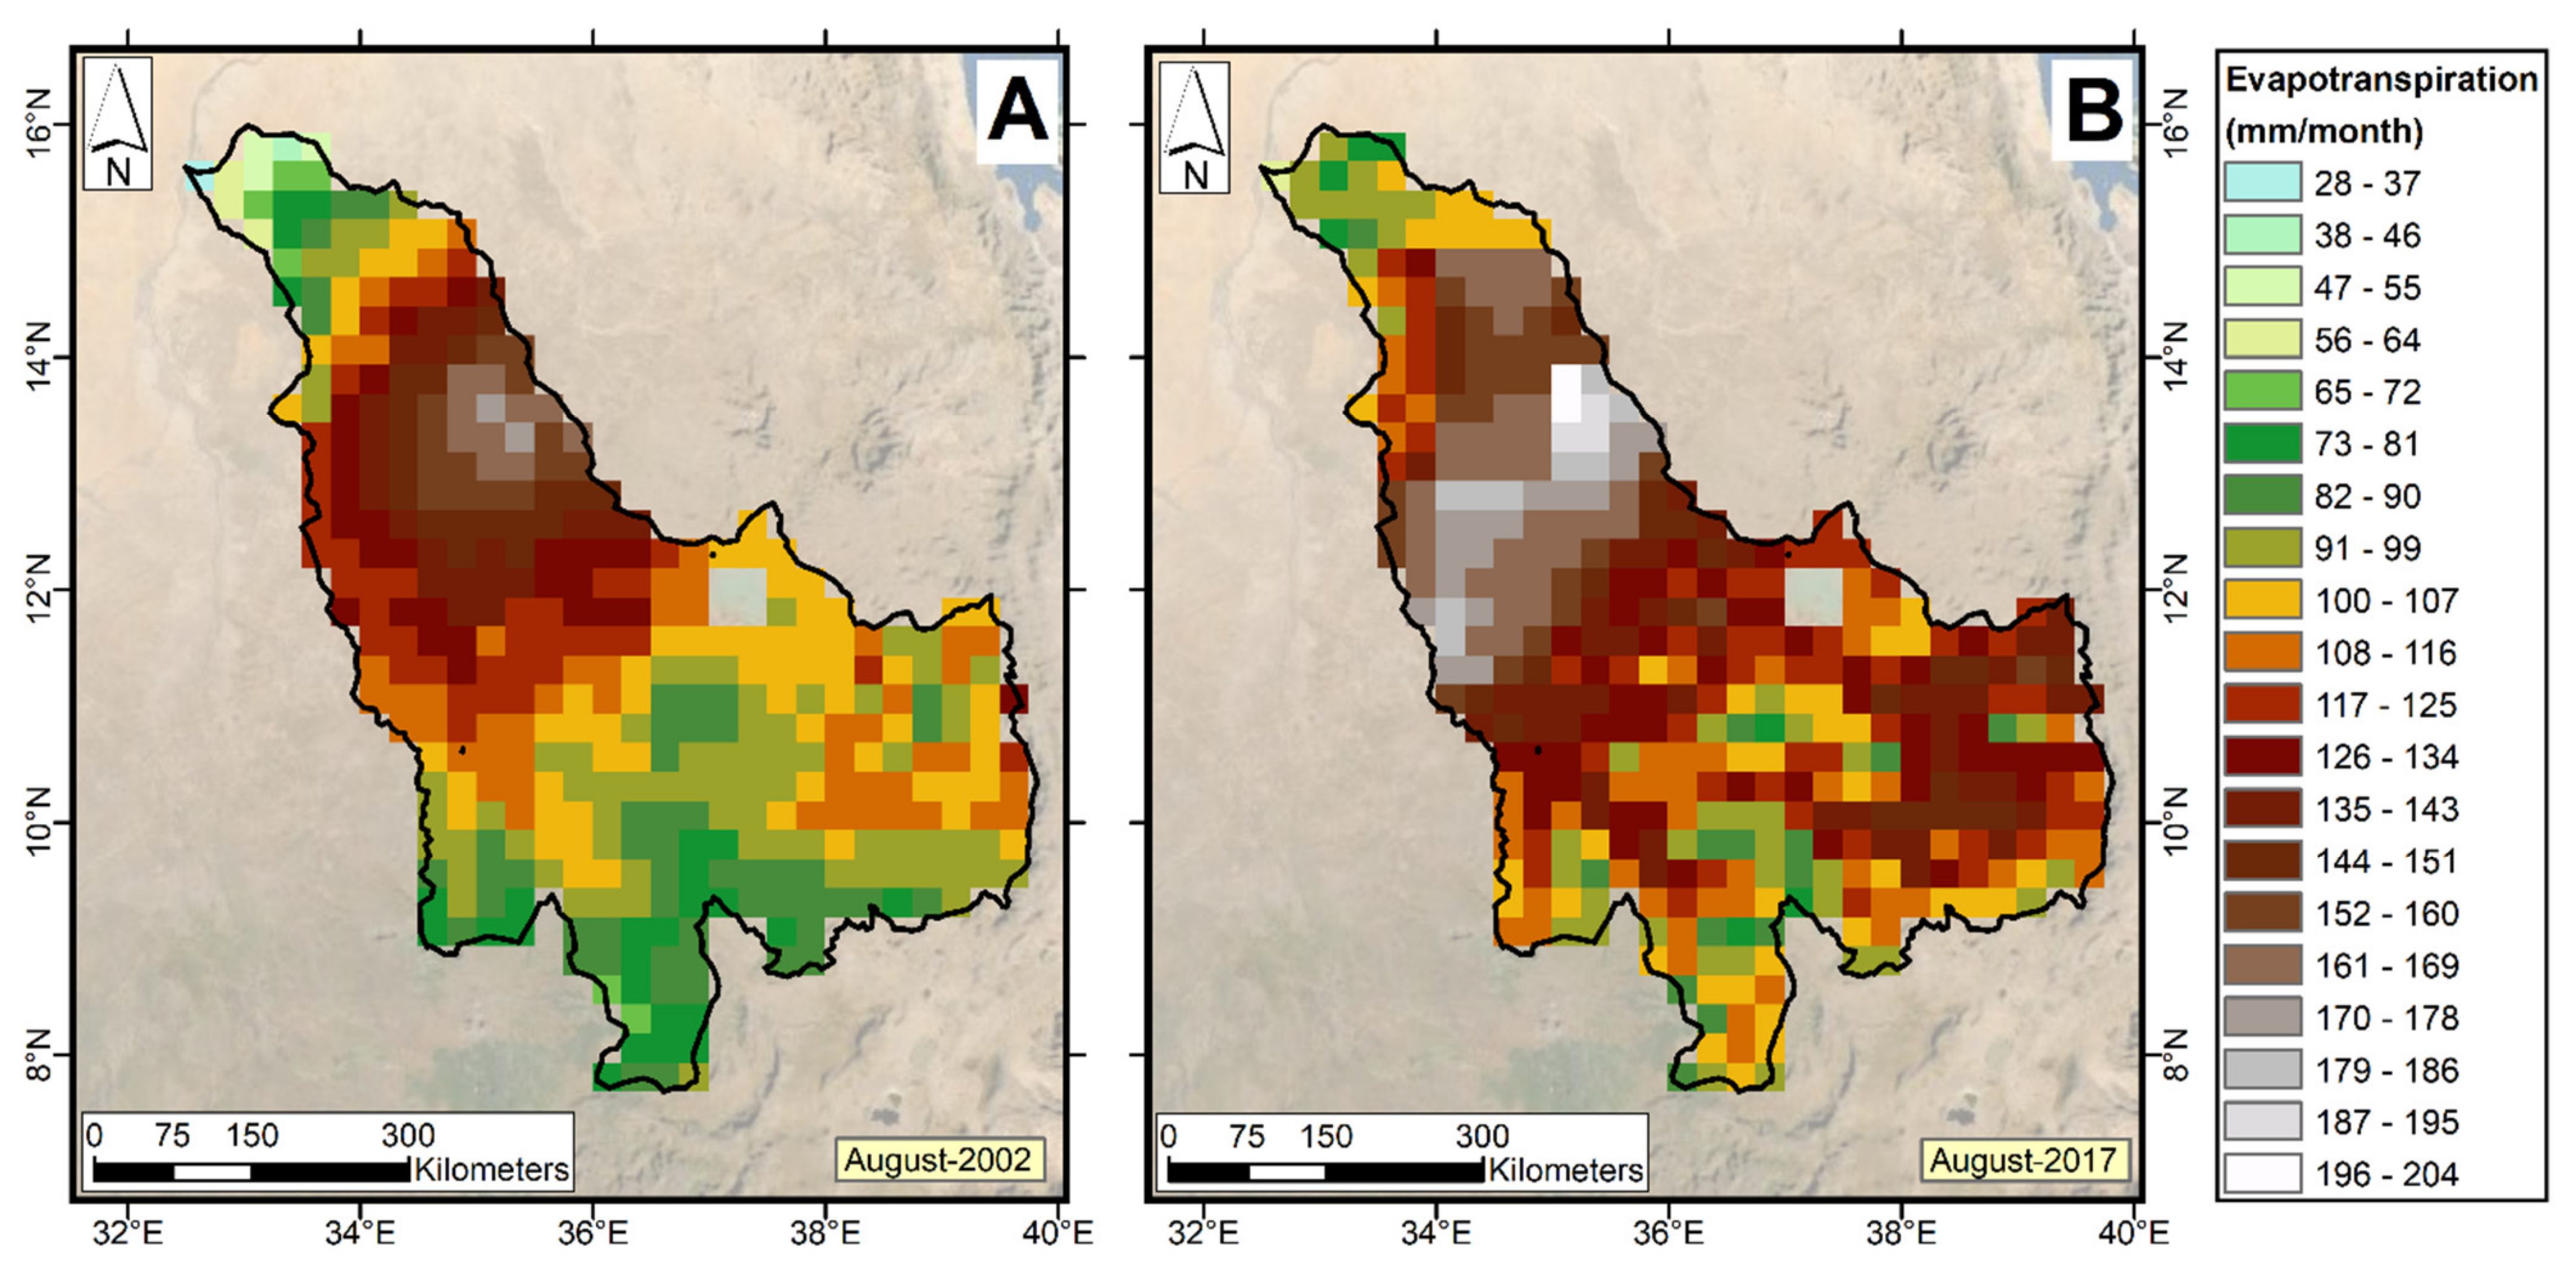
Accurate evapotranspiration estimation is crucial in assessing water resources and the influence of climate and land-use change on those resources [57]. Many drought researchers have focused on including evapotranspiration in drought indices [58,59,60]. However, information used to calculate the ET is complicated to measure in most parts of the world due to limited spatial resolution and the high cost of measurement apparatus. Therefore, researchers resorted to remote sensing (RS) products to overcome these limitations. Recent improvements in remote sensing technologies and progress in data assimilation techniques have enabled ET estimation, such as the Global Land Data Assimilation System (GLDAS). The GLDAS provides ground-based observations and remote sensing instruments to provide data to restrain the modeled land surface conditions [61]. The GLDAS was created collaboratively by scientists at the National Oceanic and Atmospheric Administration, National Centers for Environmental Prediction; and the National Aeronautics and Space Administration, Goddard Space Flight Center. The data can be found via the link: (www.disc.gsfc.nasa.gov/datasets/GLDAS_NOAH025_M_2.1/summary. Accessed 18 February 2022). Many researchers used GLDAS data to depict or monitor drought in Africa and many parts of the world [62,63,64,65]. In this study, GLDAS with Noah (GLDAS-Noah) version 2 was used with temporal coverage from 2000 to the near present. A sample of data from GLDAS is presented in Figure 3.
- Soil Moisture (SM)
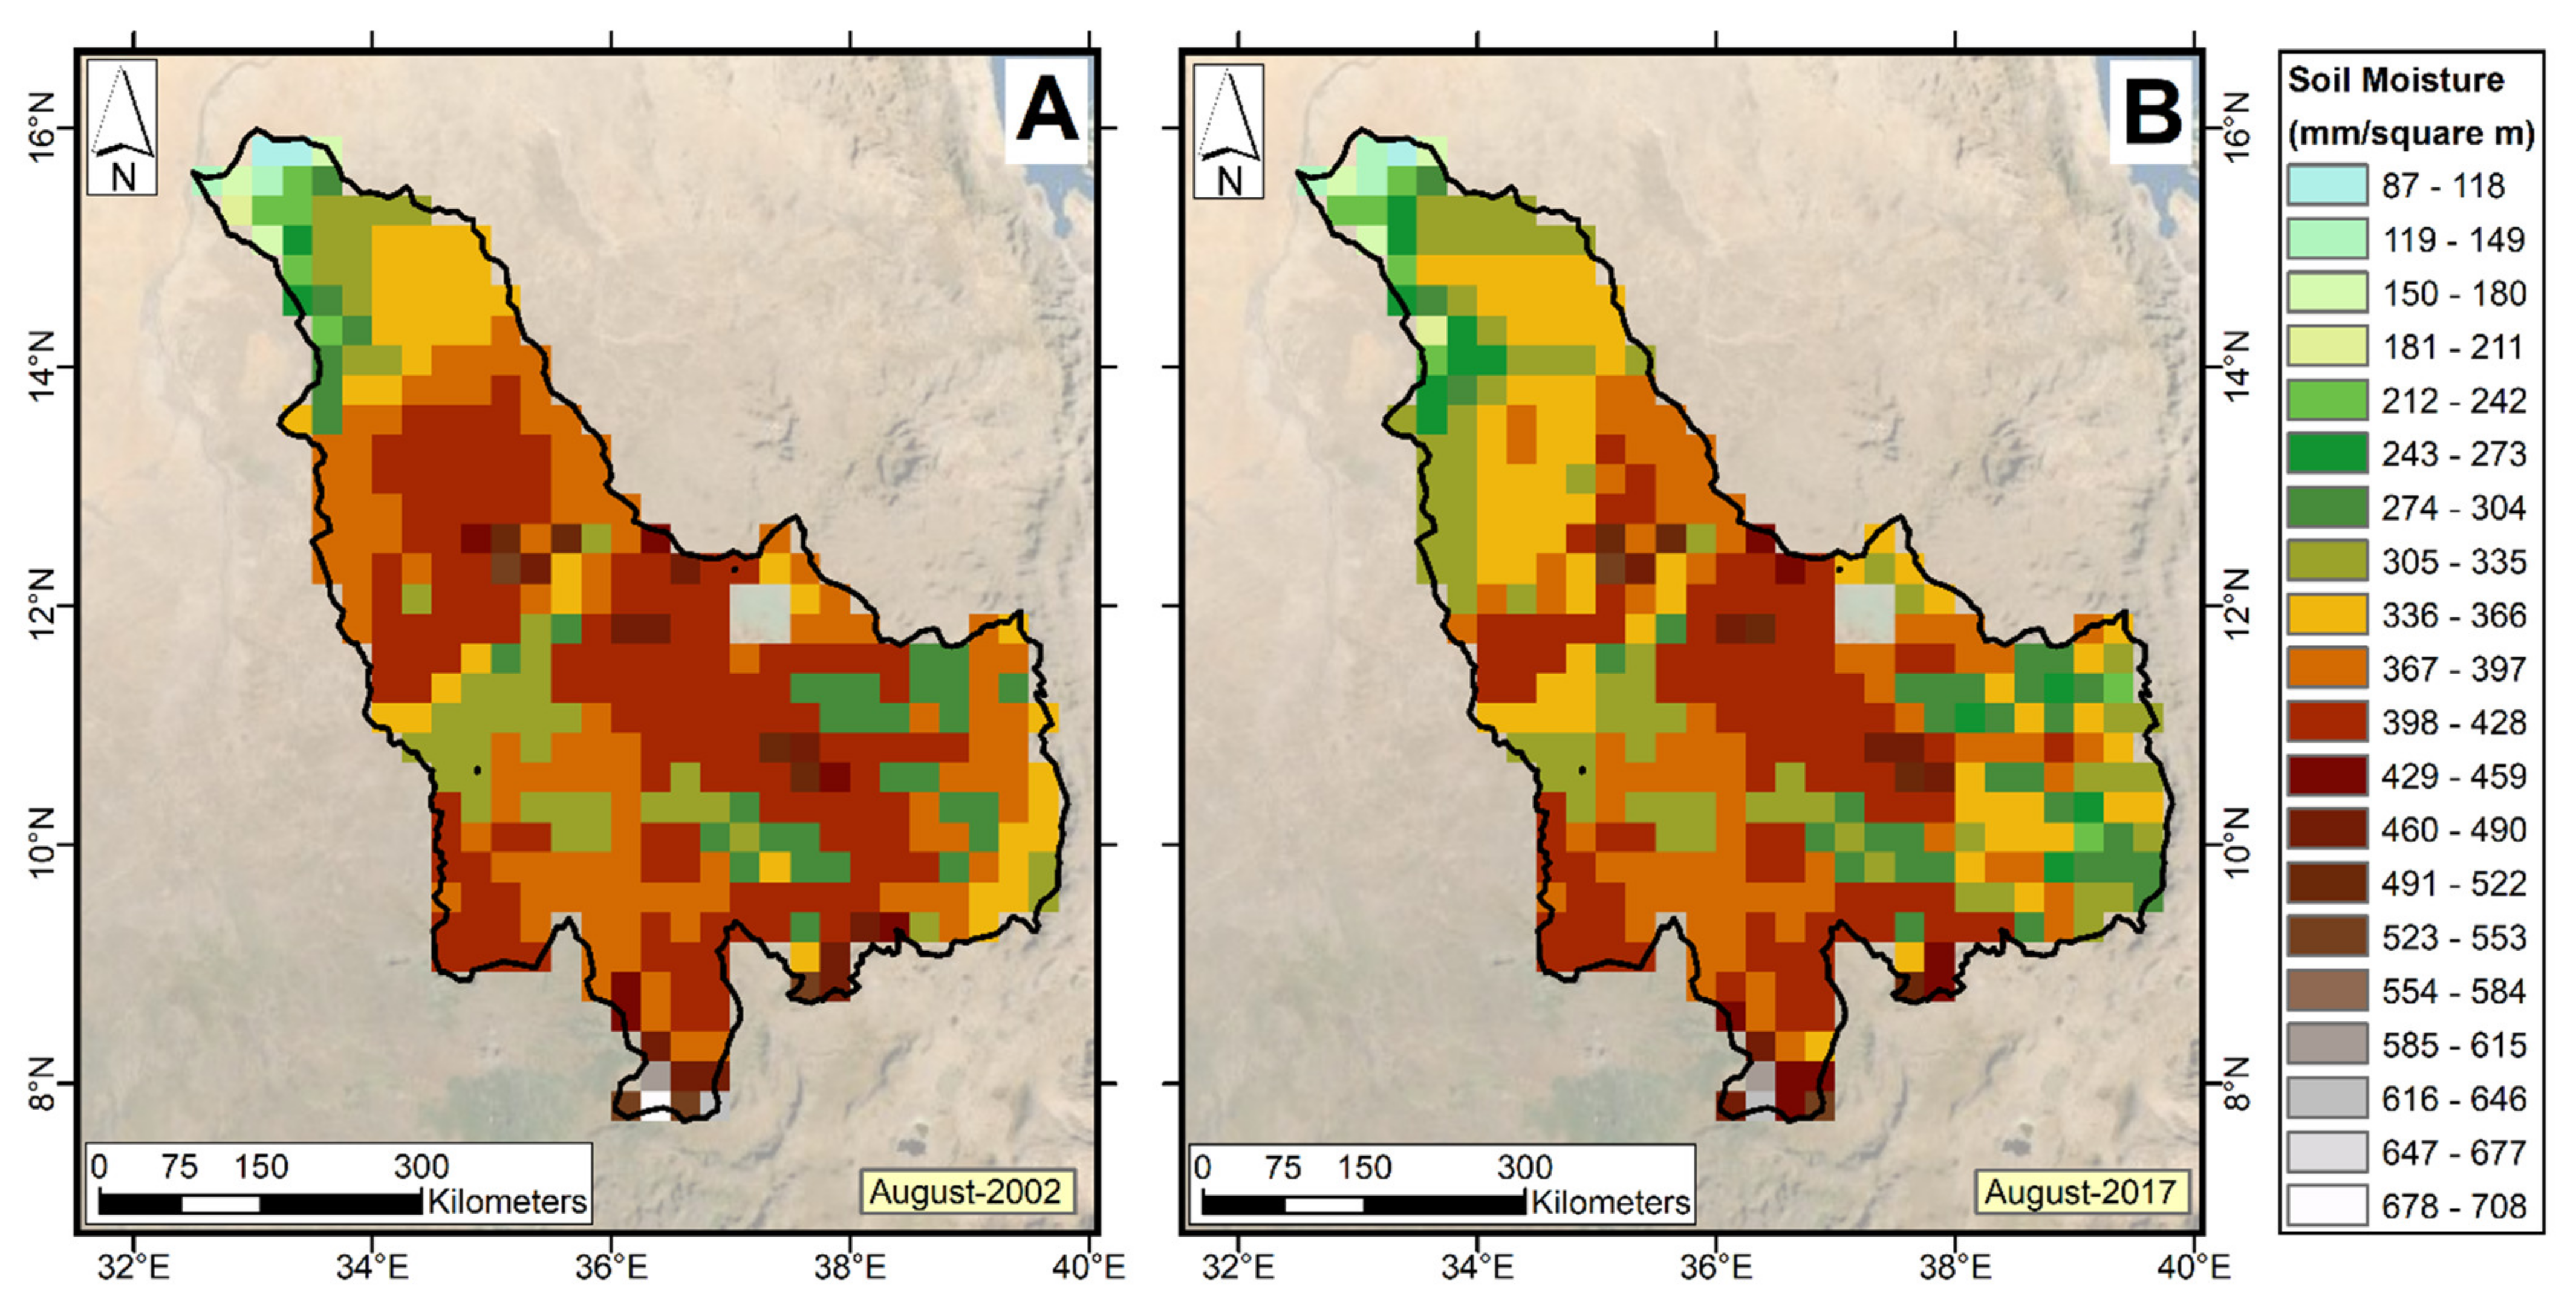
In terms of long-term measurements and large-scale monitoring, soil moisture (SM) is the least frequently observed component of the hydrologic cycle [63]. Whereas meteorological drought is linked to severe variation of precipitation, agricultural drought is linked to a reduction in soil moisture and consequently influences crops and production. Hence, SM is considered an important indication of agriculture drought. One of the first studies to use soil moisture as an indicator of the drought was Sheffield et al. [66], who used SM data of the United States to apply the beta distribution. While SM in deep soil strata presents the amount of water available for the aquifer and the stream’s baseflow, and accordingly is an indicator for hydrological drought [67], SM in the root zone (SMrz) is a controlling element of vegetation growth and hence is a reliable key for agricultural drought [2]. This is because SM in the root zone considerably impacts evapotranspiration rates in agricultural zones. The GLDAS-Noah provides SMrz that was used in this study from 2000 to July 2021 at 0.25 degrees of spatial resolution. The GLDAS-Noah SM products were broadly used [65,68,69,70] where it was proven that they could monitor drought events. Figure 4 shows a sample of SM over the Blue Nile from GLDAS-Noah.
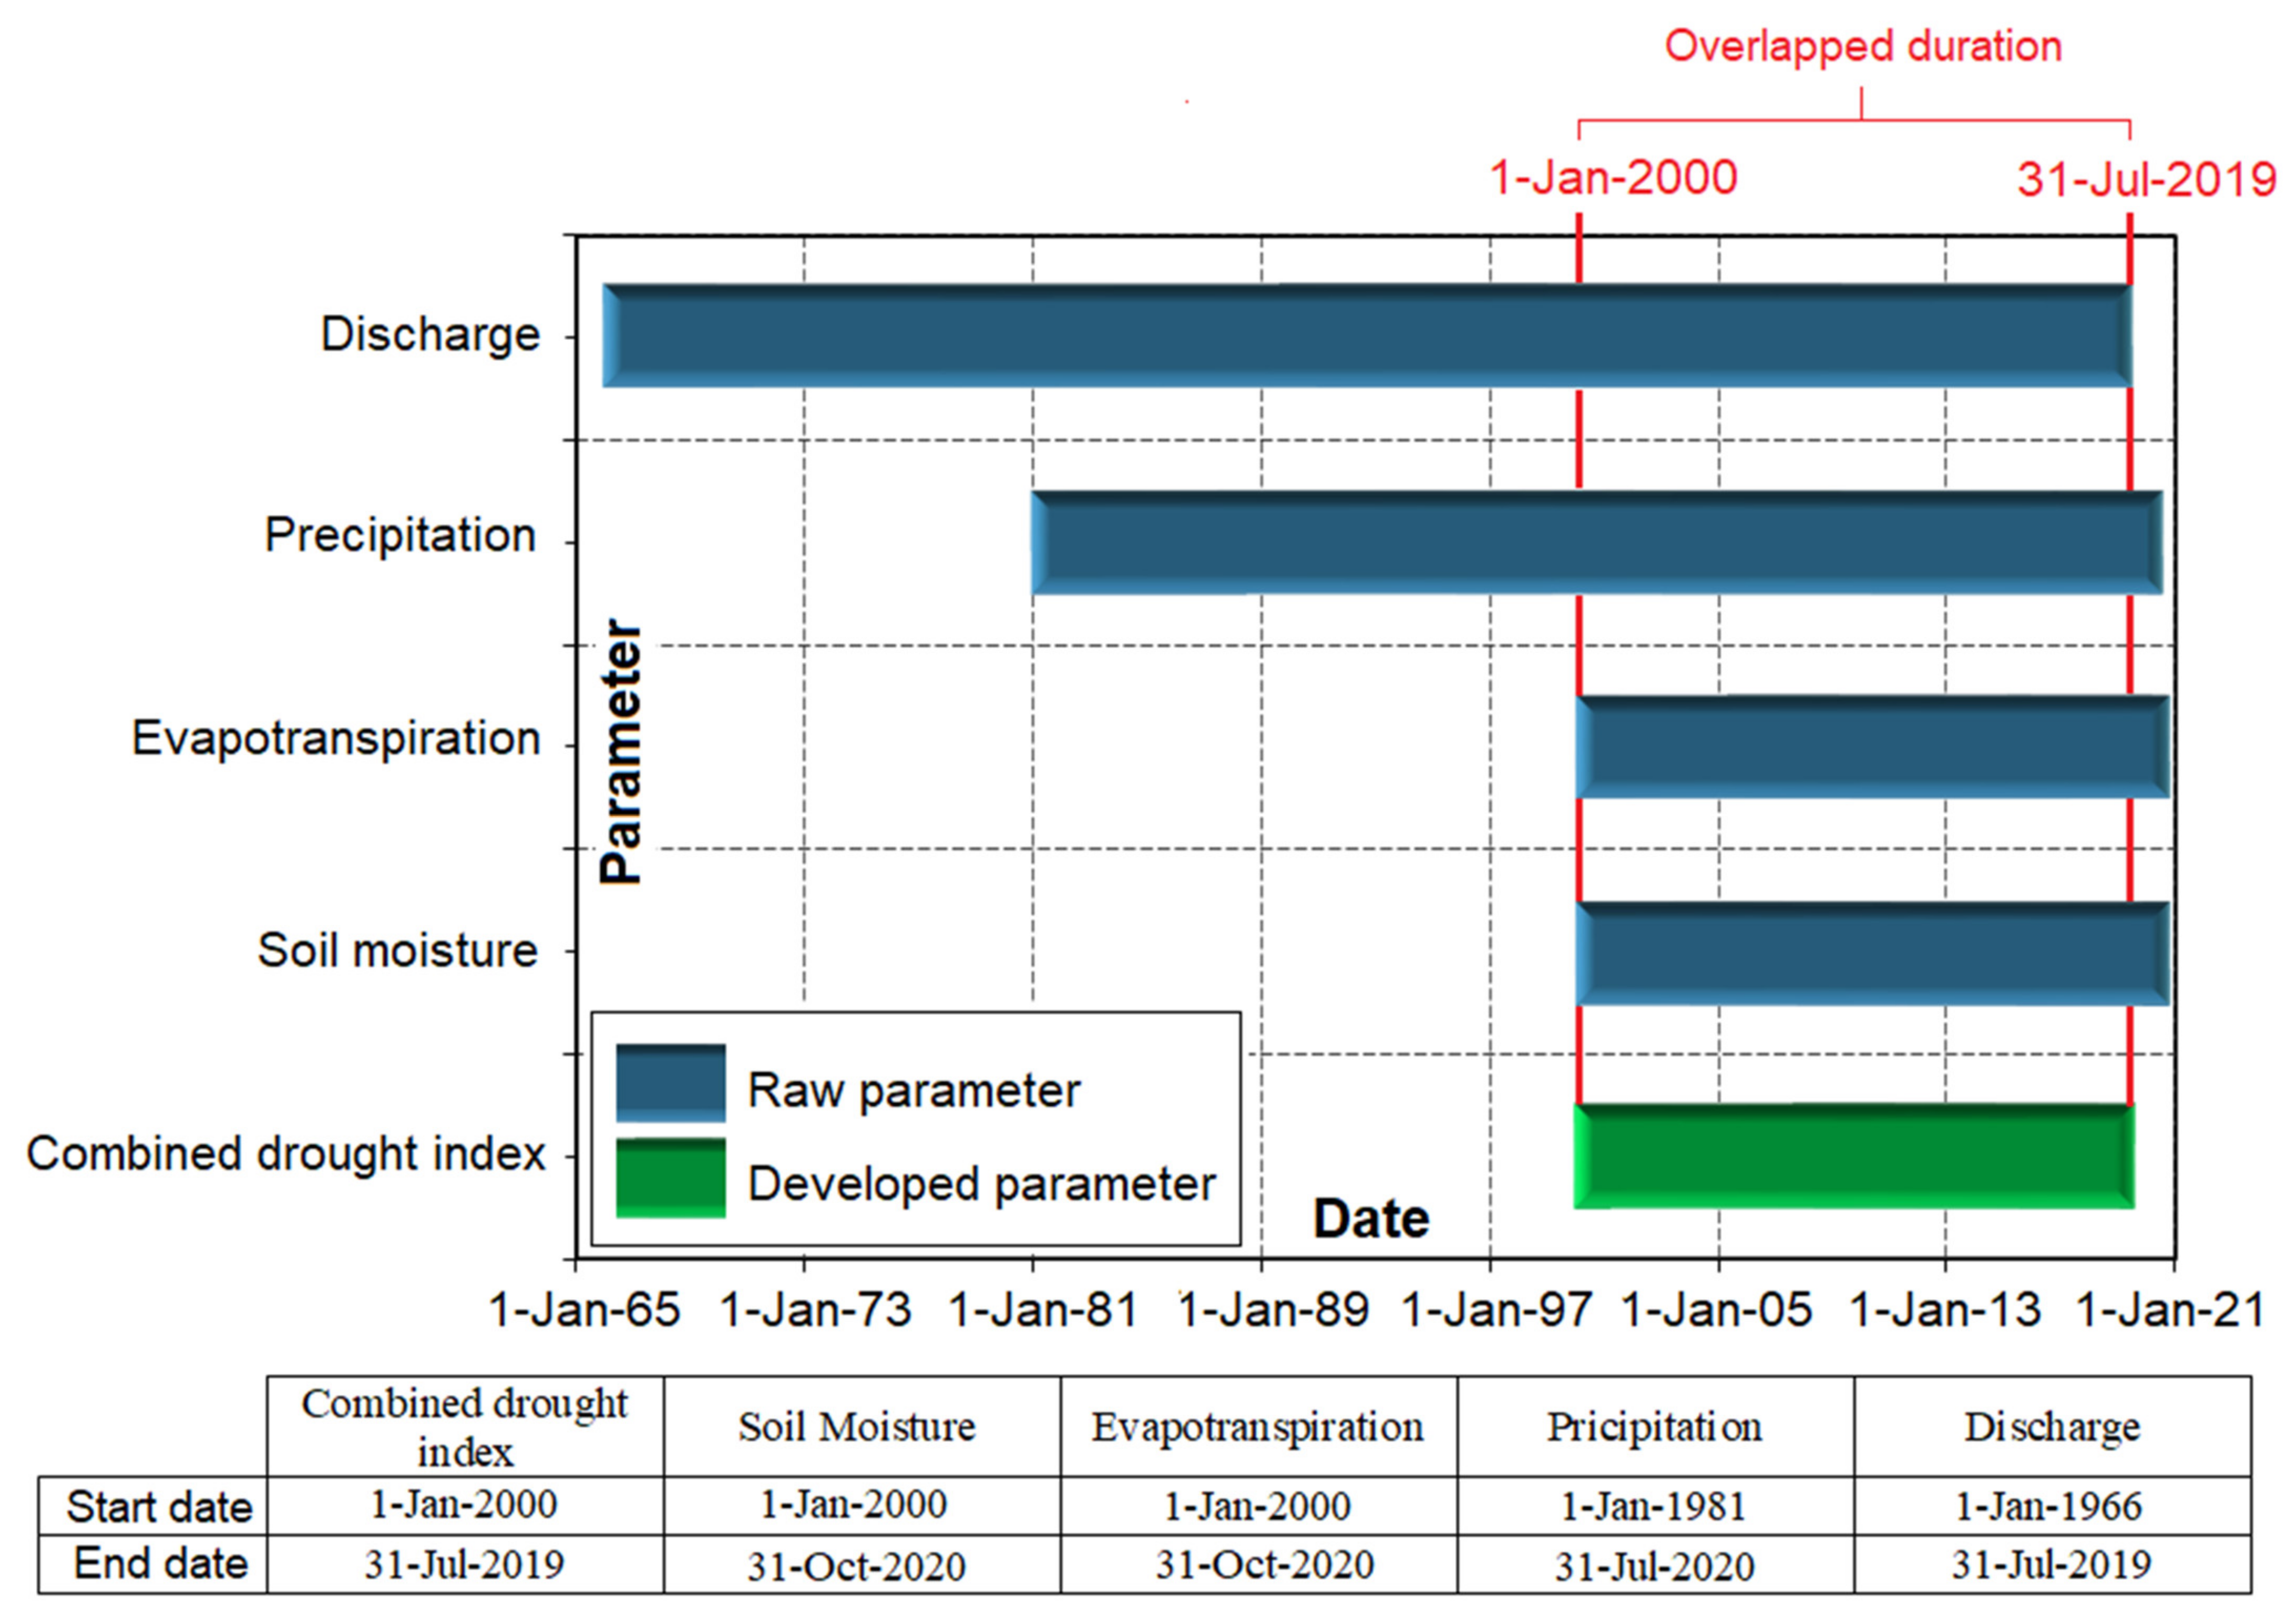
In summary, the data were acquired from different sources with different temporal lengths to employ all available observations to evaluate the historical drought over the BN and to design a combined index. Based on previous studies, these variations in record length have a limited effect on the drought category [40,71,72]. Figure 5 explains the temporal length of each parameter and the overlapped time span that was used to calculate the BN combined Index.
2.3. Methodology
2.3.1. Standardized Indices
An essential step for calculating any index is choosing the appropriate method for standardization based on the monthly time series. This strategy permits comparison between different kinds of parameters. To assure index comparability, we used the same calculation approach for each index, as recommended by the literature.
- Standard Precipitation Index (SPI)
Based on monthly precipitation data, McKee et al. [73] created the SPI, which fits gamma distribution then transforms the gamma distribution’s cumulative probability to a normal distribution. In theory, the SPI reflects how many standard deviations a precipitation event is from the mean value for a certain time. The SPI values vary from −2 to +2, with negative and positive values representing times of drought and wetness, respectively. They also established the criteria for a drought incident for any timescale. The SPI may be computed from one month to 72 months. Statistically, the optimum feasible range of applicability is 1–24 months [74]. We used the long-term monthly precipitation data from 1981 to 2019 from CHIRPS to calculate the SPI to investigate the meteorological drought over the BN and develop the composite drought index (CDI).
- Standardized Runoff Index (SRI)
The Standardized Runoff Index (SRI) was developed by Shukla and Wood [75], and it is used to characterize the hydrological drought. It is an index built on the same principle as the SPI by fitting a gamma distribution to data and then converting the cumulative probability function to a normal distribution. The only variable considered is the discharge, where it is essential to identify continuous time series of monthly discharge records.
- Standardized Soil Moisture Drought Index (SSI)
The Standardized Soil Moisture Drought Index (SSI) was developed by Hao and AghaKouchak [76]. It follows the concept of Z-scores and was successfully applied by studies such as [77,78].
- Standardized Evapotranspiration Drought Index (sETI)
We introduce and examine the Standardized Evapotranspiration Drought Index (sETI). We applied a straightforward and reproducible method that meets the research standards for distinguishing the patterns of drought propagations. Subsequently, the data used are manipulated less as no models are used. The concept of Z-scores is the foundation of the sETI. The index uses the standardized method to describe how much the evapotranspiration varies from the historical average of evapotranspiration, and hence the droughts are identified as statistical outliers in the time series. The sETI is described in Equation (1)
where: is the monthly evapotranspiration data from GLDAS-Noah; is the long-term average of evapotranspiration data; and is the long-term standard deviation of evapotranspiration data.
2.3.2. Developing the Composite Drought Index (CDI)
This study used a combination of the four aforementioned drought indices at a monthly timescale from 2000 to 2017. These indices represent the meteorological drought (SPI), the agricultural drought (sETI, and SSI), and the hydrological drought (SRI).
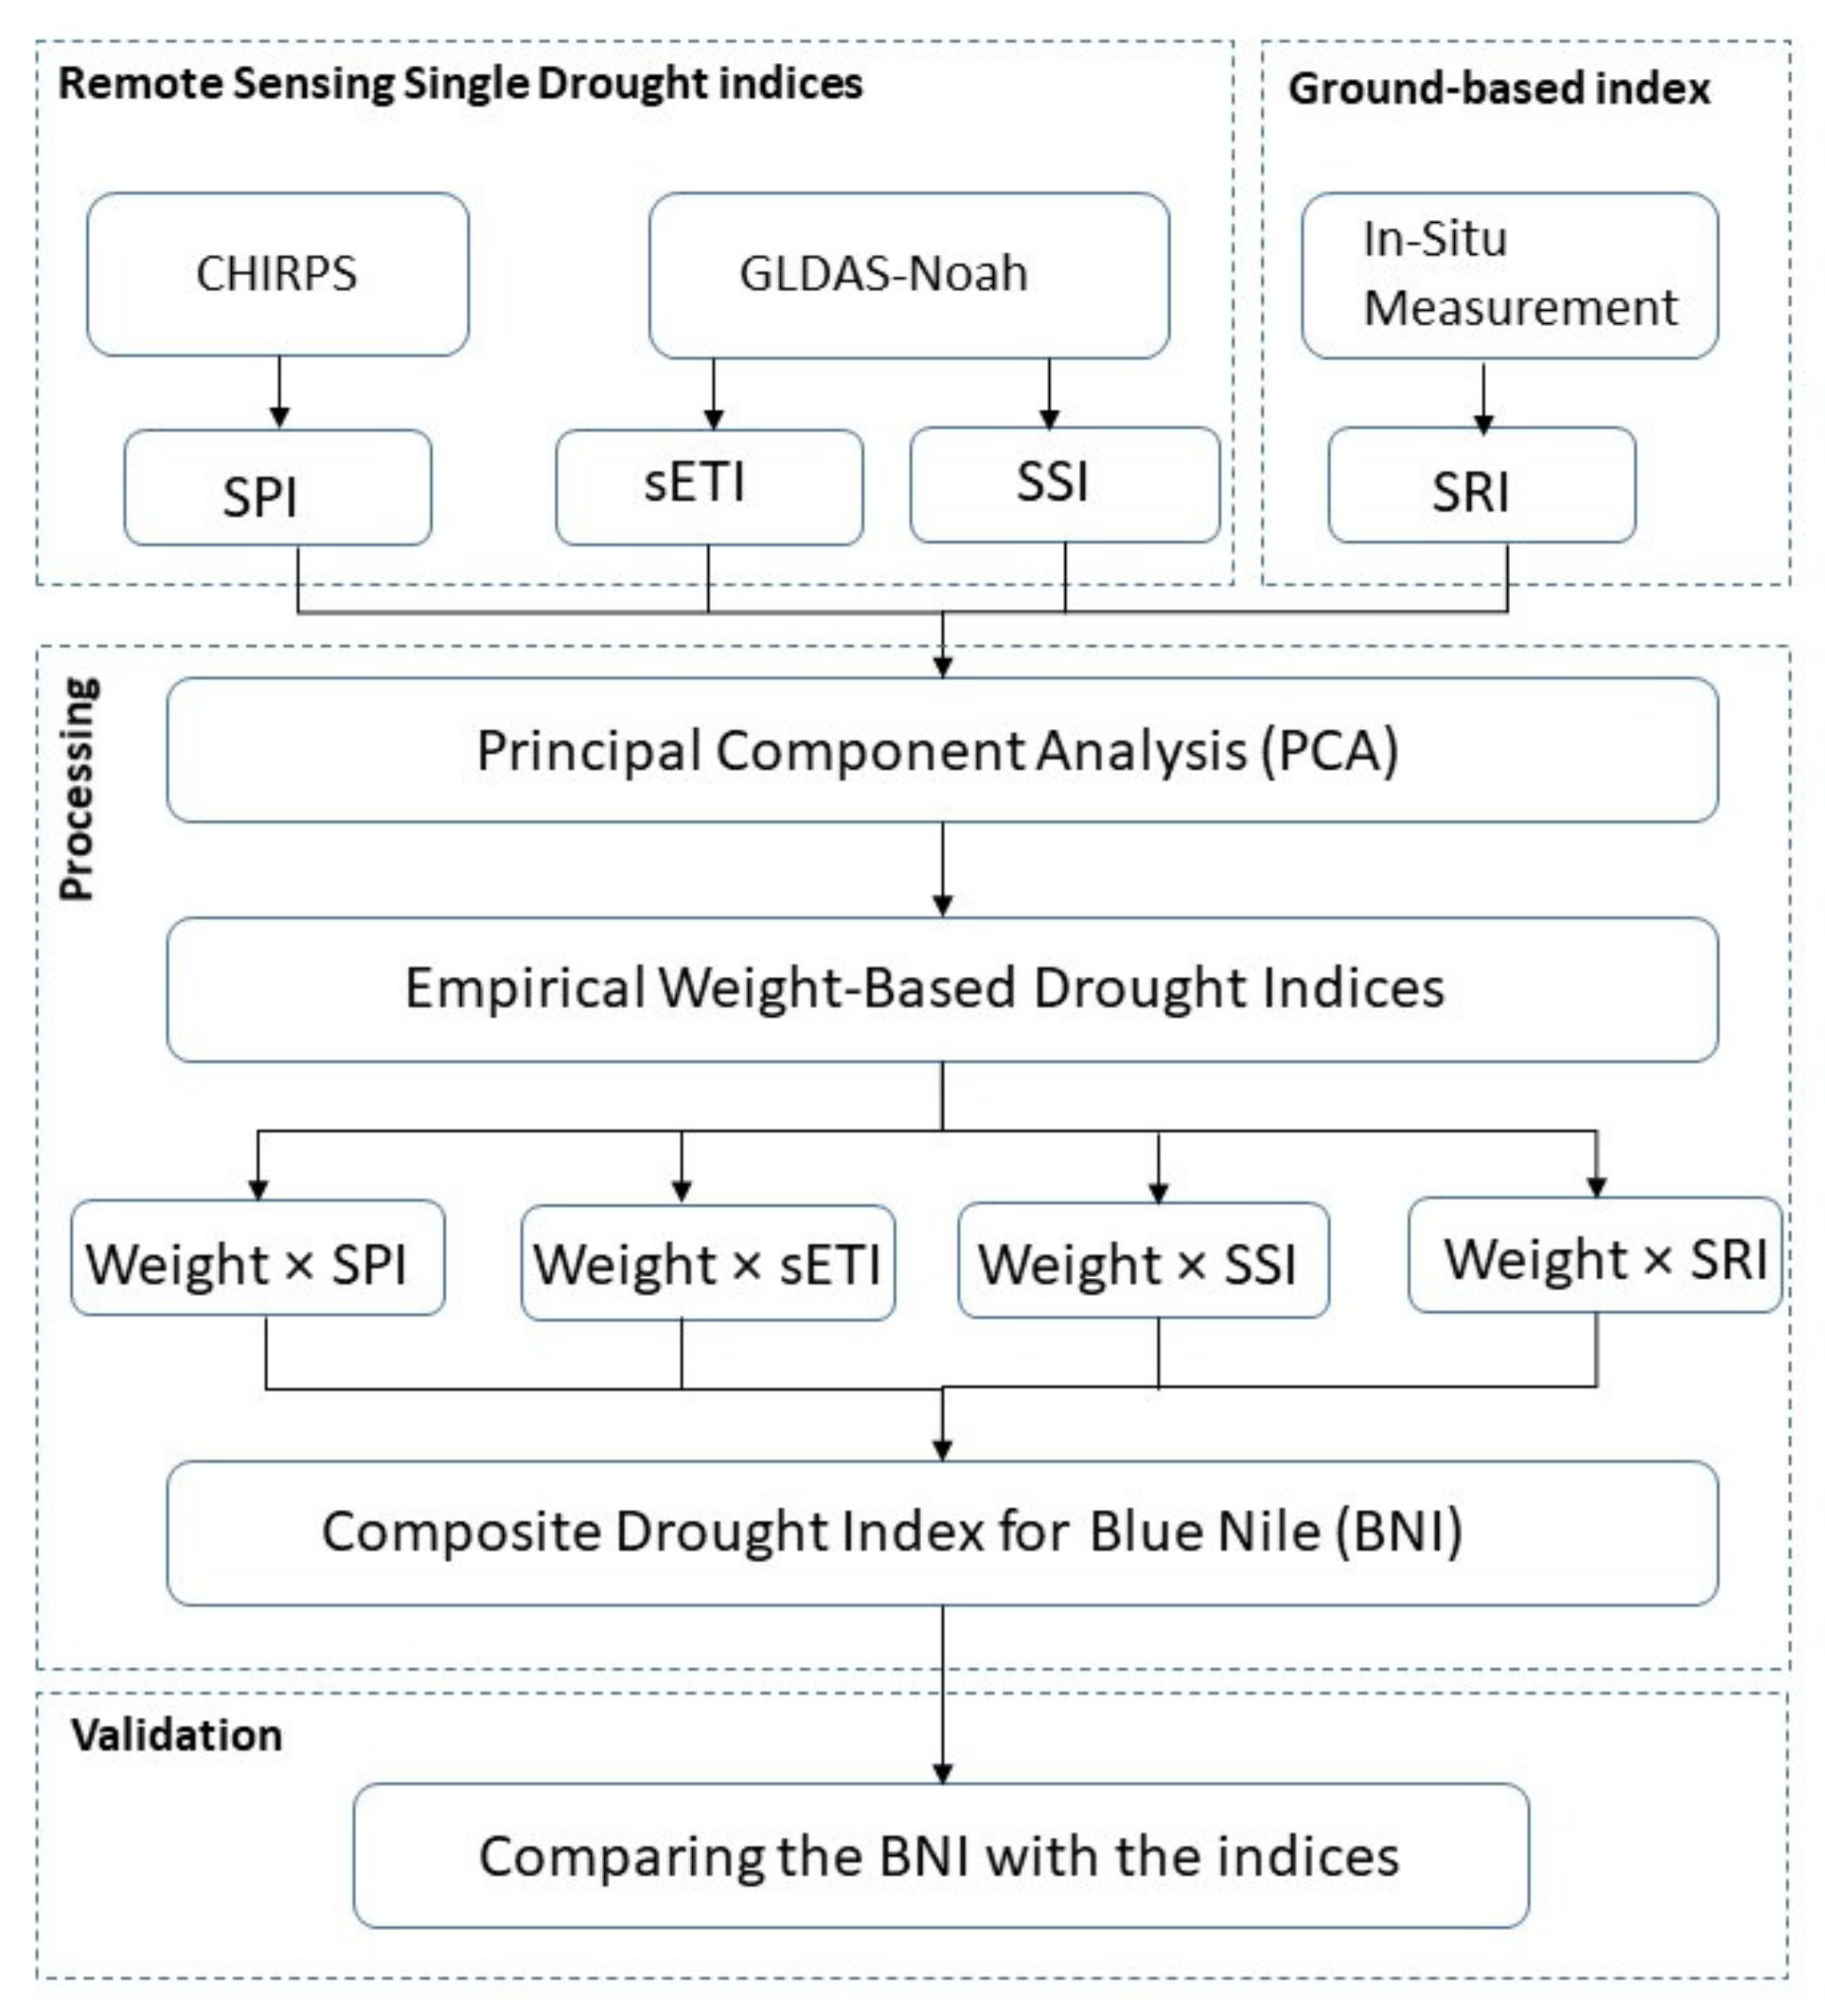
The principal component analysis (PCA) is one of the multivariate approaches that aims to reduce the dimensionality of many parameters or large datasets by reconstructing a large number of parameters into a smaller collection while retaining the majority of the information from the original data [79]. PCA also demonstrates how different parameters vary in respect to one another and how they are related. This is accomplished by employing a covariance matrix or its standardized formula—the correlation matrix—to convert correlated data into a new set of uncorrelated variables. The next step is to identify the principal components by computing the eigenvectors and eigenvalues of the covariance matrix. After calculating the eigenvalues, they should be ranked based on magnitude. According to the desired reduced parameters, the highest rank of eigenvalues will be kept. After that, the basis vectors will be formed using the eigenvalues. The greater the magnitude of the eigenvalue, the greater the variance its equivalent basis vector will have, and that will be assigned to the first axis of the principal component (PC1). This approach will conserve as much of the initial data as possible. After that, the empirical weight approach was applied by using weight combinations that identify weight as a percentage less than 100% for each index, which offered maximum possible correlation confidence between the time series of the CDI and the time series of each investigated drought index.
Next, we multiply the standardized original data by the factor score coefficients to find a new data series as in Equation (2). Figure 6 describes the methodology of our research.
where: BNI is the Blue Nile composite drought index; WSPI, WSRI, WSSI, and WsETI are the weights assigned for SPI, SRI, SSI, and sETI, respectively.
BNI = WSPI × SPI + WSRI × SRI + WSSI × SSI + WsETI × sETI
3. Results and Discussion
3.1. Meteorological Drought (SPI)
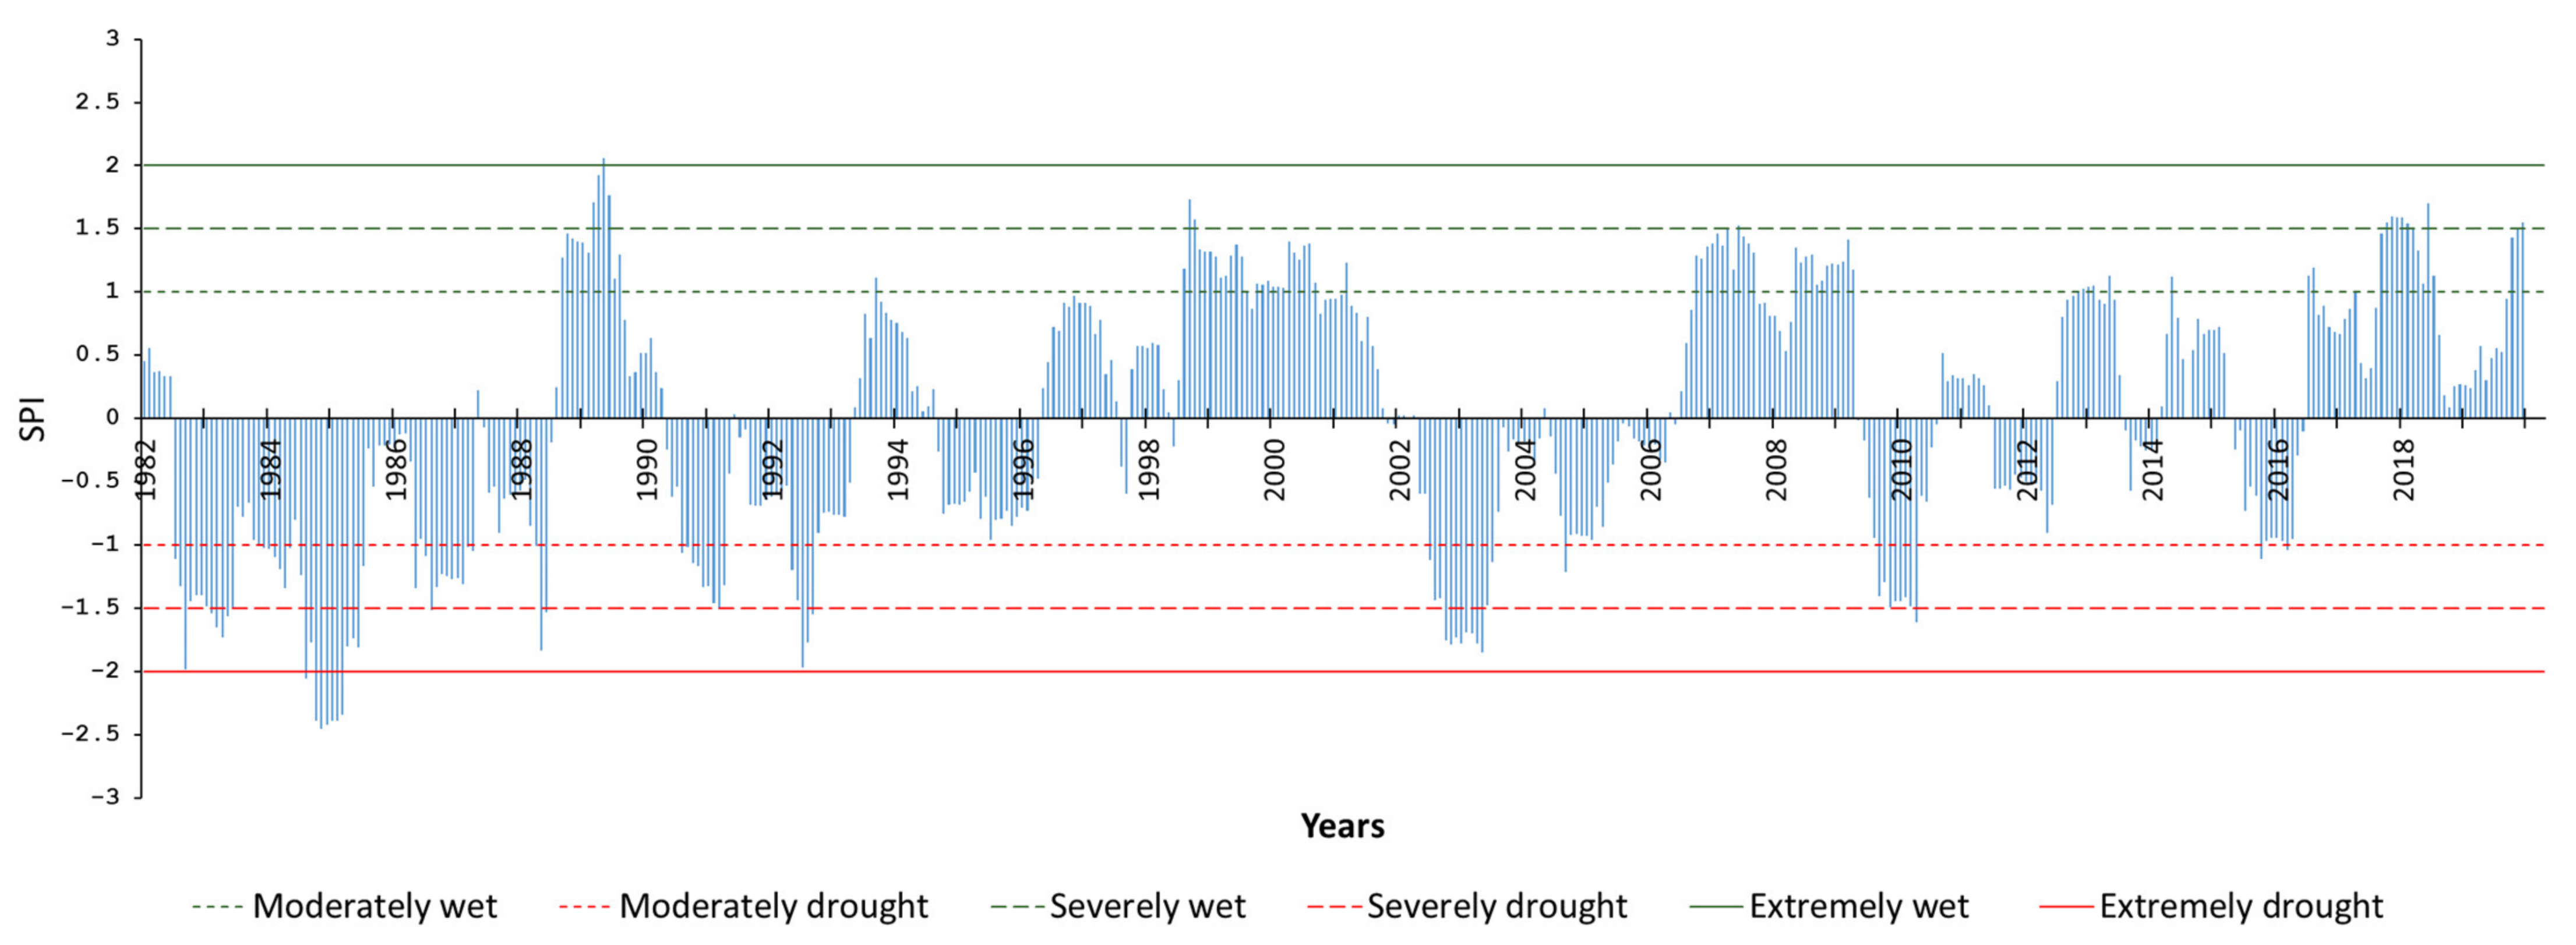
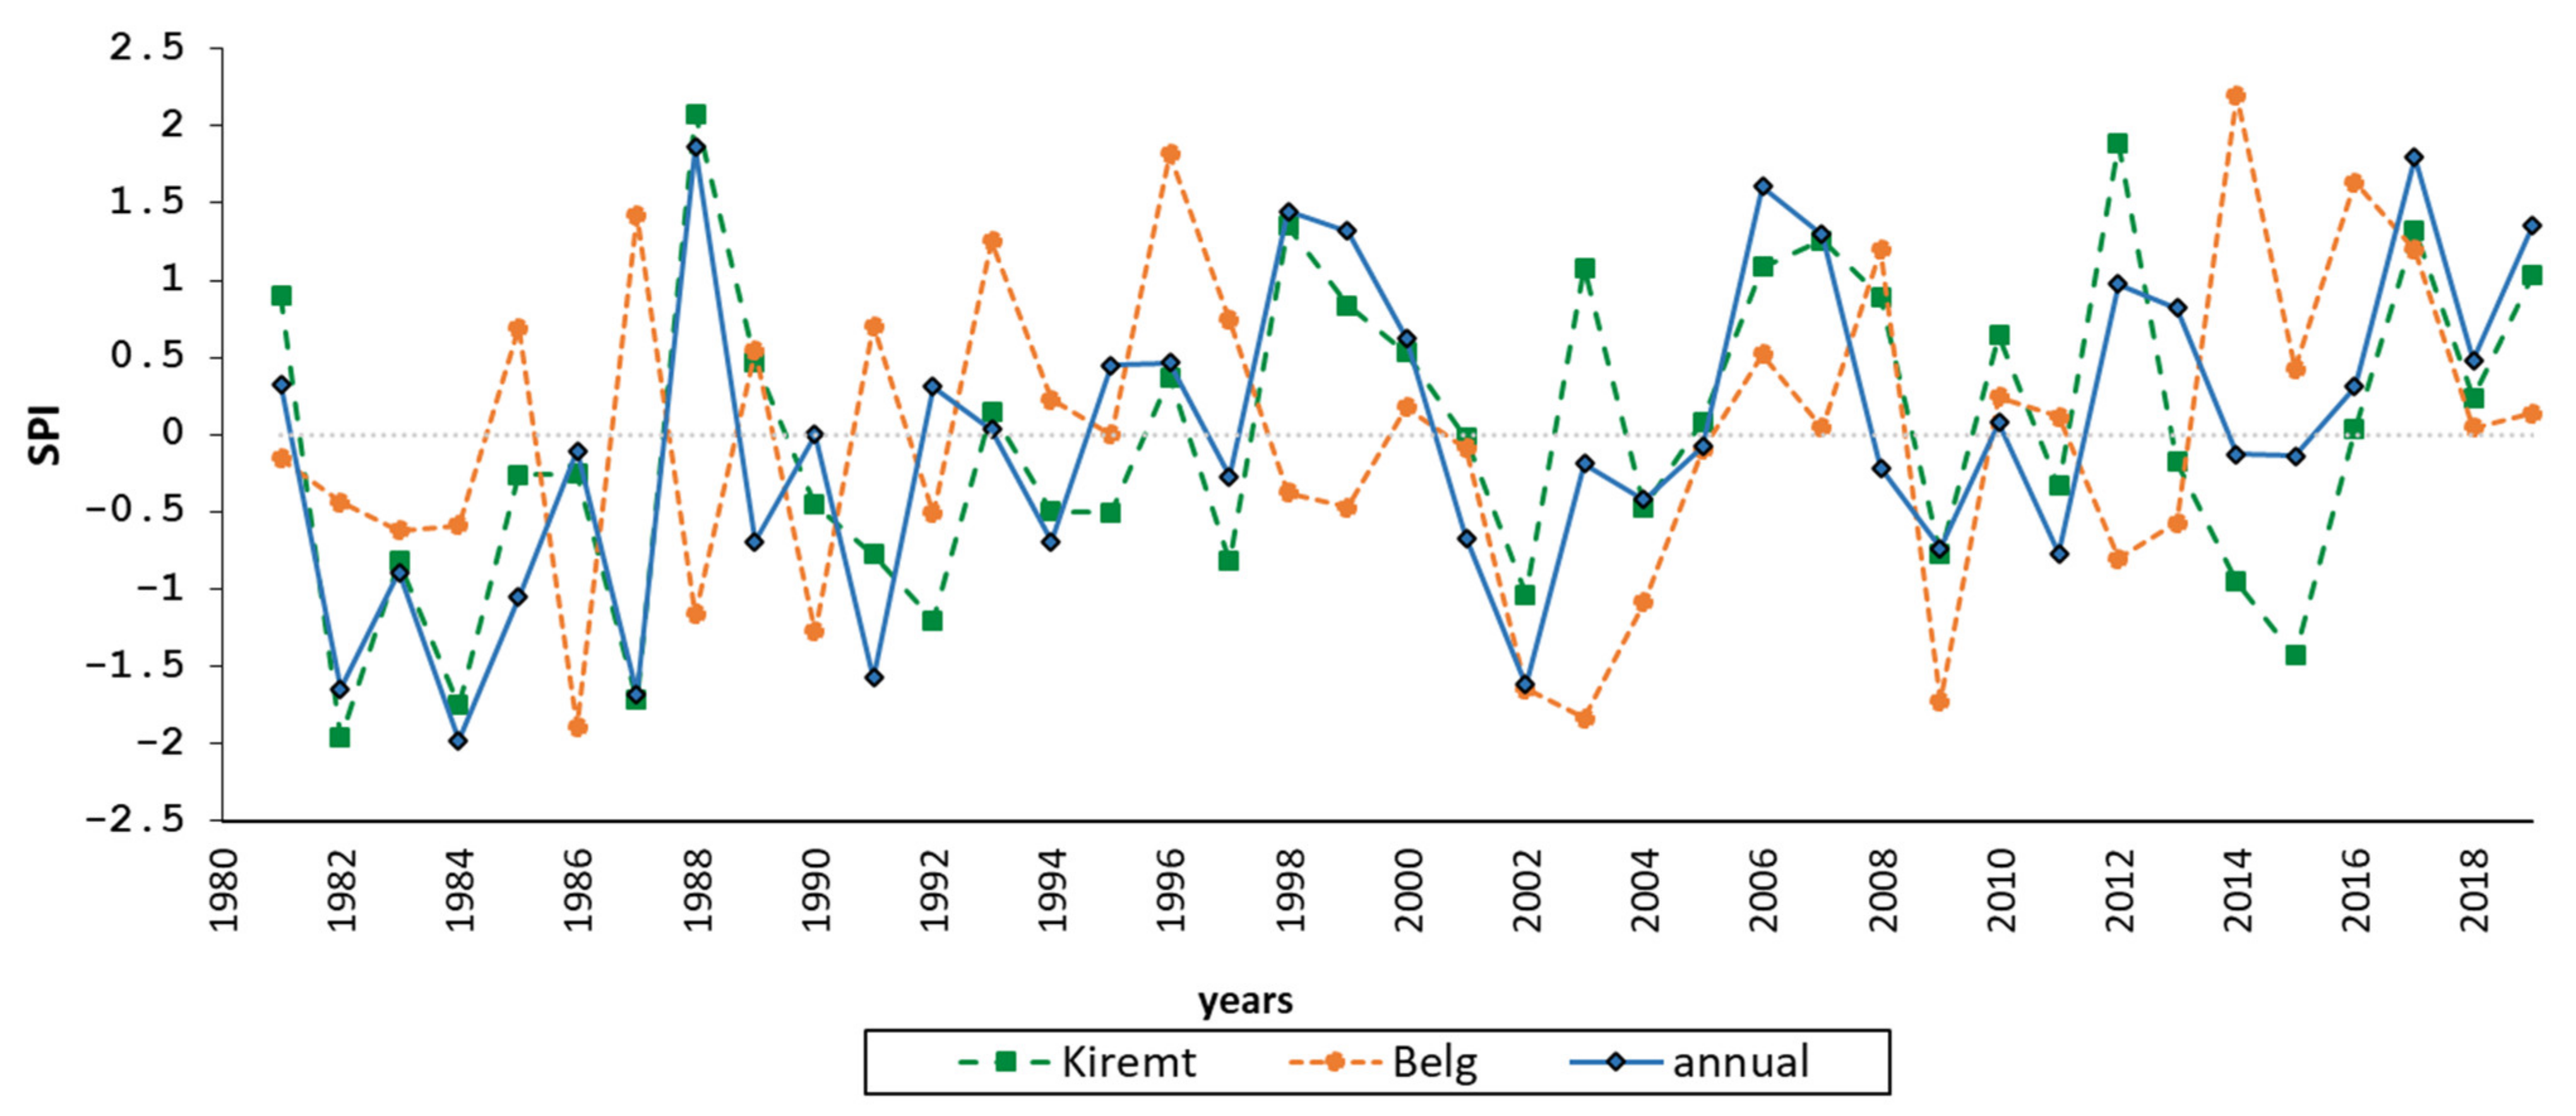
The SPI was calculated based on the BN’s mean areal precipitation (MAP) in various timescales (1, 3, 6, 9 and 12 months). The analysis was performed for the period from 1981 to July 2020. The SPI in timescales from one to nine months showed frequent leaps, and the index reacted promptly to the rainy or dry months. From these timescales, it is challenging to determine if we had a drought year or not. The constancy of wet and drought months started to be shown evidently in the 12-month SPI, where we can identify the years of droughts and how long they lasted. Figure 7 shows the SPI-12 captured the documented historical drought events in the 1980s, 1990s, and 2000s. According to the SPI category, it can be shown that the basin was subjected to severe prolonged drought episodes over the last 40 years. These drought episodes were observed by several previous studies, such as [80,82,83]. The analysis continued to include the seasonal and annual scales. There are two rainy seasons over the BN. The kiremit season is the main rainy season and lasts from July to September. The belg season is the shorter rainy season and lasts from February to April. The analysis showed that droughts could occur in either or both of the two seasons. However, the two seasons agree in cases of extreme drought or high floods. Comparing the seasonal analysis with the annual revealed that the kiremit is the dominant season and an indicator for the occurrence of drought on annual scales, as seen in Figure 8.
3.2. Agricultural Drought (sETI & SSI)
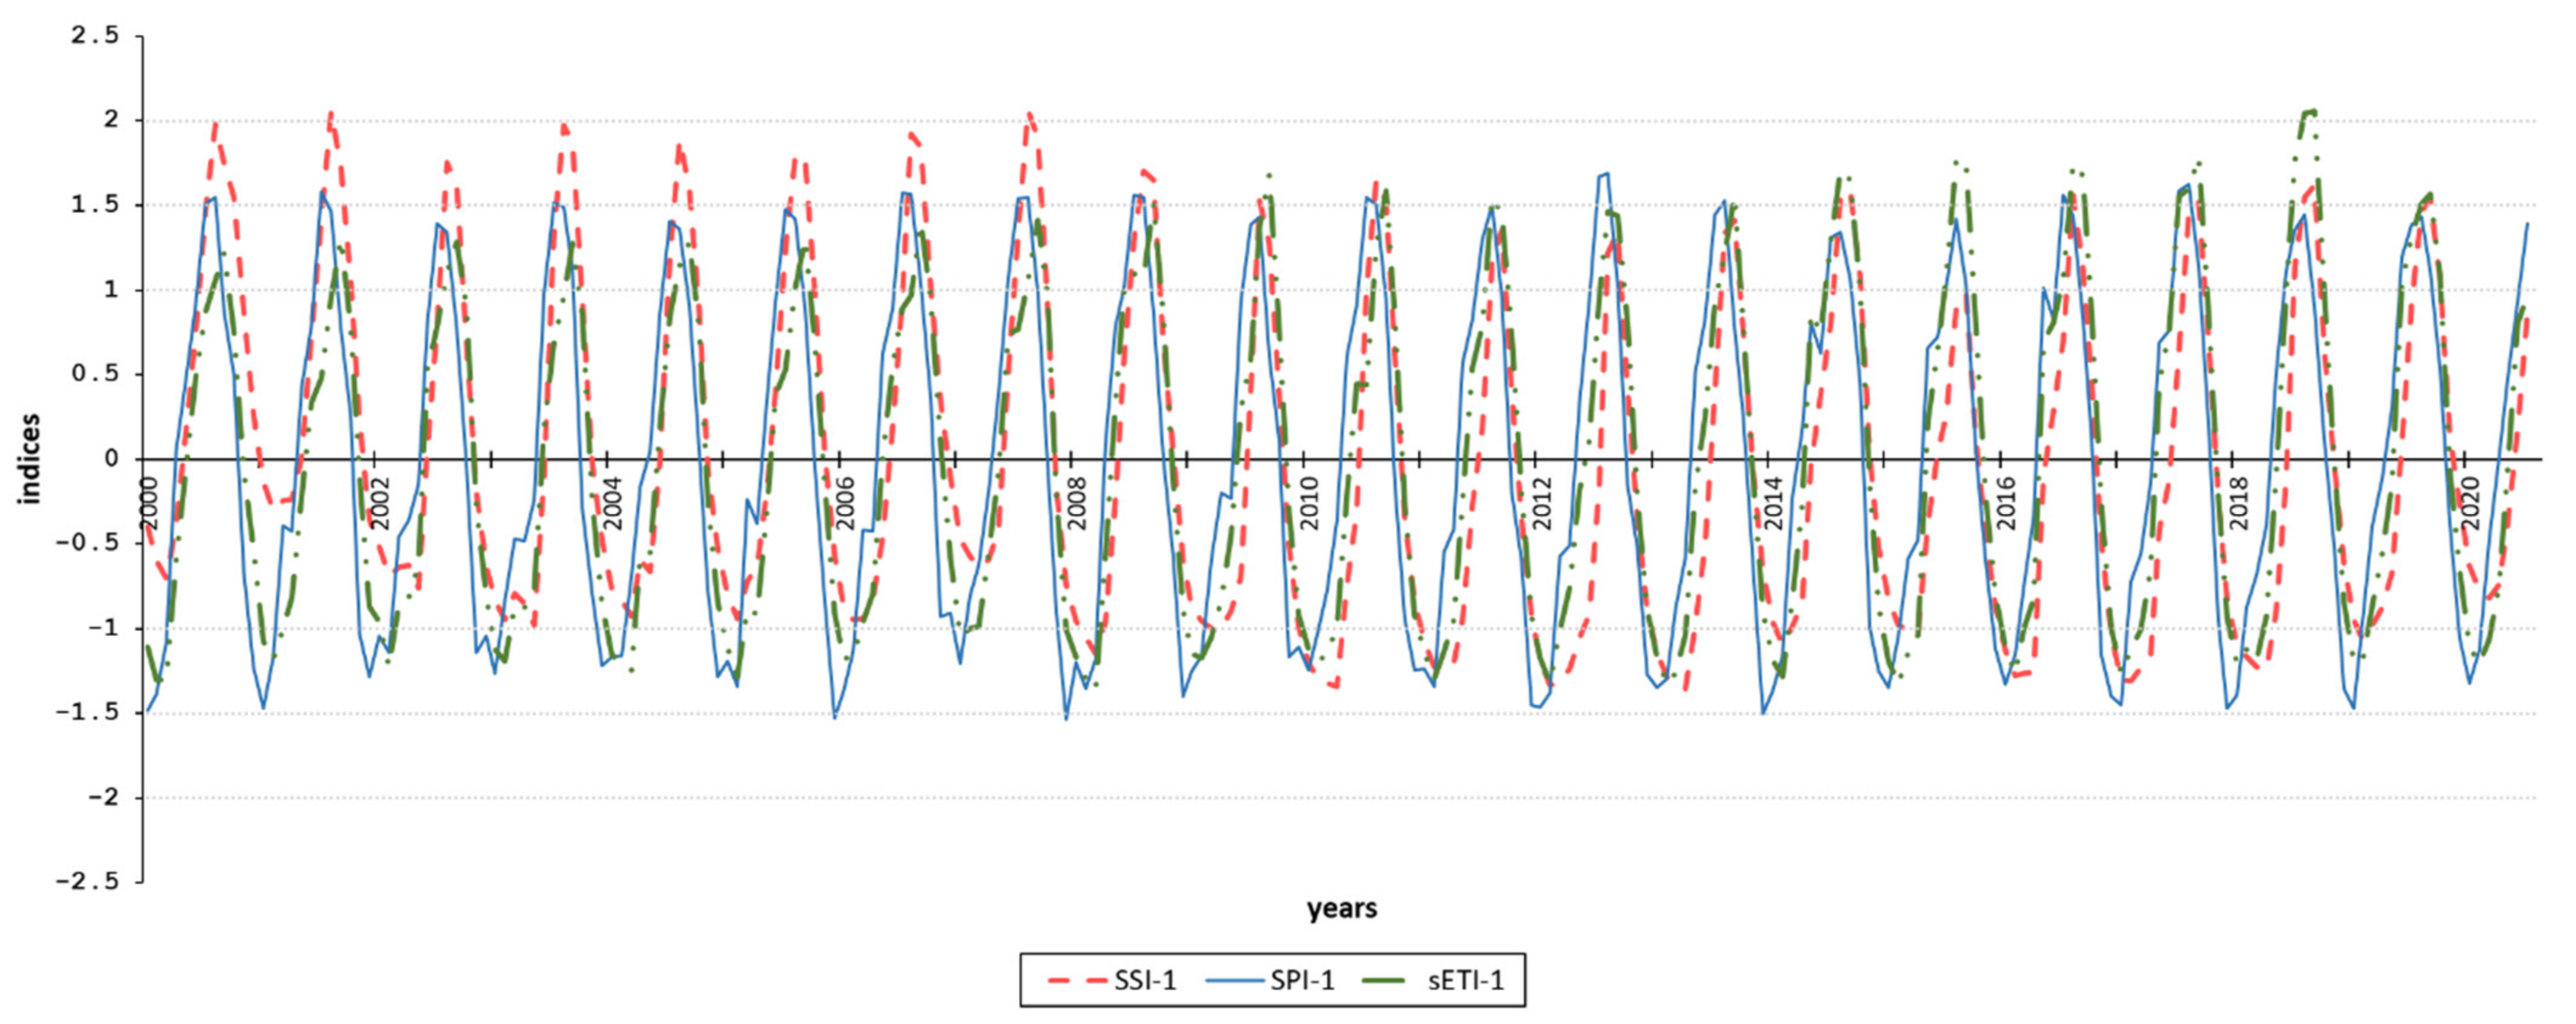
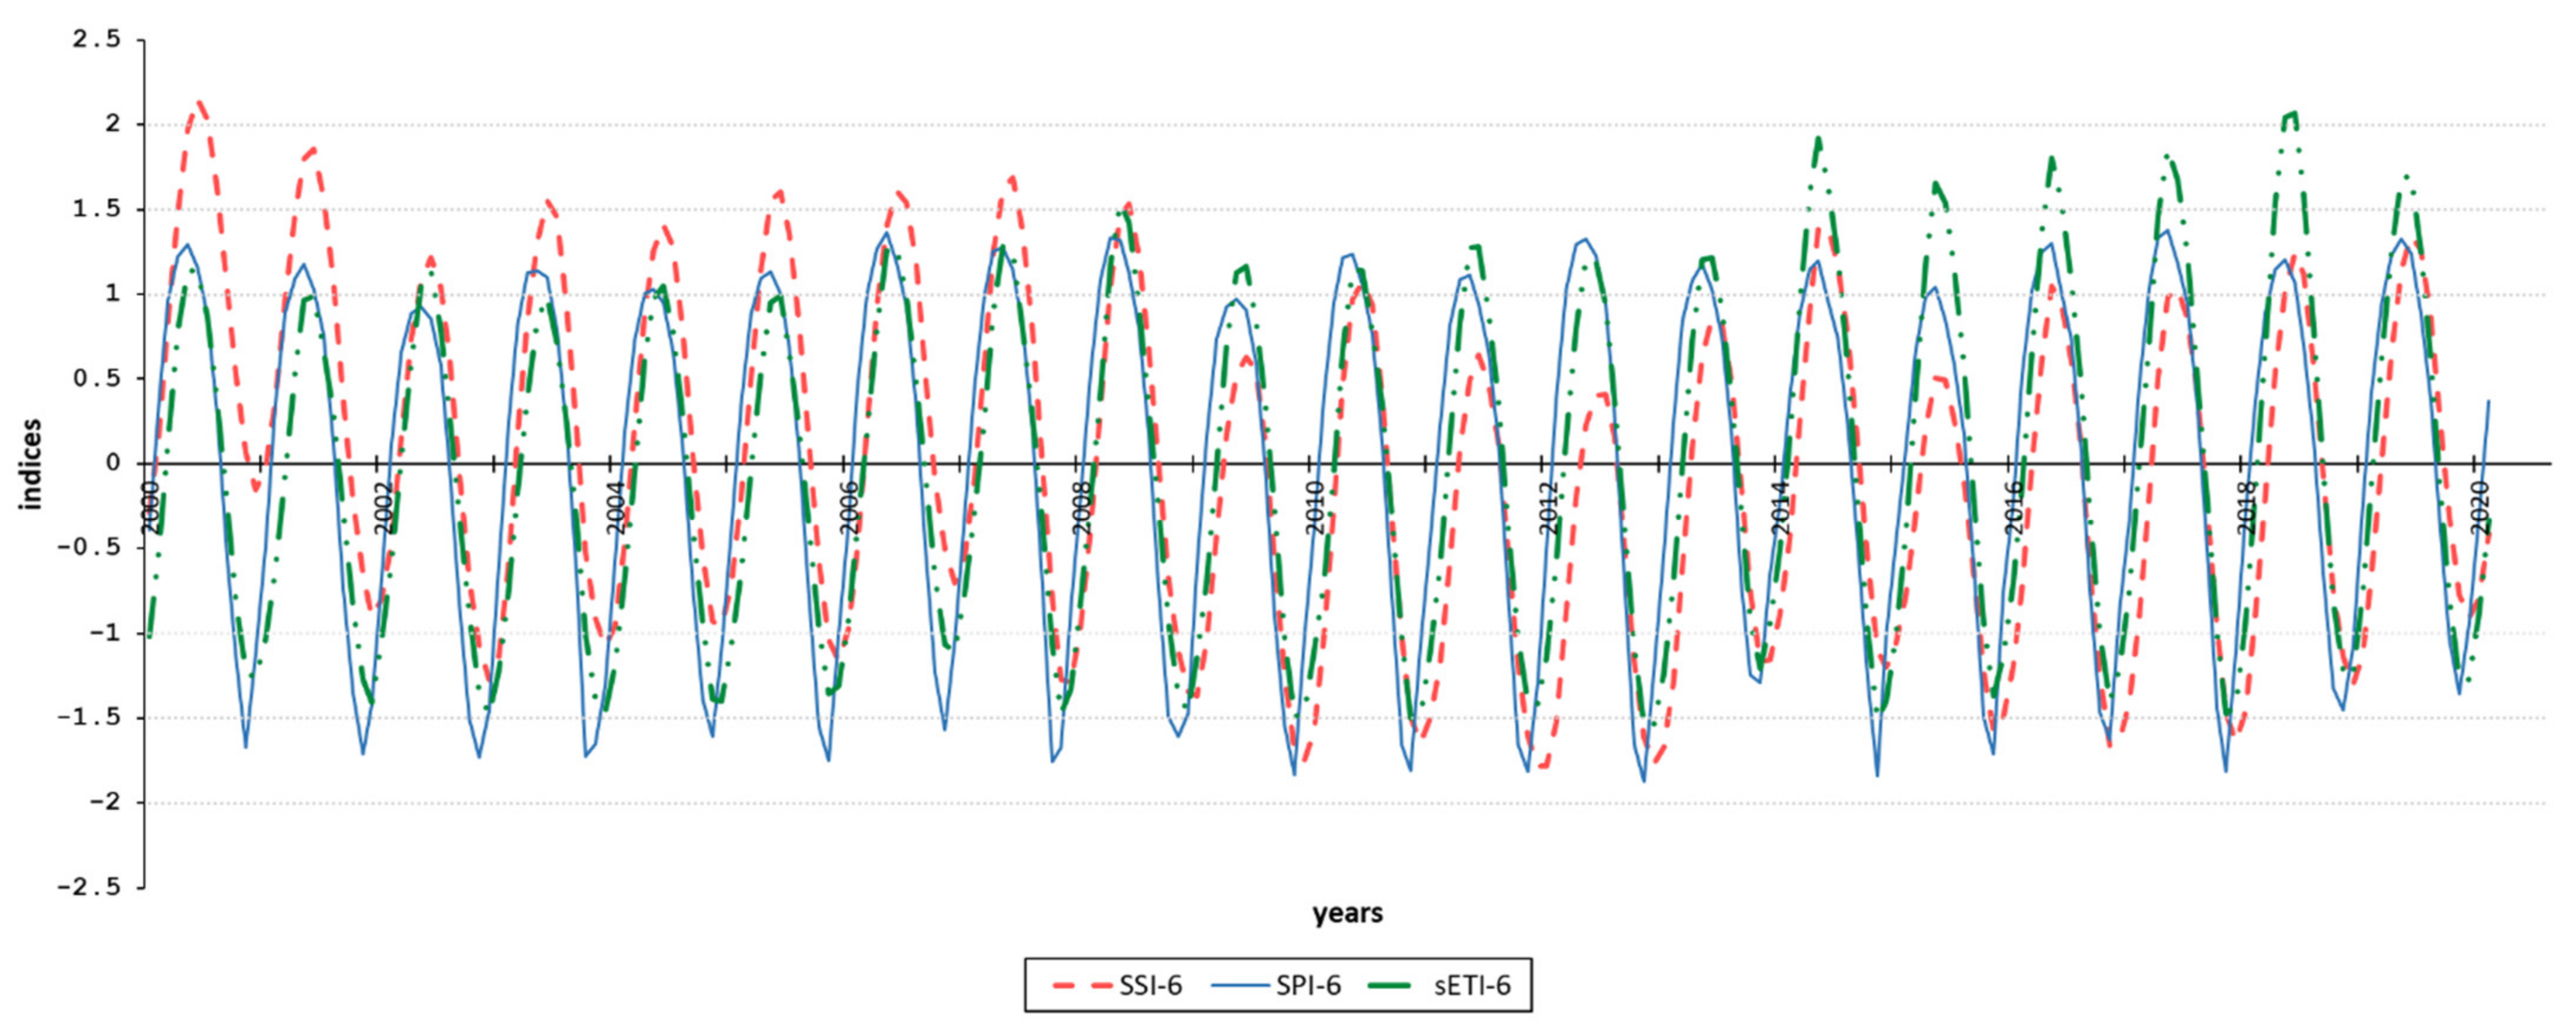
The sETI and SSI were calculated from GLDAS-Noah v2 from 2000 to 2021 for the BN based on the mean area. Figure 9 shows the plotting of the SPI with the sETI and SSI for the monthly time step. The high fluctuations in the three indices within the short period were visible. It is shown that the meteorological drought fell before the agriculture drought with a lag time of about a month. The six-month time step is shown in Figure 10, where the SPI had more frequent severe drought than the sETI and SSI during 2000/2001. Although it was a drought period, it was not for the SSI. With further investigation, we found that the irrigation water was much more than the precipitation amount [84], which affected the soil moisture values. The BN has the Gezira scheme, one of the world’s largest irrigation schemes. Therefore, it significantly influences the overall mean of the soil moisture and evapotranspiration over the basin. The reason behind the difficulty of comparing the SPI with the sETI and SSI further than six months into the future is that there are more human-induced factors that affected the latter indices. These factors are those such as irrigation and crop rotations with different evapotranspiration results. Further investigation about the effect of the irrigation schemes and the crop patterns is highly needed.
3.3. Hydrological Drought (SRI)
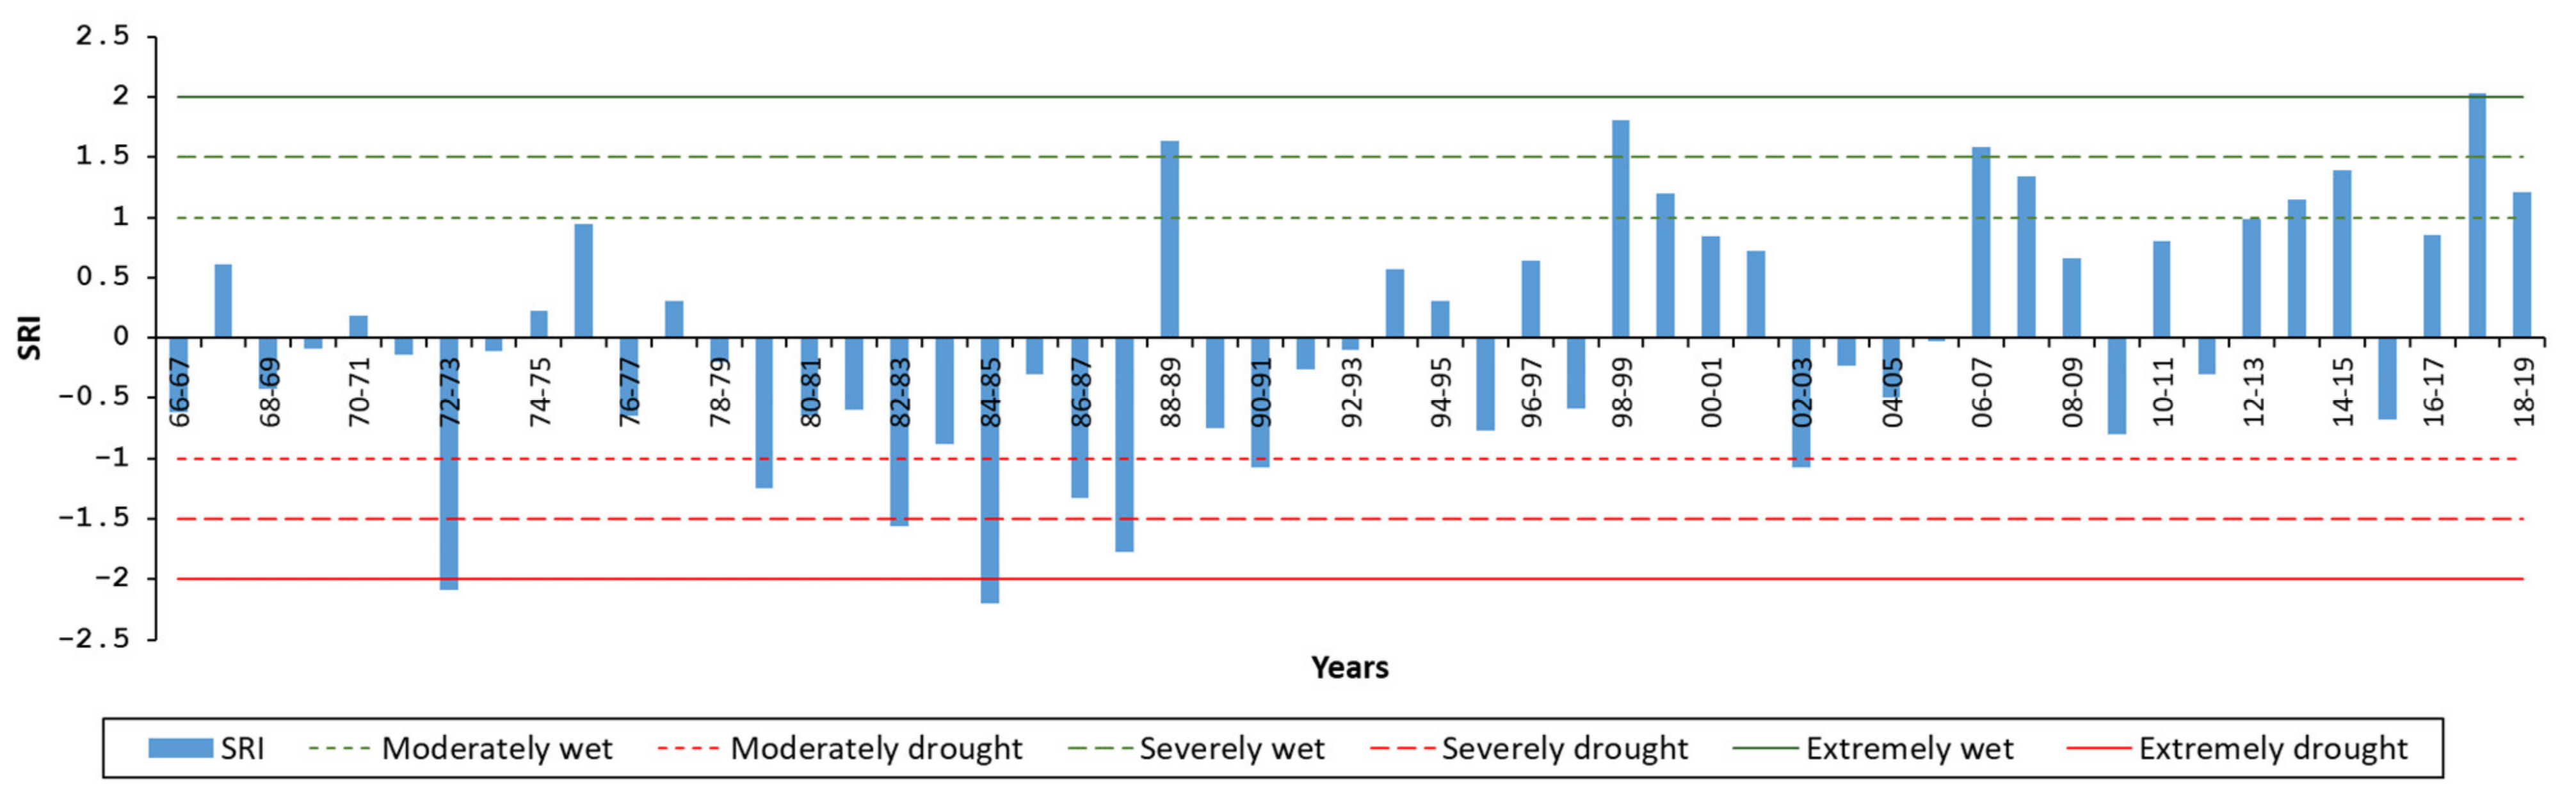
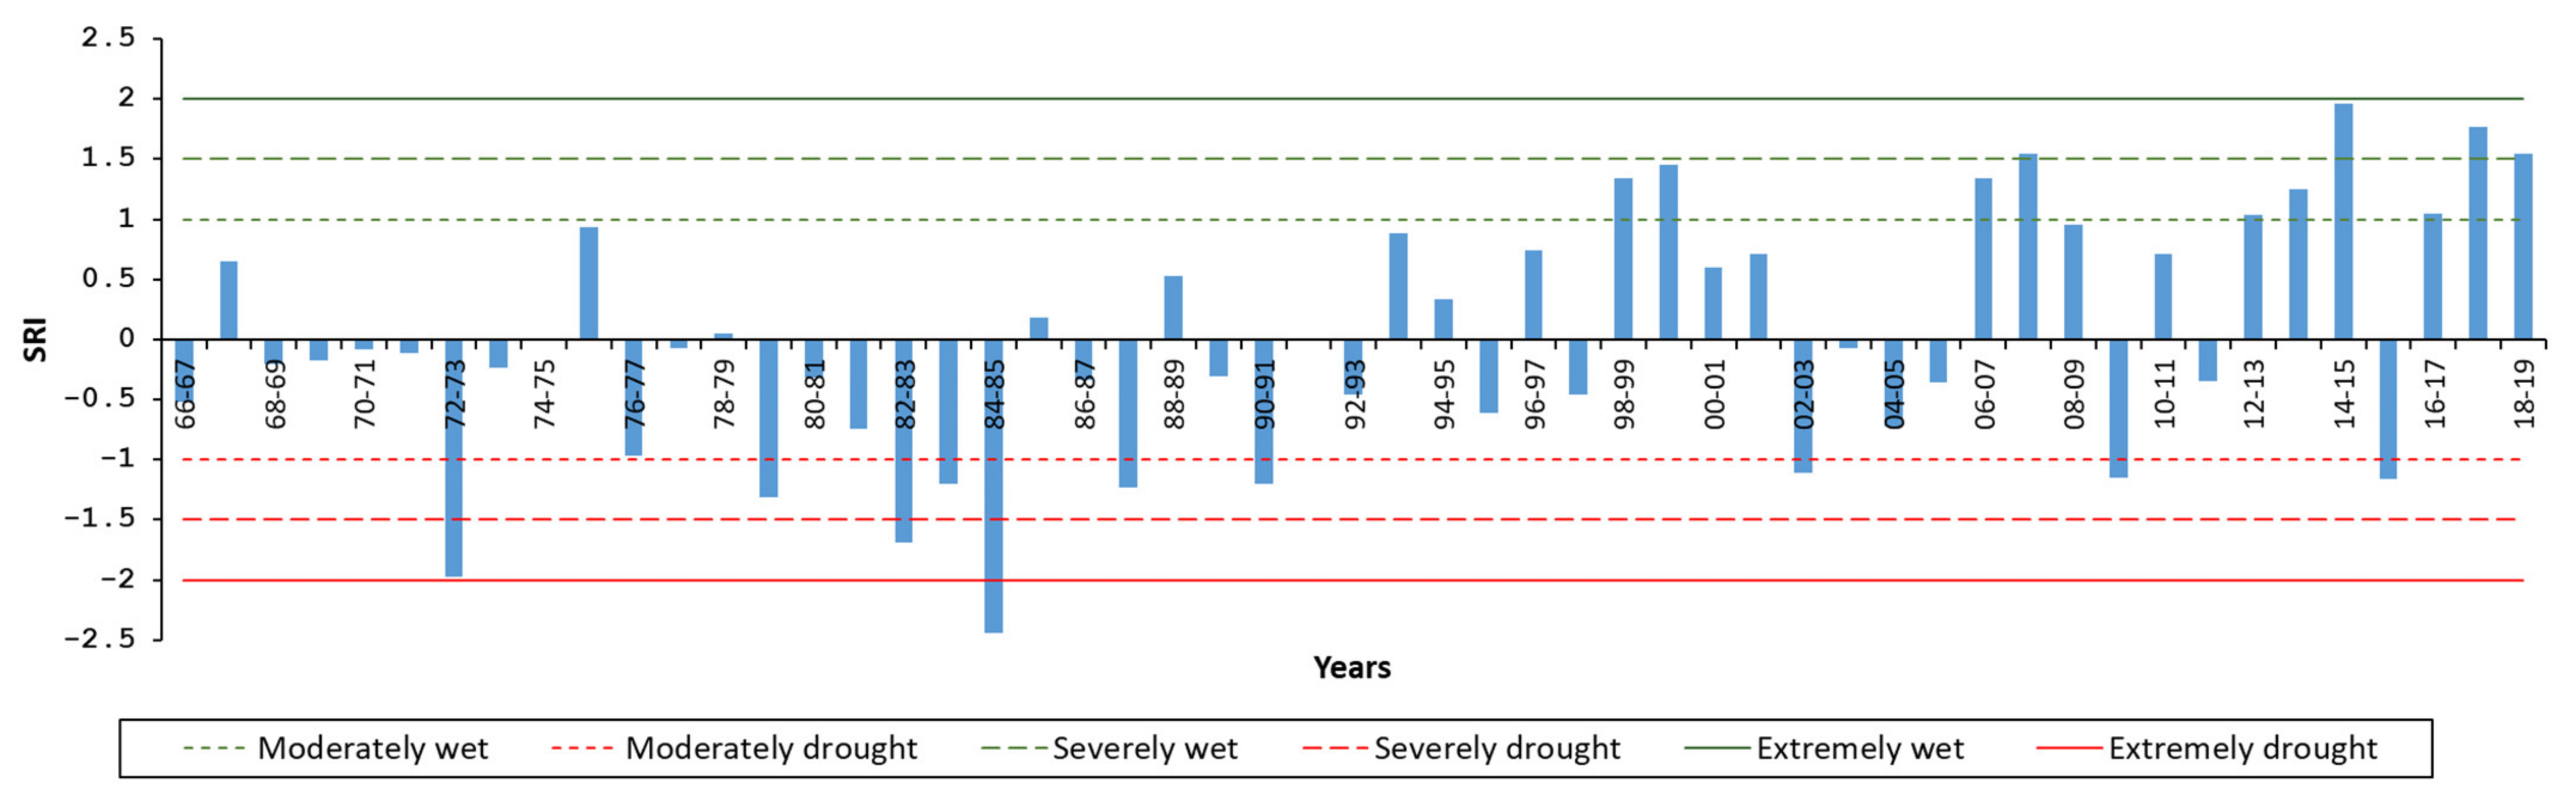
The SRI was calculated based on point-based for two locations (El Diem, and Khartoum). The analysis was done for the period from 1966 to 2019 for various timescales (1, 3, 6, 9, and 12 month). The locations of the stations are shown in Figure 1. The El Diem flow station represents the flow from the UBN, and the Khartoum station represents the outflow from the BN. Similar to the behavior of the other indices for timescales less than 9 months, the SRI showed frequent swings between wet and dry conditions. Figure 11 and Figure 12 showed the annual SRI for El Diem and Khartoum, respectively. The SRI in the two stations captured the extreme droughts in 1972/1973 and 1984/1985, and the severe droughts during the 1980s.
3.4. Correlation between Drought Indices
The relationship between all studied drought indices in different time scales was investigated by the Pearson correlation coefficient (r). We have four different indices at five different timescales, which resulted in a matrix of 20 × 20. Table 2 presents the Pearson correlation coefficient (r) for the BN. The SRI here is based on the point-based at Khartoum station, which represents the outlet of the BN. It can be seen that the SPI-3 has the highest correlation coefficient with sETI-1. In addition, it was noticed that with a longer timescale, the correlation values decrease.
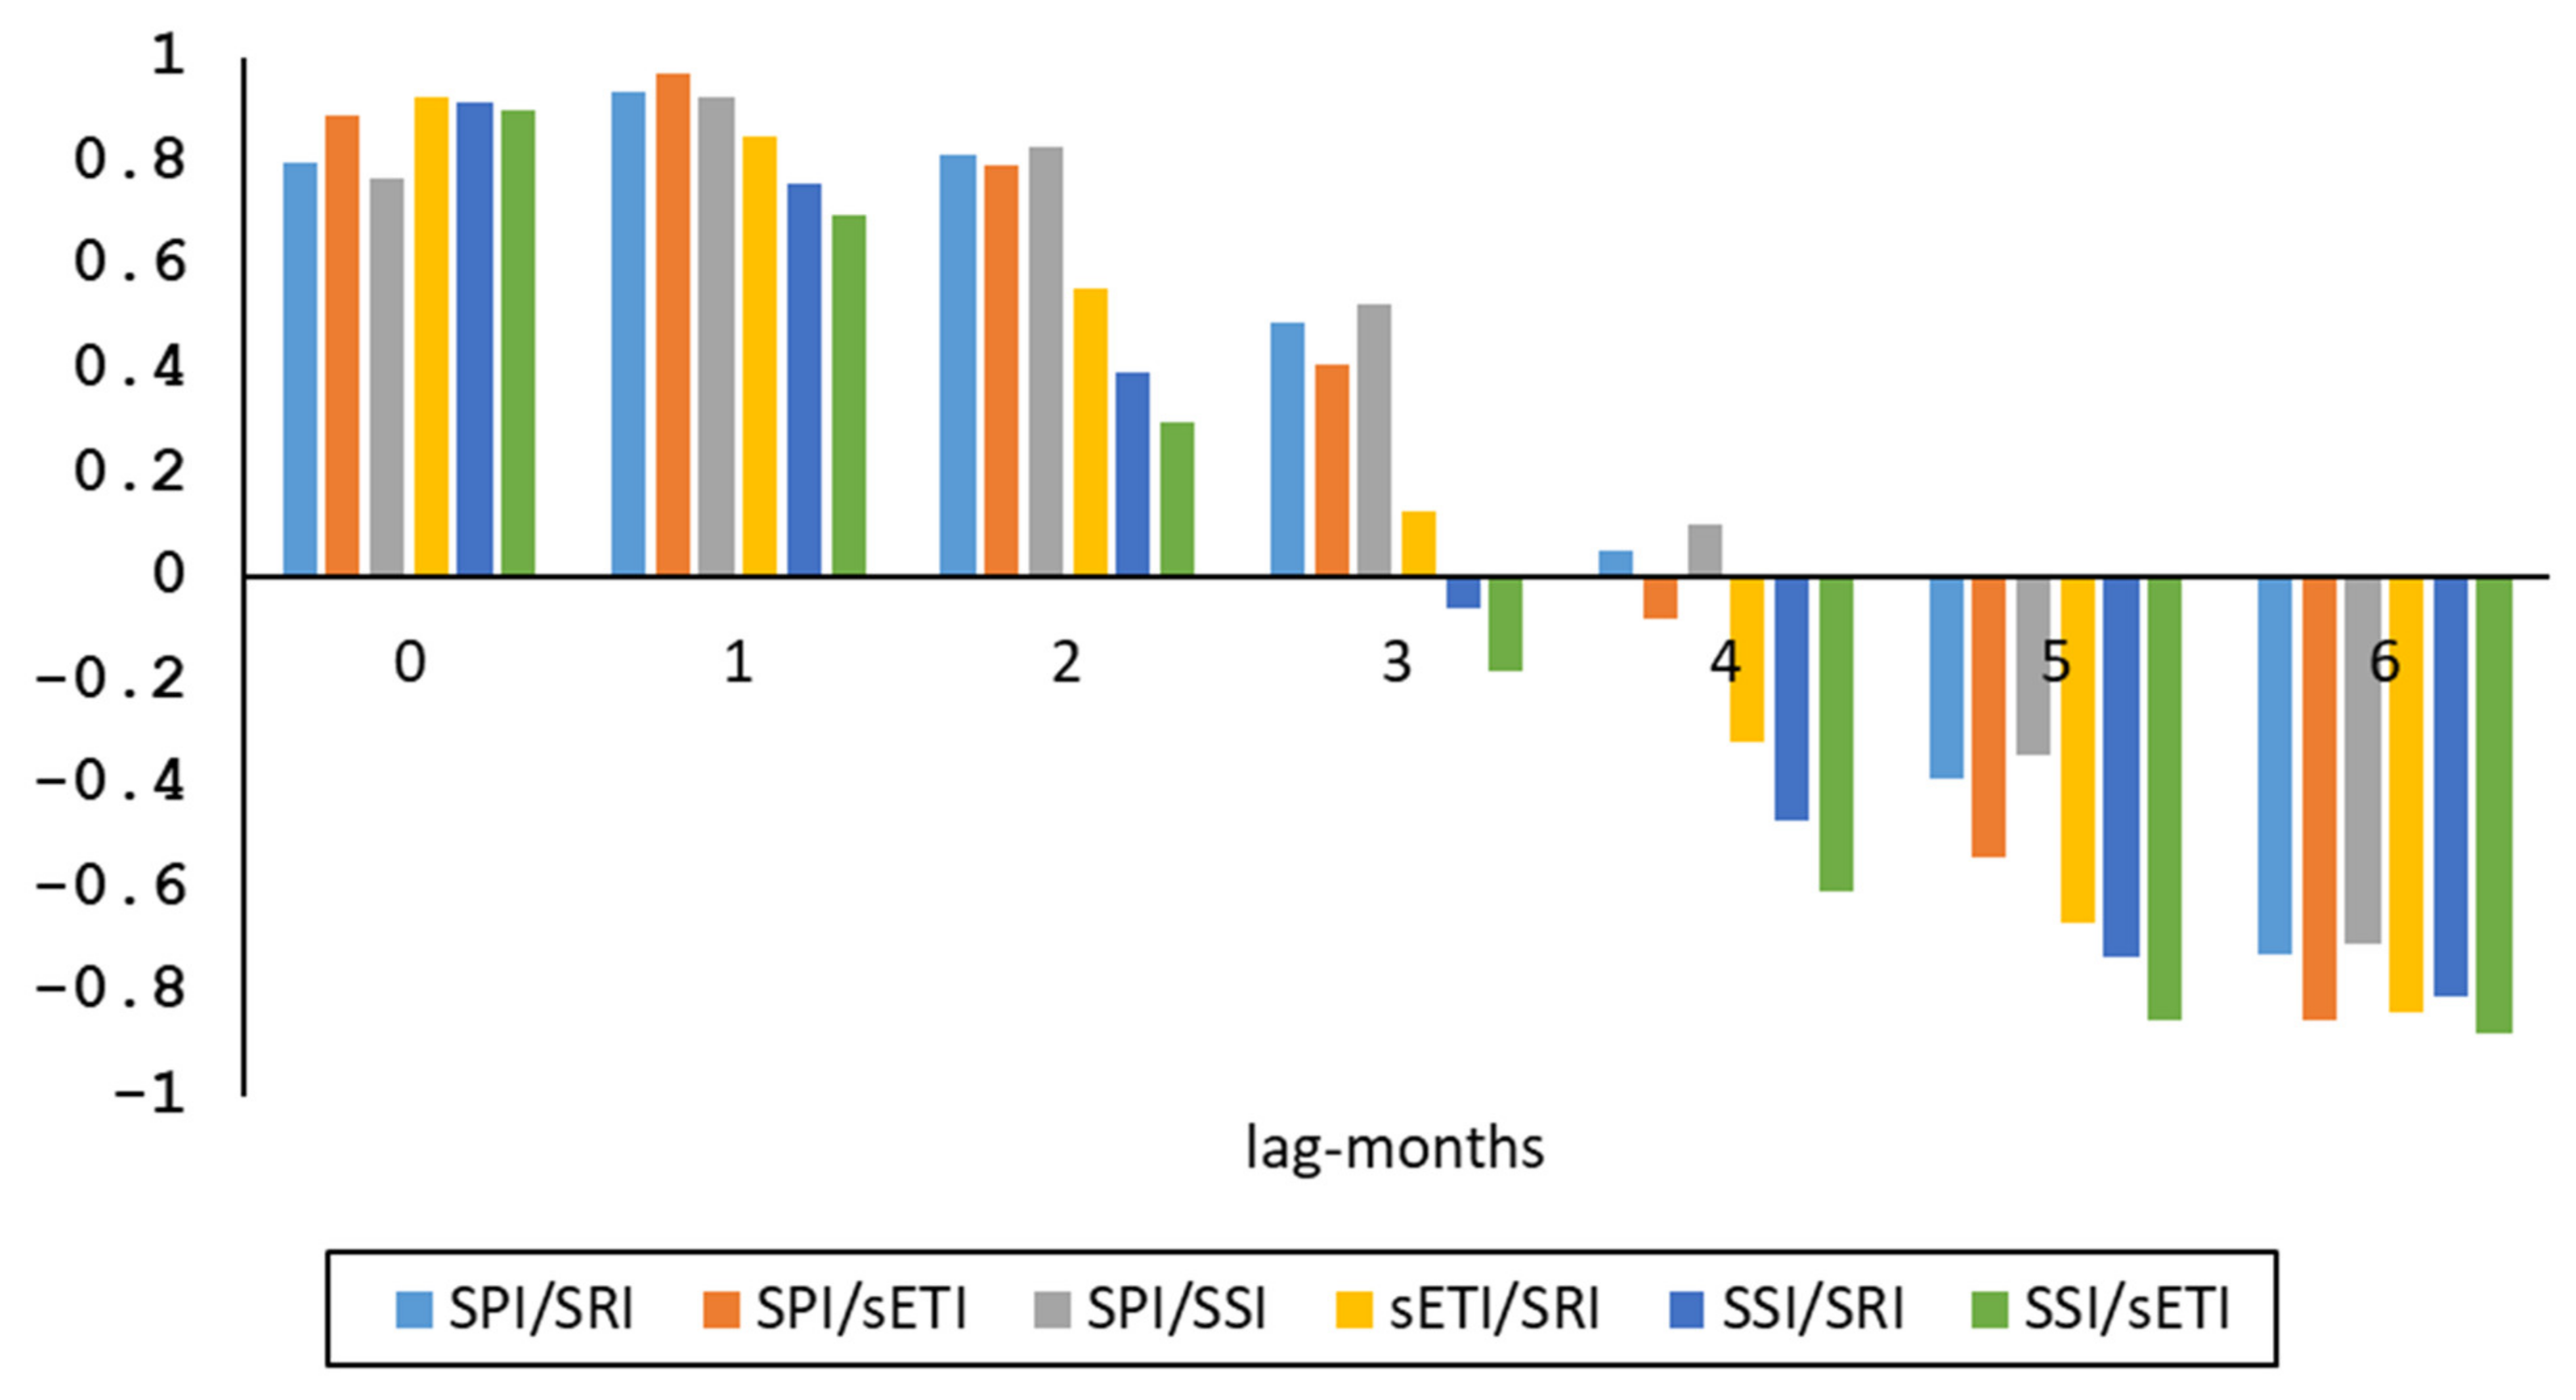
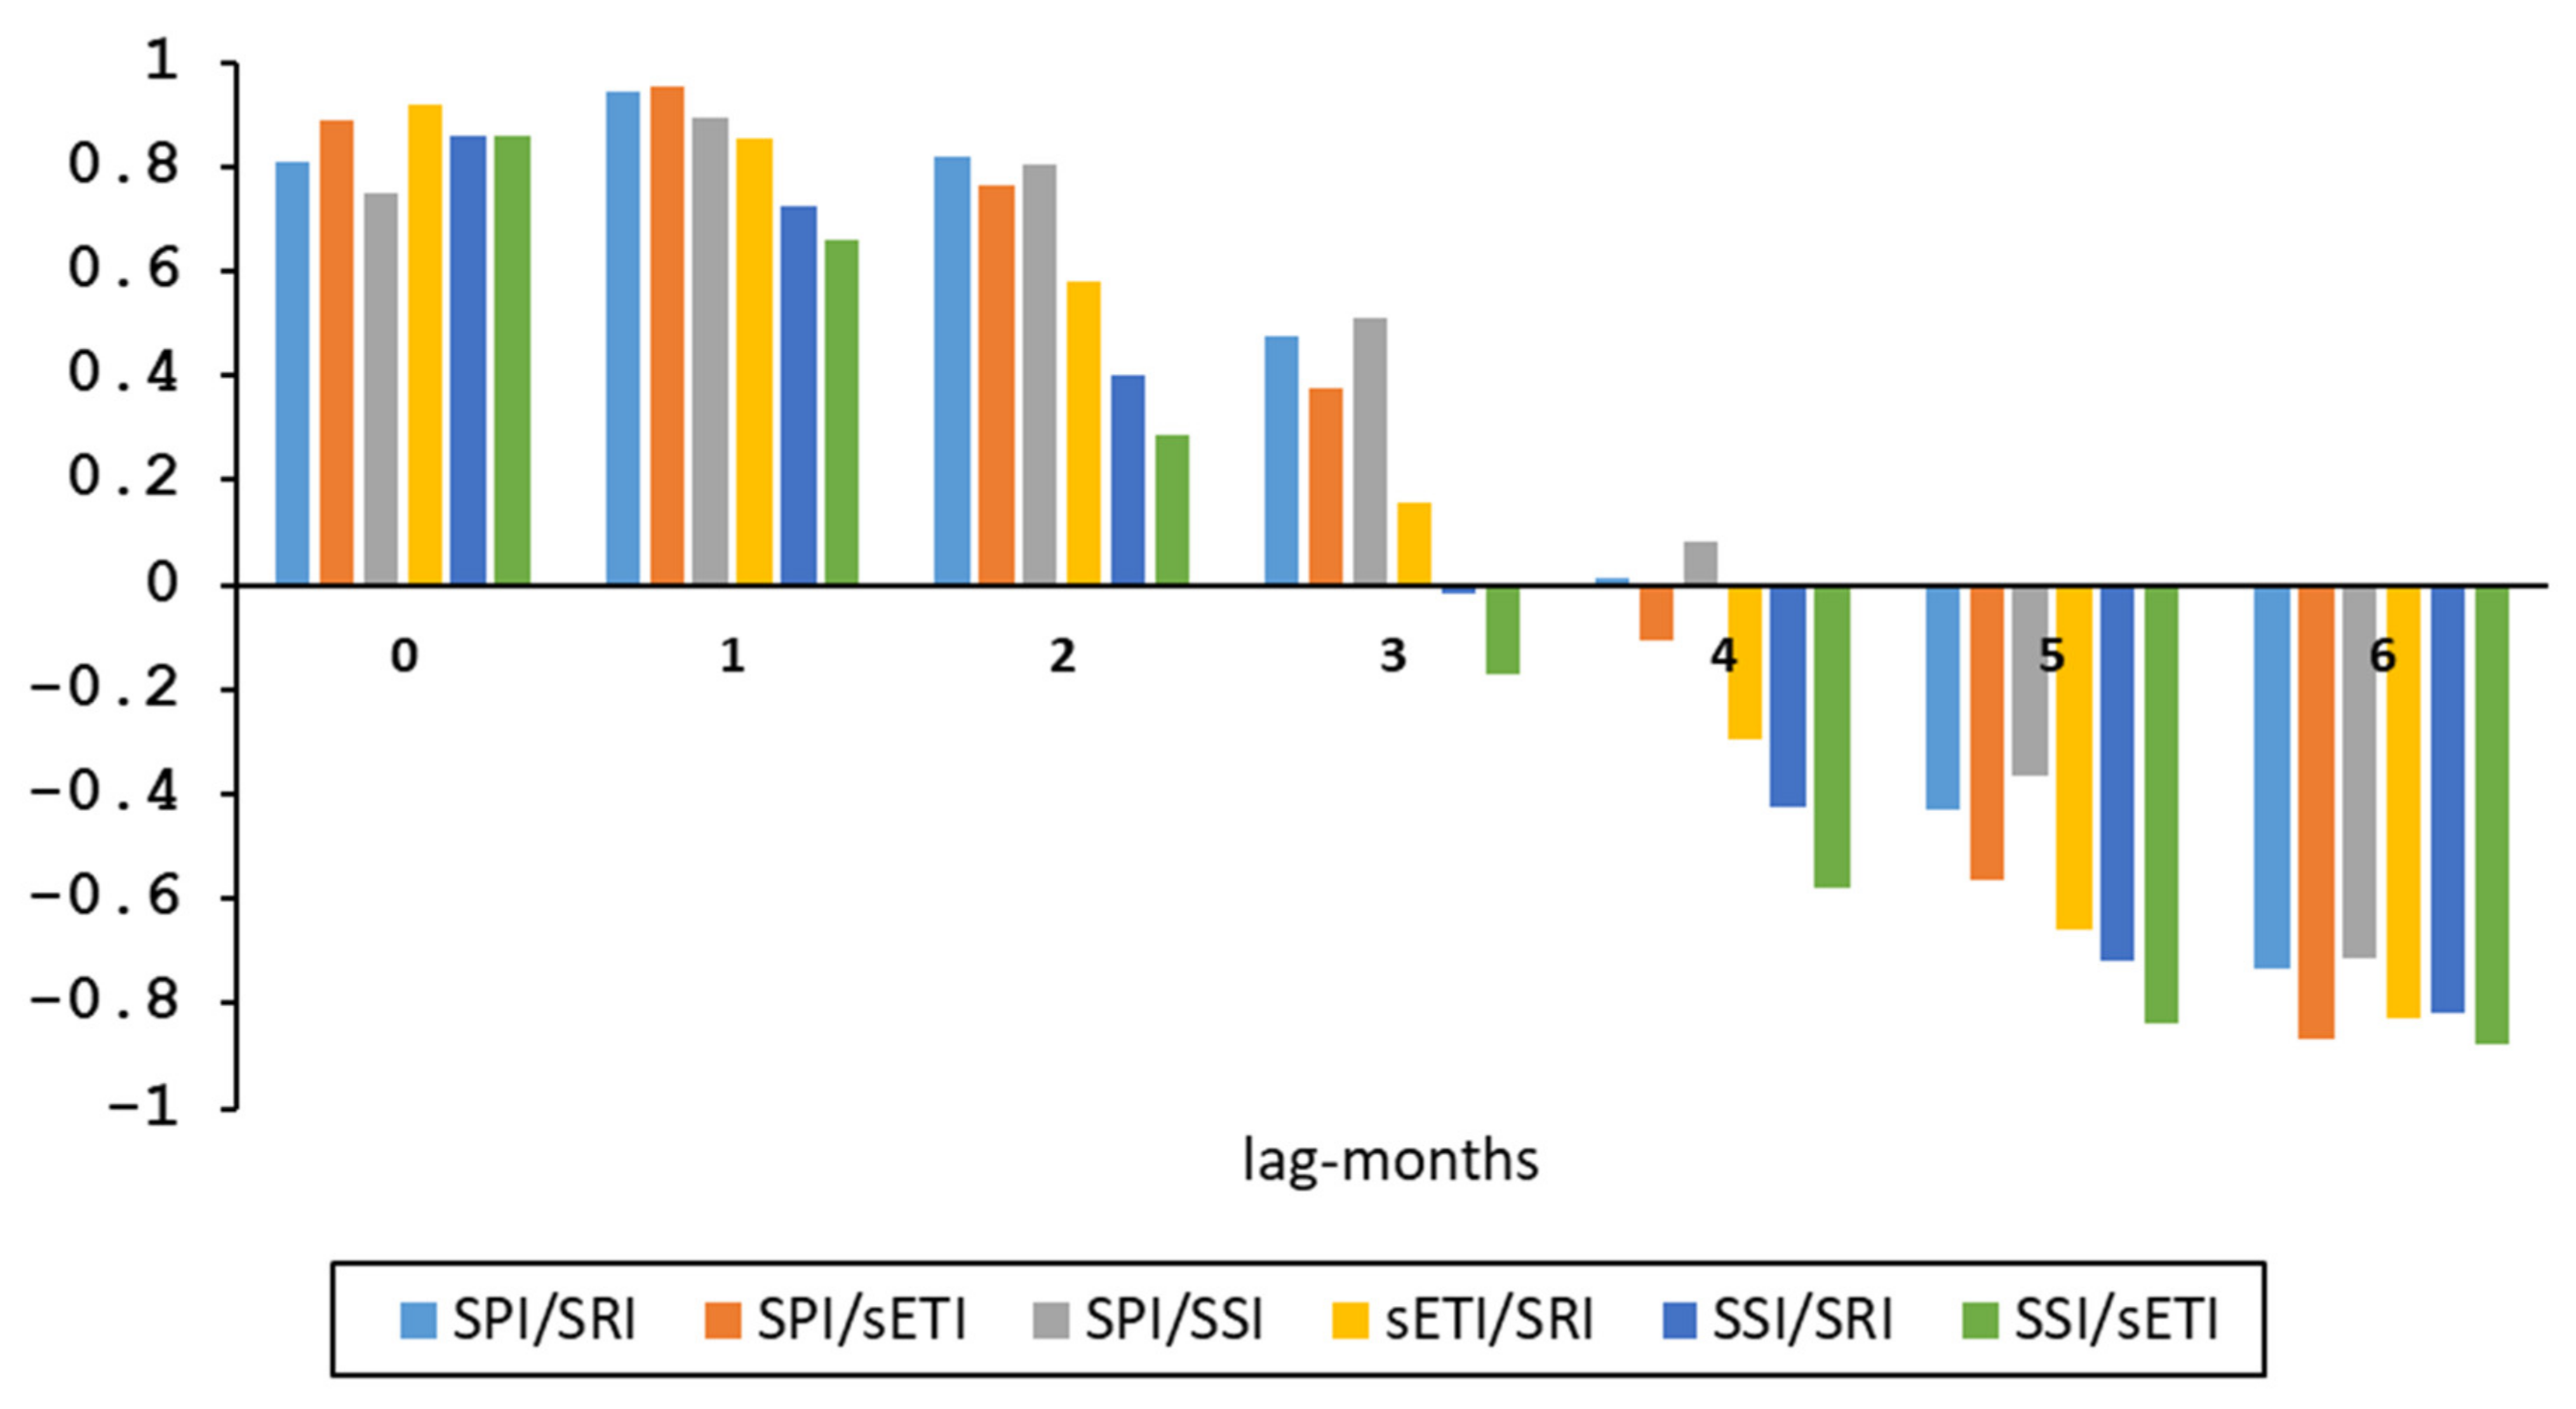
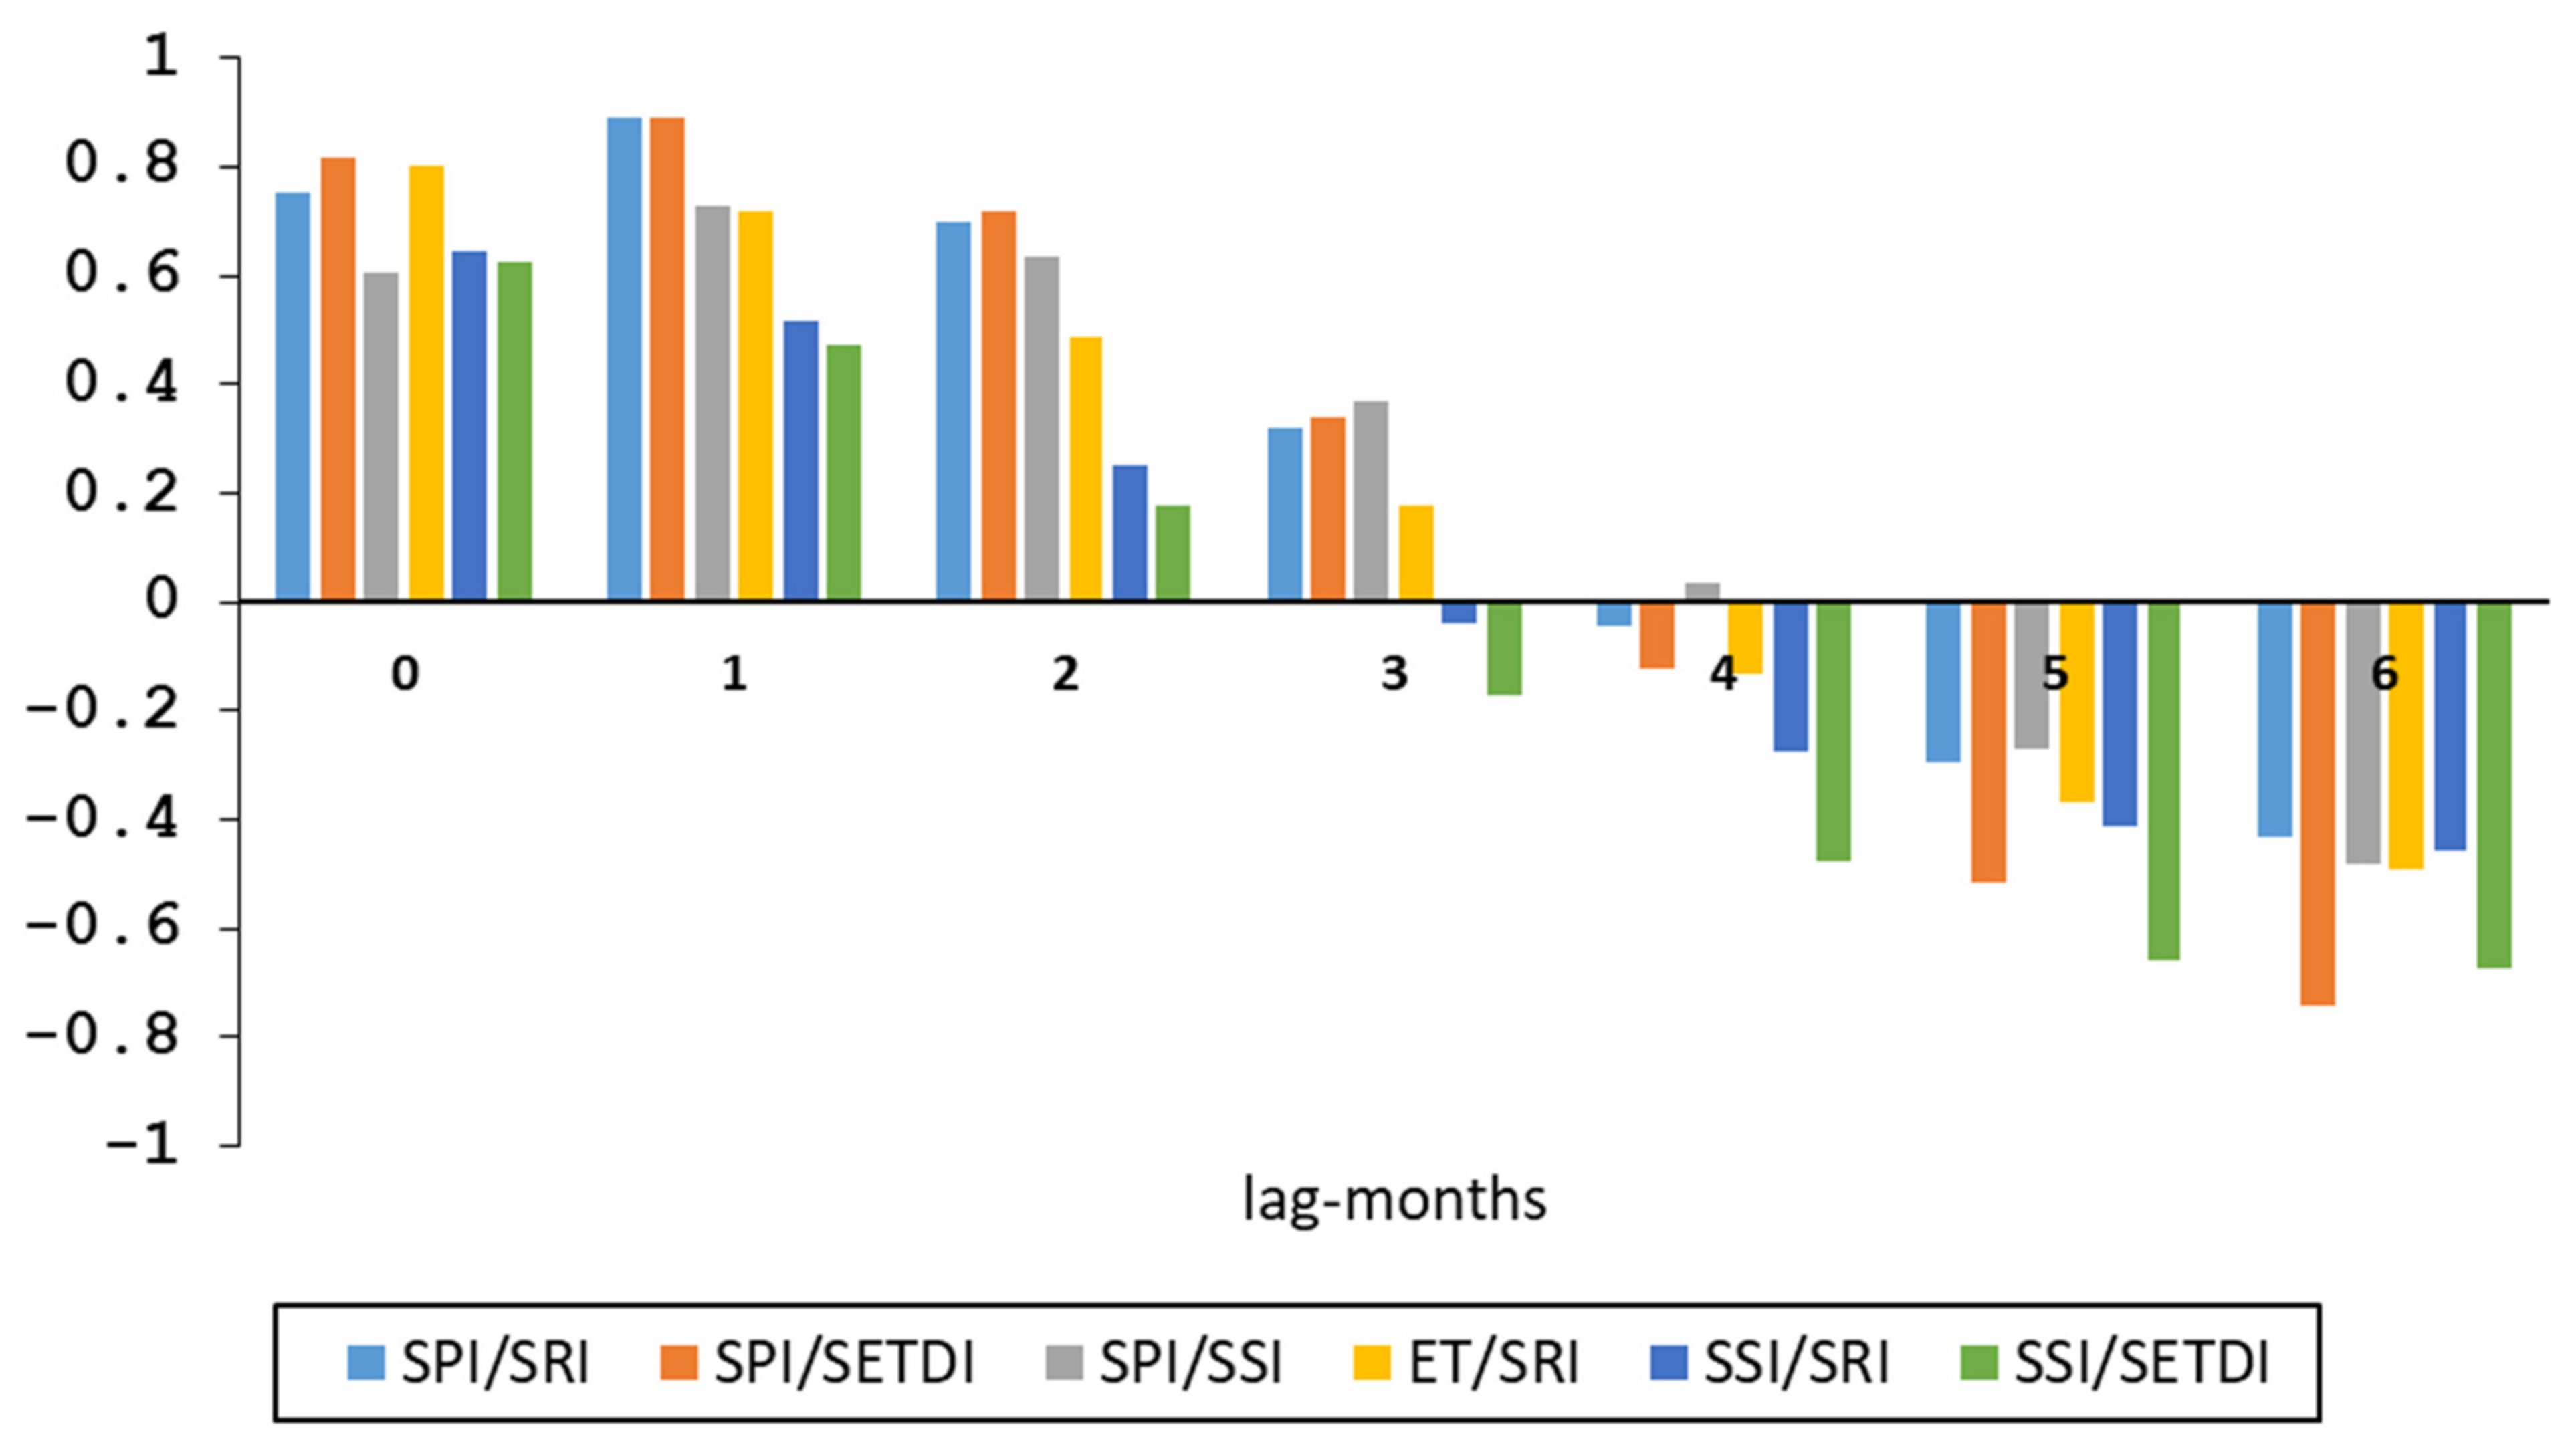
Based on the Pearson correlation matrix, we performed correlation graphs to demonstrate the time lags and correlations between the different indices, as seen in Figure 13, Figure 14, Figure 15 and Figure 16. We performed the lags up to 6 months because it was concluded from the Pearson matrix that the correlations are very weak with a longer timescale. Figure 13 shows the correlation of the monthly indices (SPI-1, SRI-1, SSI-1, sETI-1) with 0-lag up to 6-month lag. For correlations between SSI and SRI, the highest values were found with 0-lag. The same was found for the correlations between SSI and sETI. Figure 14 shows the correlation of the accumulated 3-month indices (SPI-3, SRI-3, SSI-3, sETI-3). Figure 15 shows the correlation of the accumulated 6-month indices (SPI-6, SRI-6, SSI-6, sETI-6). Figure 16 shows the correlations of the accumulated 9-month indices (SPI-9, SRI-9, SSI-9, sETI-9). The graphs show that with longer accumulation periods, correlation values decrease. This analysis helped in finding the suitable lag time between the parameters for drought analysis. The SPI with the rest of the indices (sETI, SRI, SSI) had the highest correlation value with a 1-month lag in all time scales. However, the correlations between SRI and SSI and sETI were the highest in 0-lag. This means that the three parameters behave simultaneously as expected. Correlation values between indices remained high within lag-0 to lag-2. These results showed the link between the investigated drought indices in the BN and confirmed that depending on a single drought index is insufficient for operational drought management. In addition, the lag gave us insight into designing the CDI.
3.5. The Composite Drought Index (BNI)
The first step of creating the composite drought index for the BN was using the PCA and four drought indices from 2000 to 2017. The period from 2018 to 2019 was left for validation. The correlations and drought propagation results inspired the researchers to use the time lag in designing the new index. The time lag of one month between the SPI and the rest of the indices was applied. The new index was formed from the first principal component (PC1), containing more than 90% of the four indices’ information. After that, the empirical weight approach was applied. The optimal weights for PSI, SRI, SSI, and sETI for use in CDI were selected as 0.33, 0.26, 0.22, and 0.19, respectively, presented in Equation (3). The result reveals that the SPI and the SRI have the highest weight, which indicates their dominance over the basin. The sETI has the lowest weight compared to the other indices. This requires more investigation in the future.
where: BNIt is the Blue Nile composite drought index at time (t); SPIt the standardized Precipitation index at time (t); SRIt−1 the standardized runoff index at time (t − 1), SSIt−1 the standardized soil moisture index at time (t − 1); sETIt−1 the standardized evapotranspiration index at time (t − 1).
BNIt = 0. 33× SPIt + 0.26 × SRIt−1 + 0.22× SSIt−1 + 0.19 × sETIt−1
3.6. Evaluation of the BNI
Different methods were used to evaluate the validity of the BNI calculations. The correlation between the BNI and the indices for the period from 2018 to 2019 is shown in Table 3. This period was not included in the BNI calculation. The correlation results show a high correlation for that period.
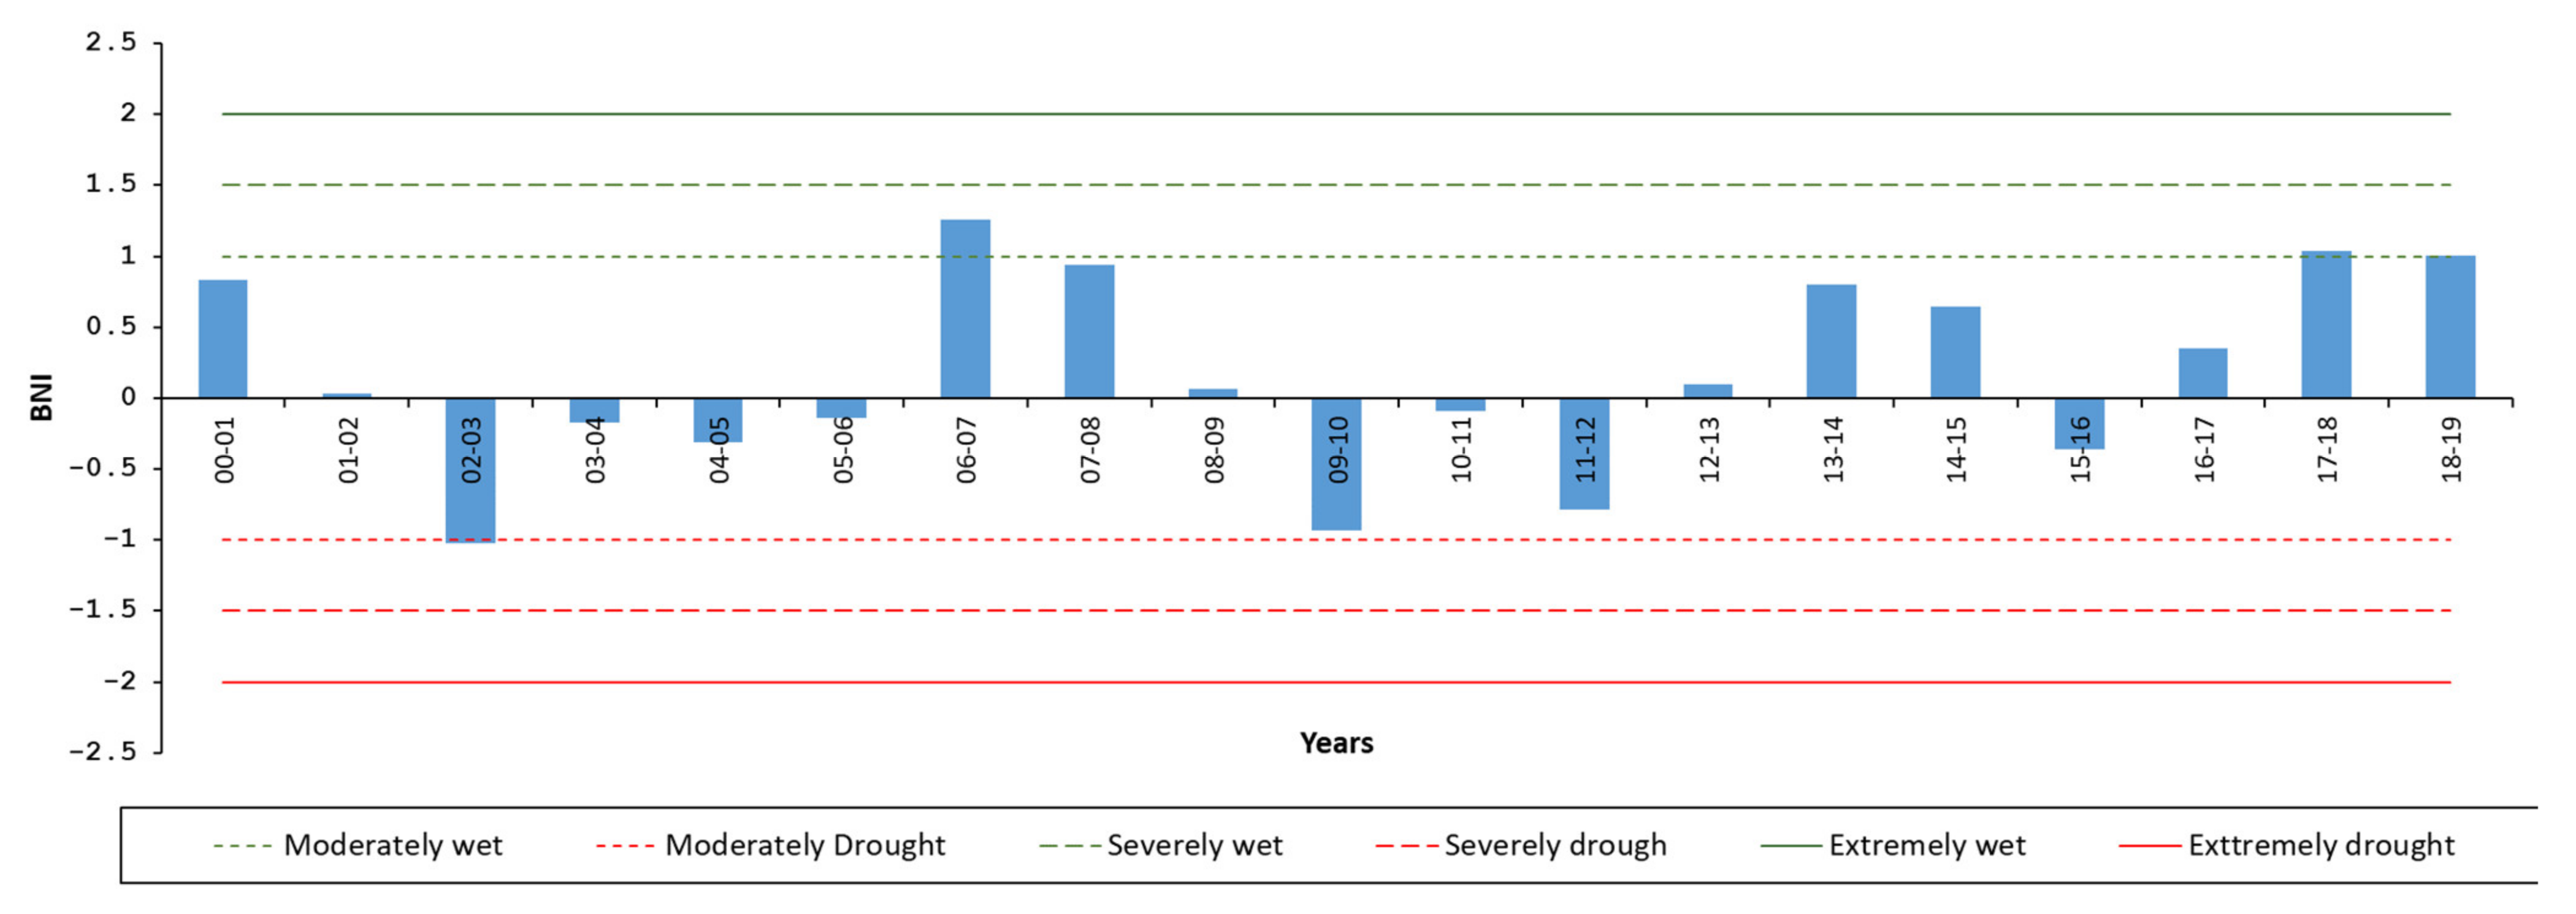
The annual time steps of the BNI for the whole period (2000 to 2019) are shown in Figure 17. The BNI shows its ability to identify the historic drought for the basin in 2002/2003, 2009/2010, and 2015/2016 as well as the wet years 2006/2007, 2007/2008, 2016/2017, 2017/2018 and 2018/2019.
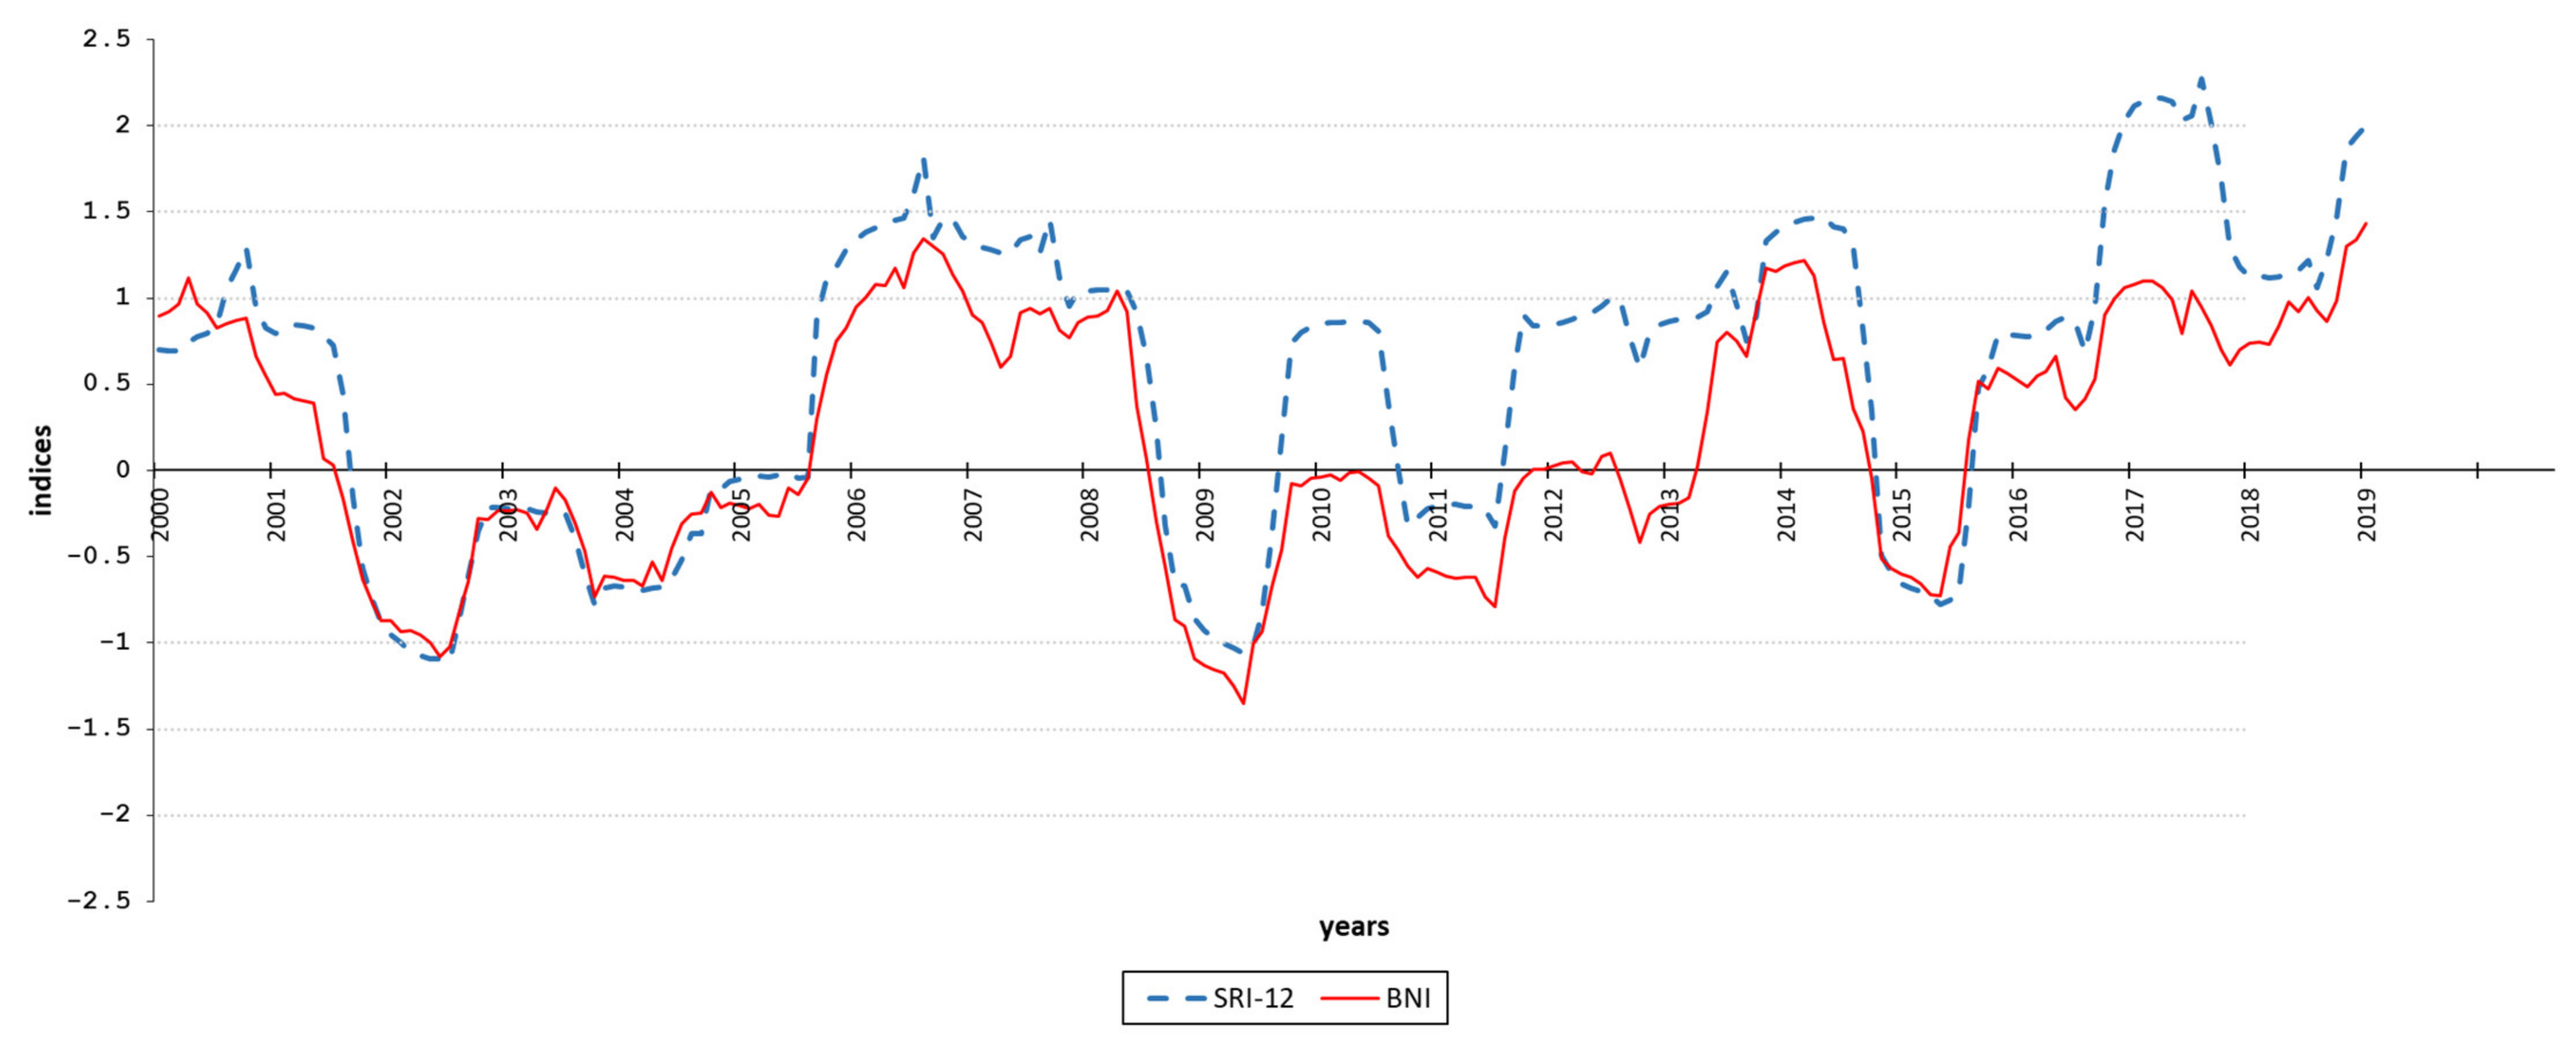
Moreover, we compared the 12-month BNI with the 12-month of SRI at EL-Diem Station as seen in Figure 18. The BNI was able to capture the trend in general, especially at drought periods That is because the BNI was calculated at Khartoum, which is downstream of El Diem. Our research revealed that the BNI was successfully applied to detect the historic drought.
4. Conclusions
To build a resilience plan for drought events, it is essential to comprehend the characteristics of the historical droughts of the region. The assessment of drought over a large basin such as the Blue Nile is a challenging objective and has not been deeply tackled before except for small portions of the basin. In this research, the historical drought events are assessed over the whole basin using four different drought indices. The meteorological drought is quantified by the Standardized Precipitation Index (SPI). The precipitation data used to calculate the SPI are collected from Climate Hazards Group InfraRed Precipitation with Stations (CHIRPS) Version 2.0 data set. The Agricultural drought is evaluated by the Standardized Soil Moisture Index (SSI). NASA Global Land Data Assimilation System (GLDAS) data are used to calculate the SSI. Additionally, the new Standardized Evapotranspiration Drought Index (sETI) is proposed based on the GLDAS data to assess agricultural drought. Hydrological drought is assessed based on ground flow measurements at selected outlets of the basin to calculate the Standardized Runoff Index (SRI). The four indices are compiled in the proposed Blue Nile Composite Drought Index (BNI).
The flow time series was collected from the discharge records at El Diem and Khartoum stations from 1966 to 2019 to calculate the SRI for hydrological drought assessment. The SRI at these stations captured the historical drought events in the 1970s, 1980s, and 2000s. The historical drought events were acquired from the literature review, news, and the Emergency Events Database (EM-DAT). The SPI captured the drought events that happened in the 1980s and 2000s with a shorter data period, from the 1980s to the present. From the 2000s to the present, the sETI and SSI were calculated and astonishingly captured the 2000s drought event with shorter timespan data. This confirmed that the impact of the data length on drought assessment is limited. It can be concluded that shorter data length could be accepted in drought assessment.
All drought indices were calculated in different timescales (1, 3, 6, 9, 12 months and annually). On shorter timescales (9 months and less), the recurrent swings between wet, normal conditions, and drought states were noticed. However, at 12-month and annual timescales, the results showed the onset and end of historical drought events and detected their severity and category. The SPI was the first index that indicates the beginning of a drought event. The SSI, SETI, and SRI caught the same event but with a lag of 1 to 3 months and different severity. This was noticed in short timescales but was barely observed in longer and annual timescales. This lag was insightful in designing the composite drought index for the Blue Nile, and this lag was incorporated in the methodology.
The Principal Component Analysis (PCA) and the empirical weights method were used to develop the combined drought index. The designed Blue Nile Drought Composite Index (BNI) effectively integrates the information included in different drought indices for better monitoring drought events. The BNI was built based on four single-based drought indices of hydrologic cycle components, precipitation, soil moisture, evapotranspiration, and discharge. Additionally, we considered the time lag between precipitation and other parameters. The optimal weights for SPI, SRI, SETI, and SSI were 0.33, 0.26, 0.22, and 0.19, respectively. Pearson correlation analysis was carried out to assess the newly designed index’s ability to monitor the drought. This was done by comparing the BNI with the other proposed indices.
The following points are the key findings of this research:
- A new combined drought index (BNI) that incorporates the major components of the hydrological cycle into one index is developed to assess the drought over the Blue Nile Basin.
- The proposed agricultural drought index sETI showed promising results with a simple approach to assess drought.
- The global earth observation data provide a good opportunity to monitor the drought in case of scarce, missing, or unreliable ground data.
- The literature revealed that machine learning is a promising technique and further investigation with one or more of its models to verify the accuracy of the PCA-based model is recommended.
Author Contributions
Conceptualization, methodology, and analysis, M.A. and A.M.H.; Software, validation, investigation, resources, and data curation, M.A.; writing—original draft preparation, M.A. and A.M.H.; writing—review and editing, M.A., A.M.H., M.G. and A.W.; visualization, M.A. and A.M.H.; supervision, M.G. and A.W. All authors have read and agreed to the published version of the manuscript.
Funding
This research received no external funding.
Informed Consent Statement
Not applicable.
Data Availability Statement
Rainfall data, Climate Hazards Group InfraRed Precipitation with Stations (CHIRPS) v2.0 can be found via link: www.chc.ucsb.edu/data/chirps. Accessed 16 February 2022; evapotranspiration and root zone moisture data from the Global Land Data Assimilation System (GLDAS), can be found via link: www.disc.gsfc.nasa.gov/datasets/GLDAS_NOAH025_M_2.1/summary Accessed 18 February 2022.
Conflicts of Interest
The authors declare no conflict of interest.
References
- Changnon, S.A.; Easterling, W.E. Measuring Drought Impacts: The Illinois Case 1. JAWRA J. Am. Water Resour. Assoc. 1989, 25, 27–42. [Google Scholar] [CrossRef]
- Keyantash, J.; Dracup, J.A. The quantification of drought: An evaluation of drought indices. Bull. Am. Meteorol. Soc. 2002, 83, 1167–1180. [Google Scholar] [CrossRef]
- WMO; GWP. Handbook of Drought Indicators and Indices; Svoboda, M., Fuchs, B., Eds.; Integrated Drought Management Programme (IDMP): Geneva, Switzerland, 2016; pp. 5–6. ISBN 978-92-63-11173-9. [Google Scholar]
- Dracup, J.A.; Lee, K.S.; Paulson, E.G. On the definition of droughts. Water Resour. Res. 1980, 16, 297–302. [Google Scholar] [CrossRef]
- Wilhite, D.A. Drought as a Natural Hazard: Concepts and Definitions. In Drought: A Global Assessment; Wilhite, D.A., Ed.; Routledge: London, UK, 2000; Volume 1, pp. 3–18. [Google Scholar]
- Coles, N.A.; Eslamian, S. Definition of Drought. In Handbook of Drought and Water Scarcity. Vol 1. Principles of Drought and Water Scarcity; Eslamian, S., Eslamian, F., Eds.; Taylor Francis: Boca Raton, FL, USA, 2017; pp. 1–26. [Google Scholar]
- Wilhite, D.A.; Glantz, M.H. Understanding: The Drought Phenomenon: The Role of Definitions. Water Int. 1985, 10, 111–120. [Google Scholar] [CrossRef] [Green Version]
- Orimoloye, I.R.; Belle, J.A.; Orimoloye, Y.M.; Olusola, A.O.; Ololade, O.O. Drought: A Common Environmental Disaster. Atmosphere 2022, 13, 111. [Google Scholar] [CrossRef]
- Wutich, A.; Brewis, A.; Tsai, A. Water and mental health. Wiley Interdiscip. Rev. Water 2020, 7, 1–16. [Google Scholar] [CrossRef]
- Obasi, G.O.P. WMO’s Role in the International Decade for Natural Disaster Reduction. Bull. Am. Meteorol. Soc. 1994, 75, 1655–1661. [Google Scholar] [CrossRef] [Green Version]
- United Nations Office for Disaster Risk Reduction. GAR Special Report on Drought 2021; United Nations Office for Disaster Risk Reduction: Geneva, Switzerland, 2021; pp. 167–168. ISBN 9789212320274. [Google Scholar]
- Orimoloye, I.R.; Zhou, L.; Kalumba, A.M. Drought disaster risk adaptation through ecosystem services-based solutions: Way forward for south africa. Sustainability 2021, 13, 4132. [Google Scholar] [CrossRef]
- IPCC. IPCC Climate Change 2014: Synthesis Report. Contribution of Working Groups I, II and III to the Fifth Assessment Report of the Intergovernmental Panel on Climate Change; Core Writing Team, Pachauri, R.K., Meyer, L.A., Eds.; IPCC: Geneva, Switzerland, 2014; p. 151. [Google Scholar]
- Vicente-Serrano, S.M.; Quiring, S.M.; Peña-Gallardo, M.; Yuan, S.; Domínguez-Castro, F. A review of environmental droughts: Increased risk under global warming? Earth-Science Rev. 2020, 201, 102953. [Google Scholar] [CrossRef]
- Haile, G.G.; Tang, Q.; Li, W.; Liu, X.; Zhang, X. Drought: Progress in broadening its understanding. WIREs Water 2020, 7, 1–25. [Google Scholar] [CrossRef]
- Heim, R.R. A Review of Twentieth-Century Drought Indices Used in the United States. Bull. Am. Meteorol. Soc. 2002, 83, 1149–1165. [Google Scholar] [CrossRef] [Green Version]
- Quiring, S.M. Monitoring Drought: An Evaluation of Meteorological Drought Indices. Geogr. Compass 2009, 3, 64–88. [Google Scholar] [CrossRef]
- Zargar, A.; Sadiq, R.; Naser, B.; Khan, F.I. A review of drought indices. Environ. Rev. 2011, 19, 333–349. [Google Scholar] [CrossRef]
- Kchouk, S.; Melsen, L.; Walker, D.; van Oel, P. A review of drought indices: Predominance of drivers over impacts and the importance of local context. Nat. Hazards Earth Syst. Sci. Discuss. 2021, 1–28. [Google Scholar] [CrossRef]
- Bhaga, T.D.; Dube, T.; Shekede, M.D.; Shoko, C. Impacts of climate variability and drought on surface water resources in sub-saharan africa using remote sensing: A review. Remote Sens. 2020, 12, 4184. [Google Scholar] [CrossRef]
- Balint, Z.; Mutua, F.; Muchiri, P.; Omuto, C.T. Monitoring Drought with the Combined Drought Index in Kenya. In Lake Bonneville—A Scientific Update; Paron, P., Olago, D.O., Omuto, C.T., Eds.; Elsevier: Amsterdam, The Netherlands, 2013; Volume 16, pp. 341–356. [Google Scholar]
- Adisa, O.M.; Masinde, M.; Botai, J.O.; Botai, C.M. Bibliometric Analysis of Methods and Tools for Drought Monitoring and Prediction in Africa. Sustainability 2020, 12, 6516. [Google Scholar] [CrossRef]
- Sundararajan, K.; Garg, L.; Srinivasan, K.; Bashir, A.K.; Kaliappan, J.; Ganapathy, G.P.; Selvaraj, S.K.; Meena, T. A contemporary review on drought modeling using machine learning approaches. C. Comput. Model. Eng. Sci. 2021, 128, 447–487. [Google Scholar] [CrossRef]
- Zaniolo, M.; Giuliani, M.; Castelletti, A. Data-driven modeling and control of droughts. IFAC-PapersOnLine 2019, 52, 54–60. [Google Scholar] [CrossRef]
- Barzkar, A.; Najafzadeh, M.; Homaei, F. Evaluation of drought events in various climatic conditions using data-driven models and a reliability-based probabilistic model. Nat. Hazards 2022, 110, 1931–1952. [Google Scholar] [CrossRef]
- Najafzadeh, M.; Homaei, F.; Mohamadi, S. Reliability evaluation of groundwater quality index using data-driven models. Environ. Sci. Pollut. Res. 2022, 29, 8174–8190. [Google Scholar] [CrossRef]
- Yaseen, Z.M.; Ali, M.; Sharafati, A.; Al-Ansari, N.; Shahid, S. Forecasting standardized precipitation index using data intelligence models: Regional investigation of Bangladesh. Sci. Rep. 2021, 11, 1–25. [Google Scholar] [CrossRef] [PubMed]
- Achite, M.; Jehanzaib, M.; Elshaboury, N.; Kim, T. Evaluation of Machine Learning Techniques for Hydrological Drought Modeling: A Case Study of the Wadi Ouahrane Basin in Algeria. Water 2022, 14, 431. [Google Scholar] [CrossRef]
- Byun, H.-R.; Wilhite, D.A. Objective Quantification of Drought Severity and Duration. J. Clim. 1999, 12, 2747–2756. [Google Scholar] [CrossRef]
- Esfahanian, E.; Nejadhashemi, A.P.; Abouali, M.; Adhikari, U.; Zhang, Z.; Daneshvar, F.; Herman, M.R. Development and evaluation of a comprehensive drought index. J. Environ. Manage. 2017, 185, 31–43. [Google Scholar] [CrossRef] [PubMed] [Green Version]
- Steinemann, A. Drought indicators and triggers: A stochastic approach to evaluation. J. Am. Water Resour. Assoc. 2003, 39, 1217–1233. [Google Scholar] [CrossRef]
- Vyas, S.S.; Bhattacharya, B.K.; Nigam, R.; Guhathakurta, P.; Ghosh, K.; Chattopadhyay, N.; Gairola, R.M. A combined deficit index for regional agricultural drought assessment over semi-arid tract of India using geostationary meteorological satellite data. Int. J. Appl. Earth Obs. Geoinf. 2015, 39, 28–39. [Google Scholar] [CrossRef]
- Mannava, V.K.S.; Motha, R.P.; Wilhite, D.A.; Wood, D.A. (Eds.) 2011. Agricultural Drought Indices. In Proceedings of the WMO/UNISDR Expert Group Meeting on Agricultural Drought Indices, Murcia, Spain, 2–4 June 2010; World Meteorological Organization United: Geneva, Switzerland, 2010; p. 197. [Google Scholar]
- Yildirim, G.; Rahman, A.; Singh, V. A Bibliometric Analysis of Drought Indices, Risk, and Forecast as Components of Drought Early Warning Systems. Water 2022, 14, 253. [Google Scholar] [CrossRef]
- Sepulcre-Canto, G.; Horion, S.; Singleton, A.; Carrao, H.; Vogt, J. Development of a Combined Drought Indicator to detect agricultural drought in Europe. Nat. Hazards Earth Syst. Sci. 2012, 12, 3519–3531. [Google Scholar] [CrossRef] [Green Version]
- Kulkarni, S.S.; Wardlow, B.D.; Bayissa, Y.A.; Tadesse, T.; Svoboda, M.D.; Gedam, S.S. Developing a Remote Sensing-Based Combined Drought Indicator Approach for Agricultural Drought Monitoring over Marathwada, India. Remote Sens. 2020, 12, 2091. [Google Scholar] [CrossRef]
- Han, H.; Bai, J.; Yan, J.; Yang, H.; Ma, G. A combined drought monitoring index based on multi-sensor remote sensing data and machine learning. Geocarto Int. 2021, 36, 1161–1177. [Google Scholar] [CrossRef]
- Ali, M.; Helmi, A.; Ghaith, M.; Wagdy, A. Gap analysis in the current knowledge limitations in drought assessment research in the eastern Nile River Basin. Int. J. Eng. Res. Technol. 2019, 12, 2200–2206. [Google Scholar]
- Amin, D.; Elshamy, M.; Fouda, S.; Kassem, T. Drought Risk Assessment in Eastern Nile under Current and Future Climate Conditions. In Proceedings of the Eau–Société–Climat’2017 (ESC-2017), Hammamet, Tunisia, 2–3 October 2017; Volume 1, pp. 2–7. [Google Scholar]
- Bayissa, Y.A.; Moges, S.A.; Xuan, Y.; van Andel, S.J.; Maskey, S.; Solomatine, D.P.; van Griensven, A.; Tadesse, T. Spatio-temporal assessment of meteorological drought under the influence of varying record length: The case of Upper Blue Nile Basin, Ethiopia. Hydrol. Sci. J. 2015, 60, 1–16. [Google Scholar] [CrossRef]
- Khadr, M. Temporal and spatial analysis of meteorological drought characteristics in the upper Blue Nile river region. Hydrol. Res. 2017, 48, 265–276. [Google Scholar] [CrossRef]
- Khadr, M. Forecasting of meteorological drought using Hidden Markov Model (Case Study: The upper Blue Nile river basin, Ethiopia). Ain Shams Eng. J. 2016, 7, 47–56. [Google Scholar] [CrossRef] [Green Version]
- Bayissa, Y.; Tadesse, T.; Demisse, G.; Shiferaw, A. Evaluation of Satellite-Based Rainfall Estimates and Application to Monitor Meteorological Drought for the Upper Blue Nile Basin, Ethiopia. Remote Sens. 2017, 9, 669. [Google Scholar] [CrossRef] [Green Version]
- Zaroug, M.A.H.; Eltahir, E.A.B.; Giorgi, F. Droughts and floods over the upper catchment of the Blue Nile and their connections to the timing of El Niño and La Niña events. Hydrol. Earth Syst. Sci 2014, 18, 1239–1249. [Google Scholar] [CrossRef] [Green Version]
- Dutra, E.; Di Giuseppe, F.; Wetterhall, F.; Pappenberger, F. Seasonal forecasts of droughts in African basins using the Standardized Precipitation Index. Hydrol. Earth Syst. Sci. 2013, 17, 2359–2373. [Google Scholar] [CrossRef] [Green Version]
- Awadallah, A.G. Evolution of the Nile River drought risk based on the streamflow record at Aswan station, Egypt. Civ. Eng. Environ. Syst. 2014, 31, 260–269. [Google Scholar] [CrossRef]
- Bayissa, Y.; Maskey, S.; Tadesse, T.; van Andel, S.; Moges, S.; van Griensven, A.; Solomatine, D. Comparison of the Performance of Six Drought Indices in Characterizing Historical Drought for the Upper Blue Nile Basin, Ethiopia. Geosciences 2018, 8, 81. [Google Scholar] [CrossRef] [Green Version]
- Dilnesa, W. Hydro-Metrological Drought Assessments along the Blue Nile River Basin in East Gojjam Zone. Civ. Environ. Res. 2020, 12, 24–35. [Google Scholar] [CrossRef]
- Mulualem, G.M.; Liou, Y.-A. Application of Artificial Neural Networks in Forecasting a Standardized Precipitation Evapotranspiration Index for the Upper Blue Nile Basin. Water 2020, 12, 643. [Google Scholar] [CrossRef] [Green Version]
- Taye, M.; Sahlu, D.; Zaitchik, B.F.; Neka, M. Evaluation of Satellite Rainfall Estimates for Meteorological Drought Analysis over the Upper Blue Nile Basin, Ethiopia. Geosciences 2020, 10, 352. [Google Scholar] [CrossRef]
- Bayissa, Y.A. Developing an Impact-Based Combined Drought Index for Monitoring Crop Yield Anomalies in the Upper Blue Nile Basin, Ethiopia; CRC Press: London, UK, 2018; ISBN 9780429399510. [Google Scholar]
- Kebede, A.; Raju, U.J.P.; Korecha, D.; Nigussie, M. Developing new drought indices with and without climate signal information over the Upper Blue Nile. Model. Earth Syst. Environ. 2020, 6, 151–161. [Google Scholar] [CrossRef]
- Sutcliffe, J.V.; Parks, Y.P. The Hydrology of the Nile; The International Association of Hydrological Science: Oxfordshire, UK, 1999; pp. 127–141. [Google Scholar]
- Funk, C.C.; Peterson, P.J.; Landsfeld, M.F.; Pedreros, D.H.; Verdin, J.P.; Rowland, J.D.; Romero, B.E.; Husak, G.J.; Michaelsen, J.C.; Verdin, A.P. A quasi-global precipitation time series for drought monitoring. US Geol. Surv. Data Ser. 2014, 832, 1–12. [Google Scholar]
- Bijaber, N.; El Hadani, D.; Saidi, M.; Svoboda, M.; Wardlow, B.; Hain, C.; Poulsen, C.; Yessef, M.; Rochdi, A. Developing a Remotely Sensed Drought Monitoring Indicator for Morocco. Geosciences 2018, 8, 55. [Google Scholar] [CrossRef] [PubMed] [Green Version]
- Jung, H.C.; Getirana, A.; Policelli, F.; McNally, A.; Arsenault, K.R.; Kumar, S.; Tadesse, T.; Peters-Lidard, C.D. Upper Blue Nile basin water budget from a multi-model perspective. J. Hydrol. 2017, 555, 535–546. [Google Scholar] [CrossRef] [Green Version]
- Fisher, J.B.; Melton, F.; Middleton, E.; Hain, C.; Anderson, M.; Allen, R.; McCabe, M.F.; Hook, S.; Baldocchi, D.; Townsend, P.A.; et al. The future of evapotranspiration: Global requirements for ecosystem functioning, carbon and climate feedbacks, agricultural management, and water resources. Water Resour. Res. 2017, 53, 2618–2626. [Google Scholar] [CrossRef]
- Narasimhan, B.; Srinivasan, R. Development and evaluation of Soil Moisture Deficit Index (SMDI) and Evapotranspiration Deficit Index (ETDI) for agricultural drought monitoring. Agric. For. Meteorol. 2005, 133, 69–88. [Google Scholar] [CrossRef]
- Tsakiris, G.; Vangelis, H. Establishing a drought index incorporating evapotranspiration. Eur. Water 2005, 9, 3–11. [Google Scholar]
- Vicente-Serrano, S.M.; Beguería, S.; López-Moreno, J.I. A Multiscalar Drought Index Sensitive to Global Warming: The Standardized Precipitation Evapotranspiration Index. J. Clim. 2010, 23, 1696–1718. [Google Scholar] [CrossRef] [Green Version]
- Rodell, M.; Houser, P.R.; Jambor, U.; Gottschalck, J.; Mitchell, K.; Meng, C.-J.; Arsenault, K.; Cosgrove, B.; Radakovich, J.; Bosilovich, M.; et al. The Global Land Data Assimilation System. Bull. Am. Meteorol. Soc. 2004, 85, 381–394. [Google Scholar] [CrossRef] [Green Version]
- Alemayehu, T.; van Griensven, A.; Senay, G.B.; Bauwens, W. Evapotranspiration Mapping in a Heterogeneous Landscape Using Remote Sensing and Global Weather Datasets: Application to the Mara Basin, East Africa. Remote Sens. 2017, 9, 390. [Google Scholar] [CrossRef] [Green Version]
- Luetkemeier, R.; Stein, L.; Drees, L.; Liehr, S. Blended Drought Index: Integrated Drought Hazard Assessment in the Cuvelai-Basin. Climate 2017, 5, 51. [Google Scholar] [CrossRef] [Green Version]
- Mukherjee, S.; Mishra, A.; Trenberth, K.E. Climate Change and Drought: A Perspective on Drought Indices. Curr. Clim. Chang. Reports 2018, 4, 145–163. [Google Scholar] [CrossRef]
- Zhang, G.; Su, X.; Ayantobo, O.O.; Feng, K. Drought monitoring and evaluation using ESA CCI and GLDAS-Noah soil moisture datasets across China. Theor. Appl. Climatol. 2021, 144, 1407–1418. [Google Scholar] [CrossRef]
- Sheffield, J.; Goteti, G.; Wen, F.; Wood, E.F. A simulated soil moisture based drought analysis for the United States. J. Geophys. Res. D Atmos. 2004, 109, 1–19. [Google Scholar] [CrossRef]
- Ford, T.W.; Quiring, S.M. Comparison of Contemporary In Situ, Model, and Satellite Remote Sensing Soil Moisture With a Focus on Drought Monitoring. Water Resour. Res. 2019, 55, 1565–1582. [Google Scholar] [CrossRef]
- Spennemann, P.C.; Rivera, J.A.; Saulo, A.C.; Penalba, O.C. A Comparison of GLDAS Soil Moisture Anomalies against Standardized Precipitation Index and Multisatellite Estimations over South America. J. Hydrometeorol. 2015, 16, 158–171. [Google Scholar] [CrossRef]
- Yang, S.; Meng, D.; Gong, H.; Li, X.; Wu, X. Soil Drought and Vegetation Response during 2001–2015 in North China Based on GLDAS and MODIS Data. Adv. Meteorol. 2018, 2018, 1–14. [Google Scholar] [CrossRef] [Green Version]
- Zhang, L.; Liu, Y.; Ren, L.; Jiang, S.; Yang, X.; Yuan, F.; Wang, M.; Wei, L. Drought Monitoring and Evaluation by ESA CCI Soil Moisture Products Over the Yellow River Basin. IEEE J. Sel. Top. Appl. Earth Obs. Remote Sens. 2019, 12, 3376–3386. [Google Scholar] [CrossRef]
- Jain, V.K.; Jain, M.K.; Pandey, R.P. Effect of the Length of the Streamflow Record on Truncation Level for Assessment of Streamflow Drought Characteristics. J. Hydrol. Eng. 2014, 19, 1361–1373. [Google Scholar] [CrossRef]
- Link, R.; Wild, T.B.; Snyder, A.C.; Hejazi, M.I.; Vernon, C.R. 100 years of data is not enough to establish reliable drought thresholds. J. Hydrol. X 2020, 7, 100052. [Google Scholar] [CrossRef]
- McKee, T.B.; Doesken, N.J.; Kleist, J. The Relationship of Drought Frequency and Duration to Time Scales. In Proceedings of the Eighth Conference on Applied Climatology, Anaheim, CA, USA, 17–22 January 1993; American Meteorological Society: Boston, MA, USA; pp. 17–22. [Google Scholar]
- Guttman, N.B. Comparing the Palmer Drought Index and the Standardized Precipitation Index. J. Am. Water Resour. Assoc. 1998, 34, 113–121. [Google Scholar] [CrossRef]
- Shukla, S.; Wood, A.W. Use of a standardized runoff index for characterizing hydrologic drought. Geophys. Res. Lett. 2008, 35, 1–7. [Google Scholar] [CrossRef] [Green Version]
- Hao, Z.; AghaKouchak, A. Multivariate Standardized Drought Index: A parametric multi-index model. Adv. Water Resour. 2013, 57, 12–18. [Google Scholar] [CrossRef] [Green Version]
- Khan, M.I.; Zhu, X.; Arshad, M.; Zaman, M.; Niaz, Y.; Ullah, I.; Anjum, M.N.; Uzair, M. Assessment of spatiotemporal characteristics of agro-meteorological drought events based on comparing Standardized Soil Moisture Index, Standardized Precipitation Index and Multivariate Standardized Drought Index. J. Water Clim. Chang. 2020, 11, 1–17. [Google Scholar] [CrossRef]
- Xu, Y.; Wang, L.; Ross, K.; Liu, C.; Berry, K. Standardized Soil Moisture Index for Drought Monitoring Based on Soil Moisture Active Passive Observations and 36 Years of North American Land Data Assimilation System Data: A Case Study in the Southeast United States. Remote Sens. 2018, 10, 301. [Google Scholar] [CrossRef] [Green Version]
- Jollife, I.T.; Cadima, J. Principal component analysis: A review and recent developments. Philos. Trans. R. Soc. A Math. Phys. Eng. Sci. 2016, 374, 20150202. [Google Scholar] [CrossRef]
- Bayissa, Y.A.; Tadesse, T.; Svoboda, M.; Wardlow, B.; Poulsen, C.; Swigart, J.; van Andel, S.J. Developing a satellite-based combined drought indicator to monitor agricultural drought: A case study for Ethiopia. GIScience Remote Sens. 2019, 56, 718–748. [Google Scholar] [CrossRef]
- Schwartz, C. Applications of Earth Observations for the Development of A Customized Composite Drought Index In Pakistan; University of Alabama: Huntsville, AL, USA, 2021; p. 84. [Google Scholar]
- Khadr, M. Recent Trends and Fluctuations of Rainfall in the Upper Blue Nile River Basin. In The Handbook of Environmental Chemistry; Springer Science and Business Media LLC: Berlin, Germany, 2017; pp. 451–466. ISBN 1433-6863r978-3-642-03970-6. [Google Scholar]
- Elkollaly, M.; Khadr, M.; Zeidan, B. Drought analysis in the Eastern Nile basin using the standardized precipitation index. Environ. Sci. Pollut. Res. 2018, 25, 30772–30786. [Google Scholar] [CrossRef]
- Elshaikh, A.; Yang, S.; Jiao, X.; Elbashier, M. Impacts of Legal and Institutional Changes on Irrigation Management Performance: A Case of the Gezira Irrigation Scheme, Sudan. Water 2018, 10, 1579. [Google Scholar] [CrossRef] [Green Version]
Figure 1.
The Nile basin (A) The major sub-basins of the Nile River and its countries; (B) The Blue Nile basin and the main flow stations of the Blue Nile and at the downstream sub-basin; (C) the topography of the Blue Nile Basin.
Figure 1.
The Nile basin (A) The major sub-basins of the Nile River and its countries; (B) The Blue Nile basin and the main flow stations of the Blue Nile and at the downstream sub-basin; (C) the topography of the Blue Nile Basin.

Figure 2.
CHIRPS Sample for the Blue Nile in (A) August 2002, (B) August 2017.

Figure 3.
Evapotranspiration data from GLDAS-Noah V2 product for the Blue Nile, (A) August 2002; (B) August 2017.
Figure 3.
Evapotranspiration data from GLDAS-Noah V2 product for the Blue Nile, (A) August 2002; (B) August 2017.

Figure 4.
Soil moisture data from GLDAS-Noah v2 for the Blue Nile, (A) August 2002; (B) August 2017.
Figure 4.
Soil moisture data from GLDAS-Noah v2 for the Blue Nile, (A) August 2002; (B) August 2017.

Figure 5.
The temporal length of each parameter and the BN combined index.

Figure 6.
Methodology flowchart for creating the composite drought index.

Figure 7.
The 12 months SPI for the Blue Nile Basin.

Figure 8.
The seasonal SPI during kiremit and belg, and the annual SPI.

Figure 9.
Monthly time steps SPI-1, SSI-1, and sETI-1.

Figure 10.
Six-month time steps SPI-6, SSI-6, and sETI-6.

Figure 11.
Annual SRI at EL Diem station for time series from 1966 to 2019.

Figure 12.
Annual SRI at Khartoum station for time series from 1966 to 2019.

Figure 13.
Correlation results among monthly indices with a time lag up to 6 months.

Figure 14.
Correlation results among indices of 3-month accumulation period with a time lag up to 6 months.
Figure 14.
Correlation results among indices of 3-month accumulation period with a time lag up to 6 months.

Figure 15.
Correlation results among indices of 6-month accumulation period with a time lag up to 6 months.
Figure 15.
Correlation results among indices of 6-month accumulation period with a time lag up to 6 months.

Figure 16.
Correlation results among indices of 9-month accumulation period with a time lag up to 6 months.
Figure 16.
Correlation results among indices of 9-month accumulation period with a time lag up to 6 months.

Figure 17.
Annual BNI for time series from 1966 to 2019.

Figure 18.
The 12-month BNI and SRI at El Diem.


Table 1.
BNI drought classification based on SPI.
| Drought Category | BNI Values |
|---|---|
| Extremely Wet | >2 |
| Severely Wet | 1.5 to 1.99 |
| Moderately Wet | 1.0 to 1.49 |
| Mildly Wet | 0 to 0.99 |
| Mildly Dry | 0 to −0.99 |
| Moderately Dry | −1.0 to −1.49 |
| Severely Dry | −1.50 to −1.99 |
| Extremely Dry | <−2.0 |
Table 2.
The Pearson’s correlation coefficient (r) matrix at different timescales of the drought indices.
Table 2.
The Pearson’s correlation coefficient (r) matrix at different timescales of the drought indices.
| Index | SPI1 | SRI1 | sETI1 | SSI1 | SPI3 | SRI3 | sETI3 | SSI3 | SPI6 | SRI6 | sETI6 | SSI6 | SPI9 | SRI9 | sETI9 | SSI9 | SPI12 | SRI12 | sETI12 | SSI12 |
|---|---|---|---|---|---|---|---|---|---|---|---|---|---|---|---|---|---|---|---|---|
| SPI1 | 1 | |||||||||||||||||||
| SRI1 | 0.75 | 1 | ||||||||||||||||||
| sETI1 | 0.87 | 0.88 | 1 | |||||||||||||||||
| SSI1 | 0.76 | 0.91 | 0.90 | 1 | ||||||||||||||||
| SPI3 | 0.83 | 0.88 | 0.96 | 0.92 | 1 | |||||||||||||||
| SRI3 | 0.40 | 0.83 | 0.75 | 0.80 | 0.80 | 1 | ||||||||||||||
| sETI3 | 0.52 | 0.80 | 0.85 | 0.84 | 0.89 | 0.93 | 1 | |||||||||||||
| SSI3 | 0.35 | 0.73 | 0.69 | 0.85 | 0.76 | 0.92 | 0.91 | 1 | ||||||||||||
| SPI6 | 0.19 | 0.61 | 0.57 | 0.67 | 0.64 | 0.86 | 0.87 | 0.87 | 1 | |||||||||||
| SRI6 | −0.26 | 0.36 | 0.15 | 0.33 | 0.20 | 0.71 | 0.56 | 0.67 | 0.81 | 1 | ||||||||||
| sETI6 | −0.18 | 0.36 | 0.27 | 0.39 | 0.34 | 0.74 | 0.71 | 0.75 | 0.89 | 0.92 | 1 | |||||||||
| SSI6 | −0.34 | 0.18 | 0.05 | 0.32 | 0.14 | 0.58 | 0.48 | 0.72 | 0.74 | 0.87 | 0.86 | 1 | ||||||||
| SPI9 | −0.45 | 0.15 | −0.08 | 0.14 | −0.03 | 0.49 | 0.35 | 0.52 | 0.63 | 0.90 | 0.84 | 0.83 | 1 | |||||||
| SRI9 | −0.59 | −0.06 | −0.33 | −0.19 | −0.31 | 0.25 | −0.01 | 0.17 | 0.18 | 0.68 | 0.50 | 0.56 | 0.75 | 1 | ||||||
| sETI9 | −0.72 | −0.21 | −0.38 | −0.26 | −0.34 | 0.21 | 0.07 | 0.19 | 0.36 | 0.74 | 0.72 | 0.69 | 0.82 | 0.80 | 1 | |||||
| SSI9 | −0.63 | −0.29 | −0.45 | −0.15 | −0.40 | 0.01 | −0.14 | 0.22 | 0.12 | 0.48 | 0.37 | 0.74 | 0.60 | 0.65 | 0.63 | 1 | ||||
| SPI12 | 0.04 | 0.23 | 0.06 | 0.08 | 0.06 | 0.24 | 0.07 | 0.09 | 0.10 | 0.30 | 0.10 | 0.12 | 0.21 | 0.46 | 0.19 | 0.15 | 1 | |||
| SRI12 | 0.02 | 0.26 | 0.09 | 0.06 | 0.06 | 0.29 | 0.11 | 0.09 | 0.09 | 0.36 | 0.14 | 0.11 | 0.16 | 0.55 | 0.24 | 0.14 | 0.77 | 1 | ||
| sETI12 | 0.05 | 0.23 | 0.13 | 0.02 | 0.07 | 0.24 | 0.16 | 0.02 | 0.09 | 0.26 | 0.21 | 0.01 | 0.12 | 0.35 | 0.38 | −0.04 | 0.49 | 0.62 | 1 | |
| SSI12 | −0.02 | 0.00 | −0.05 | 0.21 | −0.02 | 0.01 | −0.04 | 0.26 | −0.01 | 0.05 | −0.04 | 0.40 | 0.02 | 0.10 | −0.03 | 0.69 | 0.14 | 0.16 | −0.10 | 1 |
Table 3.
The correlation coefficient between the monthly BNI and the monthly SPI, SRI, sETI and SSI.
Table 3.
The correlation coefficient between the monthly BNI and the monthly SPI, SRI, sETI and SSI.
| Index | SPI | SRI | sETI | SSI |
|---|---|---|---|---|
| BNI | 0.98 | 0.96 | 0.96 | 0.97 |
Publisher’s Note: MDPI stays neutral with regard to jurisdictional claims in published maps and institutional affiliations. |
© 2022 by the authors. Licensee MDPI, Basel, Switzerland. This article is an open access article distributed under the terms and conditions of the Creative Commons Attribution (CC BY) license (https://creativecommons.org/licenses/by/4.0/).
Share and Cite
MDPI and ACS Style
Ali, M.; Ghaith, M.; Wagdy, A.; Helmi, A.M. Development of a New Multivariate Composite Drought Index for the Blue Nile River Basin. Water 2022, 14, 886. https://doi.org/10.3390/w14060886
AMA Style
Ali M, Ghaith M, Wagdy A, Helmi AM. Development of a New Multivariate Composite Drought Index for the Blue Nile River Basin. Water. 2022; 14(6):886. https://doi.org/10.3390/w14060886
Chicago/Turabian StyleAli, Marwa, Mostafa Ghaith, Ahmed Wagdy, and Ahmed M. Helmi. 2022. "Development of a New Multivariate Composite Drought Index for the Blue Nile River Basin" Water 14, no. 6: 886. https://doi.org/10.3390/w14060886
Note that from the first issue of 2016, this journal uses article numbers instead of page numbers. See further details here.