
Environmental Decision Support Systems as a Service: Demonstration on CE-QUAL-W2 Model


1
Department of Natural Resources and Environmental Management, University of Haifa, 2611001 Haifa, Israel
2
Independent Researcher, 821735 Hadera, Israel
3
Department of Civil and Environmental Engineering, Portland State University, Portland, OR 97201, USA
*
Author to whom correspondence should be addressed.
Water 2022, 14(6), 885; https://doi.org/10.3390/w14060885
Submission received: 23 January 2022
/
Revised: 22 February 2022
/
Accepted: 7 March 2022
/
Published: 11 March 2022
(This article belongs to the Special Issue Decision Support Tools for Water Quality Management)
Abstract
:An environmental decision support system (EDSS) can be used as an important tool for the rehabilitation and preservation of ecosystems. Nonetheless, high assimilation costs (both money and time) are one of the main reasons these tools are not widely adopted in practice. This work presents a low-cost paradigm of “EDSS as a Service.” This paradigm is demonstrated for developing a water quality EDSS as a service that utilizes the well-known CE-QUAL-W2 model as a kernel for deriving optimized decisions. The paradigm is leveraging new open-source technologies in software development (e.g., Docker, Kubernetes, and Helm) with cloud computing to significantly reduce the assimilation costs of the EDSS for organizations and researchers working on the rehabilitation and preservation of water bodies.
1. Introduction
The rehabilitation and preservation of ecosystems is an important goal to achieve globally. There are multiple incentives for meeting this goal: preserving biodiversity, mitigating climate change, and assuring future generations can enjoy clean air, land, and water. Water quantity and quality management play an essential part in these conservation efforts. Therefore, environmental agencies usually include in their guidelines the need for stakeholder involvement in the decision-making process [1,2]. A standard tool that can engage stakeholders in decision making is a decision support system (DSS). Specifically, in the case of environmental usage, the tool is often called an environmental decision support system (EDSS). In water-quality-related issues, a water quality model can be used as a kernel in the EDSS that can guide recommendations to stakeholders. The recommendations may include the impacts of changes in flow quantity and water quality, managing the day-to-day operations of hydropower dams (or any water infrastructure) under environmental restrictions, or responding to an unexpected pollution event.
To meet conservation efforts in aquatic environments, agencies often recommend developing EDSSs to guide decision making and engage stakeholders [1]. These EDSSs are part of a holistic system for allocating and managing water to maintain ecosystem functions. Nevertheless, such tools are still not widely adopted in practice. The following factors make an EDSS expensive (in resources and time) to implement: (1) Model assimilation and calibration; (2) Lack of required expertise in the use and interpretation of EDSSs; (3) Software development for the implementation and maintenance of the EDSS; (4) Computer resources needed for the model computation and hosting the EDSS application (the installation of the software on a computer or a server).
This study shows how the last two challenges could be addressed using a low-cost implementation that leverages new open-source technologies in software development (e.g., Docker, Kubernetes, and Helm) and cloud computing. We demonstrate a water quality EDSS that uses the CE-QUAL-W2 model [3] as a kernel to explore the water quality changes resulting from different management decisions.
The choice of using the CE-QUAL-W2 model was based on a simple approach for selecting a water quality model from Mateus [4]. This approach was based on a systematic review of the main available models. The review consisted of the model abilities, dissemination and publications, and the usage experience. In all categories, the CE-QUAL-W2 model was ranked first. CE-QUAL-W2 can simulate the hydrodynamics and water quality of rivers, lakes, reservoirs, and estuaries [3]; thus, when used as a kernel in an EDSS, it allows decision support for multiple types of aquatic environments.
Furthermore, this model is open-source, which means that there is no need to invest money in buying licenses to use the model, and users that are familiar with software programming can add features. Mateus [4] also notes that CE-QUAL-W2 simulations are relatively fast and require low computational power compared to other models. The model input and output are based on text files. The model itself is an executable that can be run without interacting with a graphical user interface (GUI). This model design acts as a simple external application programing interface (API) that allows another software program (e.g., EDSS) to change the inputs, execute the model, and analyze the results. CE-QUAL-W2 was implemented in over 2000 sites in 116 countries [5]. The source code is actively maintained with bug fixes and new features by Portland State University, USA.
As a result, we chose the CE-QUAL-W2 model as the kernel of our EDSS. The main objective of a water quality EDSS is to provide a simple interface for stakeholders to better plan future projects in the wetland or handle the day-to-day operations of the wetland. Using CE-QUAL-W2 for decision making is not new; several attempts have been made over the years to use the model in decision-making contexts.
For example, Eturak [6] used the model as part of an EDSS to understand the impact of the planned “Buyuk Melen” reservoir on its watershed in Turkey. As the reservoir was still in the planning stages, there was no option to calibrate the model. Thus, the model’s setup was conducted according to the best knowledge available at the time. Next, a few scenarios with different flow volumes of domestic and industrial wastewater were chosen, and their simulations were executed using the model. Later, the results were compared and graphed for the stakeholders to discuss the implications of different scenarios.
The manual approach of Eturak [6], where a modeler familiar with CE-QUAL-W2 can provide the needed analysis, highlights several drawbacks: (1) Execution of the different scenarios needs continuous involvement of the modeler in the process, including setting up the different inputs, executing model runs, and then comparing the results. Thus, the modeler must be involved in the detailed manual planning of each scenario proposed by the stakeholders. This increases the cost of using the EDSS and makes the discussion/involvement of the stakeholders more difficult; (2) The manual process is time-consuming. For complex models, the stakeholders will need to wait for a report from the modeler for each of their scenario requests. This does not allow for an active discussion in which scenarios are refined rapidly. In practice, it is hard to define the scenarios in advance. Usually, the scenarios are refined during an active discussion between the stakeholders (partly by seeing how the model reacts). As such, an active discussion is critical, and it could be conducted only if the EDSS can be used in real-time without manually performing time-consuming analyses.
Kumar [7] developed a user-friendly web-based EDSS to interact with an existing calibrated CE-QUAL-W2 model in the Occoquan Reservoir in northern Virginia, USA. The purpose was to enhance stakeholders’ interaction with the modeling software. The implementation included a multi-part system controlled by the user from a web server. The web server connects to a bridge module that sends the requests for model execution and mines the results. The final part utilizes other computers and servers on the local network to execute the different model runs in parallel. The results are then returned to the user for analysis.
In the experiment of Kumar [7], the downsides of the manual approach in Erturk [6] were addressed. Thus, the modeler was no longer involved in the process, and the parallel execution on multiple computers facilitated fast computation. Still, the work of Kumar [7] had some other downsides: (1) Not all parts of the EDSS were reusable. Furthermore, the code was written specifically for the subject reservoir. Any other user who wants to use this infrastructure will need to change the source code to match their system; (2) On each computer in the network intended to be used for model execution, a piece of supporting software must be installed. This requires information technology (IT) to set up and maintain the software; (3) Part of the implementation uses ArcGIS, which is a licensed program.
Shaw [8] implemented a very different approach for the Cumberland River system. This study described a method for computing hourly power generation schemes for a hydropower reservoir using high-fidelity models, surrogate modeling techniques, and optimization methods. The predictive power of the high-fidelity hydrodynamic and water quality model CE-QUAL-W2 was emulated by an artificial neural network (ANN) then integrated into a genetic algorithm (GA) optimization approach to maximize the hydropower generation subject to constraints on dam operations and water quality. By using the ANN as a surrogate model, Shaw [8] demonstrated a way to address the drawbacks of both Eturak [6] and Kumar [7]. The surrogate model ran within 2 s versus a 6 min runtime in the CE-QUAL-W2 model of the considered system. This allowed running the EDSS on a single six-core computer in a reasonable time frame.
Nevertheless, the surrogate approach still had some drawbacks: (1) There was still a potential and need to implement and train a surrogate model in addition to the CE-QUAL-W2 model. For the training itself, many CE-QUAL-W2 runs were needed. In this case, 729 runs were made; (2) The solution was implemented using MATLAB and its “Neural Network” and “Optimization” toolboxes, which are licensed software.
Given the examples above, there is still a potential to develop a reusable EDSS solely based on open-source tools without investing in expensive computation hardware. This could be achieved by combining the software as a service (SaaS) paradigm with cloud computing technology. According to market analysts, such as the international data corporation (IDC), cloud computing has become more common and accessible over the last decade. They also show a trend of reduced usage costs for the users. They indicate that these factors have made SaaS usage more popular in the last few years. This conclusion is derived from the immense growth in revenues and market share for SaaS in the public cloud [9]. This can be explained by the benefits of this paradigm for the customers and the service providers. Some of these benefits are: (1) Customers do not need to have any computer infrastructure or install software on computers; (2) The company does not need to pay for computers and servers that are not in use and can adopt a “pay as you use” model; (3) The virtually “infinite” parallelization option for on-demand computer power allows the companies to offer efficient solutions for any number of customers, termed scalability; (4) The company eliminates the need for local IT personnel to maintain the computation infrastructure and server rooms; (5) Updates are deployed quickly to all users. Similar to our paradigm, other studies discussed leveraging cloud computing and SaaS for environmental software development. Swain [10] presented an open-source platform for interacting and developing environmental applications. The platform was designed to simplify modern web-based software development over cloud infrastructure for scientists. The study focused on simplifying the development but did not consider computational aspects, such as parallel execution of the models. Ercan [11] developed a cloud-based SaaS to calibrate the Soil and Water Assessment Tool [12]. The proposed solution is based on a single algorithm that utilizes multiple (up to 256) central processing units (CPU) for parallel executions of the model [11]. Recently, Li [13] implemented a Docker-based [14] framework for developing EDSS that can be used on cloud infrastructure [13]. Considering the examples above, they all support the need to simplify environmental software development for computationally intensive applications, making EDSS more accessible to environmental scientists, hydrologists, and stakeholders. This study continues these efforts while focusing on a water quality EDSS that requires intensive computational power. We propose a generic EDSS, which is based on the popular CE-QUAL-W2 model for: (1) Simplifying and reducing the needed amount of software development by requiring only a decision algorithm development instead of a full computational infrastructure; (2) Supporting flexible scaling of computer resources of parallel model runs, which are expected in decision problems that involve water quality simulations. To achieve the above goals, we explore new technologies that simplify and reduce the cost of assimilating a water quality EDSS. Thus, offering a new paradigm of “Water Quality EDSS as a Service”, an open-source computationally efficient platform that can support any EDSS algorithm application utilizing the CE-QUAL-W2 model. This paradigm can make these tools more accessible and approachable for use by environmental agencies and organizations, enabling advanced decision making and increasing stakeholder engagement.
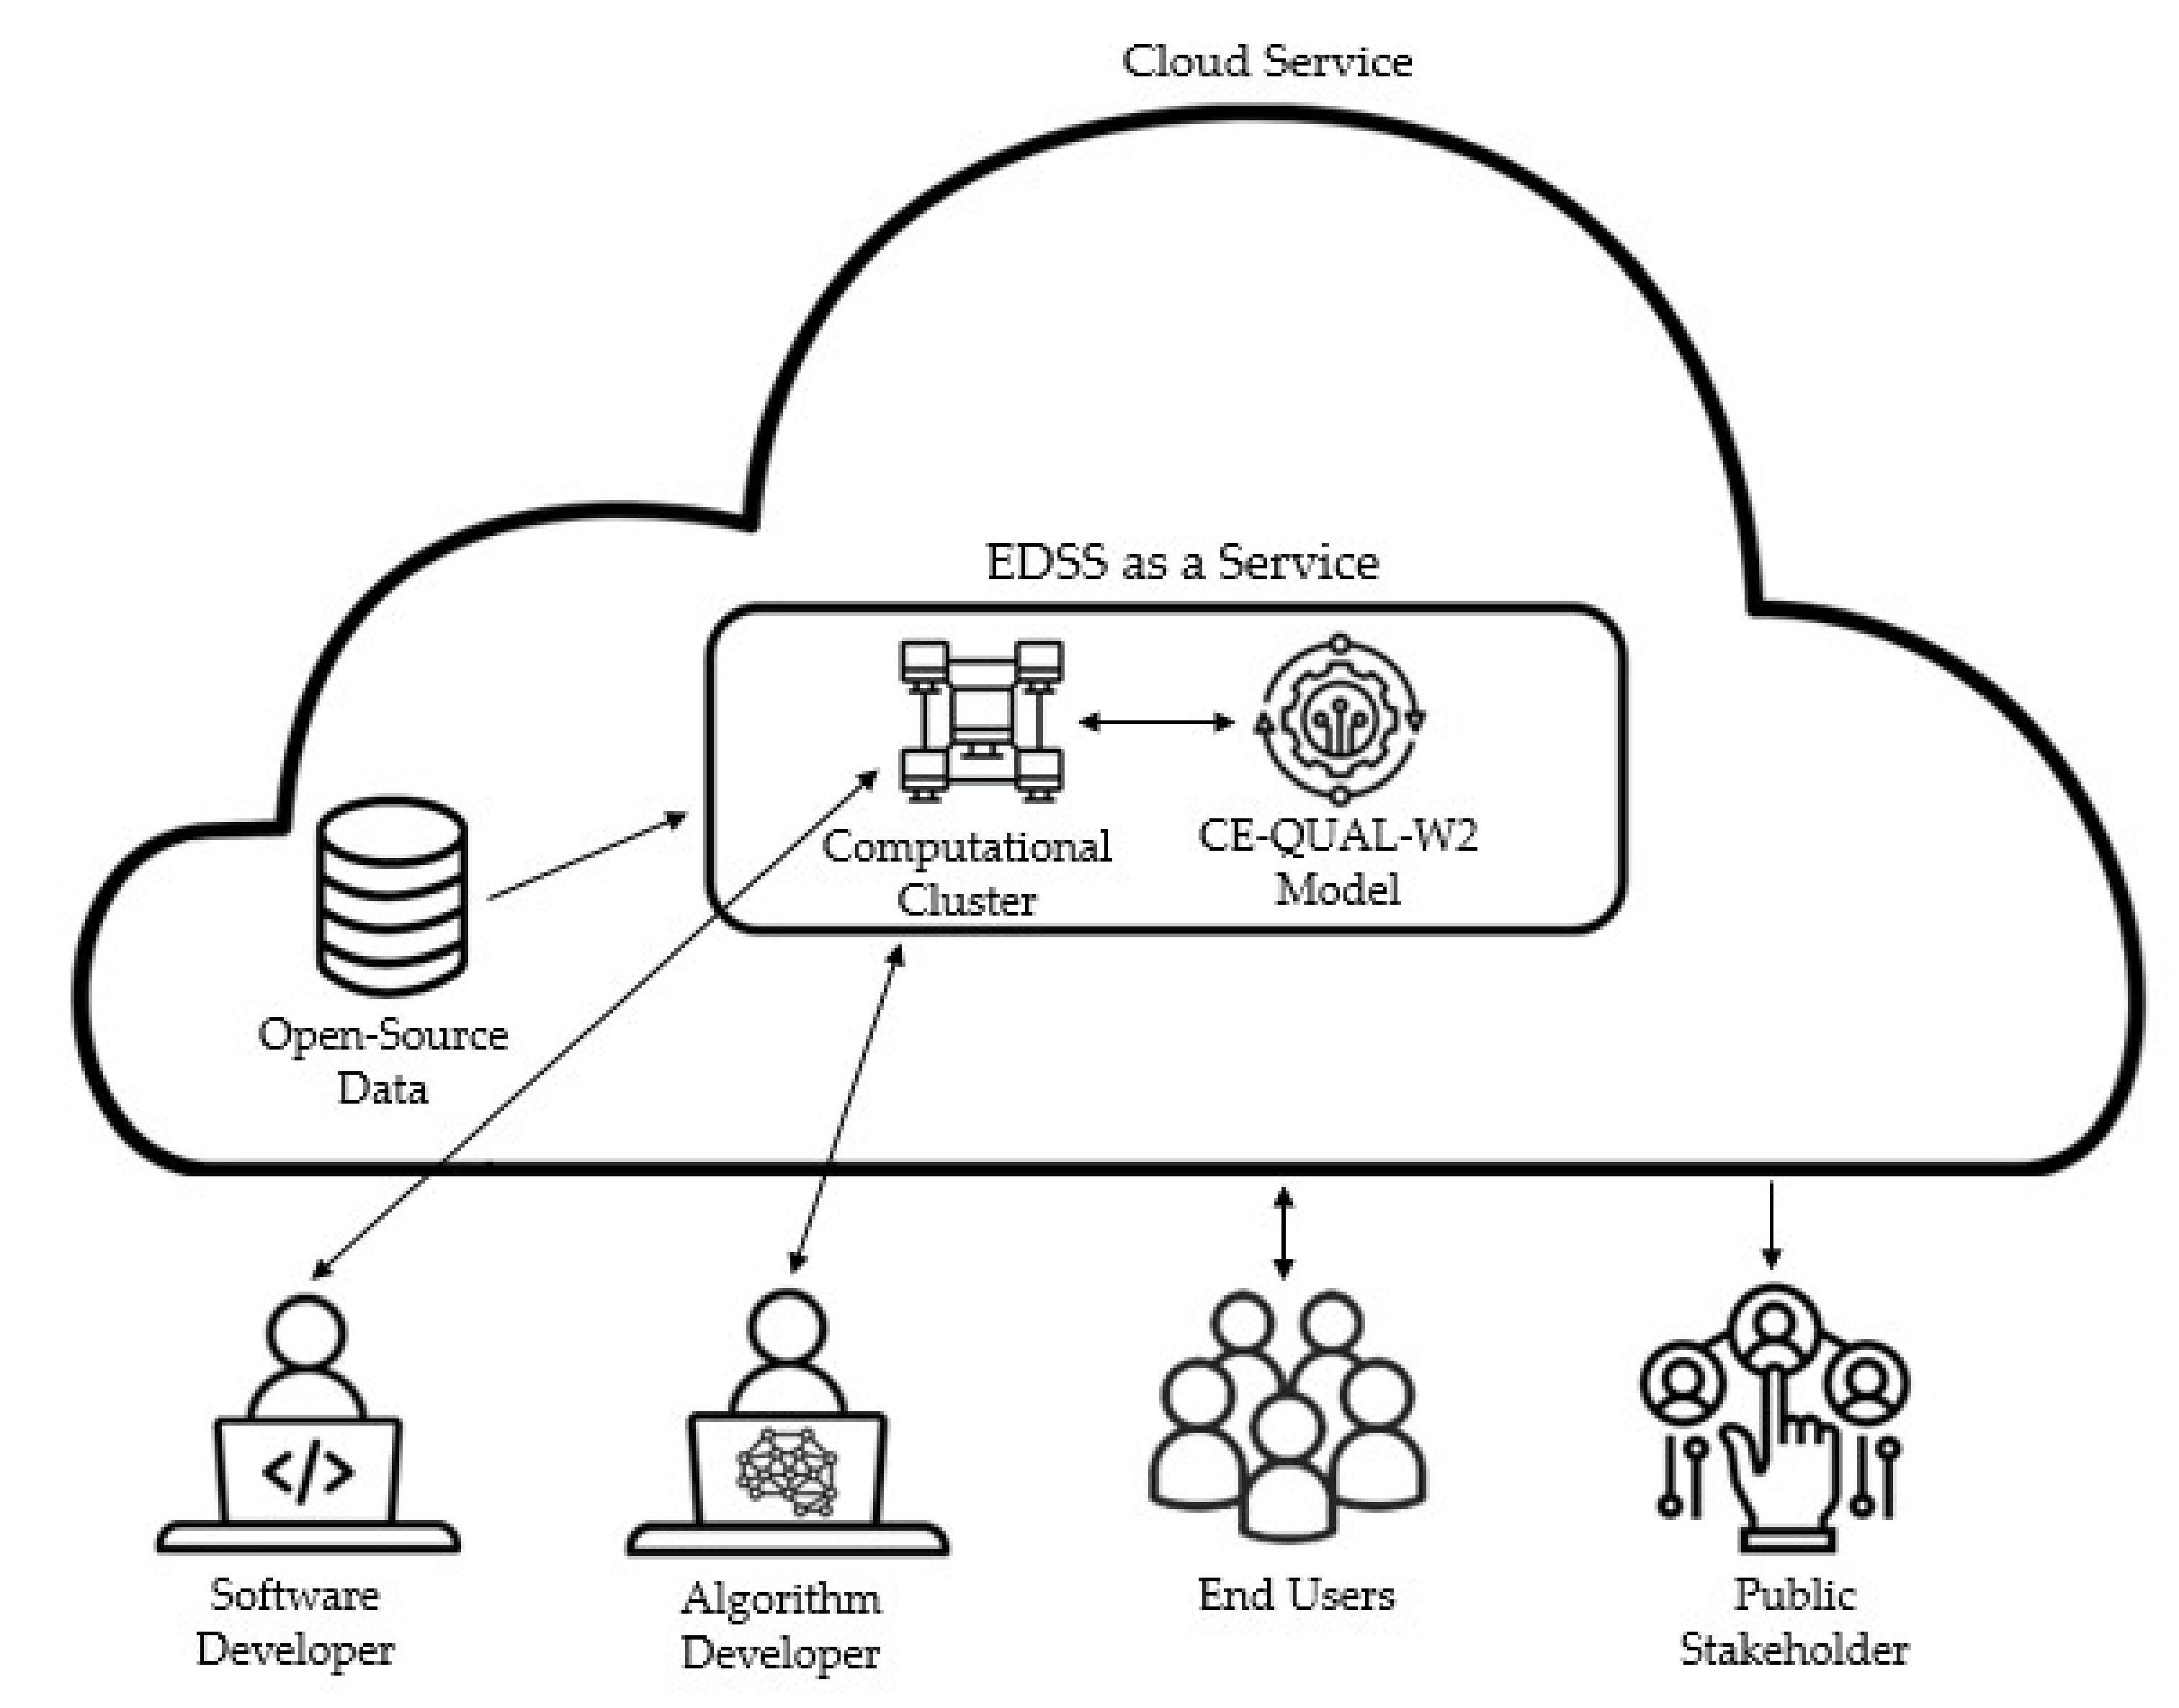
The conceptual framework of EDSS as a service is illustrated in Figure 1. The EDSS system disconnects the different levels of complexity between software and algorithm developers and the different end-users. The software developer maintains the computational infrastructure, and, thus, they are responsible for advanced software development (e.g., configuring the computational cluster). In contrast, the algorithm developer interacts only with a higher level of the EDSS using a simple interface; thus, little experience in cloud computing technology is expected from the algorithm developer. Relying on a simple interface, water engineers and/or hydrologists with experience in algorithm development can use the system to distribute heavy computational tasks in the cloud. End-users (e.g., a watershed manager) can define scenarios and initiate runs using a web-based interface without the need to make changes to the EDSS; hence, the arrow shown in Figure 1 does not reach a deep level as in the case of the developers. Lastly, the public stakeholders can view and comment on the published scenarios and results (i.e., they have one-directional arrow in Figure 1).
2. Methods
The main principles that guide us in designing and constructing the EDSS as a service are: (1) Supplying a low-cost solution and keeping it an open-source service that can be changed and enhanced by future users; (2) Allowing the use of any cloud computing provider, such as AWS, Google, Azure, or Alibaba.
2.1. Solution Architecture
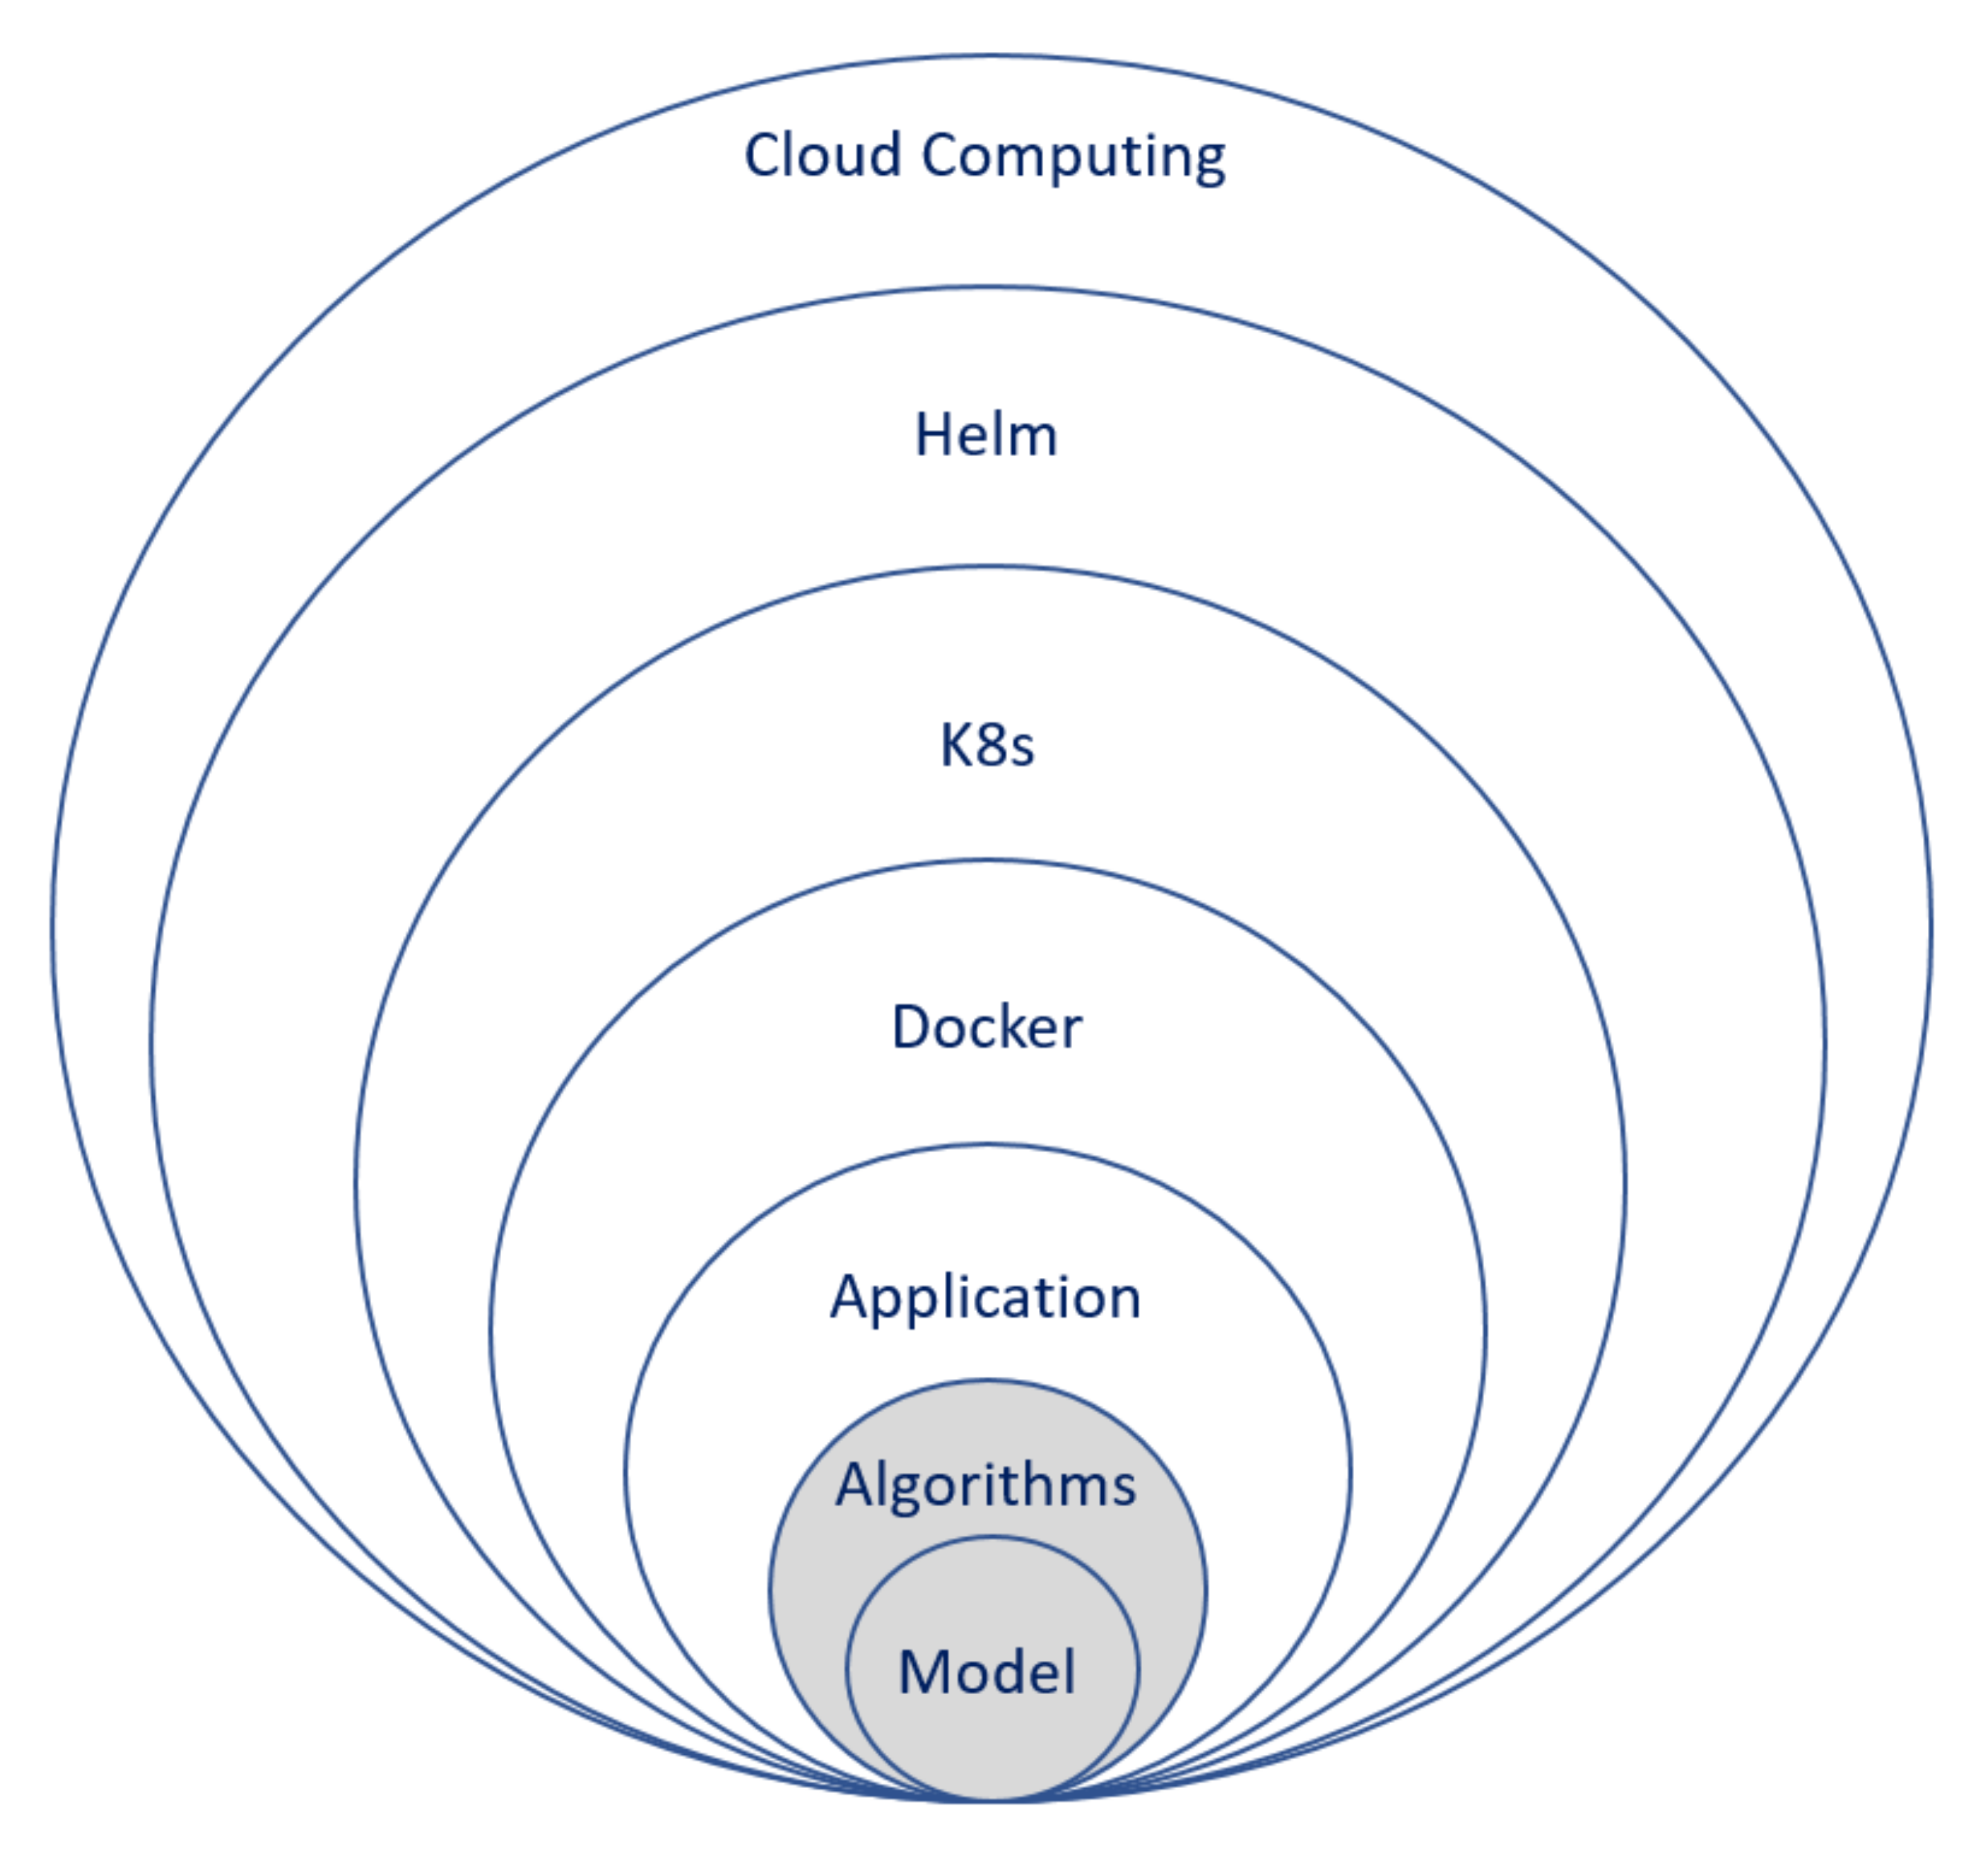
In order to meet the goals above for developing an EDSS as a service, an architectural design based on the latest available technology for SaaS is proposed. Figure 2 shows the encapsulation of the different core layers, followed by a detailed description of each of the core layers.
Model—The CE-QUAL-W2 model is the heart of the EDSS, as it is used as a kernel for decision making. The model was released only for Windows operating systems in the last few years. Although it is possible to develop this kind of EDSS as a service in a Windows environment [14], we prefer the Linux environment since it is more cloud-environment-compatible and license-free. For that need, we created an open-source GitHub project. This project holds the needed files and instructions to compile the CE-QUAL-W2 source code to be executed in a Linux environment [15]. Besides the model executable, this layer also includes the user-specific input files of a calibrated model ready for simulations. These input files are the template that the application layer changes according to the algorithm requirements.
Algorithm—The layer of the algorithm is responsible for two primary operations: (1) Deciding on the needed permutation for the model simulations and supplying the different parameters needed for the model input files for each of these simulations; (2) Analyzing the results of the simulations according to the developed algorithm. A single EDSS can hold multiple algorithms for the user. For example, an algorithm can conduct a grid search for the best matching simulation output according to the user input targets, while another algorithm can plot a specific model output parameter as recorded in all the different simulations.
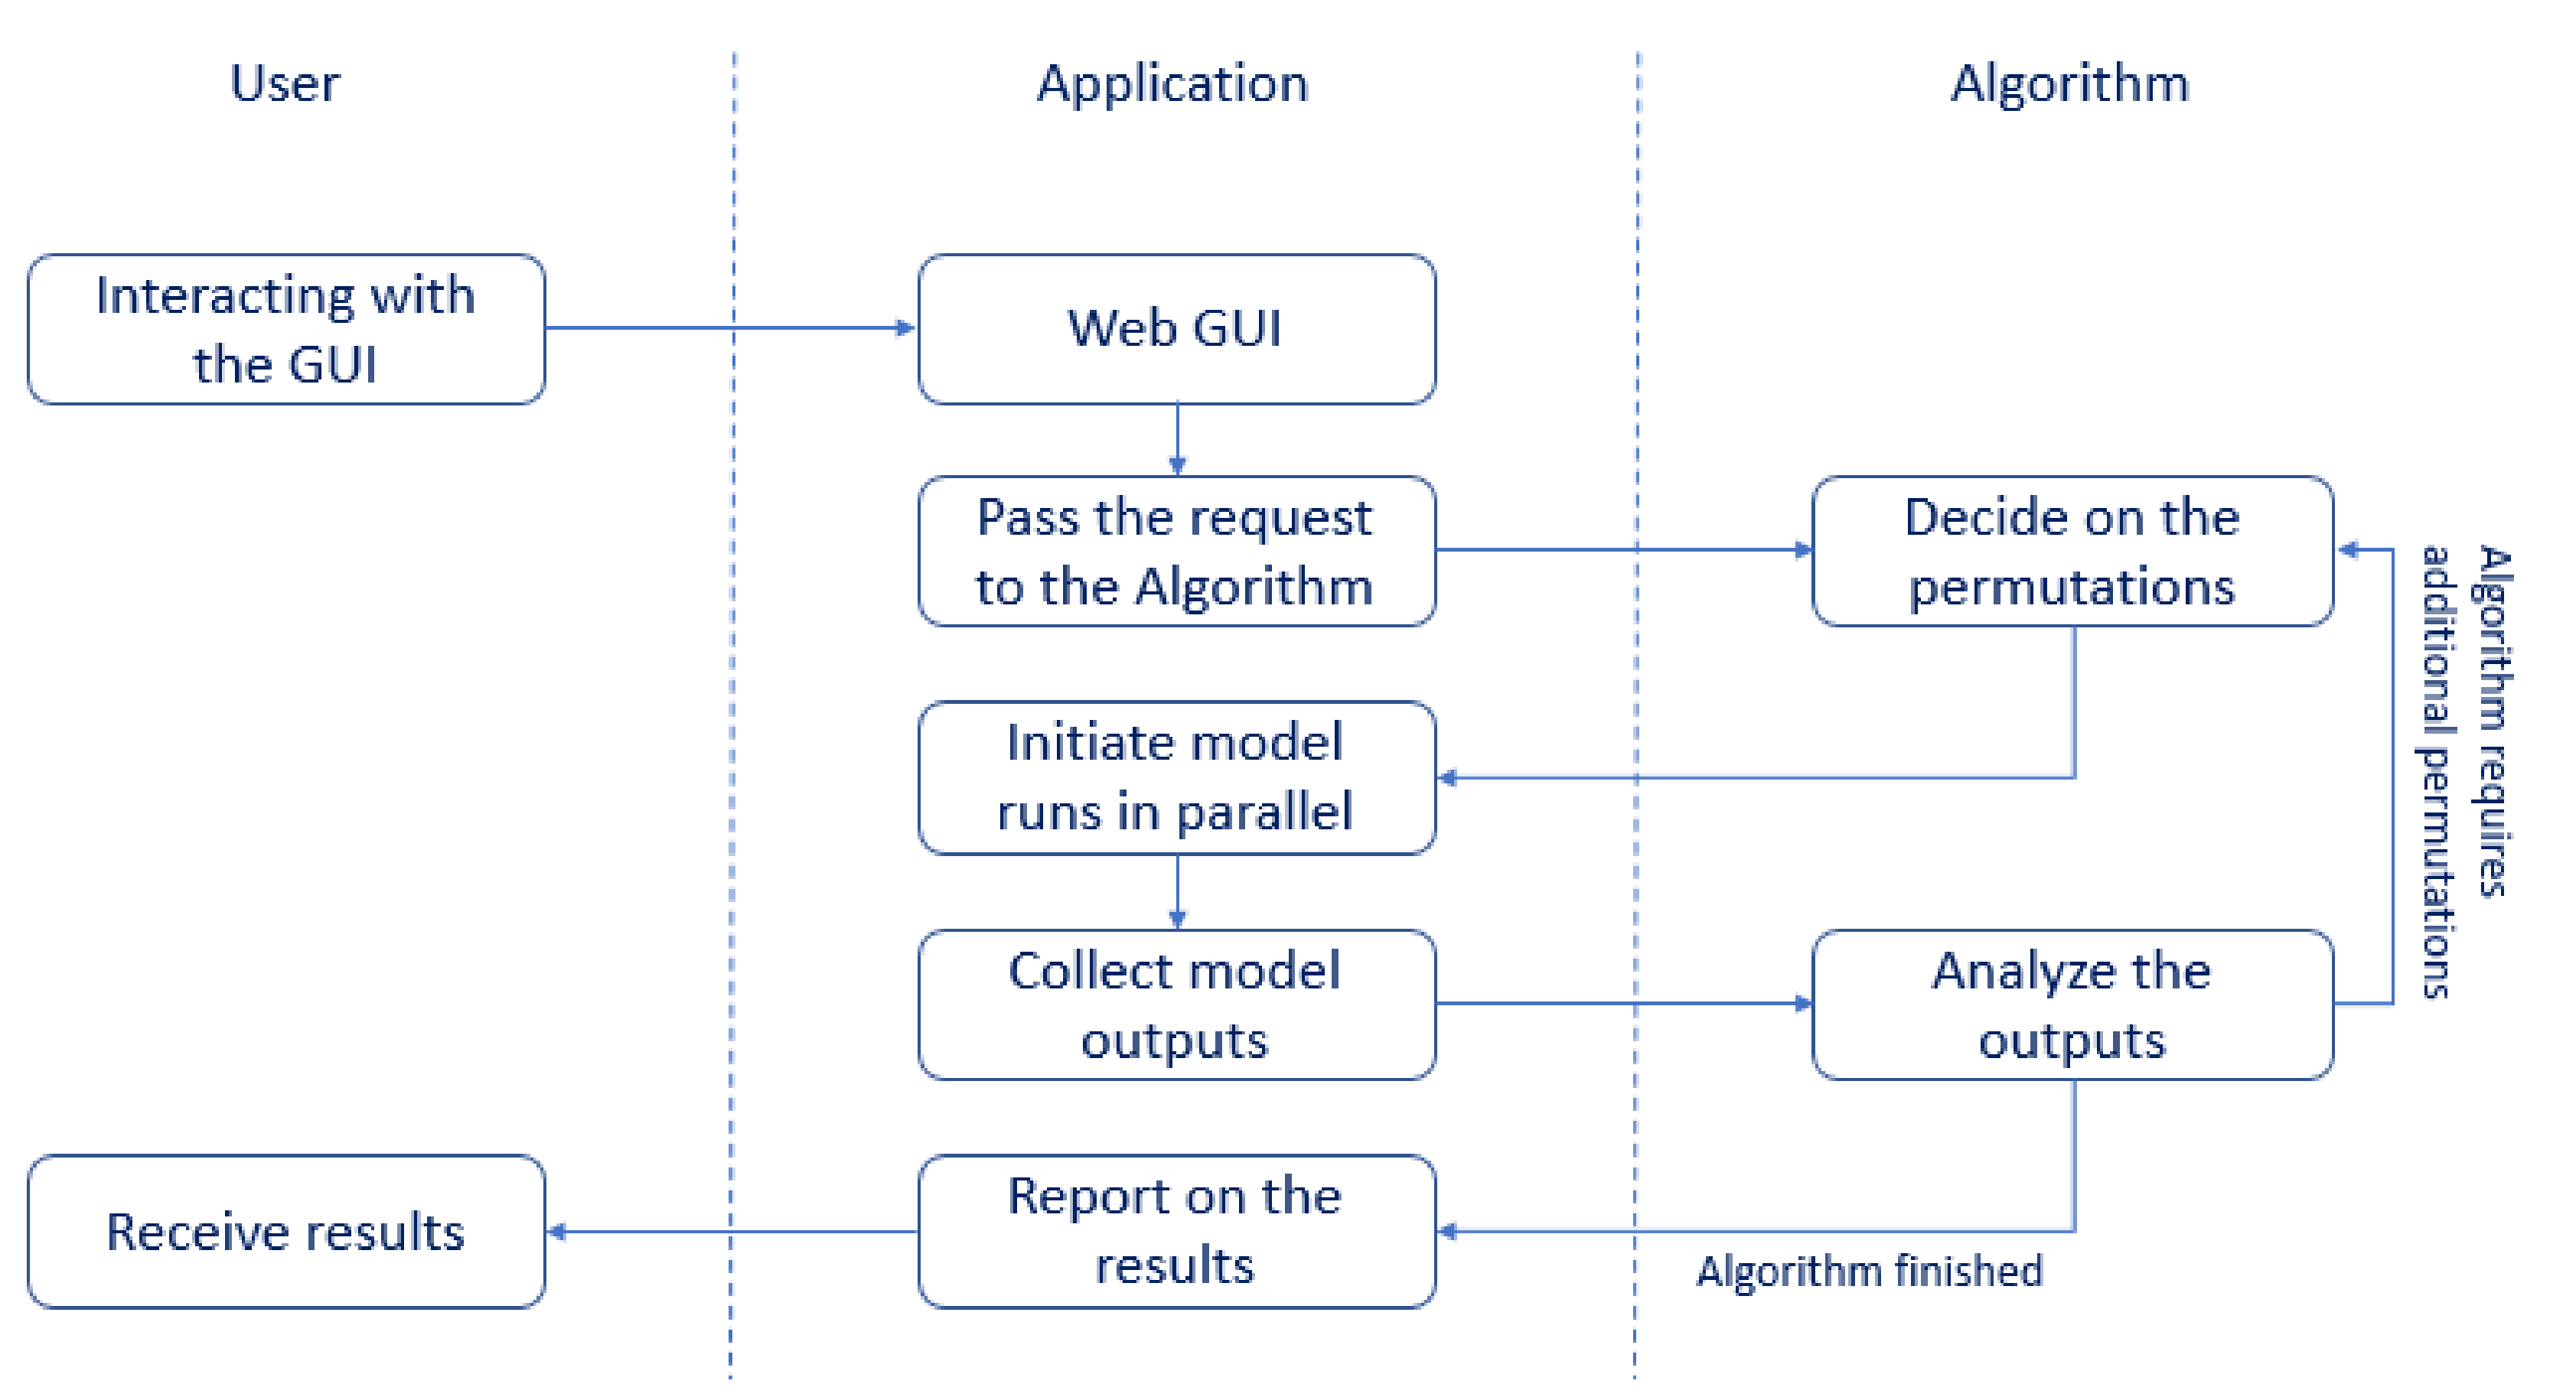
Application—This layer has five different responsibilities. The interactions of these responsibilities are described in Figure 3: (1) Provide a simple web-based user interface for the EDSS, allowing users to send requests to the service (Figure 4). An example of a user request is shown later in Section 2.2.1; (2) Pass the user request to the algorithm layer and receive a response from the algorithm to specify the needed simulation permutations list; (3) Initiate parallel model execution requests according to the permutations; (4) Collect all the model simulation results and send them back to the algorithm once the model simulations are completed. (5) Obtain the analyzed results from the algorithm and display them back in the web user interface.
Docker—The Docker container layer was developed to allow the isolation and packaging of the software together with all of its dependencies. A container is an executable that can be run on any computing environment without worrying about the operating system or the hardware infrastructure [14]. The Docker infrastructure is free for use and holds the following benefits for the EDSS implementation: (1) No need to set up the infrastructure or the operating system; (2) It can run on cloud resources as well as on a single computer. The Docker engine can be run on Windows, Linux, or Mac operating systems; (3) Cloud providers supply a cost-effective and straightforward interface for setting up your application using Docker. In this EDSS as a service, a single Docker container was created. This container can be used either for running the application or running individual model simulations in parallel across multiple model executions.
Kubernetes (K8s)—This is a layer developed after organizations started to adopt the Docker solution and were looking for a way to streamline the scaling process and coordinate multiple services encapsulated as Docker containers. Scaling involves initiating more and more Docker containers according to the demand [16]. K8s is also open-source. In this EDSS, K8s is leveraged to manage the runs of multiple Docker containers in parallel, each running a different model simulation. This allows for the automatic scaling of the cloud computing power when needed, allowing the user to benefit from the “pay as you use” cloud computing model while all the simulations are performed in parallel.
Helm—This is a packaging manager for Kubernetes that was developed to simplify the deployment of K8s applications according to a predefined configuration file [17]. It is free to use and allows the easy and repeatable deployment of this EDSS to the cloud computing environment. Deploying the EDSS to a cloud provider would require many manual configurations without using Helm.
Cloud computing—This final layer allows the EDSS as a service to hold one unit that runs only the user interface during the idle times and scale to multiple computer units when model simulations are needed. To make it generic for any cloud computing provider, the EDSS relies on basic computing building blocks used by all cloud computing providers. However, it could have been easier to design the system for a specific cloud computing provider. Where applicable, current industry standards and best practices were applied to ensure that the APIs and interfaces between the layers will be supported by various third-party tools to simplify the infrastructure layers’ deployment, scaling, and management.
2.2. Interfaces
There are two different personas for this EDSS, and dedicated interfaces were created to match their distinct needs. The first interface is for the user who wants to consult the EDSS about a water quality issue. The second persona is the EDSS developer (algorithm developer) who wants to introduce a new algorithm or enhance an existing algorithm.
2.2.1. User Interface
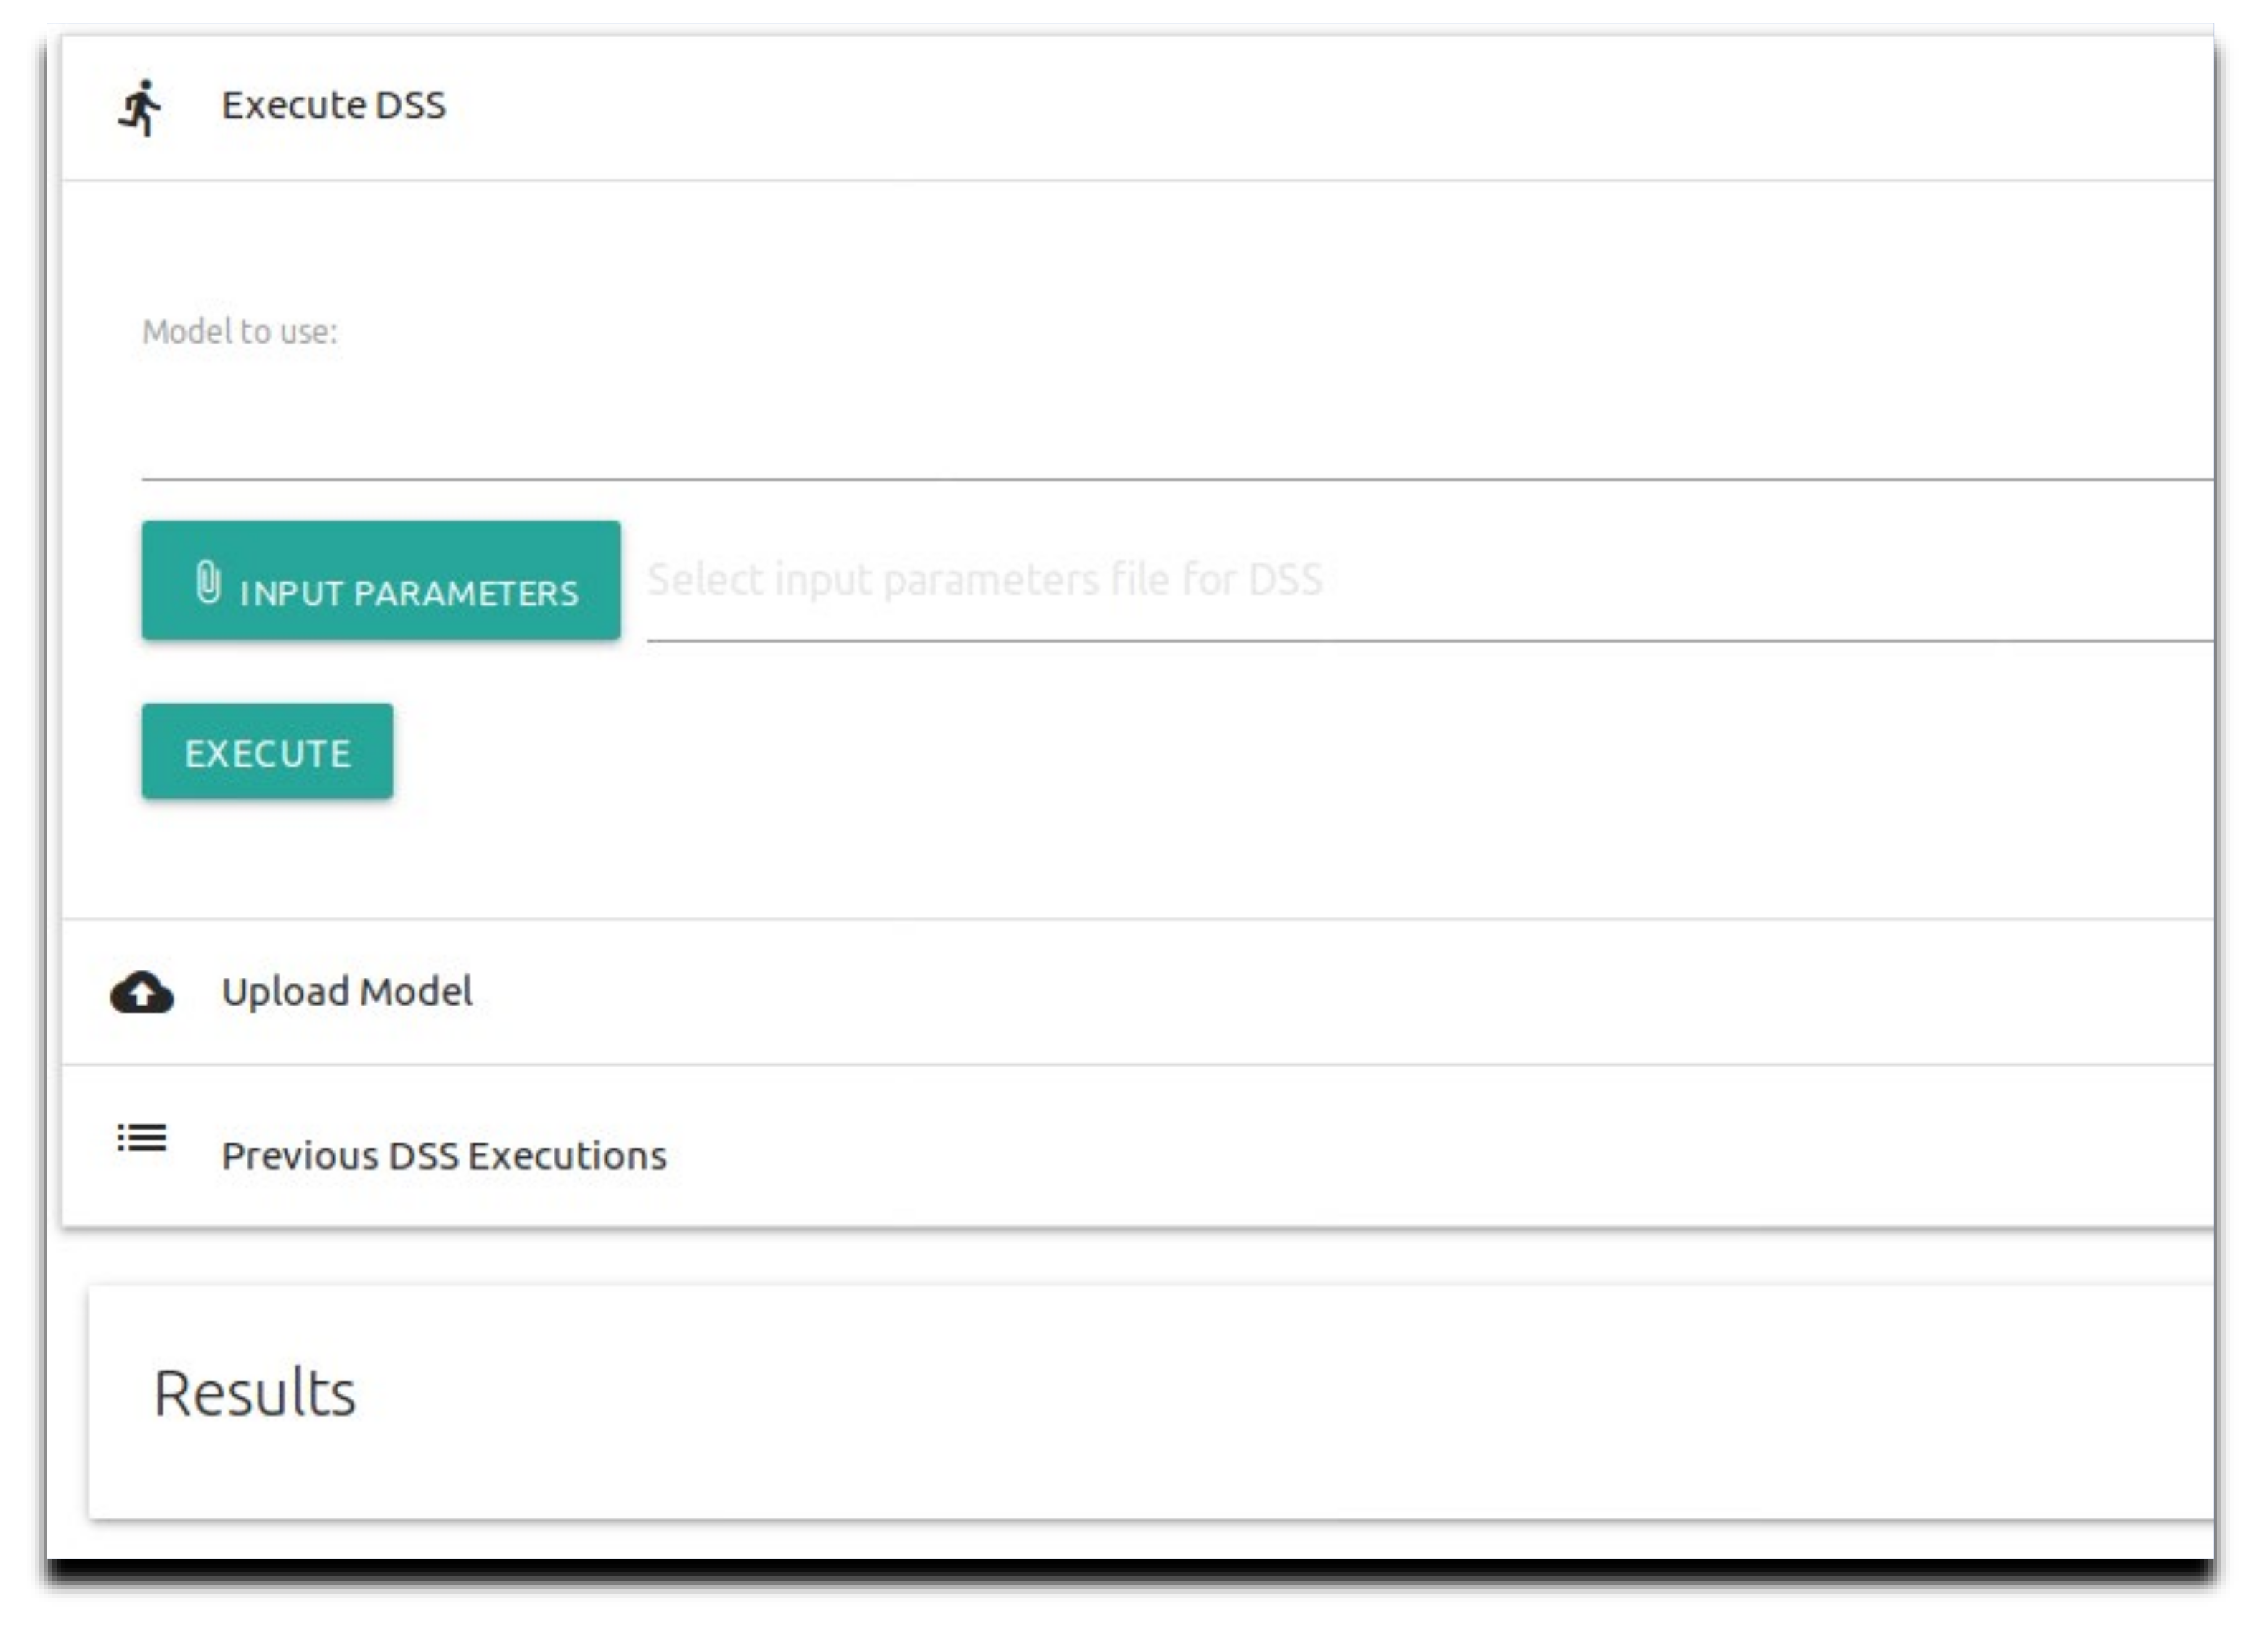
As displayed in Figure 4, the end-user interface is divided into three sections: (1) Initiate the model—The model user sets the model that will be run and the input parameters file for the algorithm. According to this input file, the algorithm determines the needed permutations and analyzes the runs. The input file can be in any format that the algorithm code can read. For the case study, we developed an algorithm that reads JSON format files due to their ease of processing using any computer programming language [18], but CSV or TXT could have been used as well. Once the input file is selected, the user can start the run by pressing the “Execute” button; (2) Upload model—The model user uploads their CE-QUAL-W2 model input files (not the executable itself) based on their calibration. This allows the user flexibility of usage without needing their CE-QUAL-W2 input files to be part of the source code that is wrapped with the Docker image; (3) Results—These are the results reported by the algorithm once all the model runs are finished and saved to a downloadable zip file. There is also an option to view the results from previous runs, as shown in Figure 4. In the EDSS GitHub repository, we provide a demo video tutorial with instructions on using the EDSS.
2.2.2. Algorithm Developer Interface
An EDSS can use numerous algorithms to support decision making, depending on the issue at hand. This current design of the EDSS as a service allows developing different algorithms and embedding them in the infrastructure for different use cases. The algorithm developer needs basic knowledge in Python programing language, working with Git source code control, and a basic understanding of cloud computer infrastructure to test the code change. The logic for each of the core modules is well isolated, and the linkages between the layers (Application -> Docker -> K8s -> Helm -> Cloud Computer) are clearly defined. The developer does not need to change the infrastructure layers to support a new algorithm.
For developing a new algorithm, the following steps need to be taken:
- Fork the current GitHub project [19] to a new one;
- Creating a Travis CI account [20]. The current GitHub project is configured to use Travis CI for running the unit tests and pushing the created Docker images to the Docker repository. The new Travis CI account needs to be configured in the GitHub project;
- Creating a Docker account [14] to hold the Docker images. All the mentioned accounts (GitHub, Travis CI, and Docker) are free for open-source projects;
- The “dss/scripts/build_and_push_to_docker_hub.sh” script needs to be updated to reference the new Docker repository. The Helm “dss/chart/wqdss/values.yaml” file needs to be updated to retrieve the Docker images from the correct repository;
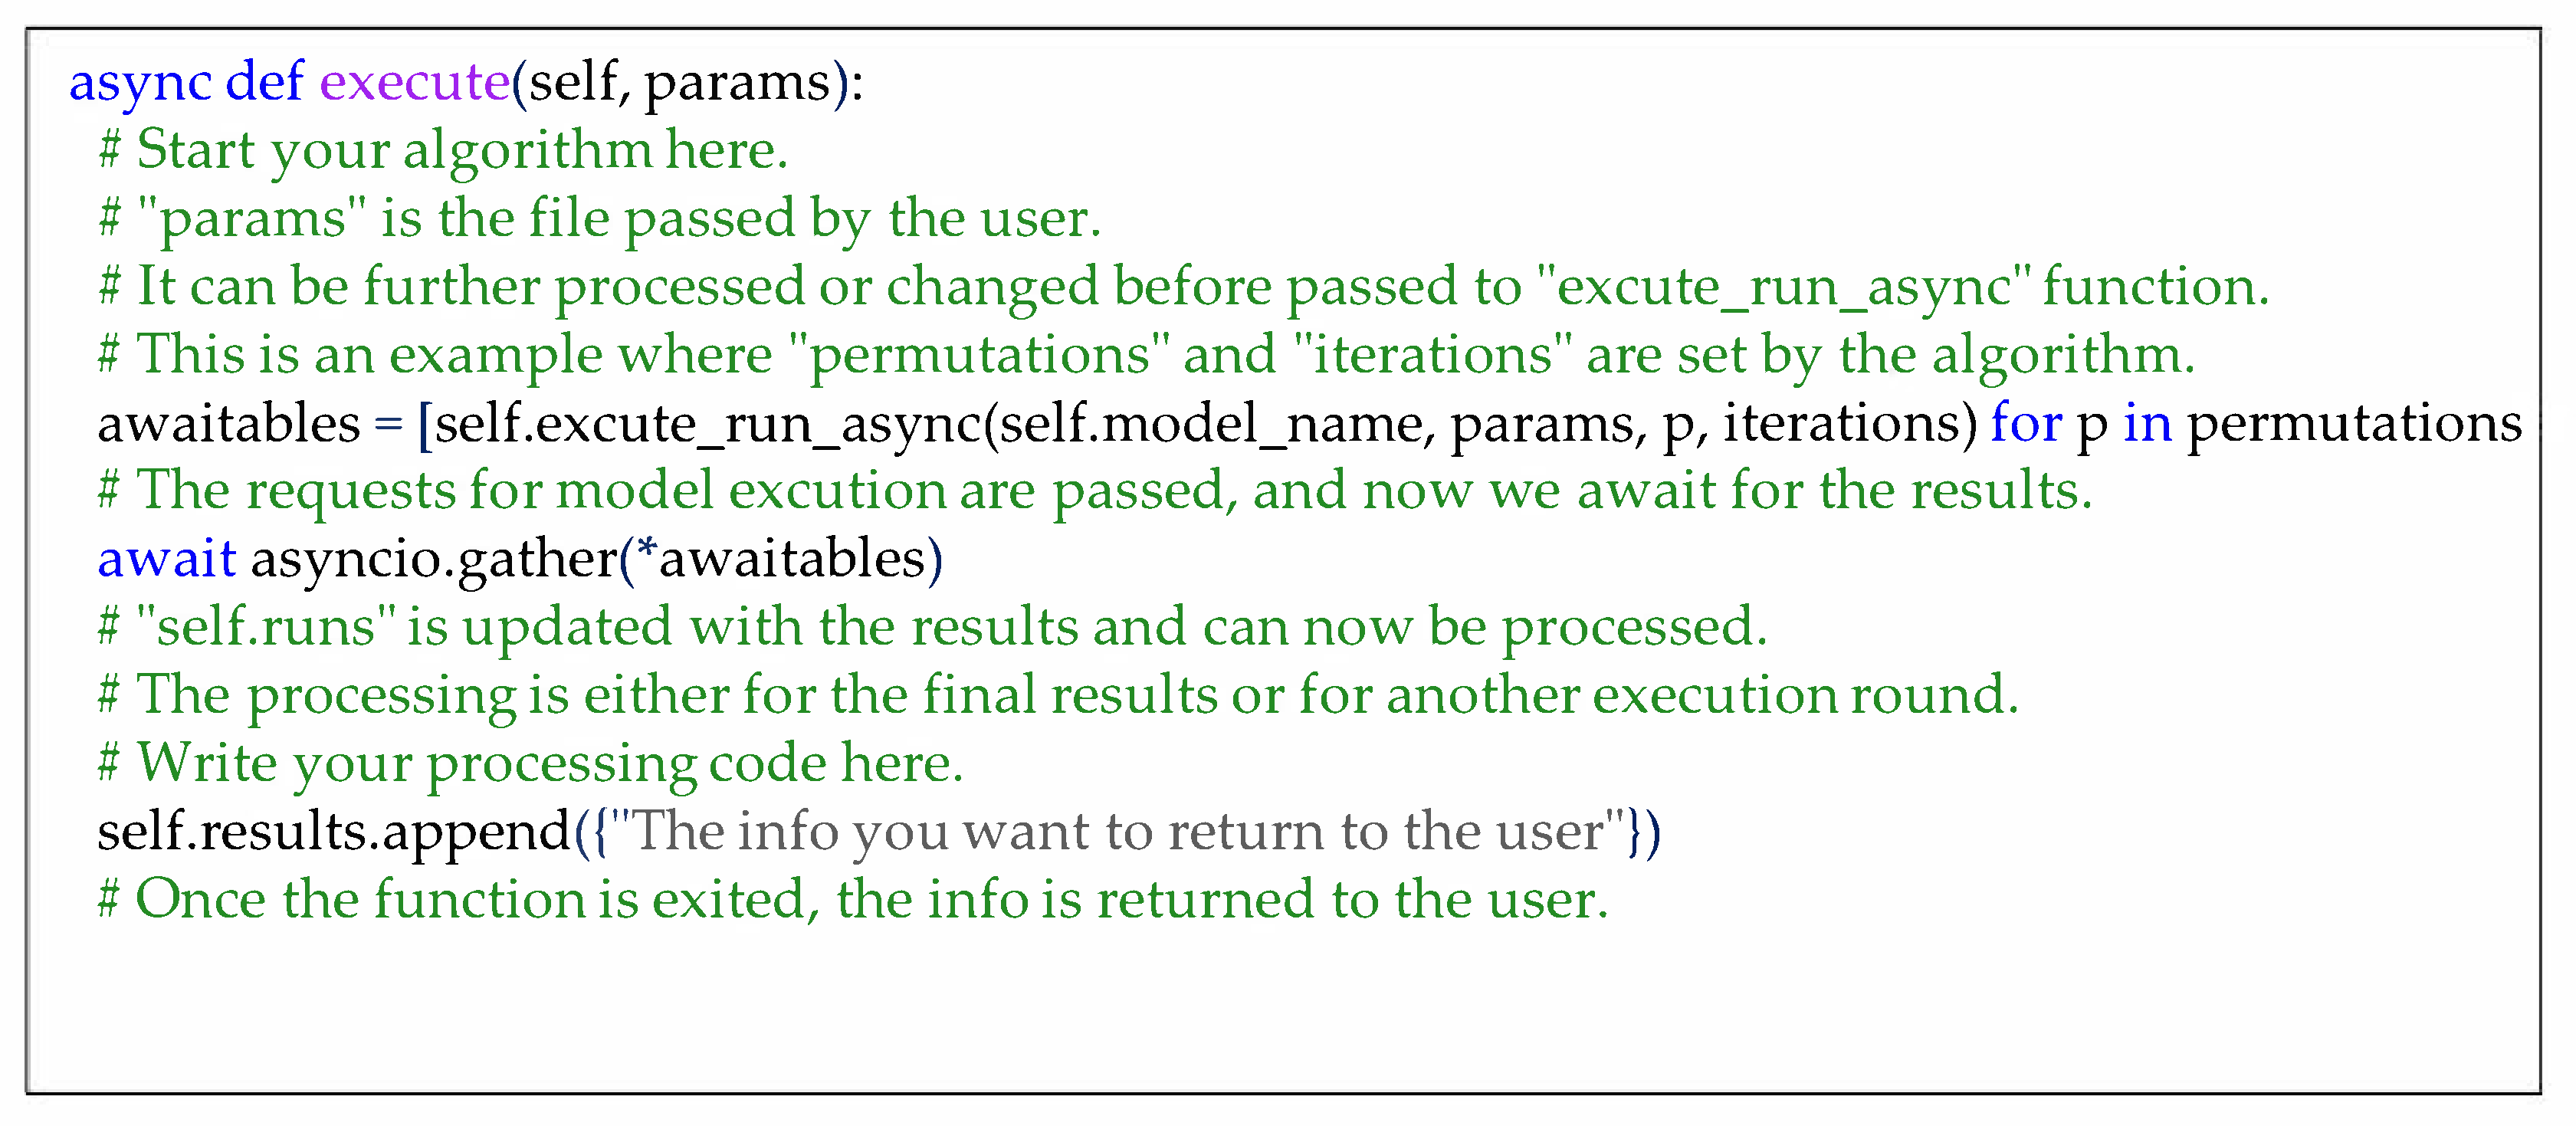
- As described in Figure A1 (See Appendix A), the entry function of the algorithm is “execute” under the “dss/src/wqdss/processing.py” Python module in the “Execution” class (see EDSS GitHub repository [19]). This is where the code should be changed for a new algorithm. In the case of several algorithms, the input file should include the algorithm name and the applicable function according to the selected algorithm that will be called from the “execute” function. In order to request multiple model simulations, the “execute_run_async” function needs to be called. Once this function returns, the results can be analyzed. This function can be called several times if needed. In order to publish the results, the class member “self.result” should be updated before exiting the “execute” function.
- The changed code then needs to be pushed to the main GitHub branch in order for the Travis CI to trigger the unit tests and publish the Docker image to the Docker repository;
- Deploying the code using Helm and verifying the EDSS behavior.
2.3. Cloud Computing Resources Scaling
When using cloud resources with this EDSS, the scaling is performed in two levels: (1) The horizontal pod autoscaling (HPA), which determines how many different Docker pods (images) are brought up in order to receive a request for model execution. The Docker images are configured to run a single model each. The Helm “values.yaml” file has an “hpa” section with an option to configure the minimum and the maximum number of pods brought up. In addition, the CPU target utilization percentage is also defined in this section. Once the CPU usage crosses this limit, a new pod is created; (2) The cloud provider K8s cluster auto-scaling. Once there are more CPU usage requests than cloud computing provides, the cluster will automatically bring up additional computer resources to run the pods according to the limits defined in the cluster settings.
Multiple factors will affect the scaling efficiency, starting from the chosen type of computer node that brings a different type of CPU generation. The run time of a single model can be cut in half between the newest CPU generation and old CPU generations. As mentioned above, different configurations of the K8s cluster and HPA will also have a significant effect on optimizing the scaling, where optimized scaling is defined as running all the model permutations in parallel. However, having optimized scaling comes with having more cloud computing nodes ready for execution, which results in a higher idle time cost since the user needs to pay for the running computing nodes even if almost no CPU is utilized. Thus, having optimized scaling is not necessarily a primary goal.
Nonetheless, we want to benchmark an optimal scaling performance for reference. The “Spokane river example” was used to demonstrate the scaling. This example is shipped with the CE-QUAL-W2 version 4.1 package. We changed the simulation days from 200-205 to 200-300 to create a longer run and highlight the benefit of the scaling. The Google Cloud provider was chosen to deploy the EDSS. The e2-standard-2 (2 vCPUs and 8GB memory) were used for the computing nodes. To perform ten parallel simulations, both the HPA and K8s cluster configurations were made such that all the needed computing nodes and pods were already up and running at the beginning of the execution. That is ten pods and five computing nodes. This run of ten model permutations took 26 min. Using the same configuration, only changing the HPA to allow a single pod (i.e., ten serial runs without parallelization) took 3 h and 50 min (23 × 10 = 230 min).
3. Case Study
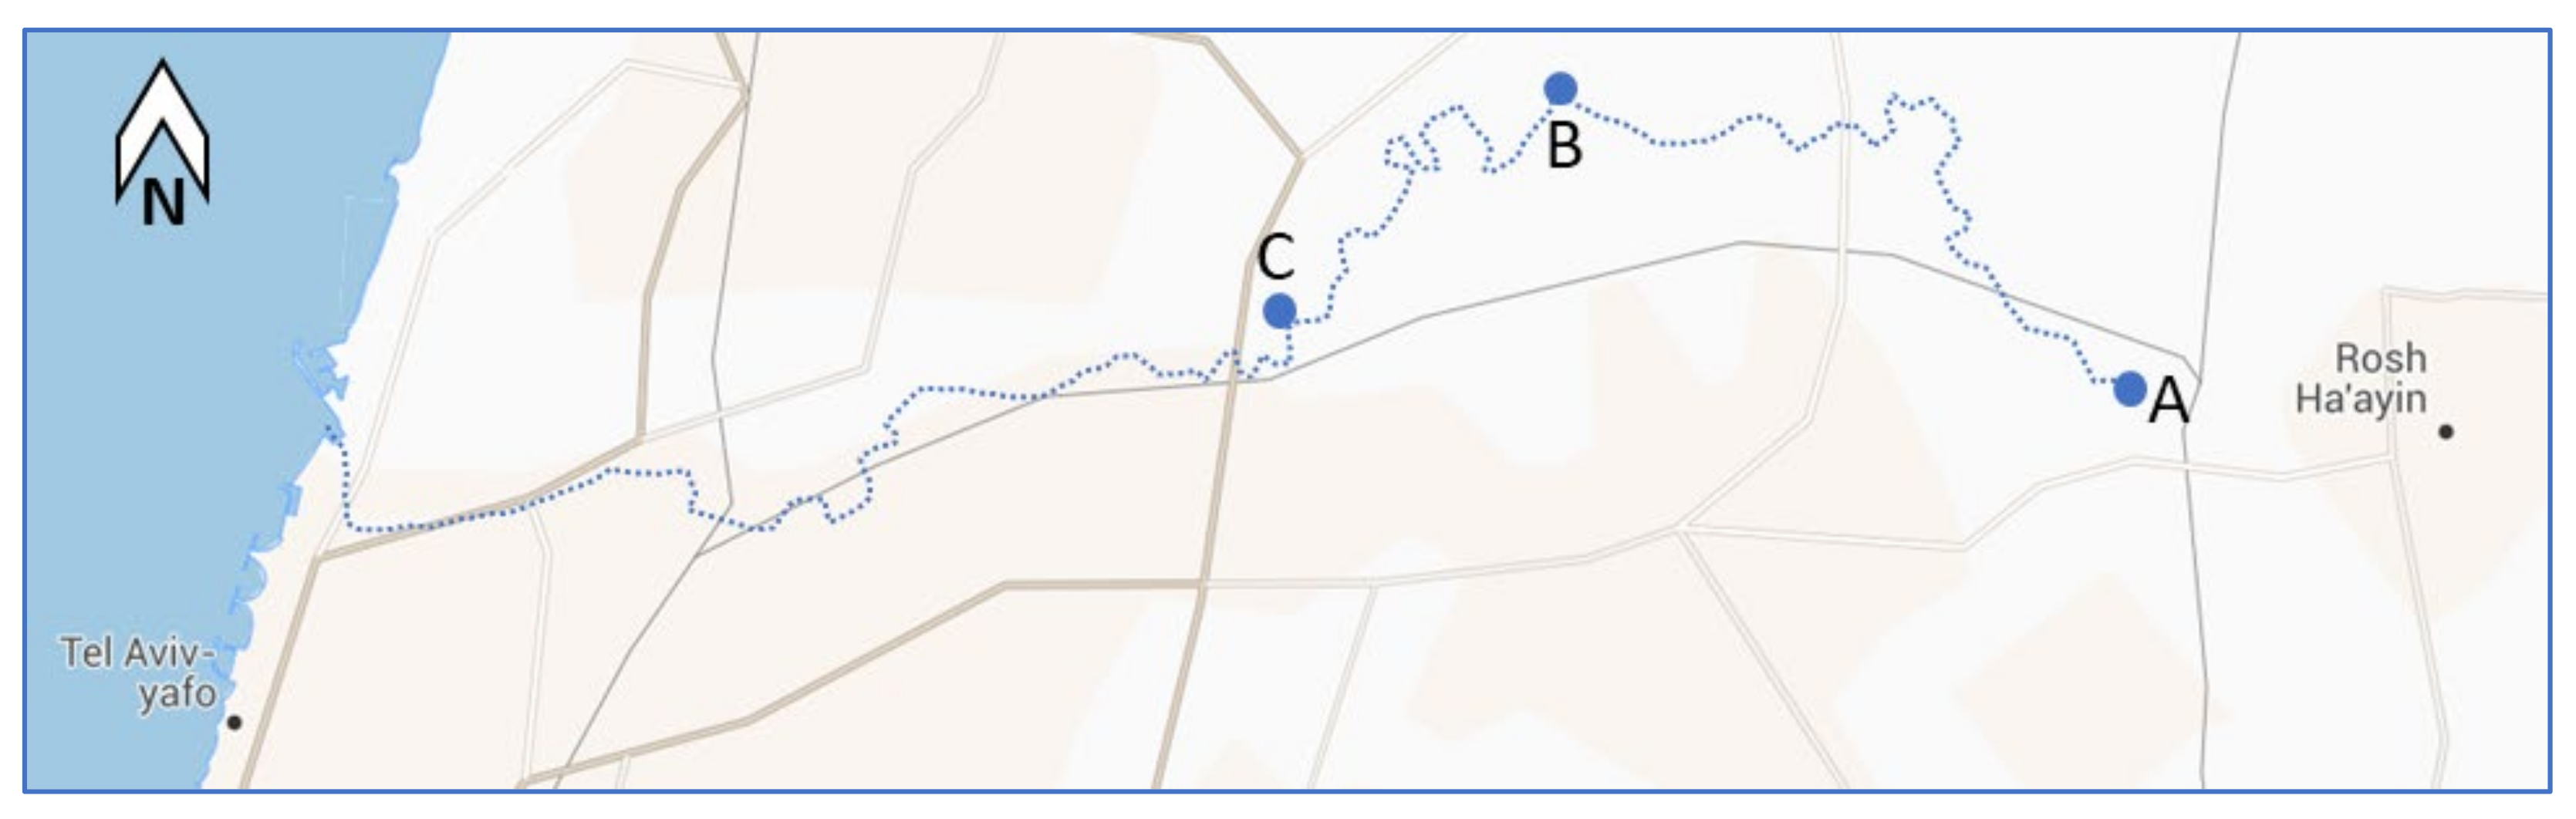
Israel has thirteen different drainage and river authorities, each responsible for streams and rivers in a different part of the country. Among their many duties, these authorities are also responsible for rehabilitating the rivers and streams and adapting them for leisure and recreational purposes [21]. Each authority is independent and relatively small (staffed with less than ten people). One of these authorities is the Yarqon River Authority (YRA), responsible for the Yarqon stream [22]. The Yarqon is a lowland coastal stream, about 28 km long, in central Israel that flows between a mix of agricultural fields and urban areas, ending in an estuary connected to the Mediterranean Sea, as shown in Figure 5. While the historical flow of the stream originated in natural springs, over the years, due to over-exploitation of the aquifer, the natural springs dried out [23]. Today, there are two different water sources for the stream: (1) Pumps supplying water from lower depths in the aquifer for the upstream part instead of the springs that dried out; (2) There are three different Wastewater Treatment Plants (WWTP) which discharge tertiary treated water in two locations in the middle section of the stream [23]. In order to promote preservation and recovery efforts, the YRA works with 18 different stakeholders [22], which poses a significant obstacle to reaching a consensus on rehabilitation efforts. We set out to show how a water quality EDSS as a service can serve as a solution for the YRA in its efforts to rehabilitate the stream.
3.1. Applying the CE-QUAL-W2
Water quality models are rarely used in Israel’s rivers and streams. Therefore, to show the benefits of the EDSS, a CE-QUAL-W2 model had to be applied for the Yarqon stream. However, the available data on flows, temperature, and water quality in the stream were insufficient to calibrate the model. Therefore, for EDDS demonstration purposes, we applied a non-calibrated model for the stream according to the best data that was available. Although the EDSS cannot supply outputs for decision making under these conditions, we can still demonstrate how the EDSS will assist the YRA if it invests in calibrating a model for the stream.
3.2. The EDSS Algorithm
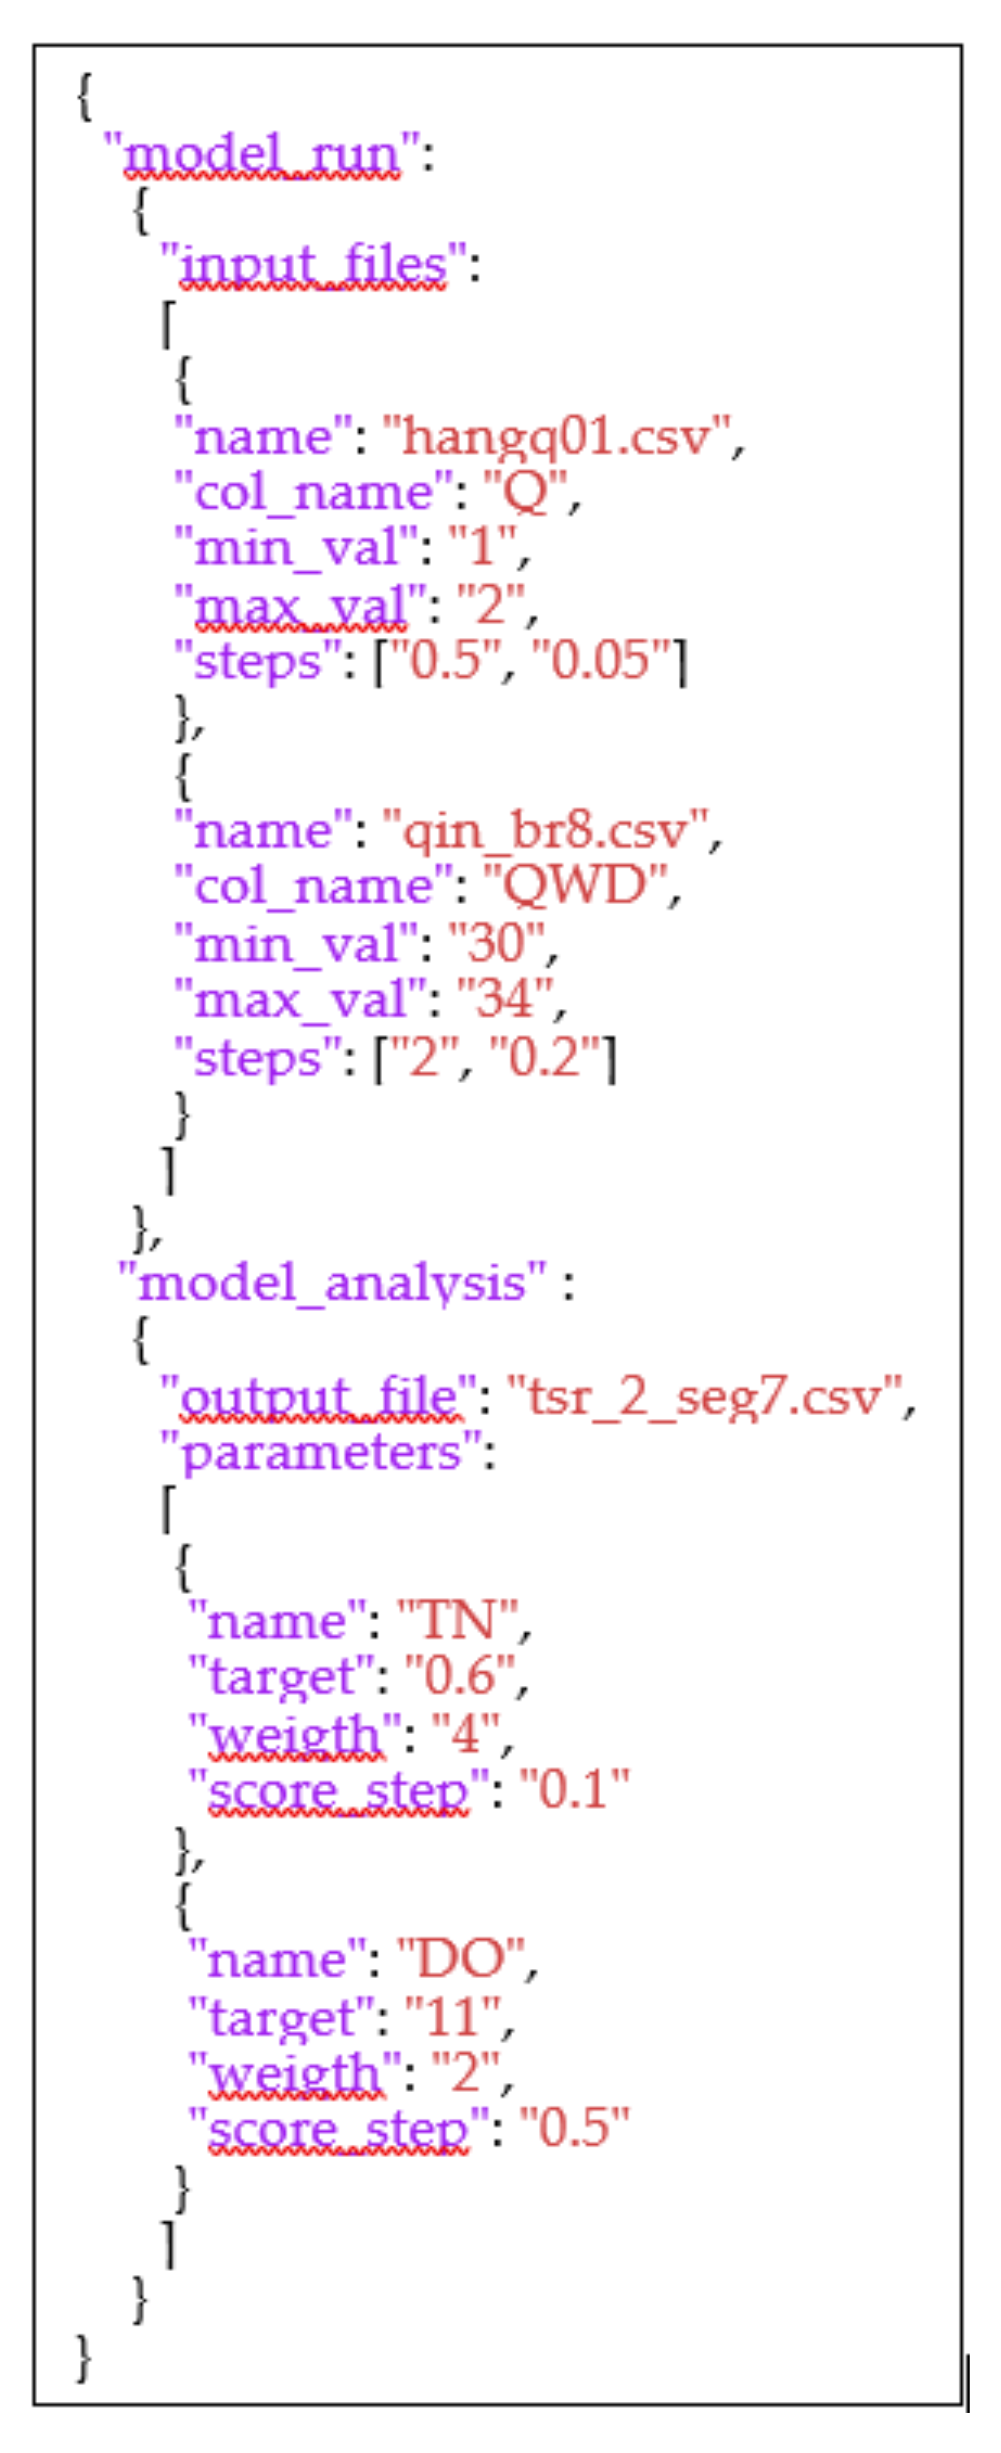
For demonstration purposes, the example implemented algorithm was a simple recursive grid search, which used two types of inputs as shown in Figure A2 in the Appendix A: (1) model_run that specified the parameters needed for the algorithm to set the different run permutations; (2) model_analysis that specified the parameters for finding the best run. The JSON format for the input file was chosen over other formats, such as CSV or TXT, due to its flexibility. Under the model_run section, there is an option to define any number of model input files that need to be changed in the input_files section. For each input file, the user needs to define the following: (1) name—Name of the input file; (2) col_name—Name of the CSV column that needs to be changed (the parameter that is changed); (3) min_val—The minimum value of the parameter that is being changed; (4) max_val—The maximum value of the parameter that is being changed; (5) steps—The increase interval in the parameter value between the minimum and maximum definitions. This parameter can hold a list of values. If more than one value is defined, a recursive run is conducted in smaller intervals for further rounds of model simulations around the previous result that best matched the target. Although the user can define the smallest interval in the first run and obtain the same results faster, the recursive option was added to allow cloud computing cost reduction by reducing the overall number of permutations without significantly impacting the accuracy of the result. In the example shown in Figure A2, in the first pass of model execution, nine different permutations will be executed as there are (2 − 1) / 0.5 + 1 = (34 − 30) / 2 + 1 = 3 different parameter values to set in each of the 2 input files. In the second pass of model execution, the minimum and maximum range are set from the previous round best-run parameter value +/− the previous step value divided by two. In this case, there are another 0.5 / 0.05 + 1 = 2 / 0.2 + 1 = 11 different parameter values to set in each of the 2 input files.
Under the model_analysis section, the model output file that needs to be analyzed is defined in the output_file field. Under the section of parameters, any number of parameters can be defined. Each parameter has the following definitions: (1) name—Column name in the output csv file; (2) target—The target value of the parameter we want to reach; (3) weight—This is a relative parameter that allows setting a priority between the different defined parameters; (4) score_step—This is defined in order to unify the units of different parameters. It is defined as the deviation from the target per unit score. For example, in Figure A2, a deviation of 0.1 g/m3 in total nitrogen (TN) is considered 1 score, while a deviation of 0.5 g/m3 in dissolved oxygen (DO) is considered 1 score. As such, dividing the deviations by the corresponding score_step will facilitate summing the deviations of different parameters in score units, as shown in Equation (1). Equation (1) defines what score each model simulation will receive according to the distance from the target.
Since the score represents deviations from targets, we seek the model simulation that minimizes the score. For example, for the run in Figure A2, we seek the model simulation that minimizes the score defined in Equation (2).
3.3. Case Study Results
In order to demonstrate the abilities of the EDSS, we choose a decision-making problem in which the decision maker needs to decide on the pump flow rate that supplies the water from the aquifer in the most upstream section (point A in Figure 5) to achieve the desired goal of water quality. More specifically, the algorithm needs to quantify the impact of changes in the pump flow rate on the downstream section water quality, given the additional inputs from WWTPs in the middle of the stream and the natural processes occurring along the stream’s 28 km path (Figure 5). This decision-making problem represents a constant debate among stakeholders on the amount of freshwater allocated to the stream to meet water quality targets.
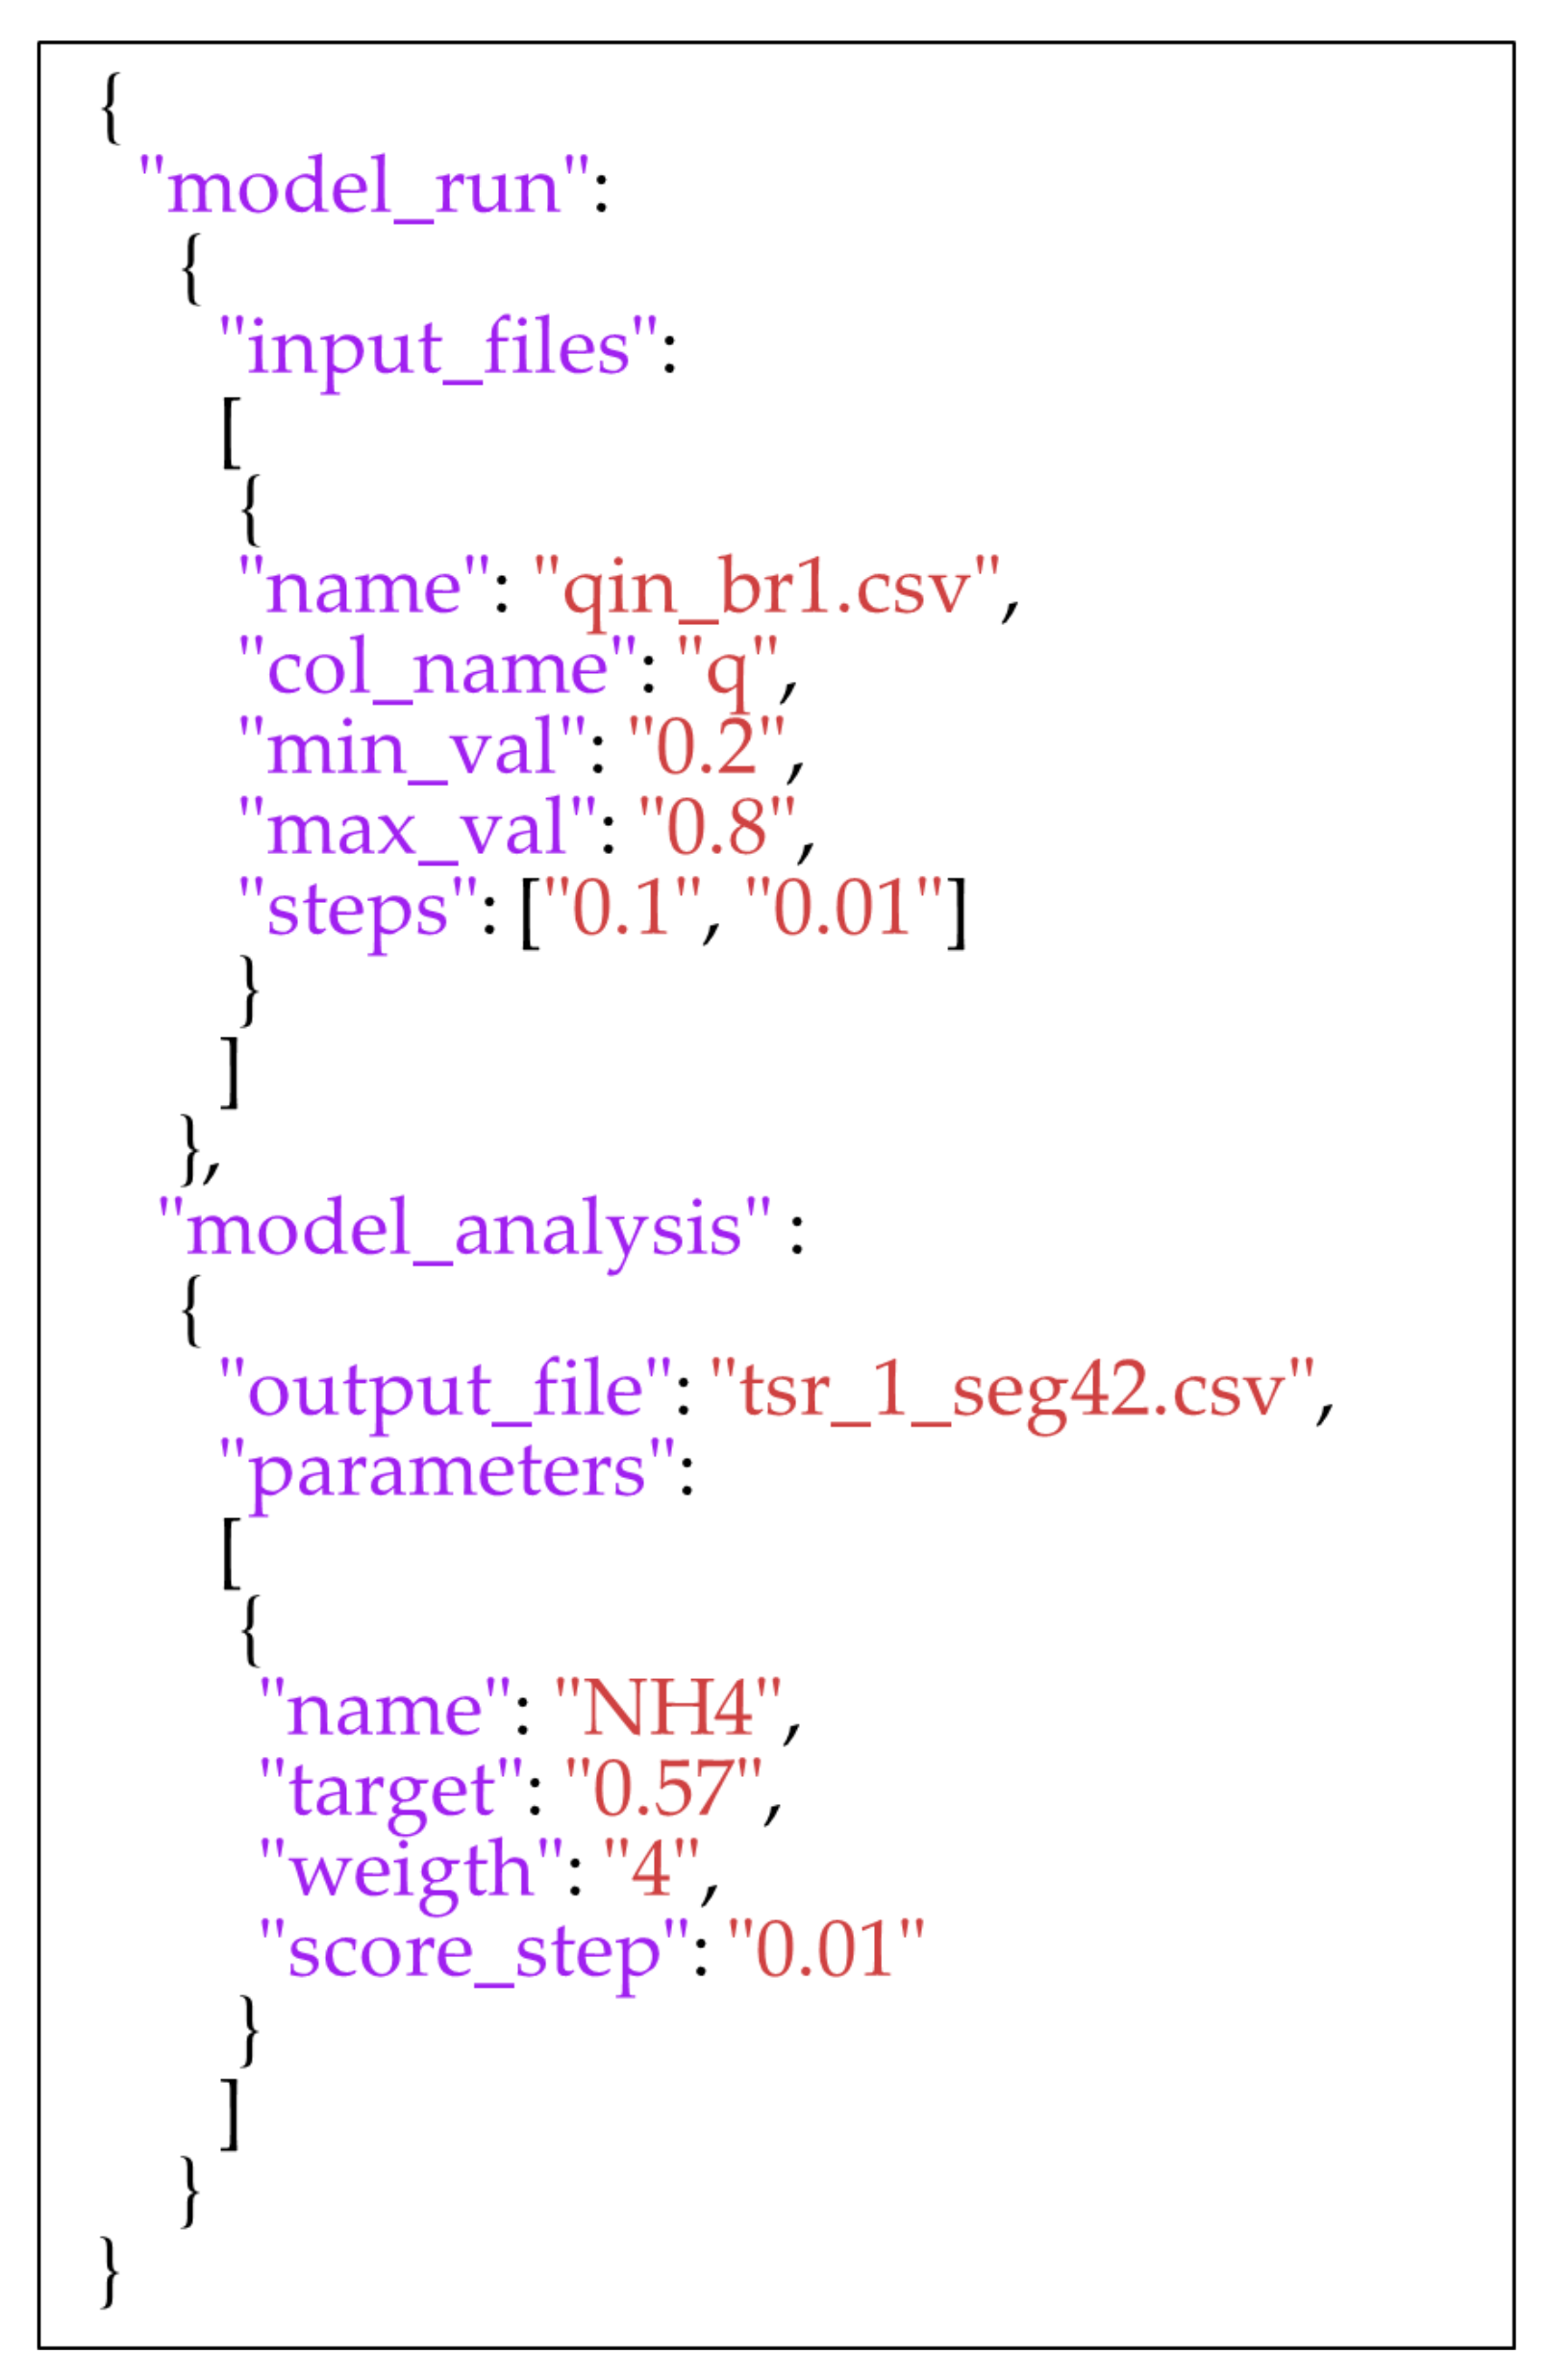
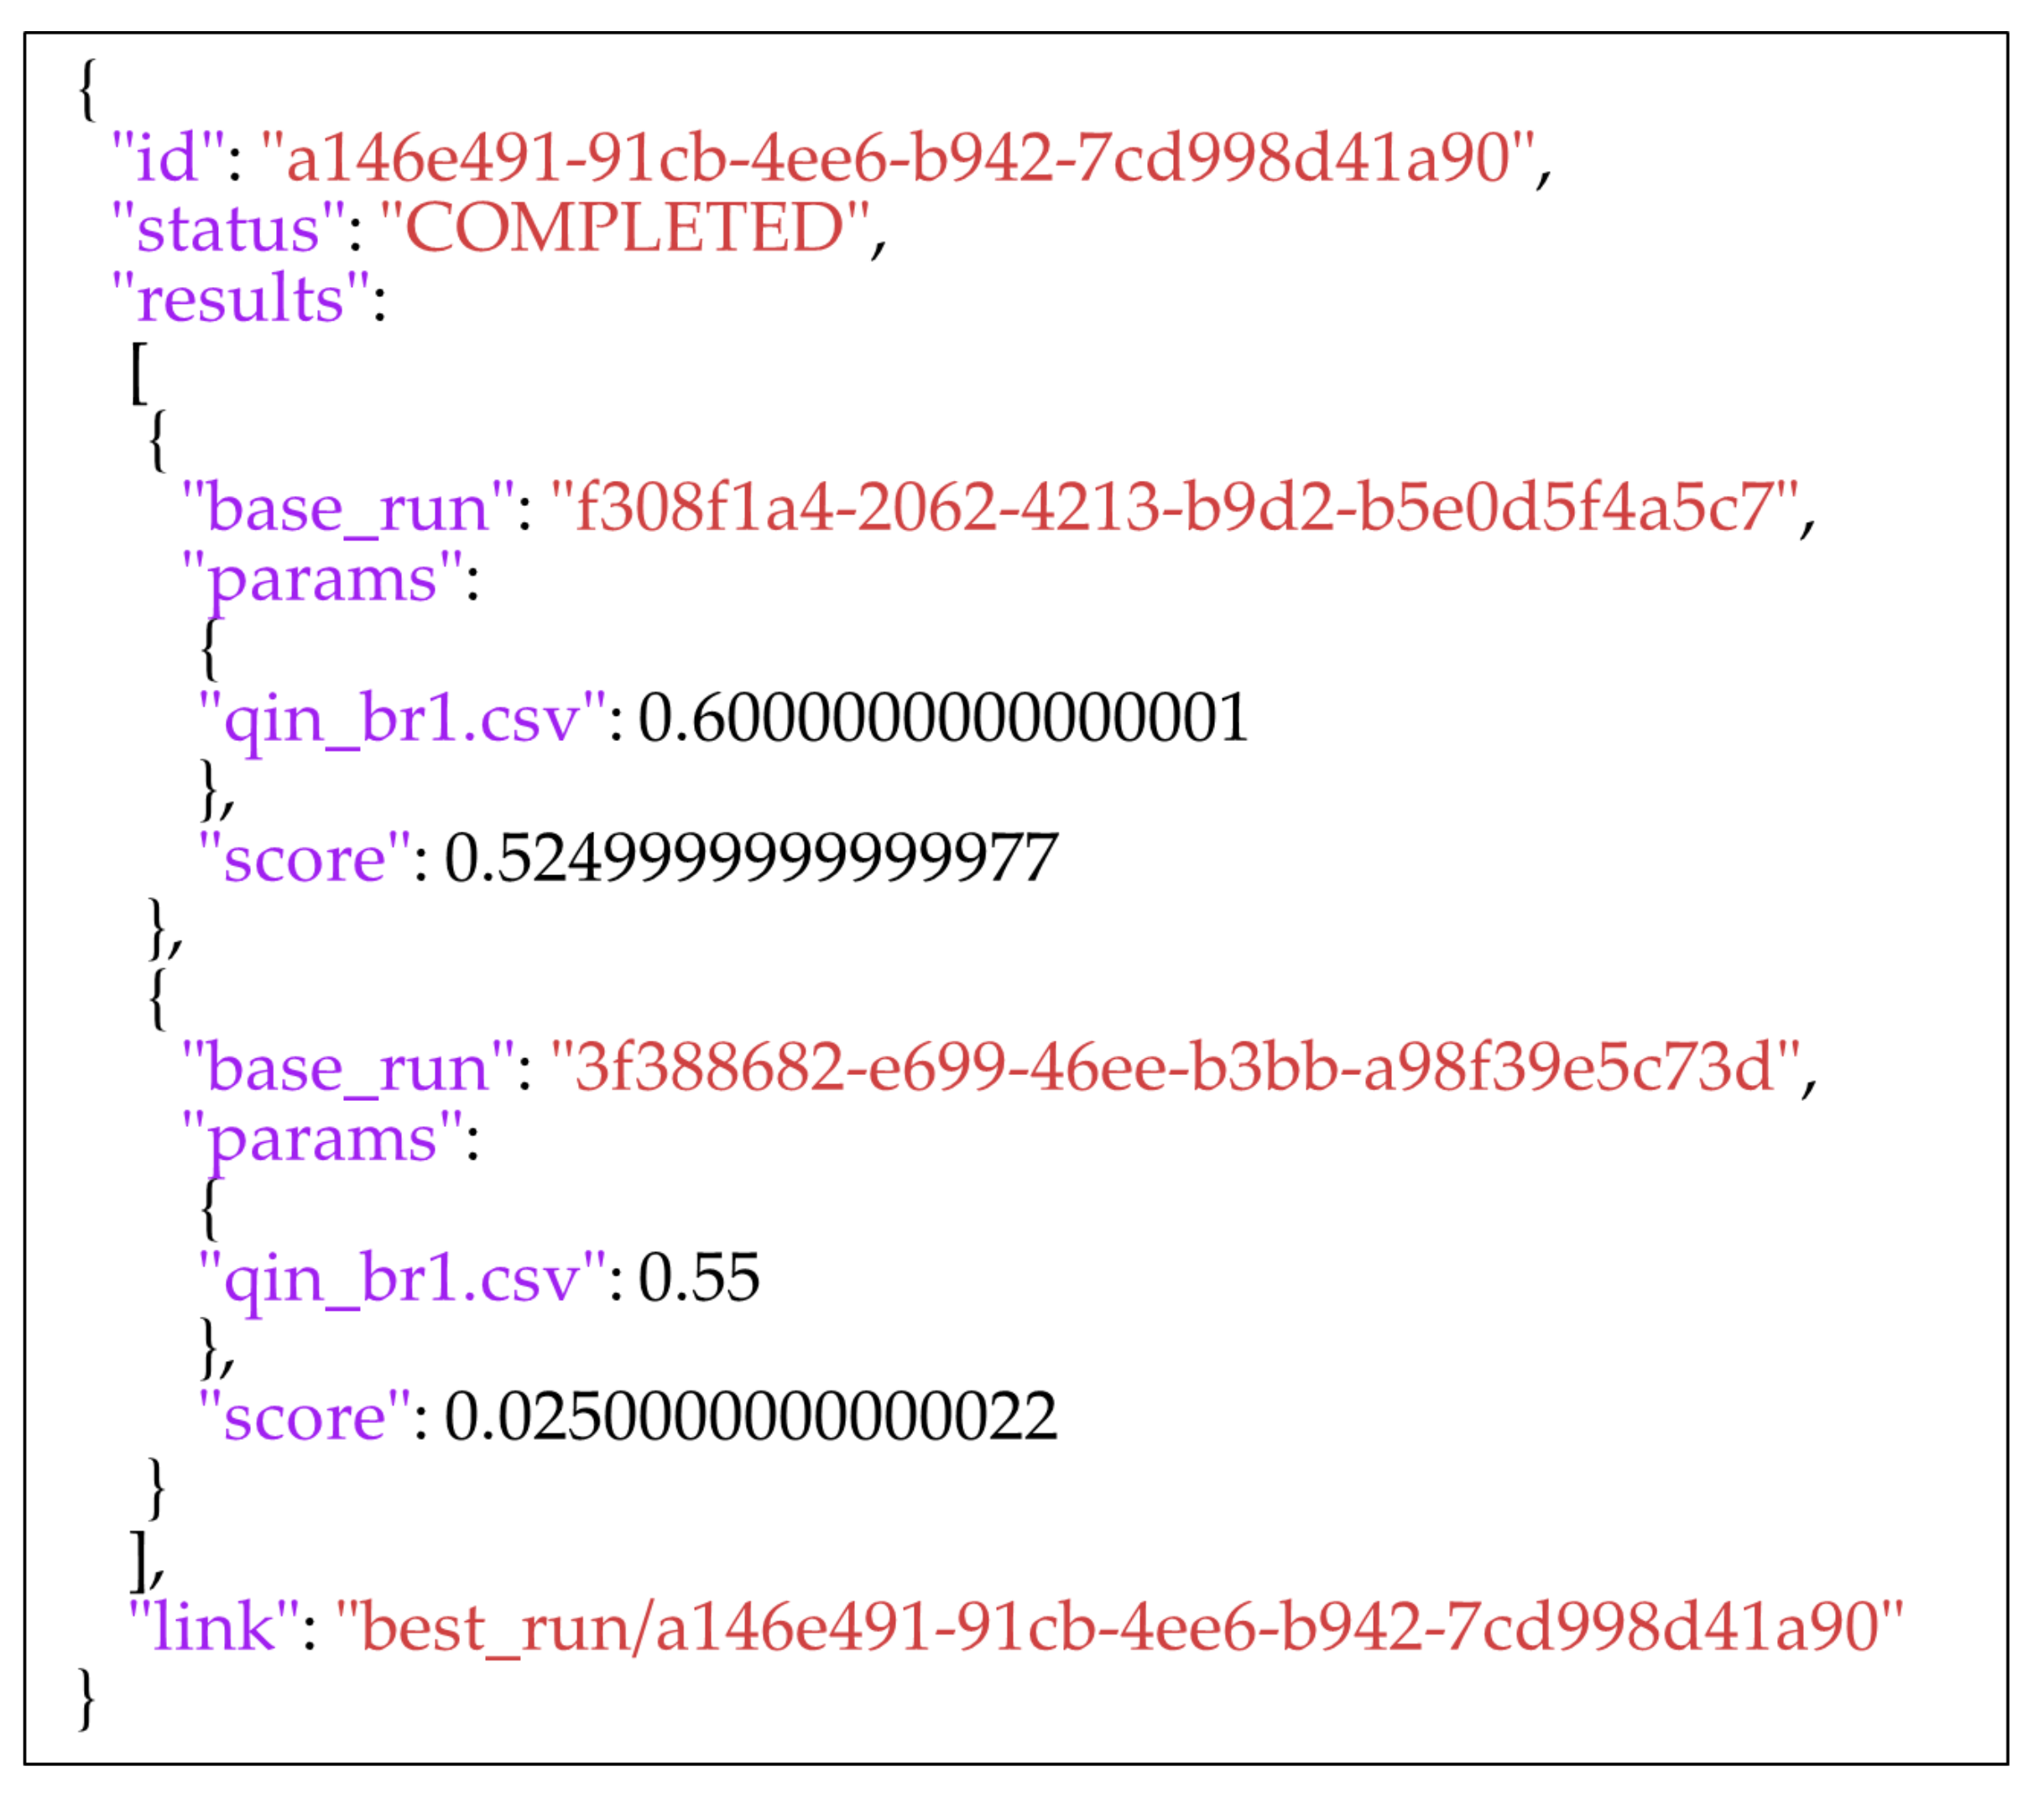
A scenario of excess ammonia (NH4-N) concentration downstream was simulated. As shown in Figure A3 in Appendix A, the EDSS input file defines a possible range of pump flows (col_name = q) between 0.2 m3/s (min_val) and 0.8 m3/s (max_val). The flow changes as defined in the steps were set for two recursive runs, one with 0.1 m3/sec and the second with 0.01 m3/s. The “qin_br1.csv” (name) is the input file that needs to be changed. The NH4-N concentration target of 0.57 g/m3 (target) was set. The weight is not relevant in this case, as only a single target parameter was used. The simulated NH4-N concentration is extracted from the output file of “tsr_1_seg42.csv” (name). The defined score_step was set to 0.01 g/m3. The pump flow that minimizes the score was found by the EDSS as shown in Figure A4 in Appendix A: (1) id—Each EDSS execution has a unique string; (2) status—This field is changed from “RUNNING” to “COMPLETED” once the EDSS publishes the results; (3) result—This shows the results of the best run. In this case, as two recursive runs were defined, we can see two sets of results with different identification strings (best_run). The first is for the search between 0.2 m3/s and 0.8 m3/s with 0.1 m3/s interval, in which a flow of 0.6 m3/s (params) had the best relative score of 0.525 out of the seven runs. The second results are for the run between 0.55 m3/sec and 0.65 m3/s with a 0.01 m3/s interval. In this second search, the best score was 0.025, corresponding to a flow of 0.55 m3/s; (4) A link to download the zip output files from the model executions is available, as shown in Figure A4.
In this example, seven parallel simulations were conducted on cloud computing resources in the first round. In the second round, eleven simulations were conducted in parallel. Altogether, eighteen simulations were conducted in order to reach the result. A more cloud-computing-expensive path could have been taken if a “step” of 0.01 m3/s was solely defined with no recursive rounds. In that case, 61 simulations would have been conducted, resulting in a shorter run time (in case these runs are performed in parallel), but with more cloud computing charges.
4. Benefits from EDSS as a Service
The developed paradigm of a “Water Quality EDSS as a Service” holds multiple benefits for environmental organizations working on preserving and recovering aquatic ecosystems. This specific study implementation is beneficial to organizations or researchers with a calibrated CE-QUAL-W2 model for the water bodies they manage since this remains the highest cost in the EDSS. We can divide the direct users’ benefits into two categories: (1) Benefits to the end-user who consults the EDSS; (2) Benefits to the developer looking to introduce a new algorithm to the user.
4.1. User Benefits
- Ease of use—The simple web interface allows interaction with the system without the need to understand the format of the CE-QUAL-W2 input files. There is also no need to install any software on the user’s computer.
- Reduce simulation time—As the different model simulations are in parallel, the user can obtain the result within the time frame of a single model simulation.
- Extensibility—A software developer can embed any algorithm in the service.
- Low cost—All the software used in this solution is open source. The only needed payments are for the “pay as you use cloud computer” and for a software developer to adjust the needed algorithm to the organization’s needs and then bring up the service for use. Next, we review the developer benefits, which also help maintain a low development cost. An additional aspect is that the developed infrastructure is generic and can support any cloud computing provider (such as AWS, Google, Azure, or Alibaba), where some environmental organizations or researchers can obtain grants for usage from one of the providers. Additional cost savings can also be achieved if a prominent environmental organization maintains the service and algorithms for smaller organizations. For example, in the YRA case, if the Israeli water authority takes responsibility for developing the algorithms and maintaining the service, all thirteen drainage authorities will benefit from it without each of the thirteen developing their algorithms.
4.2. Developer Benefits
- Ease of new algorithm implementation—The architecture of the different software layers described in Figure 2 might look overwhelming. However, it isolates the different core components from the infrastructure layers. Therefore, the algorithm developer would only need to understand the interfaces between the application and the algorithm, be familiar with the Python programming language, and have a basic knowledge of deploying the service to the cloud provider.
- Flexible user interface—The flexible design for the user input does not require having any web development knowledge. It also allows the creation of an input file that is clear and easily produced by the user.
In addition to the direct user’s benefits, the “EDSS as a Service” paradigm also enabled the usage of legacy software in a modern service. Specifically, the CE-QUAL-W2 model has been developed, fine-tuned, and stabilized over the past 40 years. As an open-source project, it will be hard to finance the model redesign into a modern software design. This “EDSS as a Service” allows users to leverage the benefits of a modern web service along with its kernel of a well-established model. The developed infrastructure can also be used for fine-tuning the model calibration. Today, the modeler calibrating the CE-QUAL-W2 model needs to run the model multiple times while changing different tuning parameters. This is conducted to find the best match to the historic observed results in the field. This process is tedious and time-consuming, especially for long-running simulations. An algorithm similar to the grid search algorithm implemented for the YRA can be utilized to perform a parallel search for the best tuning parameters that maximize the goodness of fit between the observed and simulated results.
5. Broader Policy Implications
Water quality management is inherently complex since it involves the interplay of physical, chemical, hydrological, and biological parameters influenced by environmental, socio-economic, and technical factors [24]. In recent decades, this has been compounded by stricter legislation and increased public awareness around the world. As mentioned earlier, EDSS as a service can assist policymakers in understanding these complexities by enabling decision makers to gather, share, and interpret results for different planning and operation scenarios on demand without paying for the necessary license, data storage, or technical support. There are three main policy implications, which are highlighted below.
5.1. Adaptive Management
By combining current water quality data with an EDSS, ‘‘what-if’’ scenario testing can better inform management and policy decisions. However, it is often difficult for decision makers to readily access model information and use models directly to evaluate alternative scenarios [25]. This makes the use of predictive models cumbersome and costly, reinforcing the need for EDSS as a service as a mainstream tool to assist deliberation. Such an adaptive management approach can enable watershed managers to build a flexible, accurate understanding of their system and refine and update management strategies [26].
5.2. Community Engagement
There is a growing recognition that citizens should be actively involved as key stakeholders in the watershed planning process. By engaging communities, policymakers can gain local knowledge, increase fairness and equity in decision making, and avoid failure due to non-acceptance [7]. An effective EDSS can allow citizens to take a participatory approach and highlight the various advantages and disadvantages of different scenarios [27].
5.3. Long-Term Resilience Planning
Growing urban populations, limited budgets, and the impact of climate change are increasingly putting a strain on watershed management. Even a slight increase in temperature can lead to general changes in the microbiological processes in lakes, rivers, and streams [28]. Therefore, resilience planning is essential to cope with and recover from disruption and anticipate trends and variability. For example, when a factory requests permission to dump water that was part of the manufacturing process into a stream, an EDSS can be used to understand the impact on the stream. This can be conducted by plotting the water quality parameters under different flow and quality outputs from the factory as predicted by the model in different points downstream. After such a plot is created, the treatment level of the disposed water can be determined for the factory. In another application using the same example, a government agency could find thresholds related to the stream condition (e.g., flow, temperature, nutrients, etc.), where dumping of water in a certain quality from the factory will not be allowed or the amount will be limited below the regular output. In conclusion, EDSS as a service enables local communities and national regulators alike to take a holistic approach to planning for the future.
Author Contributions
Conceptualization, Y.B. and M.H.; methodology, Y.B.; software, B.D.; validation, Y.B., A.C. and S.W.; investigation, Y.B.; data curation, Y.B.; writing—original draft preparation, Y.B. and A.C.; writing—review and editing, M.H., S.W., A.C. and B.D.; visualization, Y.B.; supervision, M.H.; project administration, Y.B. All authors have read and agreed to the published version of the manuscript.
Funding
This research received no external funding.
Data Availability Statement
EDSS GitHub repository: https://github.com/WQDSS/Evaluna (accessed on 22 May 2021) CE-QUAL-W2 for Linux environment compilation, GitHub repository—https://github.com/WQDSS/CE-QUAL-W2-Linux (accessed on 22 May 2021).
Acknowledgments
This work was supported by the Yarqon River Authority.
Conflicts of Interest
The authors declare no conflict of interest.
Appendix A
Figure A1.
Code snippet for creating a new algorithm.

Figure A2.
Example input file. Note: Two different model files are changed for the permutations, and a single recursive step is defined. The algorithm analysis considers two output parameters with different “weight” and “score_step” values.
Figure A2.
Example input file. Note: Two different model files are changed for the permutations, and a single recursive step is defined. The algorithm analysis considers two output parameters with different “weight” and “score_step” values.

Figure A3.
Case study input file.

Figure A4.
The output of the EDSS. Note: In the first round of simulations (i.e., steps of 0.1 m3/s), 0.6 m3/s flow had the best score. In the second round of simulations (i.e., steps of 0.01 m3/s around 0.6 m3/s), 0.55 m3/s flow had the best score.
Figure A4.
The output of the EDSS. Note: In the first round of simulations (i.e., steps of 0.1 m3/s), 0.6 m3/s flow had the best score. In the second round of simulations (i.e., steps of 0.01 m3/s around 0.6 m3/s), 0.55 m3/s flow had the best score.

References
- Ramsar Convention Secretariat. Water Allocation and Management: Guidelines for the Allocation and Management of Water for Maintaining the Ecological Functions of Wetlands, 4th ed.; Ramsar Convention Secretariat: Gland, Switzerland, 2010. [Google Scholar]
- U.S. Environmental Protection Agency. 2001. Stakeholder Involvement & Public Participation at the U.S. EPA: Lessons Learned, Barriers, & Innovative Approaches. Available online: https://www.epa.gov/sites/production/files/2015-09/documents/stakeholder-involvement-public-participation-at-epa.pdf (accessed on 22 May 2021).
- Cole, T.M.; Wells, S.A. CE-QUAL-W2: A Two-Dimensional, Laterally Averaged, Hydrodynamic and Water Quality Model, Version 4.1; Portland State University: Portland, OR, USA, 2003. [Google Scholar]
- Mateus, M.; da Silva, R.; Almeida, C.; Silva, M.; Reis, F. ScoRE—A Simple Approach to Select a Water Quality Model. Water 2018, 10, 1811. [Google Scholar] [CrossRef] [Green Version]
- CE_QUAL-W2 Application by Country. Available online: http://cee.pdx.edu/w2/ (accessed on 22 May 2021).
- Erturk, A.; Ekdal, A.; Gurel, M.; Zorlutuna, Y.; Tavsan, C.; Seker, D.; Tanik, A.; Ozturk, I. Application of Water Quality Modelling as a Decision Support System Tool for Planned Buyuk Melen Reservoir and Its Watershed. Sustainable Use and Development of Watersheds. Sustain. Use Dev. Watersheds 2008, 227–242. [Google Scholar] [CrossRef]
- Kumar, S.; Godrej, A.; Grizzard, T. A web-based environmental decision support system for legacy models. J. Hydroinform. 2015, 17, 874–890. [Google Scholar] [CrossRef] [Green Version]
- Shaw, A.; Sawyer, H.; LeBoeuf, E.; McDonald, M.; Hadjerioua, B. Hydropower Optimization Using Artificial Neural Network Surrogate Models of a High-Fidelity Hydrodynamics and Water Quality Model. Water Resour. Res. 2017, 53, 9444–9461. [Google Scholar] [CrossRef]
- Martins, R.; Oliveira, T.; Thomas, M. An empirical analysis to assess the determinants of SaaS diffusion in firms. Comput. Hum. Behav. 2016, 62, 19–33. [Google Scholar] [CrossRef]
- Swain, N.; Christensen, S.; Snow, A.; Dolder, H.; Espinoza-Dávalos, G.; Goharian, E.; Jones, N.; Nelson, J.; Ames, D.; Burian, S. A new open source platform for lowering the barrier for environmental web app development. Environ. Model. Softw. 2016, 85, 11–26. [Google Scholar] [CrossRef] [Green Version]
- Ercan, M.; Goodall, J.; Castronova, A.; Humphrey, M.; Beekwilder, N. Calibration of SWAT models using the cloud. Environ. Model. Softw. 2014, 62, 188–196. [Google Scholar] [CrossRef]
- Gassman, P.W.; Reyes, M.R.; Green, C.H.; Arnold, J.G. The Soil and Water Assessment Tool: Historical development, applications, and future research directions. Trans. ASABE 2007, 50, 1211–1240. [Google Scholar] [CrossRef] [Green Version]
- Li, Y. Towards fast prototyping of cloud-based environmental decision support systems for environmental scientists using R Shiny and Docker. Environ. Model. Softw. 2020, 132, 104797. [Google Scholar] [CrossRef]
- Docker Windows Containers. Available online: https://www.docker.com/products/windows-containers (accessed on 22 May 2021).
- CE-QUAL-W2-Linux, Port of the CE-QUAL-W2 Model to Linux. Available online: https://github.com/WQDSS/CE-QUAL-W2-Linux (accessed on 22 May 2021).
- Kubernetes. Available online: https://kubernetes.io/ (accessed on 22 May 2021).
- Helm. Available online: https://helm.sh/ (accessed on 22 May 2021).
- JSON. Available online: https://www.json.org/json-en.html (accessed on 22 May 2021).
- EDSS. Available online: https://github.com/WQDSS/Evaluna (accessed on 22 May 2021).
- TravisCI. Available online: https://travis-ci.org/ (accessed on 22 May 2021).
- Israel Drainage Authorities (Hebrew). Retrieved from Kishon Drainage Authority. Available online: https://www.rnkishon.co.il (accessed on 22 May 2021).
- Yarqon River Authority. Available online: https://www.yarqon.org.il/en/ (accessed on 22 May 2021).
- Arnon, S.; Avni, N.; Gafny, S. Nutrient uptake and macroinvertebrate community structure in a highly regulated Mediterranean stream receiving treated wastewater. Aquat. Sci. 2015, 77, 623–637. [Google Scholar] [CrossRef]
- Wang, G.; Mang, S.; Cai, H.; Liu, S.; Zhang, Z.; Wang, L.; Innes, J.L. Integrated watershed management: Evolution, development and emerging trends. J. For. Res. 2016, 27, 967–994. [Google Scholar] [CrossRef] [Green Version]
- Uusitalo, L.; Lehikoinen, A.; Helle, I.; Myrberg, K. An overview of methods to evaluate uncertainty of deterministic models in decision support. Environ. Model. Softw. 2015, 63, 24–31. [Google Scholar] [CrossRef] [Green Version]
- Li, Y.; Degener, J.; Gaudreau, M.; Li, Y.; Kappas, M. Adaptive capacity based water quality resilience transformation and policy implications in rapidly urbanizing landscapes. Sci. Total Environ. 2016, 569, 168–178. [Google Scholar] [CrossRef] [PubMed]
- Hewitt, R.J.; Macleod, C.J. What do users really need? Participatory development of decision support tools for environmental management based on outcomes. Environments 2017, 4, 88. [Google Scholar] [CrossRef] [Green Version]
- Bhateria, R.; Jain, D. Water quality assessment of lake water: A review. Sustain. Water Resour. Manag. 2016, 2, 161–173. [Google Scholar] [CrossRef] [Green Version]
Figure 1.
The conceptual framework of EDSS as a service.

Figure 2.
The different layers in the EDSS as a service design. Note: Grey represents layers that will require changes between implementations of the EDSS. White represents the infrastructure layers that do not require changes between different implementations.
Figure 2.
The different layers in the EDSS as a service design. Note: Grey represents layers that will require changes between implementations of the EDSS. White represents the infrastructure layers that do not require changes between different implementations.

Figure 3.
Application layer interactions.

Figure 4.
The web-based user interface of the EDSS.

Figure 5.
Study area map. (A) Source of the stream, from aquifer water pumps. (B) Discharge points of two WWTP. (C) Discharge point of a third WWTP. Note: background map is adapted from “Michelin maps”.
Figure 5.
Study area map. (A) Source of the stream, from aquifer water pumps. (B) Discharge points of two WWTP. (C) Discharge point of a third WWTP. Note: background map is adapted from “Michelin maps”.

Publisher’s Note: MDPI stays neutral with regard to jurisdictional claims in published maps and institutional affiliations. |
© 2022 by the authors. Licensee MDPI, Basel, Switzerland. This article is an open access article distributed under the terms and conditions of the Creative Commons Attribution (CC BY) license (https://creativecommons.org/licenses/by/4.0/).
Share and Cite
MDPI and ACS Style
Bornstein, Y.; Dayan, B.; Cahn, A.; Wells, S.; Housh, M. Environmental Decision Support Systems as a Service: Demonstration on CE-QUAL-W2 Model. Water 2022, 14, 885. https://doi.org/10.3390/w14060885
AMA Style
Bornstein Y, Dayan B, Cahn A, Wells S, Housh M. Environmental Decision Support Systems as a Service: Demonstration on CE-QUAL-W2 Model. Water. 2022; 14(6):885. https://doi.org/10.3390/w14060885
Chicago/Turabian StyleBornstein, Yoav, Ben Dayan, Amir Cahn, Scott Wells, and Mashor Housh. 2022. "Environmental Decision Support Systems as a Service: Demonstration on CE-QUAL-W2 Model" Water 14, no. 6: 885. https://doi.org/10.3390/w14060885
Note that from the first issue of 2016, this journal uses article numbers instead of page numbers. See further details here.