Article

Precipitation Variability and Drought Assessment Using the SPI: Application to Long-Term Series in the Strait of Gibraltar Area

by
Mercedes Vélez-Nicolás
1,
Santiago García-López
1,*,
Verónica Ruiz-Ortiz
2,
Santiago Zazo
3 and
José Luis Molina
3
1
Department of Earth Sciences, Campus Rio San Pedro, University of Cadiz, 11510 Puerto Real, Spain
2
Department of Industrial Engineering and Civil Engineering, Campus Bay of Algeciras, University of Cadiz, 11202 Algeciras, Spain
3
IGA Research Group, Higher Polytechnic School of Ávila, University of Salamanca, 05003 Ávila, Spain
*
Author to whom correspondence should be addressed.
Water 2022, 14(6), 884; https://doi.org/10.3390/w14060884
Submission received: 16 February 2022 / Revised: 5 March 2022 / Accepted: 9 March 2022 / Published: 11 March 2022
(This article belongs to the Section Hydrology)

Abstract

:
The standardized precipitation index (SPI) provides reliable estimations about the intensity, magnitude and spatial extent of droughts in a variety of time scales based on long-term precipitation series. In this work, we assess the evolution of monthly precipitation in the Barbate River basin (S. Iberian Peninsula) between 1910/11 and 2017/18 through the generation of a representative precipitation series for the 108-year period and the subsequent application of the SPI. This extensive series was obtained after processing all the precipitation data (67 stations) available within and nearby the basin and subsequent complex gap-filling stages. The SPI identified 26 periods of drought, 12 of them severe and 6 extreme, with return periods of 9 and 18 years, respectively. Complementary analysis evidenced changes in precipitation cyclicity, with periodicities of 5 and 7–8 years during the first and second half of the study period, respectively. Additionally, the amplitude of pluviometric oscillations increased during the second half of the period, and extreme events were more frequent. While the decade 1940–1950 was very dry, with precipitation 11% below the basin’s average, 1960–1970 was very humid, with precipitation 23% above average. Contrary to the results of climate change projections specific to this area, a clear downward trend in precipitation is not detected.

1. Introduction

Droughts are extreme climatic events associated with the spatiotemporal variability of precipitation regimes and have profound impacts on natural and socioeconomic systems. These natural hazards pose a threat to water security and food production, cause property damage, loss of life and displacement of communities, and affect a vast range of ecosystem services. In spite of the many ways droughts affect the environment and human lives, the concept of drought itself is elusive, and to date, there is no universal definition. For instance, the World Meteorological Organization (WMO) [1] defined droughts as sustained and extended deficiencies in precipitation and the Intergovernmental Panel on Climate Change (IPCC) [2] as periods of abnormally dry weather long enough to cause a serious hydrological imbalance. The reason for this lack of a unified definition is that droughts must be defined according to the characteristics of each climatic regime, sectors affected or the application intended for the definition [3]. Additionally, droughts can be classified into four main categories (meteorological, hydrological, agricultural and socioeconomic) [4,5], and their negative effects can be exacerbated by numerous factors, such as the demand placed on water resources or their management strategy.
Droughts are located at the tail of the distribution of climate variables and usually occur as clusters of several consecutive years; however, their timing, frequency and intensity are undergoing rapid changes as a consequence of climate change [6,7]. In recent decades, a wide variety of indexes have been developed to detect, monitor and assess droughts. These indexes are usually relevant to a given type of drought and rely on combinations of precipitation, temperature, evapotranspiration or streamflow data. One of the most widespread meteorological drought indices is the Standardized precipitation index (SPI) proposed by McKee et al. [8] to identify abnormally wet and dry periods. The SPI, which will be explained in more detail in Section 3.2.2, is the index considered in this work. Another well-known index is the Palmer drought severity index (PDSI) [9], based on a rather complex soil–water balance that considers precipitation, soil moisture and evapotranspiration for a specific region. The PDSI relates the severity of drought to the accumulated weighted differences between actual precipitation and the precipitation necessary to retain a normal water balance level. Although the PDSI provides a more comprehensive picture of the water cycle and its components, its algorithm was devised for relatively homogeneous semiarid or subhumid regions, and its extrapolation beyond these areas would lead to unrealistic results [10]. Another tool to define drought duration and severity and predict their onset and end is the reclamation drought index (RDI) [11], which is calculated at a river basin level and incorporates as inputs precipitation, snowpack, streamflow, reservoir levels and temperature to account for evaporation.
Other recent approaches are the effective drought index (EDI) [12], which considers daily water accumulation with a weighting function of time, or the reconnaissance drought index developed by Tsakiris et al. [13], which relates precipitation with the potential evapotranspiration. The amount and duration of water deficits have also been described with indexes based on precipitation anomalies. Indexes of this type are the Foley drought index (FDI) or the percent of normal rainfall. The FDI tallies the deviations of monthly precipitation measurements from long-term monthly averages and normalizes each anomaly with respect to the annual average rainfall in order to account for their magnitude [14]. On the other hand, the percent of normal precipitation (PNP) is one of the simplest and most effective methods to measure rainfall in a single region with similar geographic characteristics or in a single season. It is obtained by dividing actual precipitation by normal precipitation (usually considered a 30-year mean) and multiplying by 100%. Its main disadvantage is that PNP is based on a normal distribution where the mean and median are considered to be the same when, actually, average precipitation is often not the same as the median precipitation [15]. In spite of the limitations of these indices, they enable assimilating large volumes of data into quantitative information and constitute advantageous tools for drought forecasting, impact assessment and contingency planning [16].
Recently, drought research has headed towards the use of data-driven models such as support vector regression (SVR) and artificial neural networks (ANNs) [17,18,19]. However, these machine learning techniques are constrained by their limited ability to deal with nonstationary data, an issue that is being overcome by the application of wavelet analysis to preprocess data inputs [20,21]. This approach is demonstrated to be a useful forecasting tool, improving the results of traditional ANN and SVR models and in the case of SPI time series, reducing its sensitivity to changes in monthly precipitation.
The expected changes in drought patterns are becoming a major concern in regions with large interannual precipitation variability, such as the countries of the Mediterranean basin, considered a hot spot of climate change [22,23]. This has led to a growing body of literature on the evolution of precipitation and drought patterns using well-established indices in the Mediterranean area [24,25,26,27,28]. In the particular case of the Iberian Peninsula, drought patterns are determined by their intermediate location between temperate and subtropical climates and are characterized by their complexity and marked spatial gradients throughout the territory [29]. The number of studies on drought characterization and monitoring using indices is quite large in the context of the whole country [30,31,32,33,34,35]. However, the limited spatial density of measurements in large-scale studies, together with the remarkable climatic and topographic heterogeneity of certain regions such as Andalusia (Southern Spain), may yield unrepresentative results on smaller scales. It should be noted that the evolution of drought periods within the Iberian Peninsula can be very diverse; while the most intense episodes are usually regional, other individual droughts are restricted to concrete areas and take place as local phenomena. Thus, even the most widespread episodes of drought have affected the Iberian Peninsula in an uneven manner [36].
Although there are some works on drought indices at the Andalusian level [37], the number of detailed studies at smaller scales such as hydrographic basins in this region are very scarce, and only a few can be cited [38,39]. Therefore, it is necessary to increase efforts towards finer detail studies that may help to understand more accurately climatic variability and evolution of droughts, especially in certain regions with particular vulnerabilities and geographies, such as the Barbate River basin. In this regard, despite the great dependence of this basin on surface water resources, to date, there are no studies on the evolution of precipitation in this location.
The aim of this paper is to analyze the irregularity of precipitation between 1910/11 and 2017/18, with special emphasis on periods of drought, to identify changes in rainfall patterns potentially associated with climate change in the Barbate River Basin (province of Cádiz, Andalusia). In this regard, the main challenge was the generation of a rainfall series over a century long and representative of a large area of territory from all the available records in the basin, which were affected by numerous data gaps. For this purpose, we present a workflow for the elaboration of a 108-year monthly precipitation series and its characterization from the point of view of the occurrence, magnitude and duration of droughts using the SPI. The interest of this work also lies in the study area, whose characteristics are typical of a transition zone between temperate and subtropical climates, with marked spatial gradients, influenced by its location between the Atlantic Ocean and the Mediterranean Sea. This paper also discusses future drought and rainfall trends projected for the region by several authors and governmental agencies and compares their findings with those reported for the study area. The data produced in this study will provide valuable information for management and decision making by different entities such as water user associations (WUA) and will aid in the adoption of appropriate water policies that minimize the impact of future droughts in the study area. Additionally, the knowledge gathered from this study can be the seed for future research in this geographical area, in addition to being of great importance for the allocation of water resources and economic and agricultural development in the basin.
After briefly describing the most relevant drought indices, their applicability and limitations, the remainder of this work is structured as follows. Section 2 presents the case study and particularities of the study area. Section 3 provides a detailed description of the dataset and methodology applied. Section 4 presents the main experimental results, based on the analysis of the precipitation series and on the evolution of the SPI. In Section 5, our findings are discussed and compared with those from other studies. Finally, Section 6 summarizes the main conclusions drawn from the research.

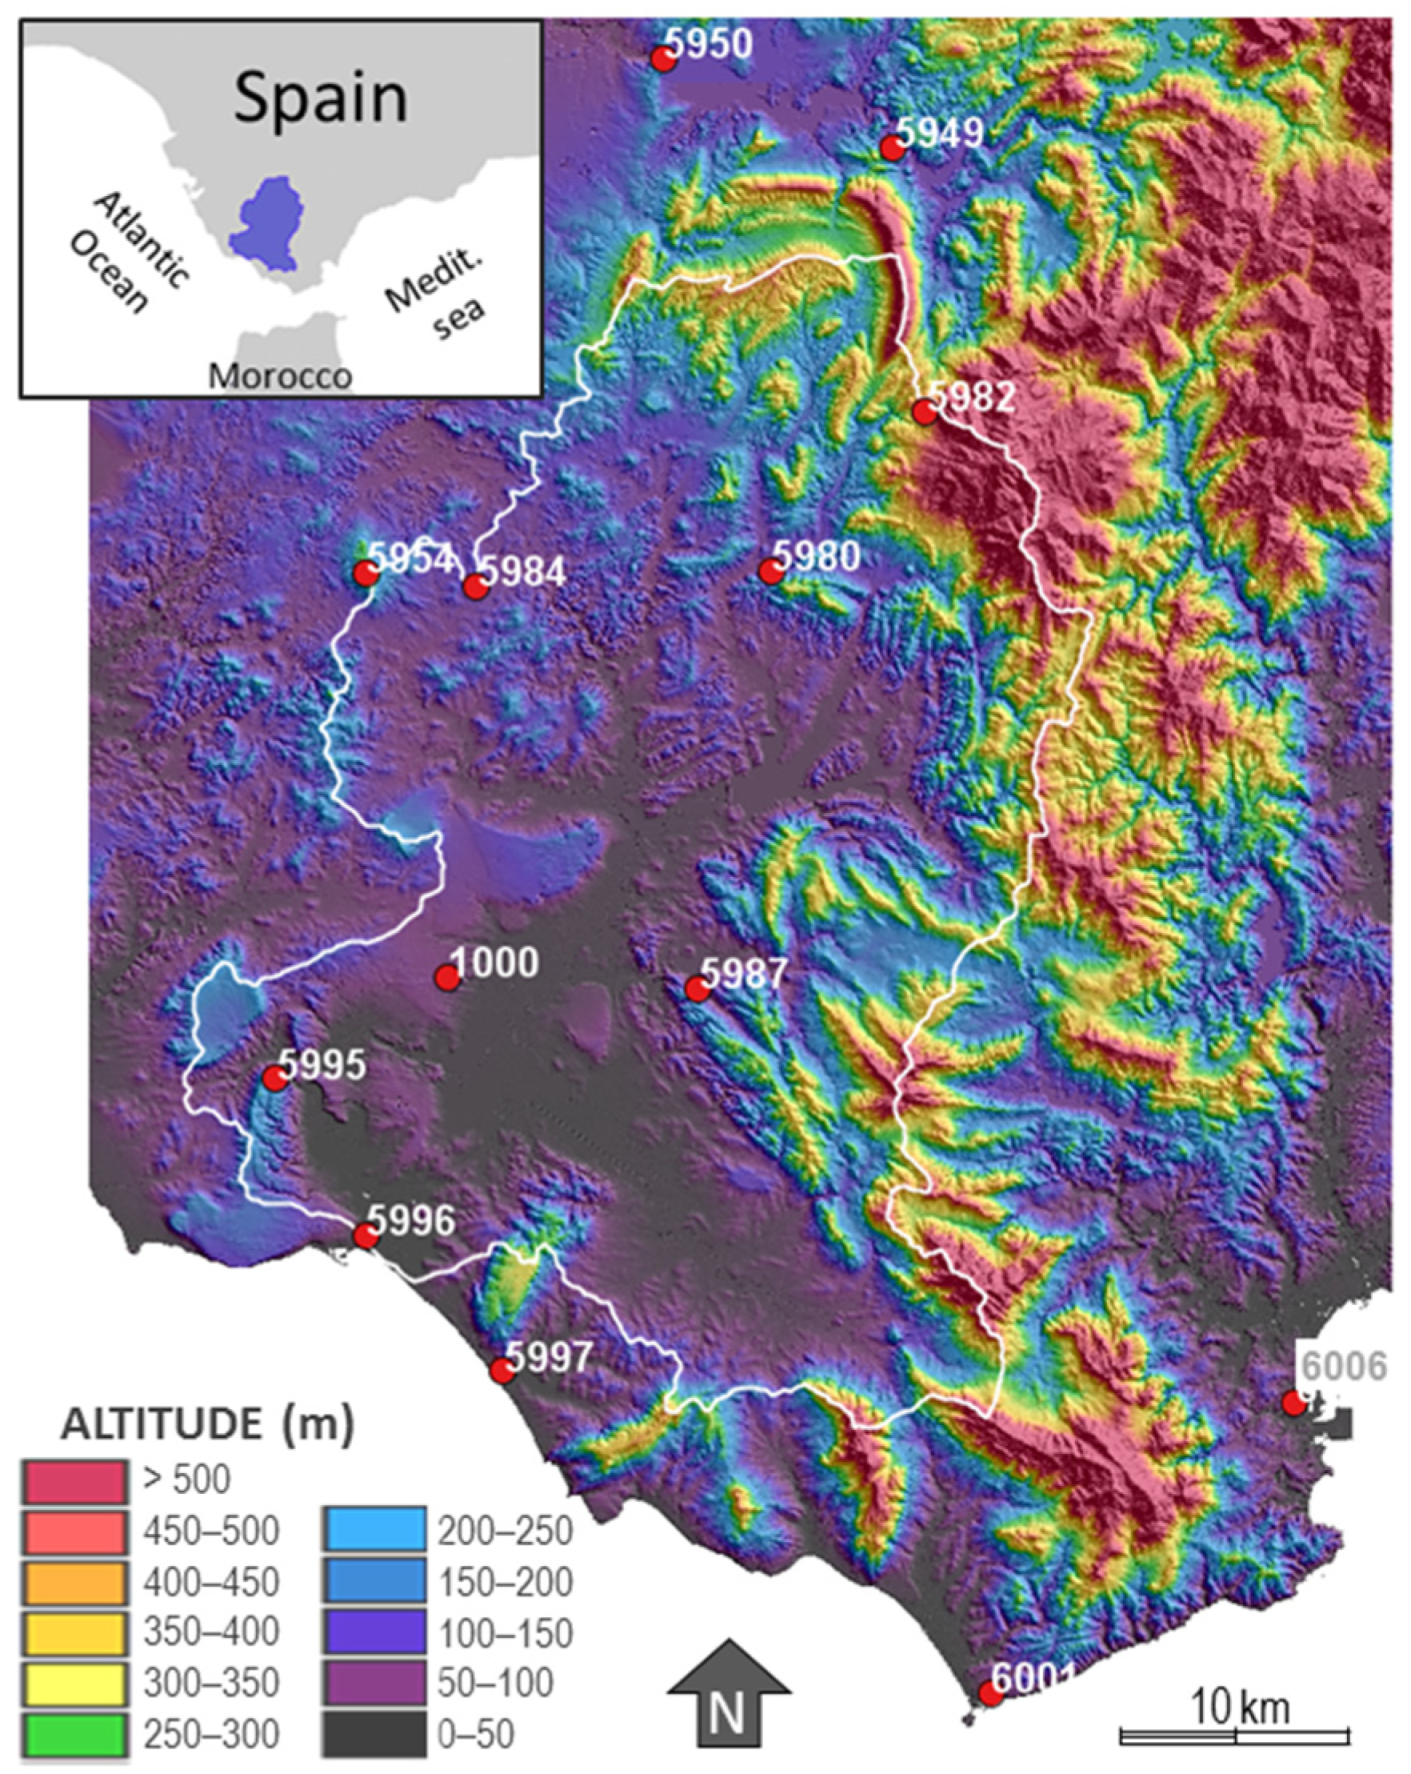
2. Case Study: Climate and Context

The Barbate River Basin is located in the province of Cadiz, in the southern tip of Spain, near the Strait of Gibraltar. The basin has an area of approximately 1330 km2 and displays a smooth orography, with more than the 70% of its area ranging between 0 and 100 m altitude, except for the NE sector, which coincides with the Alcornocales Natural Park, where mountainous reliefs reach 1090 m above sea level at some locations (Figure 1).
According to the Köppen–Geiger classification, the climate of this Andalusian region is temperate with hot, dry summers [40]. At the local scale, the basin is characterized by a Mediterranean climate with a strong oceanic influence bolstered by the orography and a marked seasonal rainfall regime. In the study area, precipitation shows a strong interannual irregularity and mainly concentrates on autumn and winter months, with practically no precipitation between June and September. Rainfall shows average annual values of 835 mm, which can range between 365 mm during dry years and 1606 mm during wet years [41]. The average annual temperature is 18.2 °C, with milder values in mountainous areas. The area is strongly affected by intense and persistent periods of warm, dry easterly winds known as Levante, which can reach speeds over 100 km/h and blow for more than 7 consecutive days, resulting in significant evaporation processes on surface resources [42,43]. The economy in the basin is mainly based on agriculture and livestock farming, activities that are highly dependent on the supply of surface water from the reservoirs Barbate, Celemín and Almodóvar (joint capacity of 277 hm3) and, to a lesser extent, on the exploitation of local aquifers [44].

3. Materials and Methods

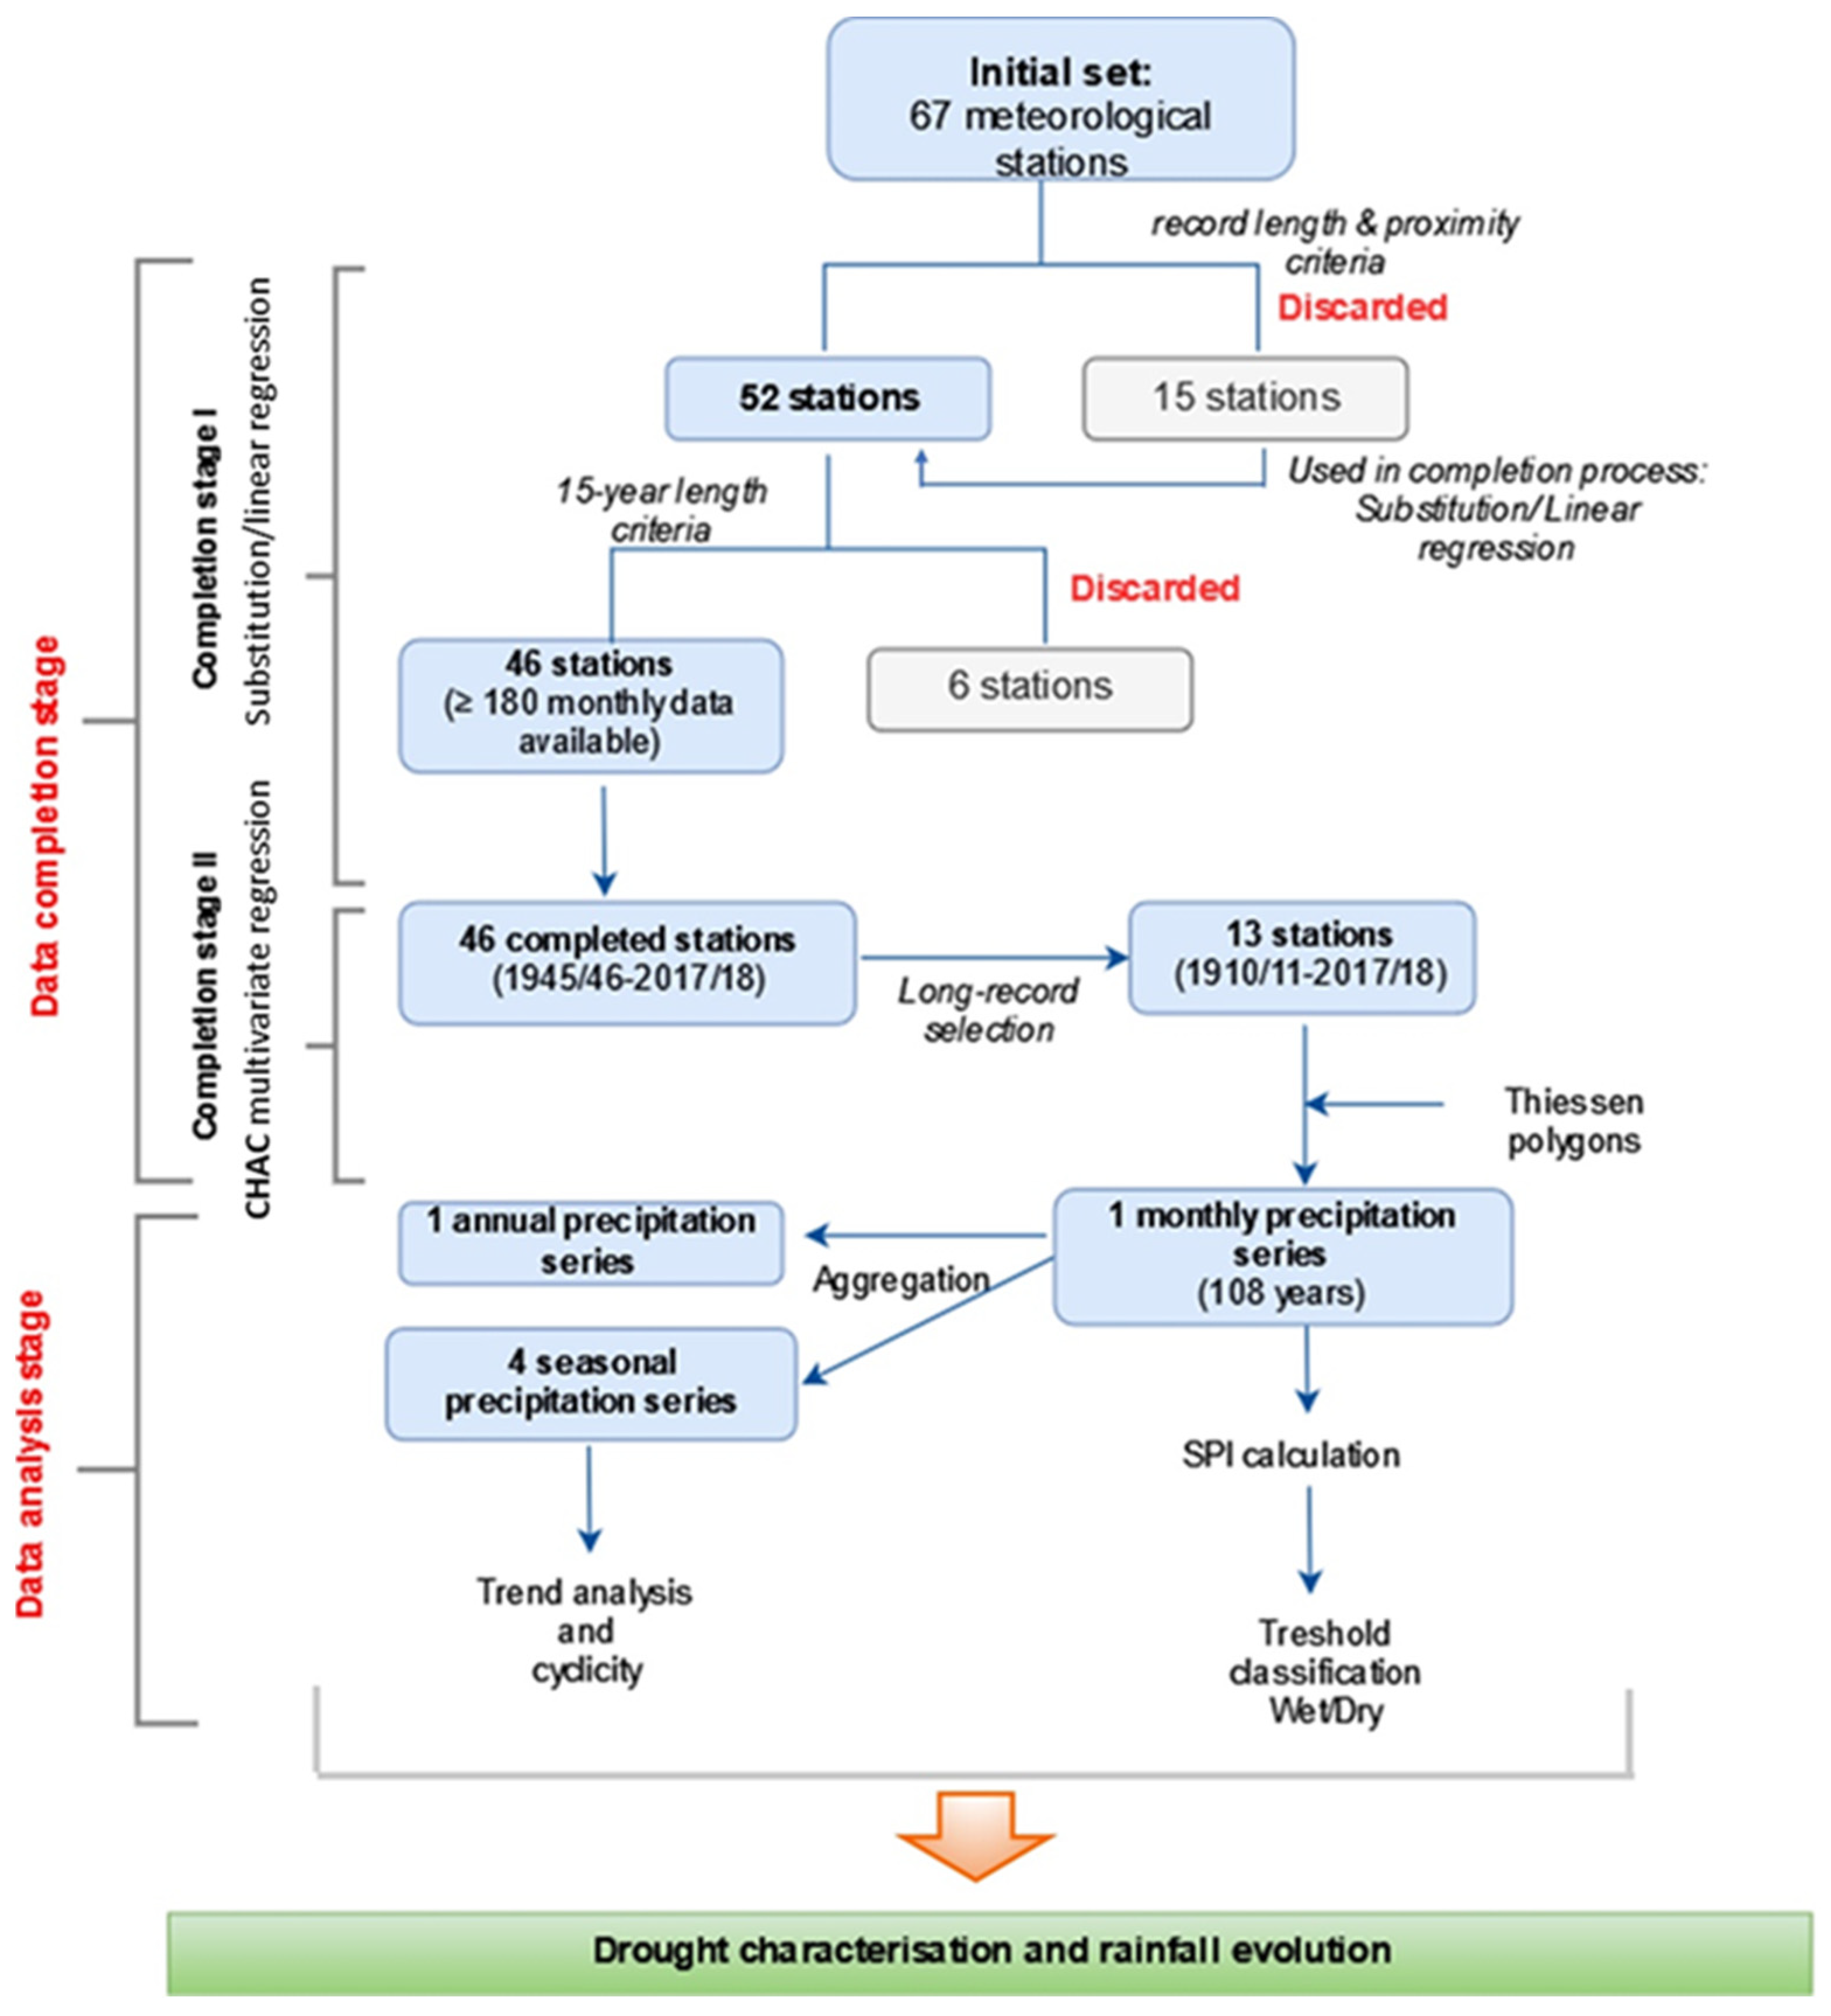
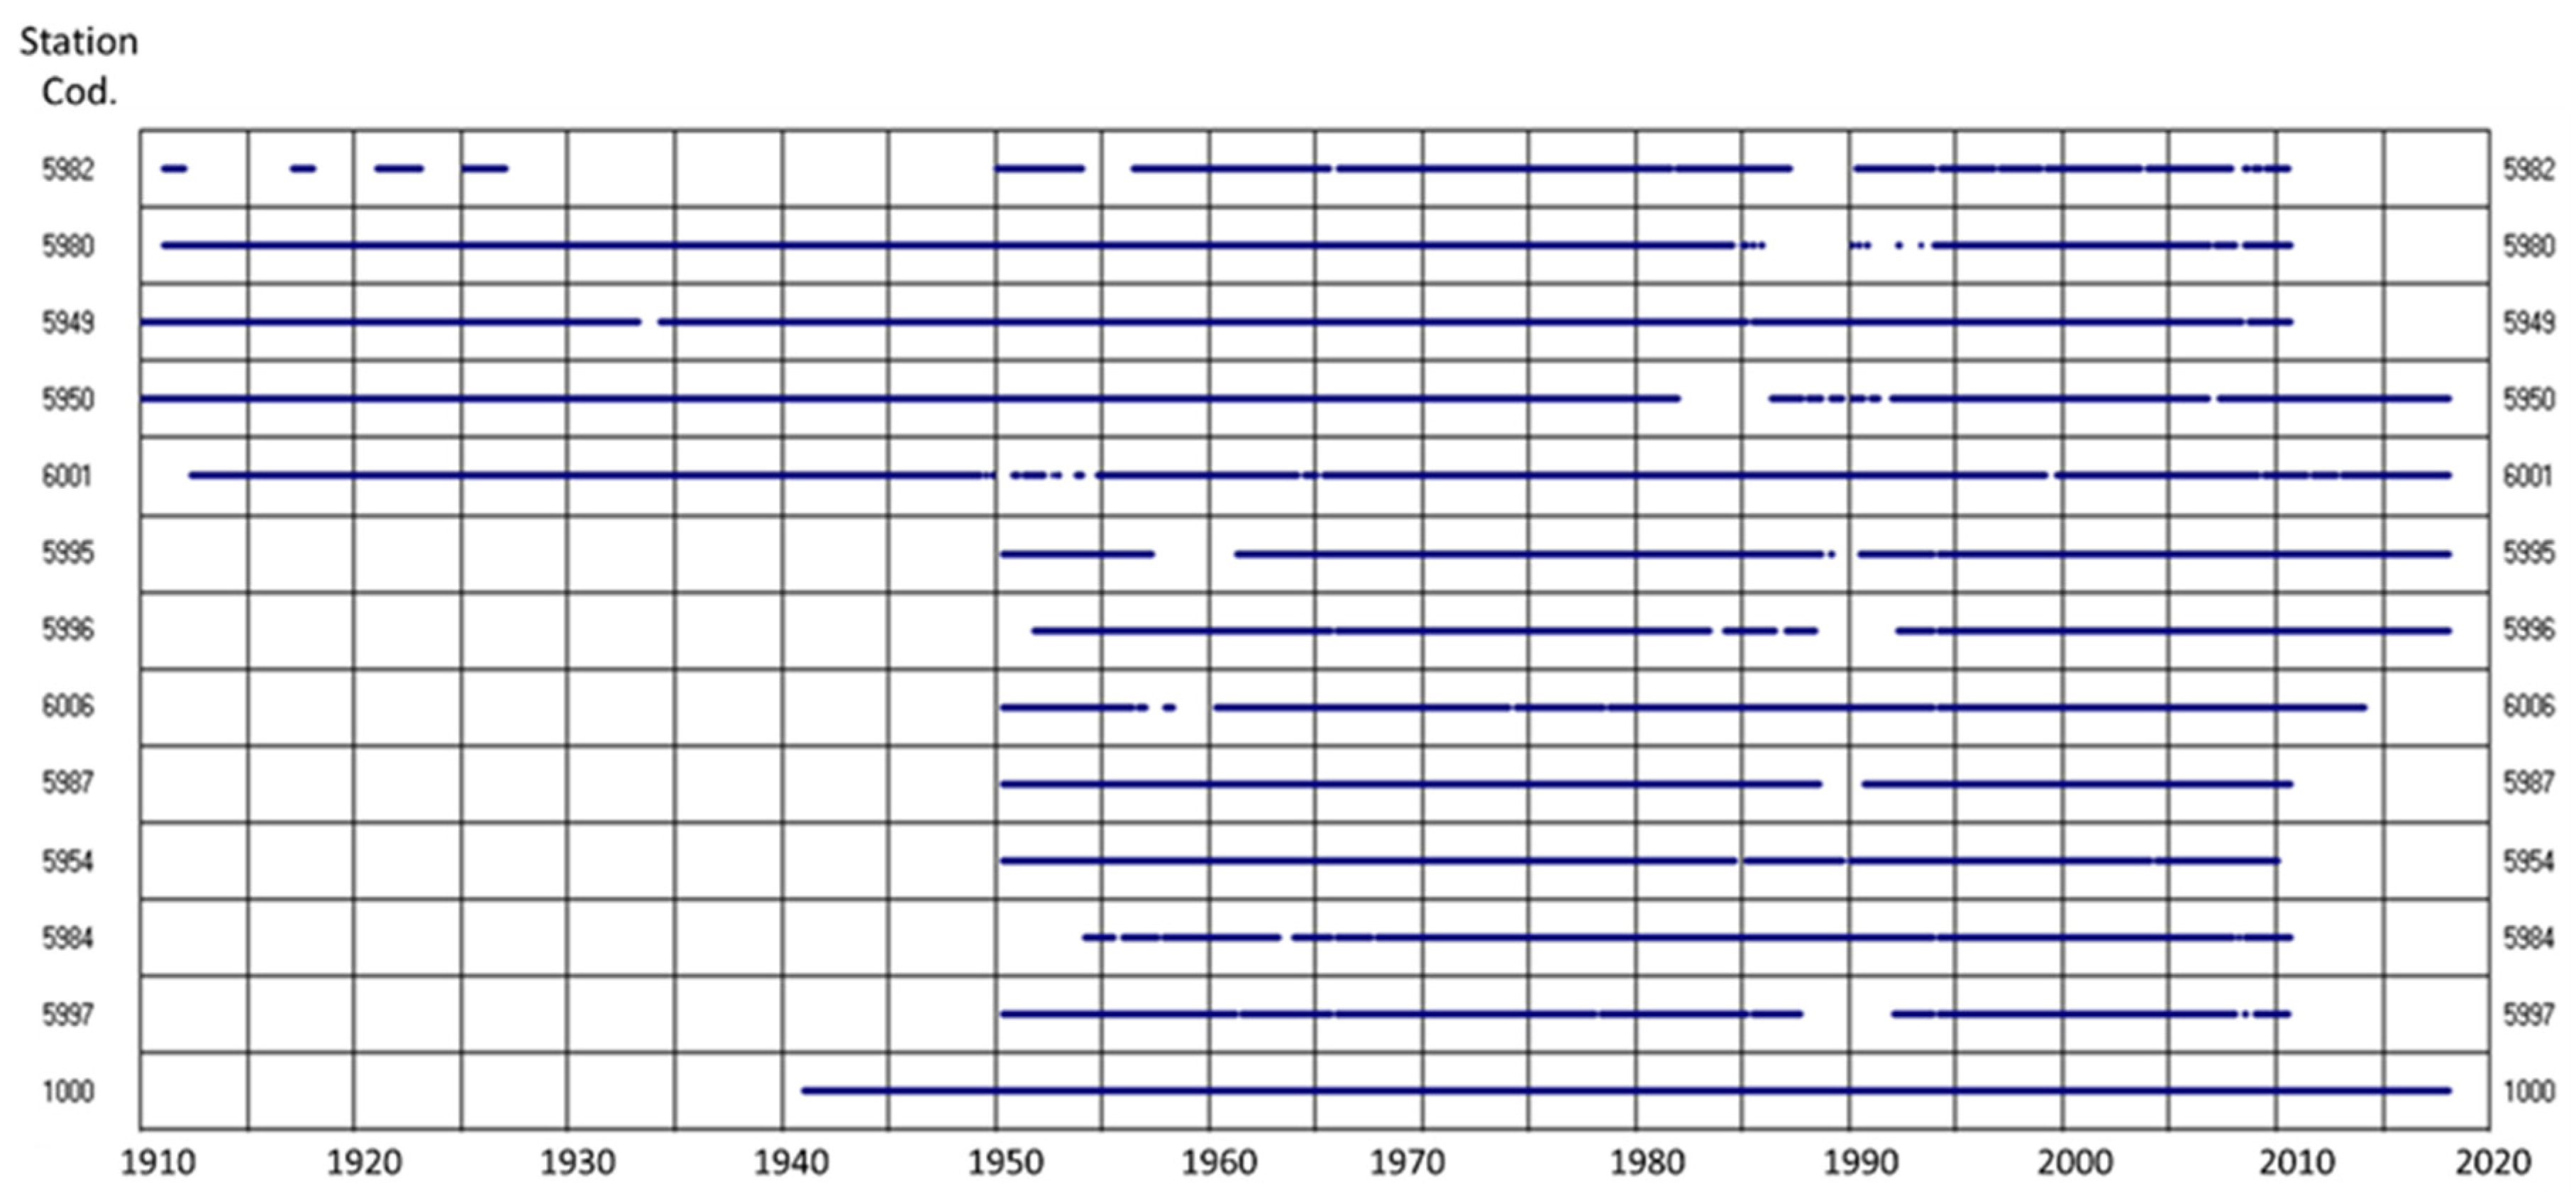
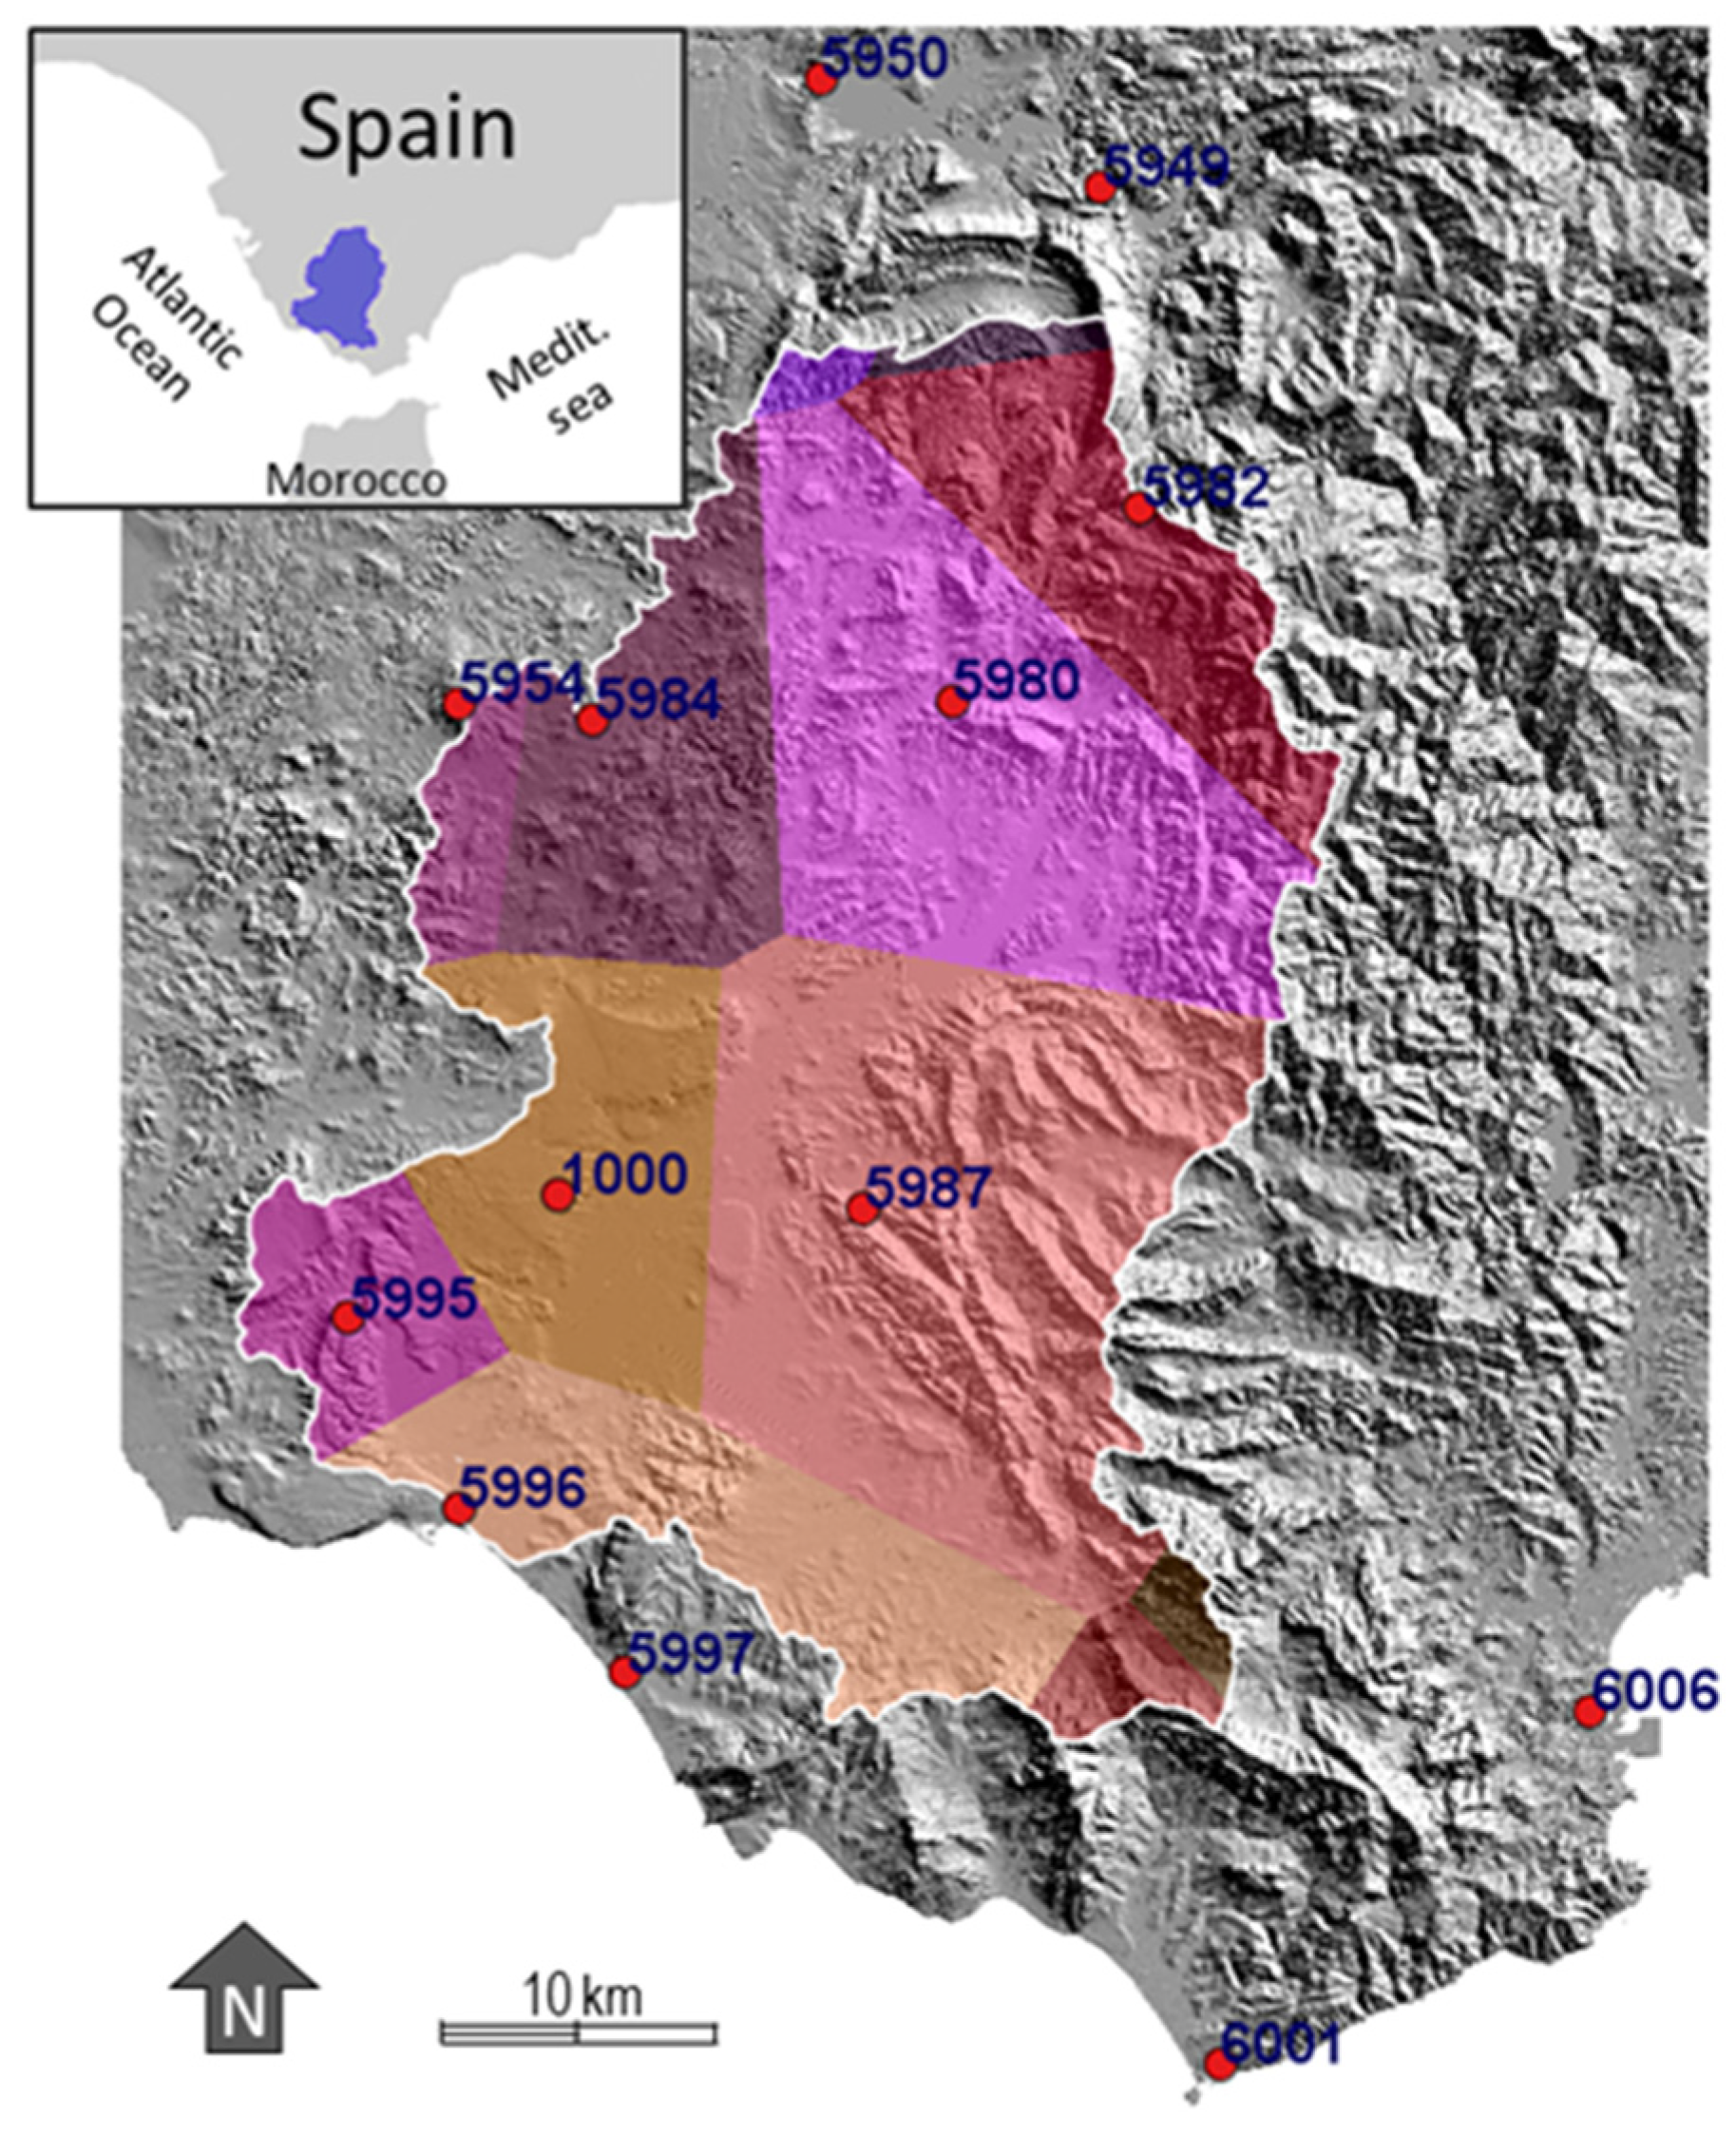
3.1. Precipitation Data

Initially, monthly precipitation data were collected from a total of 67 meteorological stations distributed within the studied basin (1330 km2) and in neighboring areas located less than 15 km from its limits. Of them, 63 stations belong to the State Meteorological Agency (AEMET), 3 to the Andalusian Network of Agroclimatic Stations and 1 a private farmland. Data availability was different for each station; at the stations with the longest registration periods (5 stations), the precipitation records began in 1910/11, while in most of them (26 stations), the records started in the 1950s. From the set of 67 stations, only 13 were finally selected for the generation of a 108-year average precipitation series comprising the years 1910/11–2017/2018, whereas the remaining 54 were used in the series completion process. It should be noted that the hydrological year in Spain starts on 1 October and ends on 30 September because the dry season takes place between June and September.

3.2. Methodology

The proposed methodology, outlined in Figure 2, aims to generate a long-time, monthly precipitation series representative of the selected basin from which to analyze the evolution of rainfall in the last century. The workflow consists of two main stages: data completion, which comprises two substages, and series analysis. (i) The first completion substage, the filling of data gaps, is carried out by substitution and linear regression. (ii) The second substage involves the completion of precipitation records through multivariate regression. (iii) In the second stage, a single monthly precipitation series representative of the basin is generated to analyze seasonal and annual precipitation trends. Finally, the application of the SPI with the 12-month windows allowed characterizing the occurrence and magnitude of droughts during the study period. Each of the workflow stages and criteria applied is described in detail in the subsequent subsections.

3.2.1. Processing of Hydrological Series and Statistical Analysis

In the first stage, the precipitation data of each of the 67 stations were examined according to criteria of record length and geographic location. After an initial screening, 52 stations were selected, and the remaining 15 were used to fill data gaps of the former, as they were located less than 1–2 km away and presented a high correlation coefficient (>0.95). The series was completed by substitution or by linear regression. According to several authors, the minimum length that a series must have to be eligible for completion is 15 years [45,46]. This led to the selection of 46 stations and the elimination of 6 stations whose records had less than 180 monthly data available.
The last step was the systematic completion of data gaps using the software CHAC [47], which enables completing climatic series from a bivariate regression model with a previous monthly stationarization of data series. The application of this method is conditioned by two parameters: the prioritization exponent and the prioritization threshold. The former is the value that weighs the importance of the number of common data between the three climatic stations used for the estimation. The latter is the minimum value of the multiple correlation coefficient used to designate pairs of stations for completing data gaps. The eligible stations should have more than 5 records for each of the 12 months in the period considered.
The application of this criteria led to the selection of 13 stations from which 5 have records starting in 1910/11. The remaining 8 stations were chosen from those with longer registration periods and gap-completion percentages less or near 50%. Figure 3 shows the length of the records from the selected stations prior to their completion with CHAC.
Table 1 describes the characteristics of the 13 stations selected and the percentage of data completed using CHAC.
After completion, a 108-year rainfall series representative of the entire basin was generated through the weighted average of monthly precipitation values of the stations according to their area of influence, which was determined using Thiessen polygons (Figure 4). This rainfall series describes the temporal evolution of annual precipitation and allows analyzing its trends using moving averages. Although some stations have a reduced area of influence and no significant effect on the weighted average values, these were important in the gap-completion stage.

3.2.2. Integration within McKee’s Standardized Precipitation Index (SPI)

To analyze the long-term precipitation pattern and the occurrence of hydrological droughts, the SPI was calculated with the SPI-Generator software [48] using a 12-month time window. The SPI is a meteorological index that depends only on precipitation and allows identifying the wet and dry periods within a series based on the deviations from the long-term mean values in a given timescale. The method consists of fitting the precipitation data to a probabilistic distribution (“gamma distribution”) and transforming it into a normal distribution where the mean SPI value for that location and period is zero [49]. Thus, positive values indicate precipitation above the mean, and negative values indicate precipitation below the mean. McKee et al. [8] propose using the SPI to classify episodes of drought and/or extraordinary rainfall inputs according to the following categories (Table 2).
McKee et al. [8] defined droughts as periods in which the SPI is continuously negative and presents values of −1 or less. More specifically, droughts begin when SPI ≤ −1 and end when the first positive SPI value is reached.
As the SPI values are in units of standard deviation from the long-term mean, they can be applied to compare precipitation anomalies for any geographic location and can be calculated for different timescales. The fact that the SPI only requires precipitation data is an advantage in many locations where other types of data are not available, as is the case of the study area. In addition, its temporal versatility makes it a useful tool for the analysis of drought dynamics and the determination of their onset and end, which is more difficult to track with other indices [50,51]. Owing to its flexibility and applicability, the World Meteorological Organization (WMO) in 2009 recommended this index as the main tool that meteorological and hydrological services should use to monitor and follow drought conditions in their respective countries [52].

4. Results: Precipitation Series Analysis and SPI Evolution

The temporal evolution of the annual precipitation was obtained for the 108-year study period. The mean annual precipitation was 808.9 mm, with values ranging between 364.6 mm in the driest year (1998/99) and 1605.8 mm in the wettest (1962/63), with a standard deviation of 228.4 mm and a coefficient of variation of 28.2%. The frequency distribution is log-normal type (Figure 5a), with an absolute maximum in the interval 750–875 mm. Precipitation equals the mean value ± one standard deviation (interval 580–1040 mm) in 62% of the studied years and is equal to the mean value ± two standard deviations (interval 350–1250 mm) in 95% of the years (with the remaining 5% being very humid). Figure 5b shows the distribution of average monthly precipitation in the study area, where rainfall mainly concentrates in autumn and winter months.
The decade 1960–1969 was particularly humid and included the wettest year (1962/63) of the entire 108-year period. In 1962/63, the amount of precipitation was 98% higher than the average. The second and third wettest years were 1995/96 and 2009/10, with values 77% and 73% higher than the average, respectively. On the contrary, a prolonged drought event that spans from 1941 to 1950 stands out in the 108-year period. Between 1941 and 1950, only three years had precipitation close to the average, and seven years were dry or very dry. The driest year was 1998/99, when rainfall was 55% of the average. The second and third driest years were 1994/95 and 2004/05, with precipitation 51% and 50% lower than the average, respectively.
A noteworthy aspect is the greater irregularity in the occurrence of extreme events. While in the first half of the studied period (1910/11 to 1959/60), the wet years always presented values below 1.200 mm and the dry values always exceeded 500 mm (with the exception of a particularly dry year, 1948/49), in the second half (1960/61 to 2017/18), there were six wet years with rainfall values over 1.200 mm, two of which even exceed 1.400 mm. The number and intensity of dry years also increased, with precipitation values close to 400 mm in three of them. These findings evidence a greater annual irregularity in rainfall, with more proneness to extremes, which is in accordance with current climate projections. The precipitation series suggests a slight downward trend in the order of −15 mm/100 years; however, this value has to be considered cautiously due to the lack of statistical significance and because it is highly influenced by the extreme values of the series.
The 108-year period was treated with moving averages of 3, 5, and 7 elements (Figure 6) in order to smooth high-frequency oscillations and identify cyclical phenomena or long-term trends in the last century. The behavior inferred from this analysis seems to be different in the first and second halves of the series.
The three-element moving average (Figure 6a) allowed detecting a total of 16 oscillations and cycles with periods of approximately 7 years. However, some of these oscillations are of very small amplitude and tend to disappear when the five-element moving average is applied, especially during the first 50 years (Figure 6b). The application of a five-element moving average eliminates the high-frequency oscillations observed between 1910/11 and 1959/60 and only leaves two large oscillations. Subsequently, between 1960/61 and 2017/18, this algorithm evidences 7 clear and well-defined oscillations with amplitudes of approximately 11 years. In the case of the seven-element moving average (Figure 6c), it is difficult to identify a clear trend towards the reduction/increase of rainfall; however, a very wet period in the center of the series and three periods of intense rainfall deficit are detected.
As a complement to the previous analysis, the autocorrelation function was applied to the complete precipitation series and its two halves. The autocorrelogram of the 108-year series evidences a lack of significant time dependence (Figure 7a). Conversely, the correlogram of the first 50 years of the study period (Figure 7b) shows a significant correlation at k = 4 and k = 5, which in light of the moving average analysis, could be interpreted as a cyclicality of approximately 5 years. In that same 50-year period, a time dependence of 20 years is also identified. This 20-year dependence fits the low-frequency cyclicity observed on the left side of Figure 6b,c. Finally, the autocorrelogram of the second half of the study period (Figure 7c) shows a significant correlation at k = 6 and k = 7, which coincides with the cyclicality displayed by the five-element moving average (period of 7–8 years) in that interval of time.
A slight downward trend in winter and spring precipitation (−44 mm/100 years and −15 mm /100 years, respectively) was also detected. On the contrary, as Figure 8 displays, rainfall slightly increased during autumn and summer months (+20 mm/100 years and +12 mm/100 years, respectively). These changes in precipitation might affect the surface and groundwater inputs in the basin owing to a reduction in effective rainfall, which is greater for winter months for this latitude. As previously mentioned, these trends lack statistical significance and should be interpreted with caution, given the sensitivity of this type of adjustment to extreme values. Still, these values are consistent with each other.
Finally, the calculation of the SPI with 12-month windows led to the obtention of a monthly time series for the study period (Figure 9). According to Table 2, 26 periods of drought can be identified, from which 12 are categorized as “severe” (SPI < −1.5) and 6 as “extreme” (SPI < 2), with return periods of 9 and 18 years, respectively.
The description of the onset and end, duration, intensity (SPI extreme values) and magnitude (indicated as the sum of the SPI) of each drought is displayed in Table 3.
Extreme droughts presented average lengths of 21 months and average extreme SPI values of −2.49. From them, the events of 1949–1951, 1999–2000 and 2005–2008 were the most important according to their magnitude.
The characteristics of the wet periods are displayed in Table 4. In this case, the SPI shows that the decade of the 1960s, 1996–97 and 2010–11 were predominantly wet; however, these episodes were significantly shorter than dry periods in the basin. The majority (62%) of periods classified as “very wet” only lasted for 1 or 2 months. On the other hand, only four “extremely wet” periods were identified. These appear concentrated in the second half of the study period, with average lengths of 9.5 months and mean extreme SPI values of 2.96.
In general, the temporal distribution of the SPI shows that the occurrence of extreme episodes, both dry and wet, increased in the second half of the analyzed series. In this regard, it is remarkable that four of the six extreme droughts (two of them with the greatest magnitudes) and two extremely wet episodes (April 1996–February 1997 and April 2010–December 2010) took place in the last 40 years, whereas no extremely humid periods were recorded in the first half of the study period.

5. Discussion

For the study period, the distribution of monthly mean precipitation displayed a marked seasonality throughout the year, with rainfall concentrating in autumn and winter months (October to March) and very low values during the dry season (June to September), a characteristic trait of Mediterranean climates. Regarding the evolution of annual precipitation, the moving averages and autocorrelation treatments allowed identifying a different cyclicity between the first (1910/11–1959/60) and second (1960/61–2017/18) half of the 108-year series, with periods of approximately 5 years and 7–8 years, respectively. This phenomenon was accompanied by an increase in the irregularity of annual precipitation and a greater frequency of extreme events (drought and heavy rainfall years) during the second half of the study period, which was also evidenced by the SPI analysis. These findings are in agreement with those by Merino et al. [32], who reported negative precipitation trends during the last decades for all the regions of the Iberian Peninsula, alternating with short periods of strong positive anomalies. Their results coincide with those of Peña-Gallardo et al. [37] and García-Barrón et al. [53], who also detected an increase in rainfall variability in Andalusia and in the southwest region of the Iberian Peninsula, respectively, especially during the last third of the 20th century.
It is difficult to establish comparisons with studies conducted over other regions of the Iberian Peninsula owing to the different periods, spatial scales and variables considered. In fact, there are numerous discrepancies regarding precipitation trends in the Iberian Peninsula even for similar study periods. Whereas Romero et al. [54], Bladé et al. [55] and Río et al. [56] observed a generalized decrease, Coll et al. [33] did not detect appreciable changes in annual precipitation. The lack of agreement is attributable to several factors. Firstly, different periods, spatial scales and variables are considered. Secondly, the fact that many studies are based on unique precipitation data with variable spatial density and length that are usually unpublished or have restricted access makes them difficult to reproduce. Thirdly, the statistical methods employed and different processes of series completion can act as additional sources of discrepancies. In this case, the 108-year series shows a slight decrease in precipitation (−15 mm in 100 years); however, this figure should be interpreted cautiously given its susceptibility to the extreme values of the period considered. The low magnitude of this decrease, together with its lack of statistical significance, bring into question the results of the predictive models produced by different entities for the beginning of the 21st century (at least for the first decades), as explained later.
The analysis of average annual precipitation per season suggests a slight shift of rainfall from winter towards warmer seasons with higher evapotranspiration rates. These findings are consistent with other studies that highlight a generalized downward trend in winter precipitation in the western and southern sectors of the Iberian Peninsula [56,57,58,59]. In fact, as previous research has evidenced [60,61,62], the Atlantic and Mediterranean façades of the Iberian Peninsula exhibit opposite precipitation trends; while in the western sector (where the study basin is located), spring and winter rainfall has decreased in the last decades, in the eastern sector, it has increased. These changes in precipitation distribution over the western Iberian Peninsula, and their interdecadal variability is closely linked to changes in the North Atlantic oscillation (NAO), a large-scale mode related to westerly winds, storm track and jet stream that greatly determines the variability of precipitation over the Euro-Atlantic area [63,64].
Regarding the SPI, the index allowed detecting 26 events of drought during the 108-year period analyzed, 12 of them being severe (SPI < −1.5) and 6 extreme (SPI < −2.0), with return periods of 9 and 18 years, respectively. Drought distribution was irregular over time, and from the six extreme droughts detected, four took place in the second half of the study period. The longest and most intensive droughts occurred during 1949–1951, 1999–2000 and 2005–2008, coinciding with some of the driest periods that have affected the European continent and the Mediterranean basin [65,66]. Conversely, the periods 1960–70, 1996–97 and 2010–11 were predominantly wet.
To date, the Regional Government of Andalusia has produced several reports and studies to estimate the future impacts of climate change on drought under different emission scenarios using historical series of rainfall and temperature. The first of these reports, “Climate change in Andalusia: current and future climate scenarios” [67], employed historical temperature and precipitation series from more than 2300 stations and the climate models CGCM2 and ECHAM4/OPYC3 for the periods 1960–2100 and 1990–2100, respectively. Its results point out drops of 12.8 and 16% of precipitation (with respect to the average) for the periods 2011–40 and 2041–70 in the province of Cadiz, which nearly doubles at the end of the century, with a rainfall decrease by 30% in 2071–2100. On the other hand, the “Andalusian Plan for Climate Action—Adaptation Programme” [68] applied downscaling techniques and the models CGCM2 and ECHAM4 to forecast temperature and precipitation variations under three emission scenarios from the IPCC 2007 (SRES, B2, A2) for the period 2000–2100. In this case, the limited number of stations (500) resulted in lower spatial resolution, but the general trend was similar to that from the previous report, with a relatively constant decrease in rainfall at the beginning of the century and a notable reduction in the last 30 years of the study period. According to this document, the percentage of rainfall reduction will range between 2 and 10% until 2070 depending on the scenario, reaching a 15% reduction by the last third of the century in all cases. More recently, the report “The Climate of Andalusia in the XXI century. Local Scenarios of Climate Change in Andalusia. Update to the 4th IPCC Report, 2014” [69] attempted to forecast climate variations and their effects over the Andalusian region following a similar approach, but applying a greater number of climate models (BCM2, EGMAM, CNCM3, ECHAM5) and emission scenarios (A1b, A2, B1). This report shows that drops in mean annual rainfall would vary between a minimum of 13.7% (EGMAM, scenario A2) and a maximum of 26.6% (BCM2, scenario A2) by the end of the century. For the Barbate River basin, the report forecasts a reduction in precipitation of 250–300 mm in the period 2070–2100 according to the CNCM3 model, which represents an intermediate situation between the most optimistic and the most unfavorable projections. While all of these reports provide evidence that dry periods are likely to increase and become more intense in most of the Andalusian territory, the estimated percentages and figures vary to a greater or lesser extent due to the notable uncertainty to which these models are subject. This uncertainty stems from the model chosen and other factors such as the location of the study area, its orographic complexity, the number of stations considered, periods analyzed and data inhomogeneity among others, which will influence the goodness of the predictions and aspects such as spatial resolution. In this regard, the present research also indicates an increase in the irregularity of rainfall; however, it does not evidence a clearly downward trend in precipitation in recent decades. In addition, our results reveal an increase in the frequency, duration and magnitude of drought events in the second half of the analyzed period, which coincides with findings from previous studies [32,35]. This trend, together with the detected shift of winter rainfall towards warmer months, when evapotranspiration reached very high levels, might accentuate water stress in the study area and have manifold consequences on the Barbate River basin. A reduction in effective rainfall would lead to further decline of runoff and streamflow in the already highly regulated basin, compromising the inputs to the reservoir and the possibility of meeting irrigation demands in this eminently agricultural area. Similarly, subsurface runoff and groundwater recharge could potentially decrease. These hydrological changes will also affect the current water management and reservoir operating rules, which will have to be reformulated and adapted to a scenario of greater irregularity over longer periods of time. In addition, alteration of river regimes would also affect riparian ecosystems and species composition, favoring those more drought tolerant.
Although the main limitation attributed to the SPI is the use of a single meteorological element for describing a complex phenomenon, precipitation is the major driver of meteorological droughts [70,71],s and numerous studies have demonstrated the efficiency of SPI even when compared with other indexes of greater complexity [14,72]. The SPI allows obtaining in a simple way meaningful information on the main features of droughts and identifying the onset of this creeping natural hazard, which is crucial for the development of adequate adaptation and mitigation strategies at the basin scale. The results of this research will be useful to fill climatic information gaps in the Barbate River basin (also in the province of Cádiz), where the importance of irrigated agriculture and the significant water stress requires better-informed decision making and the elaboration of early warning systems. In addition, this information can aid in the design of decision support systems, a methodology that has recently been proposed by Ruiz-Ortiz et al. [42] in the area to analyze the adequacy of several water management strategies such as the joint use of surface and groundwater under different rainfall and evaporation scenarios.

6. Conclusions

In this study, a representative monthly precipitation series of the Barbate River basin has been generated for a period of 108 years, from 1910/11 to 2017/18. The occurrence of droughts has been assessed based on the frequency, magnitude and duration of the events according to the standardized precipitation index (SPI) in conjunction with other analysis techniques. The main findings of this study are as follows:
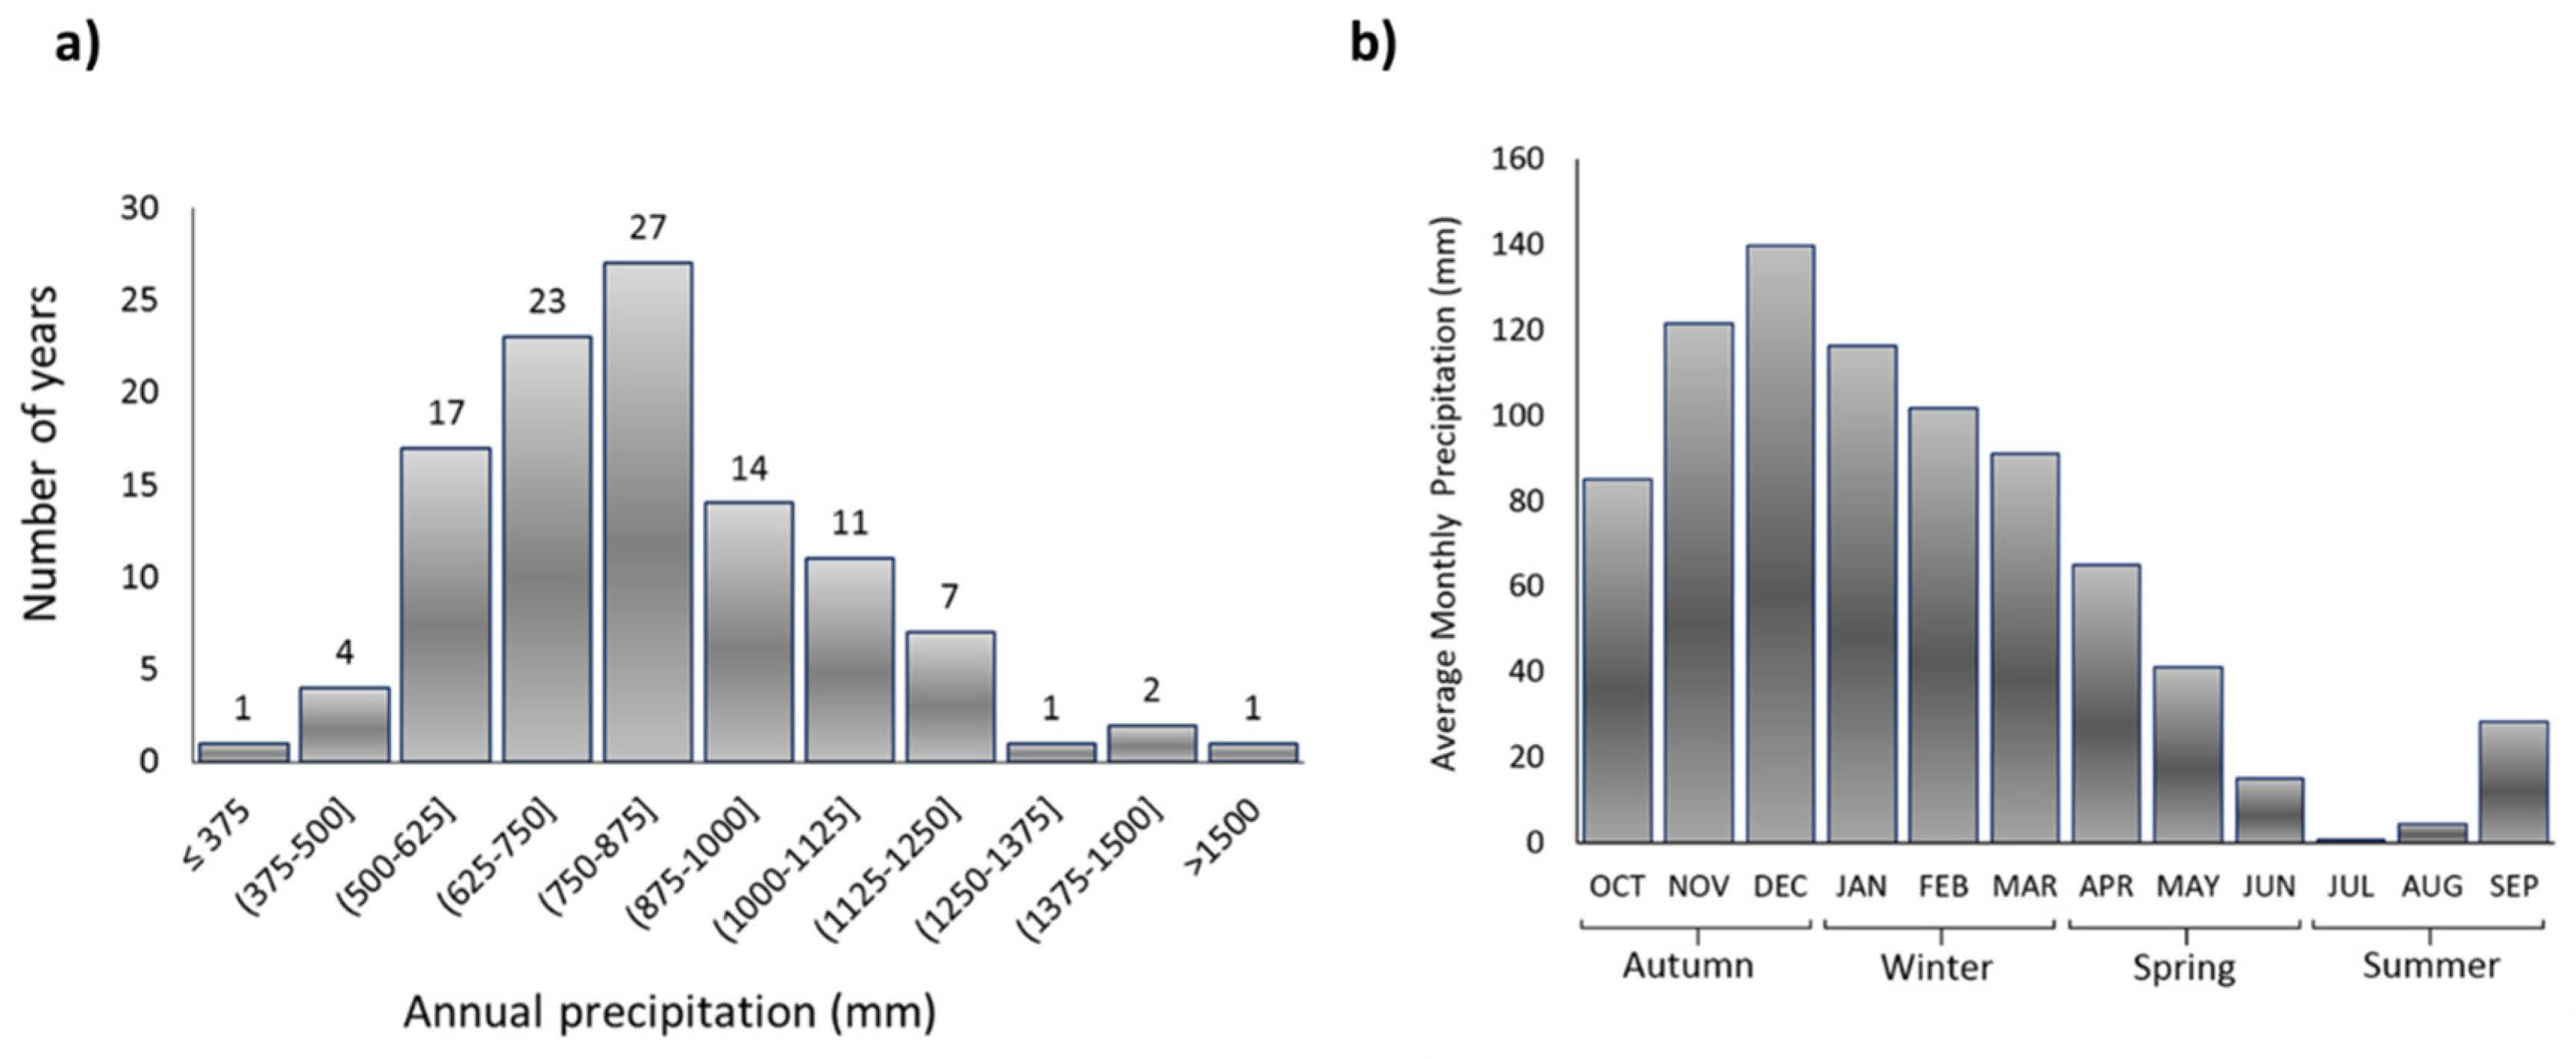
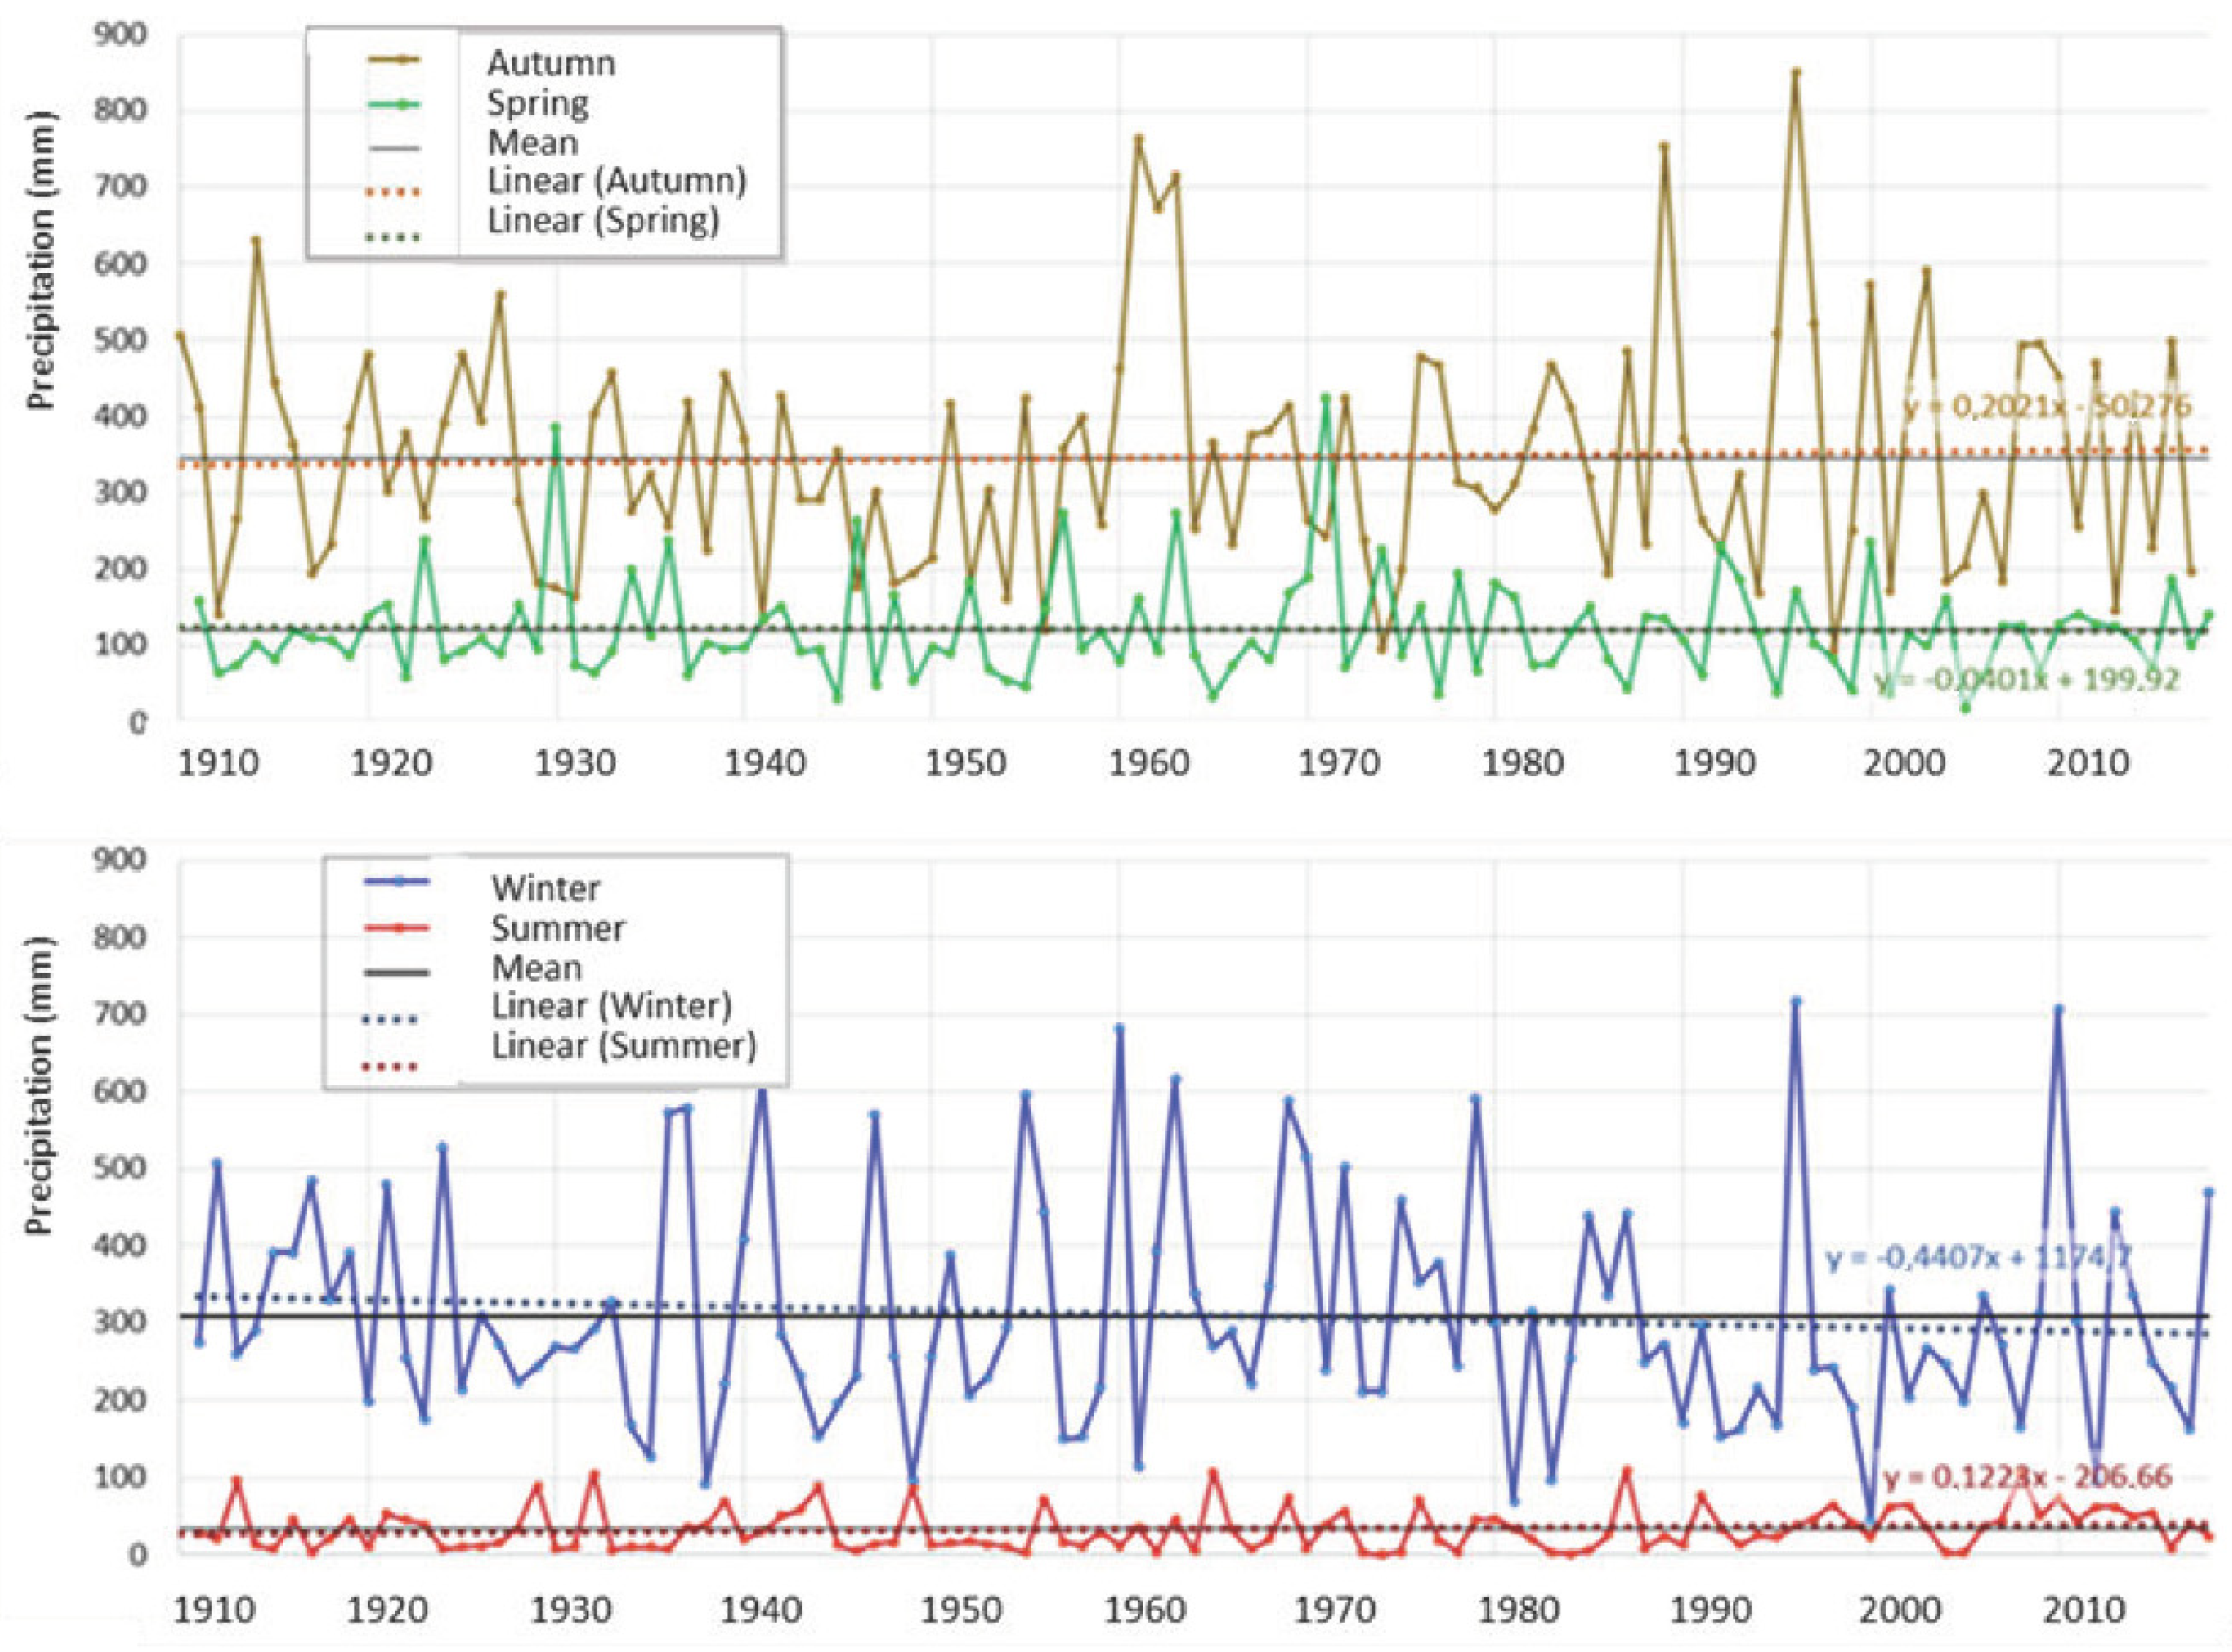
  • The distribution of monthly mean precipitation shows a marked seasonality, in line with the typical patterns of Mediterranean climates. Rainfall concentrates between the end of the autumn and winter months (October to March), with average precipitation exceeding 85 mm/month and a maximum of 140 mm/month in December. Conversely, in summer months, mean monthly rainfall is less than 20 mm/month. Seasonal analysis throughout the study period evidenced a slight shift in winter rainfall towards autumn and summer months, which could lead to a reduction in effective rainfall.
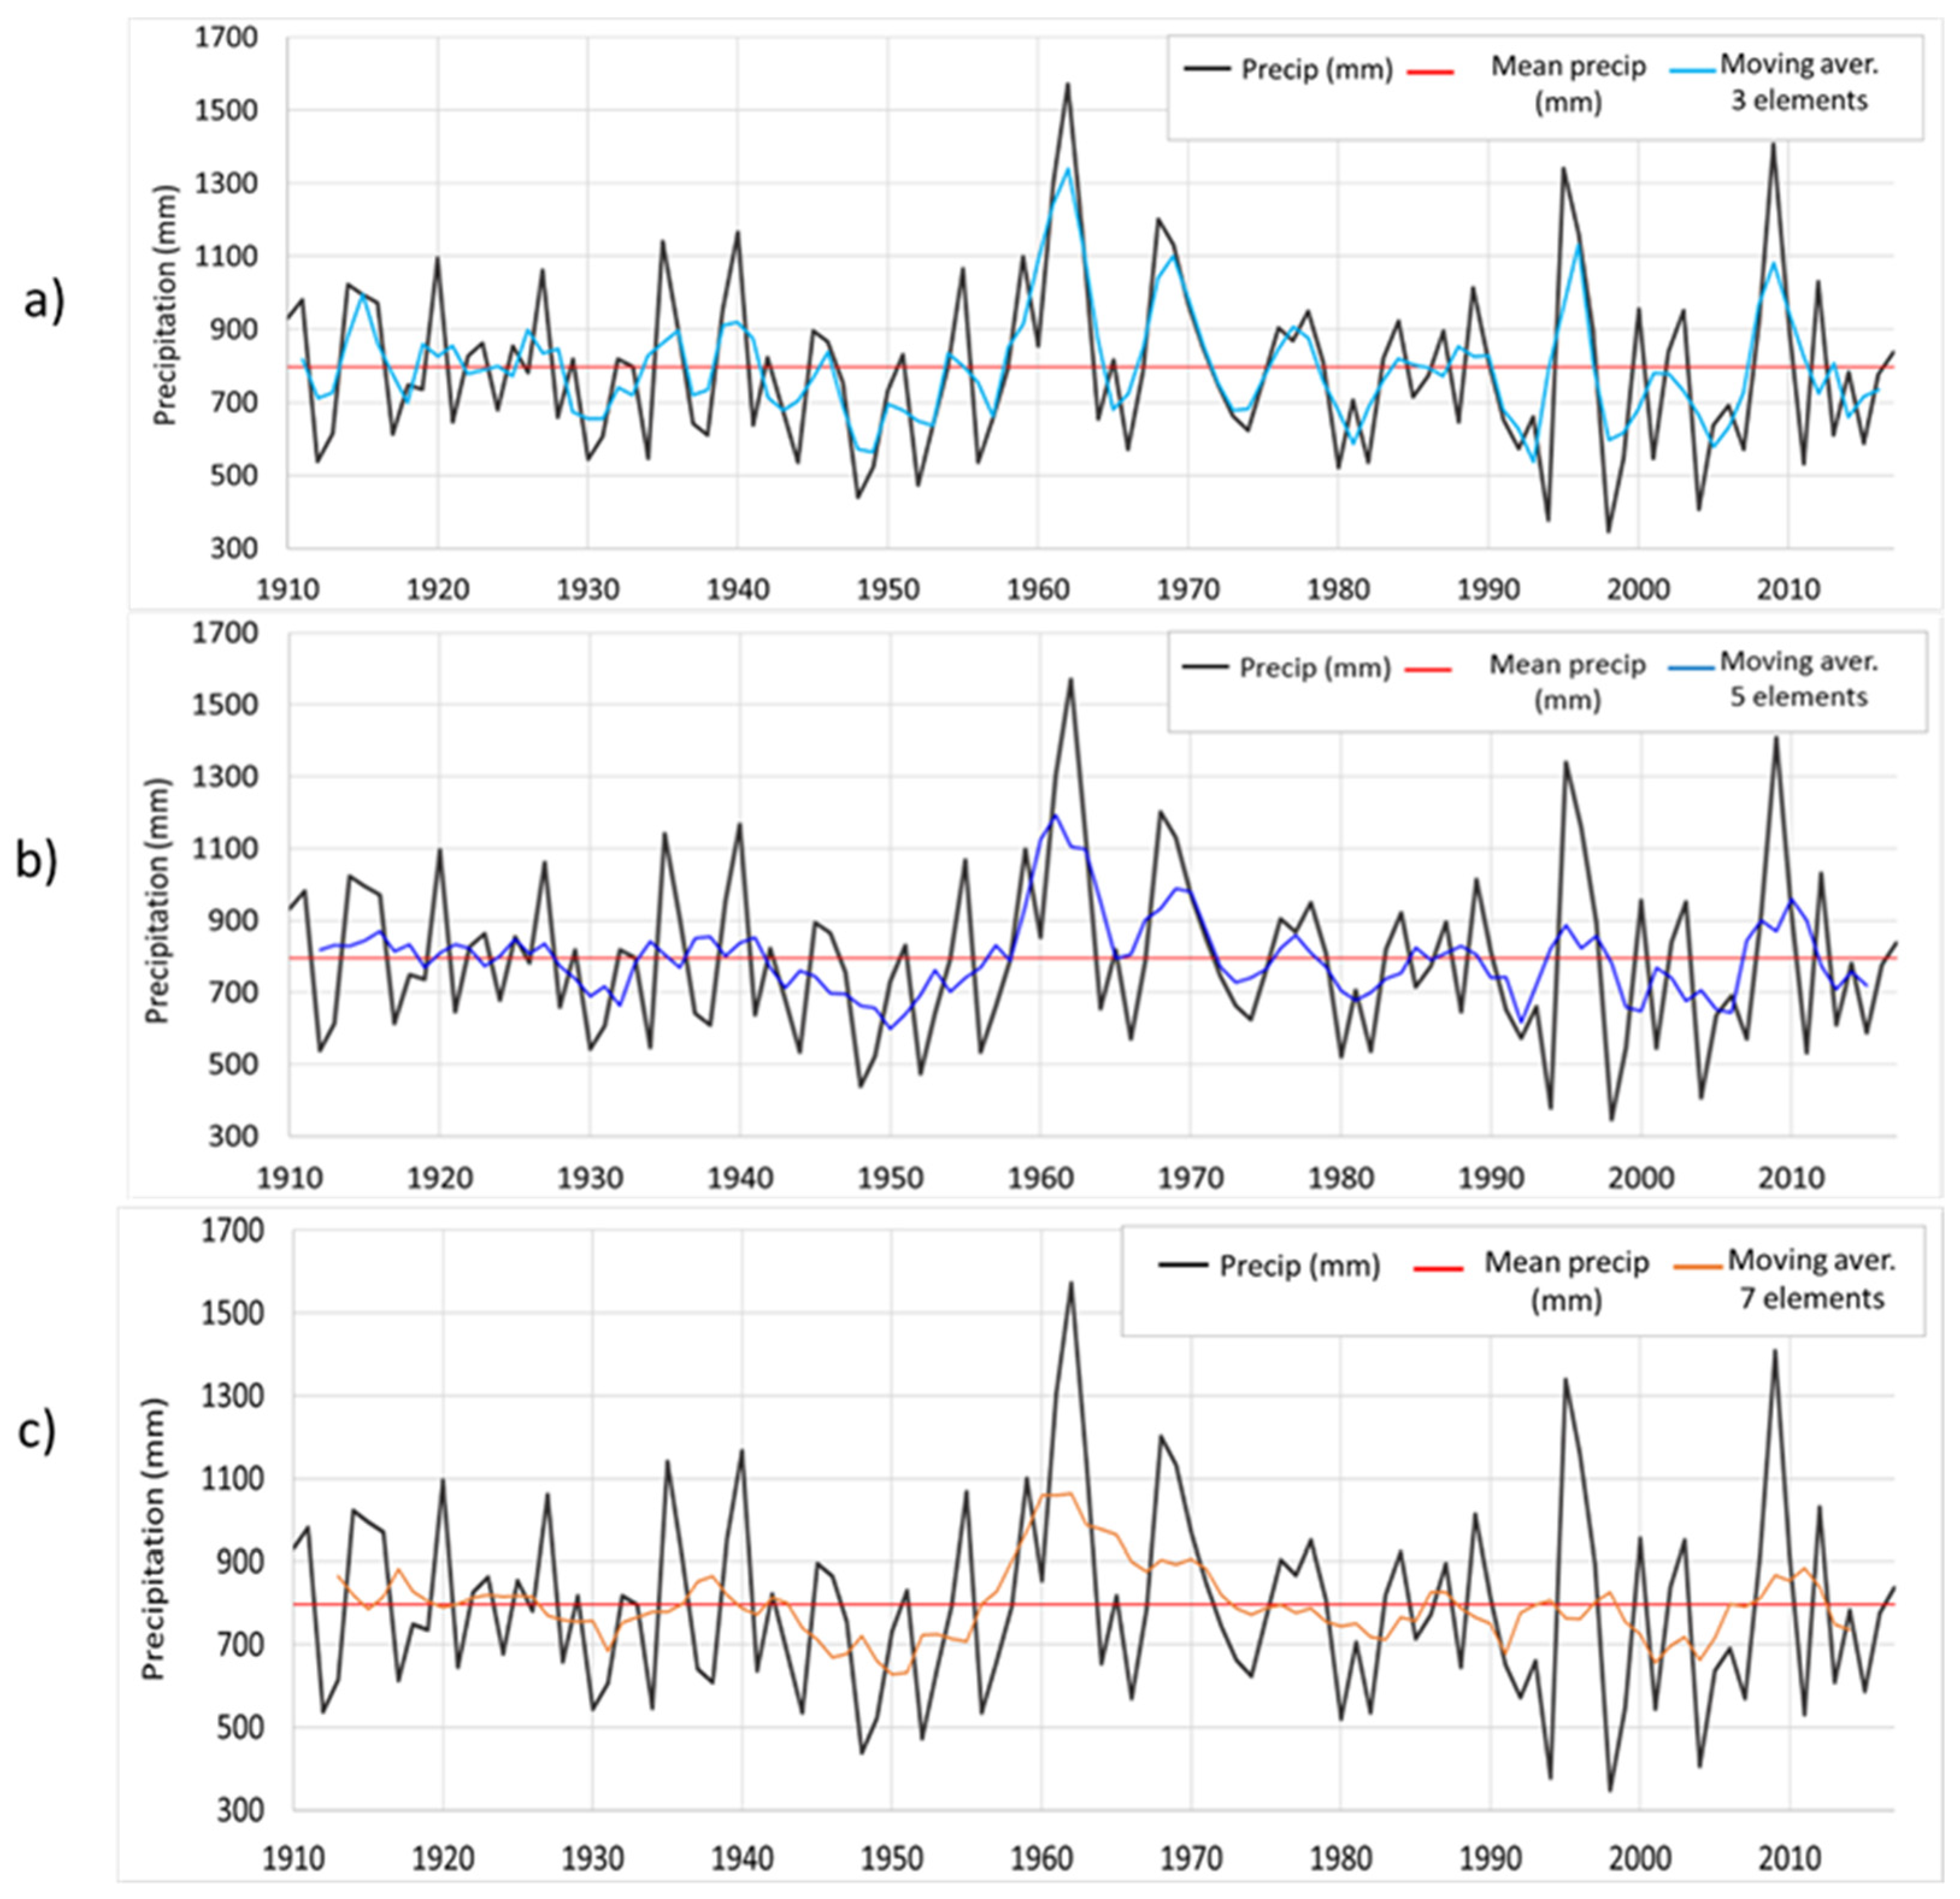
  • The interannual variation of precipitation for the whole basin ranges between the 365 mm recorded in the dry year 1998/99 and the 1606 mm in the wet year 1962/63, with a coefficient of variation of 28.2%. The analysis of average precipitation indicated that the period 1940–1950 was very dry, with an average rainfall close to 720 mm/year (11% below the basin’s average). On the contrary, the decade 1960–70 was very humid, with rainfall close to 1000 mm/year (23% higher than the average). In addition, a clear change in the precipitation pattern that affects the cyclicity, frequency and intensity of dry and wet episodes was detected. In this regard, precipitation displays greater irregularity since the 1960s, with droughts and wet periods of greater intensity and frequency.
  • Although the 108-year series does not display a clear downward trend and precipitation remains relatively stable, a slight decrease in the order of 15 mm/100 years was detected. This figure has to be interpreted cautiously given its susceptibility to the extreme values of the period considered. In any case, no significant trend towards a decrease in precipitation was detected, contrary to the predictive models of climate change, particularized to the study area.
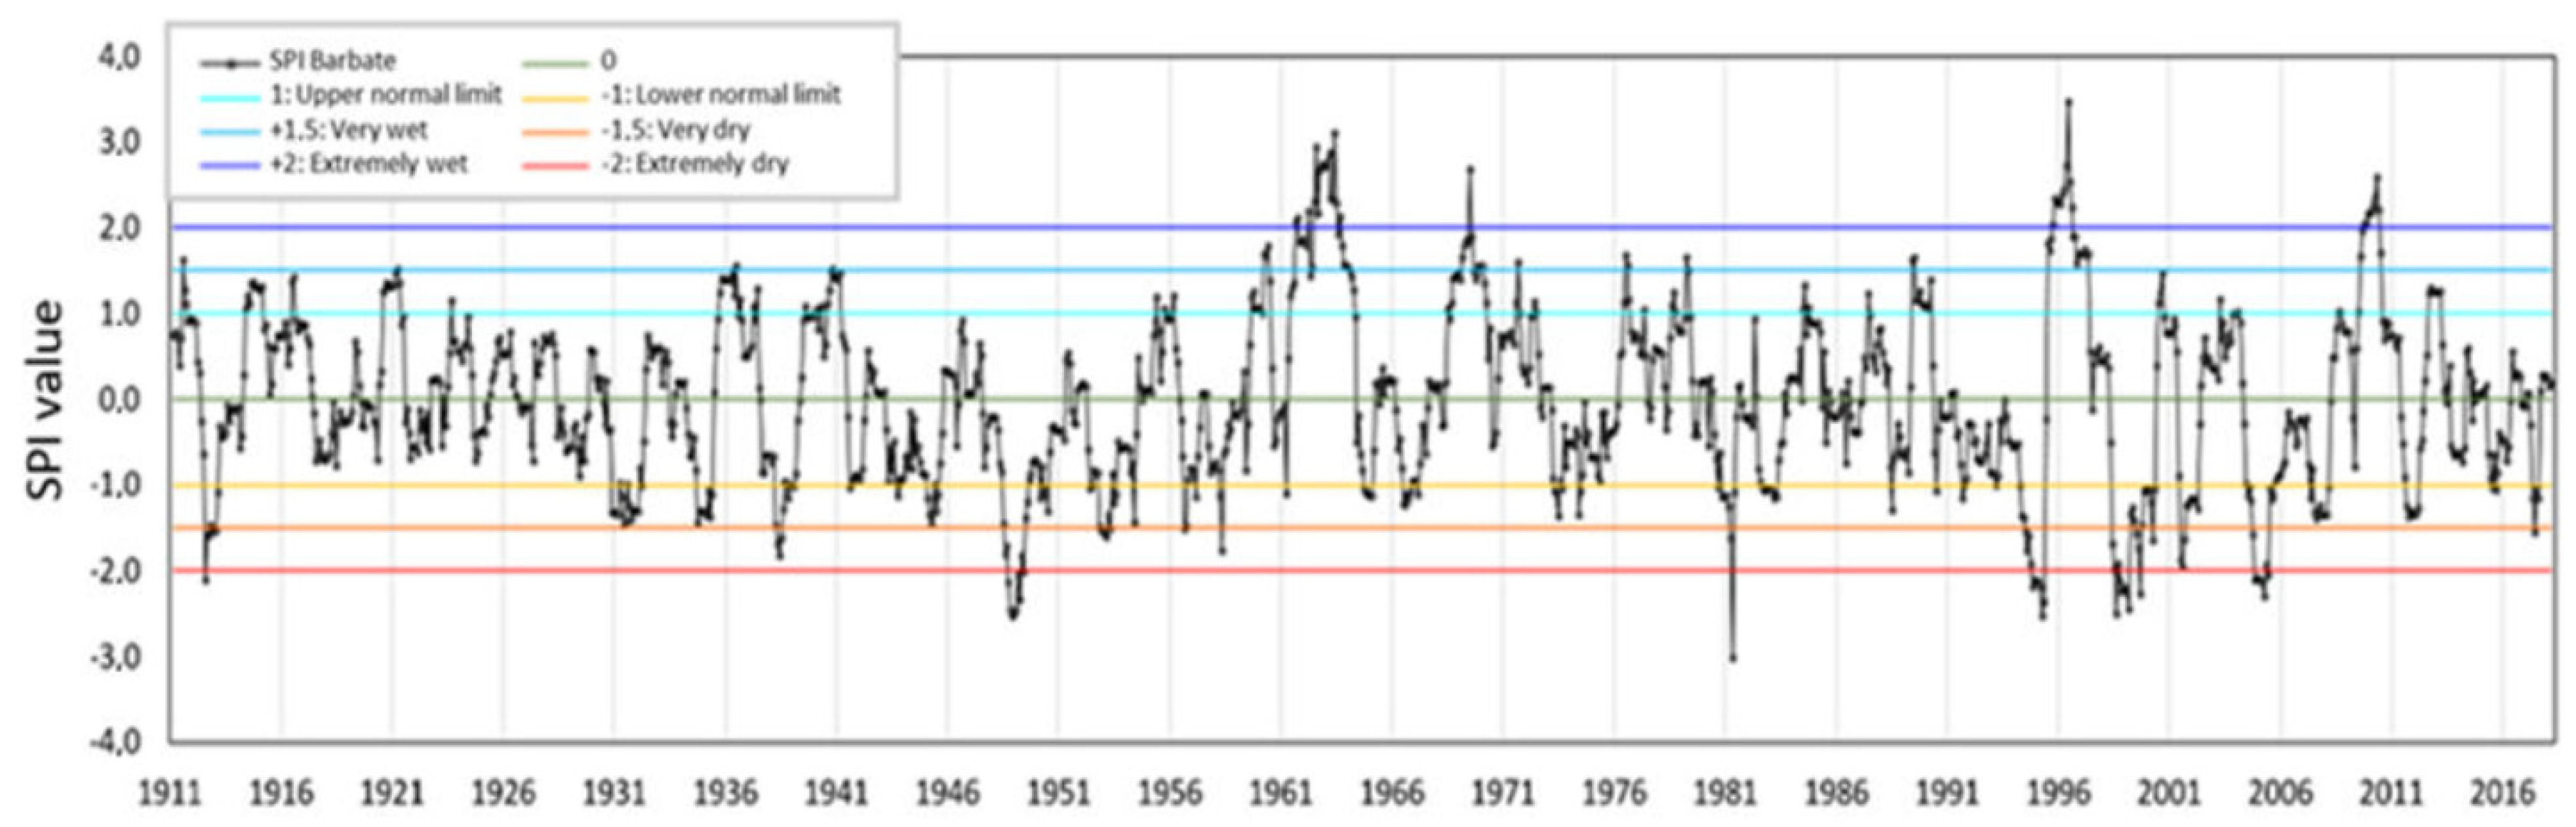
  • The SPI enabled identifying 26 events of drought during the 108-year period analyzed, of which 12 were severe (SPI < −1.5) and 6 extreme (SPI < −2.0), with return periods of 9 and 18 years, respectively. The distribution of droughts was uneven over the 108-year period. Of the six extreme droughts detected, four took place in the second half of the study period. Likewise, in the case of wet episodes, of the four extremely wet periods, and three took place in the second half of the series.
  • The study area is very likely to undergo longer and more severe drought episodes in the future; thus, having detailed information on precipitation series and drought duration, magnitude, frequency and return periods is crucial to devise early warning systems and for better water management and impact mitigation.
The authors are confident that the research presented here will be useful for future drought monitoring and climate modeling tasks in the Barbate River basin and as a tool for the elaboration of drought preparedness plans.

Author Contributions

Conceptualization, M.V.-N. and S.G.-L., methodology, S.G.-L., M.V.-N. and V.R.-O., investigation, M.V.-N., S.G.-L., V.R.-O., S.Z. and J.L.M.; data curation, S.G.-L. and V.R.-O.; writing—original draft preparation, M.V.-N. and S.G.-L.; writing—review and editing, M.V.-N., S.G.-L., V.R.-O., S.Z. and J.L.M.; supervision, M.V.-N., S.G.-L., V.R.-O., S.Z. and J.L.M. All authors have read and agreed to the published version of the manuscript.

Funding

This research was funded by the Biodiversity Foundation of the Ministry for the Ecological Transition (Project REMABAR, code PRCV00621) and the research group RNM373-Geociencias-UCA of Junta de Andalucía.

Data Availability Statement

Data are available from the corresponding author upon request.

Acknowledgments

This work has been developed within the framework of the REMABAR project, supported by the Biodiversity Foundation of the Ministry for the Ecological Transition.

Conflicts of Interest

The authors declare no conflict of interest.

References

  1. World Meteorological Organization (WMO). Report on Drought and Countries Affected by Drought During 1974–1985; WMO: Geneva, Switzerland, 1986; Volume 118, p. 22. [Google Scholar]
  2. IPCC. The Intergovernmental Panel on Climate Change. Glossary. Available online: https://www.ipcc.ch/sr15/chapter/glossary/ (accessed on 10 August 2021).
  3. Wilhite, D.A.; Svoboda, M.D.; Hayes, M.J. Understanding the complex impacts of drought: A key to enhancing drought mitigation and preparedness. Water Resour. Manag. 2007, 21, 763–774. [Google Scholar] [CrossRef] [Green Version]
  4. Wilhite, D.A.; Glantz, M.H. Understanding the drought phenomenon: The role of definitions. Water Int. 1985, 10, 111–120. [Google Scholar] [CrossRef] [Green Version]
  5. Heim, R. A Review of Twentieth- Century Drought Indices Used in the United States. Am. Meteorol. Soc. 2002, 83, 1149–1166. [Google Scholar] [CrossRef] [Green Version]
  6. Dai, A.; Trenberth, K.E.; Karl, T.R. Global variations in droughts and wet spells: 1900–1995. Geophys. Res. Lett. 1998, 25, 3367–3370. [Google Scholar] [CrossRef] [Green Version]
  7. Strzepek, K.; Yohe, G.; Neumann, J.; Bohelert, B. Characterizing changes in drought risk for the United States from climate change. Environ. Res. Lett. 2010, 5, 044012. Available online: https://iopscience.iop.org/article/10.1088/1748-9326/5/4/044012/meta (accessed on 10 February 2022). [CrossRef]
  8. McKee, T.B.; Doesken, N.J.; Kleist, J. The relation of drought frequency and duration to time scales. In Proceedings of the Eighth Conference on Applied Climatology, Anaheim, CA, USA, 17–22 January 1993; Department of Atmospheric Science Colorado State University: Fort Collins, CO, USA, 1993; Volume 17, pp. 179–184. [Google Scholar]
  9. Palmer, W.C. Meteorological Drought; US Department of Commerce, Weather Bureau: Washington, DC, USA, 1965; pp. 1–65.
  10. Tsakiris, G.; Vangelis, H. Towards a Drought Watch System based on spatial SPI. Water Resour. Manag. 2004, 18, 1–12. [Google Scholar] [CrossRef]
  11. Weghorst, K. The Reclamation Drought Index. Guidelines and Practical Applications; Bureau of Reclamation: Denver, CO, USA, 1996; p. 6.
  12. Byun, H.R.; Wilhite, D.A. Objective quantification of drought severity and duration. J. Clim. 1999, 12, 2747–2756. [Google Scholar] [CrossRef]
  13. Tsakiris, G.; Pangalou, D.; Vangelis, H. Regional drought assessment based on the Reconnaissance Drought Index (RDI). Water Resour. Manag. 2007, 21, 821–833. [Google Scholar] [CrossRef]
  14. Keyantash, J.; Dracup, J.A. The Quantification of Drought: An Evaluation of Drought Indices. Bull. Am. Meteorol. Soc. 2002, 83, 1167–1180. [Google Scholar] [CrossRef]
  15. Hayes, M. Drought Indices. In Van Nostrand′s Scientific Encyclopedia; John Wiley & Sons, Inc.: Hoboken, NJ, USA, 2006. [Google Scholar] [CrossRef]
  16. Zargar, A.; Sadiq, R.; Naser, B.; Khan, F. A review of drought indices. Environ. Rev. 2011, 19, 333–349. [Google Scholar] [CrossRef]
  17. Morid, S.; Smakhtin, V.; Bagherzadeh, K. Drought forecasting using artificial neural networks and time series of drought indices. Int. J. Climatol. 2007, 27, 2103–2111. [Google Scholar] [CrossRef]
  18. Borji, M.; Malekian, A.; Salajegheh, A.; Ghadimi, M. Multi-time-scale analysis of hydrological drought forecasting using support vector regression (SVR) and artificial neural networks (ANN). Arab. J. Geosci. 2016, 9, 725. [Google Scholar] [CrossRef]
  19. Tian, Y.; Xu, Y.P.; Wang, G. Agricultural drought prediction using climate indices based on Support Vector Regression in Xiangjiang River basin. Sci. Total Environ. 2018, 622–623, 710–720. [Google Scholar] [CrossRef] [PubMed]
  20. Belayneh, A.; Adamowski, J.; Khalil, B.; Ozga-Zielinski, B. Long-term SPI drought forecasting in the Awash River Basin in Ethiopia using wavelet neural networks and wavelet support vector regression models. J. Hydrol. 2014, 508, 418–429. [Google Scholar] [CrossRef]
  21. Khan, M.M.H.; Muhammad, N.S.; El-Shafie, A. Wavelet based hybrid ANN-ARIMA models for meteorological drought forecasting. J. Hydrol. 2020, 590, 125380. [Google Scholar] [CrossRef]
  22. Hoerling, M.; Eischeid, J.; Perlwitz, J.; Quan, X.; Zhang, T.; Pegion, P. On the increased frequency of Mediterranean drought. J. Clim. 2012, 25, 2146–2161. [Google Scholar] [CrossRef] [Green Version]
  23. Dubrovský, M.; Hayes, M.; Duce, P.; Trnka, M.; Svoboda, M.; Zara, P. Multi-GCM projections of future drought and climate variability indicators for the Mediterranean region. Reg. Environ. Chang. 2014, 14, 1907–1919. [Google Scholar] [CrossRef]
  24. Sousa, P.M.; Trigo, R.M.; Aizpurua, P.; Nieto, R.; Gimeno, L.; García-Herrera, R. Trends and extremes of drought indices throughout the 20th century in the Mediterranean. Nat. Hazards Earth Syst. Sci. 2011, 11, 33–51. [Google Scholar] [CrossRef] [Green Version]
  25. Di Lena, B.; Vergni, L.; Antenucci, F.; Todisco, F.; Mannocchi, F. Analysis of drought in the region of Abruzzo (Central Italy) by the Standardized Precipitation Index. Theor. Appl. Climatol. 2014, 115, 41–52. [Google Scholar] [CrossRef]
  26. Hertig, E.; Tramblay, Y. Regional downscaling of Mediterranean droughts under past and future climatic conditions. Glob. Planet. Chang. 2017, 151, 36–48. [Google Scholar] [CrossRef]
  27. Caloiero, T.; Veltri, S.; Caloiero, P.; Frustaci, F. Drought analysis in Europe and in the Mediterranean basin using the standardized precipitation index. Water 2018, 10, 1043. [Google Scholar] [CrossRef] [Green Version]
  28. Vogel, J.; Paton, E.; Aich, V.; Bronstert, A. Increasing compound warm spells and droughts in the Mediterranean Basin. Weather Clim. Extrem. 2021, 32, 100312. [Google Scholar] [CrossRef]
  29. Parracho, A.C.; Melo-Gonçalves, P.; Rocha, A. Regionalisation of precipitation for the Iberian Peninsula and climate change. Phys. Chem. Earth Parts A/B/C 2016, 94, 146–154. [Google Scholar] [CrossRef]
  30. Vicente-Serrano, S.M. Differences in spatial patterns of drought on different time scales: An analysis of the Iberian Peninsula. Water Resour. Manag. 2006, 20, 37–60. [Google Scholar] [CrossRef]
  31. Lorenzo-Lacruz, J.; Vicente-Serrano, J.M.; Gonzalez-Hidalgo, J.C.; López-Moreno, J.I.; Cortesi, N. Hydrological drought response to meteorological drought in the Iberian Peninsula. Clim. Res. 2013, 58, 117–131. [Google Scholar] [CrossRef] [Green Version]
  32. Merino, A.; López, L.; Hermida, L.; Sánchez, J.L.; García-Ortega, E.; Gascón, E.; Fernández-González, S. Identification of drought phases in a 110-year record from Western Mediterranean basin: Trends, anomalies and periodicity analysis for Iberian Peninsula. Glob. Planet. Chang. 2015, 133, 96–108. [Google Scholar] [CrossRef]
  33. Coll, J.R.; Aguilar, E.; Ashcroft, L. Drought variability and change across the Iberian Peninsula. Theoretical and Applied Climatology. Theor. Appl. Climatol. 2017, 130, 901–916. [Google Scholar] [CrossRef] [Green Version]
  34. Páscoa, P.; Gouveia, C.M.; Russo, A.; Trigo, R.M. Drought trends in the Iberian Peninsula over the last 112 years. Adv. Meteorol. 2017, 2017, 4653126. [Google Scholar] [CrossRef] [Green Version]
  35. García-Valdecasas, M.O.; Gámiz-Fortis, S.; Romero-Jiménez, E.; Rosa-Canóvas, J.J.; Yeste, P.; Castro-Díez, Y.; Esteban-Parra, M.J. Projected changes in the Iberian Peninsula drought characteristics. Sci. Total Environ. 2021, 757, 143702. [Google Scholar] [CrossRef]
  36. Vicente-Serrano, S.M. Spatial and temporal analysis of droughts in the Iberian Peninsula (1910–2000). Hydrol. Sci. J. 2006, 51, 83–97. [Google Scholar] [CrossRef]
  37. Peña-Gallardo, M.; Gámiz-Fortis, S.R.; Castro-Díez, Y.; Esteban-Parra, M.J. Análisis comparativo de índices de sequía en Andalucía para el periodo 1901–2012. Cuad. Investig. Geogr. 2016, 42, 67–88. [Google Scholar] [CrossRef] [Green Version]
  38. Ayuso, J.; Ayuso-Ruiz, P.; García-Marín, A.; Estévez, J.; Taguas, E. Local Analysis of the Characteristics and Frequency of Extreme Droughts in Málaga Using the SPI (Standardized Precipitation Index). In Project Management and Engineering. Lecture Notes in Management and Industrial Engineering; Ayuso Muñoz, J., Yagüe Blanco, J., Capuz-Rizo, S., Eds.; Springer: Cham, Switzerland, 2015; pp. 167–179. [Google Scholar] [CrossRef]
  39. Pulido-Calvo, I.; Gutiérrez-Estrada, J.C.; Sanz-Fernández, V. Drought and ecological flows in the lower Guadiana river basin (Southwest Iberian Peninsula). Water 2020, 12, 677. [Google Scholar] [CrossRef] [Green Version]
  40. Kottek, M.; Grieser, J.; Beck, C.; Rudolf, B.; Rubel, F. World map of the Köppen-Geiger climate classification updated. Meteorol. Z. 2006, 15, 259–263. [Google Scholar] [CrossRef]
  41. Zazo, S.; Molina, J.L.; Ruiz-Ortiz, V.; Vélez-Nicolás, M.; García-López, S. Modeling River Runo ff Temporal Behavior through a through a Hybrid Causal–Hydrological (HCH). Method. Water 2020, 12, 3137. [Google Scholar] [CrossRef]
  42. Ruiz-Ortiz, V.; García-López, S.; Solera, A.; Paredes Arquiola, J. Contribution of decision support systems to water management improvement in basins with high evaporation in Mediterranean climates. Hydrol. Res. 2019, 50, 1020–1036. [Google Scholar] [CrossRef]
  43. Ruiz-Ortiz, V.; García-López, S.; Vélez-Nicolás, M.; Sánchez-Bellón, A.; Contreras de Villar, A.; Contreras, F. Learning from hydrological and hydrogeological problems in civil engineering. Study of reservoirs in Andalusia, Spain. Eng. Geol. 2021, 282, 105916. [Google Scholar] [CrossRef]
  44. Vélez-Nicolás, M.; García-López, S.; Ruiz-Ortiz, V.; Sanchez-Bellón, A. Towards a sustainable and adaptive groundwater management: Lessons from the Benalup Aquifer (Southern Spain). Sustainability 2020, 12, 5215. [Google Scholar] [CrossRef]
  45. Acuña, J.; Felipe, O.; Ordoñez, J.; Arboleda, F. Análisis regional de frecuencia de precipitación anual para la determinación de mapas de sequías. Rev. Peru. Geo-Atmos. 2011, 3, 104–115. [Google Scholar]
  46. Núñez, J.H.; Verbist, K.; Wallis, J.R.; Schaefer, M.G.; Morales, L.; Cornelis, W.M. Regional frequency analysis for mapping drought events in north-central Chile. J. Hydrol. 2011, 405, 352–366. [Google Scholar] [CrossRef] [Green Version]
  47. CEDEX (Centro de Estudios y Experimentación de Obras Públicas). CHAC: Cálculo Hidrometeorológico de Aportaciones y Crecidas. Manual CHAC; CEDEX: Madrid, Spain, 2013; 76p, Available online: http://ceh-flumen64.cedex.es/chac/ (accessed on 23 January 2022).
  48. National Drought Mitigation Center. SPI Program. Available online: https://drought.unl.edu/monitoring/SPI/SPIProgram.aspx (accessed on 27 March 2021).
  49. European Drought Observatory, European Commission. SPI: Standardized Precipitation Index; EDO: Munchen, Germany, 2020; p. 6. Available online: https://edo.jrc.ec.europa.eu/documents/factsheets/factsheet_spi.pdf (accessed on 17 September 2021).
  50. Chervenkov, H.; Tsonevsky, I.; Slavov, K. Presentation of Four Centennial-long Global Gridded Datasets of the Standardized Precipitation Index. Int. J. Environ. Agric. Res. 2015, 2, 93–105. [Google Scholar]
  51. Rahmat, S.N.; Jayasuriya, N.; Bhuiyan, M. Assessing droughts using meteorological drought indices in Victoria, Australia. Hydrol. Res. 2015, 46, 463–476. [Google Scholar] [CrossRef]
  52. Hayes, M.; Svoboda, M.; Wall, N.; Wildhalm, M. The lincoln declaration on drought indices: Universal meteorological drought index recommended. Bull. Am. Meteorol. Soc. 2011, 92, 485–488. [Google Scholar] [CrossRef] [Green Version]
  53. García-Barrón, L.; Aguilar, M.; Sousa, A. Evolution of annual rainfall irregularity in the southwest of the Iberian Peninsula. Theor. Appl. Climatol. 2011, 103, 13–26. [Google Scholar] [CrossRef]
  54. Romero, R.; Guijarro, J.A.; Ramis, C.; Alonso, S. A 30-year (1964–1993) daily rainfall data base for the Spanish Mediterranean regions: First exploratory study. Int. J. Climatol. 1998, 18, 541–560. [Google Scholar] [CrossRef]
  55. Bladé, I.; Castro-Díez, Y.; Gutiérrez, J.M.; Herrera, S.; López-Moreno, J.I.; Vicente-Serrano, S. Tendencias atmosféricas en la Península Ibérica durante el periodo instrumental en el contexto de la variabilidad natural. In Clima en España: Pasado, Presente y Futuro; Pérez, F.F., Boscolo, R., Eds.; Ministerio de Ciencia e Innovación, Ministerio de Medio Ambiente y Medio Rural y Marino: Madrid, Spain, 2010; pp. 25–42. Available online: http://www.clivar.es/?q=es (accessed on 11 June 2021).
  56. Río, S.; Herrero, L.; Fraile, R.; Penas, A. Spatial distribution of recent rainfall trends in Spain (1961–2006). Int. J. Climatol. 2011, 31, 656–667. [Google Scholar] [CrossRef]
  57. Paredes, D.; Trigo, R.M.; García-Herrera, H.; Trigo, I.F. Understanding precipitation changes in Iberia in early spring: Weather typing and storm-tracking approaches. J. Hydrometeorol. 2006, 7, 101–113. [Google Scholar] [CrossRef] [Green Version]
  58. García, J.A.; Gallego, M.C.; Serrano, A.; Vaquero, J.M. Trends in block-seasonal extreme rainfall over the Iberian Peninsula in the second half of the twentieth century. J. Clim. 2007, 20, 113–130. [Google Scholar] [CrossRef]
  59. López-Bustins, J.A.; Sánchez-Lorenzo, A.; Azorín-Molina, C.; Ordóñez-López, A. Tendencias de la Precipitación Invernal en la Fachada Oriental de la Península Ibérica. In Cambio Climático Regional y sus Impactos; Sigró Rodríguez, J., Brunet India, M., Anfrons, E.A., Eds.; Asociación Española de Climatología: Tarragona, Spain, 2008; pp. 161–171. Available online: http://hdl.handle.net/20.500.11765/8562 (accessed on 22 October 2021).
  60. Hidalgo-Muñoz, J.M.; Argüeso, D.; Gámiz-Fortis, S.R.; Esteban-Parra, M.J.Y.; Castro-Díez, Y. Variability of the extreme rainfall events in the South of the Iberian Peninsula. Geophys. Res. Abstr. 2009, 11, 7771–7772. [Google Scholar]
  61. Hidalgo-Muñoz, J.M.; Argueso, D.; Gamiz-Fortis, S.R.; Esteban-Parra, M.J.; Castro-Diez, Y. Trends of extreme precipitation and associated synoptic patterns over the southern Iberian Peninsula. J. Hydrol. 2011, 409, 497–511. [Google Scholar] [CrossRef]
  62. Halifa-Marín, A.; Lorente-Plazas, R.; Pravia-Sarabia, E.; Montávez, J.P.; Jiménez-Guerrero, P. Atlantic and Mediterranean influence promoting an abrupt change in winter precipitation over the southern Iberian Peninsula. Atmos. Res. 2021, 253, 105485. [Google Scholar] [CrossRef]
  63. Trigo, R.M.; Pozo-Vázquez, M.; Osborn, T.; Castro-Díez, Y.; Gámiz-Fortis, S.; Esteban-Parra, M.J. North Atlantic oscillation influence on precipitation, river flow and water resources in the Iberian Peninsula. Int. J. Climatol. 2004, 24, 925–944. [Google Scholar] [CrossRef]
  64. Rodríguez-Puebla, C.; Nieto, S. Trends of precipitation over the Iberian Peninsula and the North Atlantic Oscillation under climate change conditions. Int. J. Climatol. 2010, 30, 1807–1815. [Google Scholar] [CrossRef]
  65. Bonaccorso, B.; Peres, D.; Cancelliere, A.; Rossi, G. Large Scale Probabilistic Drought Characterization Over Europe. Water Resour. Manag. 2013, 27, 1675–1692. [Google Scholar] [CrossRef]
  66. Spinoni, J.; Naumann, G.; Vogt, J.; Barbosa, P. The biggest drought events in Europe from 1950 to 2012. J. Hydrol. Reg. Stud. 2015, 3, 509–524. [Google Scholar] [CrossRef]
  67. Madueño, J.M.M. El Cambio Climático en Andalucía: Escenarios Actuales y Futuros del Clima. 2008. Available online: https://www.juntadeandalucia.es/medioambiente/portal/articulos (accessed on 13 June 2021).
  68. Junta de Andalucía, Consejería de Medio Ambiente. Plan Andaluz de Acción por el Clima. Programa de Adaptación. 2011. Available online: https://www.juntadeandalucia.es/medioambiente/portal/landing-page-planificacion/-/asset_publisher/Jw7AHImcvbx0/content/programa-de-adaptaci-c3-b3n-plan-andaluz-de-acci-c3-b3n-por-el-clima-2007-2012-/20151 (accessed on 27 June 2021).
  69. Junta de Andalucía, Consejería de Medio Ambiente y Ordenación del Territorio. El Clima de Andalucía en el Siglo XXI. Escenarios Locales de Cambio Climático de Andalucía. Actualización al 4° Informe del IPCC. Available online: https://www.juntadeandalucia.es/medioambiente/portal/landing-page-publicacion/-/asset_publisher/FytOUWH22K7t/content/el-clima-de-andaluc-c3-ada-en-el-siglo-xxi.-escenarios-locales-de-cambio-clim-c3-a1tico-de-andaluc-c3-ada.-actualizaci-c3-b3n-al-4-c2-ba-informe-del-2/20151 (accessed on 20 June 2021).
  70. Gebrehiwot, T.; van der Veen, A.; Maathuis, B. Spatial and temporal assessment of drought in the Northern highlands of Ethiopia. Int. J. Appl. Earth Obs. Geoinf. 2011, 13, 309–321. [Google Scholar] [CrossRef]
  71. Cheval, S. The Standardized Precipitation Index—An overview. Rom. J. Meteorol. 2015, 12, 17–64. [Google Scholar]
  72. Vicente-Serrano, S.M.; Begería, S.; Lorenzo-Lacruz, J.; Camarero, J.J.; López-Moreno, J.I.; Azorin-Molina, C.; Revuelto, J.; Morán-Tejeda, E.; Sanchez-Lorenzo, A. Performance of drought indices for ecological, agricultural and hydrological applications. Earth Interact. 2012, 16, 1–27. [Google Scholar] [CrossRef] [Green Version]
Figure 1. Map of the Barbate River basin and location of the meteorological stations considered in this study.
Water 14 00884 g001
Figure 2. Workflow followed in this study.
Water 14 00884 g002
Figure 3. Length of precipitation records from the selected stations prior to their completion with CHAC.
Water 14 00884 g003
Figure 4. Thiessen polygons for determining station weight.
Water 14 00884 g004
Figure 5. (a) Frequency distribution of the weighted mean annual precipitation; (b) average monthly precipitation with indication of its seasonal distribution.
Water 14 00884 g005
Figure 6. Moving averages of 3 (a), 5 (b), and 7 (c) elements applied to the mean annual precipitation series of the Barbate River basin.
Water 14 00884 g006
Figure 7. (a) Autocorrelogram of the complete 108-year series. (b) Autocorrelogram of the first half of the study period (1910/11–1959/60). (c) Autocorrelogram of the second half of the study period (1960/61–2017/18). The Anderson limits, which define the time-independent region, are indicated for each case.
Water 14 00884 g007
Figure 8. Precipitation trends in each season.
Water 14 00884 g008
Figure 9. Evolution of the SPI in the Barbate River Basin calculated for a 12-month time window for the period 1910/11–2017/18.
Water 14 00884 g009
Table 1. Rainfall stations whose series were completed using the software CHAC. Period 1910/11–2017/18. (Coordinates referred to UTM projection, zone 30, datum WGS84).
CodeX-UTM
(m)
Y-UTM
(m)
Altitude
(m)
Registration StartRegistration EndNº Months with Available Data before CHAC% Completed Using CHAC
5980255,8854,038,91814919112011108016.7
5982262,8344,046,0664281911201169546.4
6006279,4424,001,645271951201470945.3
5996237,6804,009,12471952201872044.4
5997243,8644,003,01771951201162052.1
5949261,3954,057,8891271910201111818.9
5954237,6914,038,8352771951201068647.1
5984242,6574,038,223941954201163351.1
5987252,6104,020,194231951201169246.6
5950251,0694,061,8851351909201112027.2
6001265,7843,988,615371866201811759.3
5995233,6294,016,1271871951201164050.6
1000241,3944,020,710461941201892428.7
Table 2. SPI classification according to McKee et al. (1993).
SPI ValuesCharacterization
>2.0Extremely wet
1.5 to 1.99Very wet
1.0 to 1.49Moderately wet
−0.99 to +0.99Normal
−1.0 to −1.49Moderately dry
−1.5 to −1.99Severely dry
<−2.0Extremely dry
Table 3. Main characteristics of the severe (SPI < −1.5) and extreme (SPI < −2) droughts identified in the studied basin for the period.
Severe DroughtExtreme Drought
OnsetEnd *Duration
(Months)
Extreme SPI ValueSPI SumMean SPIOnsetEnd *Duration
(Months)
Extreme SPI ValueSPI SumMean SPI
February 1913November 191421−2.1−15.88−0.76February 1913November 191421−2.1−15.88−0.76
November 1938December 193913−1.82−13.63−1.05
February 1949November 195133−2.52−40.11−1.22April 1949November 195131−2.52−36.6−1.18
June 1953February 195520−1.6−19.66−0.98
March 1957December 19579−1.51−8.55−0.95
November 1958October 195911−1.77−4.82−0.44
October 1981February 19824−3.01−5.93−1.48November 1981February 19823−3.01−4.31−1.44
January 1995January 199612−2.53−22.69−1.89May 1996January 19968−2.53−15.86−1.98
December 1998December 200024−2.5−40.72−1.7February 1999December 200022−2.5−37.06−1.68
January 2002December 200211−1.96−14.2−1.29
April 2005November 200843−2.3−45.02−1.05May 2005November 200842−2.3−43.45−1.03
December 2017March 20183−1.55−3.75−1.25
* Note: The end of each drought corresponds to the first month with a positive SPI value after a sequence of months with SPI < −1.5 or <−2. The last month is not included in the calculation of the duration of the drought.
Table 4. Main characteristics of the wet periods identified in the studied basin for the period (1910/11–2017/18).
Very Wet PeriodsExtremely Wet Periods
OnsetEndDuration
(Months)
Extreme SPI ValueSPI SumMean SPIOnsetEndDuration
(Months)
Extreme SPI ValueSPI SumMean SPI
February 1912February 191211.621.62-
October 1921October 192111.521.52-
November 1936January 193721.563.071.54
April 1941May 194121.523.021.51
October 1960December 196031.795.161.72
March 1962August 1964293.1163.051.71March 1962March 1964173.1142.482.5
September 1969August 197092.6816.41.72January 1970January 197012.682.68-
March 1972March 197211.61.6-
January 1977February 197721.683.241.62
October 1979November 197921.653.161.58
December 1989January 199021.653.271.64
January 1996November 1997233.4748.071.75April 1996February 1997113.4727.042.46
February 2010January 2011122.5925.421.78April 2010December 201092.5920.082.23
Publisher’s Note: MDPI stays neutral with regard to jurisdictional claims in published maps and institutional affiliations.

