
Assessing the Variances of Citizen Stakeholder Justice in Watershed Governance: Is Action More Effective with Reactive or Proactive Administrations


Environmental Sciences Department, Southern Illinois University Edwardsville, Edwardsville, IL 62026, USA
*
Author to whom correspondence should be addressed.
Water 2022, 14(6), 878; https://doi.org/10.3390/w14060878
Submission received: 10 November 2021
/
Revised: 21 January 2022
/
Accepted: 17 February 2022
/
Published: 11 March 2022
Abstract
:Watershed governance has historically been administered by natural resource experts and is often inaccessible to citizen stakeholders. Although many advocate for deliberative democracy as a pathway toward natural resource sustainability, others remain skeptical due to perceived tradeoffs. Environmental deliberative democracy (EDD) serves as a conceptual synthesis of collaborative principles. This research compares the social, economic, and political discourses in two Wisconsin watersheds (Geneva Lake in regulatory compliance and Green Lake, which is deemed state impaired) and posits that EDD community compatibility is enhanced by public trust in expert capacity and accessible watershed education resources. A mixed methodology is used to analyze quantitative data from citizen surveys and qualitative interview responses. Findings affirm that proactive watershed management frameworks are stronger when not prompted by environmental crises. Management programs created reactively with a specific agenda have a comparable structure with citizen involvement but have a limited capacity, scope, and potential for sustained success.
1. Introduction
Effective natural resource management (NRM) requires a scientific and technical understanding of natural systems and how they can be influenced by human civilization. As such, many scholars have assigned NRM to the realm of governmental and technical experts from local, state, and federal government agencies. In Wisconsin, the Department of Natural Resources (WDNR) oversees the management of more than 15,000 lakes [1], with broad regulatory and enforcement authority concerning lakes and their ambient watersheds. However, participation of citizen stakeholders in watershed management is limited, with superficial public involvement in regulatory processes and public policy formulation. Some environmental and public policy activists highlight the untapped potential of citizen stakeholders as governance partners. Others note that the complexity of natural systems requires skilled, educated, and trained experts to address NRM problems. This school of thought holds that increased involvement in natural resource governance by the citizen stakeholder can only be superficial because they do not have an appropriate knowledge base to guide and inform management decisions.
This research posits that environmental deliberative democracy (EDD), which emphasizes the reduction in top-down authoritarian controls in favor of increased public deliberation and civic engagement, is positively associated with public watershed outcomes. Specifically, watersheds in which EDD principles are embraced by the citizenry in partnership with the vast array of governmental, lobbying, advocacy, and other organizations are hypothesized to experience increased compliance and buy-in from citizens, as well as increased trust in the capacity of watershed management groups to address water impairment concerns.
Similarly, citizen knowledge, participation, and compliance are influenced by whether the issues are being addressed through reactive or proactive strategies. In the event of a reactive strategy, organizations work to address an identified water impairment or water quality concern, whereas proactive approaches seek to prevent a potential water quality concern. Reactively structured management programs have a specific agenda and focus, potentially limiting citizen engagement beyond the immediate problem at hand and potentially limiting the long-term viability of public engagement.
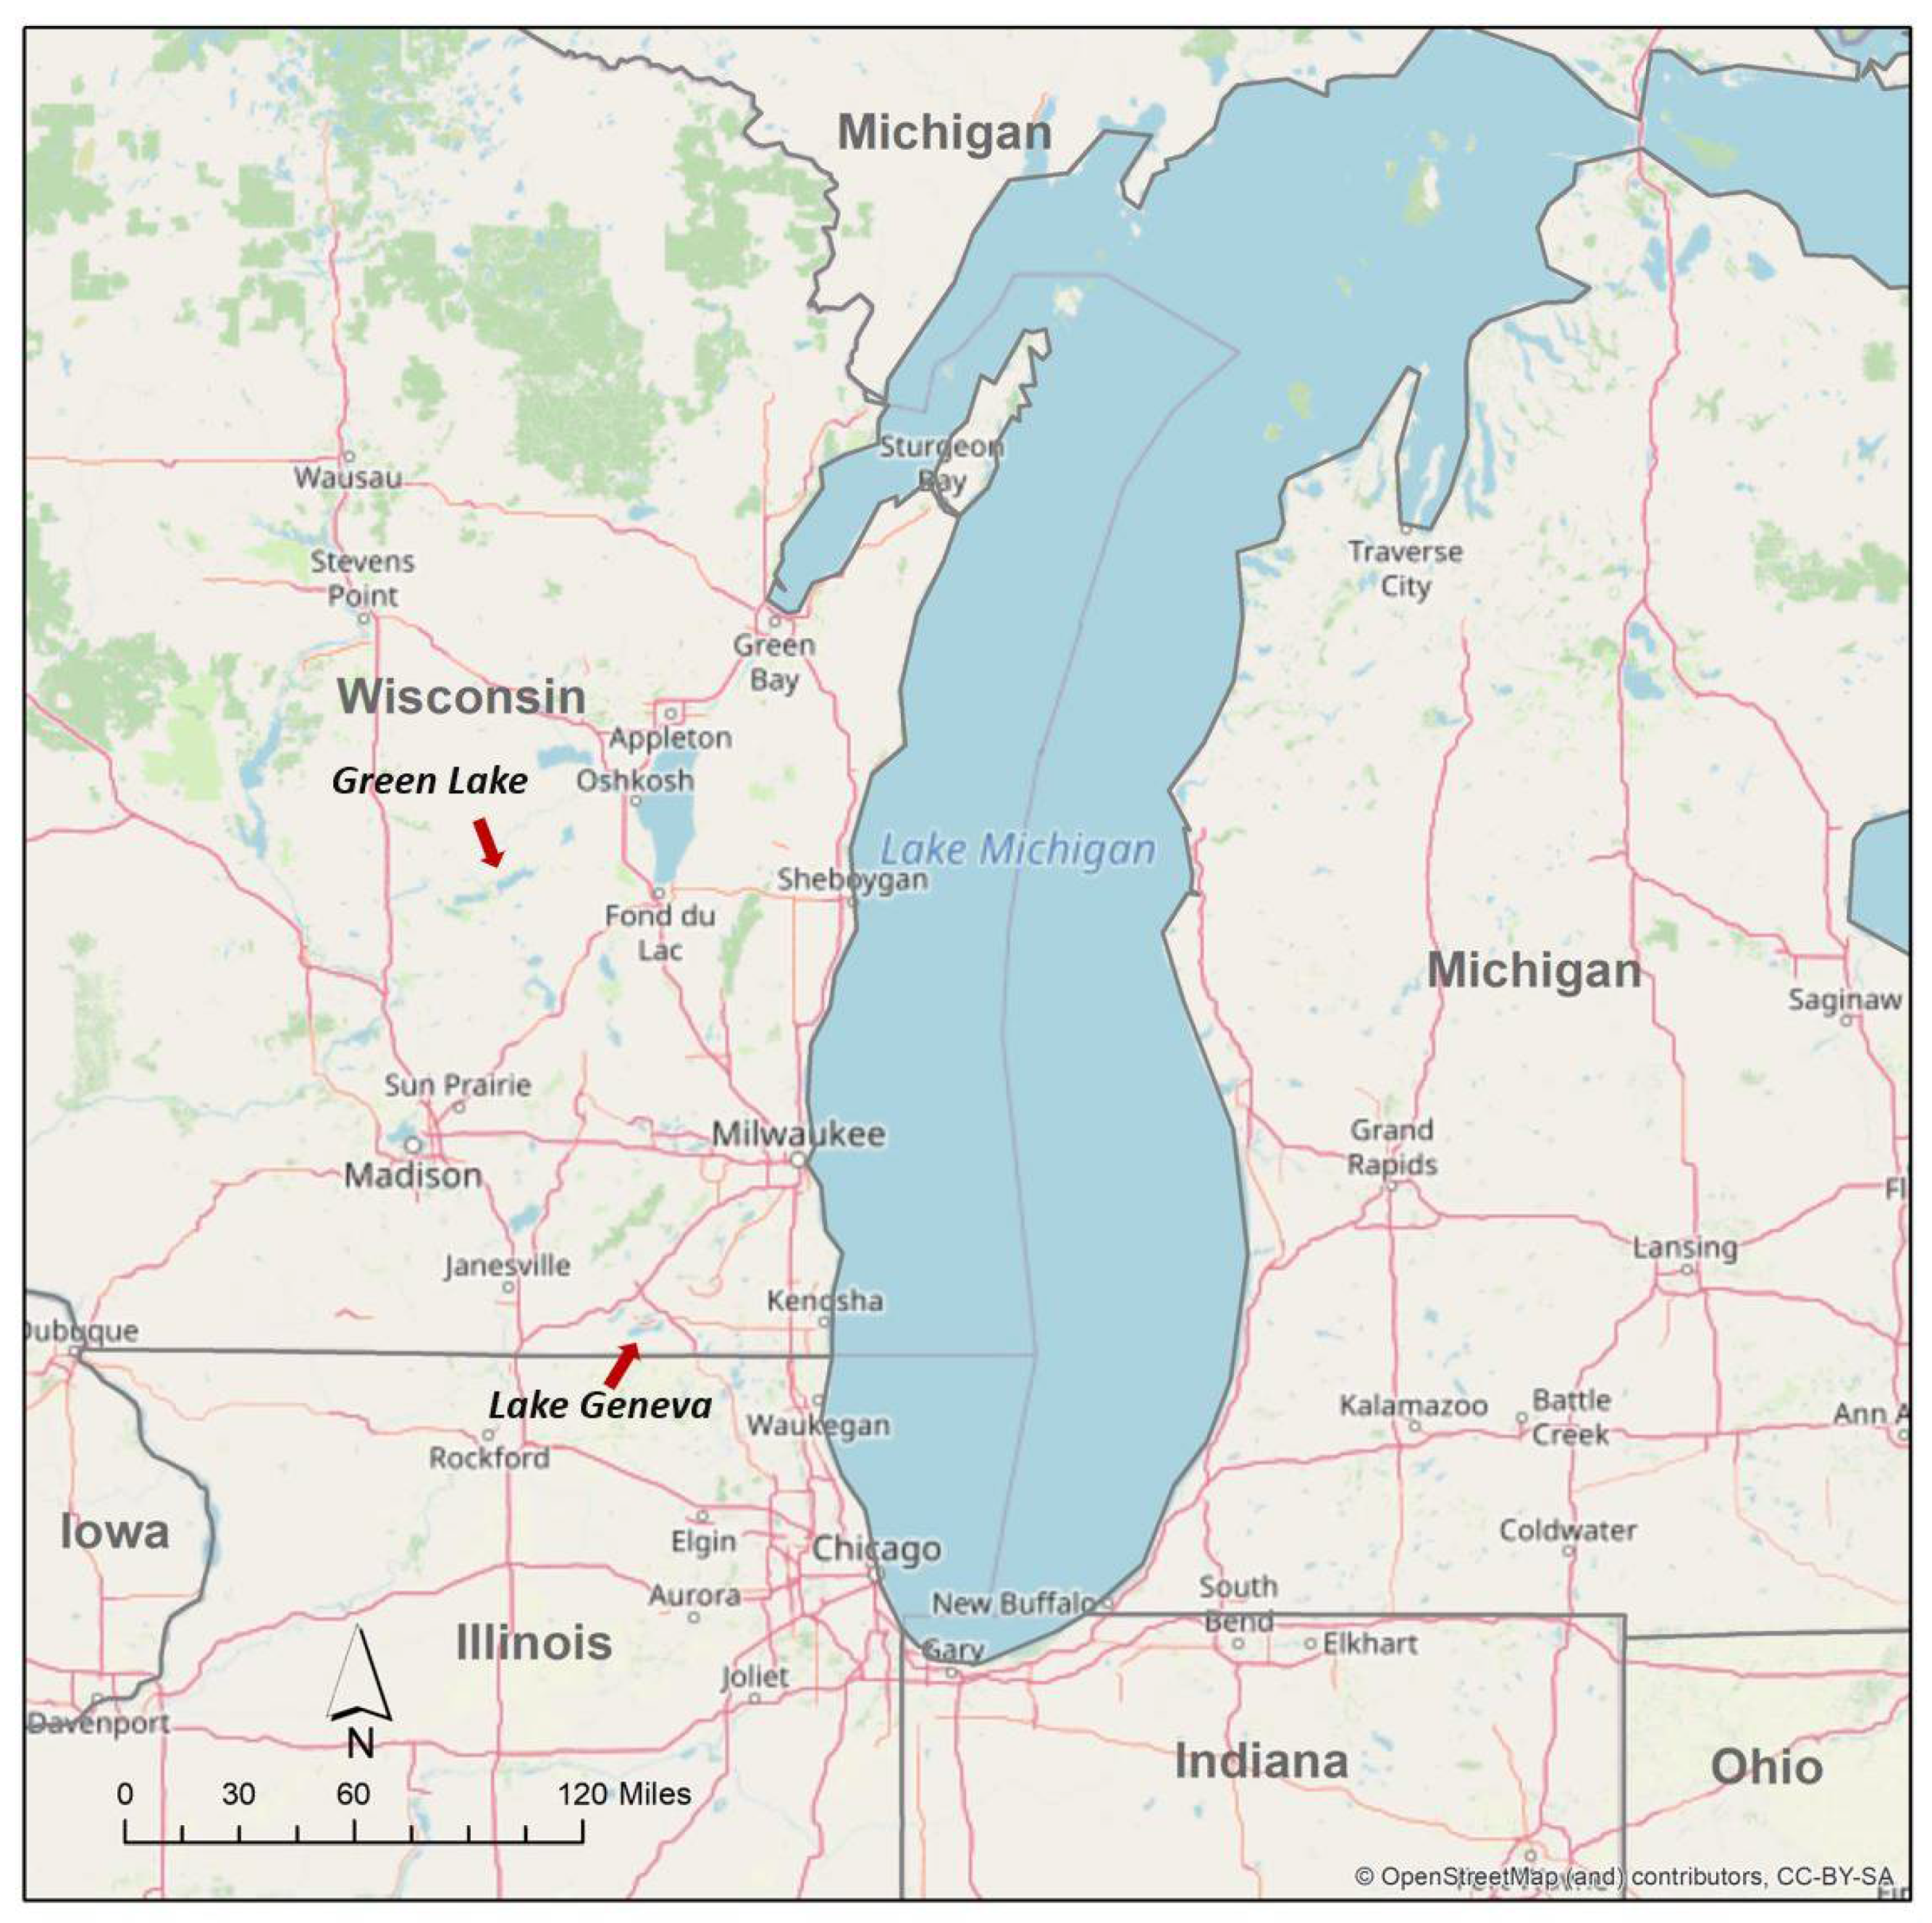
The Safe Drinking Water Act (SDWA) has served as the guiding federal legislation to protect the quality of the nation’s drinking water over the past 40 years. The 1996 SDWA amendments have been successful to some degree in facilitating public discourse by mandating the establishment of citizen advisory councils to foster transparency between administrators and the public [2]. While the Clean Water Act lacks a mechanism for direct regulation of nonpoint source pollution, the Environmental Protection Agency administers Section 319 Nonpoint Source Management Program to distribute funds to states for managing sources and implementing control measures [3]. These regulatory provisions have facilitated a more collaborative than administrative decision-making process; however, it is critically important to identify the areas of democratic governance where communities appear to fall short. This article addresses this need by investigating governance frameworks at two Wisconsin lakes and their associated watersheds through the lens of EDD principles (Figure 1).
This paper discusses multiple governmental and citizen stakeholder organizations with lake management roles. A summary list of stakeholder organizations mentioned in this paper and the role they play is included here for clarity.
Federal:
- Environmental Protection Agency (EPA): Federal agency that administers the Section 319 Nonpoint Source Management Program to distribute funds to states for managing sources and implementing control measures.
State/Regional:
- Wisconsin Department of Natural Resources (WDNR): State agency overseeing the management of over 15,000 Wisconsin lakes with broad regulatory and enforcement authority concerning lakes and their ambient watersheds;
- Southeastern Wisconsin Regional Planning Commission: The official metropolitan planning organization for the seven-county southeastern Wisconsin area.
Local (Green Lake)
- Green Lake Sanitary District (GLSD): A quasi-governmental organization that manages public and private wastewater treatment for over 2000 parcels around Green Lake. GLSD manages nonpoint pollution abatement and watershed water quality monitoring and works with municipal and county governments as well as citizen and nonprofit organizations;
- Green Lake Association (GLA): A nonprofit environmental non-government organization (ENGO) committed to facilitating participatory management by disseminating scientific studies to the public and conducting community outreach. The GLA is a nonprofit organization funded by member contributions and tax-deductible private and corporate donations;
- Green Lake County: Green Lake is located in Green Lake County;
- City of Green Lake: City located on the northeastern shore of Green Lake with a population of approximately 960;
- Markesan: City located approximately 13 miles from the southwest shore of Green Lake with a population of approximately 1300;
- Princeton: City located approximately 9 miles to the north of Green Lake’s western shore with a population of approximately 1200;
- Ripon: City located approximately 8 miles to the east of Green Lake with a population of approximately 7800.
Local (Geneva Lake):
- Fontana: Village located on the western shore of Geneva Lake with a population of approximately 1500;
- Geneva Lake Conservancy (GLC): Nonprofit ENGO dedicated to preserving environmentally sensitive lands in Walworth County. The GLC has reserved several properties near Geneva Lake as conservation easements. Organization funding is provided by tax-deductible private and corporate donations;
- Geneva Lake Environmental Agency (GLEA): An intermunicipal, quasi-governmental lake management agency formed as a shared unit of local municipal governments surrounding the lake. It is funded by local governments, but as a 501(c)(3) organization, GLEA also receives tax-deductible funding from private donors;
- Lake Geneva City: Resort city on the eastern shore of Geneva Lake with a population of approximately 7900;
- Linn Sanitary District: Linn is a town with borders on both the north and south of Geneva Lake. The sanitary district is a governmental organization that manages septic systems for many homes along the shore of Geneva Lake not connected to municipal sewage systems;
- Walworth County: Geneva Lake is located in Walworth County;
- Walworth Village: Village to the southwest of Fontana, located near Fontana with a population of approximately 2800.
1.1. Green Lake Watershed Community Background
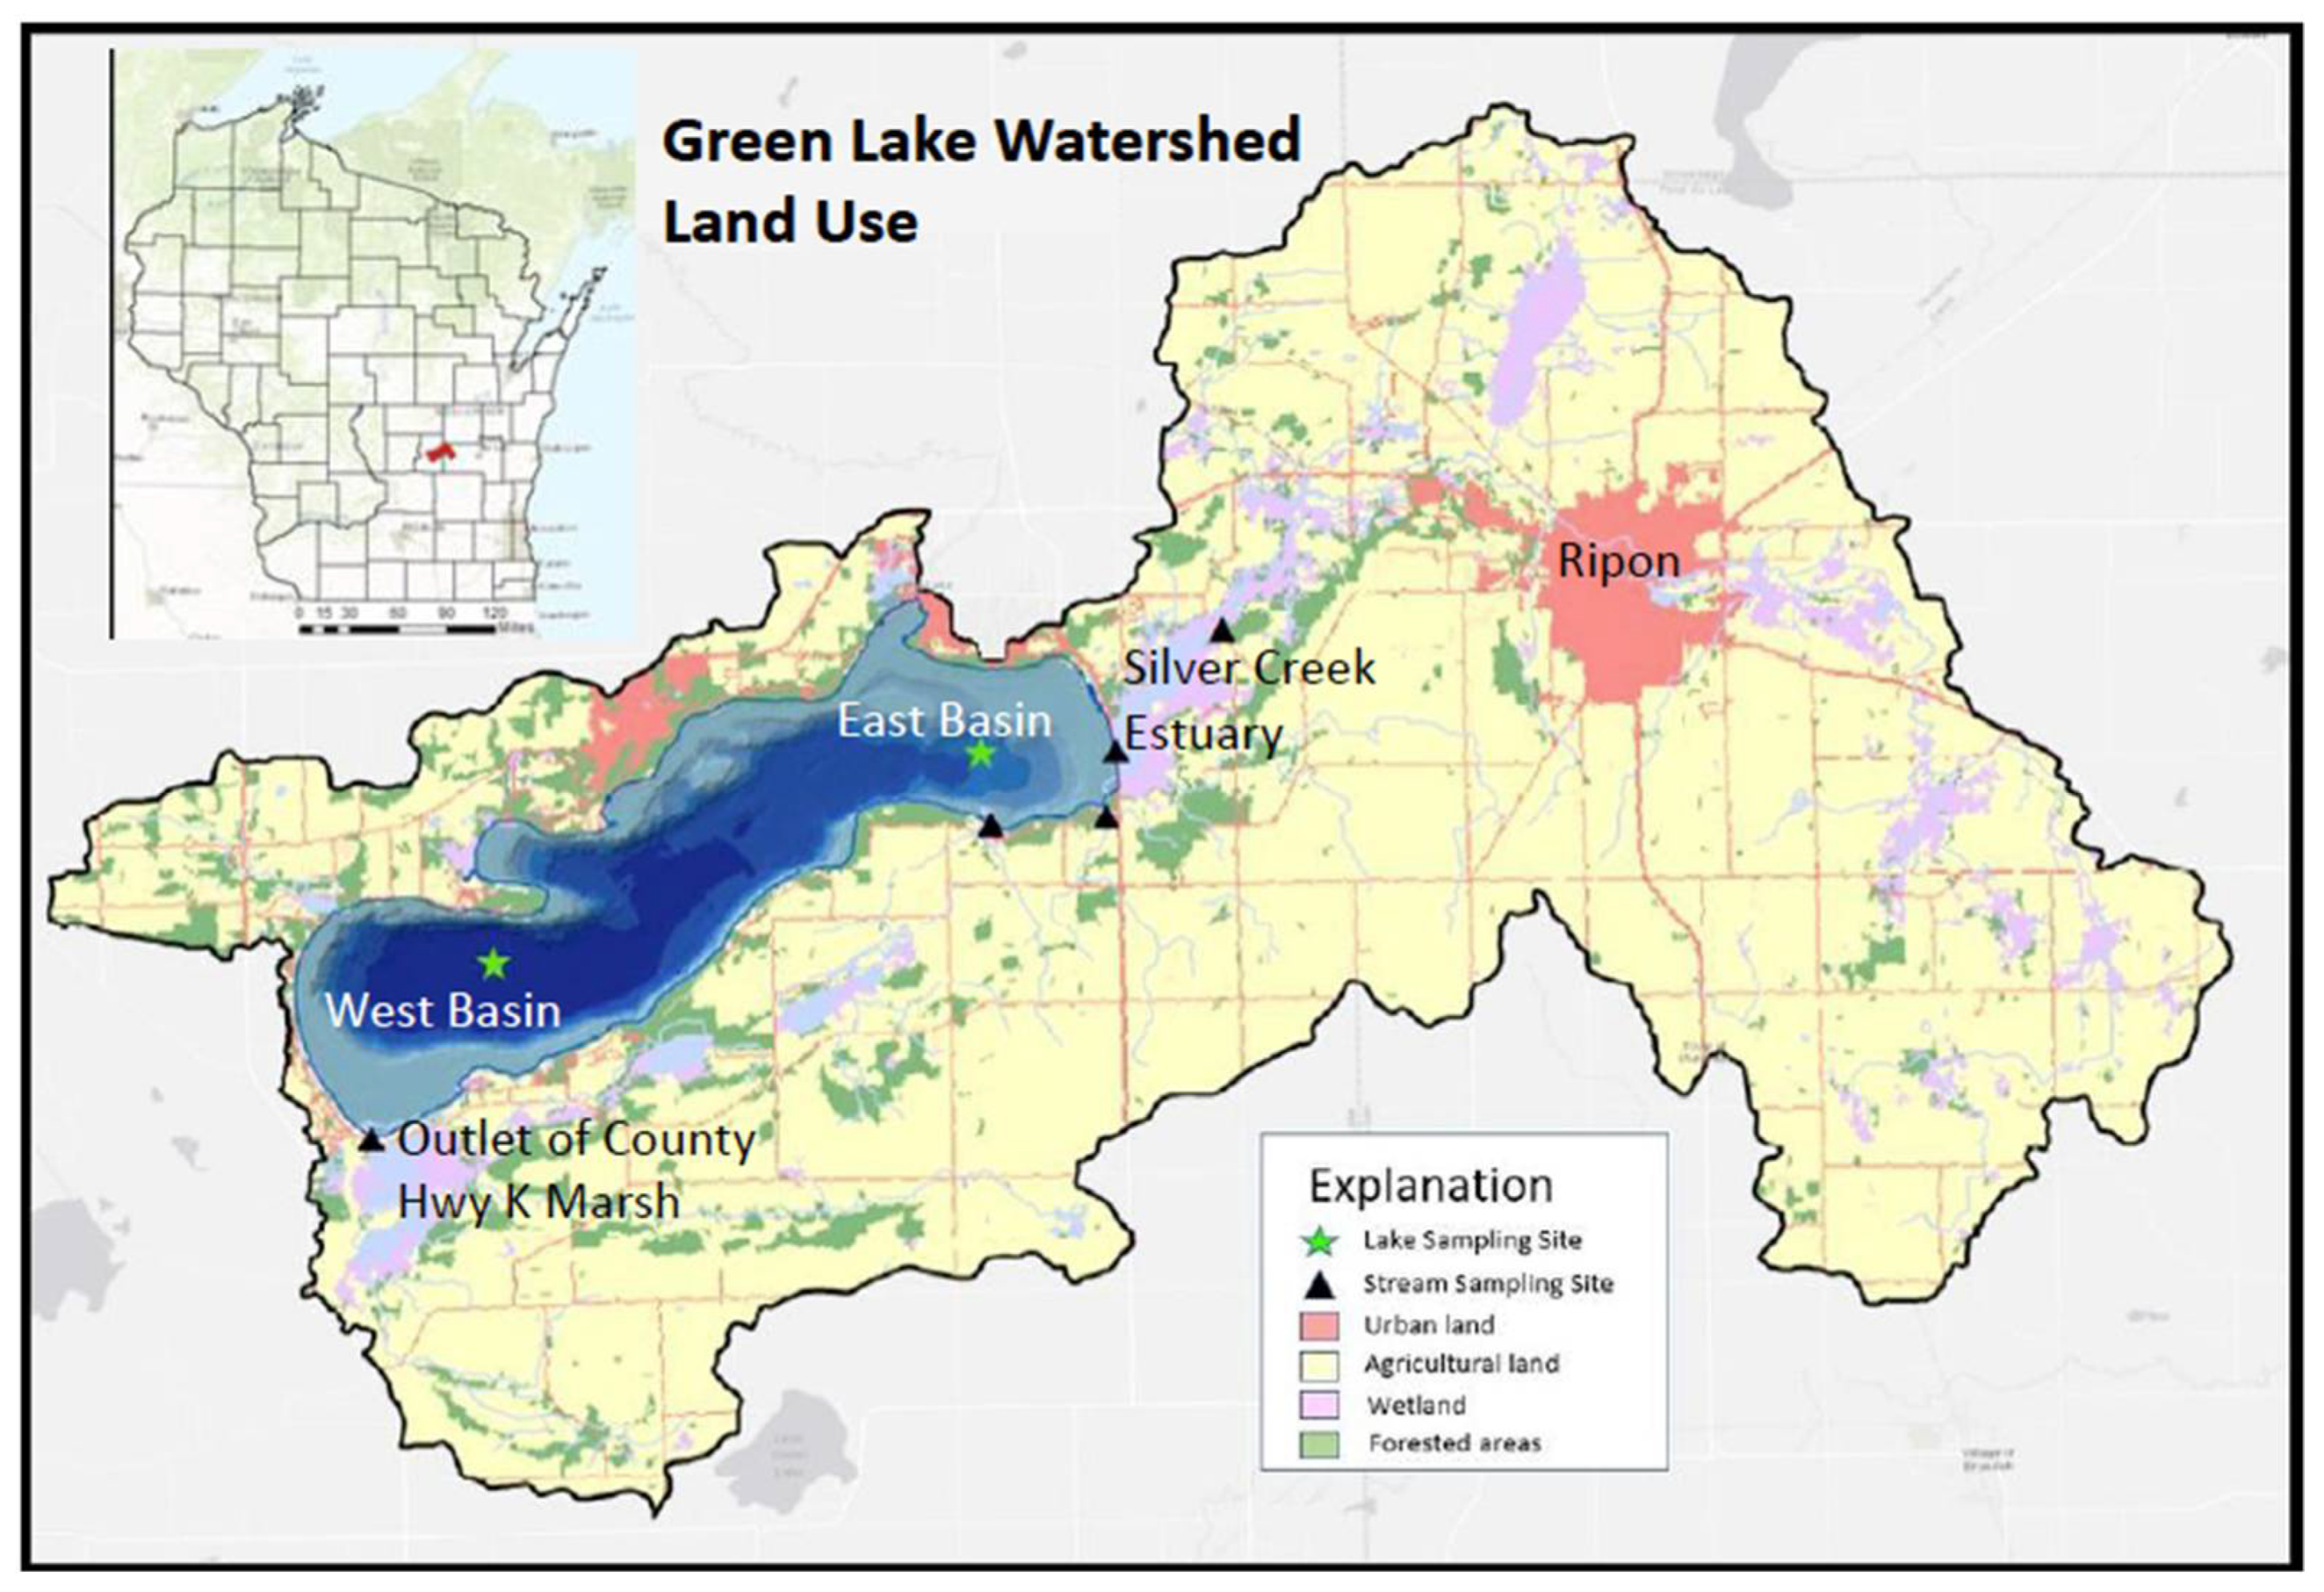
The Big Green Lake Watershed (hereafter referred to as “Green Lake”) spans approximately 110 square miles and includes three counties [4]. Agriculture accounts for about 57% of watershed land use [4]. Water entering the drainage basin remains for approximately 20 years, holding an estimated 9.3 billion cubic meters of water [4]. Green Lake is Wisconsin’s deepest natural inland lake and is bordered by over 40 km of shoreline [4]. Most of the shoreline is privately owned, and only 3 km are accessible to the public. Five municipalities collectively comprise “Green Lake Country”, which attracts a significant seasonal residency and tourism base due to the recreational appeal of Green Lake. Consequently, Green Lake County receives a significant portion of its annual economic stimulus from tourism (USD $38.4 million in 2016) [5]. Figure 2 provides an overview of the land use in the Green Lake watershed.
Nutrient management strategies trace back to 1980, when the watershed was one of four original priority watersheds identified by the WDNR due to water impairment [7]. This designation unlocked significant funding for natural resource managers to plan, implement, and maintain best management practices (BMPs). Since then, the watershed has continued to experience degradation from expanded agricultural land use and associated nutrient runoff despite an expansion of BMPs [4]. Governance responsibilities for Green Lake are shared between stakeholder conglomerates, with WDNR acting as the primary actor in environmental decision making and regulation.
At the local level, municipal and county governments manage water quality via ordinances, along with the quasi-governmental Green Lake Sanitary District (GLSD), which manages public and private wastewater treatment for over 2000 parcels [8]. GLSD conducts regular water quality monitoring, including nutrient monitoring, within the watershed and collaborates with other regional groups to operate lake sustainability programs [8]. One such partner is the Green Lake Association (GLA). GLA is a nonprofit, non-governmental organization committed to facilitating participatory management by disseminating scientific studies to the public and conducting a variety of community outreach initiatives [9].
Ten partnered stakeholder groups produced the Green Lake Management Plan, which was approved by WDNR in February 2013. This planning document aims to operationalize policy and management programs by gathering environmental data as well as public perceptions. GLSD and GLA are working toward revising the Nine Key Element Plan for the Green Lake Watershed that expired in 2002 to unlock more funding through WDNR. GLSD provided a copy of their working Nine Key Element planning document for the purpose of this research. Table 1 displays the estimated total phosphorus (TP) loading by source from 2013 to 2016, with data aggregated by local management groups. These data indicate that approximately 90.5% of the total loading of phosphorus from the watershed is being monitored by various means [10,11].
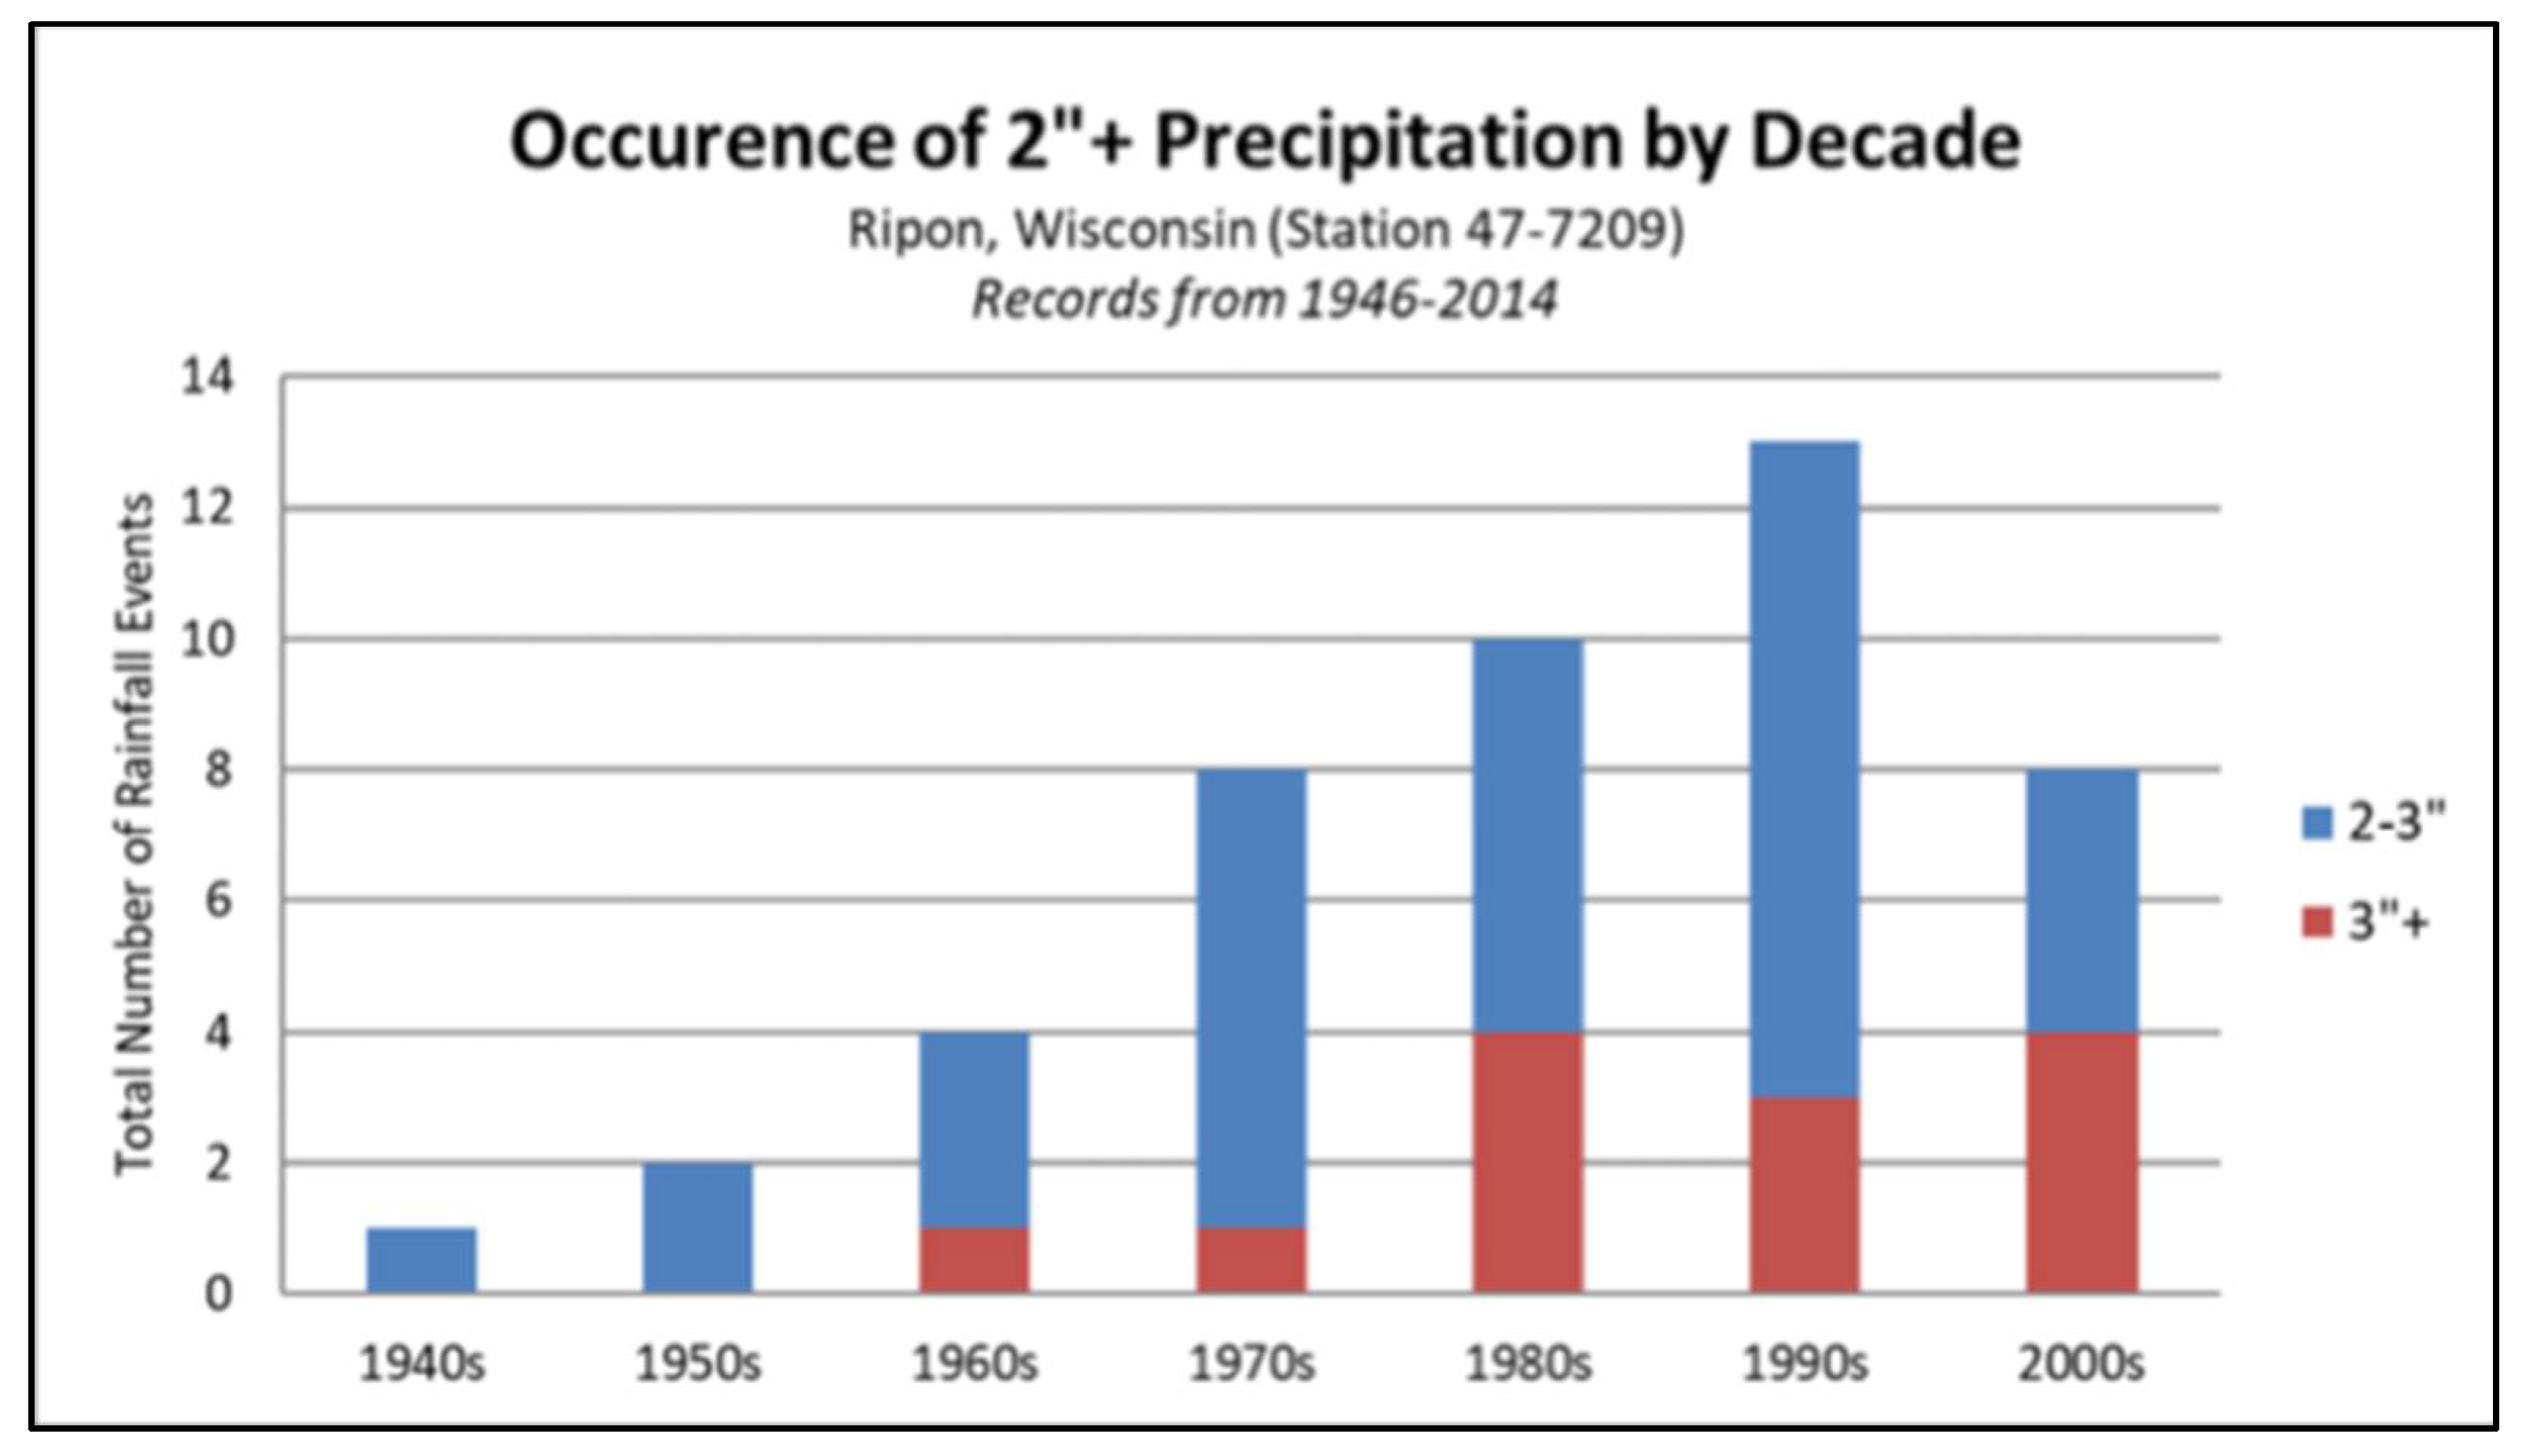
Figure 3 displays annual average TP concentrations in the epilimnion (in milligrams per liter). The epilimnion, which contains the waters nearest to the surface, forms during summer stratification. Consequently, it receives the most energy from the sun and is well mixed by wind patterns to allow relatively uniform temperatures and nutrient availability [12]. The East basin consistently contains more TP because the Silver Creek outlet lies on the East portion. Storm water, sediment, and nutrients from direct discharge or surface runoff are the suspected causes due to the increasing frequency of high magnitude precipitation events (more than 3 inches) compared to historic averages.
Figure 4 displays a snapshot of this trend, as the city of Ripon lies within the watershed. Further, Ripon storm water discharges to Silver Creek without treatment.
These large precipitation events can cause more soil detachment and subsequent deposition into the lake and its tributaries. To counter this alarming trend, watershed management groups have expanded BMPs such as sediment control basins to prevent large portions of agricultural sediments from reaching Green Lake tributaries [10]. Cost-sharing between local organizations and governments for BMPs with instillations are maintained in perpetuity by GLSD, which creates incentives for landowner adoption. These initiatives require significant funding, the bulk of which comes from WDNR grants because Green Lake is listed as an impaired water body.
Another recent problem at Green Lake concerns aquatic invasive species. The zebra mussel (Dreissena polymorpha) has been identified as an ecological threat [4]. Since NRM professionals first observed the species in 2001, zebra mussels have expanded into benthic areas in the littoral zone [4]. Although a causal relationship has not been confirmed, zebra mussels are a suspected contributor to increased green filamentous algae at Green Lake. This is because of their high population and fecal matter that coincides with algae growth [4].
1.2. Geneva Lake Watershed Community Background
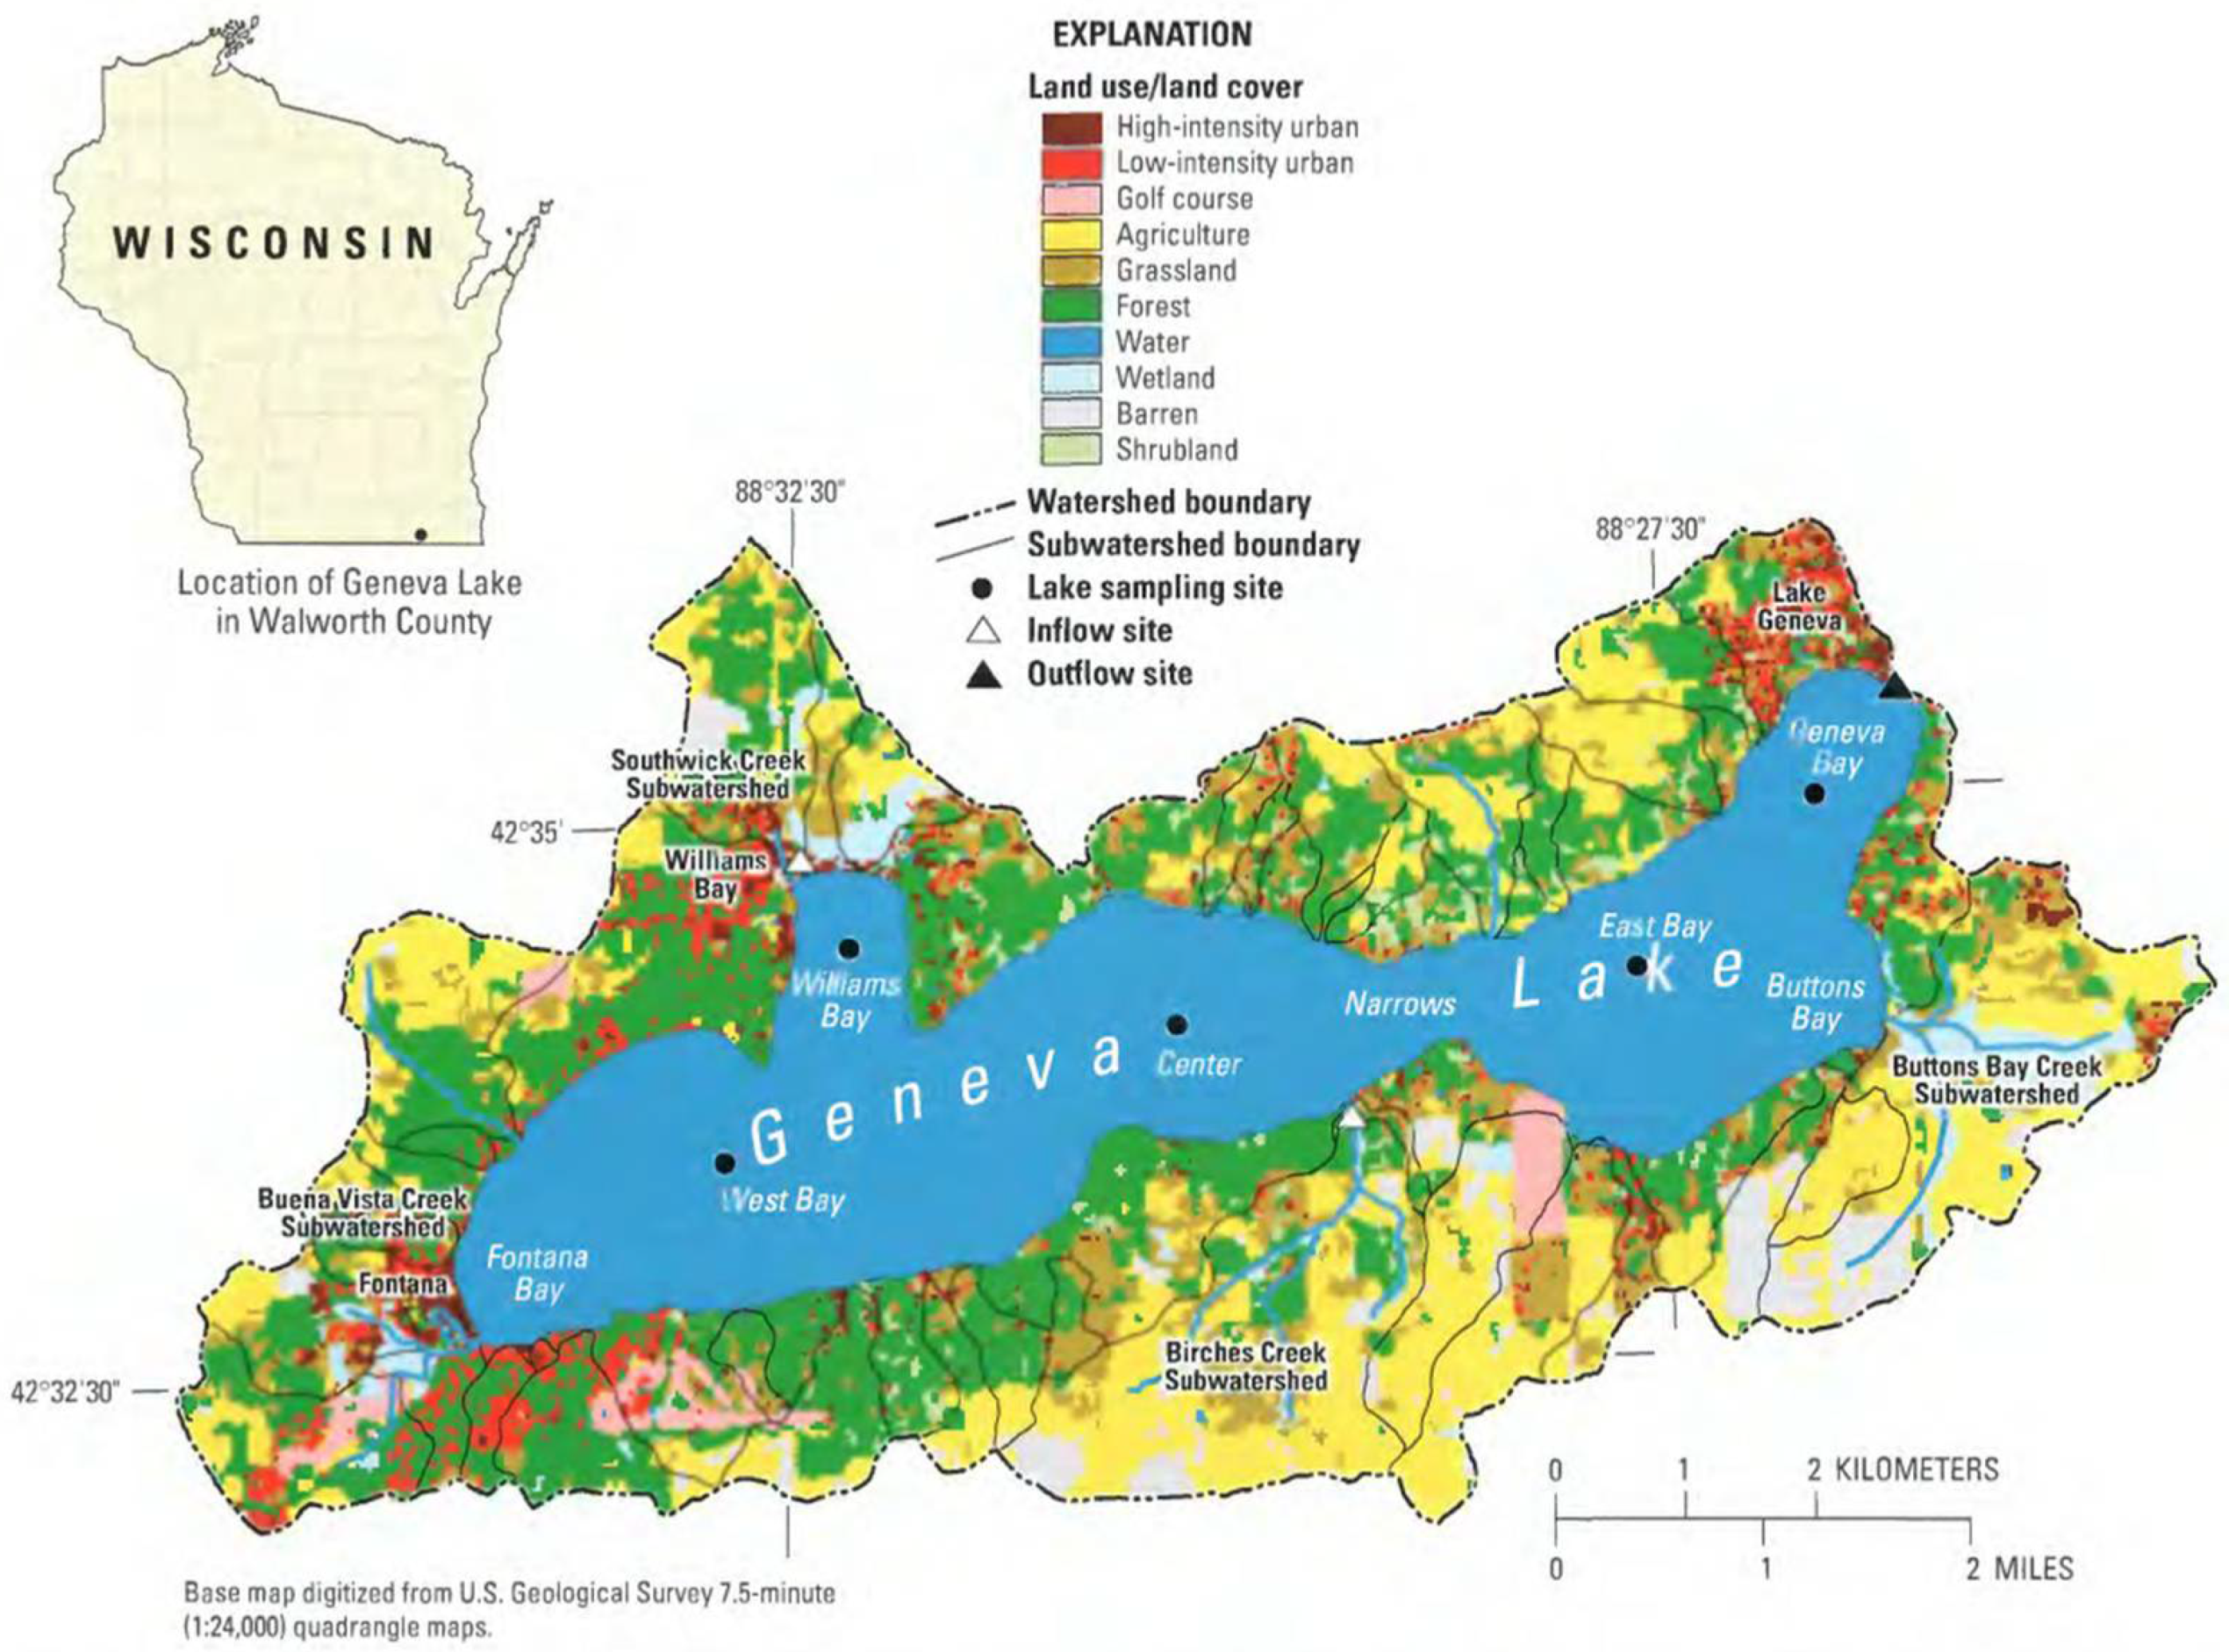
Located in Walworth County, Geneva Lake has a low watershed land area (53 square kilometers) relative to its surface area (20.7 square kilometers) [13]. Consequently, the lake has a 13.9-year retention time [13]. Prior sampling has revealed a temporal lag in water quality changes related to land use [13]. Precipitation and atmospheric water account for approximately 48% of water input to the lake, along with surface runoff (28%), stream flow (18%), and groundwater (6%) [14]. Total lake water volume is around 3.7 billion cubic meters [15]. To provide a sense of scale, approximately two Geneva Lakes could fit inside Green Lake in terms of water volume. Watershed land use includes agriculture, natural restoration, urban and residential areas [13].
Figure 5 provides an overview of land use categories. The spatial distribution and intensity of residential development are expected to impact water quality as more agricultural land is converted for residential purposes. According to a management plan prepared by the Southeastern Wisconsin Regional Planning Commission, around 37% of watershed land use is expected for residential use by 2020 [16]. The trends driving increased development could be linked with tourism, as Walworth County had USD $528.9 million in visitor spending for the 2016 fiscal year, which increased to USD $544.4 million in 2017 [5].
Agriculture is a significant economic stimulus for Walworth County and accounts for approximately 34% of land use in the Geneva Lake watershed [16]. Sediment and nutrient runoff are areas of concern for watershed managers, but Geneva Lake still has generally suitable water quality despite increasing inputs. Its tropic state index values are consistent with mesotrophic lakes, and the lake does not exceed any water quality standards [15].
The watershed is managed by a conglomerate of state, county, and municipal governments, with Environmental Non-Government Organizations (ENGOs) also playing a key role in conservation. The Geneva Lake Conservancy (GLC) has reserved several properties for conservation easements. Similarly, The Geneva Lake Environmental Agency (GLEA) conducts annual water quality monitoring projects and disseminates findings of partnered management groups to the public [16]. The agency receives financial and advisory contributions from area municipalities, which include the City of Lake Geneva, the Villages of Fontana-on-Geneva Lake and Williams Bay, and the Towns of Walworth and Linn [16]. However, most GLEA funding comes from private donor contributions. As an inter-governmental agency, GLEA regulatory authority is limited, yet it generally oversees lake management as well as community education on a range of topics [16]. The Linn Sanitary District manages septic systems for many homes along the lakeshore, as these homes are not connected to municipal sewage systems [16]. By contrast, the GLSD oversees wastewater treatment for the Green Lake region.
Overall water quality at Geneva Lake is superior to that of Green Lake, with water quality concerns typically limited by time and area. For instance, a large summer storm in July 2017 caused a surge of surface runoff. As a result, E-coli (Escherichia coli) levels at public beaches reached dangerous levels and were closed to the public. Similarly, large precipitation events can result in overland flow of agricultural sediments, which subsequently deposit into Geneva Lake. While Geneva Lake is about 90 miles due south of Green Lake, there is very little evidence or information about storm events that occurred in one locality and not the other. Additionally, one might assume that nitrogen levels might be higher in Green Lake than Geneva, which is contributing to impairment of Green Lake, but there is not enough data, statistical analysis, or water chemistry to make this statement with any degree of accuracy.
1.3. Socioeconomic and Community Dynamics of Green Lake and Geneva Lake
This research examines the role of citizen stakeholders in the governance of two Wisconsin watersheds in relation to the principles of environmental deliberative democracy. The impaired water status for Green Lake and its absence from Geneva Lake is a key distinction between these communities. Recent census estimates can reveal other meaningful community dynamics.
The City of Lake Geneva is home to some 7651 residents, with a mean family income of USD $84,743 [17]. By contrast, Green Lake Town, Wisconsin, is home to around 1238 people, with a mean family income of USD $87,540 [17]. Both Green Lake and Walworth Counties receive significant economic stimulus for tourism. Green Lake County received USD $38.4 million in direct visitor spending dollars in 2016 and USD $39.3 million in 2017 [5]. More significantly, Walworth County, the home of Geneva Lake, received USD $528.9 and USD $544.4 in 2016 and 2017, respectively [5]. The recreational appeal of these lakes has resulted in many visitors and seasonal residents, mostly during the summer months. These economic stimuli provide sufficient justification for water quality protections when a corresponding threat emerges.
This research postulates that watershed management innovations are triggered by an environmental crisis. This prediction is based on common institutional practices, as well as the historic marginalization of citizen stakeholders. Another hypothesis predicts that citizen stakeholder trust in the capacity of watershed management experts will enhance EDD community compatibility. The theoretical roots of this research project are concerned with the following questions: (1) Are watershed management practices in Green Lake and Lake Geneva reflective of increased public discourse? (2) Are the principles of EDD present in the establishment and implementation of watershed management initiatives? (3) Do innovative watershed management strategies emerge in response to an environmental crisis? (4) Are ENGOs recognized by the public as an impactful contributor to watershed management?
2. Materials and Methods
The first phase of data collection involved semi-structured, elite-level interviewing. Interviewee prospects were identified according to the classifications used during the screening process, which included: (1) professional involvement in the management of water resources; and (2) involvement in natural resource discussions with citizen stakeholders including, such as education campaigns, local knowledge shared with civic associations. Interviewees were sent a notification of participant rights, along with an invitation letter. Participants who confirmed interest were then asked to recommend colleagues or other professionals who fit the criteria. This snowball sampling method allowed a suitable diversity of agency representatives while allowing the perceptions of participants to guide the selection process. Twelve participants were interviewed (six from each watershed). A list of questions was presented to each participant while probing questions were asked when appropriate. Each interview was recorded with the consent of participants, except for one participant who requested the investigator take notes instead. These notes were then reviewed for accuracy and approved by the participant. Interview notes and recordings were transcribed verbatim and imported into NVivo software for analysis [18] (https://www.qsrinternational.com/nvivo-qualitative-data (accessed on 9 November 2021)).
Themes were identified based on inductive coding of qualitative interview data. This process was guided by Strauss and Corbin’s coding paradigm, which includes sequential open, axial, and selective coding processes [19]. Open coding was conducted upon initial review of transcriptions. Memos were recorded in a coding journal, which was updated during each coding session. To prevent excessive coding that distracts from the main issues, Glaser [20] recommends defining codes using minimal components. As such, data were coded based on simplistic indicators. For example, the “tourism economic stimulus” category contained transcript excerpts containing key phrases such as “revenue” or “budget”.
Next, axial coding involves continuous comparison between categories. Like open coding, axial coding is an iterative process. Creswell [21] describes axial coding as an effective tool for arranging and combining large amounts of qualitative data. These and other category relationships are discussed in the next section. Lastly, selective coding occurred upon the saturation of thematic categories. Selective coding involves the identification of “central” or “core” categories that have numerous relationships with sub-categories. Grounded theorists such as Gibbs [22] and Kiefer [23] note that selective coding tells a story about the issue, community, or other research topics. Consequently, selective coding is essential in developing theory that pertains to the studied phenomena [21]. The objective of this process is to produce case-specific theories by summarizing and describing thematic categories in a manner that is true to the perceptions of participants [23]. For this research, three core thematic categories emerged, which represent the most prominent insights from Geneva Lake and Green Lake watershed management professionals. These are summarized in Table 2.
These themes contextualize site-specific management frameworks. They also add context for the survey component of this analysis because each method gauges the perceptions of different stakeholders. In concert with these themes, literature pertaining to collaborative governance and the Lake Simcoe case study from a series of articles in the Journal of Great Lakes Research served as guiding documentation for coding discussions surrounding ENGOs, institutional entrepreneurs, and their impacts on EDD.
The survey component of the two-tiered analysis consisted of 13 questions designed and made accessible through SurveyMonkey online survey software and questionnaire tool [24]. The questions used were an open-ended survey of participants using the terminology of words such as trust and impairment from expert interviews and can be provided upon request. All questions are found in Appendix A, and interview questions are available upon request. Subedi [24,25] promotes Likert surveys as a simple method for measuring attitudes. These advantages add merit to surveys as an appropriate metric of public perceptions for these communities. A descriptive summary of survey results provides sample characteristics concerning public attitudes, as well as social frameworks pertaining to EDD. Participants were asked a series of questions to gauge their involvement in the water issues, as well as questions to gather demographic information on the participant pool. Participants were asked to rate the extent of their support for an idea, concept, or hypothetical scenario on a Likert scale from 1 (strongly disagree) to 5 (strongly agree). Likert survey results from questions five and seven were organized as ordered categorical data. These were combined to form a weighted dependent variable. The final survey question was open-ended to allow participants to expand on their perceptions regarding public compliance likelihood with watershed management planning based upon their degree of NRM knowledge.
The survey was administered online as the most feasible option for reaching the largest number of respondents [26] and the greatest opportunity to obtain a voluntary sample that would serve as an accurate representation of the two Wisconsin communities. Online survey notices were distributed via Facebook. A webpage to host the survey was designed with background information concerning the scope and interests of the research project. This information was made accessible to Facebook users who lived within a 40-km radius of either the City of Lake Geneva or Green Lake Town. This method proved to be an adequate representation of the watersheds. Additionally, electronic mail invitations were distributed to local businesses, universities, and organizations. This information was obtained from the Chamber of Commerce for three municipalities from each watershed, including Lake Geneva, Fontana, and Walworth for the Geneva Lake watershed and Ripon, Markesan, and Princeton for the Green Lake Watershed. Online access to the survey was open from 3 September 2018 to 16 October 2018.
The central hypothesis for this research posits that EDD is positively associated with public watershed education and public trust in the capacity of watershed management groups. In concert with this expectation, a self-assessment of reactive behavior toward watershed governance is expected to have a negative association with EDD. Reactionary decision making for the purpose of this analysis is defined as new regulatory or management strategies, which emerge in response to an environmental crisis such as nutrient pollution or a series of major storm events. Reactive behavior can be defined as NRM participation prompted by an environmental crisis. To test these expected associations, ordered logistic regression (OLR) models are used. The OLR model was preferred over a multinomial logistic model because the latter does not distinguish between ordered categories for the dependent variable. Each independent variable was structured as numeric data for the purpose of regression analyses.
Measurements of participatory management behaviors, along with attitudes concerning a desire for more public stakeholder responsibility, represent the directives of EDD. The principles of deliberative democracy promote participation and equity between expert (watershed management professionals) and lay (typically comprising homeowners and community members without professional training) stakeholders. As such, the dependent variable for regression analyses has three levels of compatibility with EDD. A response on the Likert scale higher than “3” for either question was included in a sum to create three possible values: “0” (low EDD), “1” (moderate EDD), or “2” (high EDD). A multi-level dependent variable was included with three independent variables: (1) Community watershed education; (2) Public trust in expert capacity; and (3) Reactive. These were measured by 5-point Likert scale responses for survey questions #1, #4, and #8, respectively. These variables were included in three separate regression models. Data for each model was comprised of survey responses from all respondents (n = 168), Geneva Lake respondents only (n = 131), and Green Lake respondents only (n = 32). Please note that while the term “participation” is fairly well defined as a gauge to respondents’ present level of engagement in watershed management, other variables are less concrete. For example, Trust/Capacity refers to the trust a citizen has in the capacity of existing, expert-led organizations to manage the watershed. Additionally, impairment/risk is best defined as having enough education to understand the threats of the lake due to negative environmental impacts, and reactive is the desire for administrative input to repair or restore the watershed only after risks have been defined as they have never been addressed at all.
Given the theoretical roots of the studied phenomena, an alternative methodological tool is appropriate to supplement those discussed above. To accomplish this, a generalized linear model is used using the same data. The key difference between these regression techniques relates to the response variable. EDD is measured as a binary response variable for the generalized linear regression. This model is included to see if the bivariate associations are shared with those observed in the OLR for all respondents. The model design described uses the generalized linear model function in the R software package in order to run a logistic regression and investigate the research hypotheses:
Hypothesis 1. (H1):
Proactive ENGOs and higher learning institutions actively engaged in water research are the primary facilitators of watershed management programs;
Hypothesis 2. (H2):
There is a positive association between Education and EDD;
Hypothesis 3. (H3):
There is a positive association between Trust/Capacity and EDD;
Hypothesis 4. (H4):
There is a negative association between Reactive and EDD.
Hypotheses 2–4 are tested with OLR models. A prediction for the associations or lack thereof between EDD and each independent variable is based on literature review concerning facilitative factors for successful collaborative governance between expert and citizen actors. As the focus of this research is the watershed community context, each hypothesis is applied to each regression model to allow for comparisons.
3. Results
3.1. Descriptive Survey Results
There were 168 respondents. Of those, 164 provided their locations: 131 (81%) were Geneva Lake residents and 32 (19%) from Green Lake. Table 3 displays these and other citizen demographics and is subject to incomplete survey protocols.
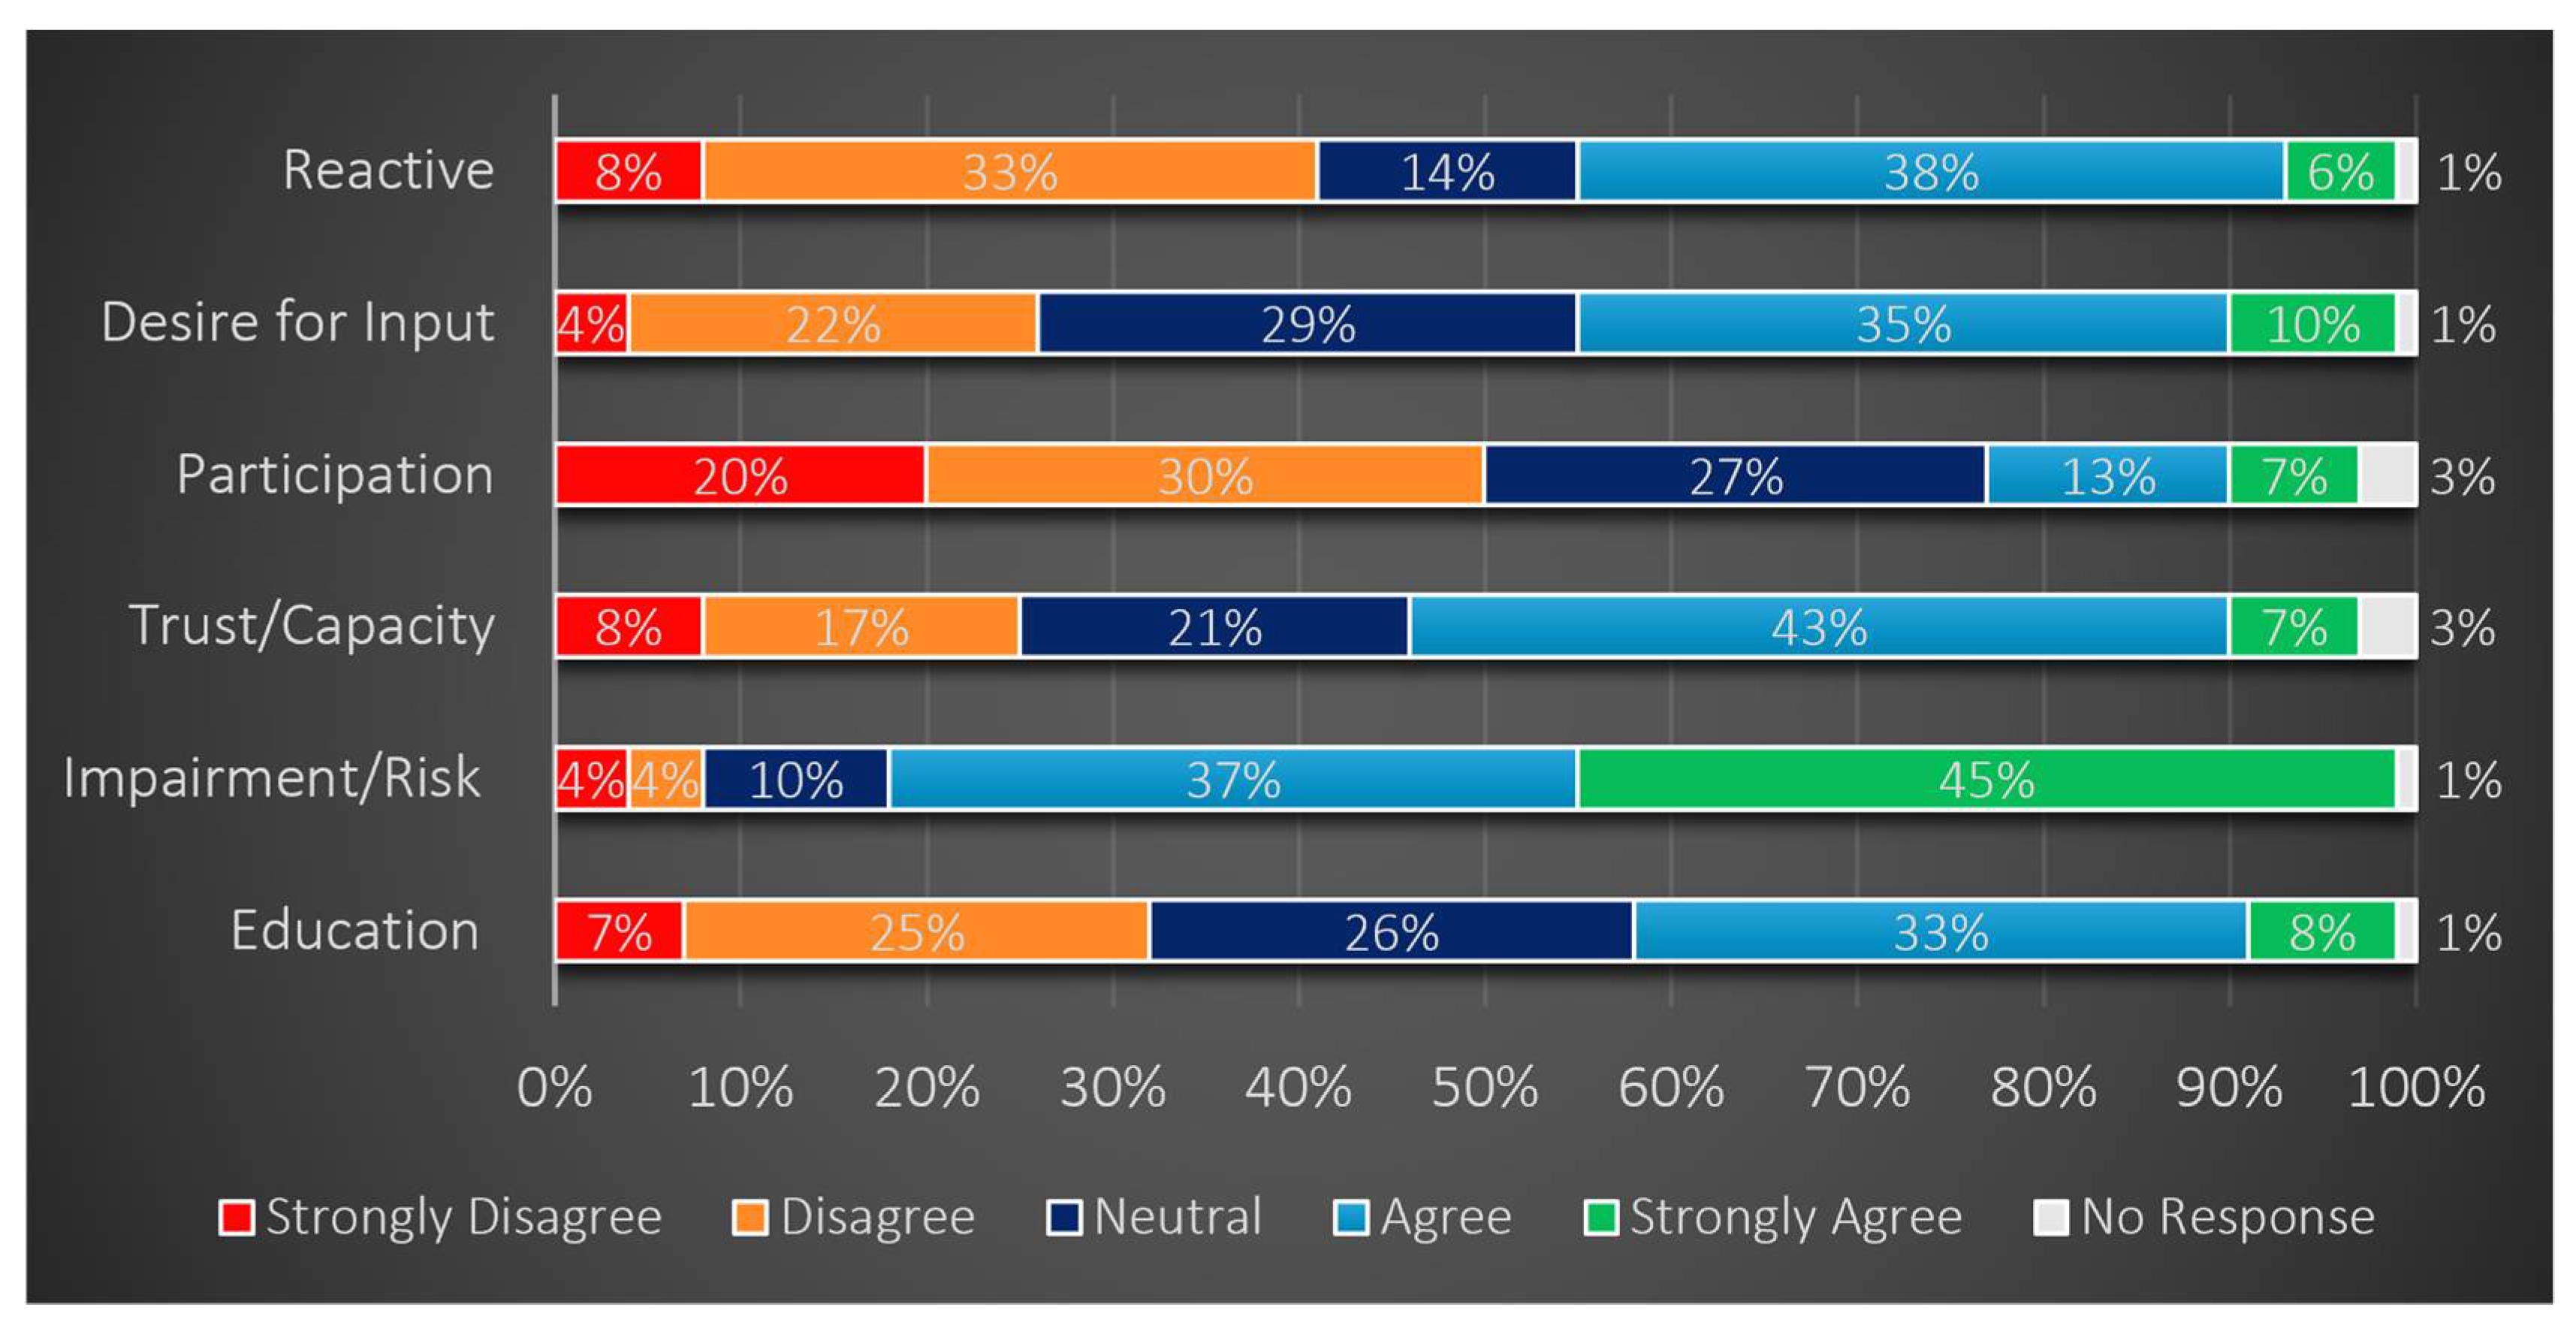
Figure 6 summarizes respondent perceptions. Most responses agreed (45%) compared to disagree (26%). Participation (survey question #5) was designed to gauge respondents’ present level of participation in watershed management. Half of all respondents either disagreed or strongly disagreed. Trust/Capacity (survey question #4) has the opposite pattern compared to Participation responses. Specifically, 29% have a negative, 21% neural ratio, but half of all respondents either agreed or strongly agreed that they trust in the effectiveness of existing, expert-led, watershed management networks.
Impairment/Risk (survey question #3) asked respondents if they agreed that an impaired designation for their lake represents other environmental risks with the most consensus agreement. Lastly, Education (survey question #1) yielded varied responses. Survey question #6 relates to the first of four hypothesis tests. Average ranks are displayed in Table 4, and it should be noted that the value of 1 is the highest negative score.
To test H1, a Friedman rank-sum test was conducted to assess whether the observed rankings observed in Table 4 were significant. The test yielded a p-value of <0.0001. This result verifies the ranks displayed in Table 4. In other words, there is a significant difference in the ranking of watershed management groups. Further, the null hypothesis for H1 is rejected due to the low p-value. In summary, these results suggest ENGOs were perceived as having the most meaningful impact on watershed management compared with public or government groups.
3.2. Regression Results
Table 5 displays the results from each OLR model. The odds ratio is included for each independent variable.
A (+) or (−) symbol next to the odds ratio indicates a positive or negative relationship with EDD. In each model, Reactive was negatively associated with EDD. This means that high values for the Reactive variable decreased community EDD compatibility, provided all other values in the model remain constant. Further, the odds ratio for Table 5 indicates that for every level of increase for the Reactive variable, the odds that the EDD compatibility level decreases are 0.69. Similarly, the odds ratio indicates that for every level of increase for the Reactive variable, the odds that the EDD compatibility level decreases are 0.63. These results were statistically significant for models with all respondents and Geneva Lake-only respondents. As such, we reject the null hypothesis for H4 for these models. These results provide evidence that post-crisis watershed management behaviors limit the capacity of these stakeholder communities to sustain management practices that adhere to the principles of EDD.
Although the dependent variable is theoretically best coded as a factor variable and ran as an ordered logit to methodologically assess the strength of the relationships and hypotheses, a generalized linear regression analysis with numerical independent variables and a binary dependent variable is tested. Table 6 displays the bivariate relationships with the response variable structured as binary rather than weighted. Again, Reactive is negatively associated with EDD. Table 6 represents notable consistencies with the OLR model. However, for the purpose of hypothesis testing, this analysis relies on results from the OLR model due to the methodological and theoretical advantages discussed previously.
Observing the correlations in Table 7 confirms the negative association between EDD and Reactive. While this association is significant, the strength of the correlation is weak. Spearman’s rho (ρ) indicates the strength of monotonic relationships between bivariate data. As such, a ρ between 0 and ±0.4 represents a weak monotonic relationship, while a ρ between ±0.41 and ±1 indicates a moderate to strong bivariate relationship. In this case, ρ = −0.175 for the Reactive variable, thus we observe a weak negative correlation. In summary, the results in Table 7 strengthen the evidence of a negative association between EDD and Reactive.
We fail to reject the null hypothesis for H2 and H3 as the associations between EDD and the trust/capacity and education variables are not significant in any regression model. The Green Lake model does not show any significant associations. These quantitative results provide indications of community EDD compatibility, as well as demographic characteristics.
3.3. Qualitative Results: Citizen Stakeholder Activity
This category concerns citizen stakeholder socioeconomic diversity, perceptions of and participation in watershed governance, and interactions with community stakeholders. A GLSD representative described varying levels of interest in watershed management among community residents:
75% are wealthy and wish to protect their investment. They fund groups like Green Lake Association so watershed management issues can be “out of sight, out of mind.” 20% are full-time area residents, they do not understand the technical aspects of watershed management but understand why it is important. They generally want to get more involved and provide a public good for their community. This group is growing. 5% are full-time area residents who dislike government and feel they are taxed too much and want to avoid additional taxes relating to lake issues (personal interview, 11 May 2018).
Community stakeholders may not be actively involved in management strategies, or such participation is limited. This was expressed by a GLA representative when discussing organizational inputs and lake management plan (LMP) involvement:
If I had to identify both a strength and maybe weakness to our strategy it’s that maybe we are lacking active, Joe-Schmoe citizen involvement. In one way it makes us really nimble, a lot of lake associations rely on voluntary participation of citizens around the lake and so because of that it’s a big commitment of their time to make decisions (personal interview, 10 May 2018).
This dynamic was expressed by Geneva Lake participants as well. For instance, a Lake Geneva City official noted how risk perceptions might vary among lakeshore property owners:
(if) you have a multi-million dollar estate on the lake, you might care much more than (if) you inherited Grandma’s house, and it’s just sitting there, and you rent it out every now and then, because that would be very little risk to you if your property value decreased versus somebody who lives there full-time and has all of their investments in it. It’s the own individual perception of risk (personal interview, 9 May 2018).
A total of 4 of the 12 interviewees, all professionals from the Green Lake watershed, expressed that funding was the most meaningful citizen contribution. Most responses varied according to the operations of the group a particular respondent represented. For instance, GLA representatives referred to their primary membership (and donor) base when discussing citizen stakeholders. These contributors are often lakeshore property owners. These appear to be the most active citizen stakeholder group in each area. However, their contributions are largely monetary and go toward funding ENGO projects. At Geneva Lake, there are families who have owned large portions of lake shore property for generations, with significant property tax impacts. For example, a proposed city budget for 2019 lists ~USD $7 million in property tax revenue [27]. Interviews yielded much commentary on the economic and political power of lakeshore residents; however, narratives of meaningful NRM decision making by citizen stakeholders with lower incomes are largely absent. Additional thematic categories may explain how other citizen groups interact with watershed managers.
3.4. Qualitative Results: Organizational Leadership
Interviewees frequently cited organizational leadership in relation to watershed education. For example, all Geneva Lake interviewees mentioned the GLEA is a leading source of community education, distributing pamphlets, newsletters, and other materials to residents. Similarly, GLA and GLSD assume some responsibility for educating area residents about Green Lake water quality issues. This educational role may be indicative of public trust of these groups and their activities. The GLSD has secured at least USD $2 million in grant dollars from 1996 to 2016 for agricultural BMP installation and other water quality protection programs. This has allowed for landowner-friendly cost-sharing for BMP instillations, which GLSD maintains in perpetuity. This aggressive expansion of conservation efforts led by GLSD represents institutional entrepreneurship, as this group both initiates and actively participates in change [28].
3.5. Qualitative Results: Proactive and Reactive Watershed Management
When discussing what motivates citizen stakeholders to participate in watershed management, participants often noted that environmental crises can trigger a reaction by the public. This phenomenon is of interest for this research, as Green Lake is listed as an impaired water body while Geneva Lake is not. The impaired classification by WDNR unlocked significant funding sources for Green Lake conservation programs. Consequently, watershed managers formulated the Green Lake Management Plan with the assistance of a citizen advisory board, expanded remediation efforts, and BMP implementation. To qualify for state and federal funding, citizen stakeholders must be involved in certain planning stages. These examples demonstrate how pollution impairment can be advantageous for facilitating EDD governance processes.
The management efforts at the Geneva Lake watershed are not as expansive. This can largely be attributed to the state and federal funding gap between these areas. However, lake protection and land conservation appear to be a priority in this area nonetheless, with funding from municipal governments as well as public donations. A GLEA representative shared a question often asked of him during community meetings: “Why do we need a lake management agency, we’ve got a great lake?” (personal interview, 7 May 2018). With respect to this question, the quality of the lake seems to be linked with cultural values and economic prosperity. The GLEA representative offered his perspective to justify management programs: “If we were in a mode of trying to rehabilitate this lake which, if it was deteriorating then definitely it would be part of our management effort; it would cost a lot more” (personal interview May 2018).
Accompanying this sentiment is a community pride in a quality lake, according to the GLEA participant: “I think Geneva Lake is known throughout at least Southeastern Wisconsin as the ultimate recreational lake. So the communities and the people that live around here have pride in that.” (personal interview, 7 May 2018). The rationale for proactive watershed management is well received by citizens when framed as a personal economic issue as well: “When you get people spending a lot of money to buy a house or land on this lake, it’s a significant investment to them and they want to protect that investment. And that’s how we market lake management: protect your investment” (personal interview 7 May 2018).
A GLA participant shared their story about a 2015 event that elicited public interest. The Green Lake LMP team installed a carp barrier to prevent the uprooting of aquatic vegetation in a degraded estuary. Numerous carp exhausted themselves trying to breach the barrier, which caused the shores to become littered with dead, foul-smelling carp:
We always have an annual meeting that’s open to the public--which is moderately well attended--but the year of the carp we had to bring in extra chairs there were so many more people that attended the meeting because they were concerned. They were in some cases upset, or they were just generally intrigued at what the heck was going on” (personal interview, 10 May 2018).
They also noted: “I don’t wish that we could have a good ole’ catastrophe, but it would make it easier to justify what we do” (personal interview, 10 May 2018). Invasive species expansion has garnered public interest at Green Lake. Zebra mussels were first observed at Green Lake in 2001 [4]. Their expansion into benthic areas in the littoral zone was accelerated because of their tremendous capacity for reproduction (females can produce up to one million eggs every season). Consequently, their excessive waste byproducts coincided with increased green filamentous algae growth at Green Lake [4]. A GLSD representative explained how residents were alarmed by the magnitude of surface algae, which accumulated along shores and emitted a foul odor: “Zebra mussels changed the game. On a scale of 1–10, watershed management went from a 6 to an 8 because of the zebra mussel problem” (personal interview, 11 May 2018).
These perceptions can inform understandings of what motivates stakeholders to expand or reform watershed management. Green Lake’s impairment has enabled expansive conservation programs that receive public interest. At Geneva Lake, awareness of how impairment can disrupt recreation and aesthetics appears to be enough of a deterrent to motivate proactive watershed protection efforts.
4. Discussion
Quantitative analysis for this research confirmed that survey respondents perceived nonprofit ENGOs as having the most meaningful impact on watershed management. The qualitative data adds context to these perceptions. Expert interviewees consistently expressed the importance of community groups for communicating complex scientific ideas to the public in an understandable manner. GLA and other Green Lake management groups appear to take their roles very seriously, both in terms of keeping the public informed and expanding conservation efforts. Interviewees emphasized the framing of environmental issues by community watershed management networks as an essential responsibility of expert stakeholders. These participants discussed the cultural and economic significance of environmental quality. Appealing to these values is an effective means of justification for water resource protection.
Interviewees often discussed community education and public trust. For instance, GLEA and GLA both appear to have essential public education functions in their respective communities. Further, some interviewees suggested that public deliberation often occurs through education. This pattern is present in the narratives of respondents who noted that educational efforts are often the catalyst for discourse between public, government, and non-government stakeholders. Geneva Lake interviewees discussed the political influence held by lakeshore homeowners’ associations. Given this dynamic, it seems likely that trusted ENGOs such as GLEA and GLA could engage other citizen stakeholders.
The assumption that environmental crises trigger participatory public responses was the rationale behind survey question #8, and the Reactive independent variable for OLR models. It was expected that reactive behaviors would limit EDD compatibility. This assumption was substantiated by results for the Geneva Lake OLR model, as well as the model that includes all respondents. There is evidence to support the assertion that the Geneva Lake community fosters proactive public watershed governance. Geneva Lake interviewee responses add context to this relationship. For this community, proactive watershed protection seems to be linked with cultural identity, as well as economic prosperity. Although Green Lake interviewees acknowledged the conceptual merits of proactive watershed management, reactive patterns were also identified. For instance, many Green Lake interviewees noted that the Green Lake Management Plan was designed because of a need for revised management strategies in response to Green Lake’s impairment status. More empirical testing is needed to confirm this pattern, as the Green Lake OLR model failed to reject the null hypothesis for H4. With respect to quantitative methods, a critical view of these analyses and overall study design may provide assistance to future investigators.
Each OLR model treats ordinal Likert responses for the three independent variables as numeric data. This is problematic according to some scholars because it assumes equidistance between each level. Similarly, numeric data can have a continuous normal distribution when, in fact, the categorical data cannot have a true normal distribution. In other words, the difference between “agree” and “strongly agree” for respondent A may be very different from respondent B. Discrete response frequencies for each independent variable were close approximations of a normal distribution, thus limiting the shortcomings of this analytical approach.
The survey and interview analyses may have been susceptible to volunteer bias, as individuals who volunteered for either may have been predisposed to feel strongly about watershed governance one way or another. For example, many survey respondents who regularly participate in citizen science or other community programs may marginalize the views of other respondents and cause inaccurate estimations [28]. The survey respondent demographics may indicate a degree of class bias because most respondents had household income and education levels exceeding community census averages.
The results of this study are generalizable only to the extent that researchers can identify similar population demographics and expert and lay perceptions. The site-specific dynamics at these Wisconsin watersheds can inform refined understandings of underlying factors contributing to EDD. Similar research inquiries in the future should note the importance of the political, social, and economic drivers at the local level before generalizing. Such efforts will be essential as communities confront intricate environmental problems. The human institutions that manage these environments, however, can be equally complex.
Watershed governance ideals and behaviors appear to vary between communities surrounding the impaired Green Lake, which receives state funds based on its impairment, and Geneva Lake. While Geneva Lake does not receive comparable state funds, watershed management programs receive support from an interested citizen stakeholder base, mostly in the form of private donations for ENGO activity. Further, the Green Lake Management Plan was formulated with the assistance of a citizen advisory committee. However, this group was disbanded after publication, and expert interviewees have suggested that advisory committee participation was symbolic. This could be due to the community mandates of federal and state grant programs, a reluctance by decision makers to empower lay populations, public indifference, or a combination. Regardless, these half measures are insufficient to maximize net benefits for social capital, institutional capacity, and water quality. In contrast, the government-run watershed management network at Green Lake has produced substantial program implementation results. These results indicate that reactive EDD practices may indeed produce short-term results, but the long-term potential for success is less secure when compared to communities that proactively build community capacity for addressing NRM issues. Collectively, these public views, along with continued institutional entrepreneurship by ENGO groups, represent the foundation for deliberative watershed governance.
Author Contributions
Conceptualization, H.K. and N.G.; methodology, H.K. and N.G.; software, H.K. and N.G.; validation, H.K. and N.G.; formal analysis, H.K.; investigation, H.K.; resources, H.K.; data curation, H.K.; writing—original draft preparation, H.K.; writing—review and editing, N.G.; visualization, H.K.; supervision, N.G.; project administration, N.G. All authors have read and agreed to the published version of the manuscript.
Funding
This research received no external funding.
Institutional Review Board Statement
The study was conducted according to the guidelines of the Declaration of Helsinki and approved by the Institutional Review Board (or Ethics Committee) of SOUTHERN ILLINOIS UNIVERSITY EDWARDSVILLE (protocol code #18-0110-100 approval of human subject exception 10-22-2018).
Informed Consent Statement
Informed consent was obtained from all subjects involved in the study.
Data Availability Statement
The data presented in this study and the appendixed questionnaire are available on request from the corresponding author. The data are not publicly available due to original data collection.
Conflicts of Interest
The authors declare no conflict of interest.
Abbreviations
| BMP | Best Management Practices |
| EDD | Environmental Deliberative Democracy |
| ENGO | Environmental Non-Government Association |
| GLA | Green Lake Association |
| GLC | Geneva Lake Conservancy |
| GLEA | Green Lake Environmental Agency |
| GLSD | Green Lake Sanitary District |
| LMP | Lake Management Plan |
| NRM | Natural Resources Management |
| OLR | Ordered Logical Regression |
| SDWA | Safe Water Drinking Act |
| TP | Total Phosphorus |
| WDNR | Wisconsin Department of Natural Resources |
Appendix A. Survey Questions
Citizen Perceptions of Watershed Management
Questions ending with * indicate a Likert scale response method.
This survey is intended to gauge citizen stakeholder perceptions concerning the management and governance of watersheds. The survey will take approximately 3 to 5 min to complete. If there is a question you prefer not to answer, please skip and complete the survey. This information will be used as part of a graduate student thesis project. Please answer questions as accurately as possible. Each participant will be entered into a drawing for a $25 Amazon gift card (two are available). Winners will be notified via email sometime in Spring 2019.
- Education concerning water resources is strong in your Community. *
- What do you perceive as the largest threat to water quality in your community?Nutrient runoff from agricultural activitiesSediment runoff from expanding development near water bodiesAbuse and misuse from water recreation activitiesContamination of groundwater resourcesAn unengaged communityInvasive and non-native species causing aquatic species lossMismanaged septic systems causing pollution from wastewaterOther (please specify)
- A lake, or water body classified as pollutant “impaired” by the State represents environmental and economic risks for my community. *
- I trust local watershed management groups to effectively address environmental concerns. *
- I am meaningfully involved in natural resource decision making processes in my watershed (policies, ordinances, field work, etc.). *
- Please rank the following groups based on their level of involvement in watershed management in your watershed (“1” being most significant, “5” being least significant)Municipal and County GovernmentEnvironmental Interest Groups and Non-Profit OrganizationsState GovernmentCitizen StakeholdersFederal Government
- Experts hold too much power concerning watershed management, and citizens should be more actively involved in decision making. *
- I am more likely to become involved in watershed management after an environmental concern arises and affects me directly, as opposed to working to prevent a concern from occurring in the first place. *
- Please provide the name of your County, zip code, and municipality. Are current municipal/county strategies to manage your watershed satisfactory, or are more innovations and technologies needed?
- What is your age?17 or younger18–2021–2930–3940–4950–5960 or older
- What was/is your typical yearly household income? (Check all that apply)Less than $20,000$20,000 to $34,999$35,000 to $49,999$50,000 to $74,999$75,000 to $99,999$100,000 to $149,999$150,000 to $199,999$200,000 or more
- Which of the following categories best describes your employment status?EmployedRetired or Not Employed
- What is the highest level of school that you have completed?High school diploma (or GED)College degreeGraduate-level degree
References
- Protecting Wisconsin’s Lakes. 2018. Available online: http://www.wisconsinlakes.org/ (accessed on 9 October 2018).
- Roberson, J.A.; Frey, M.M. An SDWA Retrospective: 20 Years after the 1996 Amendments. J.-Am. Water Work. Assoc. 2016, 108, 22–30. [Google Scholar] [CrossRef]
- Strifling, D. Integrated Water Resources Management and Effective Intergovernmental Cooperation on Watershed Issues. Mercer Law Rev. 2018, 70, 399–435. [Google Scholar]
- A Lake Management Plan for Green Lake. 2015. Available online: http://www.glakesd.com/wp-content/uploads/2014/08/Green-Lake-LMP-Part-1-UPDATED-2015.pdf (accessed on 8 May 2019).
- Wisconsin Department of Tourism. Total Tourism Impacts. Industry.Travelwisconsin.com. 2018. Available online: http://industry.travelwisconsin.com/research/economic-impact (accessed on 8 May 2019).
- U.S. Geological Service. Green Lake, Wisconsin and Its Watershed, with Sampling. 2020. Available online: https://www.usgs.gov/media/images/green-lake-wisconsin-and-its-watershed-sampling (accessed on 15 October 2021).
- Baumann, J. Green Lake Priority Watershed Project Final Report; WDNR Bureau of Watershed Management: Madison, WI, USA, 1997.
- Green Lake Sanitary District. 2018. Available online: http://www.glakesd.com/ (accessed on 5 February 2018).
- Green Lake Association. 2018. Available online: http://www.greenlakeassociation.com/glaw/index.php/about-us-2/ (accessed on 8 May 2019).
- Prellwitz, S.; Mark, C.; Sesing, M. Big Green Lake watershed nine key elements plan. 2018; unpublished manuscript. [Google Scholar]
- Baumgart, P. Application of the Soil and Water Assessment Tool (SWAT) to Evaluate Non-Point Source Phosphorus and TSS Loads in the Big Green Lake Watershed, Wisconsin (Rep.); University of Wisconsin–Green Bay: Green Bay, WI, USA, 2015; Available online: https://wwwtest.nelson.wisc.edu/wp-content/uploads/2015_Baumgart_Green_Lake_Watershed_Model.pdf (accessed on 8 May 2019).
- Batt, R.D.; Carpenter, S.; Ives, A.R. Extreme events in lake ecosystem time series. Limnol. Oceanogr. Lett. 2017, 2, 63–69. [Google Scholar] [CrossRef]
- Robertson, D.M.; Goddard, G.L.; Mergener, E.A.; Rose, W.J.; Garrison, P.J. Hydrology and Water Quality of Geneva Lake, Walworth County, Wisconsin (No. 2002-4039). US Geological Survey. 2012. Available online: https://www.researchgate.net/publication/263046265_Hydrology_and_water_quality_of_Geneva_Lake_Walworth_County_Wisconsin (accessed on 8 May 2019).
- Peters, T.W. Lake Management. 2018. Available online: https://www.genevalakemanagement.com/lake-management (accessed on 8 May 2019).
- Peters, T.W. Geneva Lake Data. 2018. Available online: https://www.genevalakemanagement.com/geneva-lake-data (accessed on 8 May 2019).
- Southeastern Wisconsin Regional Planning Commission. A Lake Management Plan for Geneva Lake Walworth County, Wisconsin. 2008. Available online: https://dnr.wi.gov/lakes/grants/largereports/LPL-756-01_GENEVA_LAKE.pdf (accessed on 9 November 2021).
- U.S. Census Bureau. Selected Economic Characteristics 2011–2015 American Community Survey 5-Year Estimates. 2015. Available online: https://data.census.gov/cedsci/all?q=acs%202011-2015 (accessed on 16 October 2017).
- NVivo Software. Available online: https://www.qsrinternational.com/nvivo-qualitative-data (accessed on 8 May 2019).
- Strauss, A.; Corbin, J. Basics of Qualitative Research; SAGE Publications: Thousand Oaks, CA, USA; University of Michigan: Ann Arbor, MI, USA, 1990. [Google Scholar]
- Glaser, B.G. Open coding descriptions. Grounded Theory Rev. 2016, 15, 108–110. [Google Scholar]
- Creswell, J.W. Qualitative Research and Research Design: Choosing among Five Traditions; Sage Publications, Inc.: Thousand Oaks, CA, USA; London, UK, 1998. [Google Scholar]
- Gibbs, G.R. Grounded Theory, Coding and Computer-Assisted Analysis; Policy Press: Bristol, UK, 2012. [Google Scholar]
- Kiefer, D. Research Methodology, Method, Research Design and Research Context. In Multicultural Work in Five United Nations Organisations: An Austrian Perspective; Peter Lang AG: Frankfurt am Main, France, 2009; pp. 37–51. Available online: http://www.jstor.org/stable/j.ctv9hj6vd.5 (accessed on 8 May 2019).
- SurveyMonkey. Available online: SurveyMonkey.com (accessed on 8 May 2019).
- Subedi, B.P. Using likert type data in social science research: Confusion, issues and challenges. Int. J. Contemp. Appl. Sci. 2016, 3, 36–49. [Google Scholar]
- Wiersma, W. The validity of surveys: Online and offline. Oxf. Internet Inst. 2013, 18, 321–340. [Google Scholar]
- Berner, D. City of Lake Geneva 2019 Proposed Budget [PDF]. Lake Geneva. 2018. Available online: https://www.cityoflakegeneva.com/vertical/sites/%7B14619068-6F01-4703-8EEB-EA74850C93B5%7D/uploads/11-Budget_Book_Complete.pdf (accessed on 8 May 2019).
- Battilana, J. Agency and institutions: The enabling role of individuals’ social position. Organization 2006, 13, 653–676. [Google Scholar] [CrossRef]
Figure 1.
Location of Green Lake and Lake Geneva in Wisconsin.

Figure 2.
Green Lake watershed land use [6].
Figure 2.
Green Lake watershed land use [6].

Figure 3.
Average annual epilimnetic total phosphorous at Green Lake [4].
Figure 3.
Average annual epilimnetic total phosphorous at Green Lake [4].

Figure 4.
Magnitude of precipitation events by decade for Ripon, Wisconsin [10].
Figure 4.
Magnitude of precipitation events by decade for Ripon, Wisconsin [10].

Figure 5.
Geneva Lake watershed land use [13].
Figure 5.
Geneva Lake watershed land use [13].

Figure 6.
Citizen self-assessments of watershed governance behaviors (n = 168).


Table 1.
Total phosphorous loading to Green Lake by source from 2013 to 2016 [10].
Table 1.
Total phosphorous loading to Green Lake by source from 2013 to 2016 [10].
| Source | Phosphorus Loading (kg) | Data Source |
|---|---|---|
| Outlet of Silver Creek Estuary | 3074 | U.S. Geological Survey monitored loads |
| Outlet of County Highway K Marsh | 1294 | U.S. Geological Survey monitored loads |
| Ungaged Areas | 2279 | SWAT model [5] |
| Direct Precipitation | 904 | Precipitation at Ripon and Markesan; assuming a P concentration of 0.036 mg/L |
| Total Annual Phosphorus Loading (2013–2016): | 7552 kg |
Table 2.
Summary of thematic categories.
| Theme | Description | Central Question |
|---|---|---|
| Citizen Stakeholder Activity | Participation in watershed governance and interactions with community stakeholders. | Who participates in NRM and why? |
| Organizational Leadership | Characterizes shared institutional responsibility. Discussions surrounding organizational directives and roles. | Are there varied collaborative and management functions among community organizations? |
| Proactive and Reactive Watershed Management | A focus on the justifications for preventative management, the effects of budget concerns, and impaired water body status. | Do environmental crises trigger public reactions? |
Table 3.
Citizen survey respondent demographics.
| Age | Geneva Lake (n = 131) | Green Lake (n = 32) | All (n = 168) | |
|---|---|---|---|---|
| 29 or younger | 0% | 3% | 7% | |
| 30–39 | 6% | 16% | 8% | |
| 40–49 | 17% | 9% | 16% | |
| 50–59 | 21% | 28% | 22% | |
| 60 or older | 47% | 44% | 46% | |
| Household Income | ||||
| USD $34,999 or less | 9% | 7% | 9% | |
| USD $35,000 to $49,999 | 8% | 10% | 8% | |
| $50,000 to $74,999 | 14% | 10% | 14% | |
| USD $75,000 to $99,999 | 13% | 17% | 13% | |
| USD $100,000 to $149,000 | 25% | 21% | 25% | |
| USD $150,000 to $199,999 | 14% | 10% | 14% | |
| USD $200,000 or more | 16% | 24% | 18% | |
| Career Status | ||||
| Employed | 58% | 65% | 61% | |
| Retired or not employed | 42% | 35% | 39% | |
| Education | ||||
| High school diploma or equivalent | 12% | 6% | 11% | |
| College degree | 47% | 71% | 52% | |
| Graduate-level degree | 40% | 23% | 37% |
Table 4.
Citizen assessments of significant watershed management groups.
| Category | Mean Rank |
|---|---|
| Environmental Interest Groups and Nonprofit Organizations (n = 143) | 2 |
| Municipal and County Government (n = 134) | 2.4 |
| Citizen Stakeholders (n = 134) | 2.9 |
| State Government (n = 136) | 3.2 |
| Federal Government (n = 155) | 4.1 |
Table 5.
Ordered logistic regression results.
| OLR Model | Independent Variable | Odds Ratio | p-Value |
|---|---|---|---|
| All Respondents (n = 168) R2 = 0.068 | |||
| Education | 1.204 (+) | 0.212 | |
| Trust/Capacity | 0.91 (+) | 0.525 | |
| Reactive | 0.699 (−) | 0.01 * | |
| Geneva Lake (n = 131) R2 = 0.075 | |||
| Education | 1.141 (+) | 0.432 | |
| Trust/Capacity | 0.946 (+) | 0.7 | |
| Reactive | 0.639 (−) | 0.006 ** | |
| Green Lake (n = 32) R2 = 0.103 | |||
| Education | 1.204 (+) | 0.068 | |
| Trust/Capacity | 0.91 (+) | 0.922 | |
| Reactive | 0.699 (−) | 0.593 | |
* 0.05 Significance Level; ** 0.01 Significance Level.
Table 6.
Generalized linear model results.
| Data | Independent Variable | Coefficient | p-Value |
|---|---|---|---|
| All Respondents (n =168) | Education | 0.135 (+) | 0.391 |
| Trust/Capacity | 0.128 (−) | 0.421 | |
| Reactive | 0.329 (−) | 0.023 * |
* 0.05 significance level.
Table 7.
Independent variable Spearman correlations with environmental deliberative democracy.
| Data | Independent Variable | Spearman Rho (ρ) | p-Value |
|---|---|---|---|
| All Respondents (n =168) | Education | 0.058 | 0.448 |
| Trust/Capacity | −0.071 | 0.371 | |
| Reactive | −0.175 | 0.023 * |
* 0.05 significance level.
Publisher’s Note: MDPI stays neutral with regard to jurisdictional claims in published maps and institutional affiliations. |
© 2022 by the authors. Licensee MDPI, Basel, Switzerland. This article is an open access article distributed under the terms and conditions of the Creative Commons Attribution (CC BY) license (https://creativecommons.org/licenses/by/4.0/).
Share and Cite
MDPI and ACS Style
King, H.; Guehlstorf, N. Assessing the Variances of Citizen Stakeholder Justice in Watershed Governance: Is Action More Effective with Reactive or Proactive Administrations. Water 2022, 14, 878. https://doi.org/10.3390/w14060878
AMA Style
King H, Guehlstorf N. Assessing the Variances of Citizen Stakeholder Justice in Watershed Governance: Is Action More Effective with Reactive or Proactive Administrations. Water. 2022; 14(6):878. https://doi.org/10.3390/w14060878
Chicago/Turabian StyleKing, Hayden, and Nicholas Guehlstorf. 2022. "Assessing the Variances of Citizen Stakeholder Justice in Watershed Governance: Is Action More Effective with Reactive or Proactive Administrations" Water 14, no. 6: 878. https://doi.org/10.3390/w14060878
Note that from the first issue of 2016, this journal uses article numbers instead of page numbers. See further details here.