Cumulative Effects of Physical, Chemical, and Biological Measures on Algae Growth Inhibition
by
 , ,
, ,
Hao Li
1 ,
,
Jiaqi Wang
1,
Enze Zhang
2,*,
Yanan Shao
1,
Lin Yang
1,
Baiheng Yang
1,
Yi Tan
1 and
Ting Gao
1 1
School of Environment, Beijing Normal University, Beijing 100875, China
2
Faculty of Architecture, Civil and Transportation Engineering, Beijing University of Technology, Beijing 100124, China
*
Author to whom correspondence should be addressed.
Water 2022, 14(6), 877; https://doi.org/10.3390/w14060877
Submission received: 8 February 2022
/
Revised: 27 February 2022
/
Accepted: 8 March 2022
/
Published: 11 March 2022
(This article belongs to the Section Biodiversity and Functionality of Aquatic Ecosystems)
Abstract
:Measures based on concurrent alterations of an environment’s physical, chemical, and biological factors are commonly adopted to control harmful algal blooms (HABs). It was postulated that the combinations and interactions of multiple measures could exert cumulative effects (as the overall effect may or may not be equal to the additive sum for each measure individually). However, few studies have further assessed whether the cumulative effect is synergistic, additive, or antagonistic. This study proposed a framework to distinguish and quantify the cumulative effects. We also designed an experiment to investigate the cumulative effect of the combined utilization of physical (flow velocity), chemical (copper), and biological (propionamide) measures on algae growth inhibition. The results show that the cumulative effect of physical and chemical measures on algae growth inhibition was antagonistic; the cumulative effect of physical and biological measures was antagonistic; the cumulative effect of chemical and biological measures was synergistic, and the cumulative effect of all the measures together tended to be antagonistic. These results showed that the synergistic interactions between chemical and biological measures produced antagonistic effects when physical measures were added. Through response surface methodology analysis, we also found that the physical factor was the most significant factor affecting the cumulative effect, followed by the chemical factor and then the biological factor. Our results provide a more detailed understanding of the interaction patterns among multiple measures that affect algal growth. Importantly, this understanding can be further integrated into future strategy development to fully exploit the potential of the cumulative effect at its maximum performance.
1. Introduction
Harmful algae blooms (HABs) have become a prevalent environmental issue in freshwater ecosystems because they increase anthropogenic eutrophication and produce other deleterious effects on the natural environment [1]. The overgrowth of harmful algae can over-consume dissolved oxygen and nutrients that other aquatic organisms heavily rely on [2]. Thus, the immediate consequence of HABs is the subsistence or extinction of other aquatic species residing in the surrounding water [3] and the more adverse far-reaching implications of HABs are not limited to aquatic organisms [4]. Harmful algae can provide multiple secondary metabolites [5]. Some secondary metabolites can cause taste and odor pollution, directly degrade the recreational function of surrounding water bodies, and pose a severe risk to drinking-water supply [6,7]. Moreover, the negative impacts can be even more severe when the algae are toxic and produce algal toxins [8]. When ingested in large amounts by humans through the food web or accidental exposure, algal toxins can result in liver, digestive, and neurological diseases [9]. Since algae have an essential ecological role in aquatic ecosystems and many other natural systems, the more frequent and severe presence of HABs can have a catastrophic effect on environmental safety and human well-being [10].
With concerns about the adverse consequences of HABs, much effort has been made to regulate algae growth directly [9]. In practice, measures for controlling HABs can be accomplished by manipulating various physical, chemical, and biological factors [11]. The effects of physical and chemical measures on algae growth have been primarily studied, and their applications are relatively broader [12,13]. The most direct physical method is separating out and harvesting the microalgal biomass [14]. Hydraulic management, such as building hydrodynamic cavitation structures or using ultrasound technology, has also been adopted to inhibit algae blooms by damaging specific algae cellular morphology and functions [15,16]. Other physical methods, such as increased flow velocity and turbulence, aim to remove algae by regulating the hydrodynamic conditions [17]. Manipulating physical methods is a straightforward approach; however, some of these methods are not permanent and may not be a feasible or widespread solution due to high implementation costs and technical limitations [18]. As for chemical measures, adding chemical substances to the afflicted water body is the most commonly used measure since it is relatively cheap and can effectively remove toxic algae [19]. The commonly applied chemical substances, such as copper sulfate and hydrogen peroxide, can poison or oxidize algae cells [20]. Another essential chemical additive for harvesting algae is flocculants [21]. Chemical measures, however, can easily be used indiscriminately, causing secondary environmental pollution [22].
Compared to these abiotic measures, controlling HABs through biological factors and biotic interactions is eco-friendly [23,24]. The biological phenomenon of allelopathy has emerged as a promising biological approach [25]. It represents an essential biological interaction mechanism between aquatic plants and microalgae [26]. In responding to the aquatic plant–microalgae competition for nutrients, aquatic macrophytes can release a series of secondary metabolites called allelochemicals [27]. The primary function of allelochemicals is generalized as directly or indirectly interfering with the growth of algae or other organisms [28]. These measures can be developed either by directly cultivating aquatic macrophytes or by adding extracted allelochemicals to the water, utilizing allelopathic principles [27,29]. Propionamide is an allelopathic substance secreted by the aquatic plant Eichhornia crassipes, which can significantly inhibit the growth of Microcystis aeruginosa with semi-continuous addition under the concentration of 2 mg /L [30,31]. The disadvantages to this approach are that planting macrophytes can be time-consuming, and the effects of adding allelochemicals to the water may vary unpredictably, depending on the dosage and the external environment [32].
In practice, the regulation of HABs is usually achieved by the combined use of all these measures, either simultaneously or sequentially. It has been shown that physical, chemical, and biological measures can jointly exert a cumulative impact when control using only a single approach is not sufficiently effective; the measures can act together to inhibit algal growth [33,34]. In one investigation, for example, the combination of copper and current velocity was applied to check the growth of diatoms; the results showed that copper’s effect on algal biomass was mediated by varying the current velocity levels [35]. In another case, when combining metal–organic frameworks with allelochemicals, the nanocrystalline Zn-MOF-FA showed stronger inhibition on algal growth than a corresponding dosage of Zn (II) and ferulic acid [36]. Evidence has also shown that the combination of algaecide and flocculant can effectively remove water blooms on a lake surface [18]. The principle is that an algaecide such as H2O2 can inactivate the cyanobacteria. Then, the lake sediment clay, combined with polymeric ferric sulfate, can carry the inactivated cyanobacteria to the bottom of the lake and deposit them there.
When implemented together, multiple measures such as these can influence each other or act on the same targets in concert [37]. Their cumulative effects on growth inhibition could be synergistic, additive, or antagonistic. Additive effects are defined as cumulative effects that together equal the sum of each individual measure [38]. In contrast, synergism and antagonism define cumulative effects that are either larger or smaller than the additive [39]. When designing and evaluating a regulation strategy, compatibility of the cumulative effects among the multiple measures is a prerequisite [40,41]. One should expect that a synergistic effect that occurs in growth inhibition from one measure does not adversely affect the other measures, but rather that each measure’s effects contribute to the others’ [42]. However, because complex interactions could occur among physical, chemical, and biological measures, few studies have qualitatively or quantitatively distinguished any HAB regulation approach’s cumulative effects.
In this study, we selected flow velocity as a physical measure, copper sulfate as a chemical measure, and propionamide as a biological measure, to study the cumulative effects of two or three measures on the growth of Microcystis aeruginosa. Microcystis aeruginosa frequently appears in freshwater ecosystems and releases microcystins which can contribute to death in organisms and pose a serious threat to drinking water supplies [43]. Using full-factor experiments, we studied the cumulative effects of discrete changes in physical, chemical, and biological measures on Microcystis aeruginosa growth. The cumulative effects were identified and quantified as synergy, addition, or antagonism. Using response surface methodology (RSM), we also simulated the cumulative effect rates of continuous changes in physical, chemical, and biological measures on Microcystis aeruginosa growth [44].
2. Materials and Methods
2.1. Experimental Method
2.1.1. Tested Algae and Culture Conditions
The freshwater microalgal species Microcystis aeruginosa (FACHB 911) was obtained from the Freshwater Algae Culture Collection at the Institute of Hydrobiology, Chinese Academy of Sciences. We used a sterile BG-11 standard medium to cultivate Microcystis aeruginosa in flasks [45]. The cultivation was conducted under a 12:12 h light–dark cycle with illumination provided by a light incubator (2100 lux). The temperature was maintained at 26 ± 1 °C. The pH and DO were not controlled in the cultivation system. Shaking by hand twice a day reduced algal cell flocculation and agglomeration. Upon reaching the exponential growth phase, the microalgae were transferred into a fresh culture medium for experimentation. All cultivation and experiments were performed under sterile circumstances. All experimental glassware was completely immersed in 10% nitric acid for at least 24 h and then flushed with distilled water.
2.1.2. Allelochemical and Chemicals
Copper (II) sulfate pentahydrate (CuSO4·5H2O, ≥99%) and propionamide (CH3CH2CONH2, ≥97%) were purchased from Sigma-Aldrich, Beijing, China
2.1.3. Nutrient
BG11 standard medium was used to approximate the N + P conditions of enriched aquatic environments [45].
2.1.4. Flow Velocity
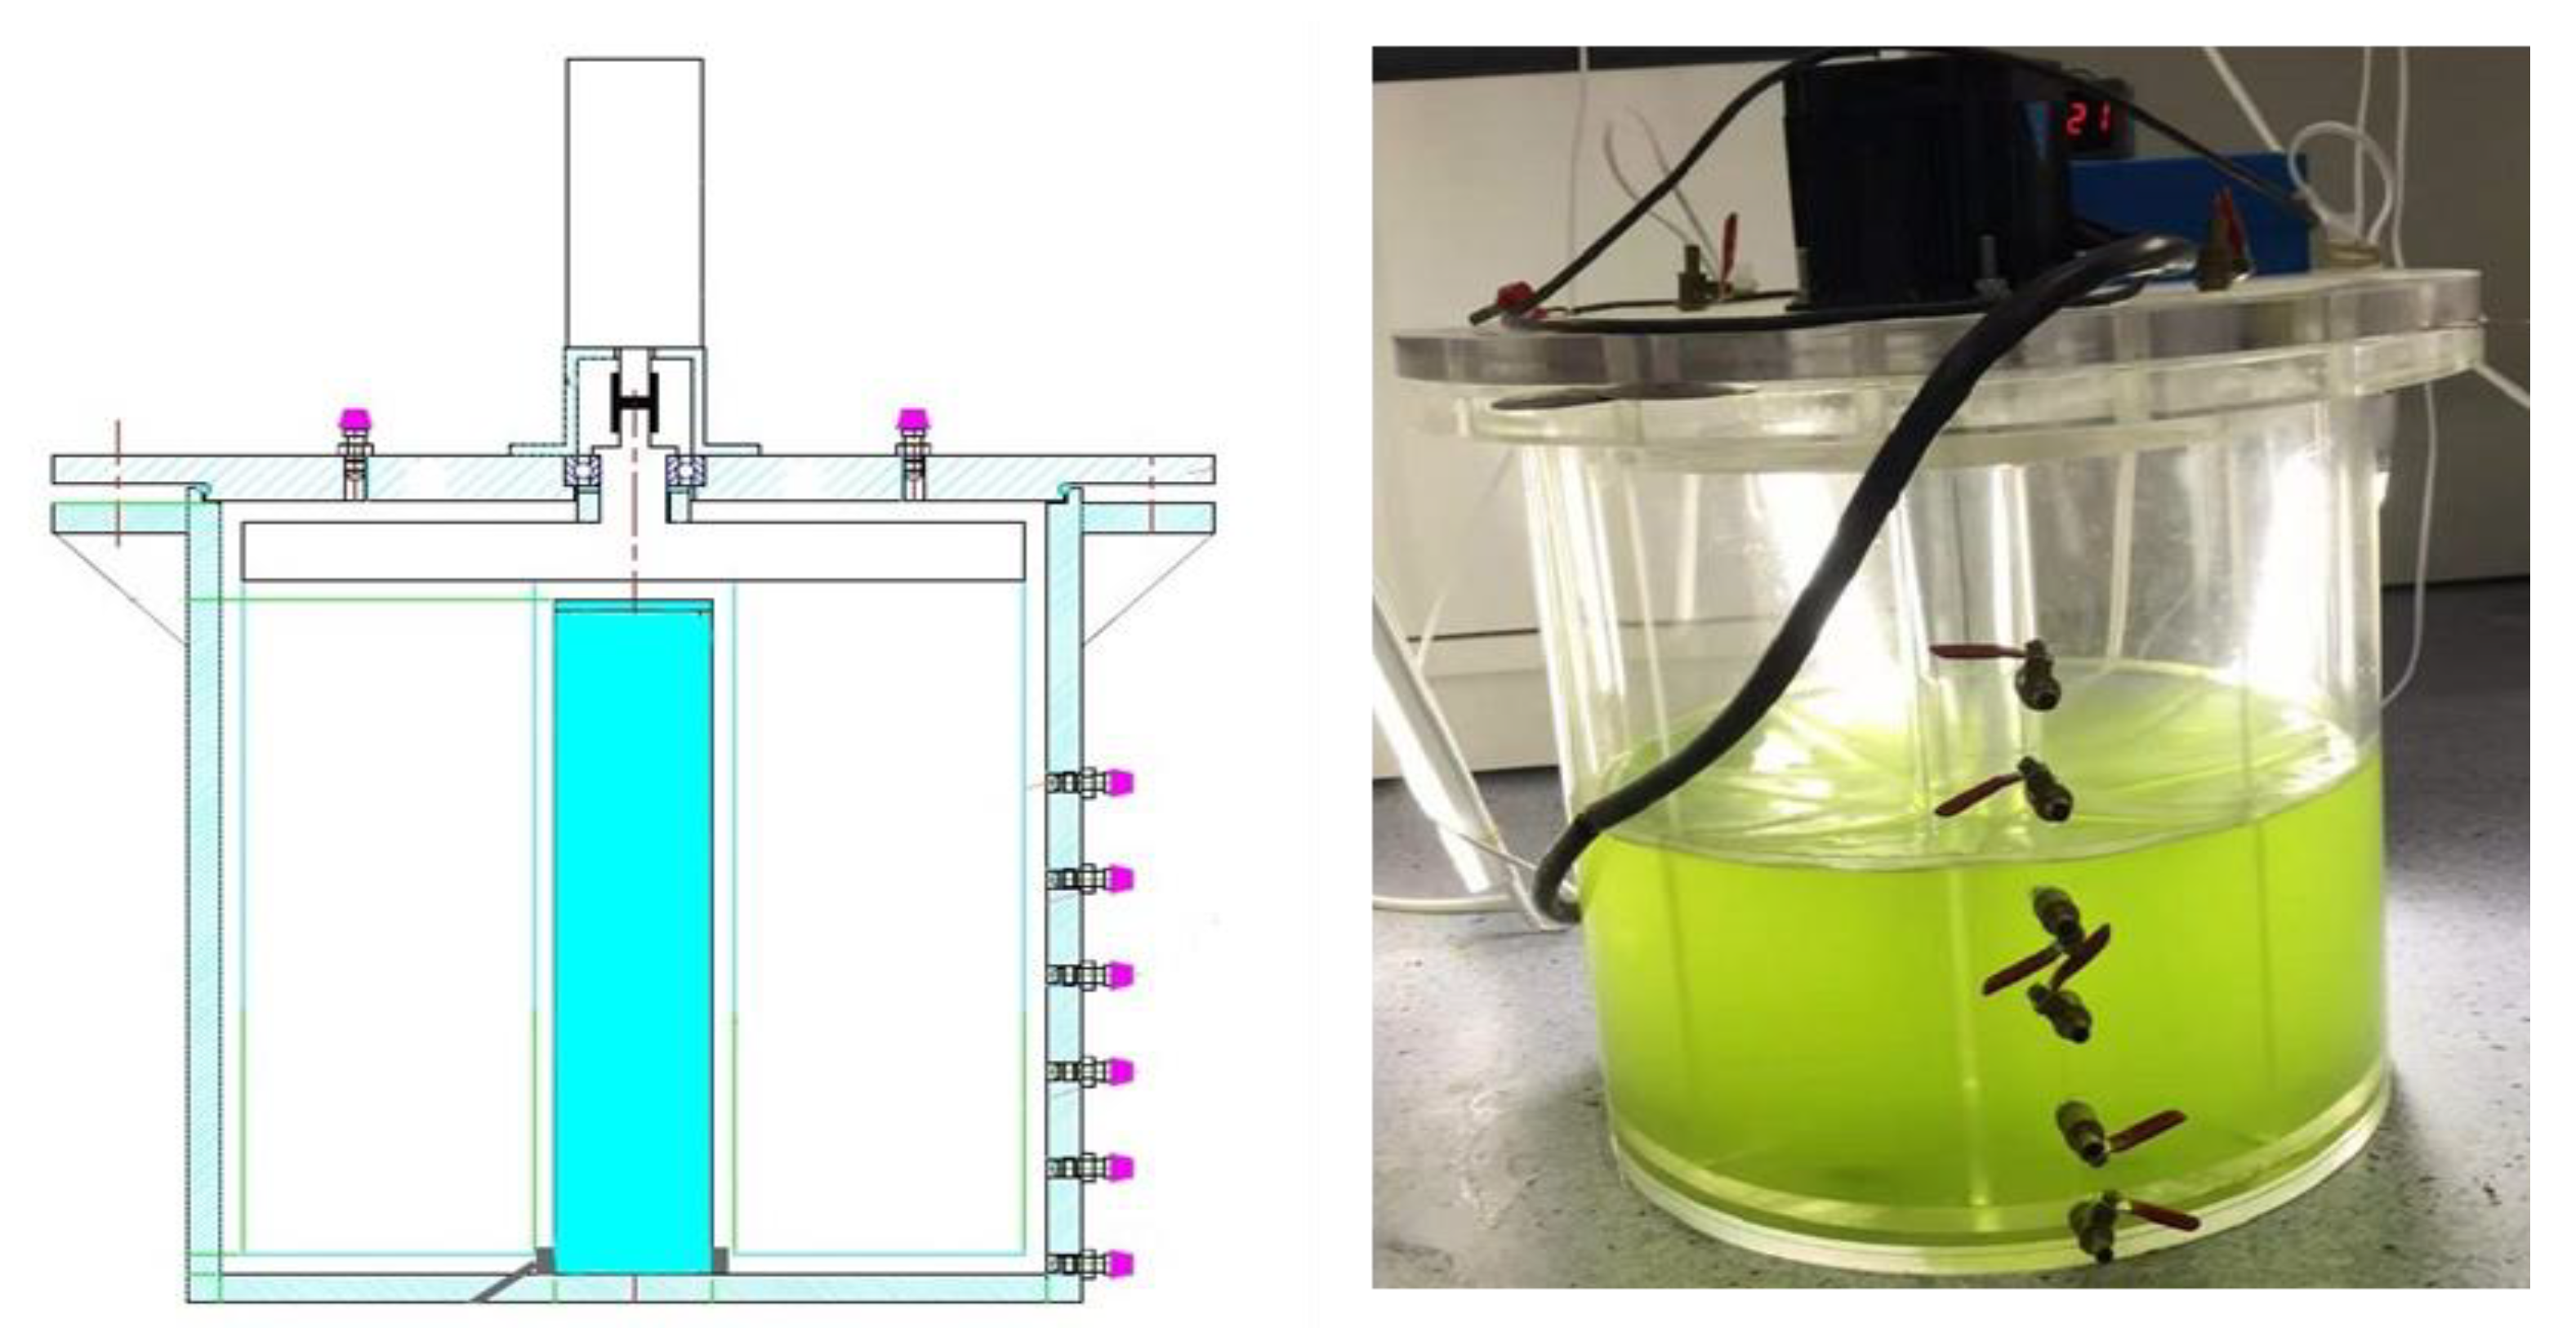
To hold the flow environment constant, flow velocity must be manipulated experimentally. (Figure 1). The flow velocity simulation device comprised a rotating baffle, a bioreactor, motors, and a variable controller. The continuously variable controller controlled the motors. The baffle, made from acrylic material, was connected to the motor and rotated horizontally. The water was pushed to a rotating flow inside the bioreactor. Controlling the baffle rotation speed produced the desired flow rate for the experiment. The bioreactor was made of acrylic material. A 41 L acrylic bioreactor was made with an outer diameter of 37 cm, an inner diameter of 7 cm, a middle width of 15 cm, and a depth of 40 cm. The bioreactor had six sample outlets on the outer wall, spaced 5 cm apart. The bioreactor was rotated at the selected speed for a period to achieve a stable condition.
2.1.5. Experiment and Sampling
A fully orthogonal experiment was designed with three factors and four levels. The factors and levels were A: flow velocity (0 m/s, 0.1 m/s, 0.15 m/s, and 0.2 m/s) [46], B: propionamide concentration (0 mg/L, 0.5 mg/L, 1 mg/L, and 1.5 mg/L) [31], and C: copper concentrations (0 μg/L, 5 μg/L, 10 μg/L, and 15 μg/L) [47,48]. The condition of no addition of physical, chemical, or biological measures was set as the control group. All groups were repeated three times.
In a sterile laboratory environment at 26 °C, the effect of flow velocity on Microcystis aeruginosa growth was performed with a flow velocity simulation device. The initial cell density of Microcystis aeruginosa was 3.5 × 10⁵ cells/mL. The cultivation was conducted under a 12:12 h light–dark cycle with illumination provided by a vertically suspended fluorescent lamp (2100 lux). The algae cell density in the control group reached the maximum cell density of 3.5 × 10⁶ cell/mL on the ninth day. The condition of no addition of physical, chemical, or biological measures was set as the control. Algae suspension samples of 50 μL were taken for each treatment group. The algal cell density of the samples was measured using flow cytometry.
2.2. Calculation of the Cumulative Effect (CE)
The cumulative effect includes synergy, addition, and antagonism. The cumulative effect of multiple measures on algal growth is defined by the following equation:
where CEim,jn represents the cumulative effect of the treatment group treated at both the m level of factor i and the n level of factor j. CE > 0 indicates a synergistic effect, CE = 0 indicates an additive effect, and CE < 0 shows an antagonistic effect. IRim represents the inhibition rate of the treatment group treated at the m level of factor i. IRjn represents the inhibition rate of the treatment group treated at the n level of factor j. IRim,jn represents the inhibition rate of the treatment group treated at both the m level of factor i and the n level of factor j. Nim represents the algal density (number of cells per mL) of the treatment group treated at the m level of factor i on the ninth day, and N0 represents the algal density (number of cells per mL) of the control group.
The cumulative effect rate of multiple measures on algal growth is expressed by the following equation:
where CERim,jn represents the cumulative effect rate of the treatment group treated at both the m level of factor i and the n level of factor j.
We studied the cumulative effects of discrete changes in physical, chemical, and biological measures at different levels on algal growth. To understand these effects in more detail, it is necessary to further analyze the influence of the cumulative effect rate of continuous changes of these measures at different levels.
2.3. Simulation of the Cumulative Effect Rate
RSM was performed to simulate the cumulative effect rate of continuous changes in physical, chemical, and biological measures at different levels on the algal growth. RSM, a multivariate statistical tool, consists of graphical representations used to describe simultaneous changes of multiple independent variables on response variables.
The experimental data were analyzed to match a second-order polynomial model by the following equation:
where Y is the response variable; β0 is the interception coefficient; βi and βii are model coefficients of the first and second order, respectively; βij is the linear model coefficient for the interaction between the independent variables i and j; Xi and Xj are factors, and ε is random error.
In the present study, the experimental design applied the Box–Behnken design (BBD) of RSM. BBD is a spherical rotation design to analyze the interactions of factors [49]. BBD was obtained using Design Expert (version 12.0.3.0; Stat Ease Inc., Minneapolis, MN, USA). Flow velocity (0.1 m/s, 0.15 m/s and 0.2 m/s), the concentration of propionamide (0.5 mg/L, 1 mg/L and 1.5 mg/L), and the concentration of copper (5 μg/L, 10 μg/L and 15 μg/L) were selected as independent variables and the cumulative effect rate as a response variable. The independent variables had low, medium, and high levels. There were 17 BBD experiments. The BBD data were collected from full factorial experiments. Table 1 shows the levels of variables in the BBD.
3. Results
3.1. Cumulative Effect of Physical and Chemical Measures
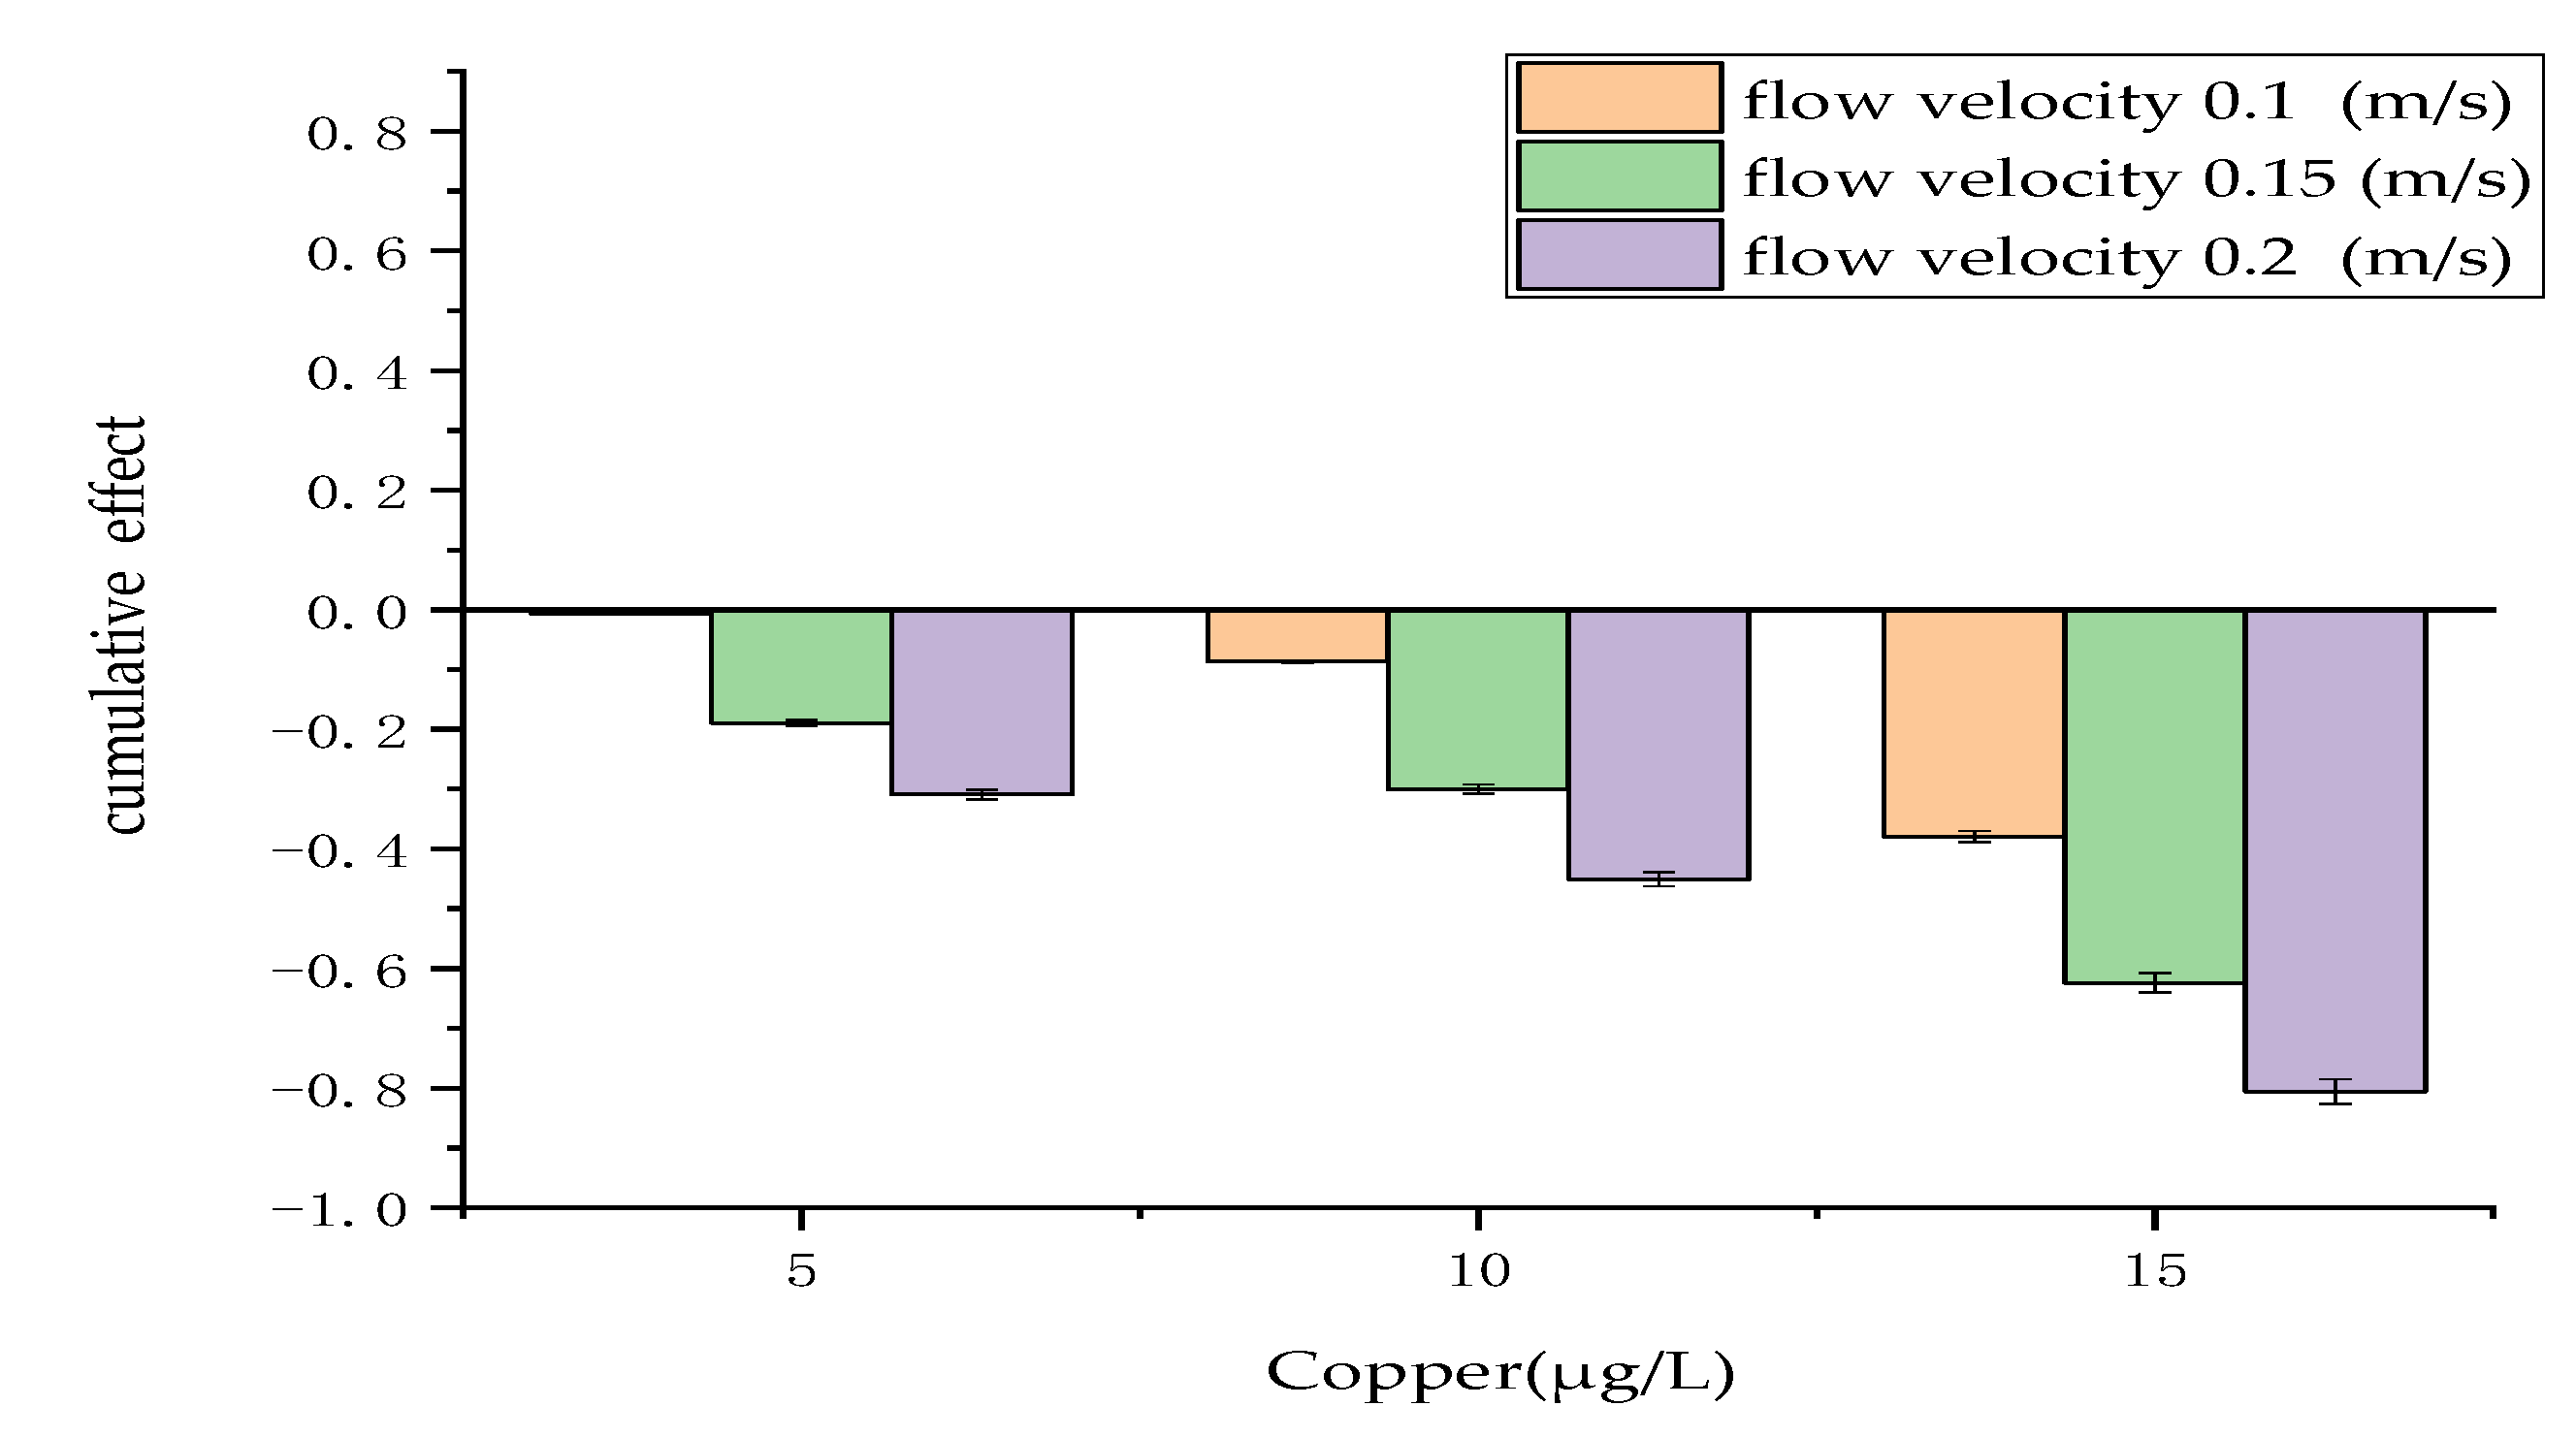
Figure 2 shows the cumulative effect of the combination of physical and chemical measures, where flow velocity represents the physical factor and copper represents the chemical factor. The results revealed that the cumulative effect of the combination of physical and chemical measures has an antagonistic effect on the regulation of algae growth. The results also showed that the antagonistic effect between the two measures increased with the flow velocity, indicating that the cumulative effect was not constant but influenced both flow velocity and copper concentration.
As shown in Figure 2, the combination of 0.2 m/s flow velocity and 15 μg/L copper had the strongest antagonistic effect, with a cumulative effect as high as 52%. In contrast, the combination of 0.1 m/s flow velocity and 5 μg/L copper had the weakest antagonistic effect; the cumulative effect was only 9%.
3.2. Cumulative Effect of Physical and Biological Measures
Figure 3 shows the cumulative effect of the combination of different flow velocity levels and different propionamide concentrations on the Microcystis aeruginosa growth, where flow velocity represents the physical factor and propionamide represents the biological factor. The results revealed that the cumulative effect of the combination of physical and biological measures had an antagonistic effect on the regulation of algae growth and that the antagonistic effect between the two measures increased with flow velocity. This indicated that the cumulative effect was not constant but influenced both flow velocity and copper concentration. As shown in Figure 3, the combination of 0.2 m/s flow velocity and 1.5 g/L propionamide had the strongest antagonistic effect, with a cumulative effect as high as 65%. In contrast, the combination of 0.1 m/s flow velocity and 0.5 g/L propionamide had the weakest antagonistic effect, with a cumulative effect of 24%.
3.3. Cumulative Effect of Chemical and Biological Measures
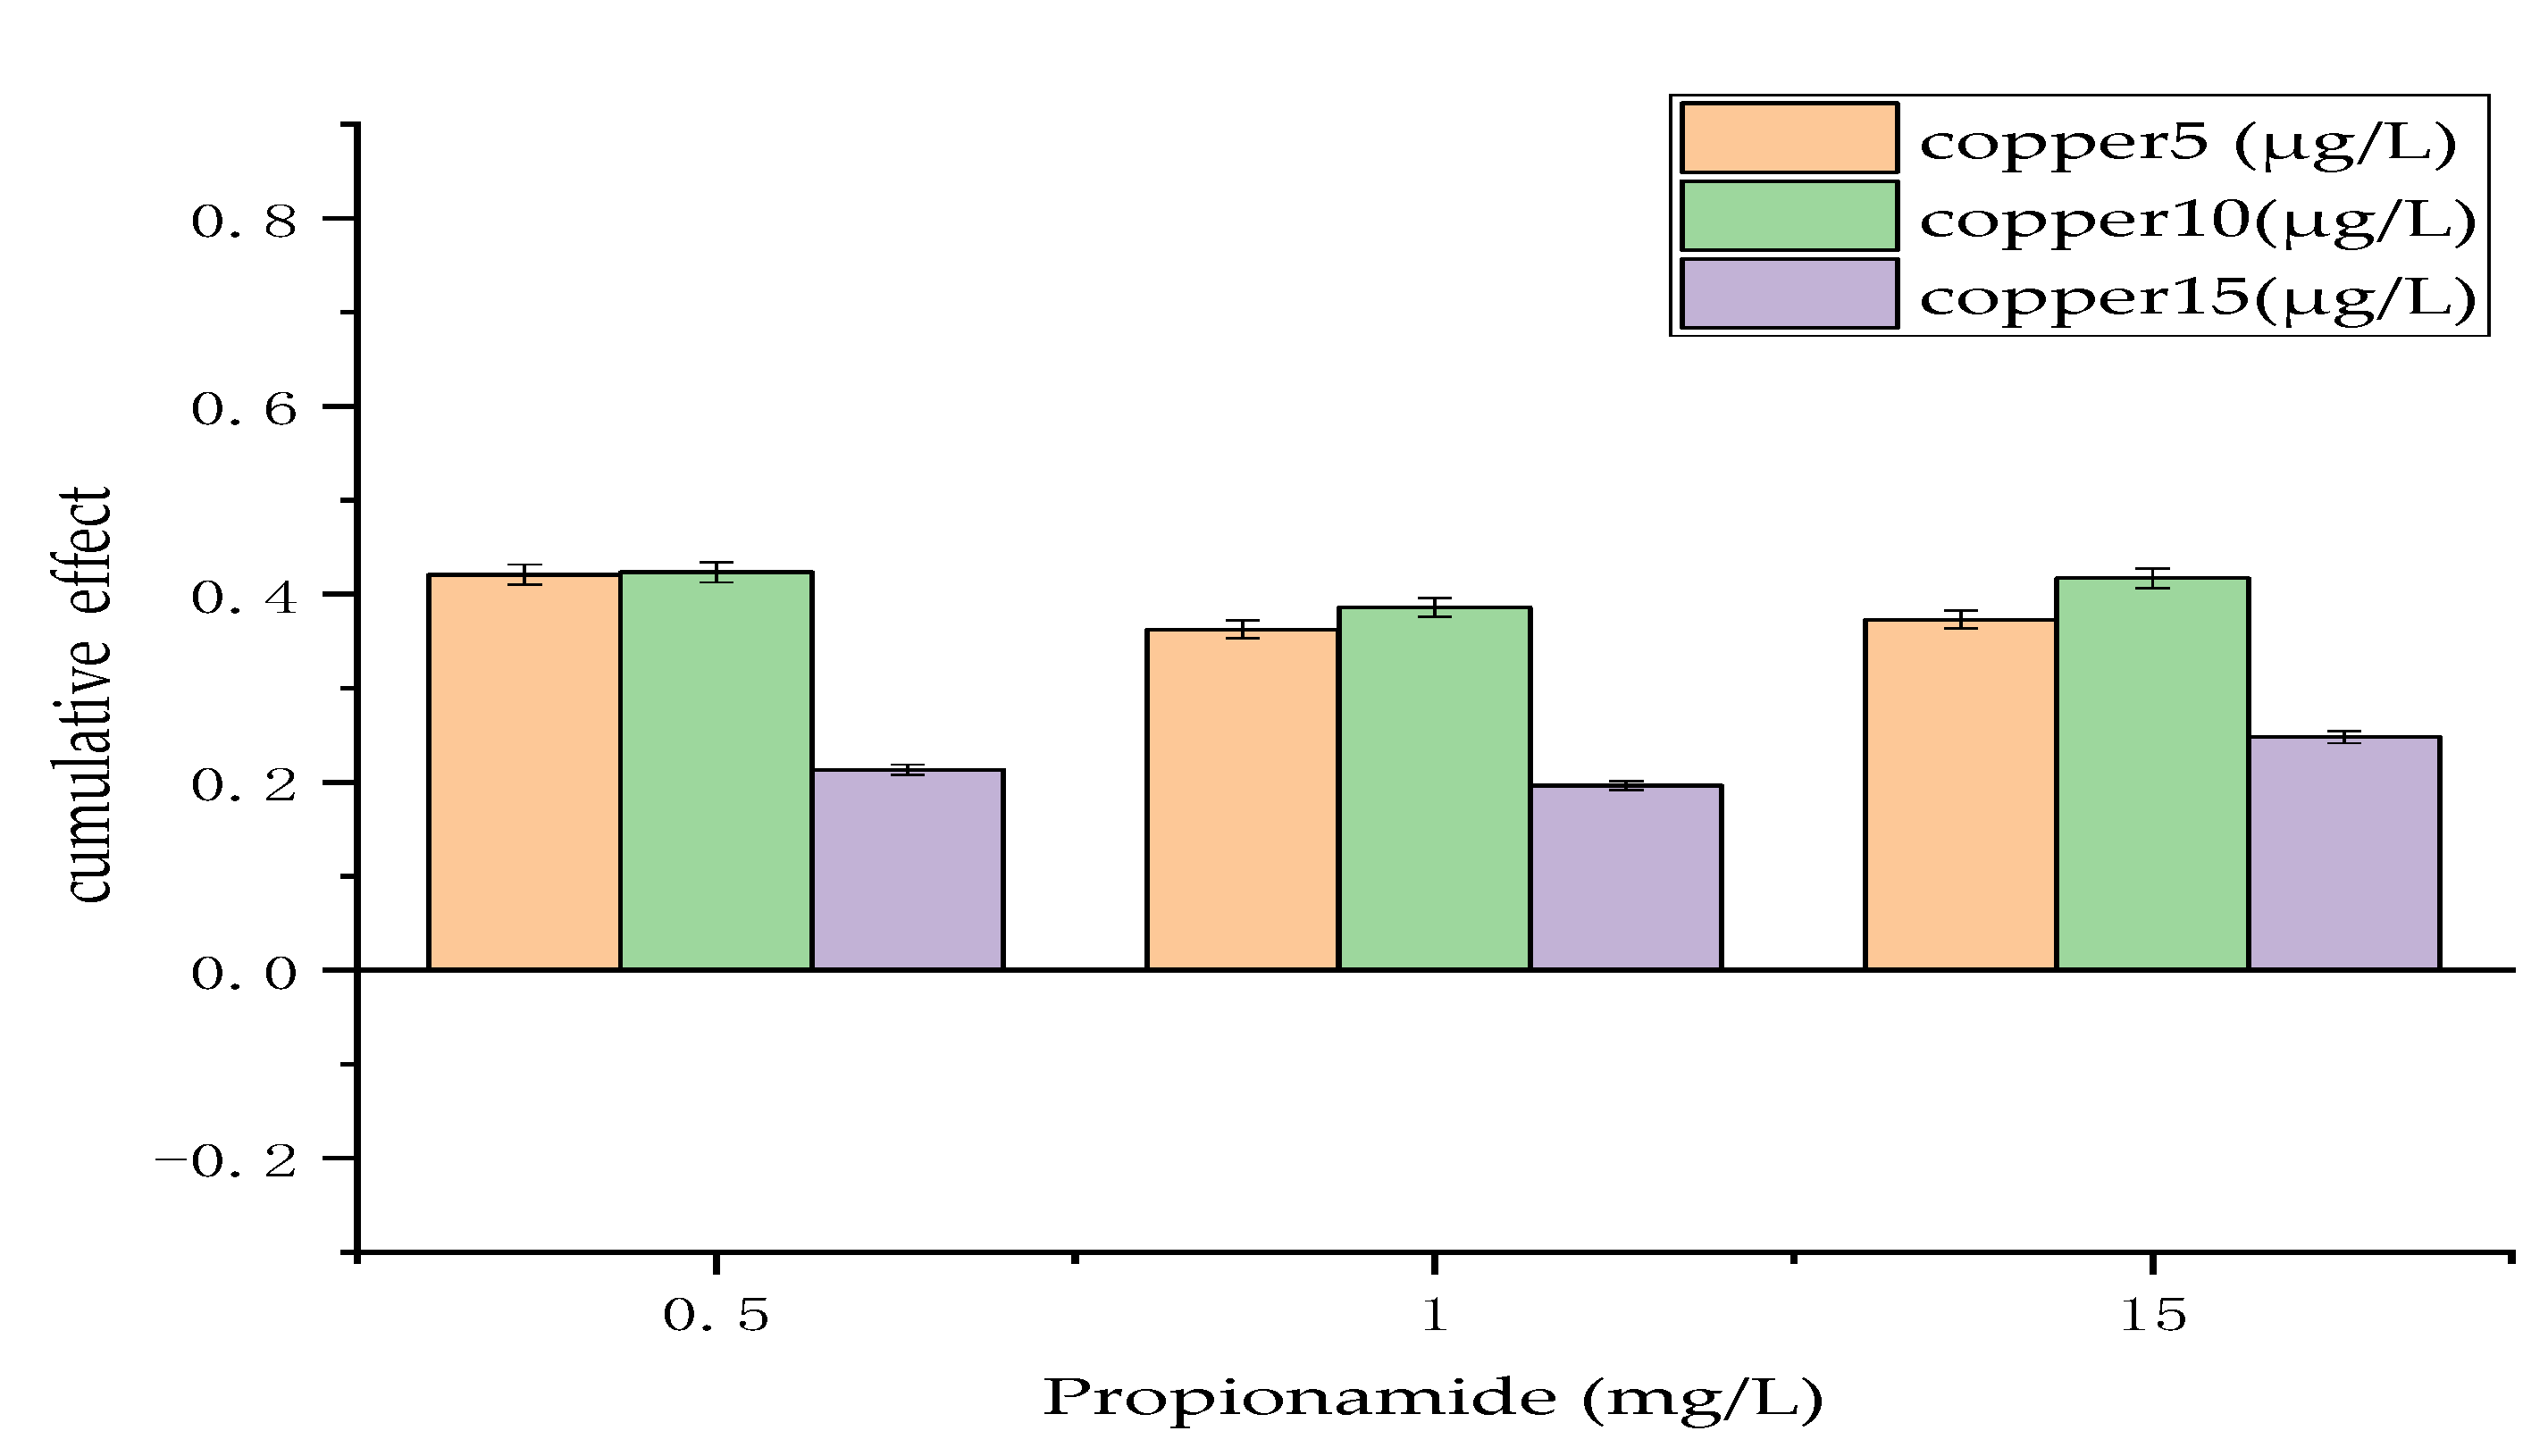
Figure 4 displays the cumulative effect of the combination of different concentrations of copper and different concentrations of propionamide on the growth of Microcystis aeruginosa, where copper represents the chemical factor and propionamide represents the biological factor. The results revealed that the cumulative effect of the combination of chemical and biological measures had a synergistic effect on the regulation of algae growth and that the synergistic effect between the two measures changed little with the increase in propionamide. However, the synergistic effect between the two measures increased gradually and then decreased rapidly with the increase in copper concentration. As shown in Figure 4, the combination of 0.5 g/L propionamide and 10 μg/L copper had the strongest antagonistic effect, with a cumulative effect as high as 24%. In contrast, the combination of 1 g/L propionamide and 15 μg/L copper had the weakest antagonistic effect, with a cumulative effect of 8%.
3.4. Cumulative Effect of Physical, Chemical and Biological Measures
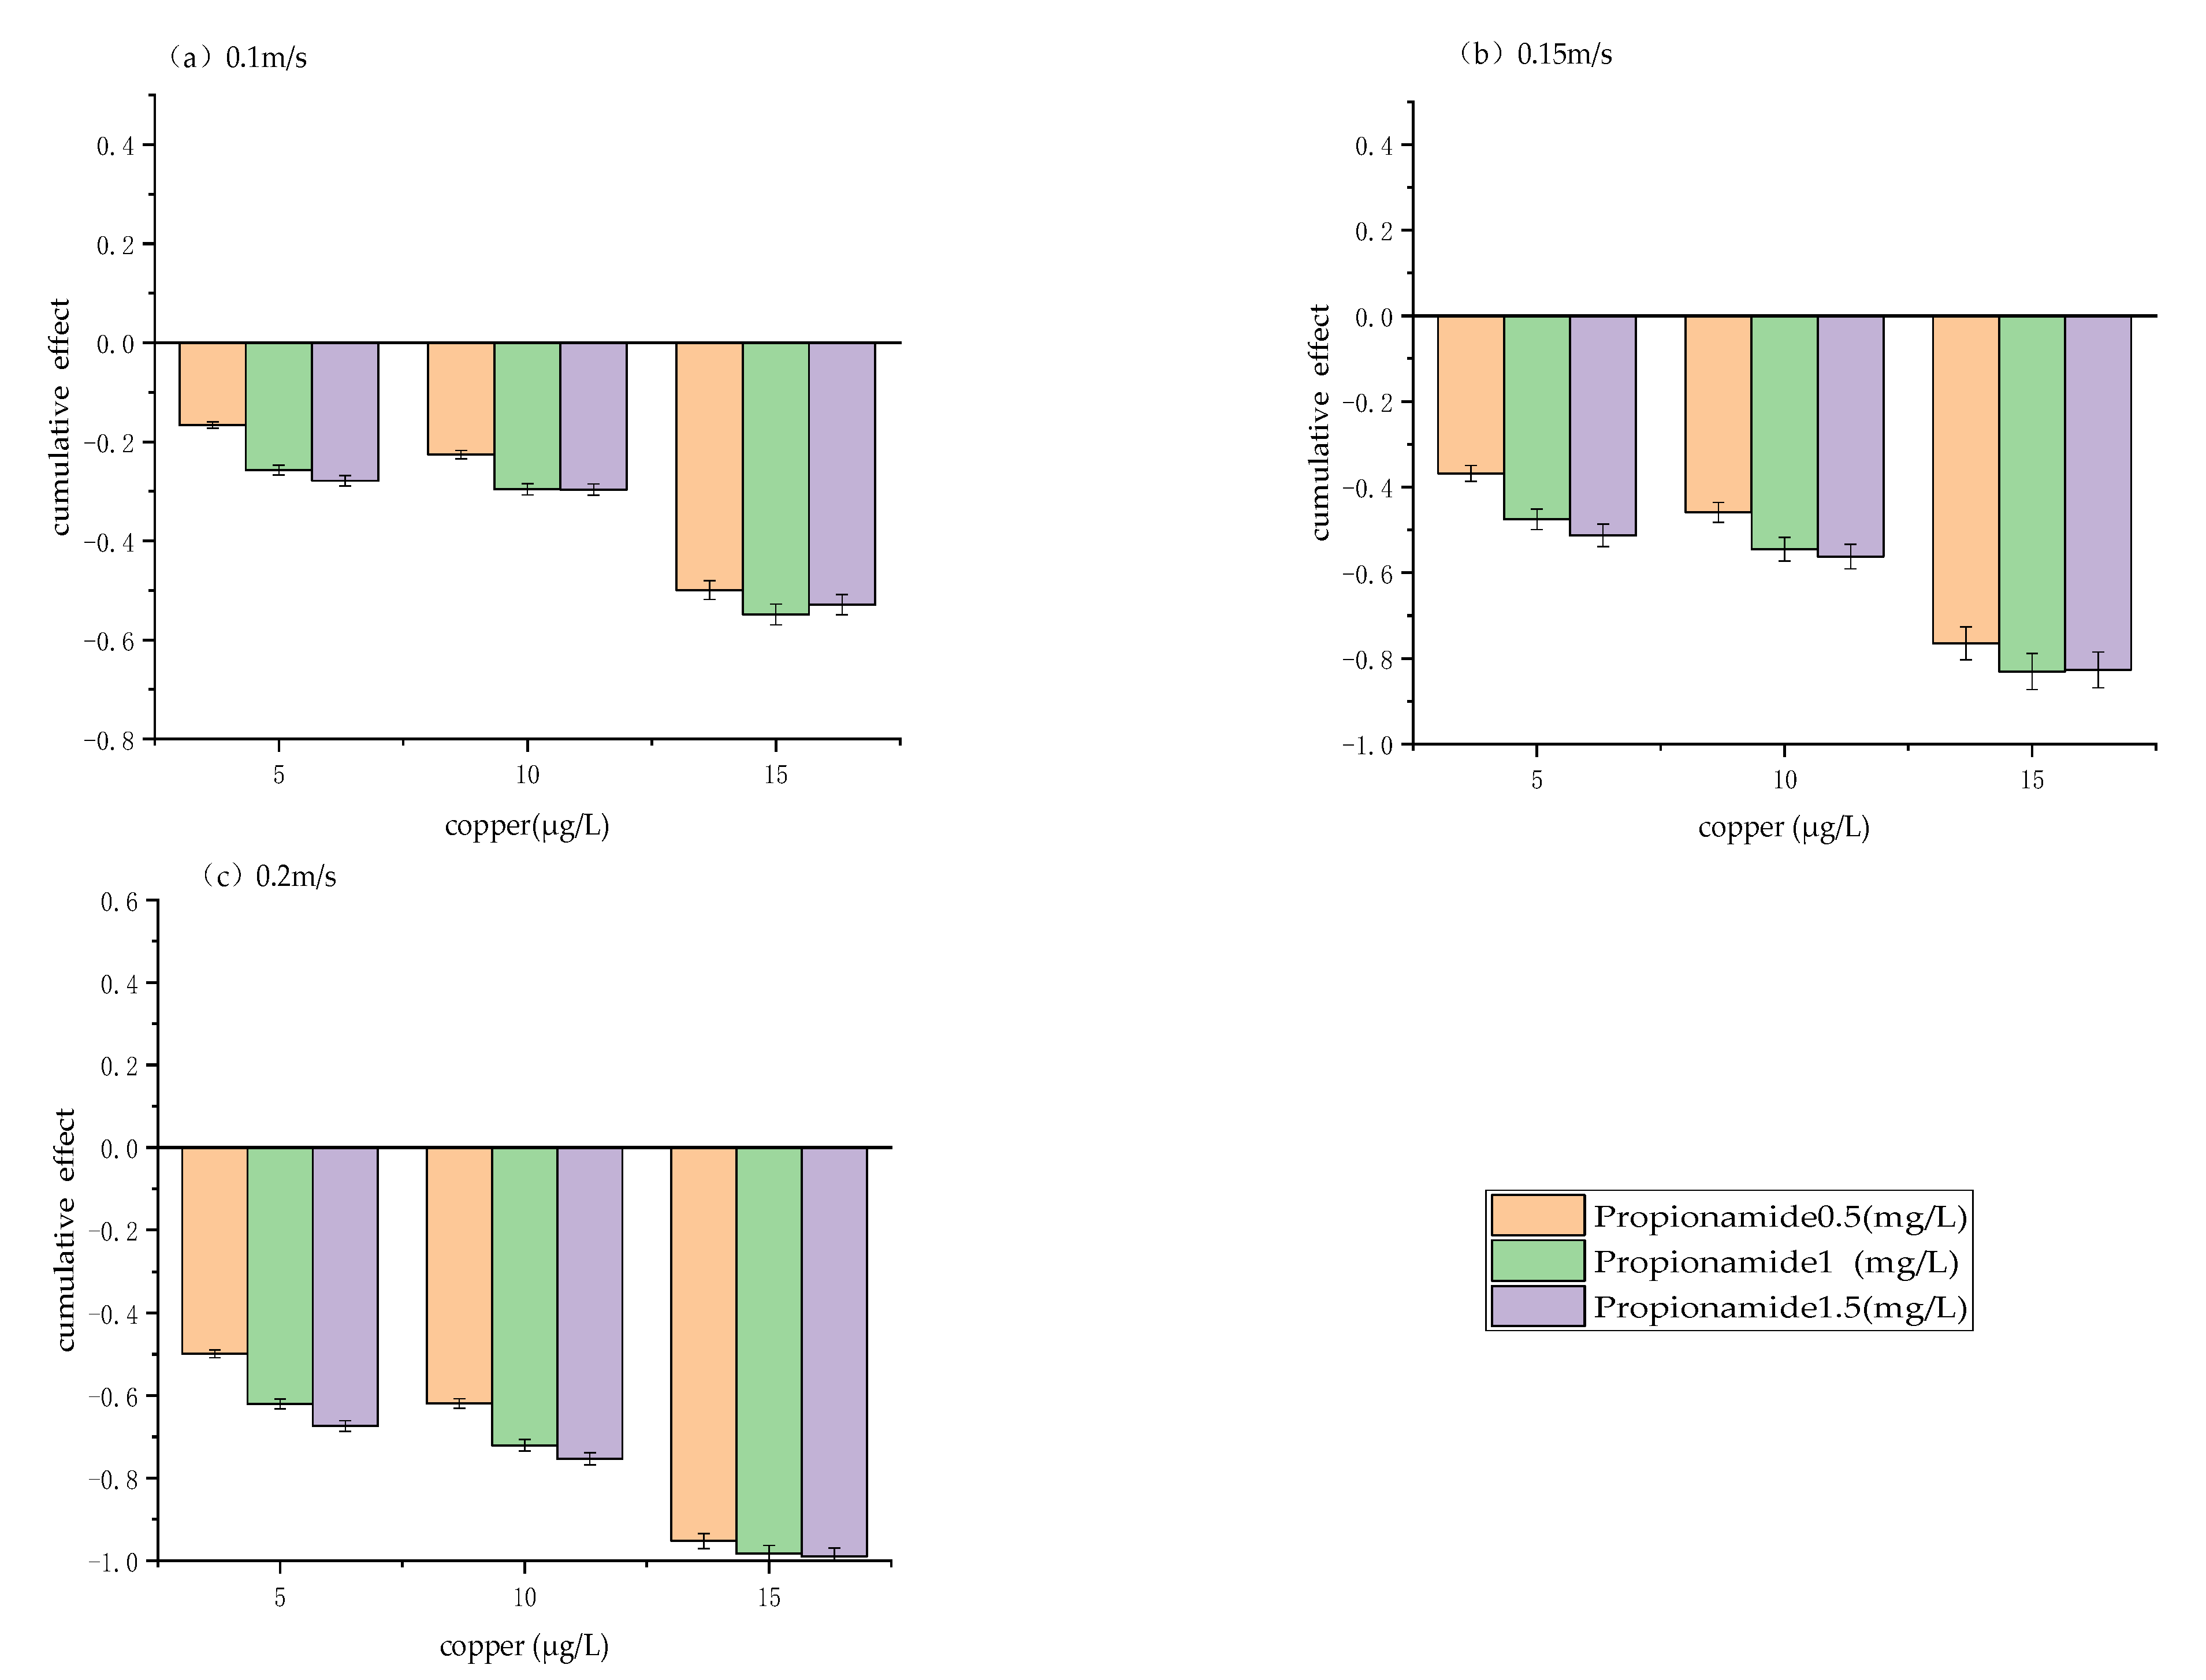
Figure 5 shows the cumulative effects of physical, chemical, and biological measures. The results revealed that the cumulative effect of the combination of physical, chemical, and biological measures had an antagonistic effect on the regulation of algae growth. The antagonistic effect of the three measures increased gradually with flow velocity increase. As shown in Figure 5, the combination of 0.2 m/s flow velocity, 1.5 g/L propionamide, and 15 μg/L copper had the strongest antagonistic effect, with a cumulative effect as high as 98%. In contrast, the combination of 0.1 m/s flow velocity, 0.5 g/L propionamide, and 5 μg/L copper had the weakest antagonistic effect, with a cumulative effect of 22%.
4. Discussion
4.1. Variation in Cumulative Effect Rate under Different Scenarios
In the present research, we studied the cumulative effects of discrete changes in physical, chemical, and biological measures at different levels on algal growth. In addition, we analyzed the cumulative effect rates of continuous changes in each factor at different levels on algal growth. This provided a more detailed understanding of the cumulative effect of these measures on algal growth. We used the RSM to establish a second-order polynomial model to predict the cumulative effect rate of continuous changes in physical, chemical, and biological measures at different levels on algal growth. The experimental data obtained from the BBD design were fitted with the second-order polynomial model. To enhance the accuracy of the prediction, the models were adjusted to match the data. Accordingly, the cumulative effect rate response was computed as the following:
where DCR represents cumulative effect rate, and A, B, and C represent velocity, propionamide, and copper, respectively.
Table 2 shows results from the analysis of variance (ANOVA) of the model for the cumulative effect rate. The F test was used to evaluate the significance of the models. Coefficient estimation with confidence levels above 95% was accepted [50]. The F-value was 90.12 and p-value was less than 0.05, indicating that the model is statistically significant. In addition, the p-value of A, B, C, AB, BC, A2, B2, and C2 were less than 0.05, suggesting that the model term is significant.
Table 3 shows the model statistics of the developed model. Coefficient of determination (R2), adjusted R2, and standard deviation (Std. Dev) were used for assessing the developed model’s competence [51]. In this table, R2 for the model was 0.99, and the adjusted coefficient of determination was 0.98. The standard deviation for the model was also found to be 0.02. Larger R2 values and smaller standard deviations indicate that the polynomial model’s accuracy and general availability were adequate [52,53]. “Adeq Precision” measures the signal-to-noise ratio. A ratio larger than 4 is desirable. The ratio of 33.76 was greater than 4 and indicated an adequate signal.
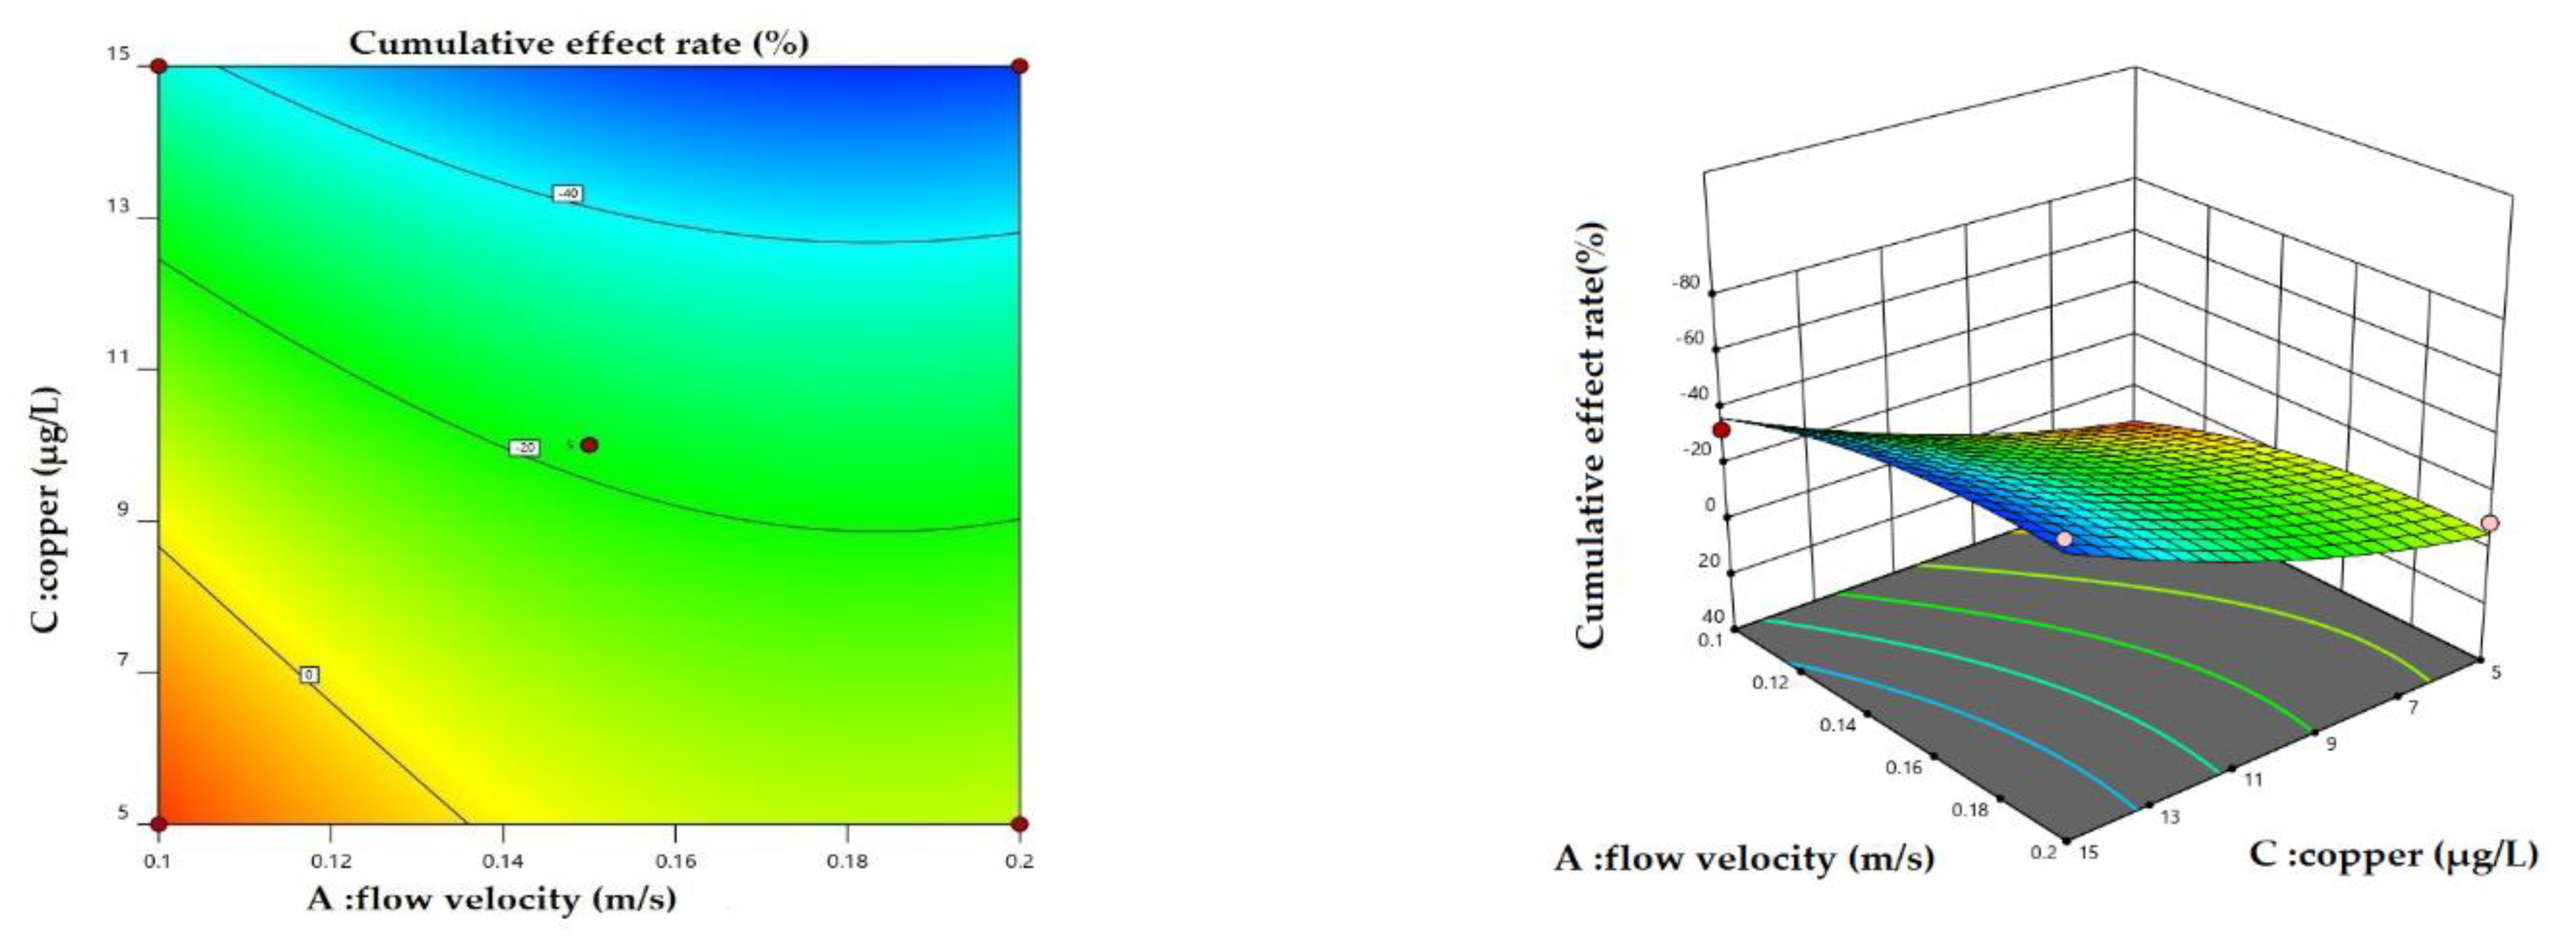
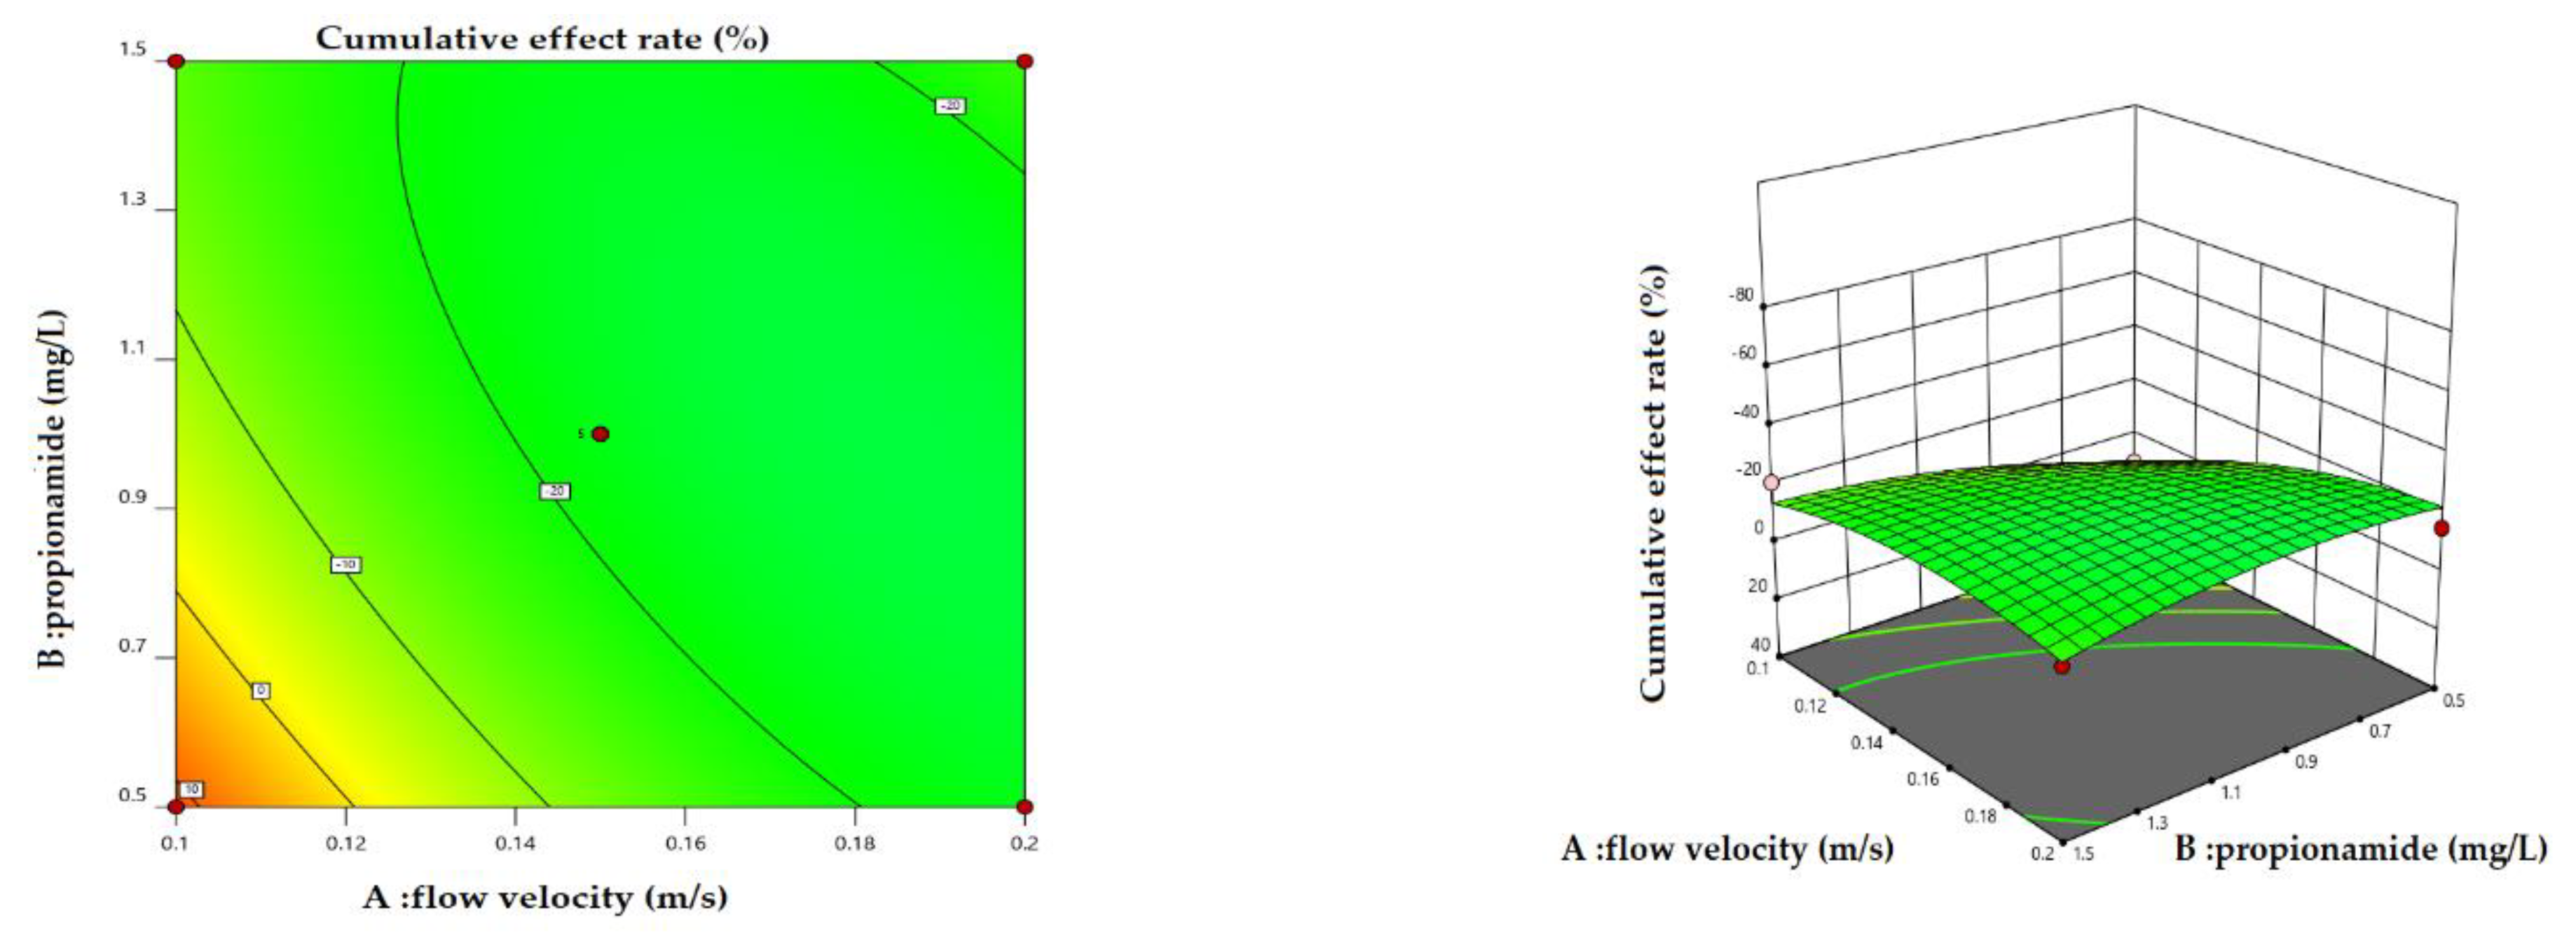
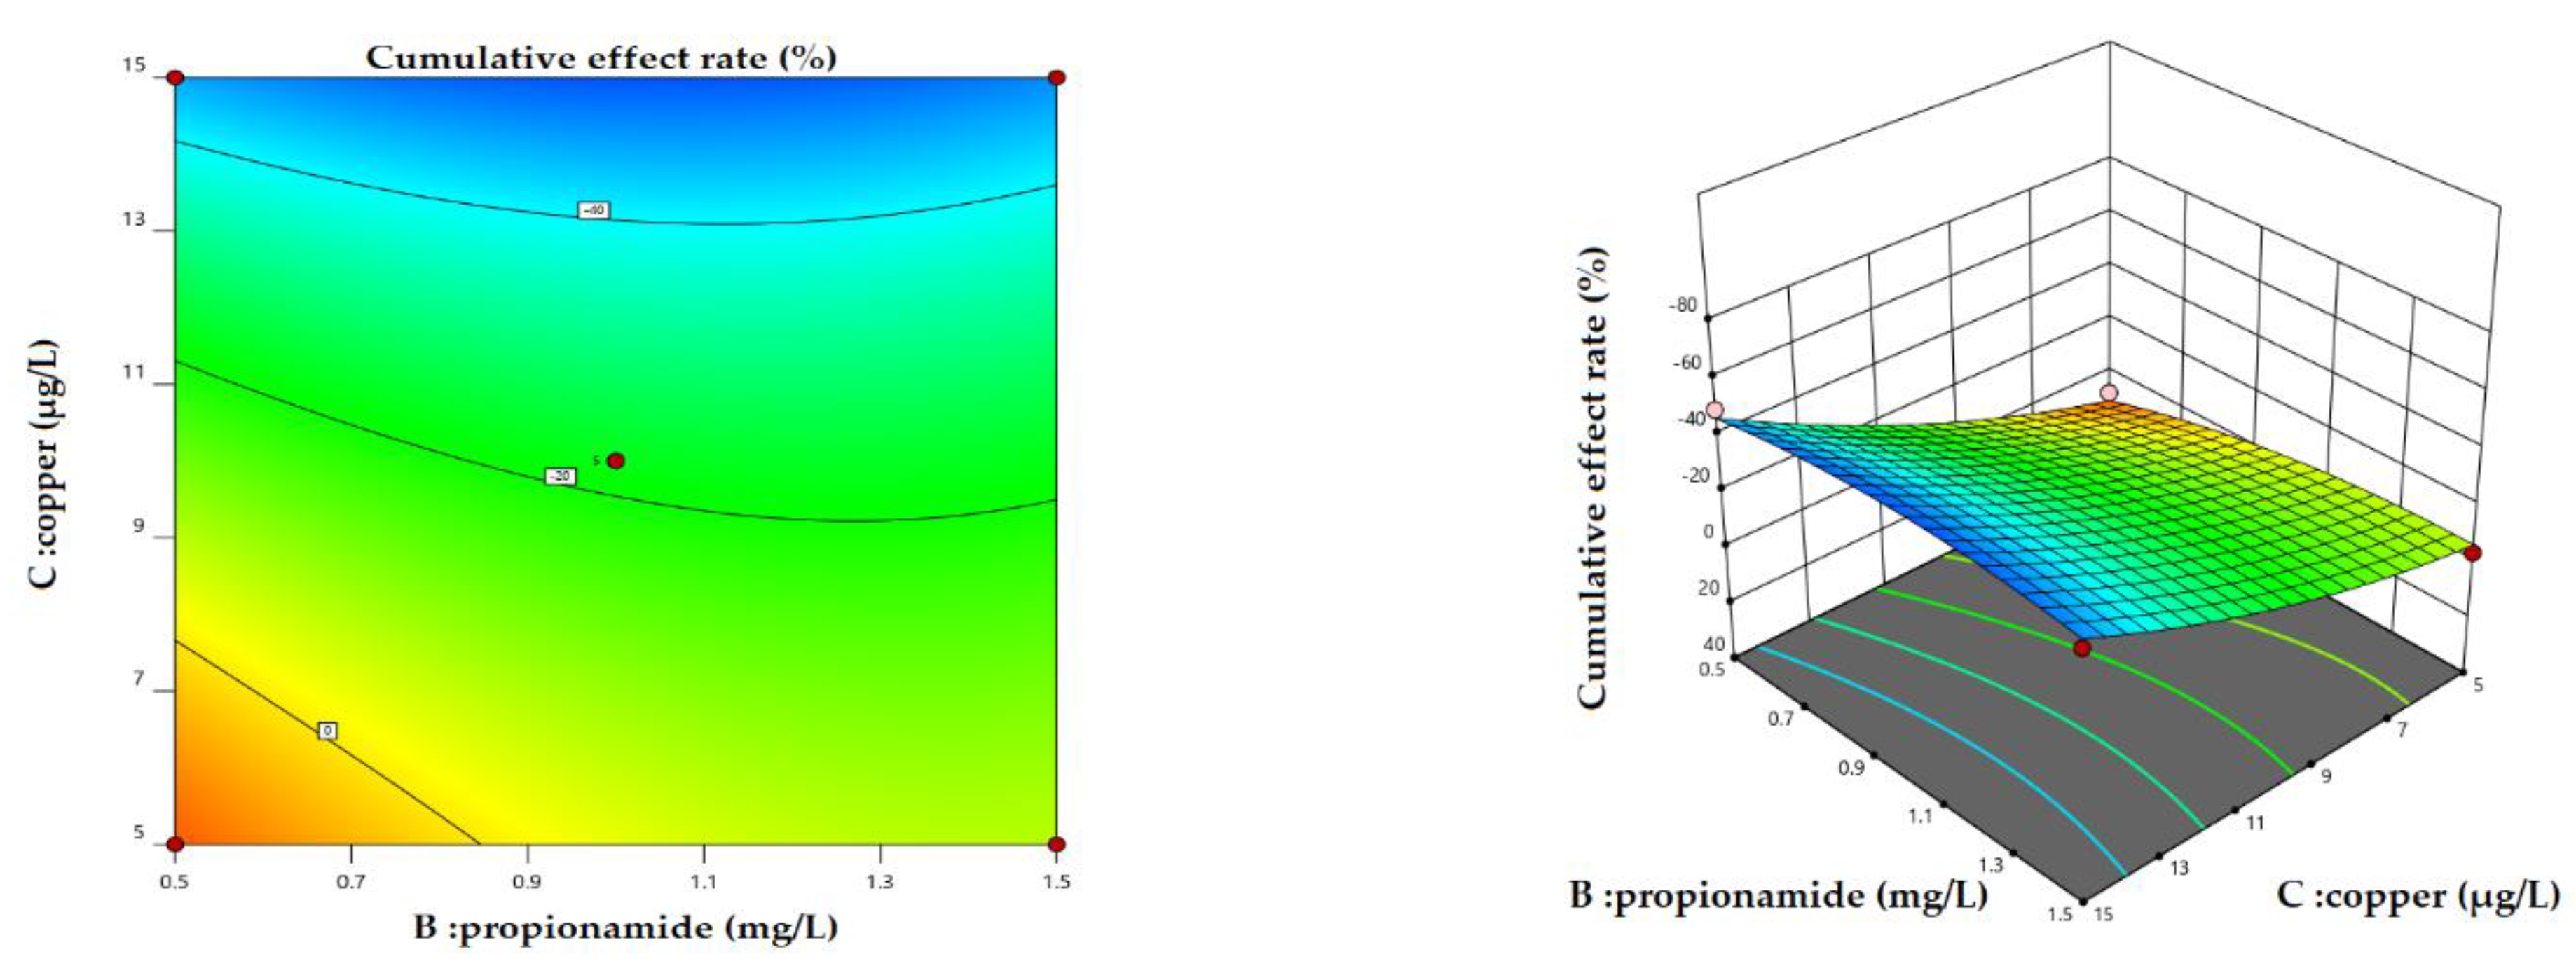
To analyze the cumulative effect rate of continuous changes in physical (flow velocity), chemical (copper), and biological (propionamide) measures at different levels, on the algal growth, two-dimensional (2D) contour plots, and three-dimensional (3D) surface plots were applied (Figure 6, Figure 7 and Figure 8). The red spots in the 3D and 2D plots are the actual values of the experimental results. In the present study, we analyzed the following scenarios.
Scenario 1: Variation in the cumulative effect rate with simultaneous changes in flow velocity and copper under different propionamide concentrations. The results showed that cumulative effect rate variation with simultaneous changes in flow velocity and copper had similar trends under different propionamide concentrations. Figure 6 shows the variation in the cumulative effect rate with simultaneous changes in flow velocity and copper under high concentrations of propionamide. As can be seen from the 3D surface plots (flow velocity and copper) in Figure 6, the apparent curved arches reveal the importance of simultaneous changes. In general, the cumulative effect rate gradually decreases with increasing copper and flow velocity and then increases again.
Scenario 2: Variation in the magnitude of the cumulative effect with simultaneous changes in flow rate and propionamide at different copper concentrations. The results indicated that the variation in the cumulative effect rate with simultaneous changes in flow velocity and propionamide had similar trends under different copper concentrations. Therefore, we analyzed the cumulative effect rate of simultaneous changes in flow velocity and propionamide under the medium concentration of copper. Figure 7 shows the variation in the cumulative effect rate with simultaneous changes in flow velocity and propionamide under the medium concentration of copper. As can be seen from the 3D surface plots (flow rate and propionamide) in Figure 7, the apparent curved arches reveal the importance of simultaneous changes. With flow velocity and propionamide increases, the cumulative effect rate first decreases and then increases.
Scenario 3: Variation in the magnitude of the cumulative effect with simultaneous changes in copper and propionamide at different flow velocities. The results showed that the variation in cumulative effect rate had similar trends with the simultaneous changes in copper and propionamide at different flow velocities. Therefore, we analyzed the cumulative effect rate of simultaneous changes in copper and propionamide under a high level of flow velocity. Figure 8 shows the variation in the cumulative effect rate with simultaneous changes in propionamide and copper under a high level of flow velocity. From the 3D surface plots (flow rate and propionamide) in Figure 8, the pronounced arcuate arch reveals the importance of simultaneous changes. In general, with the increase in propionamide and copper, the cumulative effect rate first decreased and then increased rapidly.
4.2. Comparison with Previous Results or Theories
Management measures based on physical factors can control harmful cyanobacterial blooms. Li et al. [15] showed that the average concentrations of Chl-a in a still water region were from 20.3–37.5% larger than that in their corresponding flowing region during the field experiment. The inhibitory effect of physical measures on algal growth is also affected by chemical and biological measures. Hill et al. [54] demonstrated that chemical and physical measures could regulate algal biomass by observing that cadmium and water movement were related to algal biomass. In the present study, flow velocity and copper inhibited algal growth. This was consistent with the results of Sabat et al. [35], which examined the effects of flow velocity and copper on algal growth; it was shown that the interaction between copper and current can inhibit algal growth. In addition, the combination of flow velocity and copper had an antagonistic effect on inhibiting algal growth. On the one hand, this may be because the flow velocity can change the morphology of the cells and affect the copper uptake by the cells [35]. The absorption of metal ions can be divided into two steps: first, binding to the binding site of the cell membrane, and then entering the cell through the ion channel of the cell membrane [46]. Since the flow velocity changes the morphology of the cells and affects the surface area of the cell membrane, it may affect the absorption of metal ions, resulting in antagonism. Some researchers found that excessive shear stress can change cell morphology [9,55]. On the other hand, flow velocity may stimulate algae to release complexing substances, such as copper-complexed organic ligands, indicating that flow velocity could mitigate the toxic effects of copper, and in environments where water flows, the effect of applying chemical agents can be compromised. Likewise, the combination of flow rate and propionamide was antagonistic in regulating the cumulative effect of algae. As a macromolecule, propionamide needs to consume energy when absorbed by cells. This may also occur because the flow rate changes the morphology of the cells and affects the surface area of the cell membrane, reducing the rate of the uptake of propionamide.
A combination of chemical and biological measures is often used to control the proliferation of harmful algae. Previous studies have found that allelochemicals, as critical biological measures, can affect photosynthesis, change membrane permeability, and generate oxidative stress, resulting in the death of target algal cells [27]. In addition, excess trace elements can also inhibit photosynthesis and generate reactive oxygen, resulting in the death of target algal cells [12]. The combination of chemical and biological measures could have a synergistic effect on inhibiting algal growth since they have similar algae removal mechanisms. Our findings suggest that the cumulative effect of the combination of chemical and biological measures on algal growth is synergistic. This was consistent with the results of Wang et al. [36], which indicated that the inhibition degree of Zn (II) and ferulic acid (FA) on algae is less than that of Zn-MOF-FA at corresponding doses. On the one hand, propionamide can reduce the maximum photochemical efficiency (Fv/Fm) of photosystem II [31]. On the other hand, copper enters cells, leading to magnesium replacement in chlorophyll heme, affecting photosynthesis [56].
The inhibitory effect of physical measures on algal growth is also influenced by chemical and biological measures. In the present study, the cumulative effect of the combination of physical, chemical, and biological measures on algal growth was antagonistic. Considering the flow rate, the cumulative effect of the combination of chemical and biological measures switched from synergy to antagonism on algal growth. It may be that the flow rate changes the morphology of cells and affects the surface area of the cell membrane, thus, affecting the uptake efficiency of copper and propionamide. It was also found that the antagonism increased with the flow velocity. One possible reason is that the flow velocity was too high, and the cell membrane was damaged, leading directly to cell death, ignoring the role of copper and propionamide [9].
4.3. Limitations of This Study
Our results indicated that the cumulative effect of chemical and biological measures switched from synergistic to antagonistic when including physical measures. In practice, it is important to consider water flow conditions when using copper and allelochemicals to remove algae. It is economically costly to manage harmful algal blooms. We can benefit from controlling harmful algal blooms through rational plans for measures to inhibit algal growth especially through the use of physical measures. However, some limitations should be considered for future studies. Our research chose to use flow velocity, copper sulfate, propionamide to represent physical, chemical, and biological measures. Ideally, when considering variations in all representative factors, we can accurately analyze the cumulative effect of these measures on algal growth inhibition. Meanwhile, when considering variations in multiple factors of a single measure, they can interact with each other complicating the situation. In addition, it is difficult for us to investigate all factors’ effects due to equipment limitations. We focused on the relationship between different measures. It is possible to select representative factors to reduce the interaction between various factors of a single measure. When selecting other factors, the conclusions may change since the mechanisms of algal growth inhibition are different for various factors. Additionally, our research focused on the cumulative effect of the combination of these measures on inhibiting algal growth on a short time scale. The continuous effect of these measures could weaken over time. Therefore, future research should focus on longer time scales. In addition, our study focused on conditions under which temperature and nutrients were maintained at constant levels over time. Temperature and nutritional conditions in many places change with climate change [57,58]. In natural ecosystems, under different temperature and nutrient conditions, the growth rates of algae might differ, and the cumulative effect on algal growth would be affected by temperature and nutrients. These conditions should also be considered in future research. Additionally, we discussed the mechanism causing the experimental results, referring to previous studies on the mechanism of single-factor inhibition of algal growth. It is necessary to verify that these were indeed the mechanisms causing the experimental results. There are limitations in extrapolating laboratory results to natural ecosystems, but we can still draw some suggestions from our findings. For one thing, to accurately understand the impact of combination strategies on algae inhibition in natural ecosystems, complex interactions among environmental measures on algae inhibition should not be underestimated. Furthermore, the configuration of this coupling strategy, the time-varying behavior after implementation, and changes in the surrounding environmental conditions should be the main research fields in the future.
5. Conclusions
The present study experimentally investigated the cumulative effect of the combined utilization of physical, chemical, and biological measures on algal growth inhibition. The experimental results showed that the combined utilization of physical and chemical measures had an antagonistic effect on algae growth inhibition. Similarly, the combined utilization of physical and biological measures also had an antagonistic effect on algae growth inhibition. By contrast, the combined utilization of chemical and biological measures had a synergistic effect on algae growth inhibition. Additionally, the combined utilization of physical, chemical, and biological measures had an antagonistic effect on algae growth inhibition, indicating that the cumulative effect of chemical and biological measures switched from synergistic to antagonistic, when including physical measures. Therefore, in the process of controlling harmful algal bloom, it is necessary to consider the cumulative effects of concurrent alterations of physical, chemical, and biological measures on algal growth inhibition, especially physical measures.
Author Contributions
Conceptualization, H.L. and E.Z.; methodology, H.L. and E.Z.; investigation, H.L. and E.Z.; data curation, H.L. and J.W.; formal analysis, H.L. and Y.S.; writing—original draft preparation, H.L. and E.Z.; writing—review and editing, H.L. and E.Z.; visualization, H.L., L.Y., B.Y., Y.T. and T.G. All authors have read and agreed to the published version of the manuscript.
Funding
We thank the National Natural Science Foundation of China (52079007) for their financial support.
Institutional Review Board Statement
Not applicable.
Informed Consent Statement
Not applicable.
Data Availability Statement
Data are available on-demand from the corresponding author.
Acknowledgments
We would like to extend special thanks to the editor and the anonymous reviewers for their valuable comments in significantly improving this paper’s quality.
Conflicts of Interest
The authors declare no conflict of interest.
References
- Wang, H.; Zhang, Z.; Liang, D.; Du, H.; Pang, Y.; Hu, K.; Wang, J. Separation of wind’s influence on harmful cyanobacterial blooms. Water Res. 2016, 98, 280–292. [Google Scholar] [CrossRef] [PubMed]
- Van de Waal, D.B.; Verspagen, J.M.; Lurling, M.; Van Donk, E.; Visser, P.M.; Huisman, J. The ecological stoichiometry of toxins produced by harmful cyanobacteria: An experimental test of the carbon-nutrient balance hypothesis. Ecol. Lett. 2009, 12, 1326–1335. [Google Scholar] [CrossRef] [PubMed]
- Amorim, C.A.; Dantas, E.W.; Moura, A.D.N. Modeling cyanobacterial blooms in tropical reservoirs: The role of physicochemical variables and trophic interactions. Sci. Total Environ. 2020, 744, 140659. [Google Scholar] [CrossRef] [PubMed]
- Freeman, E.C.; Creed, I.F.; Jones, B.; Bergstrom, A.K. Global changes may be promoting a rise in select cyanobacteria in nutrient-poor northern lakes. Glob. Change Biol. 2020, 26, 4966–4987. [Google Scholar] [CrossRef]
- Jones, M.R.; Pinto, E.; Torres, M.A.; Dörr, F.; Mazur-Marzec, H.; Szubert, K.; Tartaglione, L.; Dell’Aversano, C.; Miles, C.O.; Beach, D.G. CyanoMetDB, a comprehensive public database of secondary metabolites from cyanobacteria. Water Res. 2021, 196, 117017. [Google Scholar] [CrossRef]
- Ji, X.; Verspagen, J.M.H.; Stomp, M.; Huisman, J. Competition between cyanobacteria and green algae at low versus elevated CO2: Who will win, and why? J. Exp. Bot. 2017, 68, 3815–3828. [Google Scholar] [CrossRef] [Green Version]
- Gu, P.; Sun, Y.; Xue, L.; Zhu, L.; Shan, J.; Li, X.; Ni, Z.; Zhang, W.; Zheng, Z. Predicting cyanobacterial decomposition response to multiple environmental factors through Central Composite Design method. Environ. Technol. Inno. 2021, 22, 101515. [Google Scholar] [CrossRef]
- Pearson, L.; Mihali, T.; Moffitt, M.; Kellmann, R.; Neilan, B. On the chemistry, toxicology and genetics of the cyanobacterial toxins, microcystin, nodularin, saxitoxin and cylindrospermopsin. Mar. Drugs 2010, 8, 1650–1680. [Google Scholar] [CrossRef] [Green Version]
- Kang, L.; He, Y.; Dai, L.; He, Q.; Ai, H.; Yang, G.; Liu, M.; Jiang, W.; Li, H. Interactions between suspended particulate matter and algal cells contributed to the reconstruction of phytoplankton communities in turbulent waters. Water Res. 2019, 149, 251–262. [Google Scholar] [CrossRef]
- Zhao, K.; Wang, L.; You, Q.; Pan, Y.; Liu, T.; Zhou, Y.; Zhang, J.; Pang, W.; Wang, Q. Influence of cyanobacterial blooms and environmental variation on zooplankton and eukaryotic phytoplankton in a large, shallow, eutrophic lake in China. Sci. Total Environ. 2021, 773, 145421. [Google Scholar] [CrossRef]
- Park, J.; Son, Y.; Lee, W.H. Variation of efficiencies and limits of ultrasonication for practical algal bloom control in fields. Ultrason. Sonochem. 2019, 55, 8–17. [Google Scholar] [CrossRef] [PubMed]
- Jančula, D.; Maršálek, B. Critical review of actually available chemical compounds for prevention and management of cyanobacterial blooms. Chemosphere 2011, 85, 1415–1422. [Google Scholar] [CrossRef] [PubMed]
- Li, H.; Zhang, E. A coupled sampling design for parameter estimation in microalgae growth experiment: Maximizing the benefits of uniform and non-uniform sampling. Water 2021, 13, 2996. [Google Scholar] [CrossRef]
- Park, K.Y.; Kweon, J.; Chantrasakdakul, P.; Lee, K.; Cha, H.Y. Anaerobic digestion of microalgal biomass with ultrasonic disintegration. Int. Biodeter. Biodegr. 2013, 85, 598–602. [Google Scholar] [CrossRef]
- Li, F.; Zhang, H.; Zhu, Y.; Xiao, Y.; Chen, L. Effect of flow velocity on phytoplankton biomass and composition in a freshwater lake. Sci. Total Environ. 2013, 447, 64–71. [Google Scholar] [CrossRef]
- Batista, M.D.; Anhê, A.C.B.M.; de Souza Inácio Gonçalves, J.C. Use of hydrodynamic cavitation for Algae Removal: Effect on the inactivation of microalgae belonging to genus Scenedesmus. Water Air Soil Pollut. 2017, 228, 443. [Google Scholar] [CrossRef]
- Mitrovic, S.M.; Hardwick, L.; Dorani, F. Use of flow management to mitigate cyanobacterial blooms in the Lower Darling River, Australia. J. Plankton Res. 2010, 33, 229–241. [Google Scholar] [CrossRef]
- Wang, Z.; Li, D.; Qin, H.; Li, Y. An integrated method for removal of harmful cyanobacterial blooms in eutrophic lakes. Environ. Pollut. 2012, 160, 34–41. [Google Scholar] [CrossRef]
- Zuo, S.; Zhou, S.; Ye, L.; Ding, Y.; Jiang, X. Antialgal effects of five individual allelochemicals and their mixtures in low level pollution conditions. Environ. Sci. Pollut. R 2016, 23, 15703–15711. [Google Scholar] [CrossRef]
- Greenfield, D.I.; Duquette, A.; Goodson, A.; Keppler, C.J.; Williams, S.H.; Brock, L.M.; Stackley, K.D.; White, D.; Wilde, S.B. The effects of three chemical algaecides on cell numbers and toxin content of the cyanobacteria Microcystis aeruginosa and Anabaenopsis sp. J. Environ. Manag. 2014, 54, 1110–1120. [Google Scholar] [CrossRef]
- Jin, X.; Bi, L.; Lyu, T.; Chen, J.; Zhang, H.; Pan, G. Amphoteric starch-based bicomponent modified soil for mitigation of harmful algal blooms (HABs) with broad salinity tolerance: Flocculation, algal regrowth, and ecological safety. Water Res. 2019, 165, 115005. [Google Scholar] [CrossRef] [PubMed]
- Tan, K.; Huang, Z.; Ji, R.; Qiu, Y.; Wang, Z.; Liu, J. A review of allelopathy on microalgae. Microbiology 2019, 165, 587–592. [Google Scholar] [CrossRef] [PubMed]
- Zhou, X.; He, Y.; Li, H.; Wei, Y.; Zhao, L.; Yang, G.; Chen, X. Using flocculation and subsequent biomanipulation to control microcystis blooms: A laboratory study. Harmful Algae 2020, 99, 101917. [Google Scholar] [CrossRef] [PubMed]
- Kibuye, F.A.; Zamyadi, A.; Wert, E.C. A critical review on operation and performance of source water control strategies for cyanobacterial blooms: Part II-mechanical and biological control methods. Harmful Algae 2021, 109, 102119. [Google Scholar] [CrossRef]
- Bacellar Mendes, L.B.; Vermelho, A.B. Allelopathy as a potential strategy to improve microalgae cultivation. Biotechnol. Biofuels 2013, 6, 1–14. [Google Scholar] [CrossRef] [Green Version]
- Zhu, X.; Dao, G.; Tao, Y.; Zhan, X.; Hu, H. A review on control of harmful algal blooms by plant-derived allelochemicals. J. Hazard Mater. 2021, 401, 123403. [Google Scholar] [CrossRef]
- Li, B.; Yin, Y.; Kang, L.; Feng, L.; Liu, Y.; Du, Z.; Tian, Y.; Zhang, L. A review: Application of allelochemicals in water ecological restoration—algal inhibition. Chemosphere 2021, 267, 128869. [Google Scholar] [CrossRef]
- Wu, X.; Wu, H.; Ye, J.; Zhong, B. Study on the release routes of allelochemicals from Pistia stratiotes Linn., and its anti-cyanobacteria mechanisms on Microcystis aeruginosa. Environ. Sci. Pollut. R 2015, 22, 18994–19001. [Google Scholar] [CrossRef]
- Jiang, Z.; Xinyuan, Z. Treatment and utilization of wastewater in the Beijing Zoo by an aquatic macrophyte system. J. Ecol. Eng. 1998, 11, 101–110. [Google Scholar] [CrossRef]
- Liu, G.T.; Zhou, C.F.; Sun, L.F.; Zhu, W.W.; Jiang, H.; Wang, H.X.; An, S.Q. Effects of Eichhornia crassipes allelochemicals on the growth of two mono- and co-cultured algae Microcystis aeruginosa and Scenedesmus obliquus. Acta Sci. Circumst. 2011, 31, 2303–2311. (In Chinese) [Google Scholar]
- Wu, X.; Wu, H.; Wang, S.; Wang, Y.; Zhang, R.; Hu, X.; Ye, J. Effect of propionamide on the growth of Microcystis flos-aquae colonies and the underlying physiological mechanisms. Sci. Total Environ. 2018, 630, 526–535. [Google Scholar] [CrossRef] [PubMed]
- Jiang, H.; Rui, J.L.; Li, H.L.; Zhao, D.H.; Fu, J.J.; An, S.Q. Research on Algal bloom control for environment Engineering. Appl. Mech. Mater. 2013, 340, 971–974. [Google Scholar] [CrossRef]
- Furlan, E.; Torresan, S.; Critto, A.; Lovato, T.; Solidoro, C.; Lazzari, P.; Marcomini, A. Cumulative Impact Index for the Adriatic Sea: Accounting for interactions among climate and anthropogenic pressures. Sci. Total Environ. 2019, 670, 379–397. [Google Scholar] [CrossRef] [PubMed]
- Crain, C.M.; Halpern, B.S.; Beck, M.W.; Kappel, C.V. Understanding and managing human threats to the coastal marine environment. Ann. N. Y. Acad. Sci. 2009, 1162, 39–62. [Google Scholar] [CrossRef] [PubMed]
- Sabater, S.; Navarro, E.; Guasch, H. Effects of copper on algal communities at different current velocities. J. Appl. Phycol 2002, 14, 391–398. [Google Scholar] [CrossRef]
- Wang, X.; Huang, K.; Gao, J.; Szeto, Y.T.; Jiang, C.; Zhu, J.; Zhang, J.; Liu, J. Effects on photosynthetic and antioxidant systems of harmful cyanobacteria by nanocrystalline Zn-MOF-FA. Sci. Total Environ. 2021, 792, 148247. [Google Scholar] [CrossRef]
- Sha, J.; Xiong, H.; Li, C.; Lu, Z.; Zhang, J.; Zhong, H.; Zhang, W.; Yan, B. Harmful algal blooms and their eco-environmental indication. Chemosphere 2021, 274, 129912. [Google Scholar] [CrossRef]
- Crain, C.M.; Kroeker, K.; Halpern, B.S. Interactive and cumulative effects of multiple human stressors in marine systems. Ecol. Lett. 2008, 11, 1304–1315. [Google Scholar] [CrossRef]
- Ban, S.S.; Graham, N.A.; Connolly, S.R. Evidence for multiple stressor interactions and effects on coral reefs. Glob. Change Biol. 2014, 20, 681–697. [Google Scholar] [CrossRef]
- Orr, J.A.; Luijckx, P.; Arnoldi, J.F.; Jackson, A.L.; Piggott, J.J. Rapid evolution generates synergism between multiple stressors: Linking theory and an evolution experiment. Glob. Change Biol. 2022, 28, 1740–1752. [Google Scholar] [CrossRef]
- Boyd, P.W.; Collins, S.; Dupont, S.; Fabricius, K.; Gattuso, J.P.; Havenhand, J.; Hutchins, D.A.; Riebesell, U.; Rintoul, M.S.; Vichi, M. Experimental strategies to assess the biological ramifications of multiple drivers of global ocean change—A review. Glob. Change Biol. 2018, 24, 2239–2261. [Google Scholar] [CrossRef] [PubMed]
- Strain, E.M.; Thomson, R.J.; Micheli, F.; Mancuso, F.P.; Airoldi, L. Identifying the interacting roles of stressors in driving the global loss of canopy-forming to mat-forming algae in marine ecosystems. Glob. Change Biol. 2014, 20, 3300–3312. [Google Scholar] [CrossRef] [PubMed]
- Tsai, K.-P. Effects of two copper compounds on Microcystis aeruginosa cell density, membrane integrity, and microcystin release. Ecotoxicol. Environ. Safe 2015, 120, 428–435. [Google Scholar] [CrossRef] [PubMed]
- Anjum, M.F.; Tasadduq, I.; Al-Sultan, K. Response surface methodology: A neural network approach. Eur. J. Oper. Res. 1997, 101, 65–73. [Google Scholar] [CrossRef]
- Hu, Y.; Meng, F.L.; Hu, Y.Y.; Habibul, N.; Sheng, G.P. Concentration- and nutrient-dependent cellular responses of microalgae Chlorella pyrenoidosa to perfluorooctanoic acid. Water Res. 2020, 185, 116248. [Google Scholar] [CrossRef]
- Long, T.Y.; Wu, L.; Meng, G.H.; Guo, W.H. Numerical simulation for impacts of hydrodynamic conditions on algae growth in Chongqing Section of Jialing River, China. Ecol. Model 2011, 222, 112–119. [Google Scholar] [CrossRef]
- Levy, J.L.; Angel, B.M.; Stauber, J.L.; Poon, W.L.; Simpson, S.L.; Cheng, S.H.; Jolley, D.F. Uptake and internalisation of copper by three marine microalgae: Comparison of copper-sensitive and copper-tolerant species. Aquat. Toxicol. 2008, 89, 82–93. [Google Scholar] [CrossRef] [Green Version]
- Kim, Y.; Son, J.; Mo, H.H.; Lee, Y.S.; Cho, K. Modeling the influence of initial density and copper exposure on the interspecific competition of two algal species. Ecol. Model 2018, 383, 160–170. [Google Scholar] [CrossRef]
- Aslan, N.; Cebeci, Y. Application of Box–Behnken design and response surface methodology for modeling of some Turkish coals. Fuel 2007, 86, 90–97. [Google Scholar] [CrossRef]
- Liu, J. Optimisation of biomass and lipid production by adjusting the interspecific competition mode of Dunaliella salina and Nannochloropsis gaditana in mixed culture. J. Appl. Phycol. 2014, 26, 163–171. [Google Scholar] [CrossRef]
- Rezaee, R.; Maleki, A.; Jafari, A.; Mazloomi, S.; Zandsalimi, Y.; Mahvi, A.H. Application of response surface methodology for optimization of natural organic matter degradation by UV/H2O2 advanced oxidation process. J. Environ. Health Sci. 2014, 12, 67. [Google Scholar] [CrossRef] [PubMed] [Green Version]
- Kumari, M.; Gupta, S. Modeling of trihalomethanes (THMs) in drinking water supplies: A case study of eastern part of India. Environ. Sci. Pollut. R 2015, 22, 12615–12623. [Google Scholar] [CrossRef] [PubMed]
- Danbaba, N.; Nkama, I.; Badau, M.H. Application of response surface methodology (RSM) and central composite design (CCD) to optimize minerals composition of rice-cowpea composite blends during extrusion cooking. Int. J. Food Sci. Tech. 2015, 5, 40–52. [Google Scholar]
- Hill, W.R.; Bednarek, A.T.; Larsen, I.L. Cadmium sorption and toxicity in autotrophic biofilms. Can. J. Fish Aquat. Sci. 2000, 57, 530–537. [Google Scholar] [CrossRef]
- Wang, C.; Lan, C.Q. Effects of shear stress on microalgae—A review. Biotechnol. Adv. 2018, 36, 986–1002. [Google Scholar] [CrossRef]
- Nagajyoti, P.C.; Lee, K.D.; Sreekanth, T. Heavy metals, occurrence and toxicity for plants: A review. Environ. Chem. Lett. 2010, 8, 199–216. [Google Scholar] [CrossRef]
- Xue, B.; Wang, G.; Xiao, J.; Helman, D.; Sun, W.; Wang, J.; Liu, T. Global convergence but regional disparity in the hydrological resilience of ecosystems and watersheds to drought. J. Hydrol. 2020, 591, 125589. [Google Scholar] [CrossRef]
- Xue, B.; Helman, D.; Wang, G.; Xu, C.Y.; Xiao, J.; Liu, T.; Wang, L.; Li, X.; Duan, L.; Lei, H. The low hydrologic resilience of Asian Water Tower basins to adverse climatic changes. Adv. Water Resour. 2021, 155, 103996. [Google Scholar] [CrossRef]
Figure 1.
Schematic diagram of the experimental device.

Figure 2.
Cumulative effect of physical and chemical measures. The cumulative effect is expressed as the mean ± standard deviation.
Figure 2.
Cumulative effect of physical and chemical measures. The cumulative effect is expressed as the mean ± standard deviation.

Figure 3.
Cumulative effect of physical and biological measures. The cumulative effect is expressed as the mean ± standard deviation.
Figure 3.
Cumulative effect of physical and biological measures. The cumulative effect is expressed as the mean ± standard deviation.

Figure 4.
Cumulative effect of chemical and biological measures. The cumulative effect is expressed as the mean ± standard deviation.
Figure 4.
Cumulative effect of chemical and biological measures. The cumulative effect is expressed as the mean ± standard deviation.

Figure 5.
Cumulative effect of chemical and biological measures under three levels of physical measures: (a) 0.1 m/s, (b) 0.15 m/s, (c) 0.2 m/s. The cumulative effect is expressed as the mean ± standard deviation.
Figure 5.
Cumulative effect of chemical and biological measures under three levels of physical measures: (a) 0.1 m/s, (b) 0.15 m/s, (c) 0.2 m/s. The cumulative effect is expressed as the mean ± standard deviation.

Figure 6.
2D contour plots and 3D surface plots for cumulative effect rate: interactions of A (Flow velocity) and C (Copper).
Figure 6.
2D contour plots and 3D surface plots for cumulative effect rate: interactions of A (Flow velocity) and C (Copper).

Figure 7.
2D contour plots and 3D surface plots for cumulative effect rate: A (Flow velocity) and B (Propionamide) interactions.
Figure 7.
2D contour plots and 3D surface plots for cumulative effect rate: A (Flow velocity) and B (Propionamide) interactions.

Figure 8.
2D contour plots and 3D surface plots for cumulative effect rate: interactions of B (Propionamide) and C (Copper).
Figure 8.
2D contour plots and 3D surface plots for cumulative effect rate: interactions of B (Propionamide) and C (Copper).


Table 1.
Levels of the variables in the Box–Behnken design.
| Variable | Level | ||
|---|---|---|---|
| Low | Medium | High | |
| Flow velocity (m/s) | 0.1 | 0.15 | 0.2 |
| Propionamide (mg/L) | 0.5 | 1 | 1.5 |
| Copper (μg/L) | 5 | 10 | 15 |
Table 2.
ANOVA of the model for cumulative effect rate.
| Source | Sum of Squares | Df | Mean Square | F-Value | p-Value Prob > F |
|---|---|---|---|---|---|
| Model | 0.2153 | 9 | 0.0239 | 90.12 | <0.0001 (significant) |
| A-Velocity | 0.1100 | 1 | 0.1100 | 414.28 | <0.0001 |
| B-Propionamide | 0.0164 | 1 | 0.0164 | 61.85 | 0.0001 |
| C-copper | 0.0680 | 1 | 0.0680 | 256.17 | <0.0001 |
| AB | 0.0015 | 1 | 0.0015 | 5.62 | 0.0495 |
| AC | 0.0000 | 1 | 0.0000 | 0.0470 | 0.8345 |
| BC | 0.0018 | 1 | 0.0018 | 6.78 | 0.0352 |
| A² | 0.0071 | 1 | 0.0071 | 26.82 | 0.0013 |
| B² | 0.0030 | 1 | 0.0030 | 11.25 | 0.0122 |
| C² | 0.0083 | 1 | 0.0083 | 31.23 | 0.0008 |
| Residual | 0.0019 | 7 | 0.0003 | ||
| Lack of Fit | 0.0015 | 3 | 0.0005 | 5.60 | 0.0648 (not significant) |
| Pure Error | 0.0004 | 4 | 0.0001 |
Table 3.
Model statistics of the model.
| Statistical Parameters | Values of Model |
|---|---|
| Std. Dev. | 0.02 |
| R² | 0.99 |
| Adjusted R² | 0.98 |
| Adeq Precision | 33.76 |
Publisher’s Note: MDPI stays neutral with regard to jurisdictional claims in published maps and institutional affiliations. |
© 2022 by the authors. Licensee MDPI, Basel, Switzerland. This article is an open access article distributed under the terms and conditions of the Creative Commons Attribution (CC BY) license (https://creativecommons.org/licenses/by/4.0/).
Share and Cite
MDPI and ACS Style
Li, H.; Wang, J.; Zhang, E.; Shao, Y.; Yang, L.; Yang, B.; Tan, Y.; Gao, T. Cumulative Effects of Physical, Chemical, and Biological Measures on Algae Growth Inhibition. Water 2022, 14, 877. https://doi.org/10.3390/w14060877
AMA Style
Li H, Wang J, Zhang E, Shao Y, Yang L, Yang B, Tan Y, Gao T. Cumulative Effects of Physical, Chemical, and Biological Measures on Algae Growth Inhibition. Water. 2022; 14(6):877. https://doi.org/10.3390/w14060877
Chicago/Turabian StyleLi, Hao, Jiaqi Wang, Enze Zhang, Yanan Shao, Lin Yang, Baiheng Yang, Yi Tan, and Ting Gao. 2022. "Cumulative Effects of Physical, Chemical, and Biological Measures on Algae Growth Inhibition" Water 14, no. 6: 877. https://doi.org/10.3390/w14060877
Note that from the first issue of 2016, this journal uses article numbers instead of page numbers. See further details here.