Article

Optimal Location of Water Quality Monitoring Stations Using an Artificial Neural Network Modeling in the Qarah-Chay River Basin, Iran

by
Fatemeh Goudarzi
1,
Amir Hedayatiaghmashhadi
1,2,*,
Azadeh Kazemi
1 and
Christine Fürst
2
1
Department of Environmental Science and Engineering, Faculty of Agriculture and Environment, Arak University, Arak 3848177584, Iran
2
German Centre for Integrative Biodiversity Research (iDiv) Halle-Jena-Leipzig, Department of Sustainable Landscape Development, Institute of Geosciences and Geography, Martin Luther University Halle-Wittenberg, 06120 Halle (Saale), Germany
*
Author to whom correspondence should be addressed.
Water 2022, 14(6), 870; https://doi.org/10.3390/w14060870
Submission received: 3 February 2022 / Revised: 28 February 2022 / Accepted: 2 March 2022 / Published: 10 March 2022

Abstract

:
The economic development, livelihood and drinking water of millions of people in the central plateau of Iran depend on the Qarah-Chay River, but due to a lack of inappropriate monitoring, it has been exposed to destruction and pollution. Consequently, an assessment of the river’s water quality is of utmost importance for both the management of human health and the maintenance of a safe environment, which can be achieved by determining the best locations for pollution monitoring stations along rivers. In this study, artificial neural networks (ANNs) has been used to optimize the locations for Qarah-Chay River monitoring stations in Markazi province, Iran. The data are collected based on the Iranian Water Quality Index (IRWQI), the US National Sanitation Foundation Water Quality Index (NSFWQI) and the Oregon Water Quality Index (OWQI). The database is given to a multilayer perceptron (MLP) neural network along with a geographic information system (GIS). The output of this study identified six pollution monitoring stations on the river, which are mainly downstream due to the accumulation of land uses and the concentration of pollution. The gradient of the MLP network training courses model from the proposed monitoring stations is 0.062299. In addition, the performance evaluation criteria of the proposed MLP model for F1-score, recall, precision and accuracy were 0.85, 0.84, 0.88 and 0.88, respectively. The results obtained help managers to properly monitor the river’s water resources with accuracy, efficiency and lower cost; furthermore, the findings were able to provide scientific references for river water quality monitoring and river ecosystem protection.

1. Introduction

Rivers are an indispensable water resource and can provide drinking water that is essential for human livelihood, industrial water supply and demand, and valuable natural habitats [1,2]. According to the United Nations Environment Programme (UNEP) report, water pollution has worsened since the 1990s in many rivers in Latin America, Africa, and Asia [3]. However, it is still possible to reduce further pollution and restore the quality of polluted rivers [4,5].
Improper management of a river’s pollution could result in significant damage to the flora and fauna of the ecosystem, the long term impacts on public health, and distraction to commerce and the economy, which in turns lead to the overall disruption of a nation’s way of life [6]. The regular monitoring of water quality in a river network is crucial for reliable water supply and preservation of a healthy ecosystem. To comprehensively determine water quality status across an entire river network, it would be ideal to have a virtually infinite number of sampling sites that provide spatially continuous data on water quality [7]. Due to the considerable costs of installation and operation of sampling and monitoring stations along the rivers, the optimal design of water quality networks is quite important [8]. However, there are always practical limitations, such as budget constraints, to maintaining sampling sites [9]. Therefore, assessing the overall water quality status of a river network via a minimum number of sampling sites presents an important engineering problem [10].
In order to design an effective monitoring network, several criteria for the selection of sampling sites have been proposed in previous studies. [11] suggested four individual fitness functions as follows: compliance with water quality data, supervision of water use, surveillance of pollution sources, and examination of water quality changes/estimation of pollution loads. The weighed sum of these was proposed as an objective function to determine the optimal location of monitoring sites. [8] suggested a new approach based on discrete entropy theory. In this approach, the measure of transinformation in discrete entropy theory is used for quantifying the efficiency of a monitoring network, while the probability distribution functions of the random variables are not required. [12] proposed two objective functions for minimizing the average time for contaminant detection and maximizing the reliability of a monitoring system. Some studies have utilized information theory, in which disorder or uncertainty contained in a signal can be evaluated through entropy quantities such as the marginal entropy, conditional entropy, and transinformation. [13] suggested the criterion of minimum redundancy to determine the optimal spatial distribution of sampling sites, and used transinformation as the measure of redundancy. [14] used not only transinformation but also marginal entropy as measures of information gained from individual sampling sites, and suggested a methodology for expansion or modification of an existing sampling network in terms of maximum total information gained from the sites with minimum redundancy. [7] proposed an efficient algorithm that can easily determine the optimal location of water quality sampling sites in a river network. The proposed algorithm can be used alone or in conjunction with a heuristic optimization algorithm such as a genetic algorithm. For the latter, the proposed algorithm filters only competitive candidates and makes a contribution to reducing the problem size significantly. [15] used the case of the Lower Neretva Valley (LNV) to test the efficiency of applying linear mixed effect (LME) theory in modelling spatial and temporal variations of surface and groundwater quality within a polder-type agricultural catchment. The methodology uses linear regressive techniques while taking into account the spatial and temporal autocorrelation of residuals. [2] presented a Bayesian maximum entropy (BME)-based framework to optimize the locations of water quality monitoring stations (WQMS) in rivers to obtain the highest value of information with the lowest number of monitoring stations. In this study, BME is employed as a flexible, accurate, and effective approach in geostatistics to optimize the spatiotemporal coverage of potential WQMS. In addition, an information-entropy model is proposed, using value of information (VOI) and transinformation entropy (TE), in a multi-objective optimization model to relax the computational burden and allow the entire decision space to be explored. The proposed model provides a set of Pareto-optimal solutions (WQMS locations) with trade-offs between VOI (highest information) and TE (lowest overlap). Moreover, [16] takes advantage of the multiple-kernel support vector regression algorithm for estimation of water quality parameters, and [17] used a reliability assessment of water quality index based on guidelines of national sanitation foundation in natural streams through remote sensing and data-driven models as a new approach based on artificial intelligence to improve water quality management.
Artificial neural networks (ANNs) are oriented on the structures and working principles inspired by biological neural networks. They are a powerful computational technique for modelling complex non-linear relationships [18]. Many researchers have portrayed the significance of ANN in forecasting water quality in comparison with other models. The usage of neural networking has increased rapidly in the field of water-quality management and water-resource planning and management [19]. ANN models function by processing information in a similar manner to the brain, while the training of ANN models enables them to have a similar analytical and reasoning capability compared to brain neurons, which are used to solve practical problems [20]; indeed, ANN is a type of machine learning algorithm which requires no human supervision. Artificial intelligence techniques such as artificial neural networks are currently being increasingly used, since they can overcome the limitations of the deterministic models [21]. The ability to learn from the data and to carry out the tasks based on data provided for training is a feature of artificial neural networks. ANN can develop their own organization of the information as it is received during the process of learning, which means that computations can be carried out in parallel in ANN. To exploit the capabilities of ANNs, special hardware devices are being developed [22]. The ANN approach offers various advantages to problem-solving such as [23]: (i) previous knowledge of the undertaken study is not required in a neural network application; (ii) complex relationships between different parameters of the undertaken study are not required to be ascertained; (iii) for the development of an ANN model, assumption of constraints is not required; and (iv) an ANN model can always reach an optimal solution condition, whereas an optimization model can give the solution only once it has been completely processed. These attributes of ANN models make them an appropriate tool for providing solutions to different problems of hydrological modeling [24,25].
An ANN can be described as an information process system which consists of many nonlinear and densely interconnected processing units [26]. With this parallel-distributed processing architecture, ANNs have been proven to be an efficient alternative to traditional methods for hydrological modeling [27,28].
Although ANNs have a severe limitation as a black-box model in terms of providing explanatory insight into the contribution of the independent parameters in prediction, they are undoubtedly a powerful tool for delineating nonlinearity. Furthermore, several methods (e.g., Garson’s algorithm, sensitivity analysis, and a randomization approach) have been suggested for interpreting the relative influence of the descriptors, and this matter has been challenged as the inner workings of neural networks have been illuminated [29].
ANN is a structure, an element module node or neuron that is similar in structure to human time and which is mathematically related to the function. Coefficients and eavesdropping input variable features are known as weights and biases [30]; furthermore, an ANN model could achieve the highest predictive performance efficiency [31]. The ANN contains three layers including an input layer, a hidden layer, and an output layer [32]. The input node passes the input value to the hidden layer. Values are divided among all nodes in the hidden layer based on weight. There are scales between the input node and the hidden node, respectively, and between the hidden node and the output node. The weight of communication is the relationship between neurons in consecutive layers. One layer of each neuron is connected [33].
There are several studies that have reported on the application of multilayer perceptron (MLP) neural network algorithms to find the best locations for monitoring stations along rivers. Consequently, the main purpose of this paper is to find the optimal location of water quality monitoring stations using Iranian Water Quality Index (IRWQI), US National Sanitation Foundation Water Quality Index (NSFWQI) and Oregon Water Quality Index (OWQI) indexes, taking the Qarah-Chay River basin as an example.
The innovation of this research can be divided into two main categories. In general, the use of ANNs compared to other algorithms has features that have been used appropriately in this research. ANNs is a popular and helpful model for classification, clustering, pattern recognition and prediction in many disciplines. ANNs are one type of model for machine learning (ML), and have become relatively competitive to conventional regression and statistical models regarding usefulness. ANNs are a nonlinear and non-parametric model, while most statistical methods are parametric models that need larger amounts of statistics, which are widely used in solving various classification and forecasting problems, particularly in the field of environmental studies such as water management. Furthermore, ANNs can generalize; after learning from the initial inputs and their relationships, they can infer unseen relationships based on unseen data as well, thus making the model generalize and predict based on unseen data. Also, unlike many other prediction techniques, ANNs do not impose any restrictions on the input variables [34,35]. In addition, with regard to the novelty of this study, instead of individually predicting the parameters of pollution and predicting their concentration and distribution in water bodies, we tried to use the total data available cumulatively in water quality monitoring stations’ optimal locations on the river, of which not much research has been done to this point in time.

2. Materials and Methods
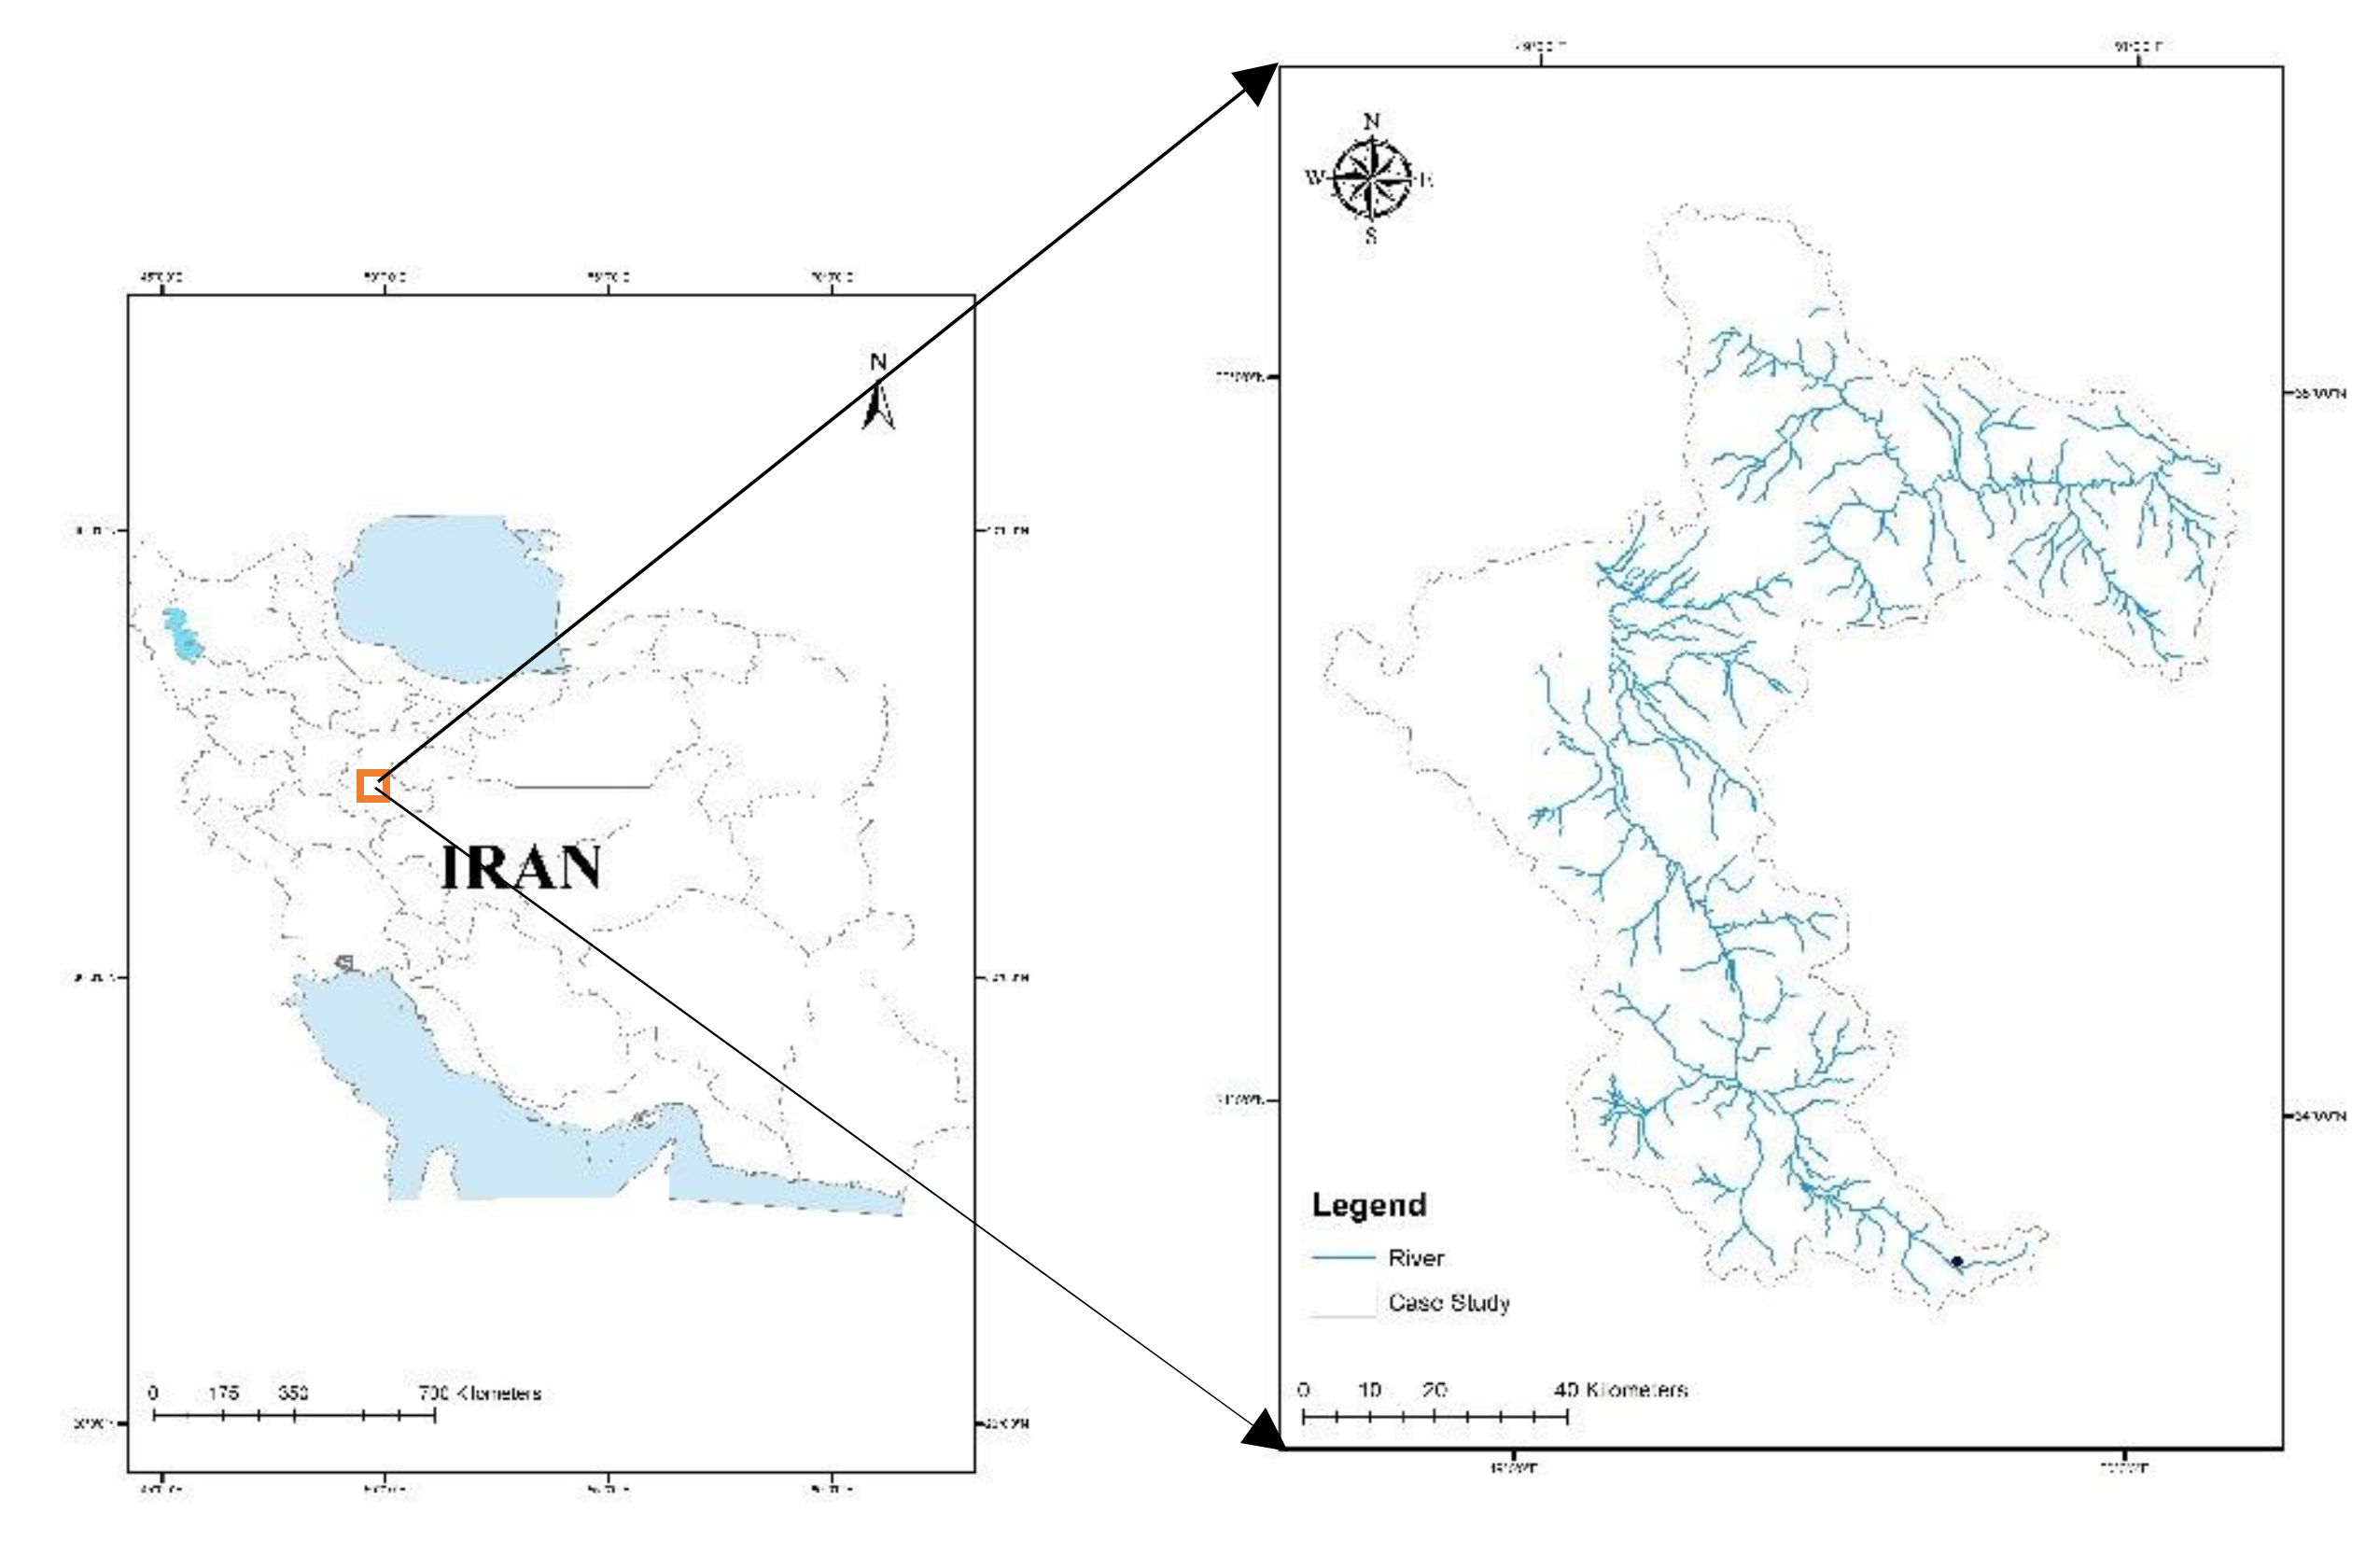
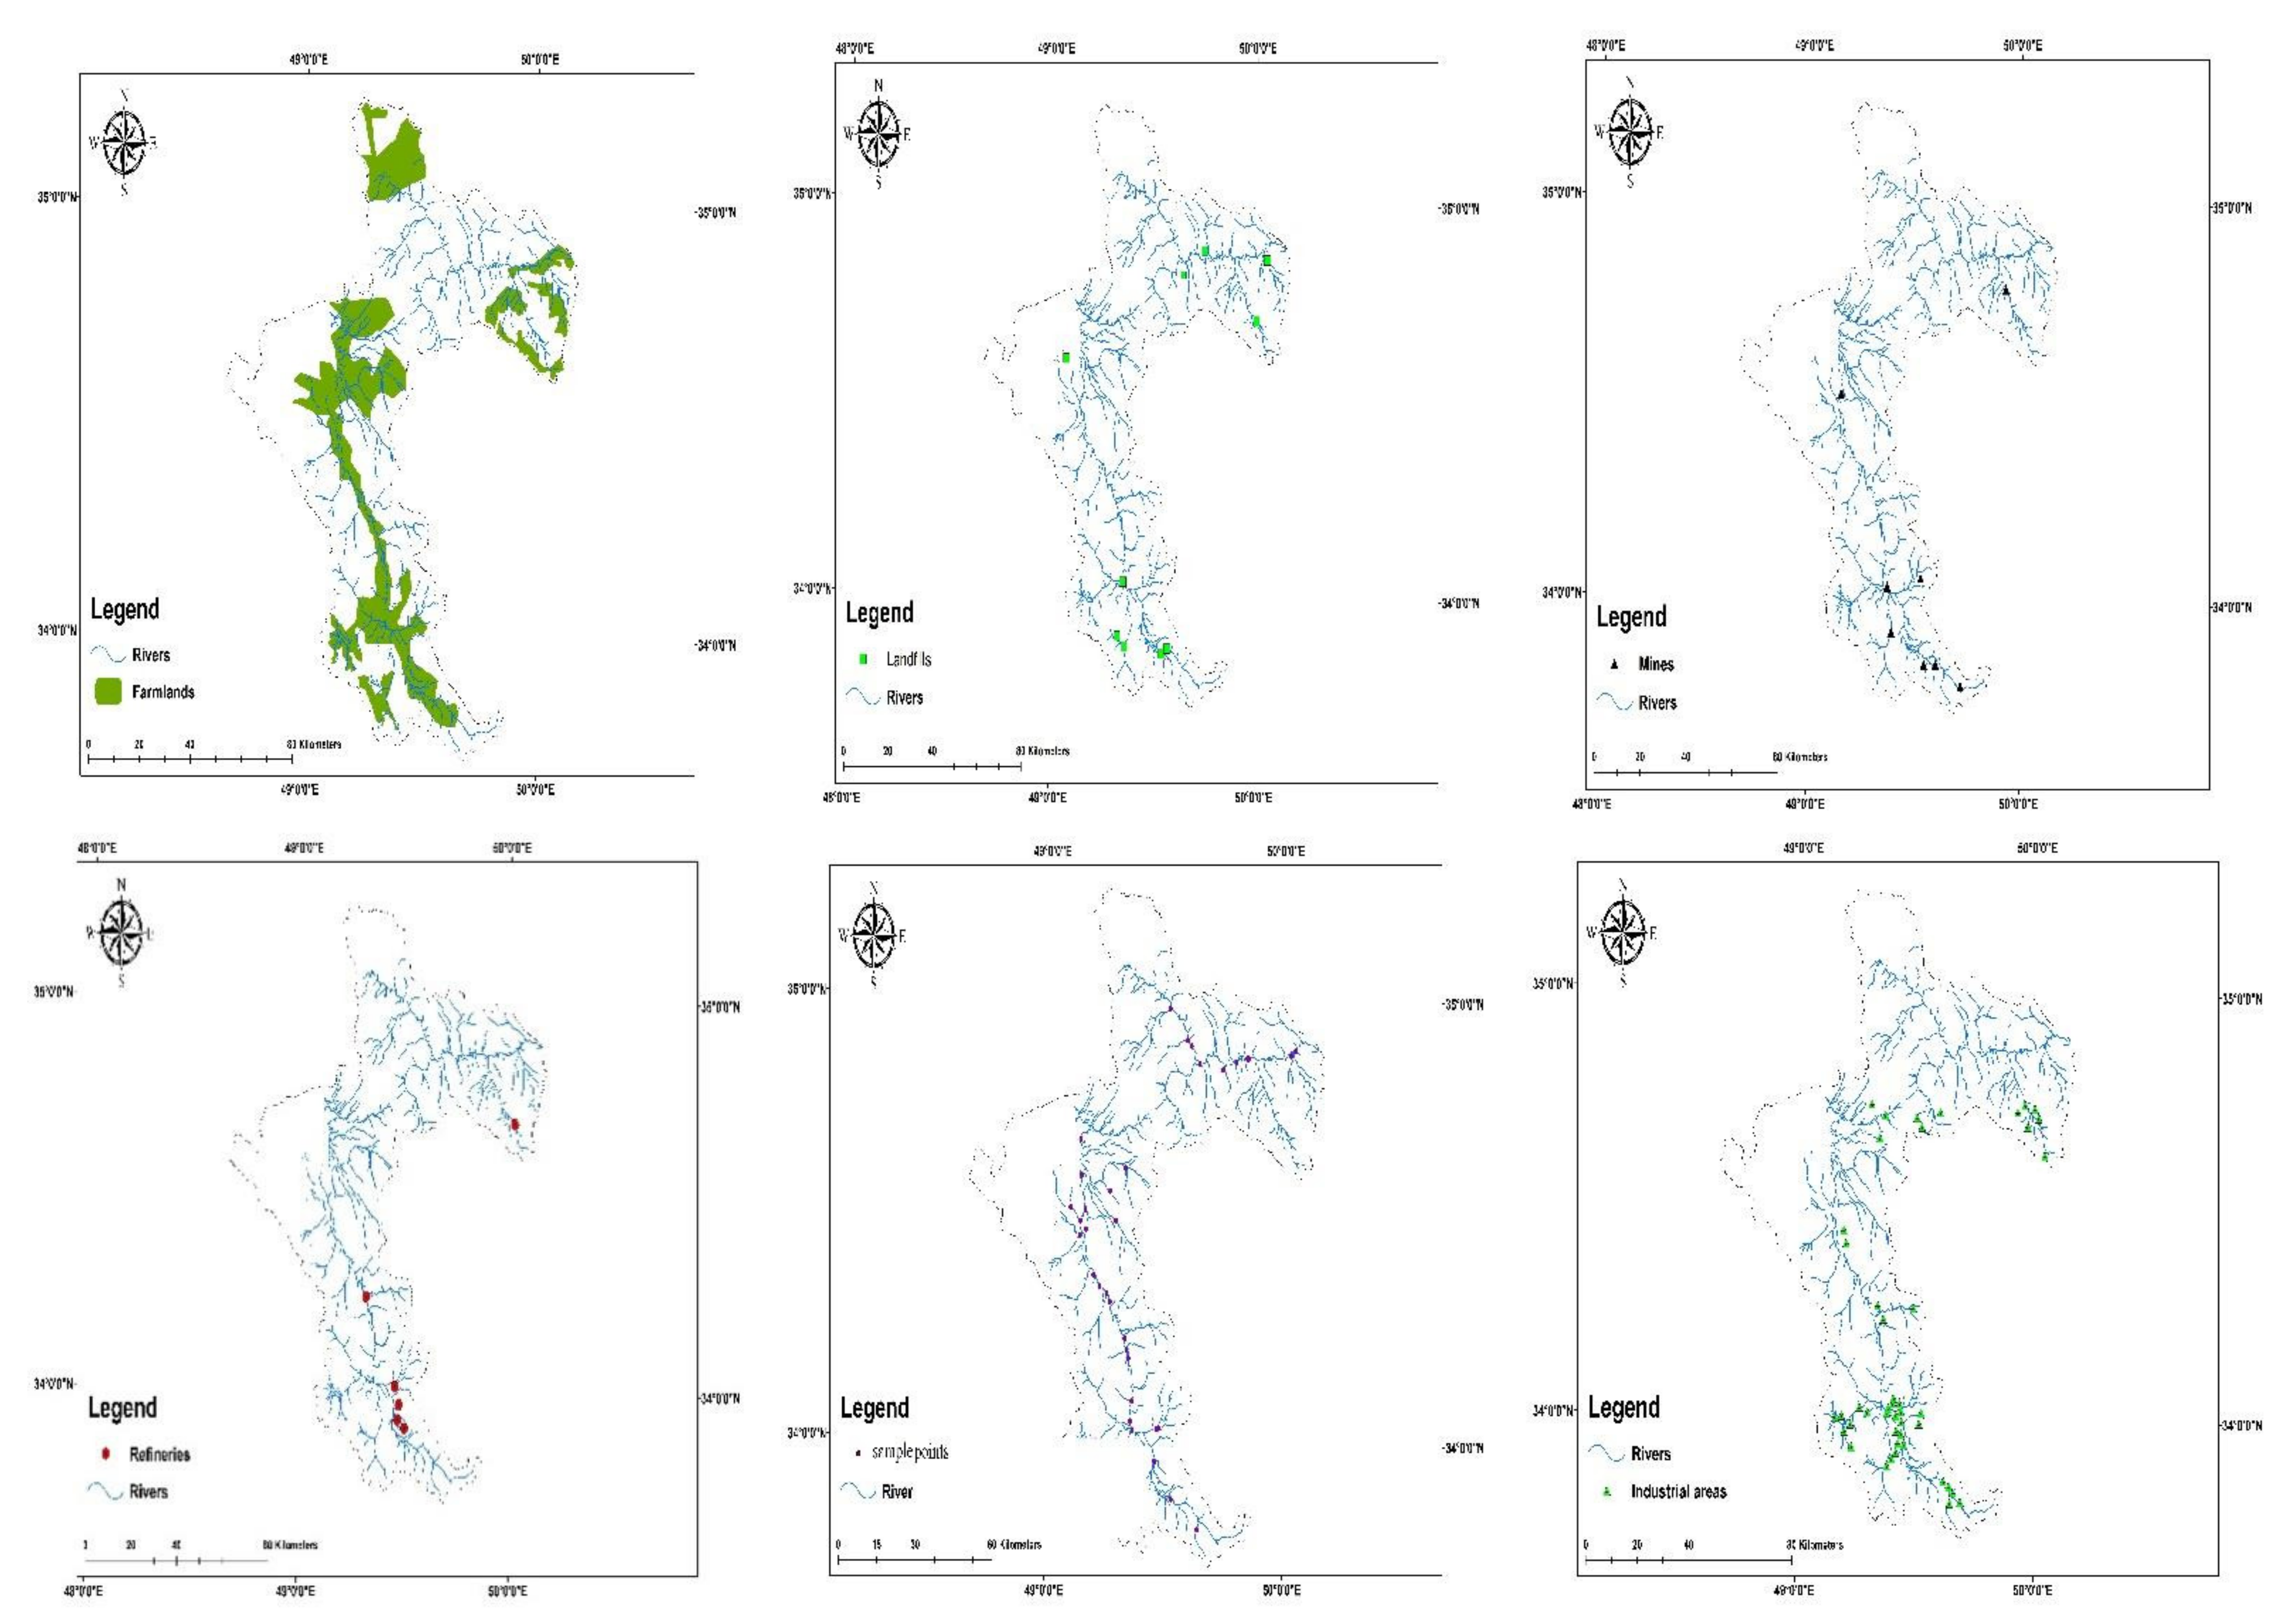
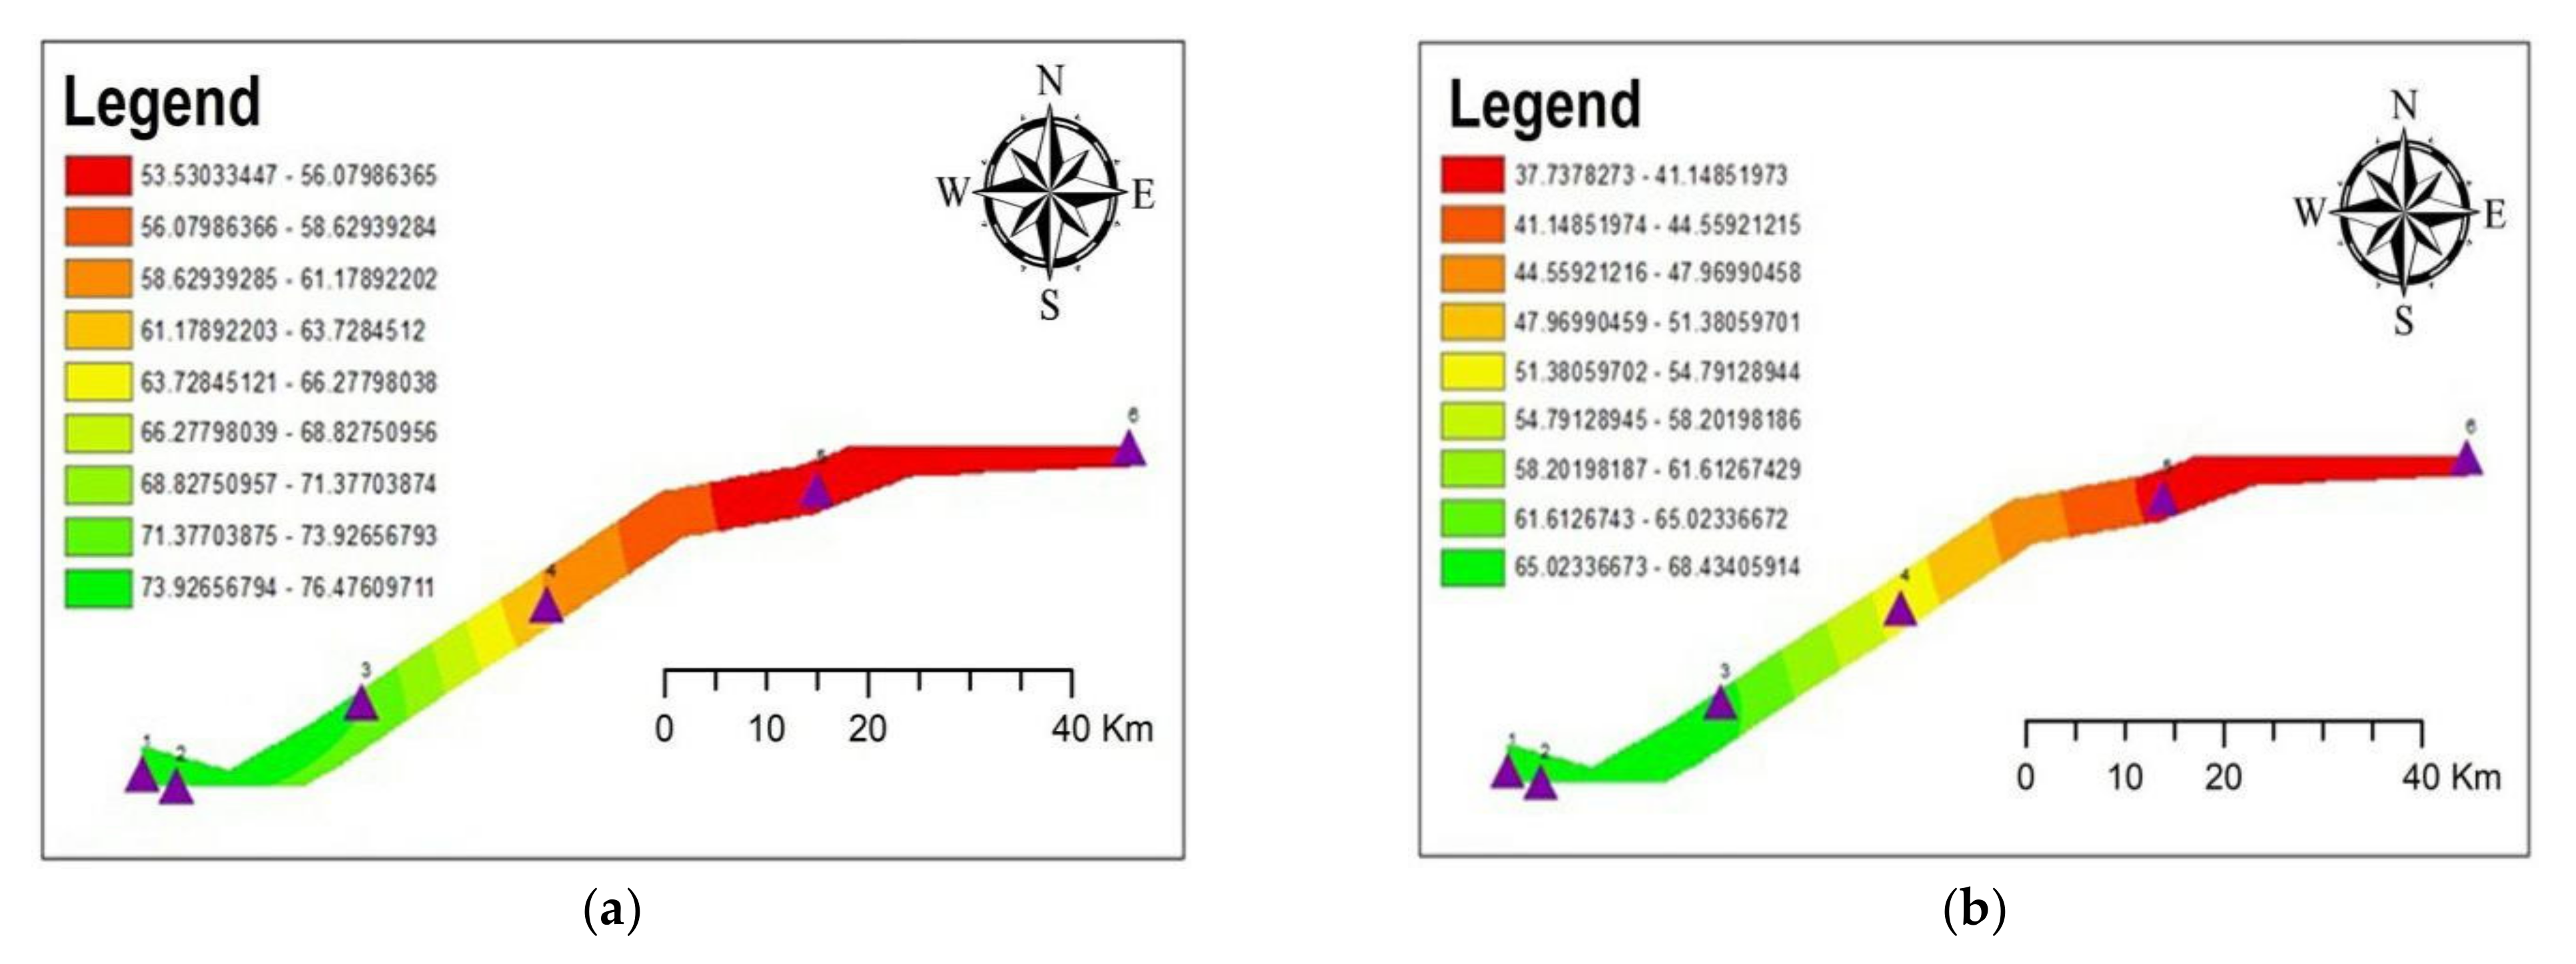
2.1. Study Area

The Qarah-Chay River basin is one of the sub-basins of the Salt Lake in Markazi, Hamedan and Qom provinces, and its most important river (the Qarah-Chay River) passes through the cities of Astana, Shazand, Arak, Hamedan, Tafresh, Saveh and Qom; the area of this watershed is 23,921 km2. The length of the Qarah-Chay River is 540 km and the altitude of its main source is 2300 m above sea level. Its general slope is 0.3% and its general route is first south-north and then west-east. Many big and small dams have been built on this river, which has been used for agricultural purposes, and its surplus enters the Salt Lake along with the flood flow. Also, the annual precipitation of this river’s basin is 150–450 mm. Qarah-Chay River is in Markazi province (Figure 1), an area exposed to many pressures, particularly pollution, so determination of water quality monitoring stations in suitable places is urgently needed.

2.2. Data and Methods

2.2.1. Data Base

For optimal location of water quality monitoring stations, the collected information is given to the MLP neural network. The values for each current sampling station enter the input layer, and the corresponding output is the optimal location of the predicted monitoring station. In the model training process, the proposed network is trained with a portion of the data to find the lowest RMS error and adjust the weight of the intermediate layers based on the amount of contamination in the samples. Samples with the highest values of weights are considered to be the most suitable points for water quality control and monitoring. In the proposed method, the number of middle layers and neurons of this layer is obtained based on trial and error. In order to validate the model, part of the input data is separated as test data to check the validity of the trained neural network model. When the performance accuracy of the training model for training data is acceptable, the performance accuracy of the model for test data and unknown data is measured [36].
The collected databases are randomly divided into two educational sets (70%) and test sets (30). According to the information related to the educational data set, the learning model is trained and tested on the experimental model. The results are entered into GIS as information layers after preparing the Confusion matrix and evaluating the errors. GIS results are given to the second model of the MLP along with the extraction characteristics from the river. Alternatives designed for output have two variables: suitable factor (1) and unsuitable factor (0). The unsuitable factor is defined in terms of areas that are of low importance in terms of location, and suitable areas have priority locations for the establishment of river monitoring stations. Figure 2 shows an implementation of the multilayer perceptron network.

Model Input Information

A database is the most important part in artificial intelligence analysis, especially with neural networks. The data include field studies (Table 1), withdrawals of physical and chemical water quality parameters such as pH, T (Temperature), TUR (Turbidity), DO (Dissolved Oxygen), BOD5 (Biological Oxygen Demand), NO3 (Nitrate), PO4 (Phosphate), FC (Fecal Coliform), TS (Total Solid), COD (Chemical Oxygen Demand), TH (Total Hardness), EC (Electrical Conductivity), and NH4 (Ammonium) from 42 points along the river during spring and autumn 2020. Moreover, there are other pollution points extracted from the river basin such as mines, landfills, industrial areas, farmlands, refineries, etc. (Figure 2). Therefore, the input database has been prepared and compiled here based on the information provided by the Markazi province Department of Environment, the Markazi province Meteorological Organization, the Markazi province Industry, Mining and Trade Organization, the Agriculture Organization of Markazi province, the Regional Water Company of Markazi, and the Iran National Cartographic Center, at both local and regional levels [37]. The type of water quality parameters extracted from the river is for use in the Iranian Water Quality Index (IRWQI) (11 parameters), US National Sanitation Foundation Water Quality Index (NSFWQI) (nine parameters) and the Oregon Water Quality Index (OWQI) (eight parameters).

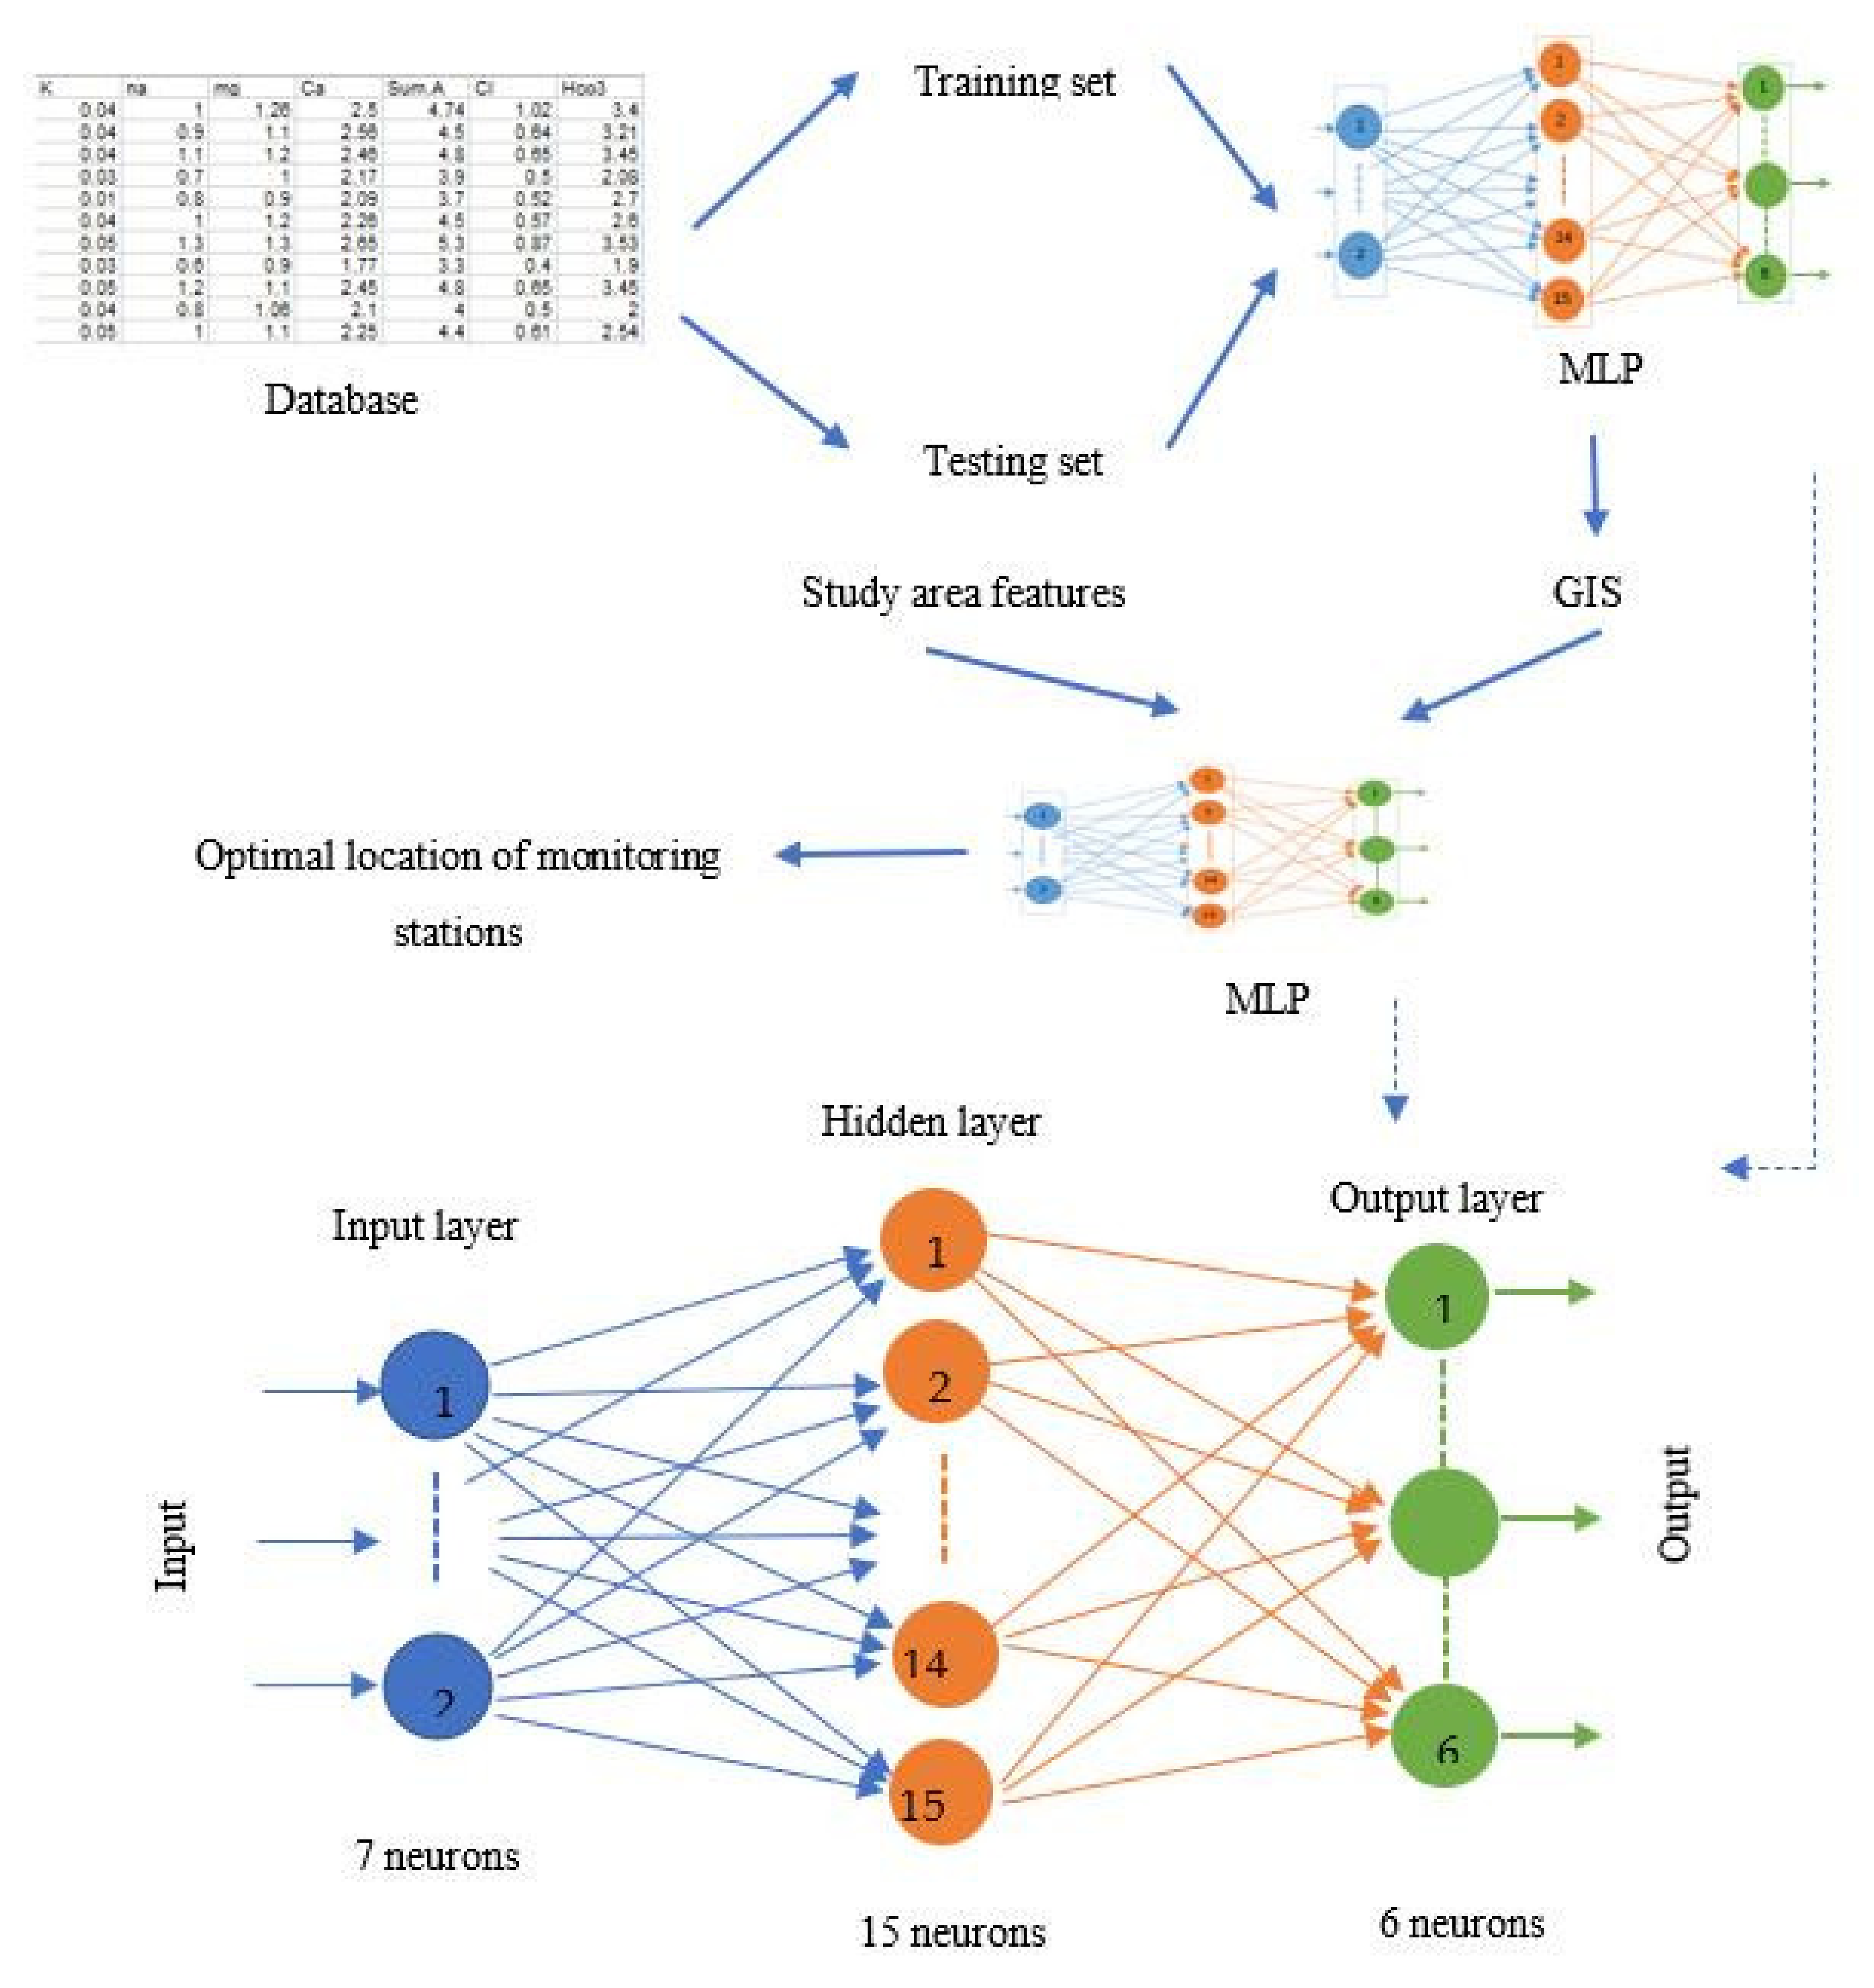
2.2.2. Multilayer Perceptron (MLP) Neural Network

An ANN is a biological model of the human brain nervous system that is used to predict, estimate, decide, and categorize input data. The structure of the ANN consists of three layers: input, middle and output. In a multilayer perceptron (MLP) neural network, in addition to the two input and output layers, there are several hidden layers [38]. This network is an extended version of the conventional perceptron network, which is used to detect and classify linearly separable data [39]. The neural network consists of two phases: training and testing. In the training phase of this network, learning is achieved by correcting the network error using a post propagation (BP) neural network (learning) algorithm [40]. The BP algorithm optimally adjusts the weight between nodes and minimizes errors in the training process. For training and optimization of MLP network weights and error calculation, optimization methods based on descent gradient, mean squared error (MSE), Levenberg_Marquardt (LM) and scaled conjugate gradient (SCG) have been used [41]. To solve the function of the LM algorithm, a Hessian matrix is considered [42]. The most important role of the proposed MLP method is finding locations of the contaminated points in the Qarah-Chay River as water quality monitoring stations.
In this research, the MLP is used in two stages (Figure 3). In the first step, used to classify water quality parameters, an MLP consisting of an input layer with seven neurons, an intermediate layer with fifteen neurons, and an output layer with six output neurons was formed. In the neural network designed to communicate between neurons in the hidden and output layers, the sigmoid transfer function (or activation function) has been used Equation (1) [43].
α = 1 1 + e x      
where α (output between 0–1), x (input), e (Napier’s constant)
In the second stage, the input of the MLP network includes features extracted from the study area and GIS data. The output of the second model of the network shows the relative optimization of water quality monitoring stations locations.

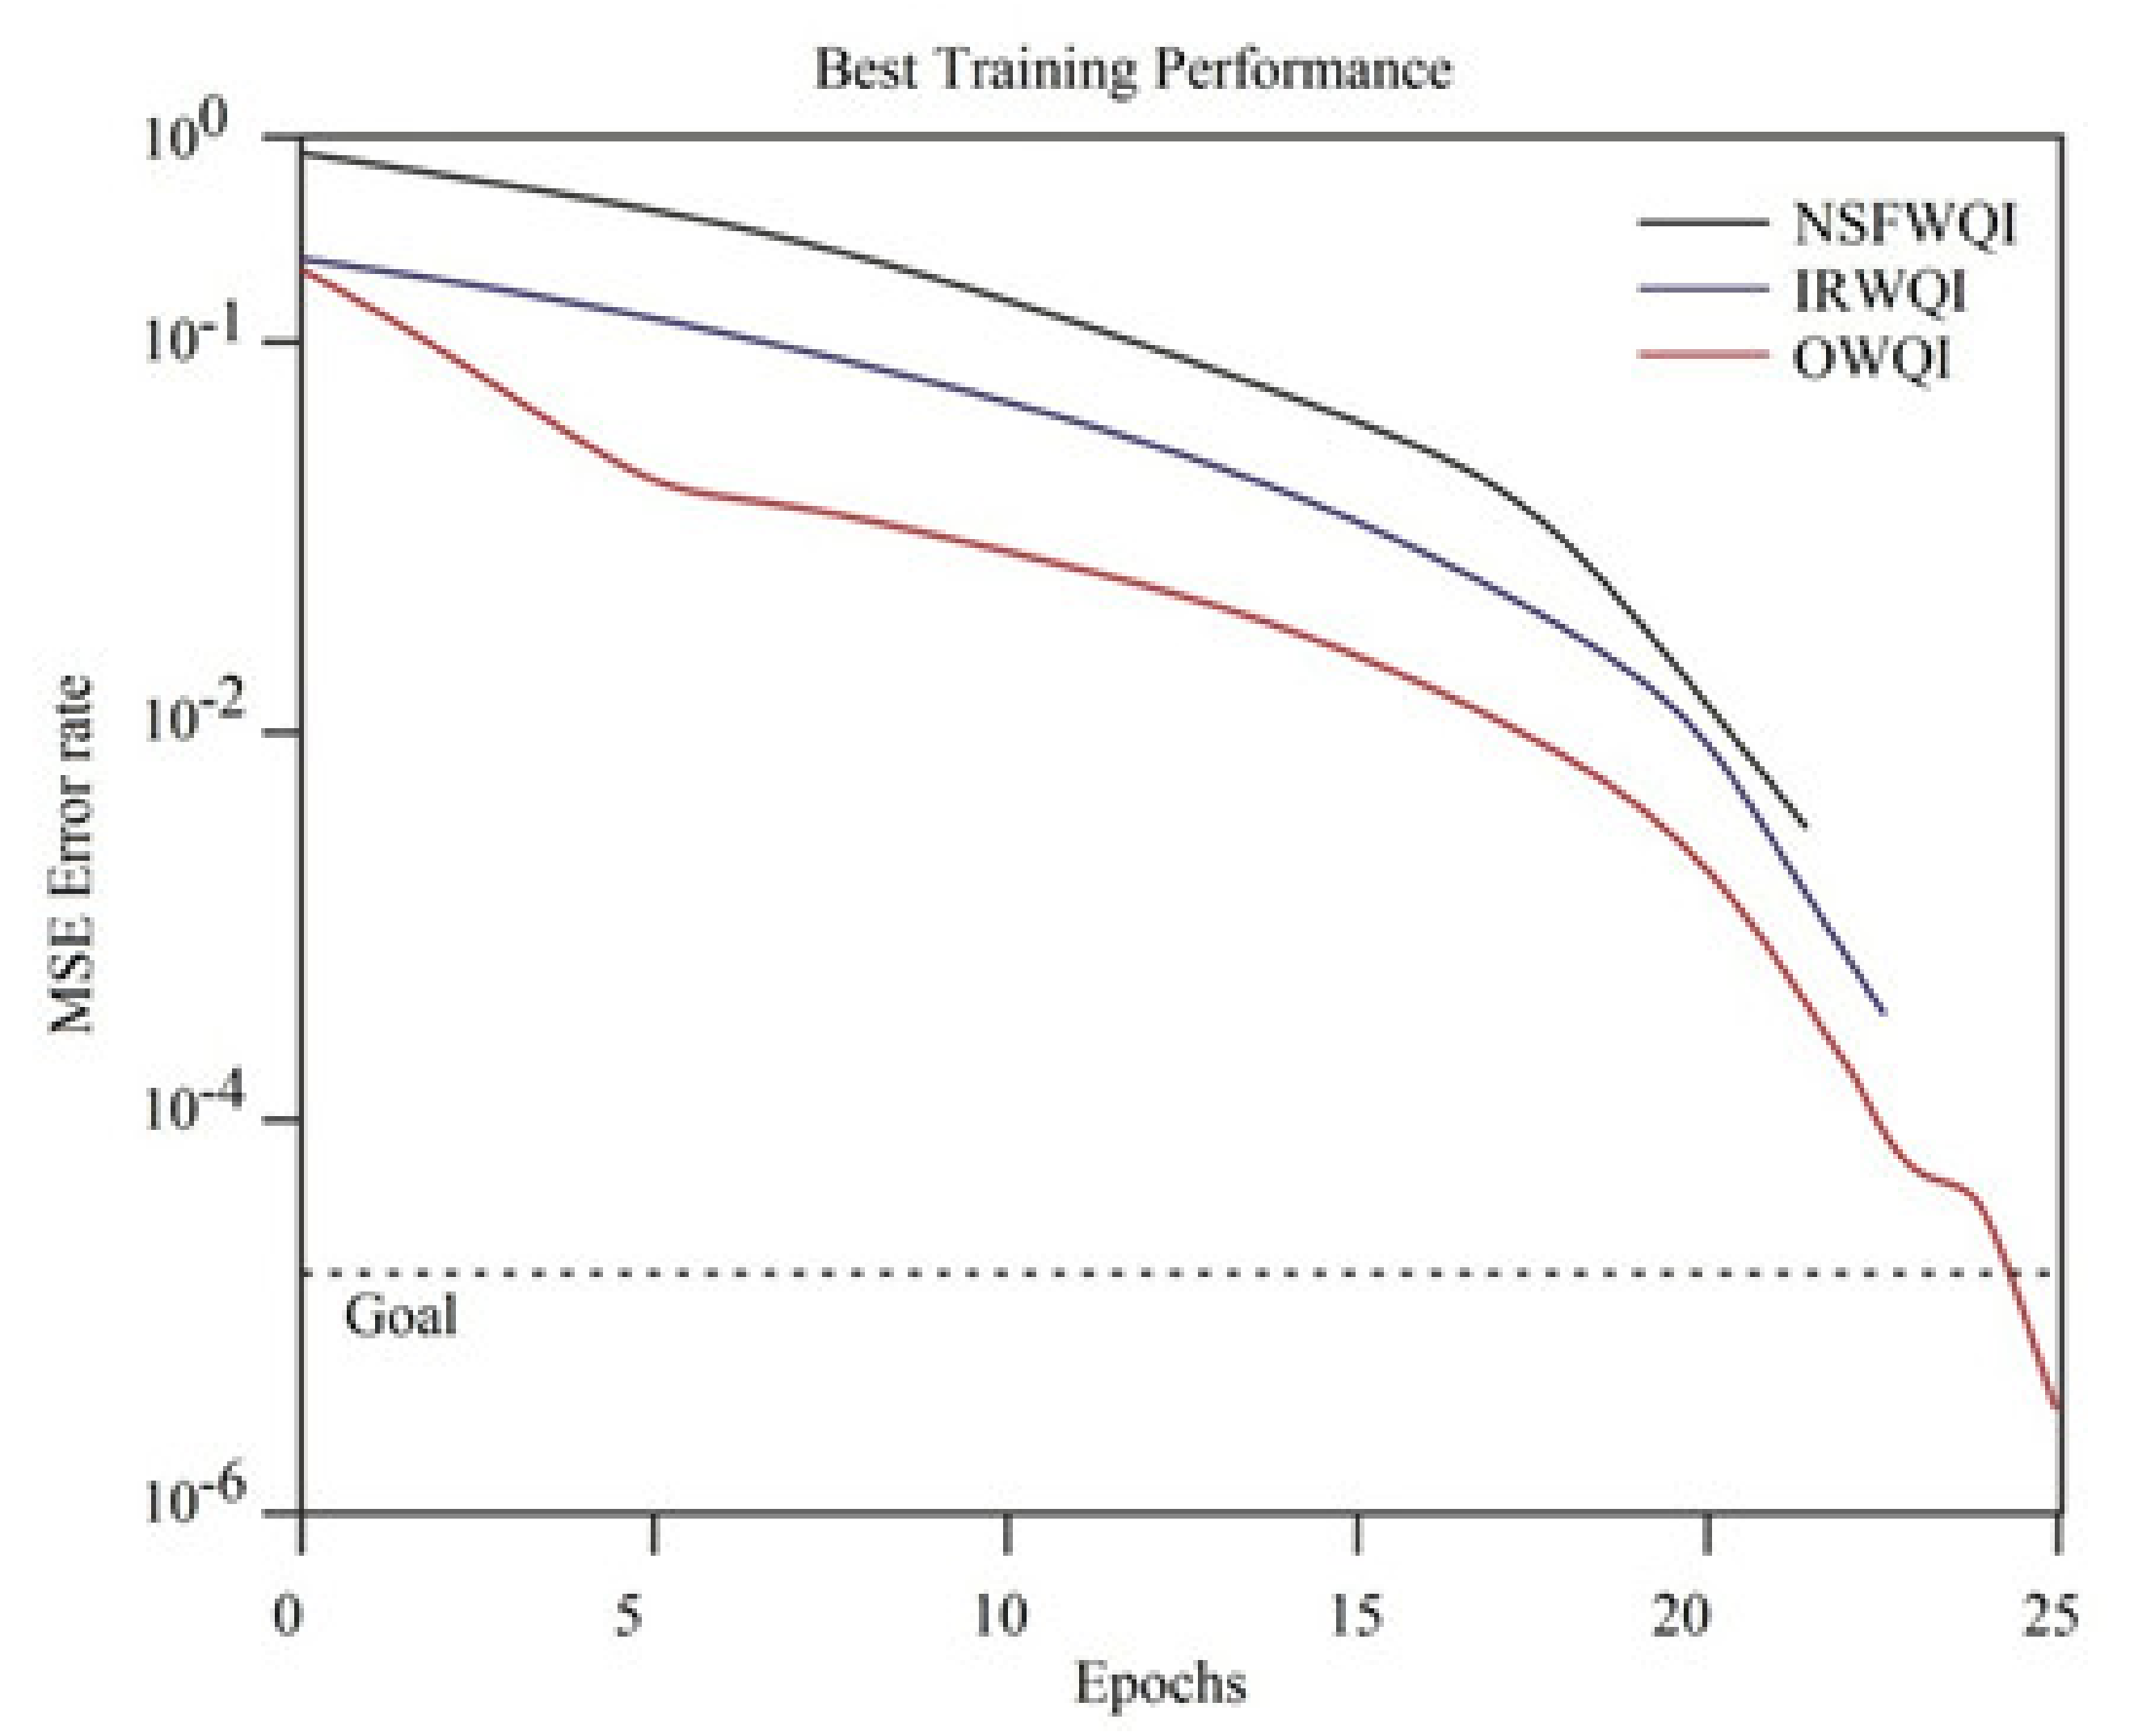
2.2.3. Evaluation Criteria of the Proposed Model

The performance evaluation criteria of the proposed method will include Accuracy, Precision, Recall, f1-score harmonic mean, Mean Squared Error (MSE), Root Mean Squared Error (RMSE) and Standard Error of the Mean (SEM) to estimate learning changes and test in the data set. Also the confusion matrix has been used to evaluate the accuracy of the proposed model [44]. Equations (2)–(4) show accuracy, precision, and recall, respectively [45,46].
Accuracy = (TP + TN)/(TP + TN + FP + FN)
Precision = TP/(TP + FP)
Recall = TP/(TP + FN)
where: T(True), F(False), P(Positives), N(Negatives)
Moreover, Equation (5) expresses the criterion f1-score. This criterion actually expresses the degree of correlation and convergence in the measured model, which can be calculated from the accuracy and recall factors.
F1-score = 2.(Precision . Recall)/(Precision + Recall)
In the proposed method, in addition to the above criteria, the ROC (Receiver Operating Characteristic) curve is used to express the ability and operational accuracy of the model. In fact, the ROC curve is a structured form of the confusion matrix, in which, by increasing the area under the AUC (area under curve) curve, the amount of OA (Overall Accuracy) also increases and shows a better performance model.

3. Results

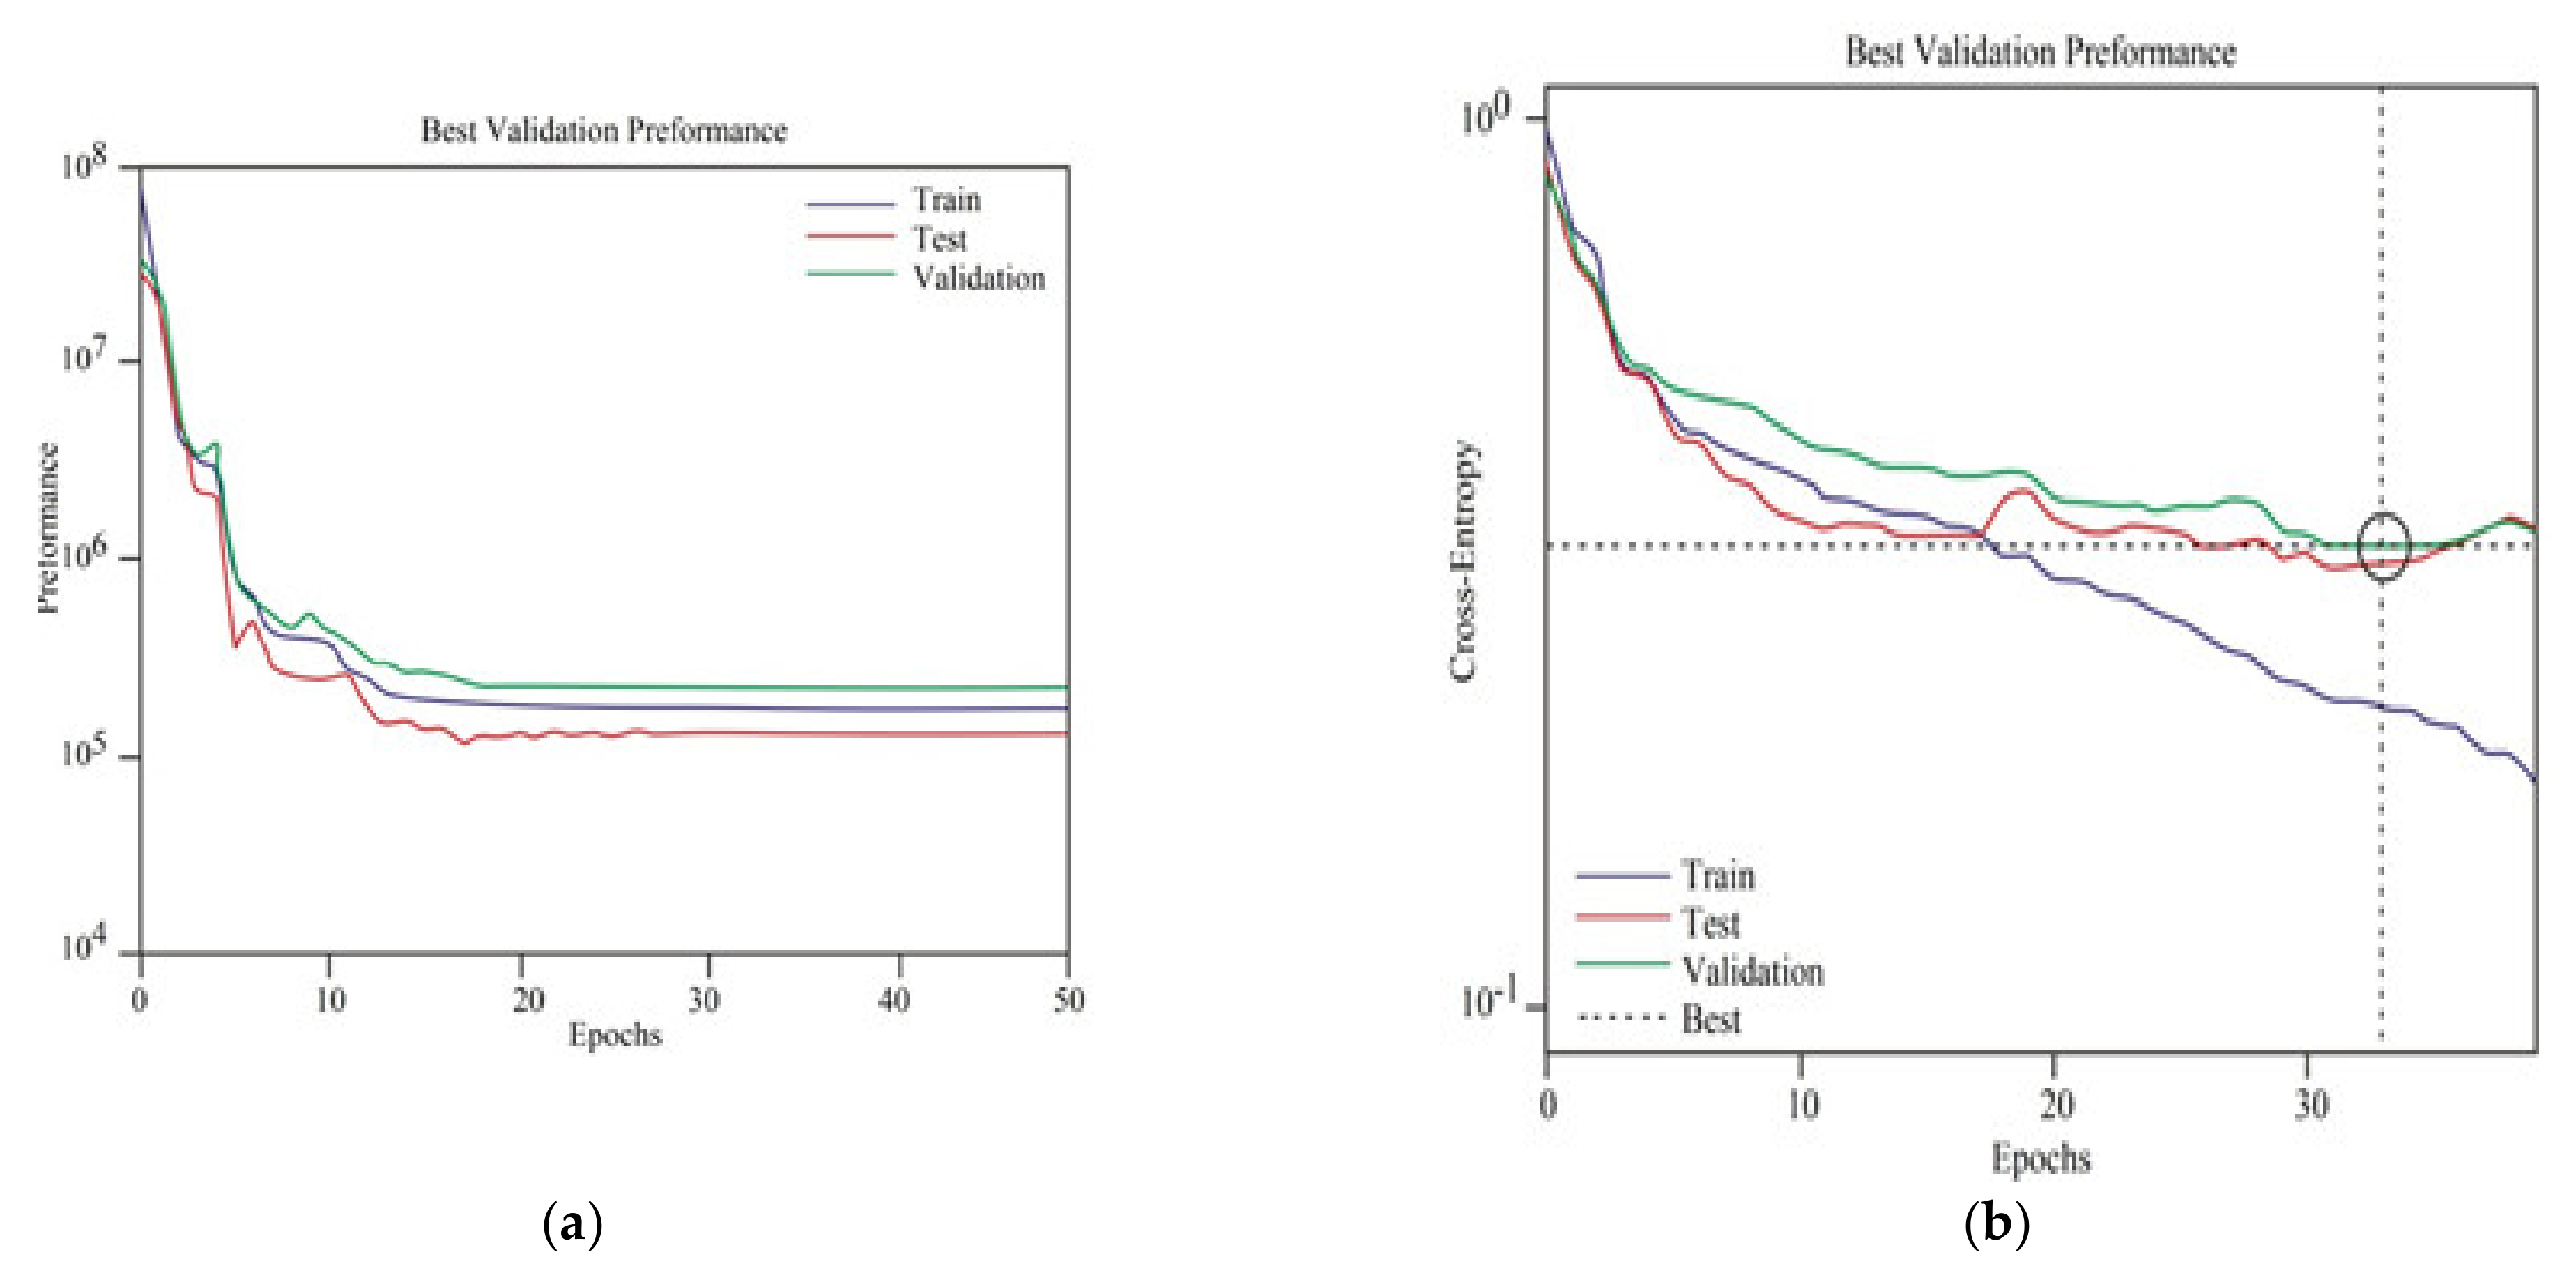
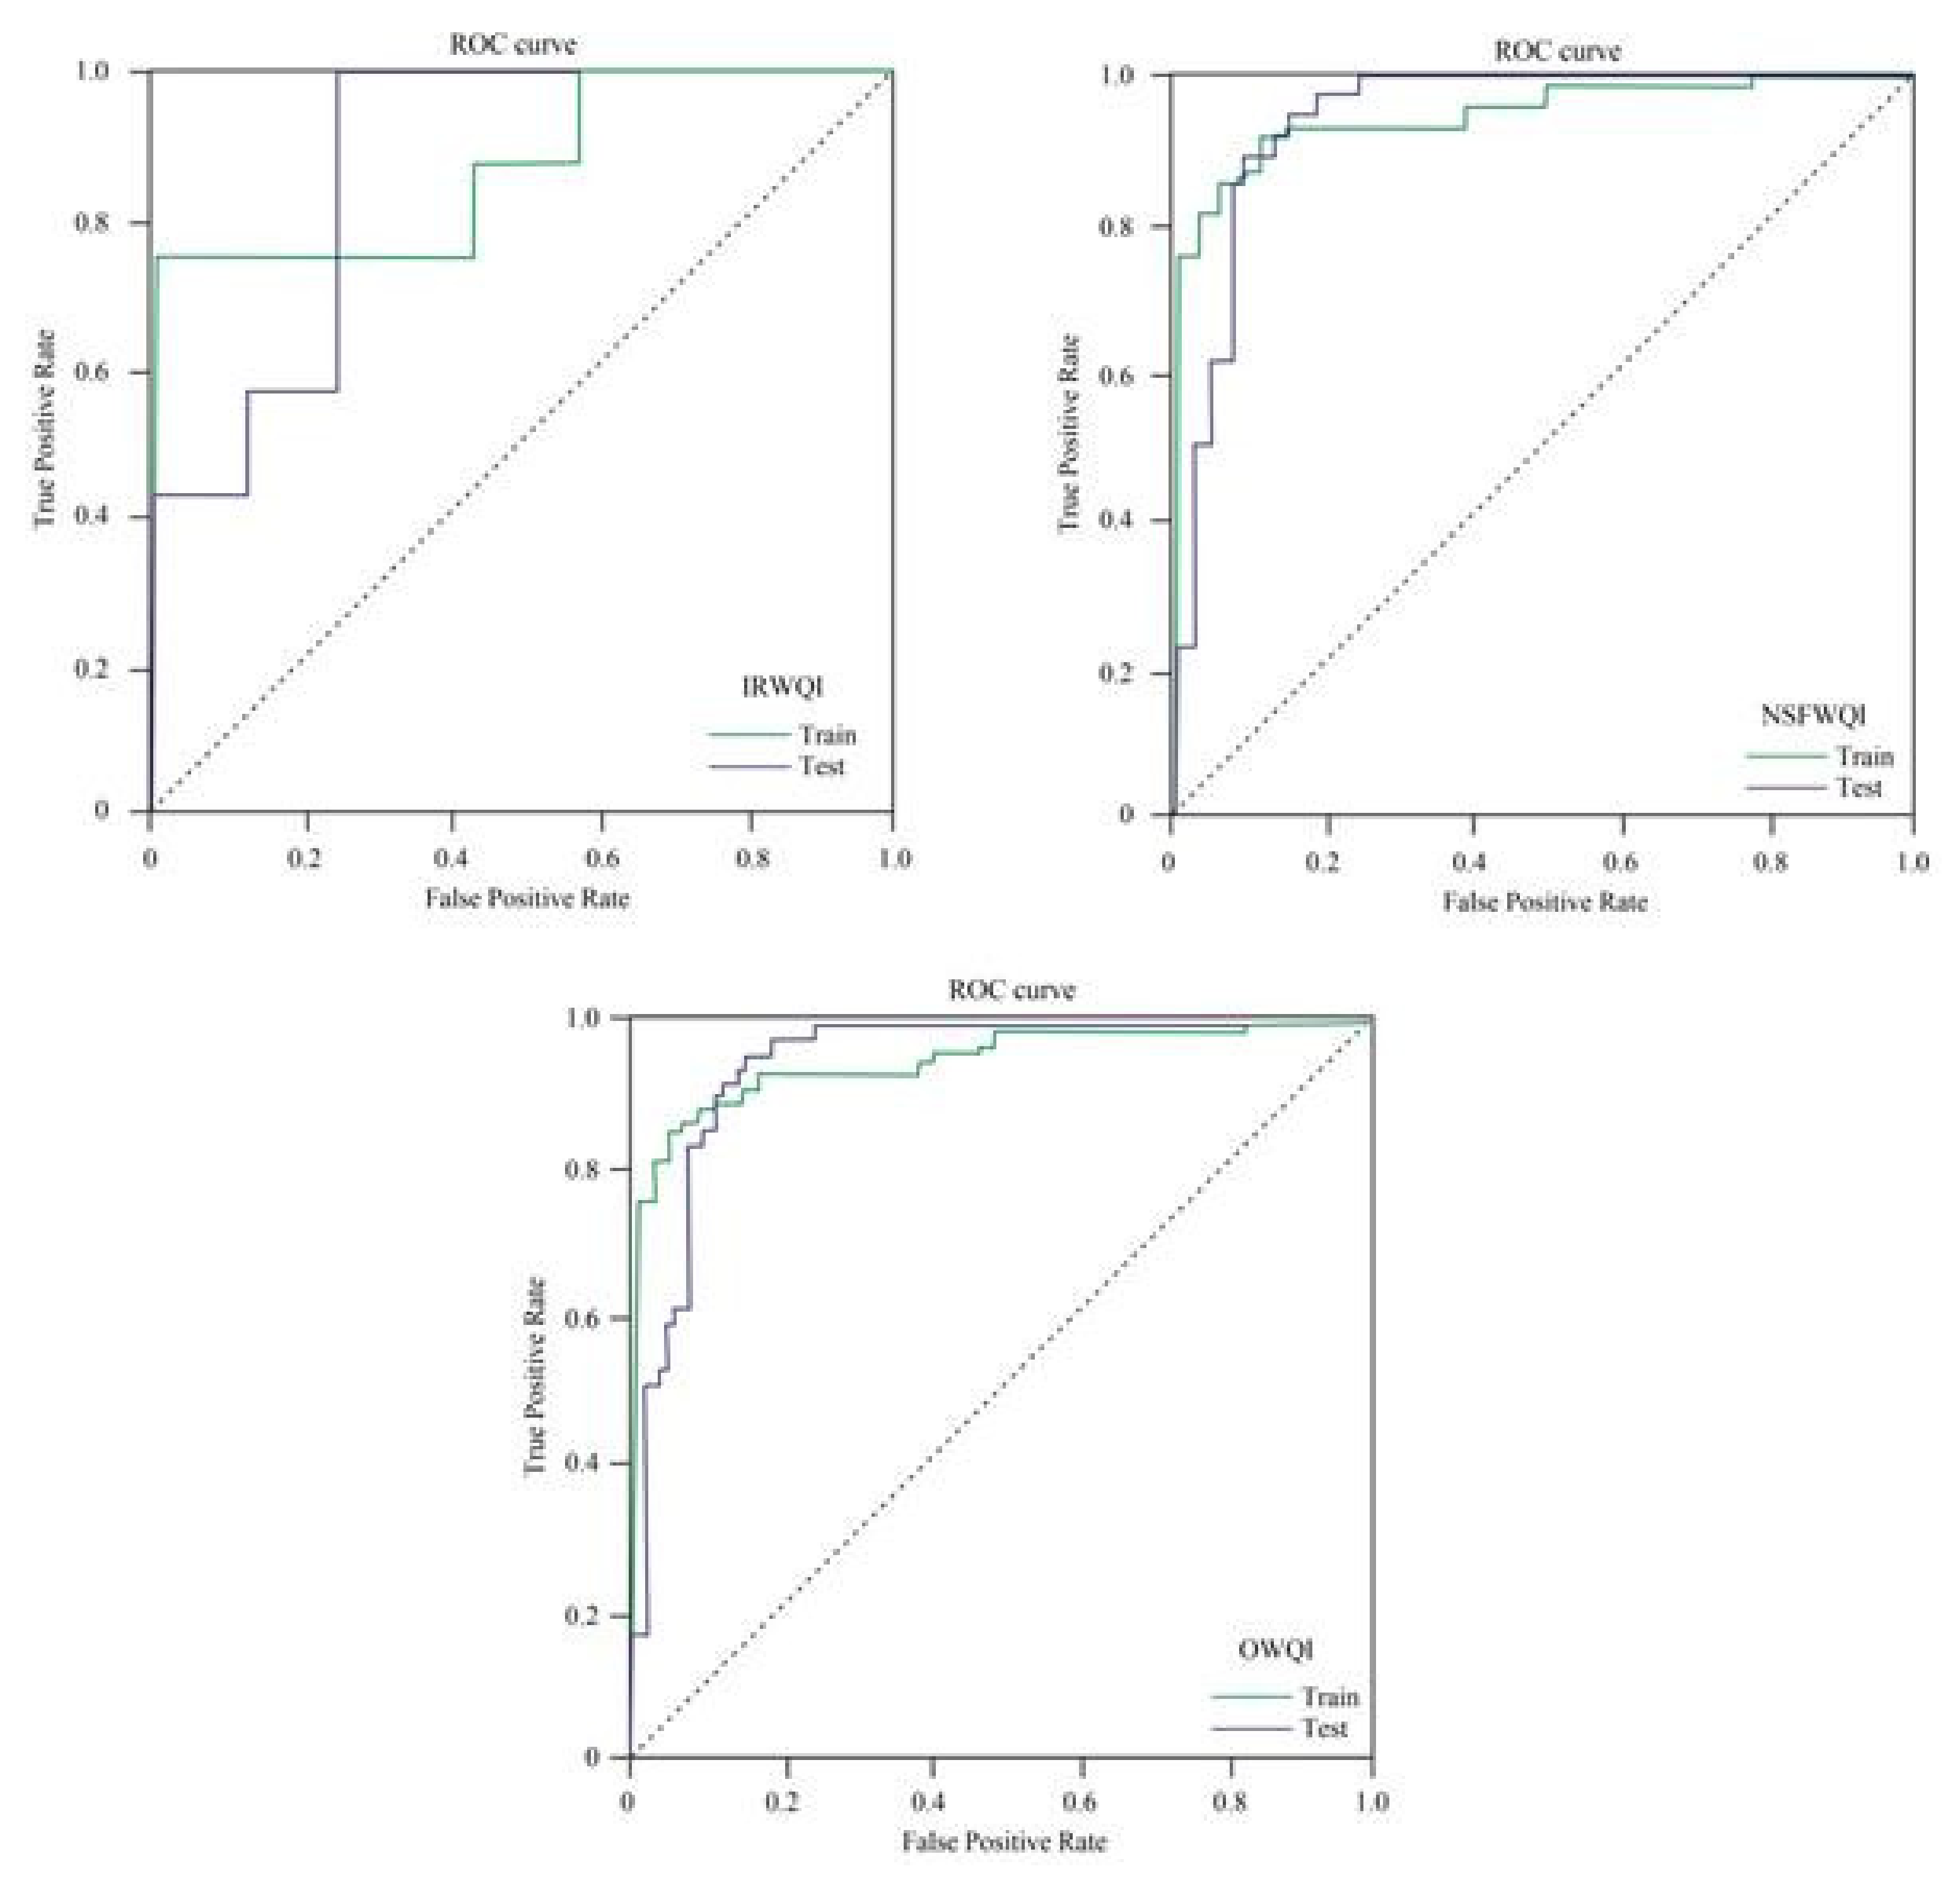
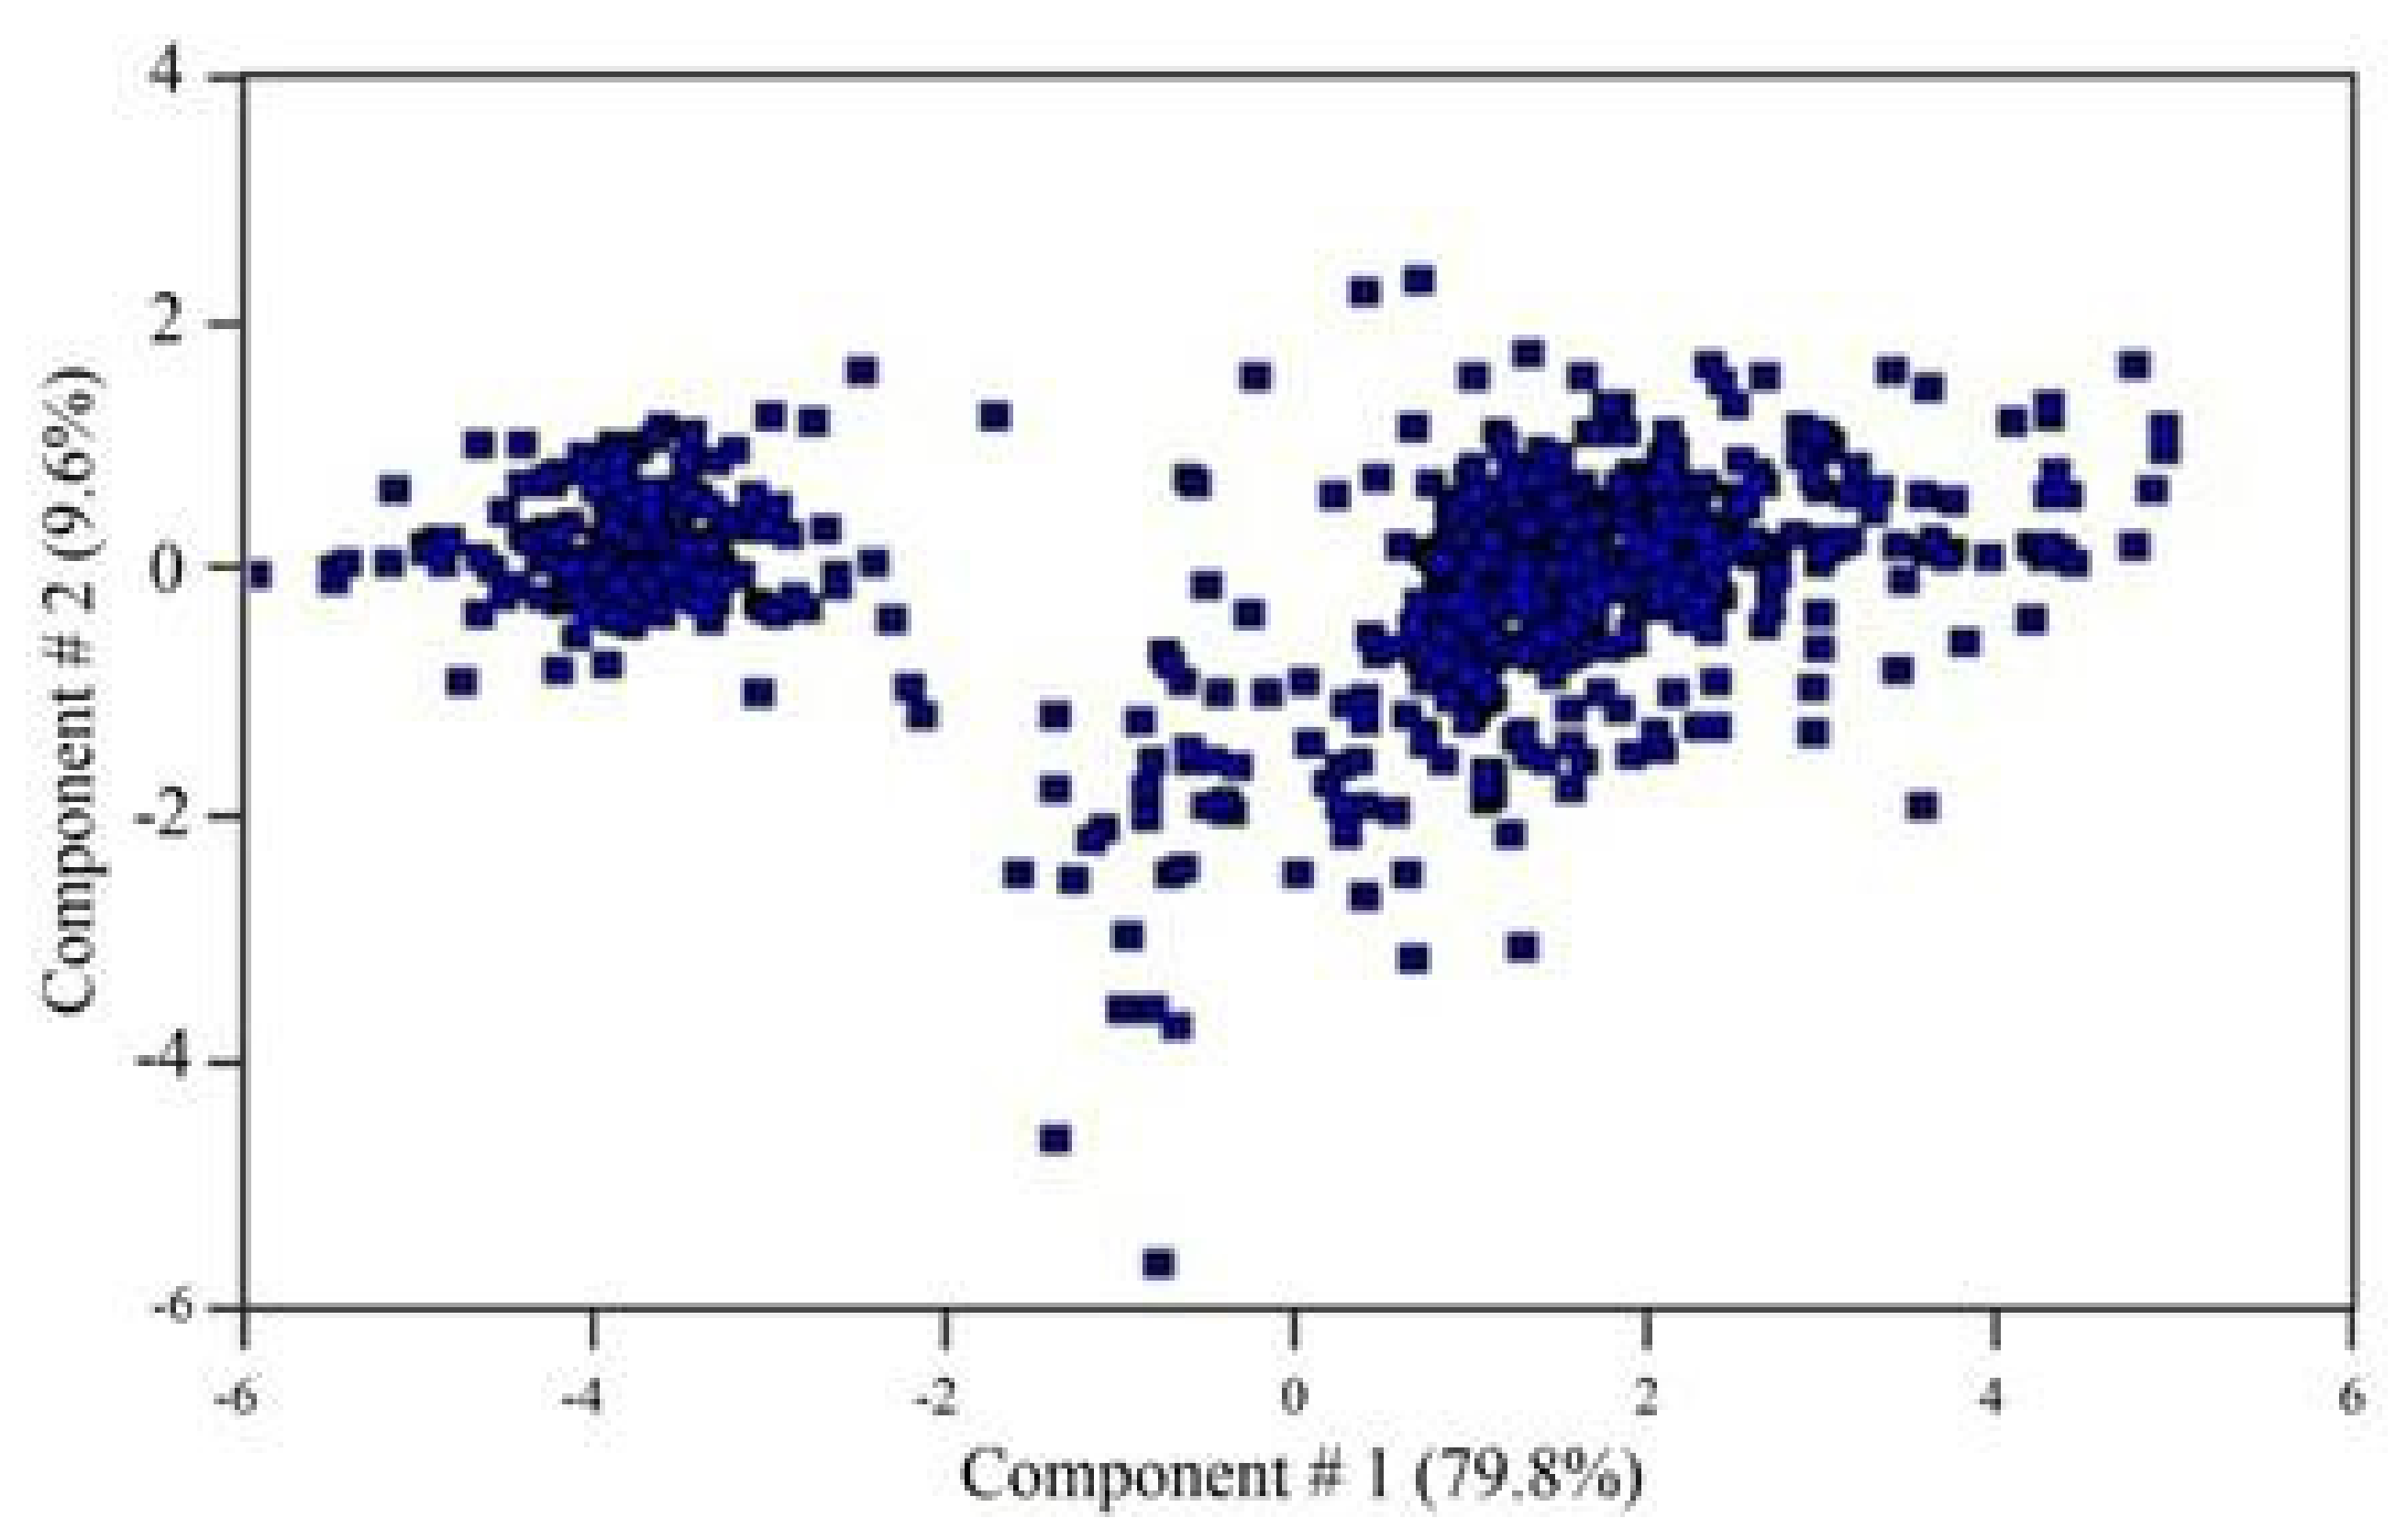
3.1. Quantitative Results

In the first step, IRWQI, NSFWQI and OWQI water quality indexes collected from the river with appropriate weighting are given to the MLP network. In the middle layer, with the sigmoid and ReLU functions and BP learning, the learning process takes place. Then the optimal weight indices with the least errors are selected. Based on the results of the values calculated for each of the indexes, it is determined that agricultural and industrial wastewater is the most prevalent cause of pollution in the Qarah-Chay River in Markazi Province. Also, the MSE function was used to check the network error; this amount of error decreased with an increase in the number of execution cycles. By using the Dense and Drope-out functions, an attempt was made to prevent the phenomenon of over-fitting. Figure 4 shows the status of MSE error changes for the IRWQI, NSFWQI and OWQI indexes.
According to Figure 4, computational errors (MSE) have a decreasing trend, and as a result, the model was able to continuously realize the extent of its erroneous estimates since the model can learn and retrain. Also, Figure 5 shows the performance of the model by generalizing the learning outcomes of the MLP to three categories of training, validation and test data.
In other words, Figure 5 shows the creation of uniformity in the learning process of the model, which shows the continuity of training and testing in the neural network. The results of performance evaluation criteria and Confusion Matrix including Precision, Recall and Accuracy are equal to 0.88, 0.84 and 0.88, respectively. Also, the results obtained from the performance evaluation and Confusion Matrix of the second MLP network for the output of alternatives and binary variables of optimal location of the monitoring station, which include Precision, Recall and F1, are equal to 0.69, 0.67, and 0.67, respectively.
According to the ROC curves estimated by the MLP model (Figure 6), which was used to evaluate the classification of water quality indexes in the training and experimental data set, it is indicated that the OA values and coefficients below the graph show high accuracy. Indeed, ROC’s results cover the accuracy estimated by the Confusion Matrix and emphasize the optimal performance and high accuracy of the MLP model.
Considering the location conditions of Qarah-Chay River and MLP model, suitable locations for river monitoring stations have been proposed (Figure 7).
The results of the proposed MLP model suggest six water quality monitoring stations according to the different degrees of water quality by the indexes for the Qarah-Chay River (Figure 7). As seen in the Figure 7, the susceptibility maps of the WQI indexes variations of the studied area are presented. Susceptibility maps provide the risk-ability rate from low-risk to high-risk zones for demonstration of the sensitivity of the predictive model regarding actual ground conditions [45,46]. Therefore, by conducting the susceptibility assessment, it will be easy to categorize the high risk area and establish controlling/modification strategies to improve the current conditions. The Figure (7) is providing the susceptibility classification that indicated in six risk-potential classes that indicated the quality indexes through the river. According to the figure, the east part of the river shows more quality than the west part. According to the evaluated data and maps, it can be said that the most important concentration of the proposed stations is in the downstream area of the river, where the concentration of flow is significant (Figure 8 and Figure 9). In addition, the gradient obtained after 13 MLP network training courses is equal to 0.062299. This gradient can be used to adapt information related to water quality indicators within stations.

3.2. Data Validation

The spatial approach and case implementation for the MLP model in this study caused the model to be not directly comparable with the achievements of other researchers. However, in order to validate and evaluate the capability of the proposed model, the Benchmark classification was used. This type of learning is actually general and extended learning that is used as a comparison for spatial models. In the present study, in order to evaluate the achievements and compare the MLP model, classifications such as Support Vector Machine (SVM), Decision Tree (DT), and Random Forest (RF) were used. These classifications are in fact like a neural network sub-branch of machine learning and operate in a supervised manner. Table 2 shows Accuracy, Precision, Recall and F1 of the above classifications along with the proposed method.
The results of the Table 2 show the optimal performance of the proposed MLP model for locating Qarah-Chay River water quality monitoring stations.

4. Discussion

In this research, the multilayer perceptron (MLP) neural network was used for the optimal location of the water quality monitoring station of the Qarah-Chay River in Markazi Province. The MLP with BP learning process and sigmoid function was used to train and classify water quality indicators such as IRWQI, NSFWQI and OWQI on the Qarah-Chay River. The network output, with 88% accuracy, finds the optimal location of water quality monitoring stations. The results of Figure 8 and Figure 9 and Table 2 show the optimal performance of the MLP in the optimal location of the monitoring station. Although extensive research has not been conducted on the use of the MLP model in locating monitoring stations along rivers, many researchers have used artificial neural networks and MLP algorithms to measure water quality in water bodies. For instance, [47] describes the application of artificial neural network (ANN) models for computing the total dissolved solids (TDS) level in Jajrood River (Iran). Two ANN networks, multi-layer perceptron (MLP) and radial basis function (RBF), were identified, validated and tested for the computation of TDS concentrations. Both networks employed five input water quality variables measured in river water over a period of 40 years. [48], to predict water quality parameters of Tireh River located at South West of Iran, a multilayer neural network model (MLP) developed. The T.D.S, Ec, pH, HCO3, Cl, Na, So4, Mg, and Ca as main parameters of water quality parameters were measured and predicted using the MLP model. The architecture of the proposed MLP model included two hidden layers in which eight and six neurons were considered at the first and second hidden layers. The tangent sigmoid and pure-line functions were selected as transfer function for the neurons in the hidden and output layers, respectively. [49] used the multilayer perceptron (MLP) method as an ANN method to generate temporal input data by learning the complex relationships of water quality variables from two types of water quality monitoring systems at major boundaries. A regular monitoring system analyzes 13 water quality variables in three layers monthly or weekly, while the automatic monitoring system analyzes eight surface water quality variables daily. [23] compared the Levenberg Marquardt (LM) algorithm and the Scaled Conjugate Gradient (SCG) algorithm to develop WQI based on the ANN approach (i.e., ANNWQI). It was observed that the LM algorithm outperforms the SCG algorithm for prediction of the ANNWQI of Indian streams, while the Bayesian Regularization algorithm was not found to be suitable for the same purpose in the present study. Also, it observed that both the LM and SCG algorithms generate robust predictions when the hidden layer contains ten neurons.
The main difference between this paper and other studies in this field is that most of the research has focused on the parameters of water pollution and predicting their distribution, while this research is beyond this level. Based on the available data (13 water quality parameters for three different indicators and the dispersion of polluting units around the river), we compared the efficiency of international and national indicators in locating the best river monitoring stations. Also, another difference between this study and other studies is the complexity of the structure of the MLP model in this study with other studies comparing the number of neurons used.
The artificial neural network algorithm used in this research is generally usable in other rivers of the Central Plateau of Iran, because the nature of the pressure factors on the rivers in this part of Iran, which depend on economic and agricultural factors, is almost the same. However, considering the climatic and geomorphological differences in each watershed can have a positive effect on improving the quality of the optimal location of monitoring stations.
Machine learning models (supervised or unsupervised) are always a function of the primary data set that can be used to improve their learning and to classify or predict the proposed alternatives with higher accuracy.
However, one of the disadvantages of an ANN is that it is a black box model, so it could not explain the mechanism happening inside the process. In ANN black box modeling, the output variables are predicted on the basis of their individual relations with the input variables. Therefore, in ANN modeling, the sample size or data must be large to prevent the overfitting prediction. Although extensive primary and educational data sets play a very important role in the model teaching and learning process, since the most important limitation to developing such models, particularly MLP, is the available database. This is because in order to run the model more accurately, in addition to water quality data, other data such as climatic and environmental information are needed, which in many cases can be difficult to prepare. In addition, due to the long length of rivers and the geomorphological diversity around the river, the application of topographic features in the model will be very time consuming and difficult and remain as the main obstacle in such studies.

5. Conclusions

The ANN approach is an effective tool for the prediction of parameters of an environmental ecosystem, particularly rivers, if a large quantity of data sets is available for the fulfilment of the required purpose. This approach overcomes the limitation of the uncertainty issue experienced by prevalent conventional water quality indexes. The ANN approach also gives an accurate prediction of the outcome, even if a mistake is committed in measuring or entering a few data in the datasheet, provided the ANN model is developed using a large number of data sets. To get the best prediction of outcome by the ANN model, a variety of data sets should be used, including the extreme cases. The ANN approach is also highly useful in environmental studies in order to predict the value of some of the parameters, which are difficult, time-consuming, or costly. These merits offered by the ANN approach make it a sought-after and quite useful technique for environmental and hydrological studies.
In this paper, the MLP network has been used for the optimal location of water quality monitoring stations of the Qarah-Chay River in Markazi Province, Iran. For this purpose, first by conducting field studies and using river information provided by various organizations, the general conditions of the area and the catchment area around the river have been determined. Then, using water quality indicators including IRWQI, NSFWQI and OWQI indexes, the parameters were weighted and entered into the MLP model as input data. The hidden or middle layer of the model was dedicated to calculations and performance measurements and was explained with the aim of optimal location (output layer). Furthermore, all simulation steps have been done in MATLAB R2021b software. The results of the study are examined by the Confusion Matrix and ROC, and finally the model is classified by SVM, DT, and RF. The results of these evaluations (six proposed monitoring stations) and comparisons show the optimal performance and high accuracy of the proposed model compared to the above classifiers.
Although this study uses a MLP network to optimally locate the water quality monitoring station, it was also suggested that future research in this area should include deep learning models such as DNN (Deep Neural Network) and CNN (Convolutional Neural Network). Also, in order to improve the accuracy of locating water monitoring stations on rivers, the use of weighting approaches, probabilistic and geo-statistical models, and environmental conditions, especially soil quality, should be used for more extensive and accurate modeling estimates. In addition, increasing number of sampling points could improve the accuracy of proposed method in similar climatic regions.
The proposed algorithm is not limited to the particular problem of water quality monitoring locations in a river network. The proposed idea can be adapted to the problems of other types of networks, such as sewerage and water distribution. The key idea underlying the proposed algorithm has the potential to contribute to the wider research community with regard to optimization practices for cases in which the cost function takes a similar form. Decision-makers can use the results of this study, in addition to the optimal location of water quality monitoring stations along the river, to better manage existing land use and future development plans, because in practice the results of this study indicate the areas with the highest levels of pollution are concentrated there (stations) and need very serious attention, especially upstream. The results of the use of the model provides important information that is used to fix issues in the study and management of water resources quality and are therefore useful for policymakers in helping build monitoring systems for the near future.

Author Contributions

Conceptualization: F.G.; software, validation, formal analysis, data curation, and writing—original draft preparation: A.H.; methodology, investigation, resources, and project administration: A.K.; visualization, supervision, funding acquisition, and writing—review and editing: C.F. All authors have read and agreed to the published version of the manuscript.

Funding

This research received no external funding.

Institutional Review Board Statement

Not applicable.

Informed Consent Statement

Not applicable.

Data Availability Statement

The data are available from the corresponding author upon reasonable request.

Acknowledgments

The authors are extremely grateful to the Markazi province Department of Environment, the Markazi province Meteorological Organization, the Markazi province Industry, Mining and Trade Organization, the Agriculture Organization of Markazi province, the Regional Water Company of Markazi, and the Iran National Cartographic Center, at both local and regional levels.

Conflicts of Interest

The authors declare no conflict of interest.

References

  1. Dimri, D.; Daverey, A.; Humar, A.; Sharma, A. Monitoring water quality of River Ganga Using Multivariate Techniques and WQI in Upper Ganga Basin of Uttarakhand, India. Environ. Nanotechnol. 2020, 15, 100375. [Google Scholar]
  2. Salman, R.; Nikoo, M.R.; Shojaeezadeh, S.A.; Bahman Beiglou, P.H.; Sadegh, M.; Adamowski, J.F.; Alamdari, N. A novel Bayesian maximum entropy-based approach for optimal design of water quality monitoring networks in rivers. J. Hydrol. 2021, 603, 126822. [Google Scholar] [CrossRef]
  3. UNEP. A Snapshot of the World’s Water Quality: Towards a Global Assessment. In Technical Report–United Nations Environment Programme; UNEP: Nairobi, Kenya, 2016. [Google Scholar]
  4. Kim, H.G.; Hong, S.; Jeong, K.S.; Kim, D.K.; Joo, G.J. Determination of sensitive variables regardless of hydrological alteration in artificial neural network model of chlorophyll a: Case study of Nakdong River. Ecol. Model. 2019, 398, 67–76. [Google Scholar] [CrossRef]
  5. Vega-Rodríguez, M.A.; Pérez, C.J.; Reder, K.; Flörke, M. A Stage-Based Approach to AllocatingWater Quality Monitoring Stations Based on the World Qual Model: The Jubba River as a Case Study. Sci. Total Environ. 2020, 762, 144162. [Google Scholar] [CrossRef] [PubMed]
  6. Banik, B.K.; Alfonso, A.; Torres, A.S.; Mynett, A.; Di Cristo, C.; Leopardi, A. Optimal placement of water quality monitoring stations in sewer systems: An information theory approach. Procedia Eng. 2015, 119, 1308–1317. [Google Scholar] [CrossRef] [Green Version]
  7. Lee, C.; Paik, K.; Yoo, D.G.; Kim, J.H. Efficient method for optimal placing of water quality monitoring stations for an ungauged basin. J. Environ. Manag. 2014, 132, 24–31. [Google Scholar] [CrossRef]
  8. Mahjouri, N.; Kerachian, R. Optimal Location of River Water Quality Monitoring Stations using the Discrete Entropy Theory: A Case Study. In Proceedings of the IWA World Water Congress and Exhibition, Vienna, Austria, 7–12 September 2008. [Google Scholar]
  9. Asadollahfardi, G.; Heidarzadeh, N.; Sekhavati, A.; Asadi, M. Optimization of water quality monitoring stations using dynamic programming approach, a case study of the Mond Basin Rivers. Iran. Environ. Dev. Sustain. 2008, 23, 2867–2881. [Google Scholar] [CrossRef]
  10. Varekar, V.; Yadav, V.; Karmakar, S. Rationalization of water quality monitoring locations under spatiotemporal heterogeneity of diffuse pollution using seasonal export coefficient. J. Environ. Manag. 2021, 277, 111342. [Google Scholar] [CrossRef]
  11. Park, S.Y.; Choi, J.H.; Wang, S.; Park, S.S. Design of a water quality monitoring network in a large river system using the genetic algorithm. Ecol. Model 2006, 199, 289–297. [Google Scholar] [CrossRef]
  12. Telci, I.T.; Nam, K.; Guan, J.; Aral, M.M. Optimal water quality monitoring network design for river systems. J. Environ. Manag. 2009, 90, 2987–2998. [Google Scholar] [CrossRef]
  13. Ozkul, S.; Harmancioglu, N.B.; Singh, V.P. Entropy-based assessment of water quality monitoring networks. J. Hydrol. Eng. 2000, 5, 90–100. [Google Scholar] [CrossRef] [Green Version]
  14. Karamouz, M.; Nokhandan, A.K.; Kerachian, R.; Maksimovic, C. Design of online river water quality monitoring systems using the entropy theory: A case study. Environ. Monit. Assess 2009, 155, 63–81. [Google Scholar] [CrossRef] [PubMed]
  15. Romić, D.; Castrignano, A.; Romić, M.; Buttafuoco, G.; Kovačić, M.B.; Ondrašek, G.; Zovko, M. Modelling spatial and temporal variability of water quality from different monitoring stations using mixed effects model theory. Sci. Total Environ. 2019, 704, 135875. [Google Scholar] [CrossRef]
  16. Najafzadeh, M.; Niazmardi, S. A Novel Multiple-Kernel Support Vector Regression Algorithm for Estimation of Water Quality Parameters. Nat. Resour. Res. 2021, 30, 3761–3775. [Google Scholar] [CrossRef]
  17. Najafzadeh, M.; Homaei, F.; Farhadi, H. Reliability assessment of water quality index based on guidelines of national sanitation foundation in natural streams: Integration of remote sensing and data-driven models. Artif. Intell. Rev. 2021, 54, 4619–4651. [Google Scholar] [CrossRef]
  18. Krtolica, I.; Cvijanović, D.; Obradović, D.; Novković, M.; Milošević, D.; Savić, D.; Vojinović-Miloradov, M.; Radulović, S. Water quality and macrophytes in the Danube River: Artificial neural network modelling. Ecol. Indic. 2021, 121, 107076. [Google Scholar] [CrossRef]
  19. Gajendran, C.; Srinivasamoorthy, K.; Thamarai, P. GIS and Geostatistical Techniques for Groundwater Science; Elsevier: Amsterdam, The Netherlands, 2019; pp. 153–164. [Google Scholar] [CrossRef]
  20. Saber, A.; James, D.E.; Hayes, D.F. Estimation of water quality profiles in deep lakes based on easily measurable constituents at the water surface using artificial neural networks coupled with stationary wavelet transform. Sci. Total Environ. 2019, 694, 133690. [Google Scholar] [CrossRef]
  21. Zhang, L.; Han, X.; Yuan, B.; Zhang, A.; Feng, J.; Zhang, J. Mechanism of purification of low-pollution river water using a modified biological contact oxidation process and artificial neural network modeling. J. Environ. Chem. Eng. 2021, 9, 104832. [Google Scholar] [CrossRef]
  22. Kadiyala, P.K.; Chattopadhyay, H. Optimal location of three heat sources on the wall of a square cavity using genetic algorithms integrated with artificial neural networks. Int. Commun. Heat Mass Transf. 2011, 38, 620–624. [Google Scholar] [CrossRef]
  23. Nayak, J.G.; Patil, L.G.; Patki, V.K. Artificial neural network based water quality index (WQI) for river Godavari (India). Mater. Today Proc. 2021, 52. [Google Scholar] [CrossRef]
  24. Sarkar, A.; Pandey, O. River water quality modelling using artificial neural network technique. Aquat. Procedia 2015, 4, 1070–1077. [Google Scholar] [CrossRef]
  25. Jahangir, M.H.; Reineh, S.M.M.; Abolghasemi, M. Spatial predication of flood zonation mapping in Kan River Basin, Iran, using artificial neural network algorithm. Weather Clim. Extrem. 2019, 25, 100215. [Google Scholar] [CrossRef]
  26. Zhu, H.; Leandro, J.; Lin, Q. Optimization of Artificial Neural Network (ANN) for Maximum Flood Inundation Forecasts. Water 2021, 13, 2252. [Google Scholar] [CrossRef]
  27. Chang, F.J.; Chiang, Y.M.; Chang, L.C. Multi-step-ahead neural networks for flood forecasting. Hydrol. Sci. J. 2007, 52, 114–130. [Google Scholar] [CrossRef]
  28. Mitrović, T.; Antanasijević, D.; Lazović, S.; Perić-Grujić, A.; Ristić, M. Virtual water quality monitoring at inactive monitoring sites using Monte Carlo optimized artificial neural networks: A case study of Danube River (Serbia). Sci. Total Environ. 2019, 654, 1000–1009. [Google Scholar] [CrossRef]
  29. Beck, M.W. NeuralNetTools: Visualization and Analysis Tools for Neural Networks. J. Stat. Softw. 2018, 85, 1–20. [Google Scholar] [CrossRef]
  30. Mitra, S.; Rashmi, N. An approach to utilize artificial neural network for runoff prediction: River perspective. Mater. Today Proc. 2021, 52. [Google Scholar] [CrossRef]
  31. Qiu, R.; Wang, Y.; Wang, D.; Qiu, W.; Wu, J.; Tao, Y. Water temperature forecasting based on modified artificial neural network methods: Two cases of the Yangtze River. Sci. Total Environ. 2020, 737, 139729. [Google Scholar] [CrossRef]
  32. Raid, S.; Mania, J. Rainfall-runoff model using an artificial neural network approach, Math. Comput. Modell 2004, 40, 839–846. [Google Scholar] [CrossRef]
  33. Chanu, S.N.; Kumar, P. Application of multilayer perceptron based artificial neural network for modeling of rainfall runoff in a Himalayan. In Proceedings of the 8th International Conference on Recent Innovations in Science, Engineering and Management, New Delhi, India, 21 October 2016; p. 15. [Google Scholar]
  34. Abiodun, O.I.; Jantan, A.; Omolara, A.E.; Dada, K.V.; Mohamed, N.A.; Ar-Shad, H. State-of-the-art in artificial neural network applications: A survey. Heliyon 2018, 4, e00938. [Google Scholar] [CrossRef] [Green Version]
  35. Sarker, I.H. Machine Learning: Algorithms, Real-World Applica-tions and Research Directions. SN Comput. Sci. 2021, 2, 160. [Google Scholar] [CrossRef] [PubMed]
  36. Velasco, L.C.P.; Serquina, R.P.; Abdul Zamad, M.S.A.; Juanico, B.F.; Lomocso, J.C. Week-ahead Rainfall Forecasting Using Multilayer Perceptron Neural Network. Procedia Comput. Sci. 2019, 161, 386–397. [Google Scholar] [CrossRef]
  37. Markazi Province Department of Environment. Water Quality Study Plan of Qarah-Chay in Markazi Province. Reports and Maps Unit, Executive Deputy 2020; Markazi Province Department of Environment: Arak, Iran, 2020.
  38. Khosravi, A.; Syri, S. Modeling of geothermal power system equipped with absorption refrigeration and solar energy using multilayer perceptron neural network optimized with imperialist competitive algorithm. J. Clean. Prod. 2020, 276, 124216. [Google Scholar] [CrossRef]
  39. Ewees, A.A.; Elaziz, M.A.; Alameer, Z.; Ye, H.; Jianhua, Z. Improving multilayer perceptron neural network using chaotic grasshopper optimization algorithm to forecast iron ore price volatility. Resour. Policy 2020, 65, 101555. [Google Scholar] [CrossRef]
  40. Jin, D.; Lin, S. Advances in Computer Science and Information Engineering; Springer: Berlin/Heidelberg, Germany, 2012. [Google Scholar]
  41. Shadkani, S.; Abbaspour, A.; Samadianfard, S.; Hashemi, S.; Mosavi, A.; Band, S.B. Comparative study of multilayer perceptron-stochastic gradient descent and gradient boosted trees for predicting daily suspended sediment load: The case study of the Mississippi River, U.S. Int. J. Sedim. Res. 2021, 36, 512–523. [Google Scholar] [CrossRef]
  42. Haykin, S.S. Neural Networks and Learning Machines; Prentice Hall: Hoboken, NJ, USA, 2009. [Google Scholar]
  43. Yonaba, H.; Anctil, F.; Fortin, V. Comparing Sigmoid Transfer Functions for Neural Network Multistep Ahead Streamflow Forecasting. J. Hydrol. Eng. 2010, 15, 275–283. [Google Scholar] [CrossRef]
  44. Aggarwal, C.C. Neural Networks and Deep Learning: A Textbook; Springer: New York, NY, USA, 2018. [Google Scholar]
  45. Buduma, N.; Locascio, N. Fundamentals of Deep Learning: Designing Next-Generation Machine Intelligence Algorithms; O’Reilly Media: New York, NY, USA, 2017. [Google Scholar]
  46. Mudashiru, R.B.; Sabtu, N.; Abustan, I. Quantitative and semi-quantitative methods in flood hazard/susceptibility mapping: A review. Arab. J. Geosci. 2021, 14, 941. [Google Scholar] [CrossRef]
  47. Niroobakhsh, M. Prediction of water quality parameter in Jajrood River basin: Application of multi layer perceptron (MLP) perceptron and radial basis function networks of artificial neural networks (ANNs). Afr. J. Agric. Res. 2012, 7, 4131–4139. [Google Scholar] [CrossRef]
  48. Qishlaqi, A.; Kordian, S.; Parsaie, A. Field measurements and neural network modeling of water quality parameters. Appl. Water Sci. 2017, 7, 523. [Google Scholar] [CrossRef] [Green Version]
  49. Kim, J.; Seo, D.; Jang, M.; Kim, J. Augmentation of limited input data using an artificial neural network method to improve the accuracy of water quality modeling in a large lake. J. Hydrol. 2021, 602, 126817. [Google Scholar] [CrossRef]
Figure 1. Location of Qarah-Chay River in Markazi Province.
Water 14 00870 g001
Figure 2. Maps of input data locations.
Water 14 00870 g002
Figure 3. The flowchart of the proposed method.
Water 14 00870 g003
Figure 4. MSE error changes for IRWQI, NSFWQI and OWQI indexes.
Water 14 00870 g004
Figure 5. Diagram of changes in train, validation and test of model by generalizing the learning outcomes by MLP (a): The performance of model by generalizing the learning outcomes by MLP; (b): The error changes for training and experimental datasets).
Water 14 00870 g005
Figure 6. ROC change curve for NSFWQI, IRWQI and OWQI indices.
Water 14 00870 g006
Figure 7. Classification of IRWQI, NSFWQI and OWQI indexes by MLP model (a): NSFWQI; (b): IRWQI; (c): OWQI.
Water 14 00870 g007aWater 14 00870 g007b
Figure 8. Gradation diagram of places classified with the MLP network.
Water 14 00870 g008
Figure 9. Histogram of the distribution of changes in output alternatives in the MLP model.
Water 14 00870 g009
Table 1. The type of water quality parameters used in the water quality indexes.
IndexParameter
PHTTURDOBOD5NO3PO4FCTSCODTHECNH4
IRWQI
NSFWQI
OWQI
Table 2. Accuracy, Precision, Recall and F1 of the SVM, DT, RF and proposed method classification.
F1RecallPrecisionAccuracy
SVM0.560.600.550.60
DT0.560.620.450.40
RF0.370.820.510.42
Proposed Method0.850.840.880.88
Publisher’s Note: MDPI stays neutral with regard to jurisdictional claims in published maps and institutional affiliations.

