
Water, Energy, and Emissions Nexus: Effect of Inflows in Urban Drainage Systems


1
Urban Water Unit, National Laboratory for Civil Engineering, LNEC, Av. Brasil 101, 1700-066 Lisbon, Portugal
2
CERIS, Instituto Superior Técnico, Universidade de Lisboa, Av. Rovisco Pais, 1049-001 Lisbon, Portugal
*
Author to whom correspondence should be addressed.
Water 2022, 14(6), 868; https://doi.org/10.3390/w14060868
Submission received: 28 January 2022
/
Revised: 25 February 2022
/
Accepted: 8 March 2022
/
Published: 10 March 2022
(This article belongs to the Special Issue Efficient Water and Energy Management in Urban Water Systems)
Abstract
:The urban water sector significantly contributes to energy consumption and greenhouse gas (GHG) emissions. Detailed assessment of the wastewater system input provides opportunities for improving the water, energy, and emissions nexus. The inflow of water not requiring treatment into wastewater systems is acknowledged worldwide. These undue inflows can increase the footprint of these systems. Together with flooding and discharges, monitoring of undue inflows is not a common practice in water utilities. Three levels of analysis are proposed to assess the magnitude of the impact of undue inflows in the water–energy–greenhouse gas (W-E-G) emissions nexus: at a national level, calculation of performance indicators using yearly data; at the utility level, performance indicators calculations using yearly, monthly, and sub-daily data; at the subsystem level, calculations using mathematical modeling. Results show the implications of undue inflows on energy and GHG emissions, including the effect of flooding and discharges. The importance of undue inflows in the W-E-G nexus is sustained by the results of three case studies in Portugal. Each level of analysis is tailored to the information available, allowing a step-by-step understanding of the relationship between water, energy consumption, and emissions of the urban drainage inflows.
1. Introduction
The relevance of the interdependence between water, energy, and greenhouse gas (GHG) emissions is widely acknowledged [1,2,3,4]. An effective reduction in GHG emissions in all anthropogenic activities requires global and urgent action, as clearly stated in the latest IPCC report [5]. The environmental and societal burden of high energy consumption, heavily based on fossil fuels and increasing costs to consumers, is problematic in all sectors, the water sector not being an exception [6]. Significant efforts are pursued to increase the use of non-fossil energy sources. Even so, the primary energy consumption (i.e., the total energy demand of a country) from fossil fuels in the world, North America, and Europe still correspond to a share of 84.3%, 81.7%, and 73.6%, respectively, values for 2019 [7].
Many studies can be found on the water–energy nexus for water to energy production, but few exist on the energy for the water sector [1,8]. The latter often comprises the energy used for water heating having a relevant share [8,9,10]. The urban water sector has a substantial contribution to energy consumption and the production of GHG emissions. Opportunities to reduce the footprint on this nexus are also recognized, including the change in energy sources, the reduction in the specific energy consumption, the energy recovery, and emissions reduction [1,8,11,12,13,14,15]. Global statistics, for the urban water sectors, are not readily available, given the sector ill-defined boundaries, a high number of actors involved, and intertwined issues [1,8,16]. Broad information on the energy consumption share for the water sector is not currently available nor easy to find [9,17].
The energy consumption for water has links to many areas in our society. Studies using life cycle assessment (LCA) provide a comprehensive picture of the water, energy, and GHG emissions nexus and are of value to support decision making accounting for their interdependencies [1,2,4,8,13,18]. Challenges in these approaches are the scale of the studies, detail of the individual processes, and data reliability and compatibility [13,17,19]. Figure 1 identifies the water sector processes, showing those managed by service providers in urban areas. Utilities managing drinking water (grey shade) and wastewater (blue shade) are not involved in the energy consumption related to all uses, for instance, uses inside the household (e.g., energy used for residential water heating has typically a high value [10]). On the other hand, electricity distribution utilities do not have the means to separate the energy consumption fraction linked to water at end-users. Therefore, bridging the global versus processes assessments are essential to consolidate and clarify the context and scope of the different studies and promote a common language and approach.
The water supply and wastewater sectors, represented with grey and blue shaded boxes in Figure 1, respectively, have a significant energy footprint. These sectors are typically managed by water utilities (water supply and wastewater systems). Water losses and undue inflows have a direct influence on the system performance, including impacts on system processes’ efficiency, total energy consumption, and associated costs (among other variables).
An estimate of energy consumption in this sector is presented by [9], based on average energy intensities by region for each process. The results provide a worldwide estimate of 120 Mtoe (million tonnes of oil equivalent) of energy (2014), of which 60% is consumed as electricity. This electricity consumption is equivalent to 4% of worldwide energy consumption. The remaining 40% are as fuel and natural gas. According to this publication, the energy associated with water losses or leakage is significant. The estimate for wastewater systems corresponds to 1% of worldwide energy consumption. Factors influencing the energy consumption are “the share of wastewater collected and treated, the groundwater infiltration and rainfall into the sewage system, the treatment level, the contamination level and the energy efficiency of operations”. The reduction in inflows not requiring treatment is considered a way to reduce consumption. As an example, reported by publication [9], in Germany, wastewater, strictly defined, accounts for only 50% of the water treated in wastewater treatment plants (WWTP), the remaining 50% being undue inflows (UI).
Scenarios for energy consumption by the water supply and wastewater sector are of steady growth, even considering measures to reduce energy consumption in individual processes [9,10]. The deterioration over time of system components (e.g., pipes, manholes) contributes to the increase in inflows not requiring treatment.
Causes of these UI into wastewater systems are associated with groundwater infiltration, rain-derived inflows, among others [20,21]. Average values of undue inflows into wastewater systems reported for Norway, Denmark, Finland, and Sweden are between 30% and 80% [22], values estimated considering average dry weather flows and these authors discuss the uncertainty related to the methods used, also resulting from calculations using time-aggregated volumes, yearly.
The GHG emissions associated with energy consumption in the wastewater sector are substantial. Direct and indirect GHG emissions integrate CO2 emissions related to energy consumption and others not linked to energy consumption, such as methane (CH4) and nitrous oxide (N2O) emissions, mainly in wastewater systems [8,15,23,24,25]. Specific data on the water, energy, and emissions nexus in the sector, reported for individual regions or countries, can be found in the literature e.g., [1,8,9,17,24].
Within the urban water cycle, the water, energy, and emissions nexus has been analyzed for the drinking water and wastewater sector, including embedded energy associated with leakage in water supply systems and UI (including groundwater infiltration and rain-derived inflows) in wastewater systems [2,4]. However, few detailed studies incorporating this issue were found [2,22,26].
A knowledge gap is identified on the consideration of the UI and overflows, the latter either at overflow structures or flooding not returning to the system. It was found by [2] that the infiltration and inflow to the sewer network are major contributors to the water footprint but did not account for overflows. The quantification of these undue inflows is complex and not carried out systematically. Few studies consider the implications of UI in the water, energy, and emissions nexus; when included, the issue is not approached comprehensively, and the relevance and uncertainties of UI are not recognized.
Previous studies on strategic and tactical assessments of wastewater utilities provide the background for proceeding with this analysis, looking at the water, energy, and emissions nexus [27,28,29]. Results showed that service provision objectives are compromised by overflow discharges and surface flooding, even if not regularly quantified. A major cause for these events is the large volume of UI; the quantification of these volumes remains a challenge because of the limited measurements available in drainage systems. These studies addressed this issue, and metrics are proposed for direct and indirect estimation of the magnitude of UI. The latter includes assessing volumes’ seasonality, confirmed by correlation with rainfall and allowed for some quantification of the magnitude of the problem. Seasonality of inflows to WWTP and seasonality related to rainfall confirmed the significance of UI volumes. The direct assessment was carried out for sub-catchments with continuous monitoring, allowing a better estimate of UI. Results regarding specific energy consumption, energy consumption per population equivalent, and specific GHG emissions (associated with total wastewater volume) ranged from poor to good performance, depending on the utility.
This paper analyzes and discusses the use of energy by wastewater utilities and the respective GHG emissions, focusing on the effect of UI. A three-level approach for assessing the use of energy, based on data collection and analysis and performance assessment metrics calculation is proposed and applied to case studies. The assessment levels are specified depending on data availability and to allow applications accordingly. A detailed assessment is presented, providing a deeper insight into the water, energy, and greenhouse gas (W-E-G) components at the utility level. The effectiveness of measures to reduce UI and the associated energy consumption and emissions are discussed. Results show the implications of UI on energy consumption and GHG emissions, including the effect of flooding and discharges.
The paper presents the following novel contributions: (i) the discussion of the importance of UI volumes in treated wastewater, often overlooked, on the W-E-G nexus; (ii) the integration of overflows in the analysis; and (iii) the assessment of the magnitude of the problem using performance indicators including overflows, tailored to the information available.
2. Methodology
2.1. Context, Scope, and Data
This paper focuses on energy for water, concentrating on the operation of the drainage subsector in urban, peri-urban, and rural agglomerations. This approach includes the blue shadowed components in Figure 1 (not accounting for the needs for construction or rehabilitation of new assets). End-use energy consumption is also excluded (e.g., residential pumping) since it is out of the direct control of the wastewater utility. WWTP were not included herein, although the methodology can be extended to incorporate other components, such as treatment processes.
For the emissions, only indirect CO2 emissions related to energy consumption are included, since non-CO2 emissions’ broad estimations require data not available on a wider scale. The wastewater processes’ non-CO2 emissions are assumed to have minor variation associated with UI when compared to a situation with only wastewater inflows requiring treatment.
The CO2 emissions associated with the energy consumed by the wastewater utility for the system operation are given by:
where is the energy consumption associated with the type of energy i (kWh/year), is the emission factor of the type of energy i (kgCO2 eq/kWh), and n is the number of energy types. For Portugal, the emission factor used is 0.47 kgCO2 eq/kWh according to legislation [30].
The proposed approach to assess the impact of undue inflows on the W-E-G nexus is organized in three levels of analysis. The first is a national level assessment, using yearly public data. The second is a utility level assessment using available data from a subset of nine utilities, with a more detailed approach for yearly data, monthly data, and sub-daily measurements from sub-catchments. The third is the subsystem level assessment, using detailed calculations, including overflows and flooding, based on mathematical modeling.
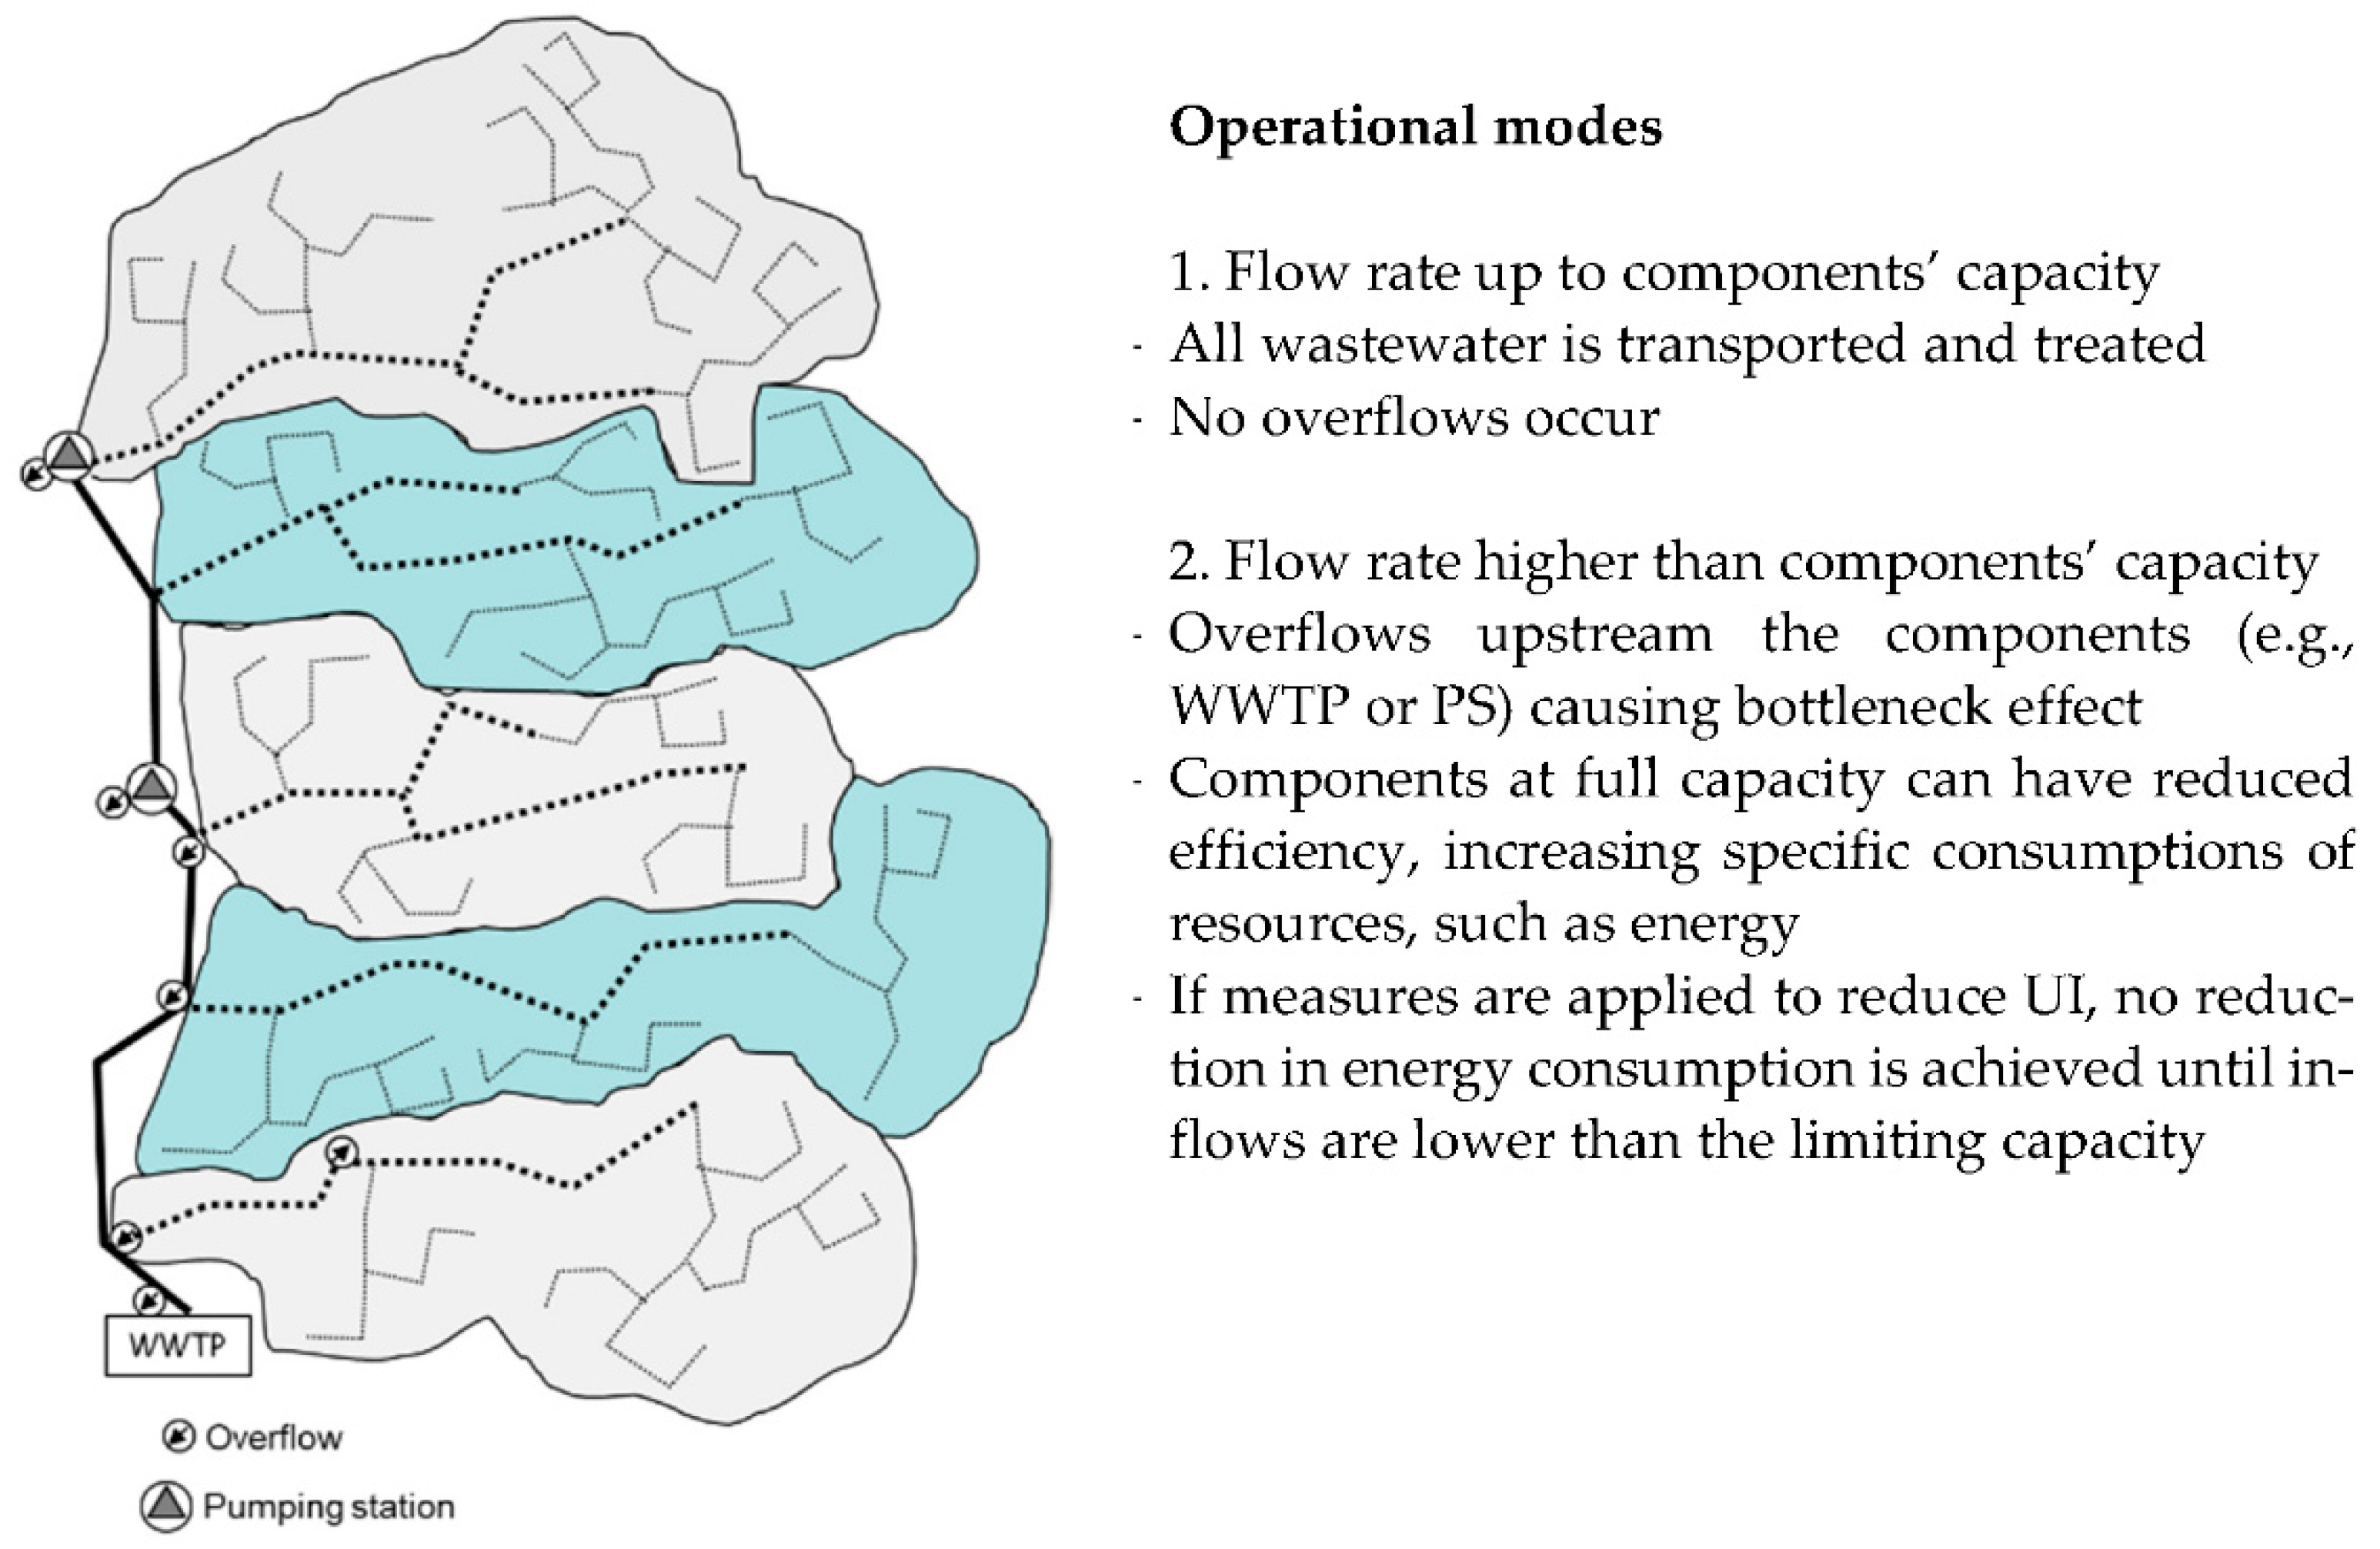
The comprehensive assessment of energy consumption, emissions, and effect of UI for wastewater systems requires an integrated perspective considering the boundaries of the system and its components capacity (e.g., WWTP or pumping stations, PS) (Figure 2). This is especially relevant when estimating potential reductions impacting the W-E-G nexus. Even if measures to reduce UI are applied, these might not have an immediate impact on energy and emissions reduction. A reduction in energy consumption and GHG emissions can only be achieved when inflows are equal to or lower than the components’ maximum capacity.
2.2. Evaluation of the Effect of UI on the W-E-G Nexus
Specific and quantitative performance assessment metrics were proposed to obtain an evaluation of the W-E-G nexus that is essential to carry out a proper diagnosis and to support the application of improvement measures. These metrics were used for the three levels of analysis, as indicated in Table 1. Performance metrics (Pi) regard energy consumption (P1–P3), seasonality (P4–P7), effects of UI (P8–P10), and GHG emissions (P11–P14).
The selection of the reference values for P14 will be carried out in future work. Different reference values are used for type A (wastewater bulk transport and treatment) and type B utilities (collection and transport, sometimes including treatment) when justified. Good performance values are presented in green, fair performance in yellow, and poor performance in red in both Table 1 and the presentation of results. The description and formulation of the novel metrics proposed are detailed in Appendix A (Table A1).
2.3. Assessment at a National Level
At a national level, only annual and aggregated data are normally available. Two performance metrics were proposed at the national level (see P1 and P11 in Table 1).
Additionally, at this level, it is of utmost importance to analyze the reported energy consumption and volumes of wastewater collected or treated, as well as data from floods and discharges, even though these data are few and typically qualitative. All these variables were analyzed graphically together with the annual rainfall data to assess the magnitude of the problem and to compute the correlation between variables.
2.4. Assessment at the Utility Level
At the utility level, a set of performance metrics was proposed in Table 1 to deepen the assessment concerning the impact of UI on energy. At this level, besides yearly data, monthly data is frequently available, allowing for the evaluation of seasonal variations, quite relevant in wastewater systems. However, monthly data can still dampen the analysis of the phenomena behind wastewater flows. Groundwater inflow, rain-derived surface flow and sanitary discharges, among others, show rapid sub-hourly variations, making it relevant to investigate sub-hourly data to quantify the undue inflow volumes and assess their impact on energy consumption and emissions. Besides infiltration and rain-derived inflows, several other UI (e.g., saline waters) can occur. If so, the corresponding metrics can be included, such as P9 and P10 in Table 1.
Among the metrics applicable at the utility level, four (P4–P7) use monthly wastewater volumes, energy consumption or precipitation data and can be applied to utilities that already monitor monthly volumes downstream from the entire system or sectorial drainage basins. Whenever detailed monitoring is available, upstream of a PS or a WWTP, the complementary three metrics (P8–P10) can be calculated, using sub-daily flow and precipitation data. For metric P9, sub-daily data on dry and wet weather seasons is required. For metric P10, detailed data on several precipitation events is required.
To calculate the global volume of undue inflows, it is necessary to process the daily flow patterns from the hourly flow and precipitation data. Calculation of the specific undue inflows (infiltration and rain-derived inflows) requires 15 min interval (or less) data on flow and precipitation, as in [29,31].
Metrics P3 and P14 use measurements of the discharges and overflows that occur in the system, allowing a comprehensive assessment of the actual volumes that are, at some point, transported in the sewers. Since discharged and overflow volumes are often unavailable for the complete system operated by the utility, a more detailed assessment is not proposed, but can be included whenever such data are attainable. Such detailed assessment is proposed at the subsystem level.
2.5. Assessment at Subsystem Level
At a subsystem level, the identification of the impact of UI in energy consumption at PS or WWTP is very important and benefits from adopting an integrated analysis, including processes, such as flooding and discharges. The integrated analysis is essential to assess the advantages of acting in UI to reduce energy consumption and GHG emissions. For this purpose, the total equivalent energy associated with the drainage basin upstream of a PS can be calculated. This energy is the total energy needed to pump the entire volume generated in the region if there were no limitations in the network transport capacity upstream of the PS. It corresponds to an estimate of the energy consumed if no discharges and floods occur and the entire volume generated is pumped [20,21,32].
Specific energy associated with UI suggests a substantial energy-saving potential by improving and investing in the control of UI, particularly in these systems located upstream of PS and WWTP. This study intends to raise awareness of water utilities about the energy savings potential from reducing UI, being fully effective only when exceedance volumes are negligible, as referred to in Figure 2.
This approach looks at the entire system upstream to assess the effect of UI on a PS and allows a better interpretation of the benefits associated with inflows reduction. It also highlights the importance of measuring flows at discharge structures because of their environmental effect and impact on energy consumption and emissions.
To estimate the energy consumption associated with the exceedance volumes (discharges and floods), a simplification based on an average unit energy consumption was adopted. Thus, the total equivalent energy consumption, , is given by:
where is the volume generated in the PS served area in the period of analysis (m3), and is the unit average energy consumption per unit of volume (kWh/m3). The calculation of EU is based on the actual energy intensity, i.e., the consumption per pumped volume. As a simplification, the PS efficiency is assumed to be constant.
The method for UI impact assessment in the energy consumption of PS is composed of four steps [32]:
- (i)
- Characterization of the reference situation, i.e., system behavior for dry weather.
- (ii)
- Analysis of the effect of an energy-saving measure focusing on the control of undue inflows, namely the reduction in undue rain-derived inflows to separative wastewater system considering scenarios of 100%, 75%, 50%, 25%, and 10% reduction.
- (iii)
- Analysis of the effect of an energy-saving measure focusing on the control of undue inflows, namely the reduction in groundwater inflows infiltration considering infiltration rates of 100%, 75%, 50%, 25%, and 10% of the daily dry weather volume, uniformly distributed by the total sewer extension.
- (iv)
- Performance assessment based on selected metrics to support evaluation of W-E-G components by the utility as presented in Table 1: P3, P12, and P14.
This procedure can be used for any installation (WWTP, PS, or other energy-consuming assets) using flow measurement data or mathematical modeling, as in the present study. Alternative simplified approaches can be used [32].
3. Case Studies
At a national level, the analysis of the data reported by the wastewater utilities to the Portuguese regulator [33] was analyzed. This Portuguese regulatory system for services assessment is compulsory for all water, wastewater, and waste services providers and annual data is publicly available.
In the Portuguese wastewater sector, the same utilities handle wastewater bulk transport and treatment (Type A utilities) and others the collection and transport, sometimes including treatment (Type B utilities). There are 12 type A and 269 type B Portuguese wastewater utilities. The analysis for all the 281 utilities was carried out yearly for the 5-year period 2015–2019. For this level, rainfall data used to characterize dry and wet weather were provided by the Portuguese meteorological institute [34].
At the utility level, the approach was applied using data provided by nine utilities [31] representative of the Portuguese wastewater sector. Wastewater systems present different dimensions and contexts, as in Table 2. Characteristics of the systems were provided for context purposes. The type of system is frequently used to compare utilities.
Three utilities are type A and six are type B utilities. Provided information includes monthly data from 2015 to 2019 and detailed sub-hourly data from measurement campaigns during 2020. These data were previously processed, dry weather flow patterns were determined, and undue inflows were characterized [35]. For this level, rainfall data used to characterize dry and wet weather were collected by the utility’s rainfall meters.
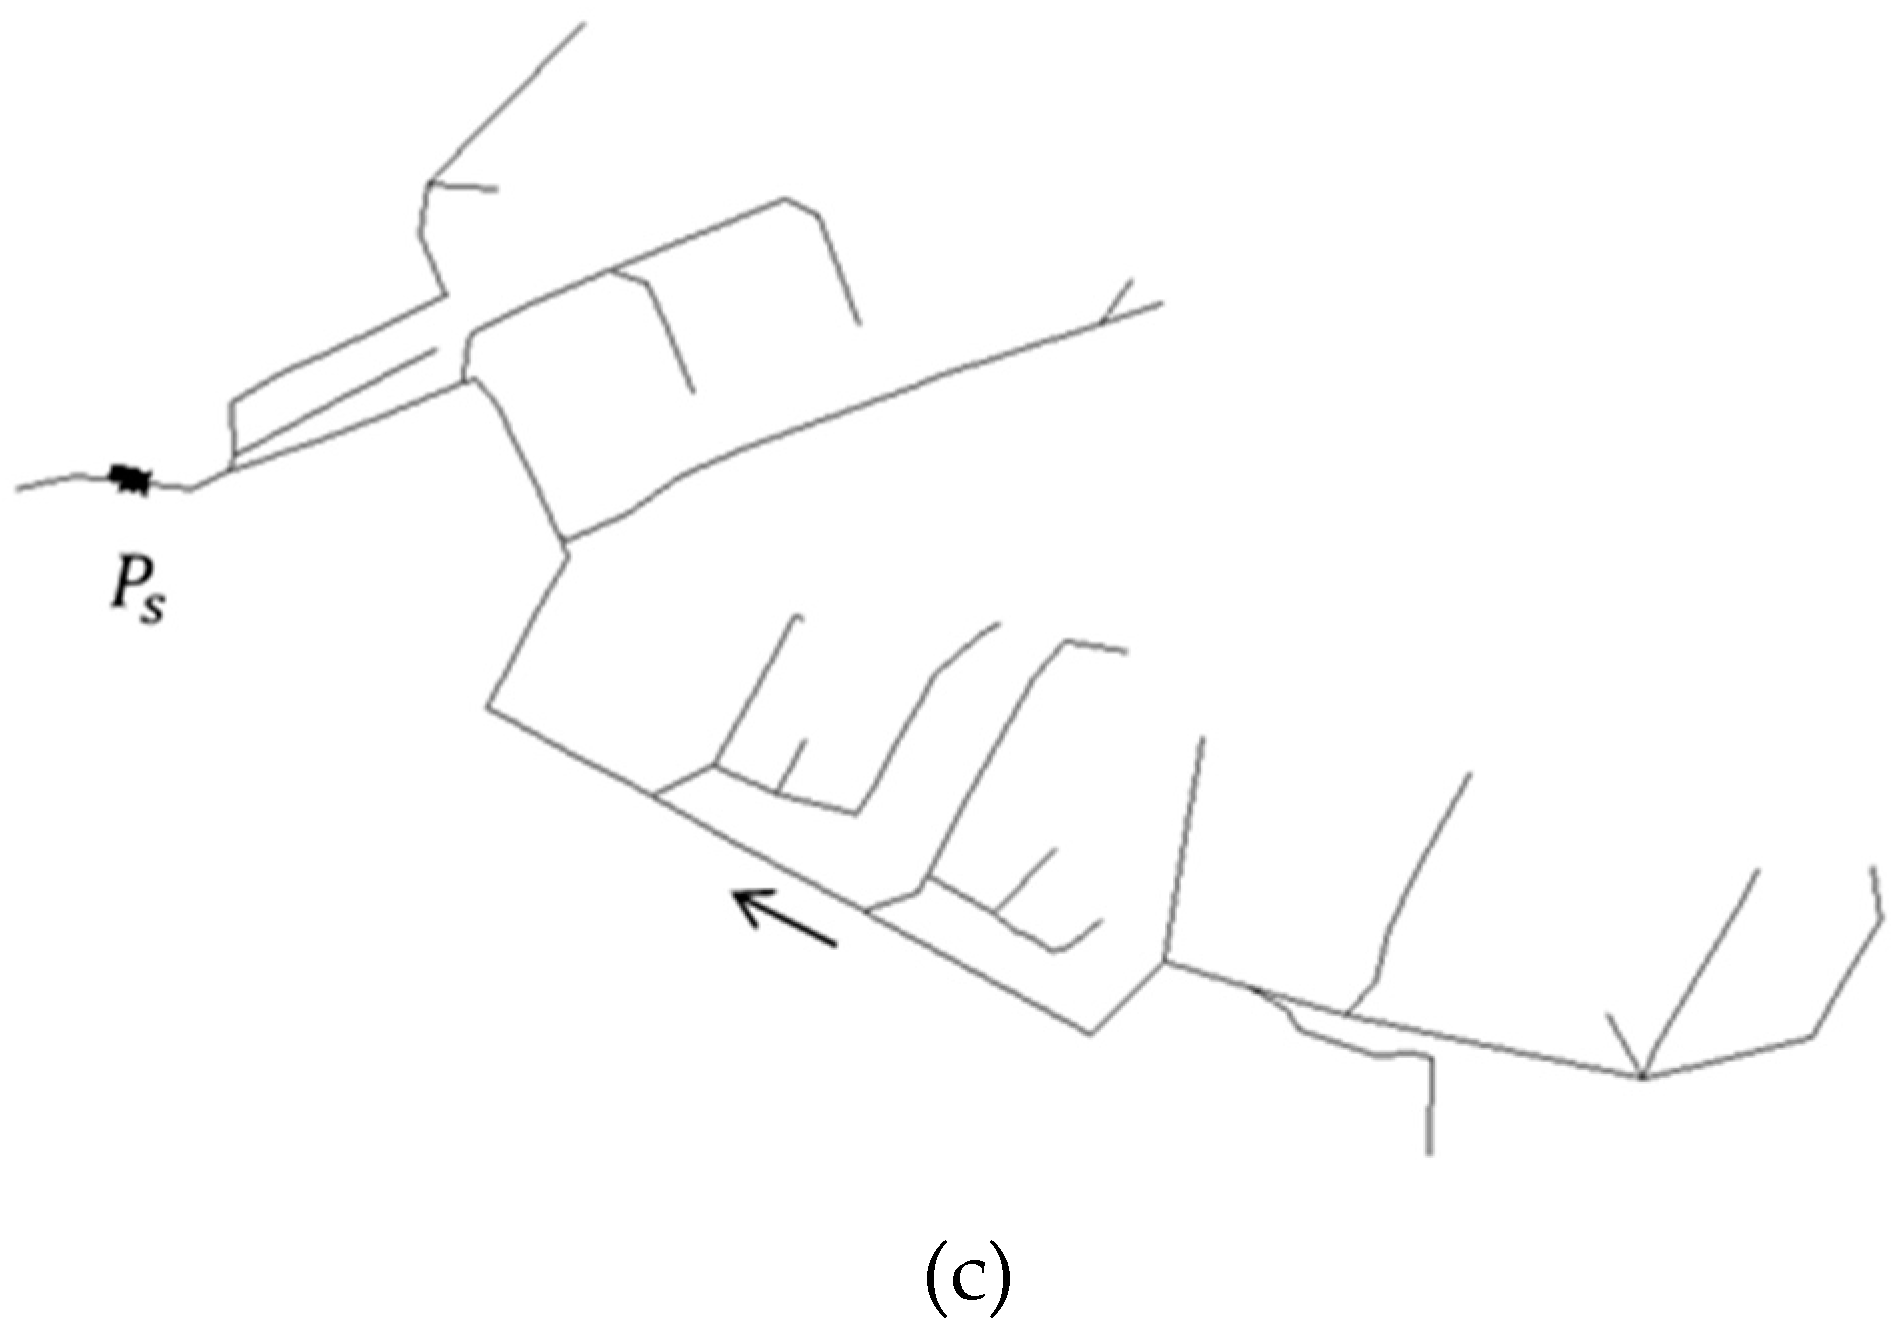
At the subsystem level, this approach was applied to a case study based on an actual wastewater separate system at Venteira, Amadora, Portugal. Mathematical modeling of scenarios used the SWMM software (version 5.1, USEPA). Venteira is a real system and the model used was built using real inventory data, measured flows and precipitation data, both in dry and wet weather. A pumping station, Ps, was included at the downstream end of the system, taking into account that downstream conditions would not influence the upstream operation.
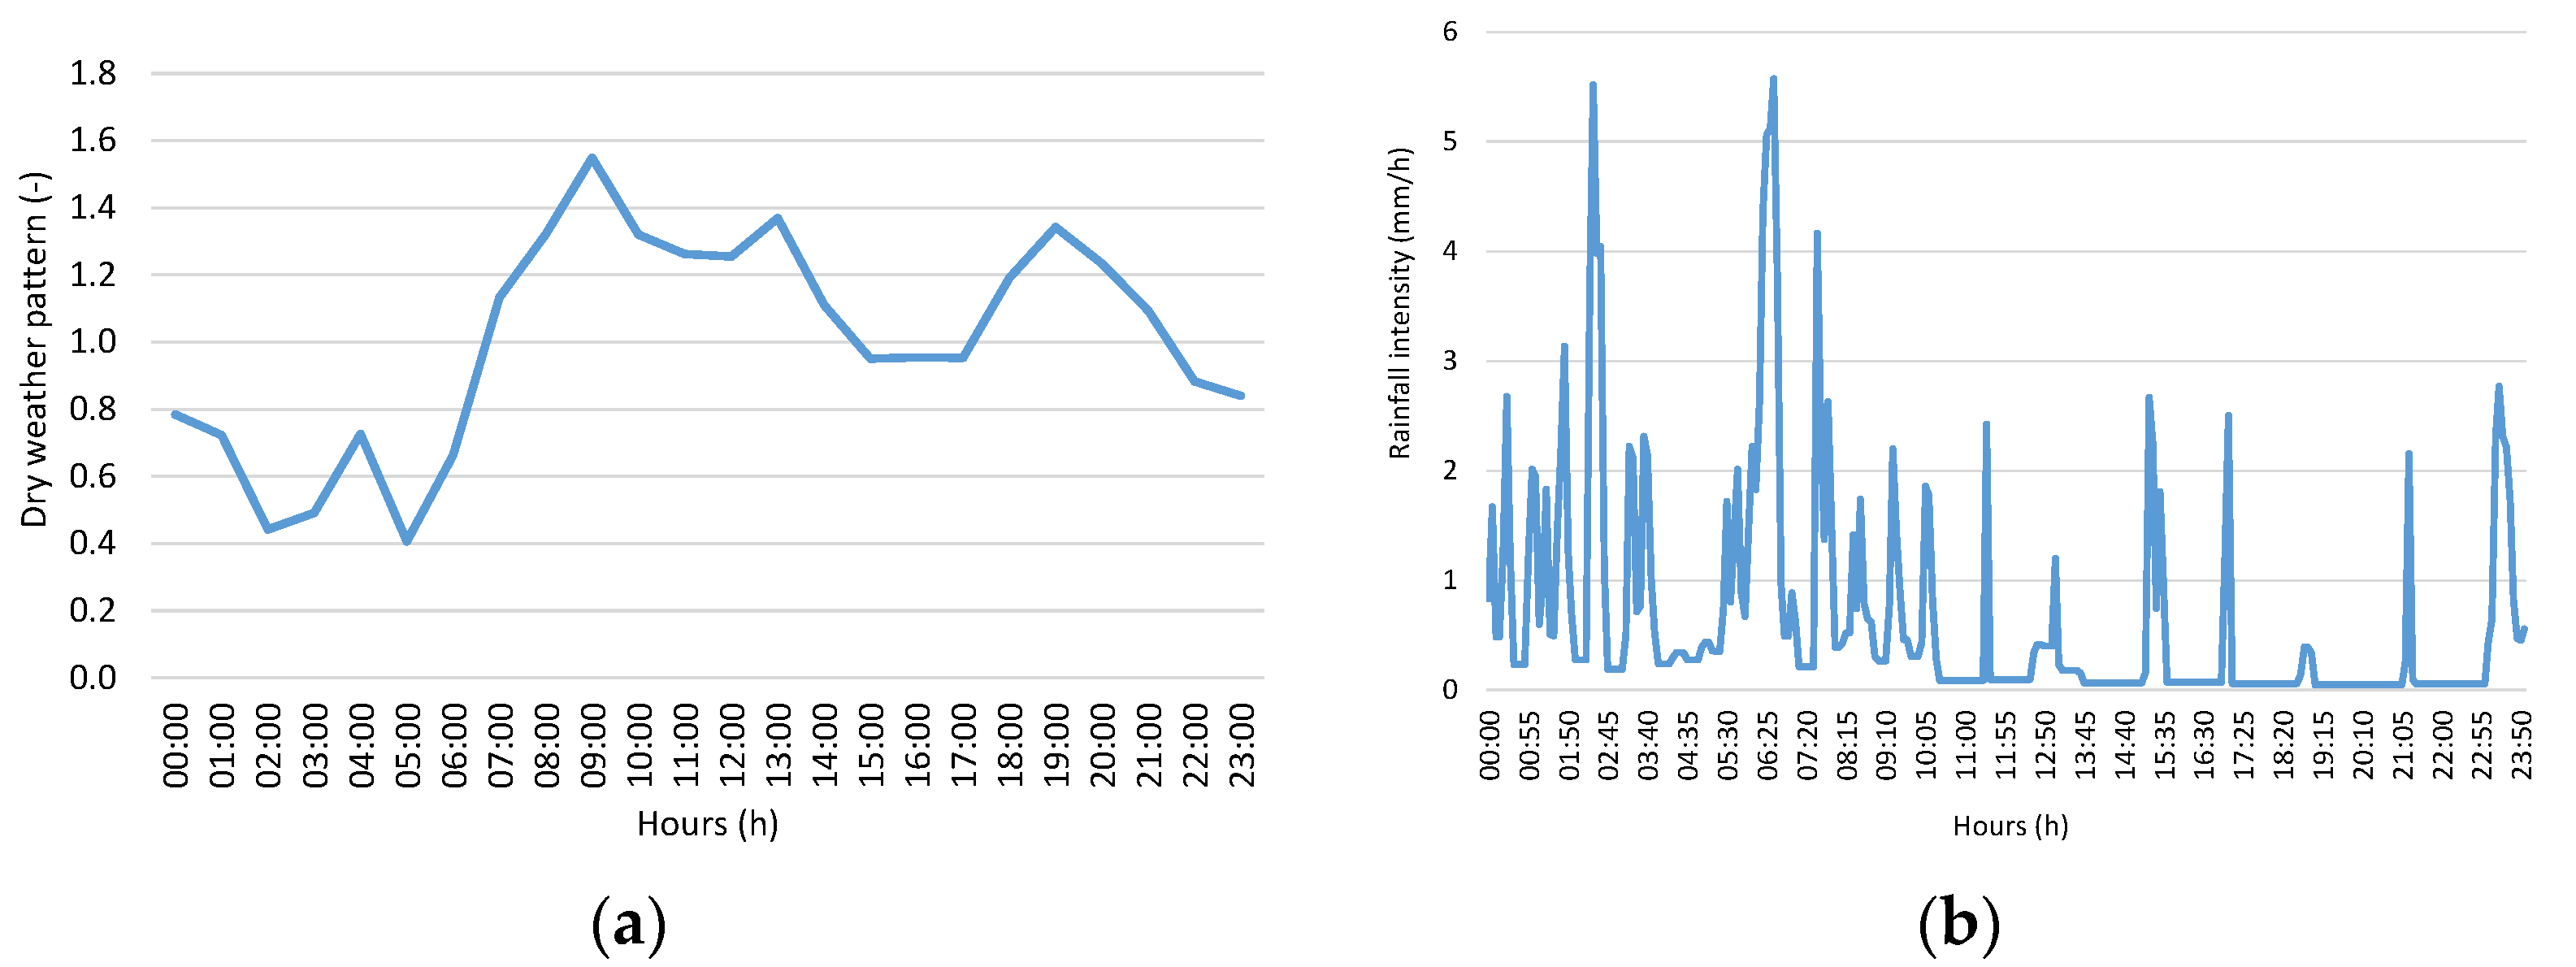
The model of the case study was calibrated and validated in a previous study [36] and adapted to the present application. As input data for characterization of the reference situation, a dimensionless dry weather flow pattern and the average sanitary flow volume corresponding to the population in the basin were used. For the simulation of rainfall scenarios, a precipitation event was used (Figure 3a). For the simulation of infiltration scenarios, total dry weather daily volume was used (Figure 3b) as a reference and a uniform distribution of the corresponding infiltration throughout the sewer network was considered, as previously described. The downstream pumping station, Ps, has a manometric head of 3.00 m and an associated weir.
The sewer length is 2.6 km, sewer diameters vary between 200 and 500 mm, and the PS is at the system downstream end. The model includes seven sub-catchments, with a total area of 0.25 km2. The total daily dry weather volume is 2380 m3 and the unit infiltration volume varies from 0.089 to 0.893 m3/m for the simulated scenarios [32]. The network scheme of Venteira is presented in Figure 3c.
4. Results and Discussion
4.1. W-E-G Nexus at National Level: The Case of Continental Portugal
Results for the assessment of the W-E-G nexus at the national level are presented in Figure 4 and Figure 5, respectively, for the analysis of the Portuguese regulator data and the performance metrics. These data have associated quality assurance procedures. In the last decade, the Portuguese regulator ERSAR has carried out the application of the quality of the service evaluation accompanied by audits to all water utilities. This yearly procedure feeds an information system publicly available including several measured operating quantities. These data have adequate reliability to be used for the national assessment level proposed in the methodology.
Detailed information is in Appendix B (Table A2, Table A3, Table A4, Table A5 and Table A6). Both Figure 4 and Table A2, Table A3, Table A4, Table A5 and Table A6 results are for 5 years (2015–2019) and for 12 type A and 269 type B Portuguese wastewater utilities. Values shown are the medians of the 281 wastewater utilities.
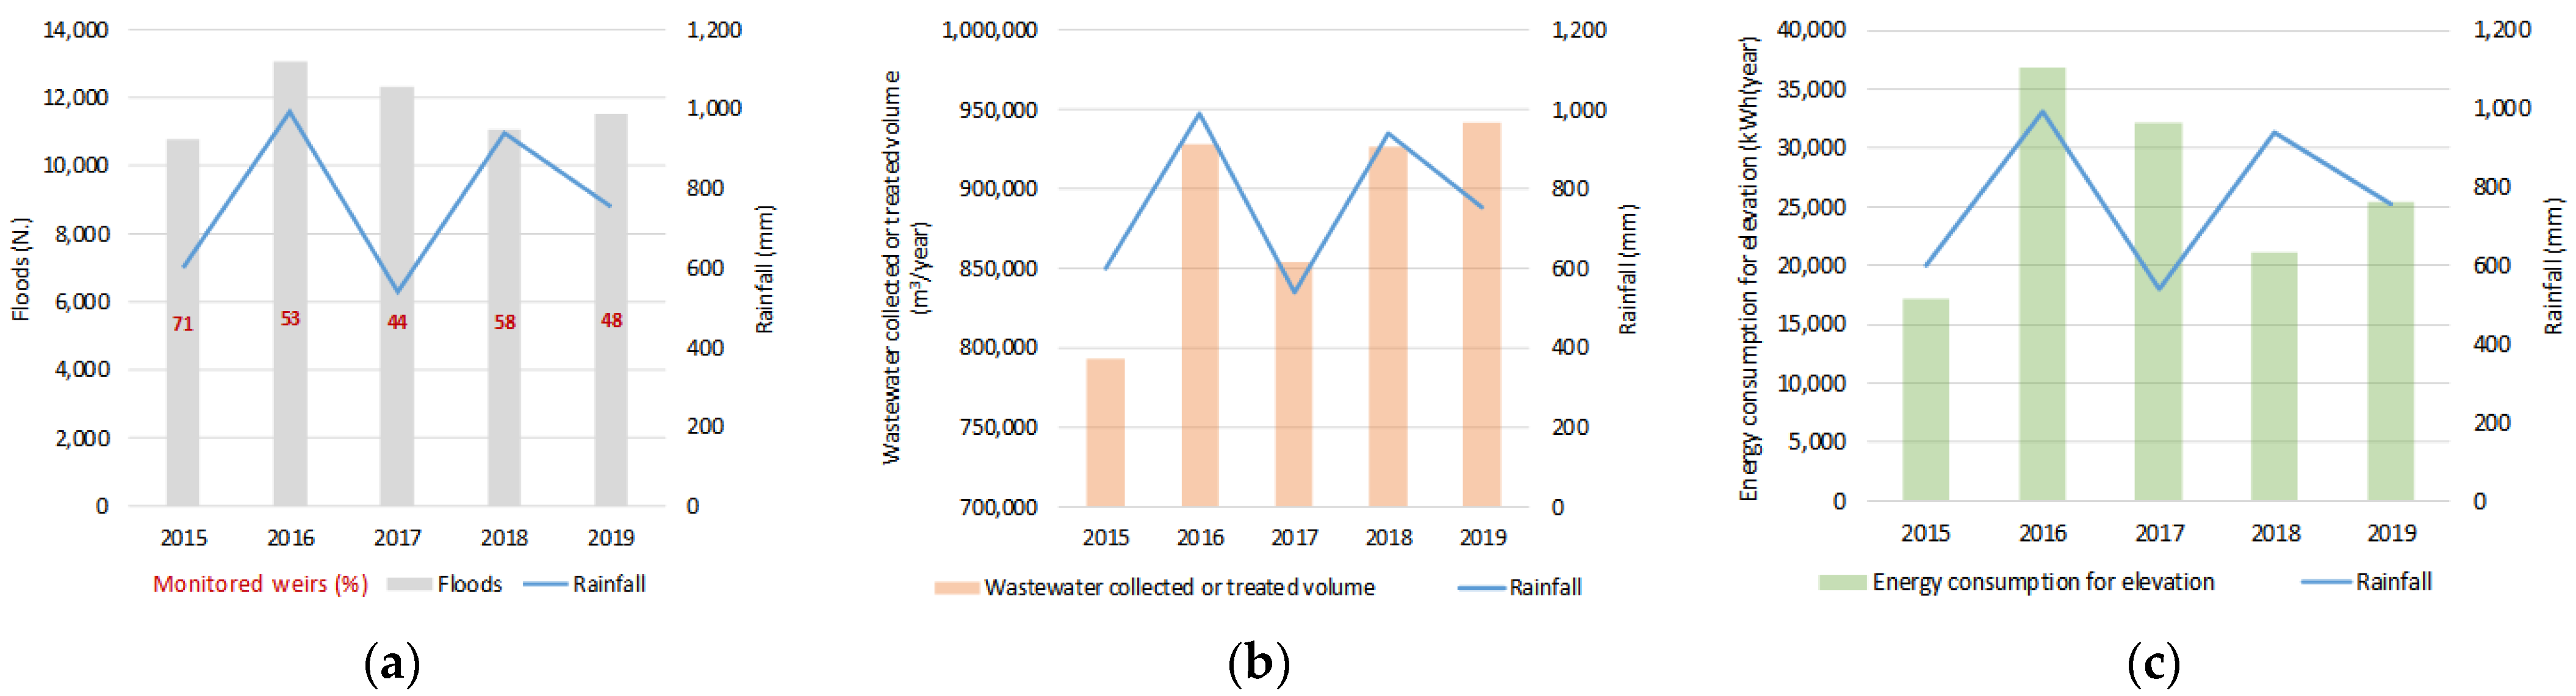
The combined analysis of the yearly data on wastewater collected or treated volumes, energy consumption, rainfall, discharges, and floods allow to identify evidence of inflows associated with the occurrence of precipitation and their impact on energy consumption. Results of this analysis show, for all years, that the increase in energy consumption, collected or treated wastewater volumes, and the number of floods, are aligned with the variation in precipitation (Figure 4a–c). Although with limitations in the reliability of this raw information, the impact of undue inflows on these variables is significant even with this aggregation of data.
The implications of UI are important in terms of untreated discharges and floods, as well as in the overall high volume of wastewater, with a direct impact on energy consumption. The wastewater collected or treated volume has a strong correlation with rainfall (Pearson coefficient r = 0.76), especially considering that a part of the rain-derived inflows does not reach the outlet of the system, being discharged during transport or upstream of measurement devices. This observation also applies to the correlation of the monitored weirs with floods, which have a significant negative correlation (Pearson coefficient r = −0.64). The latter implies that the occurrence of discharges and floods must also be evaluated jointly because floods can result from the non-existence of an emergency weir, for example, at pumping stations. Depending on the system and available monitoring data, this causal relationship between the occurrence of discharges, floods, and precipitation can be challenging to characterize. The absence of monitoring on discharge structures, as shown by the percentage of unmonitored structures (Figure 4a), implies an underestimation of the occurrences. In this context, it is strongly advisable to improve the monitoring at discharge structures and to upgrade the system maintenance and rehabilitation to reduce overall effects and data reliability.
At national and utility assessment levels, some wastewater utilities have older parts of the systems as combined, but in these cases, interceptors divert wastewater flows for the WWTP. The values used for calculations relate to the wastewater part of the system and corresponding overflows of untreated water. Flows not diverted to the WWTP are directly discharged to receiving waters or stored and treated later. In this way, evaluation of the impact on the wastewater systems is carried out even when a part of the system is combined. Furthermore, given the obligation of treating wastewater flows, in combined systems, this approach is important to evaluate the impact of excessive inflows reaching the WWTP both in dry weather and wet weather. It is important to emphasize that, because of the occurrence of overflow upstream energy consuming components, these volumes are not accounted for in wastewater collected or treated volumes. The methodology generally applies to free surface sewers. In Portugal, most wastewater systems free surface sewers. Pressure conduits are limited to pumping systems and vacuum systems are only used in very small systems not being representative of the country-wide reality. Pressure and vacuum sewers might exist, but in these cases, the vulnerability to rain-derived and infiltration inflows is considerably low. In sewers with free surface flow, although there is some capacity to accommodate part of the UI when these are very high, they can cause overflows in manholes, which can cause floods. With PS and WWTP, the capacity to accommodate undue inflows is usually lower. These components are normally equipped with emergency weirs to prevent flooding of the facilities and to protect electromechanical equipment and treatment processes, when volumes are excessive, or to use temporarily, in case of repair or maintenance activities.
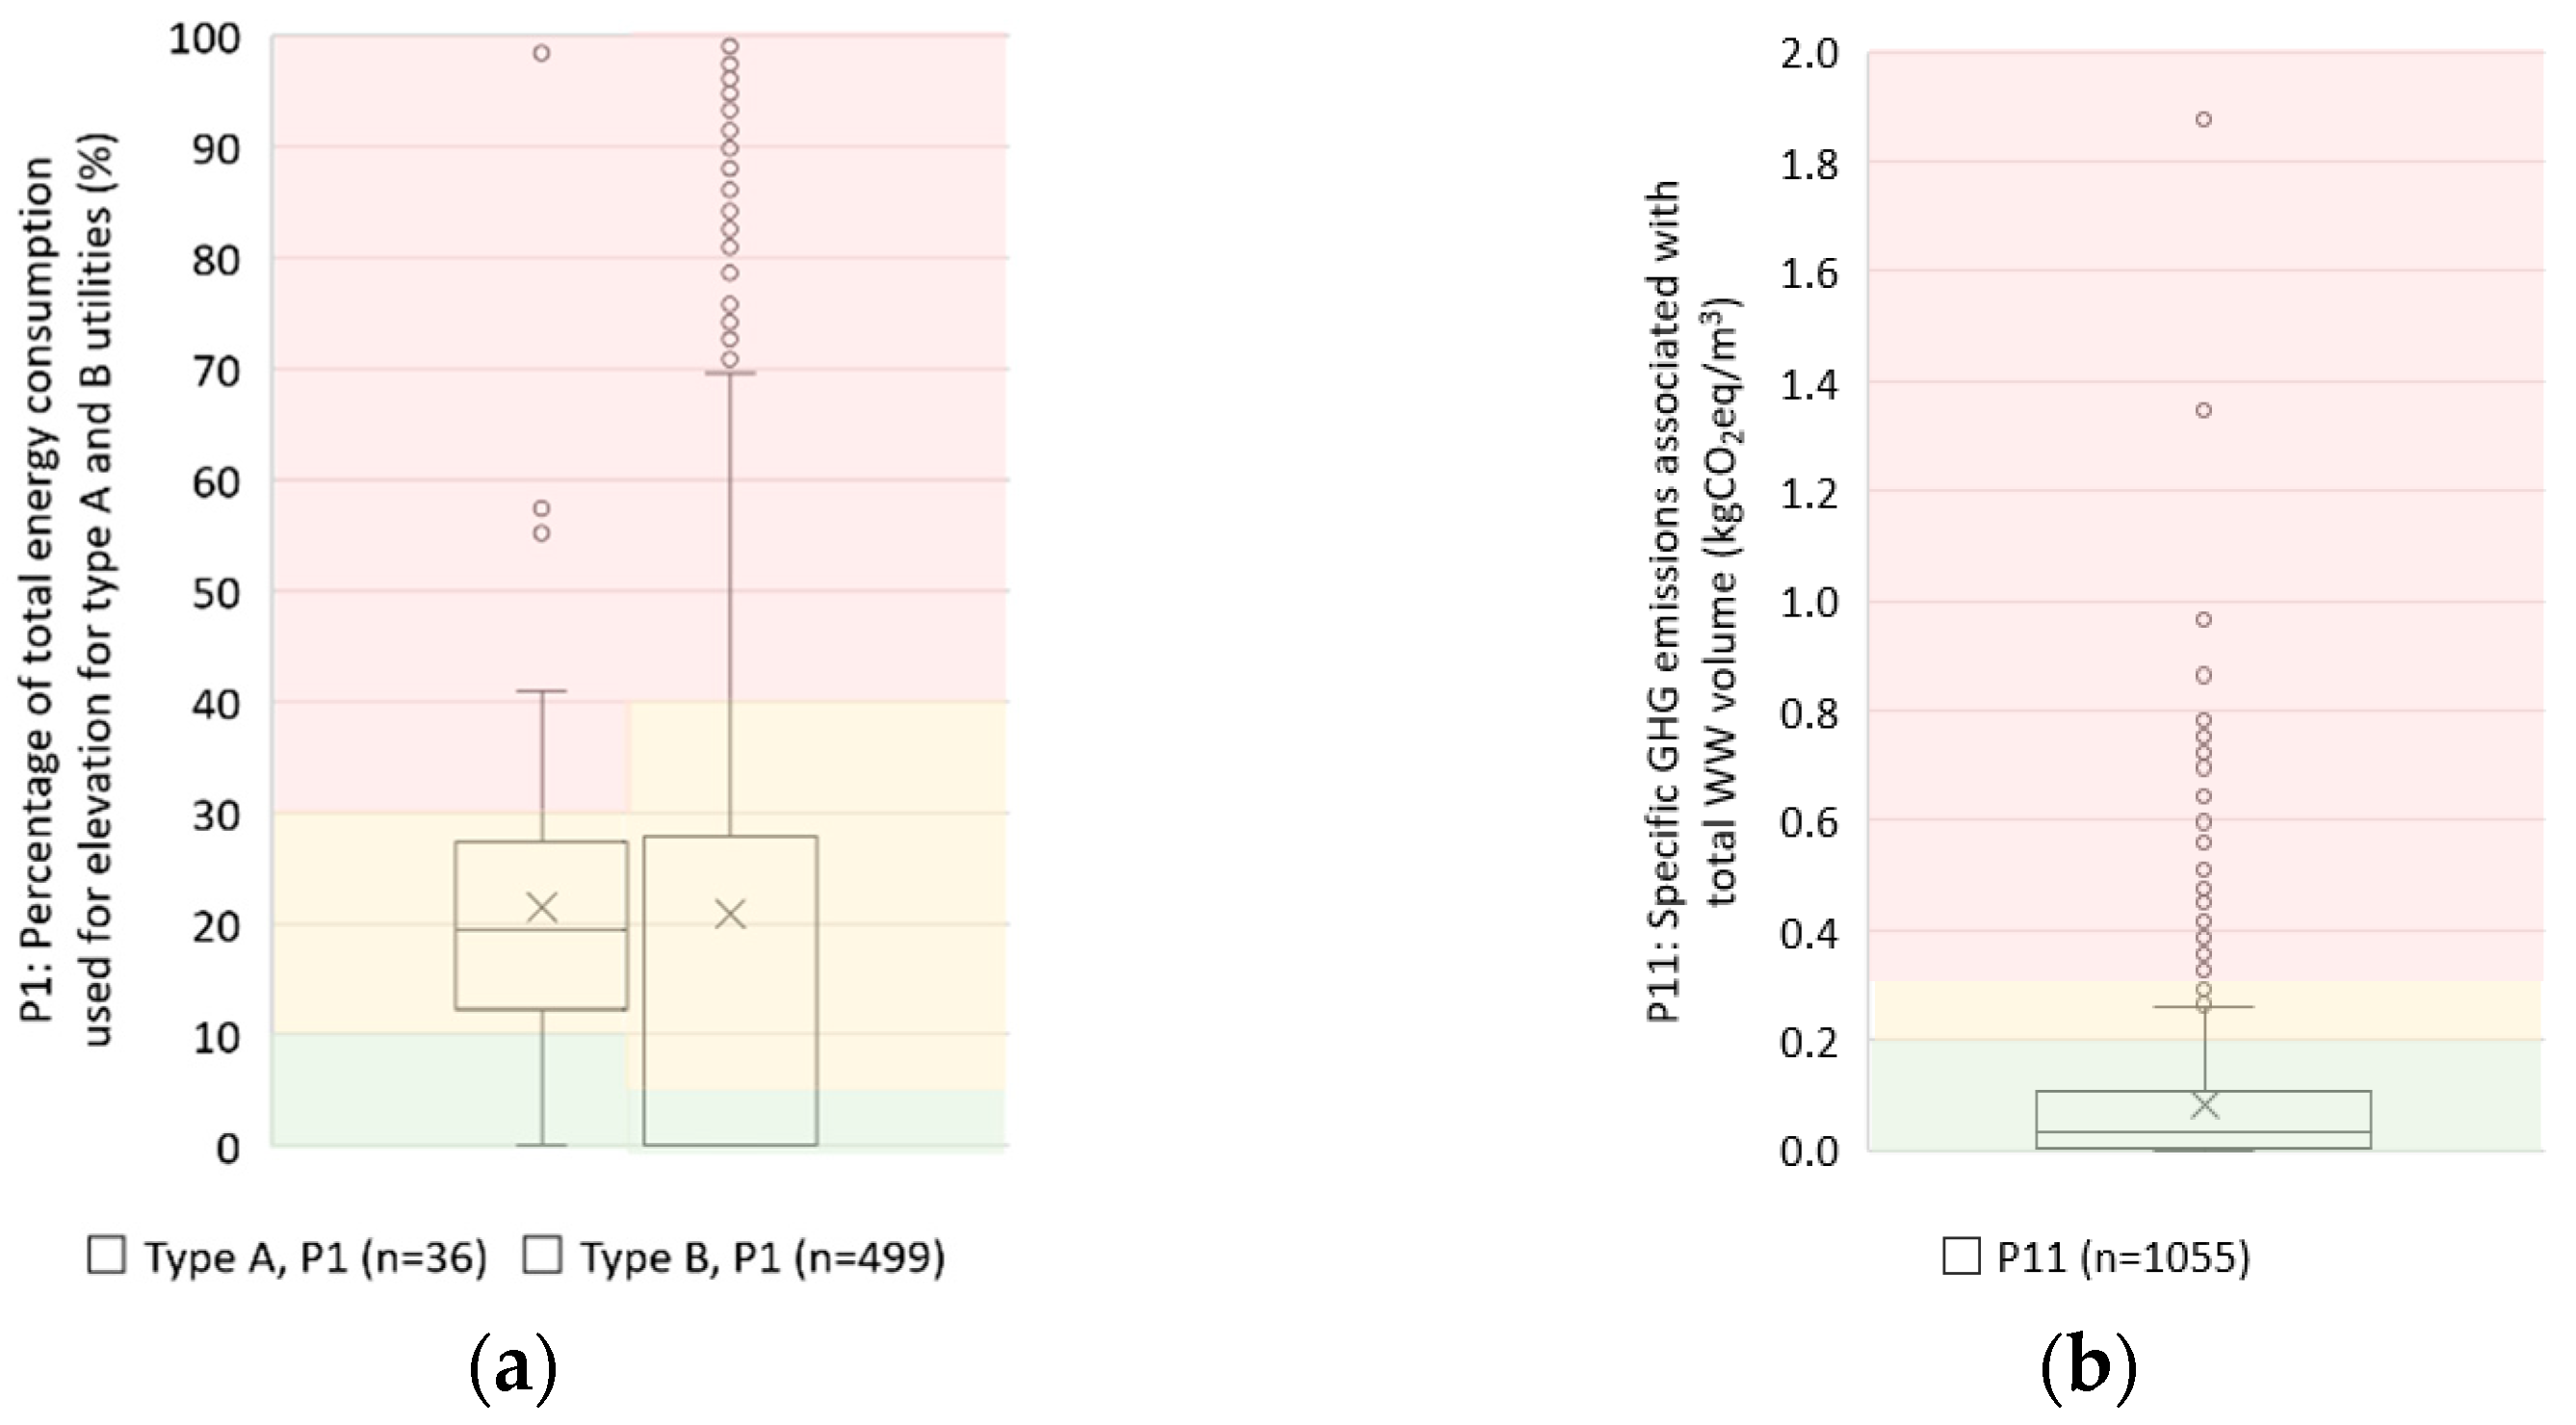
Results for the metrics P1 and P11 are presented in Figure 5. The background colors derive from the classification according to the proposed reference values. Green stands for good performance, yellow for fair performance, and red for poor performance.
Wastewater bulk transport and treatment systems (Type A) consume significantly more energy than collection and transport systems (Type B), given the higher flows and higher number of PS and WWTP. These characteristics increase their energy consumption per cubic meter of collected or treated wastewater, as well as of specific GHG emissions. Additionally, type A utilities are frequently more penalized because of the high UI received from type B utilities. Therefore, it is expected that the proportion of the pumped volume is higher in type A utilities and reference values are more restricted (Figure 5a). In terms of performance, at a national level, both types of utilities have balanced performance, as both average and median results for P1 achieve a fair performance.
Regarding P11 (Figure 5b), performance is better, with average and median values of specific CO2 emissions achieving good performance. However, as explained before, it is important to highlight that the total wastewater volume does not account for overflows, and both energy consumption and wastewater volume are biased by this phenomenon.
4.2. W-E-G Nexus at Utility Level: The Case of Nine Portuguese Utilities
The metrics were calculated using the data from the utilities. At the utility level, the results presented originate from measurement locations that were audited by the research team using European standards, to have a measure of the reliability of the data used.
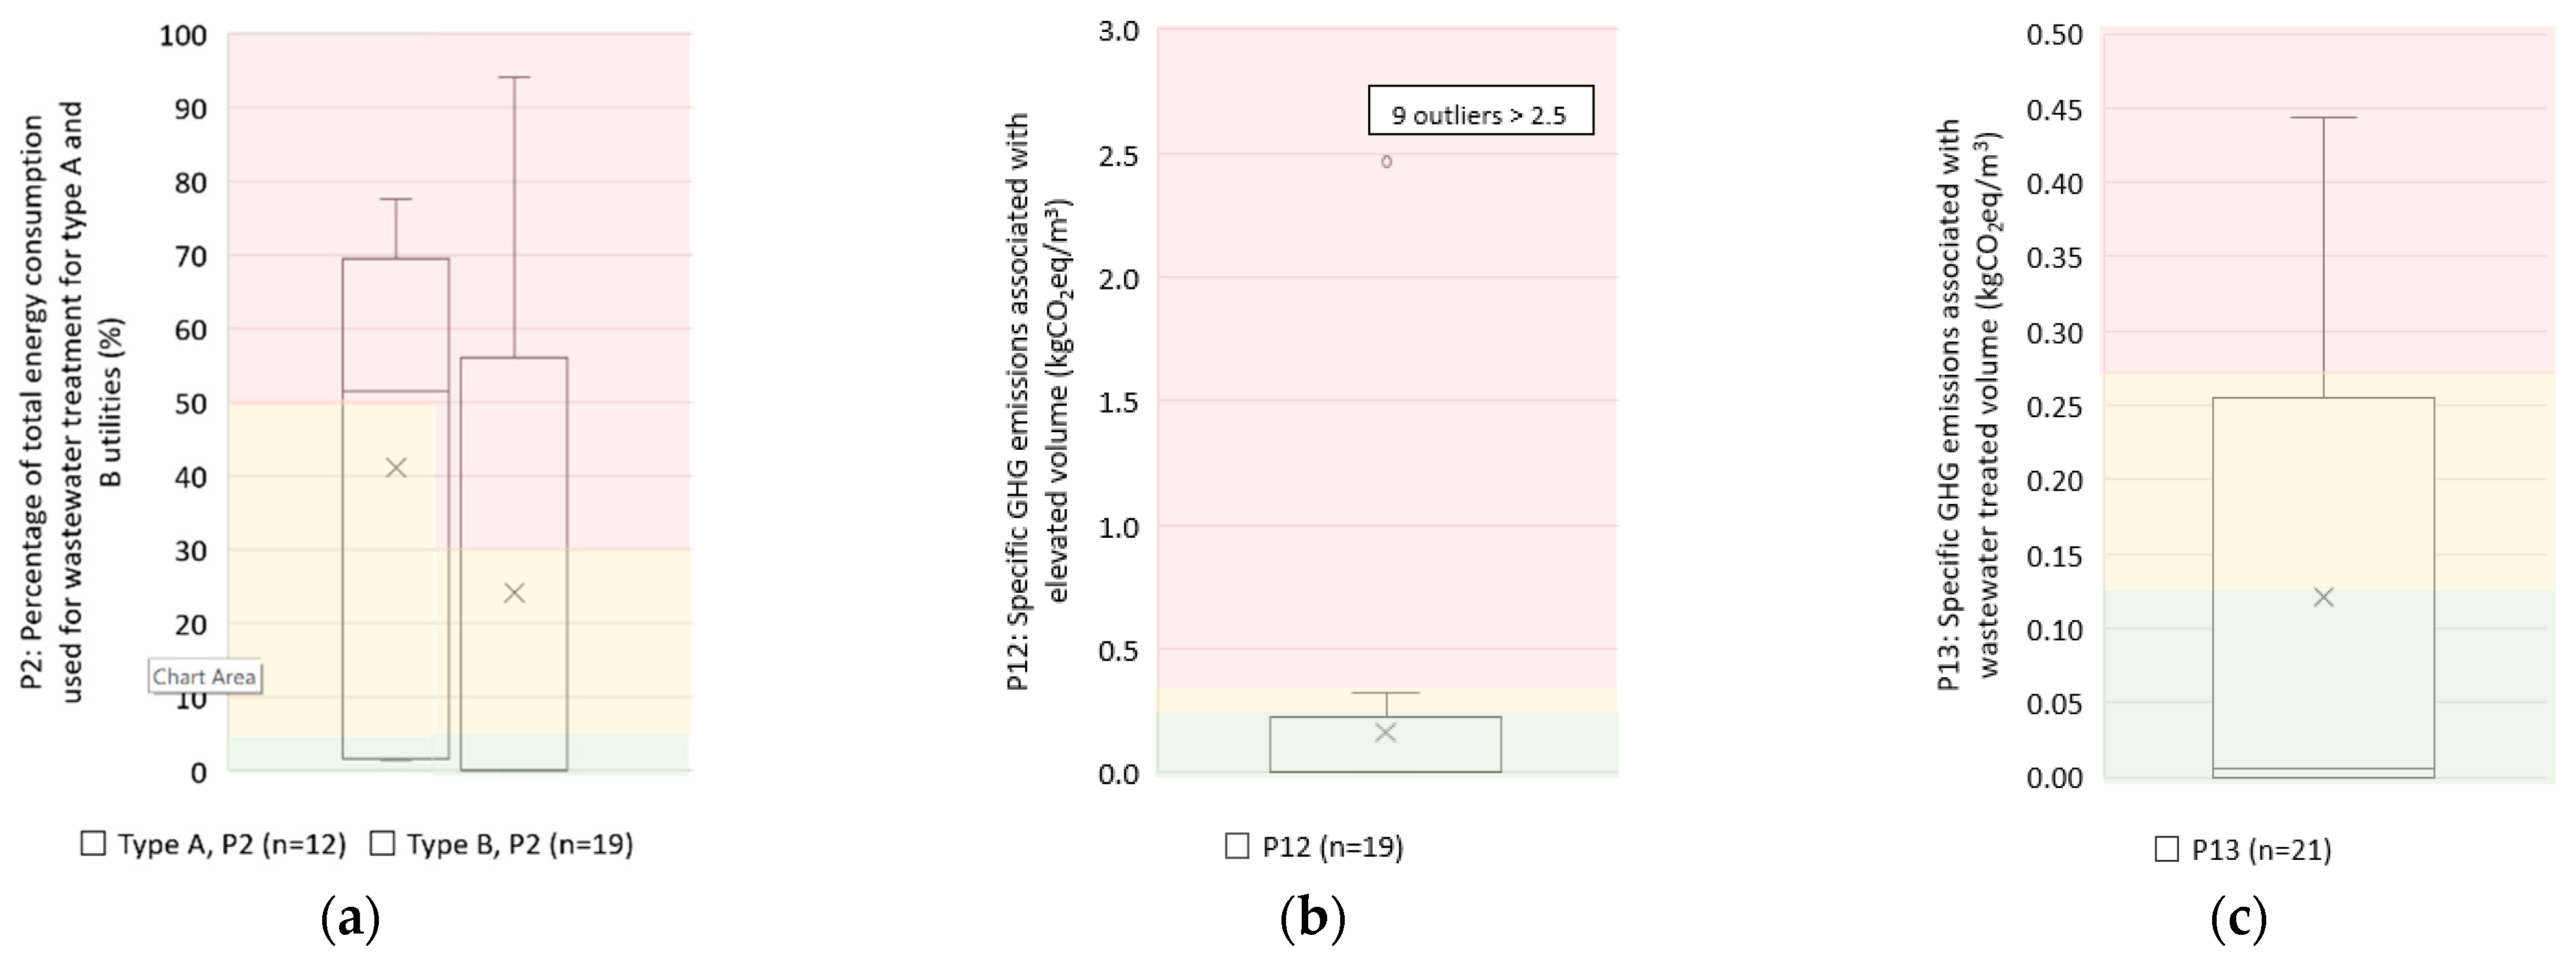
Results for metrics P2, P12, and P13 are presented in Figure 6 for the five years. A graph for each type of utility is presented for metric P2 because reference values are different for type A and type B utilities.
Metric P2 results show that a fair percentage of energy is consumed in WWTP processes. GHG emissions are higher in wastewater treatment (P13) than in wastewater pumping (P12). If a comparison with annual volumes can be made, utilities can carry out a preliminary assessment using only yearly data, even if more disaggregated information is unavailable.
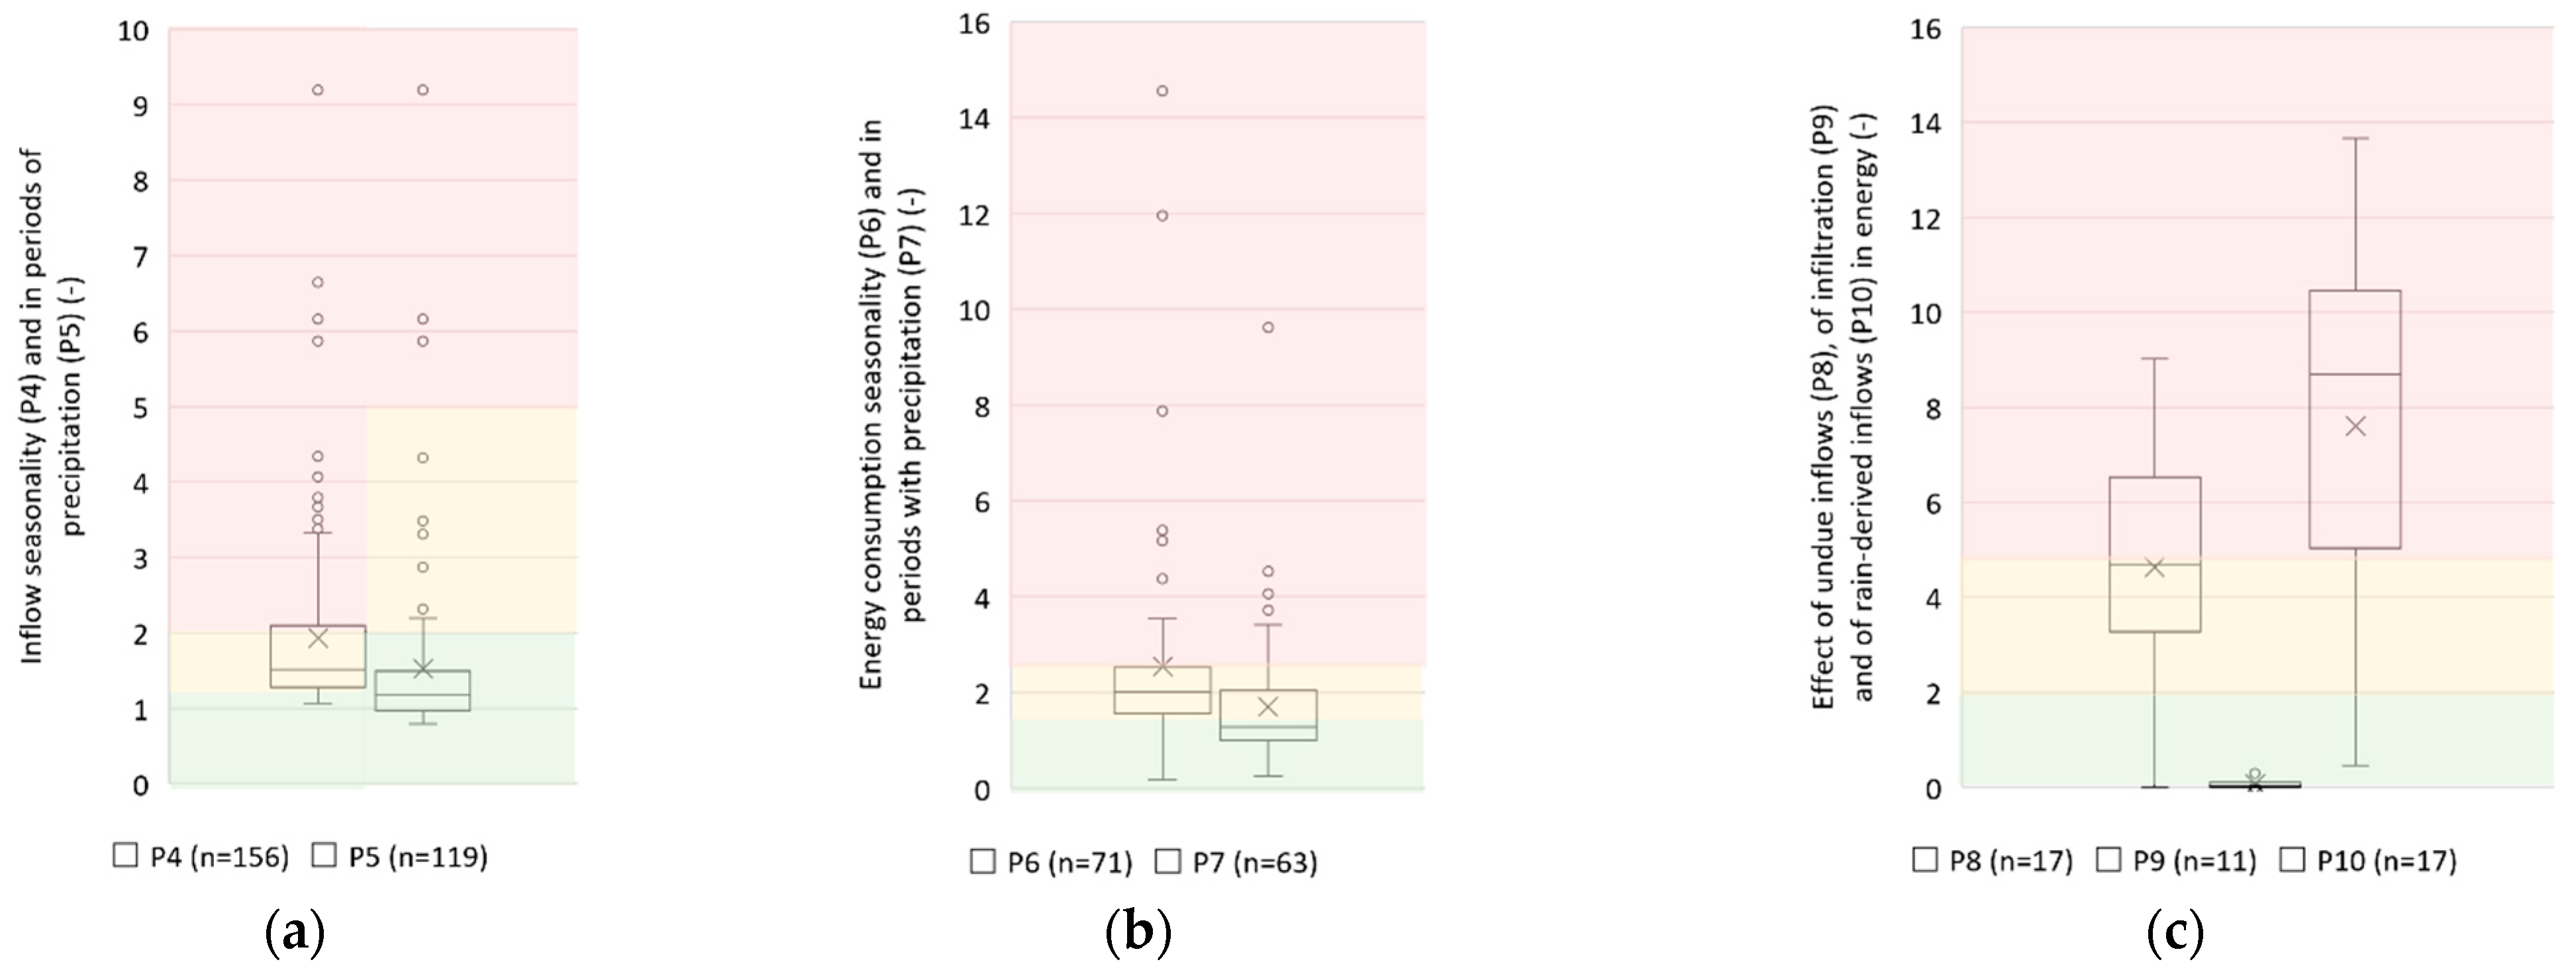
Metrics P4-P7 were calculated for many sub-systems, defined by a downstream boundary (PS or WWTP). Data simultaneity is also a constraint, such as for metric P8, for which monthly precipitation and energy data must be available for the entire year to enable metric calculation. Metrics P4-P7 were calculated for 63 up to 156 locations (n in Figure 7a,b). For metrics P8-P10, since they require very detailed information (data acquisition with less than 1 hour time steps, and sometimes, simultaneous rainfall records), it is only possible to apply the calculation procedure to the locations where the utilities installed rain gauges, collected a representative data sample, and proceeded with adequate and comprehensive data processing (according to [35]). It is important to highlight that the confidence in the results depends on the uncertainties of various sources, namely the data acquisition and processing system [35]. Furthermore, including broader approaches, requiring less detailed data, is very important to allow utilities with fewer resources to carry out the diagnosis, leveraging the implementation of a continuous improvement process.
Data between 11 and 17 measurement locations are available for this set of metrics (Figure 7c). Box and whisker plots present the statistics of the results in Figure 7.
Seasonality refers to the variations along the different seasons or times of the year, being a very important dimension to understand the impact of rain-derived inflows in wastewater systems. Inflow seasonality is confirmed by the P4 results and, even though in most cases performance is fair, most seasonality can be explained by rain-derived inflows (P5). Energy consumption also presents a marked seasonality (P7), and it looks as if consumption in periods with precipitation (P7) relate closer to overall seasonality. These results suggest undue inflows can be strongly related to yearly variations in energy consumption.
When the basis is sub-hourly data, it is possible to observe that undue inflows have a marked influence on energy consumption, increasing from four to seven times the consumption associated with wastewater (P8). Infiltration seems to have a lower influence (P9) than rainfall (P10). Rain-derived inflows increase from 5 to 10 times the energy consumption associated with wastewater during rain events in most locations. Conclusions regarding the contribution to GHG emissions (P9 and P10) have the same trend.
4.3. W-E-G Nexus at Subsystem Level: The Venteira Case Study
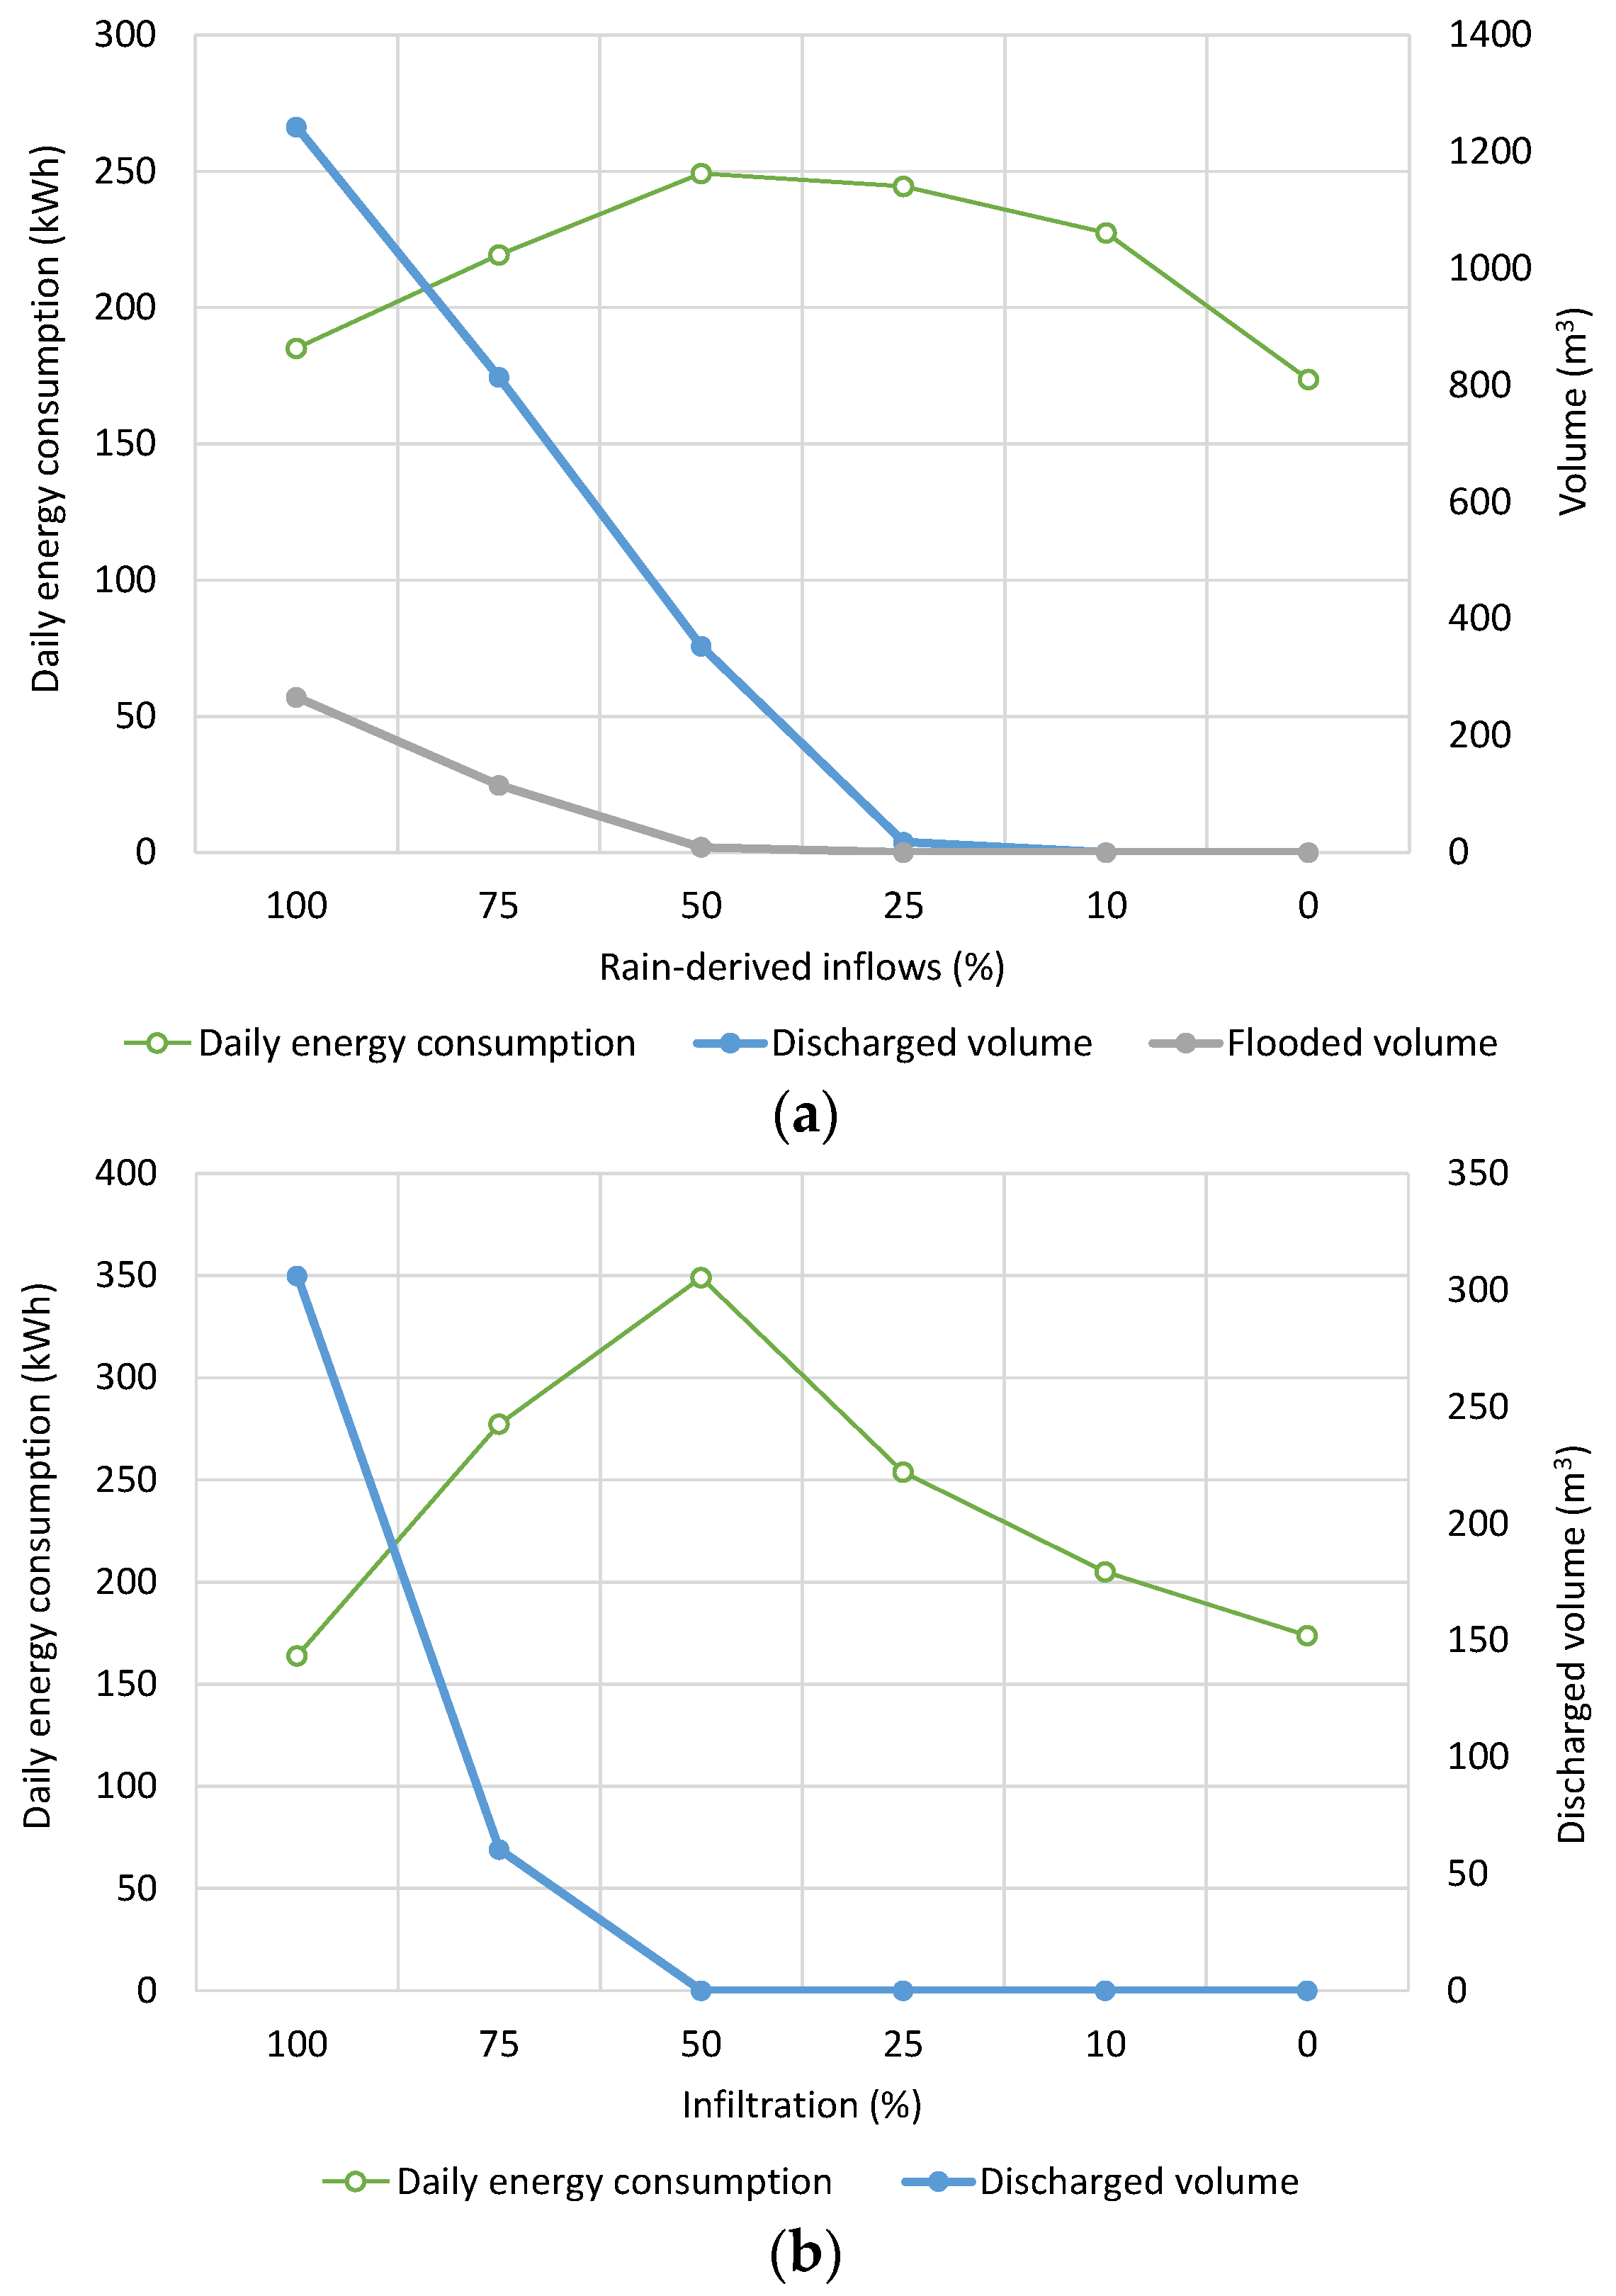
At the subsystem level, the analysis of the UI impact in the system is carried out by observing the evolution of the relevant variables, such as the energy consumption in the PS and volumes discharged and flooded upstream of the PS, as shown in Figure 8. Figure 8a,b shows that the daily energy consumption increases with rain-derived inflows and infiltration up to a certain point (i.e., 50%), and then, decreases. This decrease follows the start of a discharge because of the capacity limitation of the PS and it becomes more explicit when flooding begins. This phenomenon demonstrates that what is really reducing is the volume that leaves the system due to the systems’ limiting capacity (as overflows). Only after these overflows are eliminated, will the reduction in undue inflows impact the energy consumption.
The initial increase in energy consumption is related to the overall pump operation (e.g., pump operating time and number of start-ups), which does not depend only on the inflow volume. It was assumed that these overflows do not re-enter the system.
This analysis shows that the assessment of the UI impact on energy performance is biased by other performance problems (i.e., discharges and floods) in the system and, if they are not included, it leads to an incomplete assessment of the problem. Therefore, energy-saving measures focusing on the reduction in UI considering only measured volumes (a realistic situation, since there are few flow measurements or mathematical models for this type of system) are insufficient, being difficult to have a noticeable impact of UI reduction in energy consumption or emissions. Measures implemented will first impact the reduction in overflows until the transport capacity of the critical components is reached (because of capacity exceedance), and only after additional reductions in UI will the effect on energy consumption and emissions be achieved.
This method also contributes to determining, for each specific case, the minimum reduction in UI from which an impact on energy consumption and emissions can be observable. In the present case study, the analysis of the results in Figure 8a shows that, for rain-derived inflow, starting from a situation where 100% of the area is contributing, it would be necessary to reduce by 25% the area connected to the wastewater separative system to have a significant impact on energy consumption and emissions. For infiltration, a minimum reduction of at least 50% of the average daily dry weather volume would be necessary (Figure 8b). It should be noticed that infiltration rate was considered constant for the present case study as a necessary modeling simplification; for longer time periods and when the main objective is to quantify these inflows, infiltration should be characterized over time.
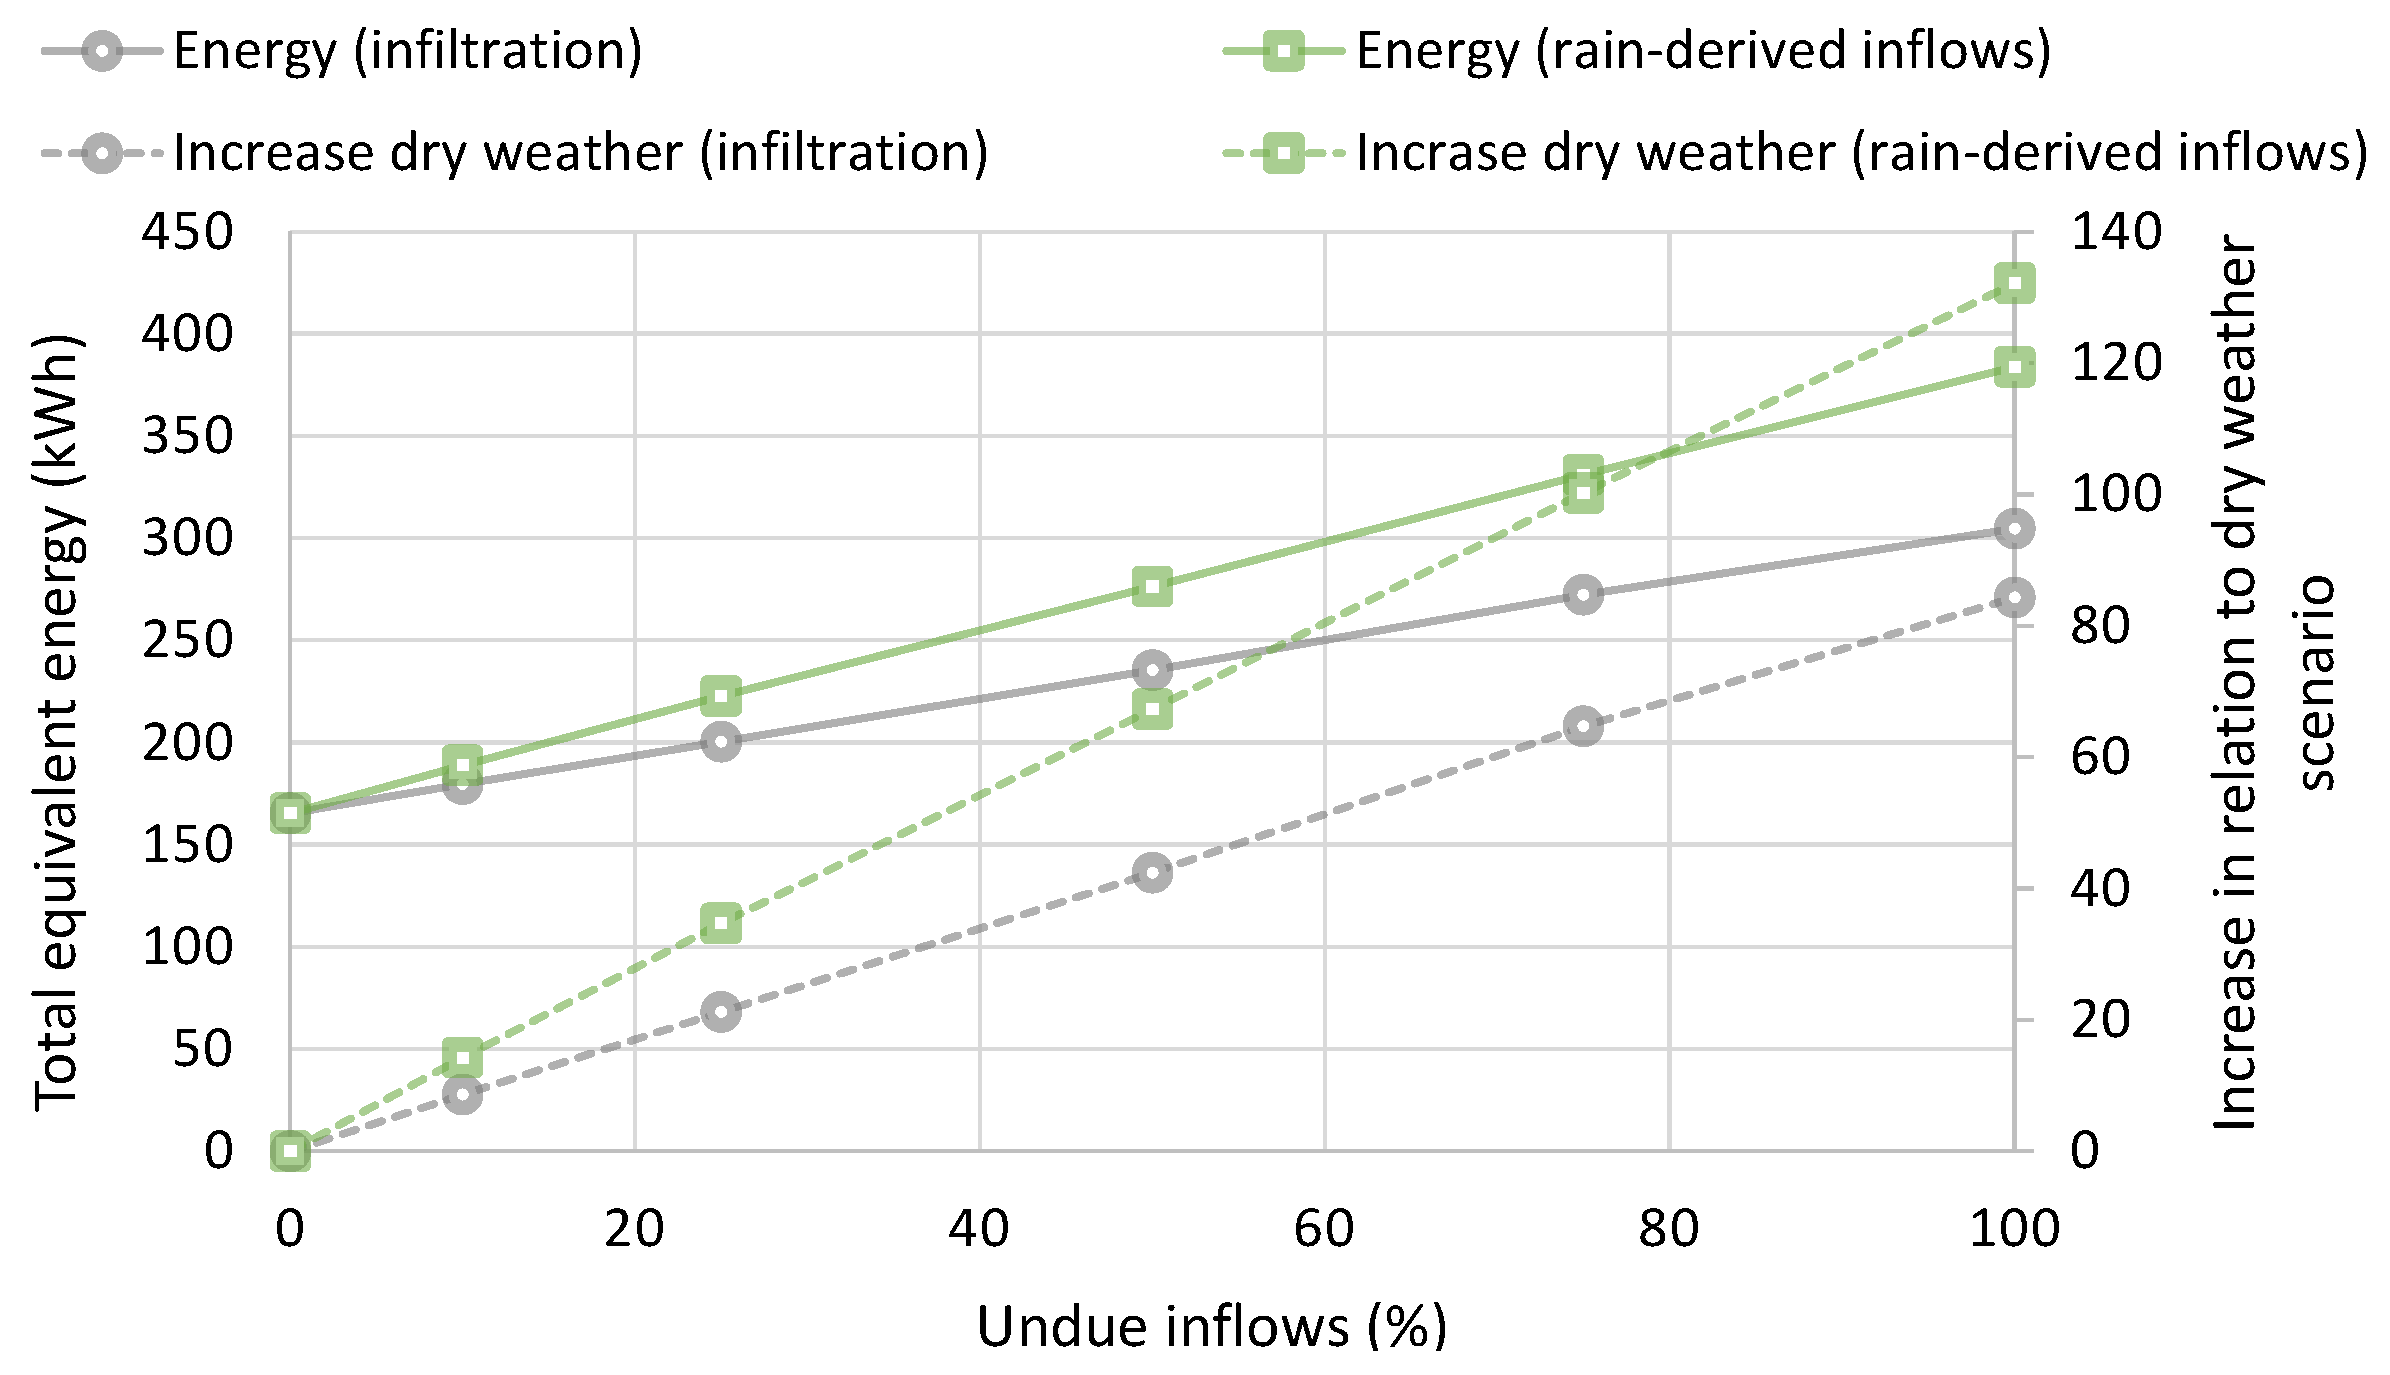
Figure 9 shows the results for the total equivalent energy consumption, for the rain-derived inflows and infiltration scenarios and the comparison with the dry weather reference situation. These results reinforce the need to consider the volume generated (wastewater and overflows) upstream of the PS, clarifying that the impact of reducing UI on energy consumption will only be effective for reductions higher than those typically perceived (because usually volumes are measured in the PS and not further upstream). For the scenario of 100% contribution of rain-derived inflows, the calculation of the equivalent energy showed that energy consumed increases to more than double when compared with the dry weather situation. The same trend is observed in the infiltration scenario.
The results confirm the growth of energy consumption with increasing UI volume, the relevance of an integrated analysis of the effect of these inflows for different systems and the importance of assessing the potential impact of UI control measures in energy-saving and emissions.
To sum up, it is possible to assess more robustly the impact that UI have on the energy consumption and on GHG emissions of the systems, showing opportunities for actions in this area.
As previously presented, a set of performance metrics is proposed, to detail this assessment at the subsystem level (Table 1). For the present case study, three performance indicators were applied, namely: P3—percentage of energy equivalent to the volume generated in the served area used for pumping (%); P12—specific GHG emissions associated with pumped volume (kgCO2 eq/m3); P14—specific GHG emissions associated with volume generated in the served area (kgCO2 eq/m3). Results are presented in Table 3 for both analyses (rain-derived inflows and infiltration) for the several scenarios (corresponding to 100%, 75%, 50%, 25%, and 10% of reduction). Results for the reference situation (dry weather) are also presented. Good performance values are presented in green, fair performance in yellow, and poor performance in red.
In the scenario of rain-derived inflows, P3 shows good performance only when implementing energy-saving measures leading to 25% of rain-derived inflows. For rain-derived higher than 25%, the volume of the overflows is higher, creating a discrepancy between the energy consumption for pumping and the energy consumption associated with the total volume generated in the served area. For the scenario of infiltration, the effect is smoother, being necessary to implement measures leading only to 75% of infiltration to achieve good performance.
Regarding P12 and P14, there is no strong trend observed since the decrease in the energy consumption and in the volumes are not proportional. For P12, values show good performance, but the reality at the subsystem level significantly differs from a broader level in which the reference values were established. P14 has no judgment about performance since few studies exist to set reference values.
5. Conclusions
The importance of the UI volumes of treated wastewater for the W-E-G nexus, often overlooked, was made clearer. Rain-derived inflows and groundwater infiltration from cracks or joints result in a flow rate increase in the wastewater separative system, reducing the available capacity and increasing transport, pumping and treatment costs. The relevance and implications for energy consumption and GHG emissions were shown in the three levels of analysis. Even at an aggregated level, the combined analysis of the yearly data on wastewater volumes, energy consumption and rainfall showed the relation between rain-derived inflows and energy consumption.
The need to integrate the systems’ exceedance in the analysis, resulting in discharges and flooding, was emphasized. The importance of having a three independent levels approach was demonstrated, allowing utilities with scarce data to tackle this issue and have an available approach to make some progress. These kinds of approaches are very relevant, since the wastewater subsector still faces a significant problem related to data availability and feasibility (e.g., installing data collection equipment as well as implementing robust and calibrated hydraulic models). At a national and utility level, the relation between flooding and discharge occurrences and higher rain-derived inflows was not always obvious, because of insufficient monitoring of overflows. However, at a utility level, it was possible to cascade down the analysis with more detailed data, and a strong relation between seasonal undue inflows and energy demands was found and quantified. An increase of four to seven times in energy consumption and GHG emissions because of overall undue inflows was observed. This increases to 5–10 times during rain events because of rain-derived inflows. In the case study utilities, infiltration has lower influence.
At a subsystem level, it was possible to quantify the impact of reducing UI, making clearer the benefits on energy consumption and GHG emissions, with a due quantification of flooding and discharges. Additionally, a way to select a target for UI reduction was presented. In the case study, energy consumption and GHG emissions would reduce when rain-derived inflow is cut down to 25% or when infiltration is cut down to 50%.
Interconnections between urban drainage systems and poor assets condition, together with low maintenance, are bound to be the origin of undue inflows and of the undesirable flooding and discharges upstream of PS and WWTP, with consequences on public health, safety, the environment, economic performance, and quality of service. Acting on the causes of UI, including the improvement of asset condition, is a labor and resource-intensive task, and utilities need to understand the medium-term benefits of such investments. Acting in UI control only envisaging reduced energy consumption might not lead to the expected result. Initially, there will be a decrease in discharged or flooded volume and only later will the impact be reflected in the reduction in high volumes and, consequently, in the associated energy consumption.
Globally, data availability and reliability are low in wastewater systems. The conditioned knowledge directly affects the calculation of performance metrics, so these metrics must be adapted to the existing data. The proposed methods to assess the magnitude of the problem are suited to different maturity levels of the utilities and are applied to the entire system, including overflows. The simplifications presented in the assessment levels are based on reasonable assumptions and practical experience of working with wastewater utilities. The methodology provides a way to quantify the actual performance and to assess the potential and effectiveness of measures thus positively contributing to decision making.
Results show an additional opportunity for utilities to get return from investments on monitoring. Overall, data are essential to support management decisions and to improve system performance. Further research should focus on adapting and extending the proposed methodology to different case studies and to the reality of other countries. The application of the most detailed parts of the methodology requires having reliable data with less uncertainty and collected with shorter acquisition time by monitoring systems, allowing to reduce the results uncertainty.
Author Contributions
The conceptual idea of this paper was by M.d.C.A. and C.J. Data analysis and investigation were carried out by C.J., M.d.C.A. and R.S.B. Original draft preparation was developed by C.J., M.d.C.A. and R.S.B. The writing, review, and editing were carried out by C.J., M.d.C.A., R.S.B. and D.C. All authors have read and agreed to the published version of the manuscript.
Funding
This research was funded by the Portuguese Foundation for Science and Technology (FCT) through the IST research unit CERIS (UIDB/04625/2020) and the Ph.D. Research Studentship PD/BD/135587/2018.
Institutional Review Board Statement
Not applicable.
Informed Consent Statement
Not applicable.
Data Availability Statement
The data presented in this study are contained within the article.
Acknowledgments
The authors gratefully acknowledge the support of the Foundation for Science and Technology (FCT) through funding UIDB/04625/2020 from the IST research unit CERIS and also the Ph.D. Research Studentship of Catarina Jorge (grant number PD/BD/135587/2018). The authors thank the following Portuguese utilities for the collaboration in the validation of the methodology, in particular: Águas do Algarve, Águas do Norte, Águas da Serra, CMLisboa, INOVA and SMAS de Sintra.
Conflicts of Interest
The authors declare no conflict of interest.
Appendix A

Table A1.
Complete P7–P10 metrics formulation.
| Metric | Description | Formulation |
|---|---|---|
| P7 Energy consumption in periods with precipitation (−) | Ratio between energy consumption in the 3 months with the highest rainfall and in the 3 months with lowest rainfall | |
| P8 Effect of UI in energy (−) | Ratio between energy consumption associated with UI and with dry weather | |
| P9 Effect of infiltration in energy (−) | Ratio between energy consumption associated with infiltration and with dry weather | |
| P10 Effect of rain-derived inflows in energy (−) | Ratio between energy consumption associated with rain-derived inflows and with dry weather |
Appendix B
Table A2.
National characterization for the evaluation of the W-E-G nexus for 2015.
| Variable/Year | Annual Rainfall (mm) | N. º PS | N. º WWTP | N. º Weirs | Monitored Weirs (%) | N. º Floods | Min | P25 | Median | Average | P75 | Max | Boxplot (1) |
|---|---|---|---|---|---|---|---|---|---|---|---|---|---|
| 2015 | 599.6 | 5375 | 2673 | 6851 | 71 | 10,772 | |||||||
| Total energy consumption (kWh/year) | 0 | 13,420 | 66,301 | 1,571,982 | 220,882 | 1.18 × 10⁸ |  | ||||||
| Energy consumption for pumping (kWh/year) | 0 | 461 | 17,156 | 326,984 | 80,332 | 1.94 × 10⁷ |  | ||||||
| Collected/treated wastewater volume (m3/year) | 93 792 | 379,491 | 793,060 | 6,324,712 | 2,637,812 | 4.84 × 10⁸ |  | ||||||
(1) Some outliers were removed to facilitate the graphical reading.
Table A3.
National characterization for the evaluation of the W-E-G nexus for 2016.
| Variable/Year | Annual Rainfall (mm) | N. º PS | N. º WWTP | N. º Weirs | Monitored Weirs (%) | N. º Floods | Min | P25 | Median | Average | P75 | Max | Boxplot (1) |
|---|---|---|---|---|---|---|---|---|---|---|---|---|---|
| 2016 | 991.6 | 5641 | 2743 | 2071 | 53 | 13,041 | |||||||
| Total energy consumption (kWh/year) | 0 | 18,328 | 71,572 | 1,699,059 | 287,192 | 1.22 × 10⁸ |  | ||||||
| Energy consumption for pumping (kWh/year) | 0 | 1716 | 36,792 | 748,795 | 169,448 | 2.05 × 10⁷ |  | ||||||
| Collected/treated wastewater volume (m3/year) | 56,040 | 431,593 | 928,722 | 7,458,093 | 311,580 | 5.68 × 10⁸ |  | ||||||
(1) Some outliers were removed to facilitate the graphical reading.
Table A4.
National characterization for the evaluation of the W-E-G nexus for 2017.
| Variable/Year | Annual Rainfall (mm) | N. º PS | N. º WWTP | N. º Weirs | Monitored Weirs (%) | N. º Floods | Min | P25 | Median | Average | P75 | Max | Boxplot (1) |
|---|---|---|---|---|---|---|---|---|---|---|---|---|---|
| 2017 | 541.3 | 5668 | 2708 | 1157 | 44 | 12,308 | |||||||
| Total energy consumption (kWh/year) | 0 | 16,731 | 70,881 | 1,683,566 | 328,151 | 8.77 × 10⁷ |  | ||||||
| Energy consumption for pumping (kWh/year) | 0 | 5743 | 32,096 | 595,261 | 156,615 | 1.60 × 10⁷ |  | ||||||
| Collected/treated wastewater volume (m3/year) | 63,268 | 348,086 | 853,829 | 6,064,429 | 2,689,580 | 3.69 × 10⁸ |  | ||||||
(1) Some outliers were removed to facilitate the graphical reading.
Table A5.
National characterization for the evaluation of the W-E-G nexus for 2018.
| Variable/Year | Annual Rainfall (mm) | N. º PS | N. º WWTP | N. º Weirs | Monitored Weirs (%) | N. º Floods | Min | P25 | Median | Average | P75 | Max | Boxplot (1) |
|---|---|---|---|---|---|---|---|---|---|---|---|---|---|
| 2018 | 939.9 | 5821 | 2715 | 1097 | 58 | 11,079 | |||||||
| Total energy consumption (kWh/year) | 0 | 17,458 | 62,756 | 1,742,734 | 274,542 | 9.22 × 10⁷ |  | ||||||
| Energy consumption for pumping (kWh/year) | 0 | 20,71 | 211,54 | 558,493 | 170,931 | 1.52 × 10⁷ |  | ||||||
| Collected/treated wastewater volume (m3/year) | 58,521 | 373,923 | 926,211 | 6,672,083 | 3,005,179 | 3.92 × 10⁸ |  | ||||||
(1) Some outliers were removed to facilitate the graphical reading.
Table A6.
National characterization for the evaluation of the W-E-G nexus for 2019.
| Variable/Year | Annual Rainfall (mm) | N. º PS | N. º WWTP | N. º Weirs | Monitored Weirs (%) | N. º Floods | Min | P25 | Median | Average | P75 | Max | Boxplot (1) |
|---|---|---|---|---|---|---|---|---|---|---|---|---|---|
| 2019 | 755.6 | 5983 | 2724 | 1549 | 48 | 11,517 | |||||||
| Total energy consumption (kWh/year) | 0 | 17,063 | 73,024 | 1,885,040 | 277,509 | 8.77 × 10⁷ |  | ||||||
| Energy consumption for pumping (kWh/year) | 0 | 1420 | 25,423 | 538,217 | 159,647 | 1.52 × 10⁷ |  | ||||||
| Collected/treated wastewater volume (m3/year) | 65,648 | 381,769 | 941,341 | 6,920,595 | 2,935,901 | 3.74 × 10⁸ |  | ||||||
(1) Some outliers were removed to facilitate the graphical reading.
References
- Nair, S.; George, B.; Malano, H.M.; Arora, M.; Nawarathna, B. Water–energy–greenhouse gas nexus of urban water systems: Review of concepts, state-of-art and methods. Resour. Conserv. Recycl. 2014, 89, 1–10. [Google Scholar] [CrossRef]
- Chhipi-Shrestha, G.; Hewage, K.; Sadiq, R. Water–energy–carbon nexus modeling for urban water systems: System dynamics approach. J. Water Resour. Plann. Manag. 2017, 143, 1–11. [Google Scholar] [CrossRef]
- Lee, M.; Keller, A.A.; Chiang, P.; Den, W.; Wang, H.; Hou, C.; Wu, J.; Wang, X.; Yan, J. Water-energy nexus for urban water systems: A comparative review on energy intensity and environmental impacts in relation to global water risks. Appl. Energy 2017, 205, 589–601. [Google Scholar] [CrossRef] [Green Version]
- Singh, P.; Kansal, A. Energy and GHG accounting for wastewater infrastructure. Resour. Conserv. Recycl. 2018, 128, 499–507. [Google Scholar] [CrossRef]
- IPCC. 2021: Summary for Policymakers. In Climate Change 2021: The Physical Science Basis; Masson Delmotte, V., Zhai, P., Pirani, A., Connors, S.L., Péan, C., Berger, S., Caud, N., Chen, Y., Goldfarb, L., Gomis, M.I., et al., Eds.; Contribution of Working Group I to the Sixth Assessment Report of the Intergovernmental Panel on Climate Change; Cambridge University Press: Cambridge, UK, 2021. [Google Scholar]
- Eurostat. Electricity Prices for Non-Household Consumers—Bi-Annual Data (From 2007 Onwards). Available online: https://ec.europa.eu/eurostat/databrowser/view/nrg_pc_205/default/table?lang=en (accessed on 30 December 2021).
- Our World in Data. Available online: https://ourworldindata.org/grapher/fossil-fuels-share-energy?country=PRT~OWID_WRL~Europe~North+America (accessed on 30 December 2021).
- Rothausen, S.G.; Conway, D. Greenhouse-gas emissions from energy use in the water sector. Nat. Clim. Change 2011, 1, 210–219. [Google Scholar] [CrossRef]
- IEA. Water Energy Nexus. Excerpt from the World Energy Outlook 2016; International Energy Agency: Paris, France, 2016.
- Plappally, A.K.; Lienhard, V.J.H. Energy requirements for water production, treatment, end use, reclamation, and disposal. Renew. Sustain. Energy Rev. 2012, 16, 4818–4848. [Google Scholar] [CrossRef]
- Environment Agency. Renewable energy potential for the water industry. In Report SC070010/R5; Environment Agency: Bristol, UK, 2009. [Google Scholar]
- Elías-Maxil, J.A.; van der Hoek, J.P.; Hofman, J.; Rietveld, L. Energy in the urban water cycle: Actions to reduce the total expenditure of fossil fuels with emphasis on heat reclamation from urban water. Renew. Sustain. Energy Rev. 2014, 30, 808–820. [Google Scholar] [CrossRef] [Green Version]
- Loubet, P.; Roux, P.; Loiseau, E.; Bellon-Maurel, V. Life cycle assessments of urban water systems: A comparative analysis of selected peer-reviewed literature. Water Res. 2014, 67, 187–202. [Google Scholar] [CrossRef] [PubMed]
- Ballard, S.; Porro, J.; Trommsdorff, C. The Roadmap to a Low-Carbon Urban Water Utility: An International Guide to the Wacclim Approach; IWA Publishing: London, UK, 2018. [Google Scholar] [CrossRef]
- Lam, K.L.; van der Hoek, J.P. Low-carbon urban water systems: Opportunities beyond water and wastewater utilities? Environ. Sci. Technol. 2020, 54, 14854–14861. [Google Scholar] [CrossRef] [PubMed]
- Ananda, J. Productivity implications of the water-energy-emissions nexus: An empirical analysis of the drinking water and wastewater sector. J. Clean. Prod. 2018, 196, 1097–1105. [Google Scholar] [CrossRef]
- Zib, L.; Byrne, D.M.; Marston, L.T.; Chini, C.M. Operational carbon footprint of the U.S. water and wastewater sector’s energy consumption. J. Clean. Prod. 2021, 321, 128815. [Google Scholar] [CrossRef]
- Xue, X.; Cashman, S.; Gaglione, A.; Mosley, J.; Weiss, L.; Ma, X.C.; Cashdollar, J.; Garland, J. Holistic analysis of urban water systems in the Greater Cincinnati region: (1) life cycle assessment and cost implications. Water Res. X 2019, 2, 100015. [Google Scholar] [CrossRef] [PubMed]
- Chini, C.M.; Stillwell, A.S. The state of U.S. urban water: Data and the energy-water nexus. Wat. Res. Res. 2018, 54, 1796–1811. [Google Scholar] [CrossRef]
- Jorge, C.; Almeida, M.C.; Covas, D. A novel energy balance tailored for wastewater systems. Urban Water J. 2022, 1–10. [Google Scholar] [CrossRef]
- Jorge, C.; Almeida, M.C.; Covas, D. Energy Balance in Wastewater Systems with Energy Recovery: A Portuguese Case Study. Infrastructures 2021, 6, 141. [Google Scholar] [CrossRef]
- Jenssen Sola, K.; Bjerkholt, J.T.; Lindholm, O.G.; Ratnaweera, H. Infiltration and Inflow (I/I) to Wastewater Systems in Norway, Sweden, Denmark, and Finland. Water 2018, 10, 1696. [Google Scholar] [CrossRef] [Green Version]
- Vasilaki, V.; Conca, V.; Frison, N.; Eusebi, A.L.; Fatone, F.; Katsou, E. A knowledge discovery framework to predict the N2O emissions in the wastewater sector. Water Res. 2020, 178, 115799. [Google Scholar] [CrossRef]
- Water UK. Net zero 2030 Routemap; 2020; Available online: https://www.water.org.uk/routemap2030/wp-content/uploads/2020/11/Water-UK-Net-Zero-2030-Routemap.pdf (accessed on 4 January 2022).
- Zhang, Q.; Smith, K.; Zhao, X.; Jin, X.; Wang, S.; Shen, J.; Ren, J.Z. Greenhouse gas emissions associated with urban water infrastructure: What we have learnt from China’s practice. WIREs Water 2021, 8, e1529. [Google Scholar] [CrossRef]
- Mouri, G.; Oki, T. Modelling the catchment-scale environmental impacts of wastewater treatment in an urban sewage system for CO2 emission assessment. Water Sci. Technol. 2010, 62, 972–984. [Google Scholar] [CrossRef]
- Almeida, M.C.; Brito, R.S.; Jorge, C.; Cardoso, M.A. Performance Assessment System to Wastewater Utilities Strategic Planning. Water 2021, 13, 2489. [Google Scholar] [CrossRef]
- Jorge, C.; Almeida, M.C.; Covas, D. Performance Assessment System for Energy Efficiency in Wastewater Systems. Water 2021, 13, 1807. [Google Scholar] [CrossRef]
- Almeida, M.C.; Brito, R.S.; Jorge, C. Estimation of Undue Inflows in Drainage Systems. to be submitted.
- Decree-law 71/2008—Decree-law n.º 71/2008, de 15 de abril. Diário da República n.º 74/2008, Série I de 2008–04-15. pp. 2222–2226. Available online: https://dre.pt/dre/detalhe/decreto-lei/71-2008-249821 (accessed on 30 December 2021). (In Portuguese).
- Almeida, M.C.; Brito, R.S.; Jorge, C.; Ribeiro, A.S.; Simões, C. Afluências indevidas a sistemas de drenagem urbana: Uma abordagem integrada. In Encontro Nacional de Entidades Gestoras; ENEG: Vilamoura, Portugal, 2021. (In Portuguese) [Google Scholar]
- Jorge, C.; Almeida, M.C.; Covas, D. Impacto de afluências indevidas no consumo energético em instalações elevatórias em sistemas de drenagem urbana. Rev. Águas E Resíduos 2021, 9, 29–40. [Google Scholar] [CrossRef]
- ERSAR. Available online: https://www.ersar.pt/pt (accessed on 30 December 2021).
- IPMA. Available online: https://www.ipma.pt/ (accessed on 30 December 2021).
- Brito, R.S.; Almeida, M.C.; Ribeiro, A.S. Enhancing hydraulic data reliability in sewers. Water Pract. Technol. 2022, 17, 431–444. [Google Scholar] [CrossRef]
- Cardoso, M.A.; Almeida, M.C.; Santos Silva, M. Sewer asset management planning—implementation of a structured approach in wastewater utilities. Urban Water J. 2016, 13, 15–27. [Google Scholar] [CrossRef]
Figure 1.
Water sector processes managed by service providers in urban areas (shaded boxes).

Figure 2.
Integrated view of the system.

Figure 3.
Venteira case study: (a) daily dry weather pattern, (b) rainfall event, and (c) network scheme.
Figure 3.
Venteira case study: (a) daily dry weather pattern, (b) rainfall event, and (c) network scheme.


Figure 4.
National characterization for the evaluation of the W-E-G nexus: (a) floods, monitored weirs vs. rainfall, (b) wastewater collected or treated volume vs. rainfall, and (c) energy consumption for pumping vs. rainfall.
Figure 4.
National characterization for the evaluation of the W-E-G nexus: (a) floods, monitored weirs vs. rainfall, (b) wastewater collected or treated volume vs. rainfall, and (c) energy consumption for pumping vs. rainfall.

Figure 5.
Results of evaluation at national level for (a) percentage of total energy consumption used for pumping (P1) for type A utilities (left) and type B utilities (right) and (b) specific GHG emissions associated with wastewater treated volume (P11).
Figure 5.
Results of evaluation at national level for (a) percentage of total energy consumption used for pumping (P1) for type A utilities (left) and type B utilities (right) and (b) specific GHG emissions associated with wastewater treated volume (P11).

Figure 6.
Results of evaluation at utility level for (a) percentage of total energy consumption used for WW treatment (P2) for type A (left) and type B utilities (right), (b) specific GHG emissions associated with pumped volume (P12), and (c) specific GHG emissions associated with wastewater treated volume (P13).

Figure 7.
Results of evaluation at utility level for (a) inflow seasonality (P4) and inflows in periods with precipitation (P5), (b) energy consumption seasonality (P6) in periods with precipitation (P7), and (c) effect of undue inflows (P8), of infiltration (P9), and of rain-derived inflows (P10) in energy.

Figure 8.
Impact of UI in energy consumption and in discharged and flooded volumes associated with (a) rain-derived inflows and (b) infiltration (no flooding occurrence).
Figure 8.
Impact of UI in energy consumption and in discharged and flooded volumes associated with (a) rain-derived inflows and (b) infiltration (no flooding occurrence).

Figure 9.
Total equivalent energy consumption for the different UI scenarios.

Table 1.
Performance metrics to support evaluation of W-E-G components.
| Performance Metric (Pi) | Description | Reference Values (Good; Fair; Poor) | Assessment Level |
|---|---|---|---|
| P1 Percentage of total energy consumption used for pumping (%) 1 | Energy consumption for pumping in relation to the total energy consumption | A: [0, 15]; ]15, 30[; [30, 100] B: [0, 5]; ]5, 40[; [40, 100] | National |
| P2 Percentage of total energy consumption used for WW treatment (%) 1 | Energy consumption for treatment in relation to the total energy consumption | A: [0, 5]; ]5, 50[; [50, 100] B: [0, 5]; ]5, 30[; [30, 100] | Utility |
| P3 Percentage of energy equivalent to the volume generated in the served area used for pumping (%) 1 | Total energy used to pump the total volume from the served area if there were no limitations on the transport capacity of the network upstream of the pumping installation | [95, 100]; [80, 95[; [0, 80[ | Subsystem |
| P4 Inflows seasonality (−) 2 | Ratio between inflows in the 3 months with the highest volumes and those in the 3 months with the lowest volumes | [1, 1.25[; [1.25, 2.0[; [2.0, +∞[ | Utility |
| P5 Inflows in periods with precipitation (−) 2 | Ratio between inflows in the 3 months with the highest rainfall and those in the 3 months with the lowest rainfall | [0, 2.0[; [2.0, 5.0[; [5.0, +∞[ | Utility |
| P6 Energy consumption seasonality (−) 1 | Ratio between energy consumption in the 3 months of highest consumption and that in the 3 months of lowest consumption | [1.0, 1.75[; [1.75, 2.5[; [2.5, +∞[ | Utility |
| P7 Energy consumption in periods with precipitation (−) | Ratio between energy consumption in the 3 months with the highest rainfall and that in the 3 months with the lowest rainfall | [1.0, 1.75[; [1.75, 2.5[; [2.5, +∞[ | Utility |
| P8 Effect of UI in energy (−) | Ratio between energy consumption related with UI and with dry weather | [0, 2.0[; [2.0, 5.0[; [5.0, +∞[ | Utility |
| P9 Effect of infiltration in energy (−) | Ratio between energy consumption related with infiltration and with dry weather | [0, 2.0[; [2.0, 5.0[; [5.0, +∞[ | Utility |
| P10 Effect of rain-derived inflows in energy (−) | Ratio between energy consumption related with rain-derived inflows and with dry weather | [0, 2.0[; [2.0, 5.0[; [5.0, +∞[ | Utility |
| P11 Specific GHG emissions associated with total WW volume (kgCO2 eq/m3) 3 | Ratio between greenhouse gas emissions associated with the total energy consumption and the volume of wastewater collected or treated | [0, 0.2]; ]0.2, 0.34]; ]0.34, +∞[ | National |
| P12 Specific GHG emissions associated with pumped volume (kg CO2 eq/m3) 3 | Ratio between greenhouse gas emissions associated with the energy consumption for pumping and the pumped volume | [0, 0.27]; ]0.27, 0.34]; ]0.34, +∞[ | Utility Subsystem |
| P13 Specific GHG emissions associated with wastewater treated volume (kgCO2 eq/m3) 3 | Ratio between greenhouse gas emissions associated with the energy consumption for treatment and the volume of wastewater collected or treated | [0, 0.13]; ]0.13, 0.27]; ]0.27, +∞[ | Utility |
| P14 Specific GHG emissions associated with volume generated in the served area (kgCO2 eq/m3) 1 | Ratio between greenhouse gas emissions associated with the energy consumption associated with the total volume generated in the served area and the volume of wastewater collected or treated | - | Subsystem |
Table 2.
Characteristics of systems used in evaluation at utility level.
| Utility | Served Area and Type of System | Sewer Length (km) | PS (n.) | WWTP (n.) |
|---|---|---|---|---|
| 1 | Mostly rural, A | 32 | 3 | 23 |
| 2 | Mostly rural, A | 447 | 192 | 65 |
| 3 | Mostly rural, B | 546 | 66 | 9 |
| 4 | Mostly rural, A | 1498 | 380 | 176 |
| 5 | Averagely urban, B | 1539 | 85 | 16 |
| 6 | Mostly urban, B | 977 | 26 | 16 |
| 7 | Mostly urban, B | 55 | 2 | 0 |
| 8 | Averagely urban, B | 444 | 17 | 1 |
| 9 | Mostly urban, B | 619 | 0 | 0 |
Table 3.
Results for P3, P12, and P14 performance metrics for the subsystem level.
| Scenario/Performance Metric | P3 (%) | P12 (kgCO2 eq/m3) | P14 (kgCO2 eq/m3) |
|---|---|---|---|
| Rain-derived inflows (% of inflowing) | |||
| 100% | 61 | 0.022 | 0.036 |
| 75% | 75 | 0.027 | 0.036 |
| 50% | 90 | 0.033 | 0.037 |
| 25% | 99 | 0.036 | 0.037 |
| 10% | 100 | 0.040 | 0.040 |
| 0% (dry weather) | 100 | 0.035 | 0.035 |
| Infiltration (% of daily dry weather volume) | |||
| 100% | 86 | 0.019 | 0.022 |
| 75% | 98 | 0.034 | 0.035 |
| 50% | 100 | 0.049 | 0.049 |
| 25% | 100 | 0.042 | 0.042 |
| 10% | 100 | 0.038 | 0.038 |
| 0% (dry weather) | 100 | 0.035 | 0.035 |
Publisher’s Note: MDPI stays neutral with regard to jurisdictional claims in published maps and institutional affiliations. |
© 2022 by the authors. Licensee MDPI, Basel, Switzerland. This article is an open access article distributed under the terms and conditions of the Creative Commons Attribution (CC BY) license (https://creativecommons.org/licenses/by/4.0/).
Share and Cite
MDPI and ACS Style
Jorge, C.; Almeida, M.d.C.; Brito, R.S.; Covas, D. Water, Energy, and Emissions Nexus: Effect of Inflows in Urban Drainage Systems. Water 2022, 14, 868. https://doi.org/10.3390/w14060868
AMA Style
Jorge C, Almeida MdC, Brito RS, Covas D. Water, Energy, and Emissions Nexus: Effect of Inflows in Urban Drainage Systems. Water. 2022; 14(6):868. https://doi.org/10.3390/w14060868
Chicago/Turabian StyleJorge, Catarina, Maria do Céu Almeida, Rita Salgado Brito, and Dídia Covas. 2022. "Water, Energy, and Emissions Nexus: Effect of Inflows in Urban Drainage Systems" Water 14, no. 6: 868. https://doi.org/10.3390/w14060868
Note that from the first issue of 2016, this journal uses article numbers instead of page numbers. See further details here.