
Monitoring Recent Changes in Drought and Wetness in the Source Region of the Yellow River Basin, China
by
 , , , and
Yanqun Ren
1,2 ,
,
Jinping Liu
1,3,*,
Masoud Jafari Shalamzari
4,5,
Arfan Arshad
6,
Suxia Liu
2,7,
Tie Liu
8,* and
Hui Tao
8 1
College of Surveying and Geo-Informatics, North China University of Water Resources and Electric Power, Zhengzhou 450046, China
2
Key Laboratory of Water Cycle and Related Land Surface Processes, Institute of Geographic Sciences and Natural Resources Research, Chinese Academy of Sciences, Beijing 100101, China
3
Key Laboratory of Hydrology-Water Resources and Hydraulic Engineering, Hohai University, Nanjing 210098, China
4
Department of Environment, Tabas Branch, Tabas 9791735618, Iran
5
Key Laboratory of Digital Earth Science, Aerospace Information Research Institute, University of Chinese Academy of Sciences, Beijing 100094, China
6
Department of Biosystems and Agricultural Engineering, Oklahoma State University, Stillwater, OK 74078, USA
7
College of Resources and Environment/Sino-Danish College, University of Chinese Academy of Sciences, Beijing 100190, China
8
State Key Laboratory of Desert and Oasis Ecology, Xinjiang Institute of Ecology and Geography, Chinese Academy of Sciences, Urumqi 830011, China
*
Authors to whom correspondence should be addressed.
Water 2022, 14(6), 861; https://doi.org/10.3390/w14060861
Submission received: 28 January 2022
/
Revised: 7 March 2022
/
Accepted: 8 March 2022
/
Published: 10 March 2022
(This article belongs to the Special Issue The Interrelationship between Climate Change, Human Activities and Hydrological Processes)
Abstract
:The source region of the Yellow River Basin (SRYRB) is not only sensitive to climate change and the vulnerable region of the ecological environment but also the primary runoff generating region of the Yellow River Basin (YRB). Its changes of drought and wetness profoundly impact water resources security, food production and ecological environment in the middle and downward reaches of YRB. In the context of global warming, based on daily precipitation, maximum and minimum temperature of 12 national meteorological stations around and within SRYRB during 1960–2015, this study obtained standardized precipitation index (SPI) and reconnaissance drought index (RDI) on 1-, 3-, 6- and 12-month scales, and then compared the consistency of SPI and RDI in many aspects. Finally, the temporal and spatial variation characteristics of drought and wetness in the SRYRB during 1960–2015 were analyzed in this study. The results showed that SPI and RDI have high consistency on different time scales (correlation coefficient above 0.92). According to the average distribution and change trend of the RDI, SRYRB presented an overall wetness state on different time scales. We found an increasing trend in wetness since the early 1980s. In terms of wetness events of different magnitudes, the highest frequency for moderate and severe ones was in June (12.7%) and February (5.5%), respectively, and for extreme wetness events, both September and January had the highest frequency (1.8%). Among the four seasons, the change rate of RDI in spring was the largest with a value of 0.38 decade−1, followed by winter (0.36 decade−1) and autumn (0.2 decade−1) and the smallest in summer (0.1 decade−1). There was a greater consistency between RDI values of larger time scales such as annual and vegetation growing seasonal (VGS) scales in SRYRB. There was generally a growing trend in wetness in the VGS time scale. These findings presented in this study can provide data support for drought and wetness management in SRYRB.
1. Introduction
Drought and flood are two of the most severe meteorological disasters to impact human society and occur widely and frequently in China [1,2], causing considerable damage to the living environment of humans [3]. They have become stronger in frequency, severity and duration under the rapid development of the economy and society [4,5]. The drought or flood disaster is a complex and multivariate phenomenon influenced by diverse physical and biological processes [6], and its spatial variation characteristics vary significantly with geography and climate [7,8]. With global warming and the acceleration of the water cycle, the spatiotemporal pattern and structure of precipitation have changed significantly [9,10], which can undoubtedly increase extreme precipitation events, further resulting in increased frequency and intensity of droughts or floods in many regions [11]. There were 7870 meteorological disasters in the world during 1970–2009, which caused 1.86 million deaths and USD 195.4 billion in direct economic losses [12]. According to Shi et al. [2], the population, affected by floods and droughts, increased at rates of 8.7 million and 3.8 million persons/decade, respectively, only in 637 counties (districts) in East China during 1984–2010, and the direct economic losses increased at rates of CNY 12.6 billion/decade and CNY 1.9 billion/decade, respectively. Therefore, it is of great significance to study and understand drought and wetness variability to avoid and mitigate losses caused by drought and flood disasters and to ensure the safety of people’s lives, property and the living environment, especially in mountainous basins.
Originating from the arid Qinghai–Tibet Plateau (QTP) and as the second largest river in China [13], the Yellow River Basin (YRB) is the crucial supply of water resources in northern China, which supports about one-third of the total population [14]. As the global and regional climate has been changing for the past decades, the drought in the YRB has increased significantly at the basin scale [3,15,16]. However, no detailed analysis of drought and wetness variations in the source region of YRB (SRYRB) was reported. SRYRB constitutes only 15.4% of the total YRB area, whereas the annual runoff at Tangnaihai station can hit 35% of the total YRB runoff [17]. As a semi-arid and semi-humid region of the QTP subfrigid zone, the drought or wetness of SRYRB was extremely susceptible to precipitation and temperature [14,18]. In recent decades, the annual precipitation over SRYRB exhibited a significant increasing trend [19] and presented an increasing gradient from the northeast to southwest in spatial patterns [14]. In terms of temperature, the overall trend has been rising with a particularly significant warming trend has existed since the late 1990s. In detail, it can be divided into three stages, namely a cool stage (approximately 1961–1980), a fluctuating stage (approximately 1981–1997) and a warm stage (approximately 1998–2010) [18]. Therefore, under these conditions, the drought and wetness state in SRYRB need to be further studied.
The characterization of drought and wetness is generally analyzed using different drought indices, which are effectively continuous functions of precipitation and other hydrometeorological variables (e.g., temperature and soil moisture) [20]. Among various drought indices, the most widely used is the standardized precipitation index (SPI) based on a probabilistic precipitation approach [21], the Palmer drought severity index (PDSI) based on the soil moisture balance equation [22], the standardized precipitation evapotranspiration index (SPEI) [23] and reconnaissance drought index (RDI) [24,25] based on the water balance (deficit or surplus) probabilistic method. Each of these indices is relevant for a specific drought type (i.e., meteorological drought, hydrological drought and agricultural drought) [26], in which SPI, SPEI and RDI are generally employed in meteorological drought. Xu et al. [27] proved the merits and limitations of SPI, RDI and SPEI through a comprehensive analysis of their spatiotemporal variation in China during 1961–2012, and the results showed that these three drought indices have almost the same performance in humid regions, while SPI and RDI were found to be more appropriate than SPEI in the arid regions. Moreover, the uses of SPI and RDI were validated worldwide [26]. Therefore, the two complementary indices (SPI and RDI) were employed in this study.
This study focuses on spatiotemporal changes of drought and wetness in SRYRB with statistical analyses in three aspects: (1) investigating the consistency of SPI and RDI on monthly, seasonal, vegetation growing seasonal (VGS) and annual scales; (2) analyzing the spatiotemporal variation characteristics of RDI on different time scales; (3) characterizing the variations of drought and wetness events at different levels on monthly, seasonal, VGS and annual scales. Most studies regarding the wetness and drought in the Yellow River Basin have considered the entire region while neglecting the importance of the source region in providing water to the growing population and economy of the downstream area. They have found contrasting and heterogeneous changes in the area given its diverse topography. Therefore, focusing on a specific region of the basin will provide a more accurate picture of water status over the past and future.
2. Materials and Methods
2.1. Study Area
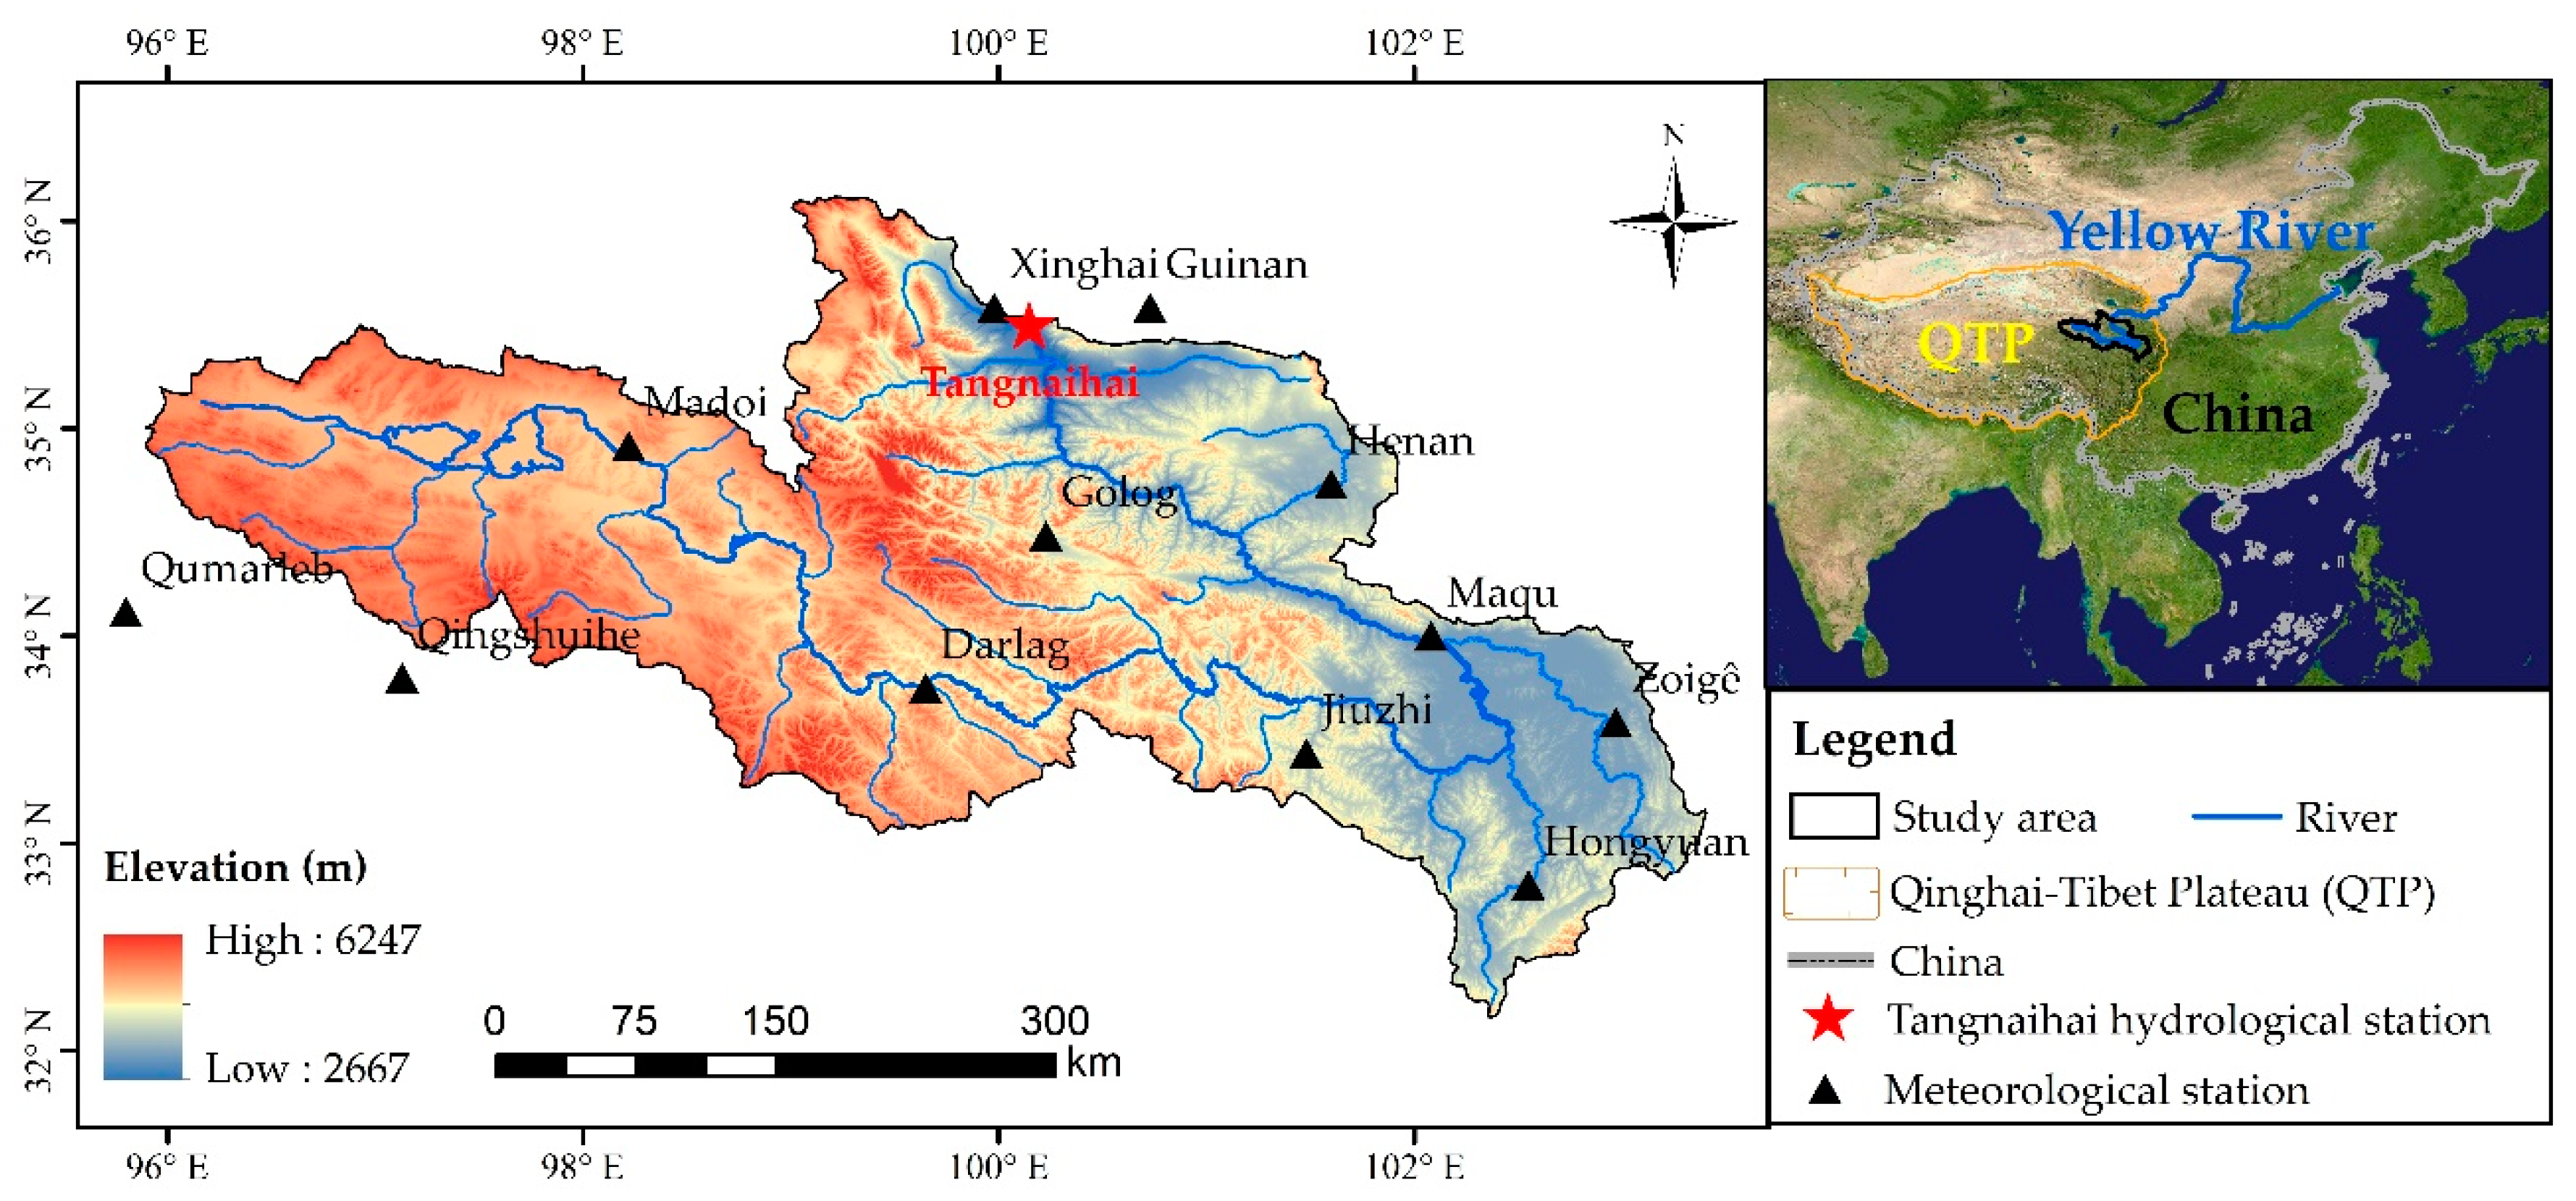
SRYRB (Figure 1) is the catchment of the Yellow River Basin (YRB) above the hydrological station of Tangnaihai, located on the northeast Qinghai–Tibet Plateau (QTP) between 32°10′–36°7′ N and 95°54′–103°24′ E [28]. The drainage area is 120,900 km2, occupying approximately 16% of the YRB [29]. It is bound by the Buqing Mountains in the north, the Bayan Har Mountains in the south and the Yueguzonglie highlands in the west [18], of which the elevation ranges from 2667 m in the east to 6247 m in the west, with the average value of 4129.3 m. Therefore, climatologically, the area belongs to the semi-arid and semi-humid alpine of the QTP subfrigid zone, with long cold and short warm seasons [18]. The climate of SRYRB is greatly influenced by the southwest monsoon and the East Asian summer monsoon, resulting in 75–90% of the annual precipitation in this area falling within June to September [30,31]. The annual precipitation ranges from 300 to 750 mm with the characteristics of low intensity (<50 mm/day) and long duration (10–30 days) [17,30], of which snowfall accounts for less than 10% primarily during November to March [29]. The annual average temperature varies between −3.6 °C and 3.4 °C from southeast to northwest, with the lowest temperature of −36.3 °C in January and the highest of 24.7 °C in August. According to Liang et al. [13], the potential evapotranspiration (PET) is approximately 1300–1400 mm/yr. There are large areas covered with grassland, lakes and swamps in SRYRB, among which grassland accounts for 80% of this area. However, due to a combined effect of long-term overgrazing and climate change, the grassland has experienced severe degradation [32].
2.2. Data Sources and Analysis
In this study, data used for drought indices calculation, including daily series of precipitation, maximum and minimum temperature, were derived from the Daily China Surface Climate Dataset (Version 3), and it was observed and published by the National Meteorological Information Center (NMIC) and China Meteorological Administration (CMA). Within and around the study area, 12 meteorological stations (Figure 1) were selected for their low missing rate of observations. In addition, three meteorological stations around SRYRB were also selected for the proximity of location and similarity of terrain, compared with the nearby region of SRYRB. The details of these meteorological stations used in this study can be observed in Table 1. All observations of the 12 meteorological stations have been filtered with strict quality control (QC), including missing data interpolation, extrema detection and internal consistency check [33], before the calculation of drought indices. Then, daily precipitation was aggregated to monthly precipitation during the hydrological year of 1960/1961 to 2014/2015, and the monthly maximum (Tmax) and minimum (Tmin) temperatures were calculated for each month during the study period based on daily Tmax and Tmin, respectively. A hydrological year is set from September to the next August based on the hydroclimatic regime.
For 12 meteorological stations, Pearson’s correlation and significant test were employed to obtain the correlation coefficients (CC) and significance level, respectively, between SPI and RDI on different time scales.
2.3. Methods
2.3.1. Calculation of Drought Indices
Standardized Precipitation Index:SPI, based on a long-term precipitation series, quantifies the difference in precipitation over a certain period, deficit or surplus, compared to the average during the same period [21]. This index has multiple time scales, from one month to one year. In the calculation procedure of SPI, precipitation series x is generally supposed to obey gamma distribution, and probability density function g(x) and cumulative distribution function G(x) can be described as Equation (1) and Equation (2), respectively:
in which α and β are the shape and scale parameters, respectively, and can be calculated by the maximum likelihood estimation (MLE). Due to the discontinuity of precipitation over time, Equation (3) is used to account for such physical features of precipitation:
in which q represents the probability of zero, and it can be estimated by using a ratio between the number of zeros and the length of the series. Then, SPI is obtained by Equation (4):
in which stands for the standard normal distribution.
Reconnaissance Drought Index: RDI, based on precipitation and potential evapotranspiration (PET), was developed to approach the water deficit in a more accurate manner as a sort of balance between input and output in a water system [25]. It is expressed in the initial value (αk) and the standardized form (RDIst) [34]. αk is calculated for the ith year in a time basis of k consecutive months as follows:
in which Pij and PETij are the cumulative precipitation and PET of the jth month in the ith year, and N is the total number of years of the available data.
By conducting testing, αk was found to obey both the log-normal and gamma distribution [35]. In this study, it was assumed to follow the gamma distribution, and the same procedures as those in the calculation of SPI were transplanted here to obtain RDI (RDIst), according to Equations (1)–(4).
Drought Pattern and Classification: In this study, the monthly, 3-month, 6-month and 12-month scales of SPI and RDI were calculated for each meteorological station during 1960/1961–2014/2015, which were abbreviated as SPI/RDI-1, SPI/RDI-3, SPI/RDI-6 and SPI/RDI-12, respectively. Take SPI as an example, SPI-1 means SPI calculated from September to August of the following year on the monthly scale; SPI-3 denotes the SPI value of autumn (September to November), winter (December to February), spring (March to May) and summer (June to August). For SPI-6, the vegetation growing seasonal (VGS) scale from March to August was selected; finally, the SPI from September to August of the following year was calculated as SPI-12. Then, the spatiotemporal pattern of SPI and RDI on different scales was developed using the Weighted Inverse Distance (IDW) interpolation technique from the 12 meteorological stations spread throughout SRYRB. The basin-scale SPI and RDI were obtained from the average of SPI and RDI over the entire study area, respectively.
The classification of meteorological drought is carried out according to SPI and RDI values. Since SPI and RDI follow similar methodologies, their values should have the same statistical meaning and, thus, are comparable. Therefore, the same thresholds [34,36,37] for both of them were used to classify drought–wetness conditions (Table 2).
2.3.2. Potential Evapotranspiration (PET) Assessment
Many approaches have been used to assess PET, which generally can be divided into three main categories: hydrologic or water balance methods, analytical methods based on climate variables and empirical estimates [38]. The first two categories have complicated structures and relatively high data demanding, for instance, the Variable Infiltration Capacity (VIC) model and Penman–Monteith equations [35]. In contrast, the category of empirical estimates became very popular in data-scarce areas as it is only based on temperature, which, to estimate PET, would produce satisfactory results for RDI calculation [39]. In this category, approaches of Hargreaves [40], Thornthwaite [41] and Blaney-Criddle [42] are well-known samples. From these approaches, Hargreaves requires mean (Tmean, optional), maximum (Tmax) and minimum (Tmin) temperatures, whereas the other two require only mean temperature. Therefore, the Hargreaves method was adopted to estimate PET in this study, and its equation was expressed as Equation (6) [43]:
in which Rs is the global solar radiation at the surface (millimeters/day), which could be computed using Equation (7) [44]:
in which KRS, with the value of 0.16, is an empirical coefficient fitted to Rs/Ra versus TR data, while TR is the difference between Tmax and Tmin; Ra stands for extraterrestrial radiation, and it can be calculated according to time (Julian day in one year) and geographic location.
3. Results
3.1. Difference and Similarities of SPI and RDI
The correlation coefficients between two drought indices on monthly, seasonal, VGS and annual scale were 0.983, 0.987, 0.984 and 0.982, respectively. All CCs between SPI and RDI were more than 0.98 on different time scales and were significant at the level of 0.01. However, slight differences do exist between the two indices. The lowest CC with 0.982 on the annual scale (SPI-12 and RDI-12) was taken, for example, to check the consistency of maximum and minimum values of SPI-12 and RDI-12, which are listed in Table 3. The CCs between the maximum and minimum of SPI-12 and RDI-12 were 0.91 and 0.92, respectively, with a significance level of 0.01. Therefore, there were certain differences in the extreme values of SPI-12 and RDI-12. Moreover, the corresponding extreme values all fell into the same drought classes in Table 2 except for the corresponding maximum values at Qingshuihe, Henan and Jiuzhi stations.
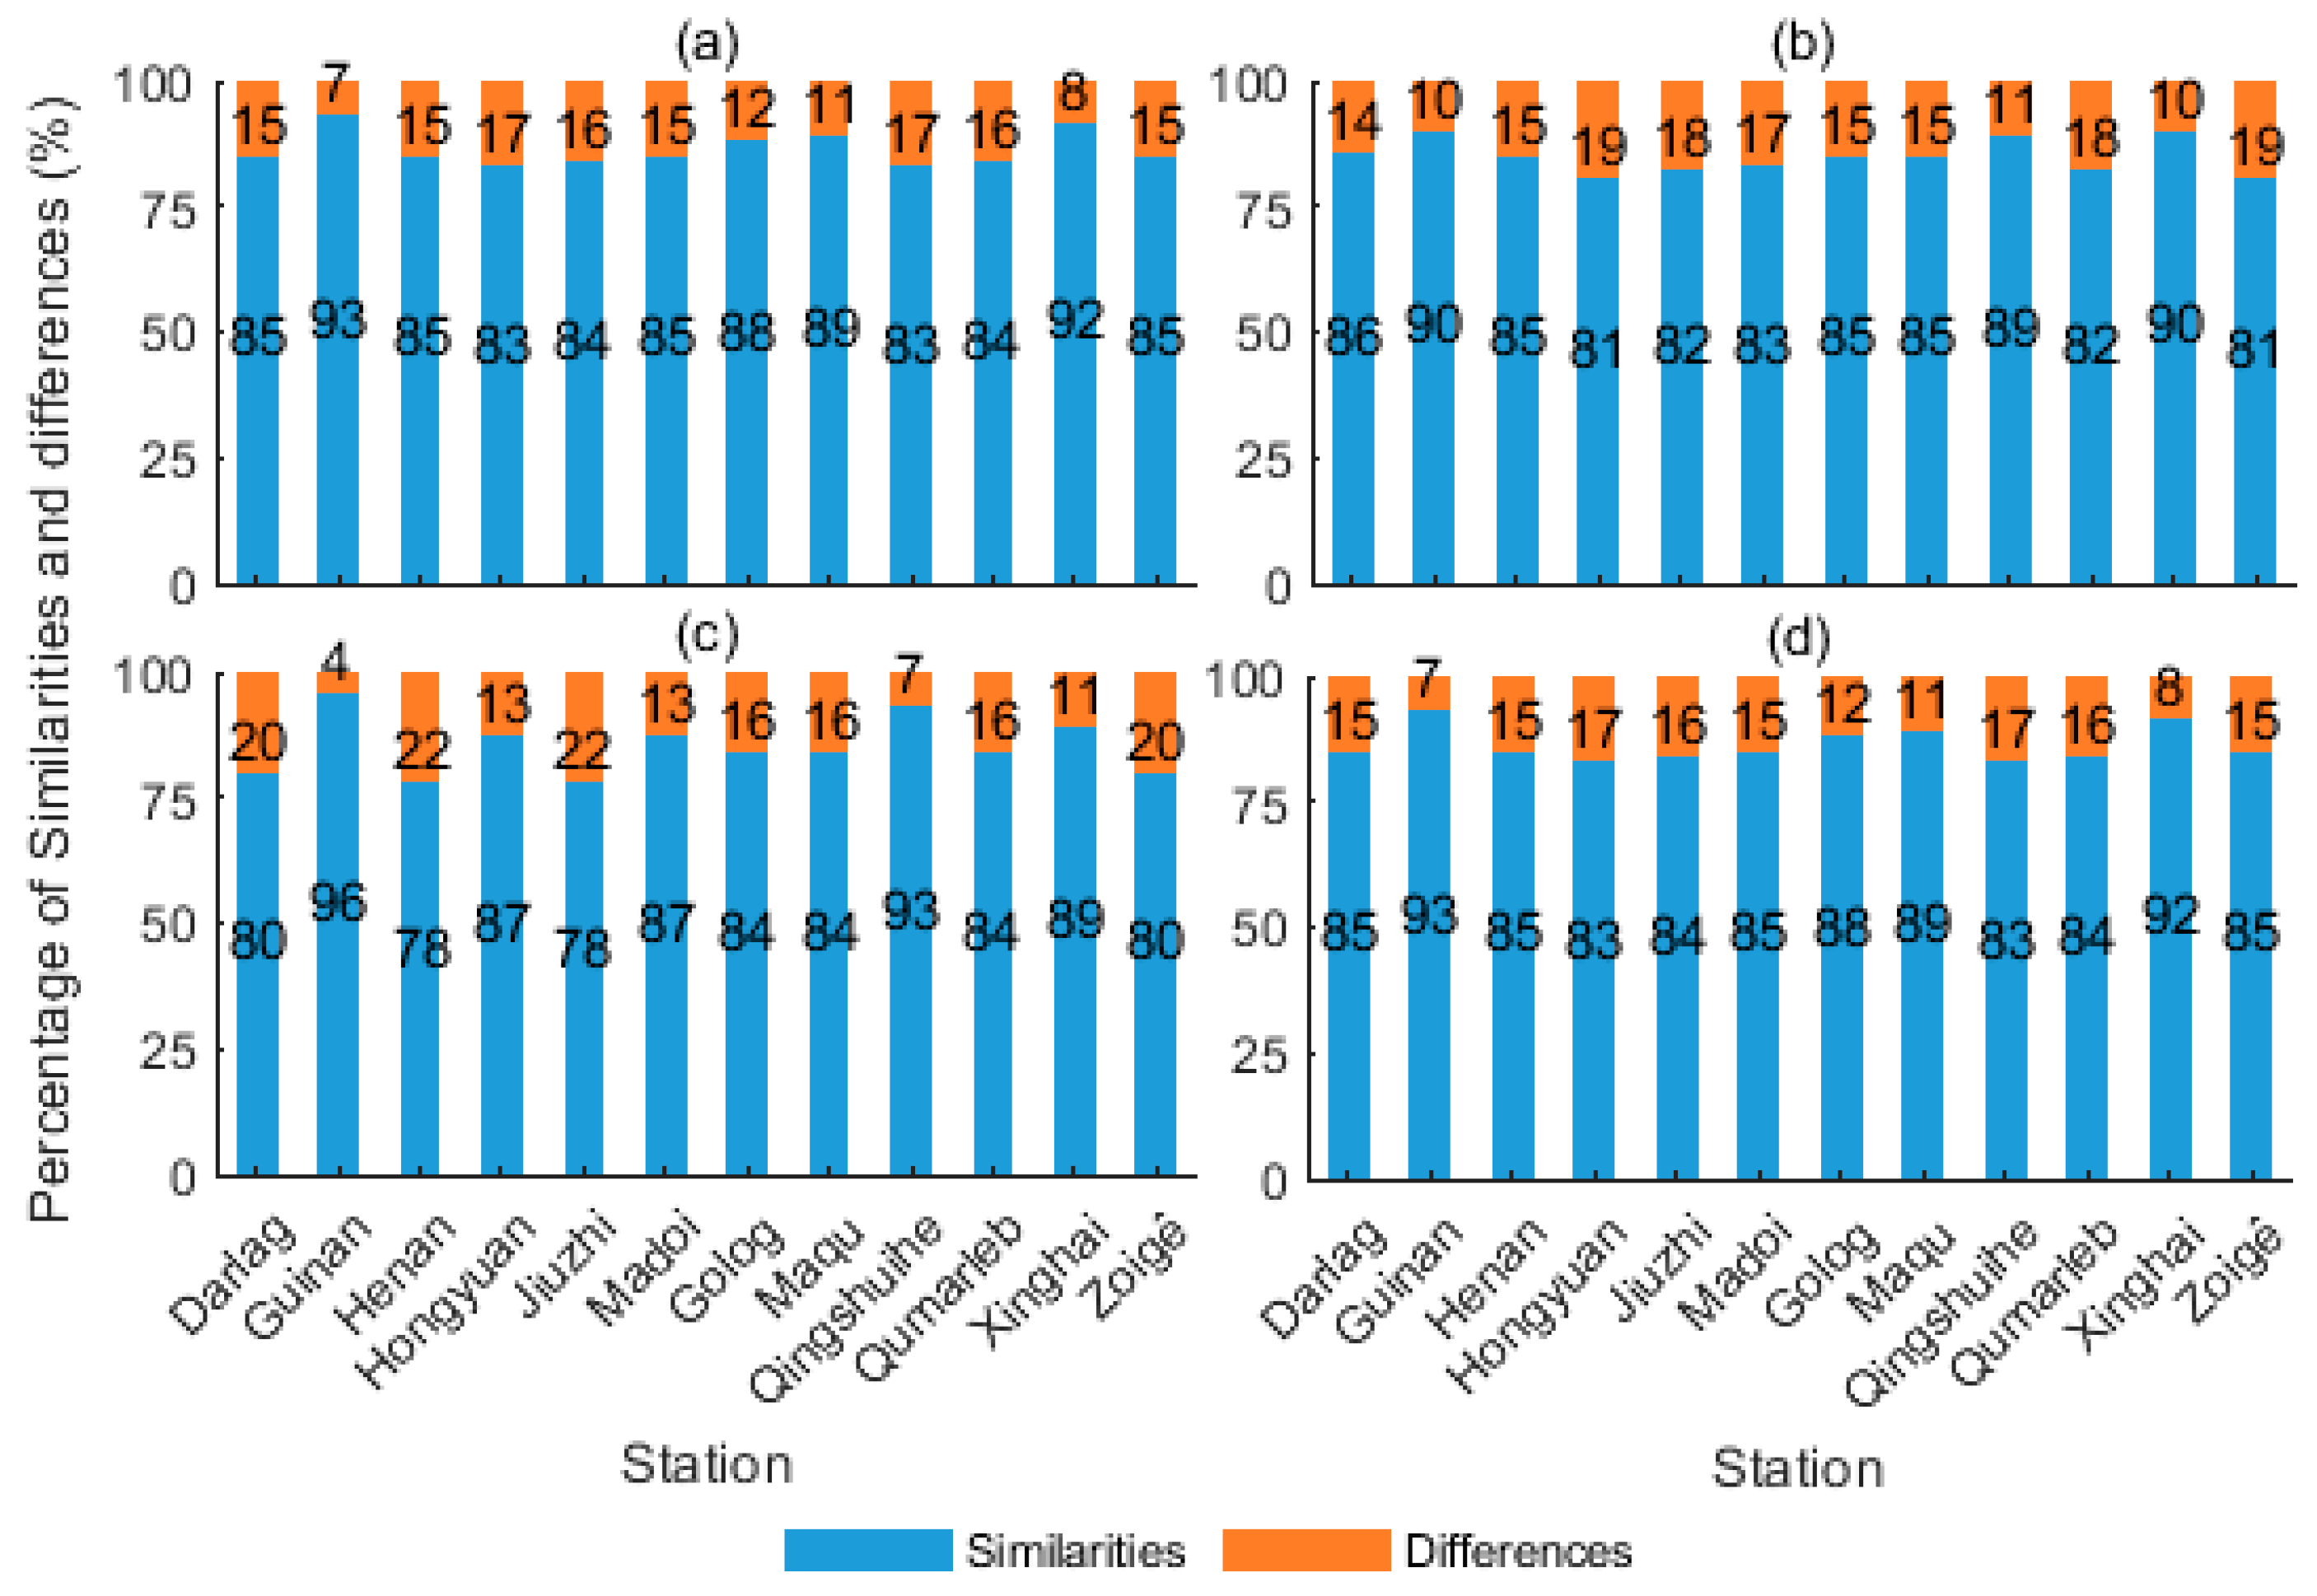
To further check the consistency of the two drought indices, the similarities and differences of drought classes on different time scales were calculated in this study (Figure 2). The differences were no more than 20% for all meteorological stations on monthly, seasonal and annual scales, and the maximum was detected in Hongyuan and Zoigê stations with a value of 19%. On the VGS scale, the differences only at the two stations of Henan and Jiuzhi were 22%, which were beyond 20%. By separating the effects of drought and wetness classes, it was found that these differences were partly dominated by the wetness classes, which could be explained by the effect of temperature-based PET by using the RDI index [36]. Overall, SPI and RDI had high consistency, which simultaneously showed the robustness and applicability of SPI and RDI in SRYRB.
3.2. Spatiotemporal Variation Characteristics of RDI
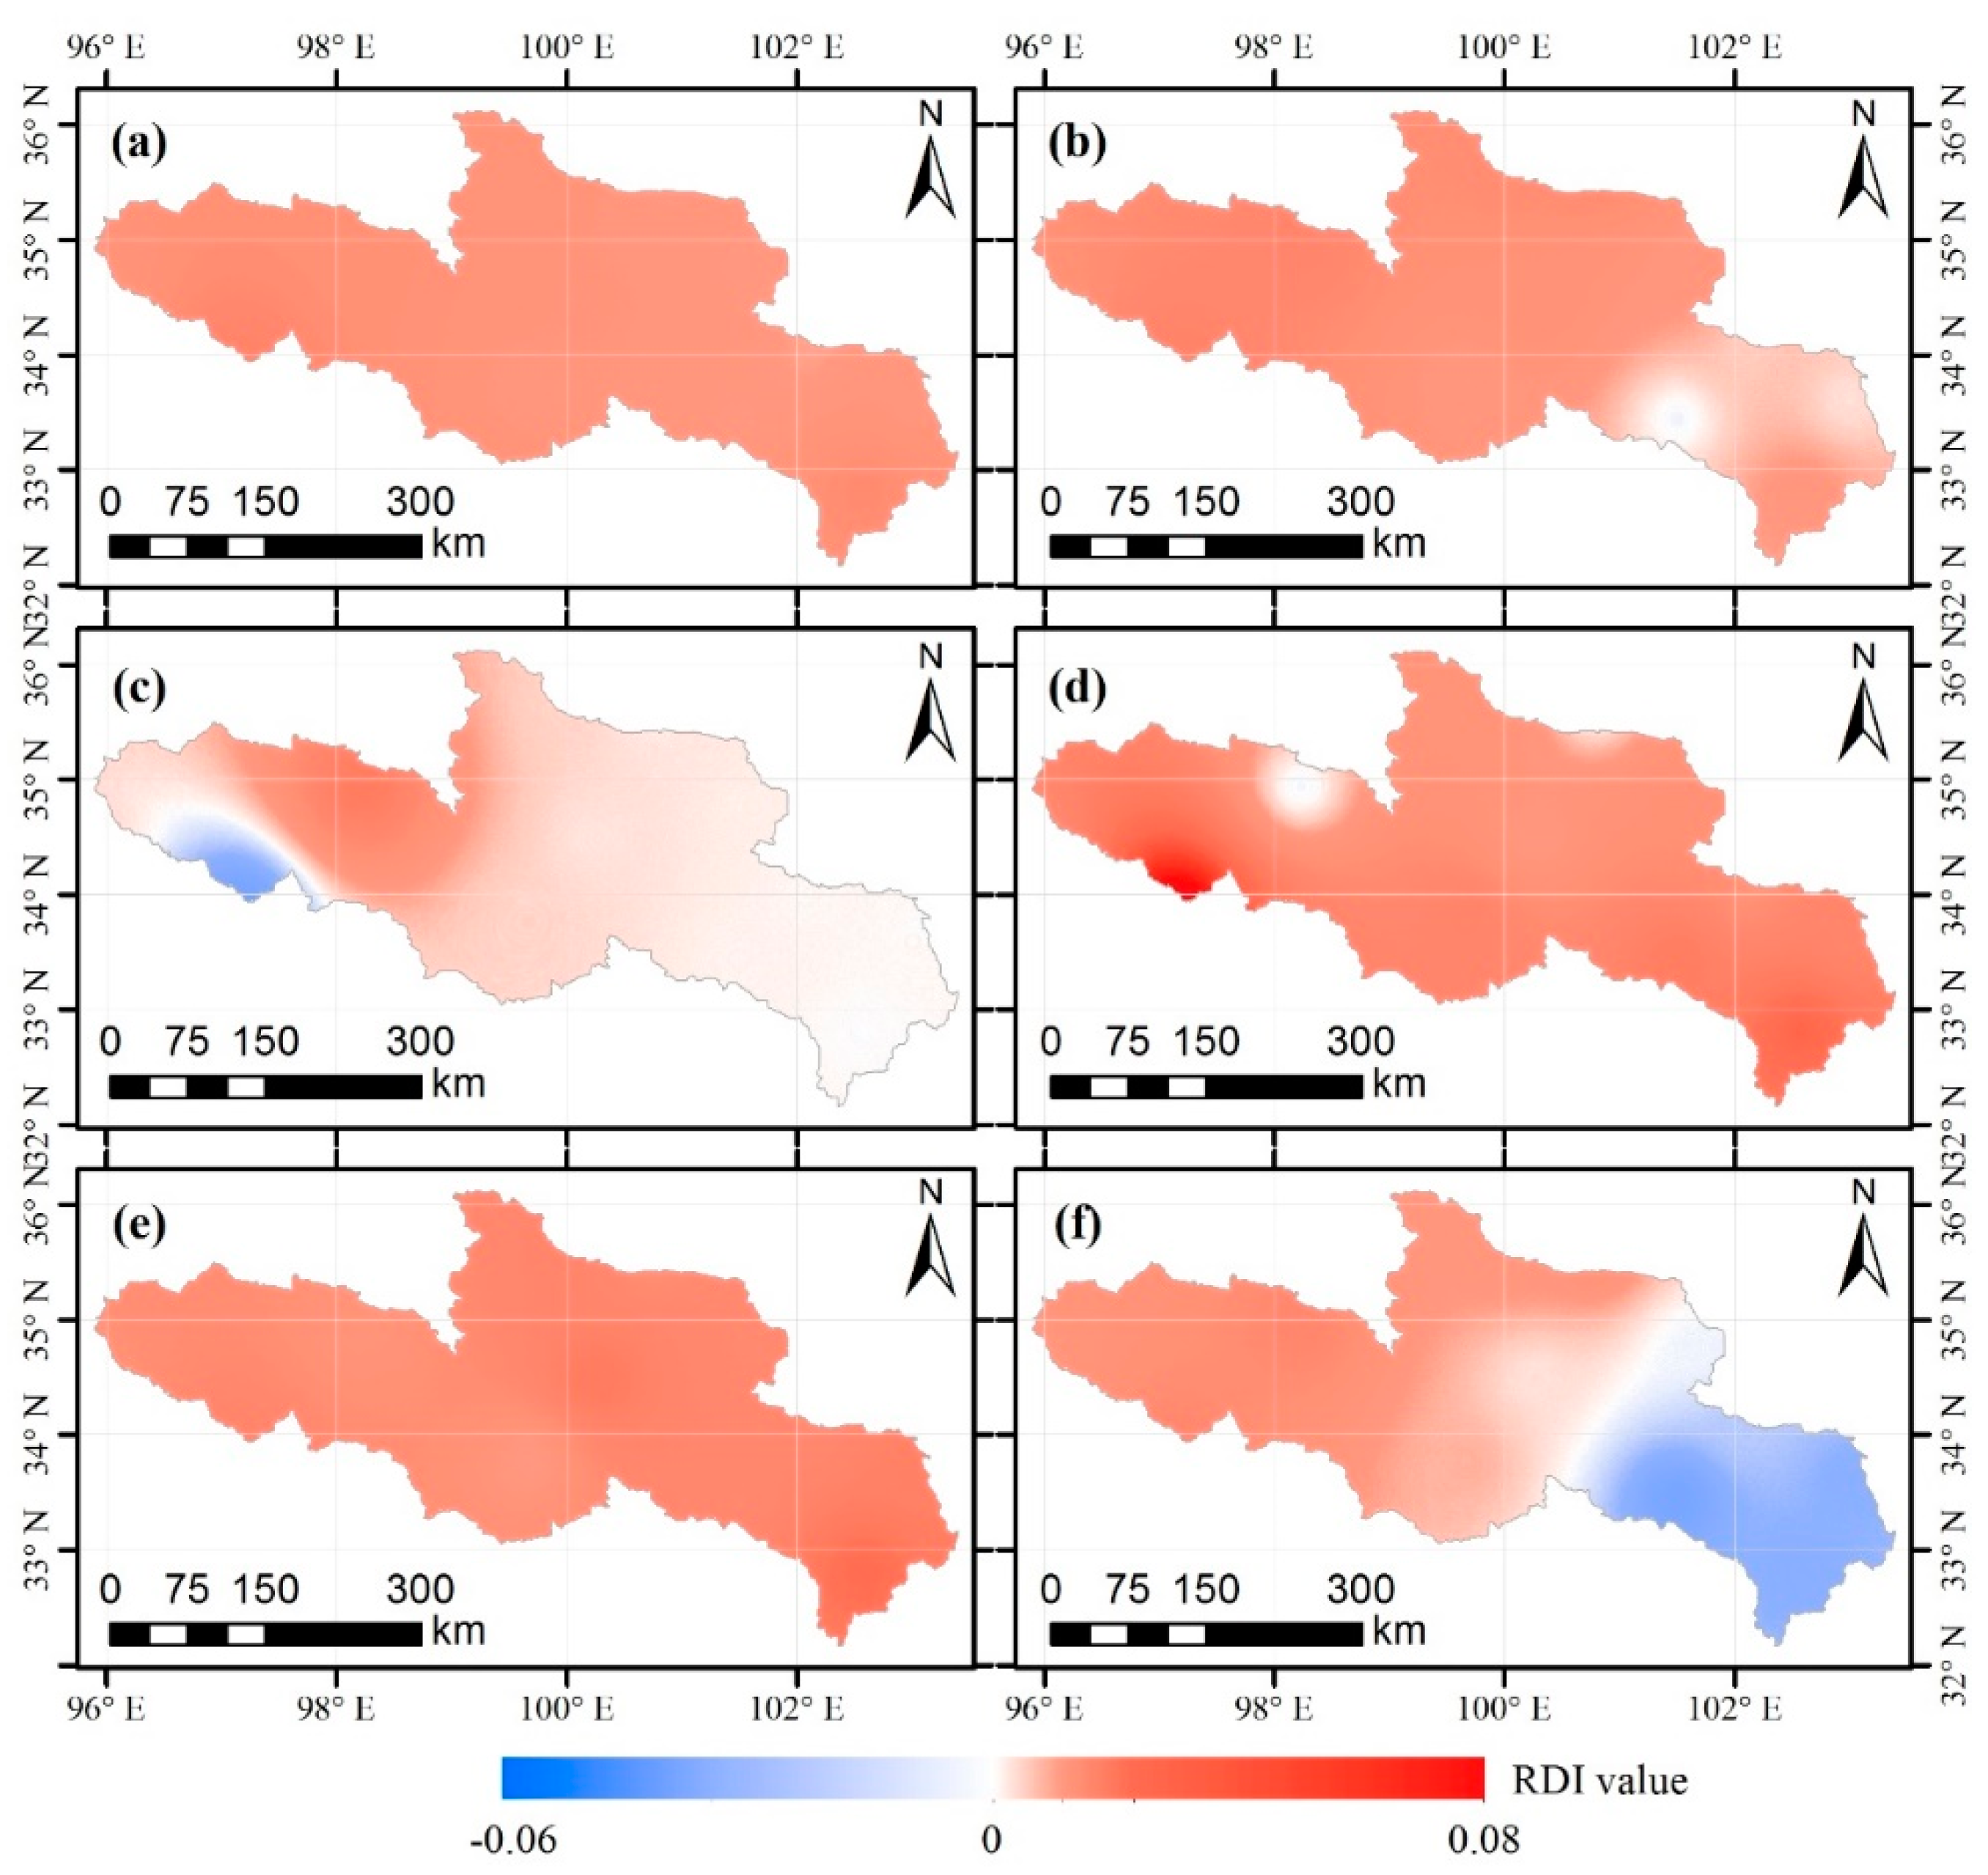
Figure 3 shows the spatial distribution of the average RDI at different time scales in SRYRB. On the annual (Figure 3a) and VGS (Figure 3b) scale, the majority of RDIs are positive, except for a small part of the area located in eastern SRYRB with no change on the VGS scale, which indicates that SRYRB is generally in the wetness condition during 1960–2015. As for the seasonal scale (Figure 3c–f), in autumn (Figure 3c), a small area in western SRYRB is in a state of drought, the eastern region is neither wet nor in a state of drought and the central region is slightly wet. In winter (Figure 3d) and spring (Figure 3e) seasons, SRYRB is almost in a wet state, while in the summer, there is a significant difference between the east and the west of the study area. Specifically, the west and middle parts of SRYRB are wet, while the east part is in a state of drought, and there is an obvious dividing line between wetness and drought.
The change trends of RDI over the SRYRB at different time scales are calculated during 1960–2015, as shown in Figure 4. From Figure 4a,b, it can be seen that the spatial distribution pattern of RDI change rates is similar between the annual scale and the VGS scale, with the change rate decreasing from west to east. However, on the annual scale, the most eastern part of SRYRB underwent a decreasing trend, while on the VGS scale, RDIs almost experienced an increasing trend. The combined Figure 3a,b indicate that the average distribution and change trend of annual RDI can be explained by that on the VGS scale to a certain extent. On the seasonal scale (Figure 3c–f), there are significant differences in the spatial distribution of RDI variation characteristics. Among the four seasons, the change rate of RDI is relatively more significant in winter (Figure 3d) and spring (Figure 3e), then followed by summer (Figure 3f) and the smallest is during the autumn (Figure 3c). In winter and spring, the change rates of RDI generally exhibited a decreased gradient from southwest to northeast. It should be noted that, in the summer, the RDI in eastern SRYRB presented a decreasing trend while that in western SRYRB showed an increasing trend, indicating that the difference of drought and wetness between the east and west was gradually sharper. However, the RDI over most areas of SRYRB experienced a noticeable increasing trend at different time scales during the period of 1960–2015, which can conclude that the climate in the SRYRB is changing towards warming and wetness in the context of global warming.
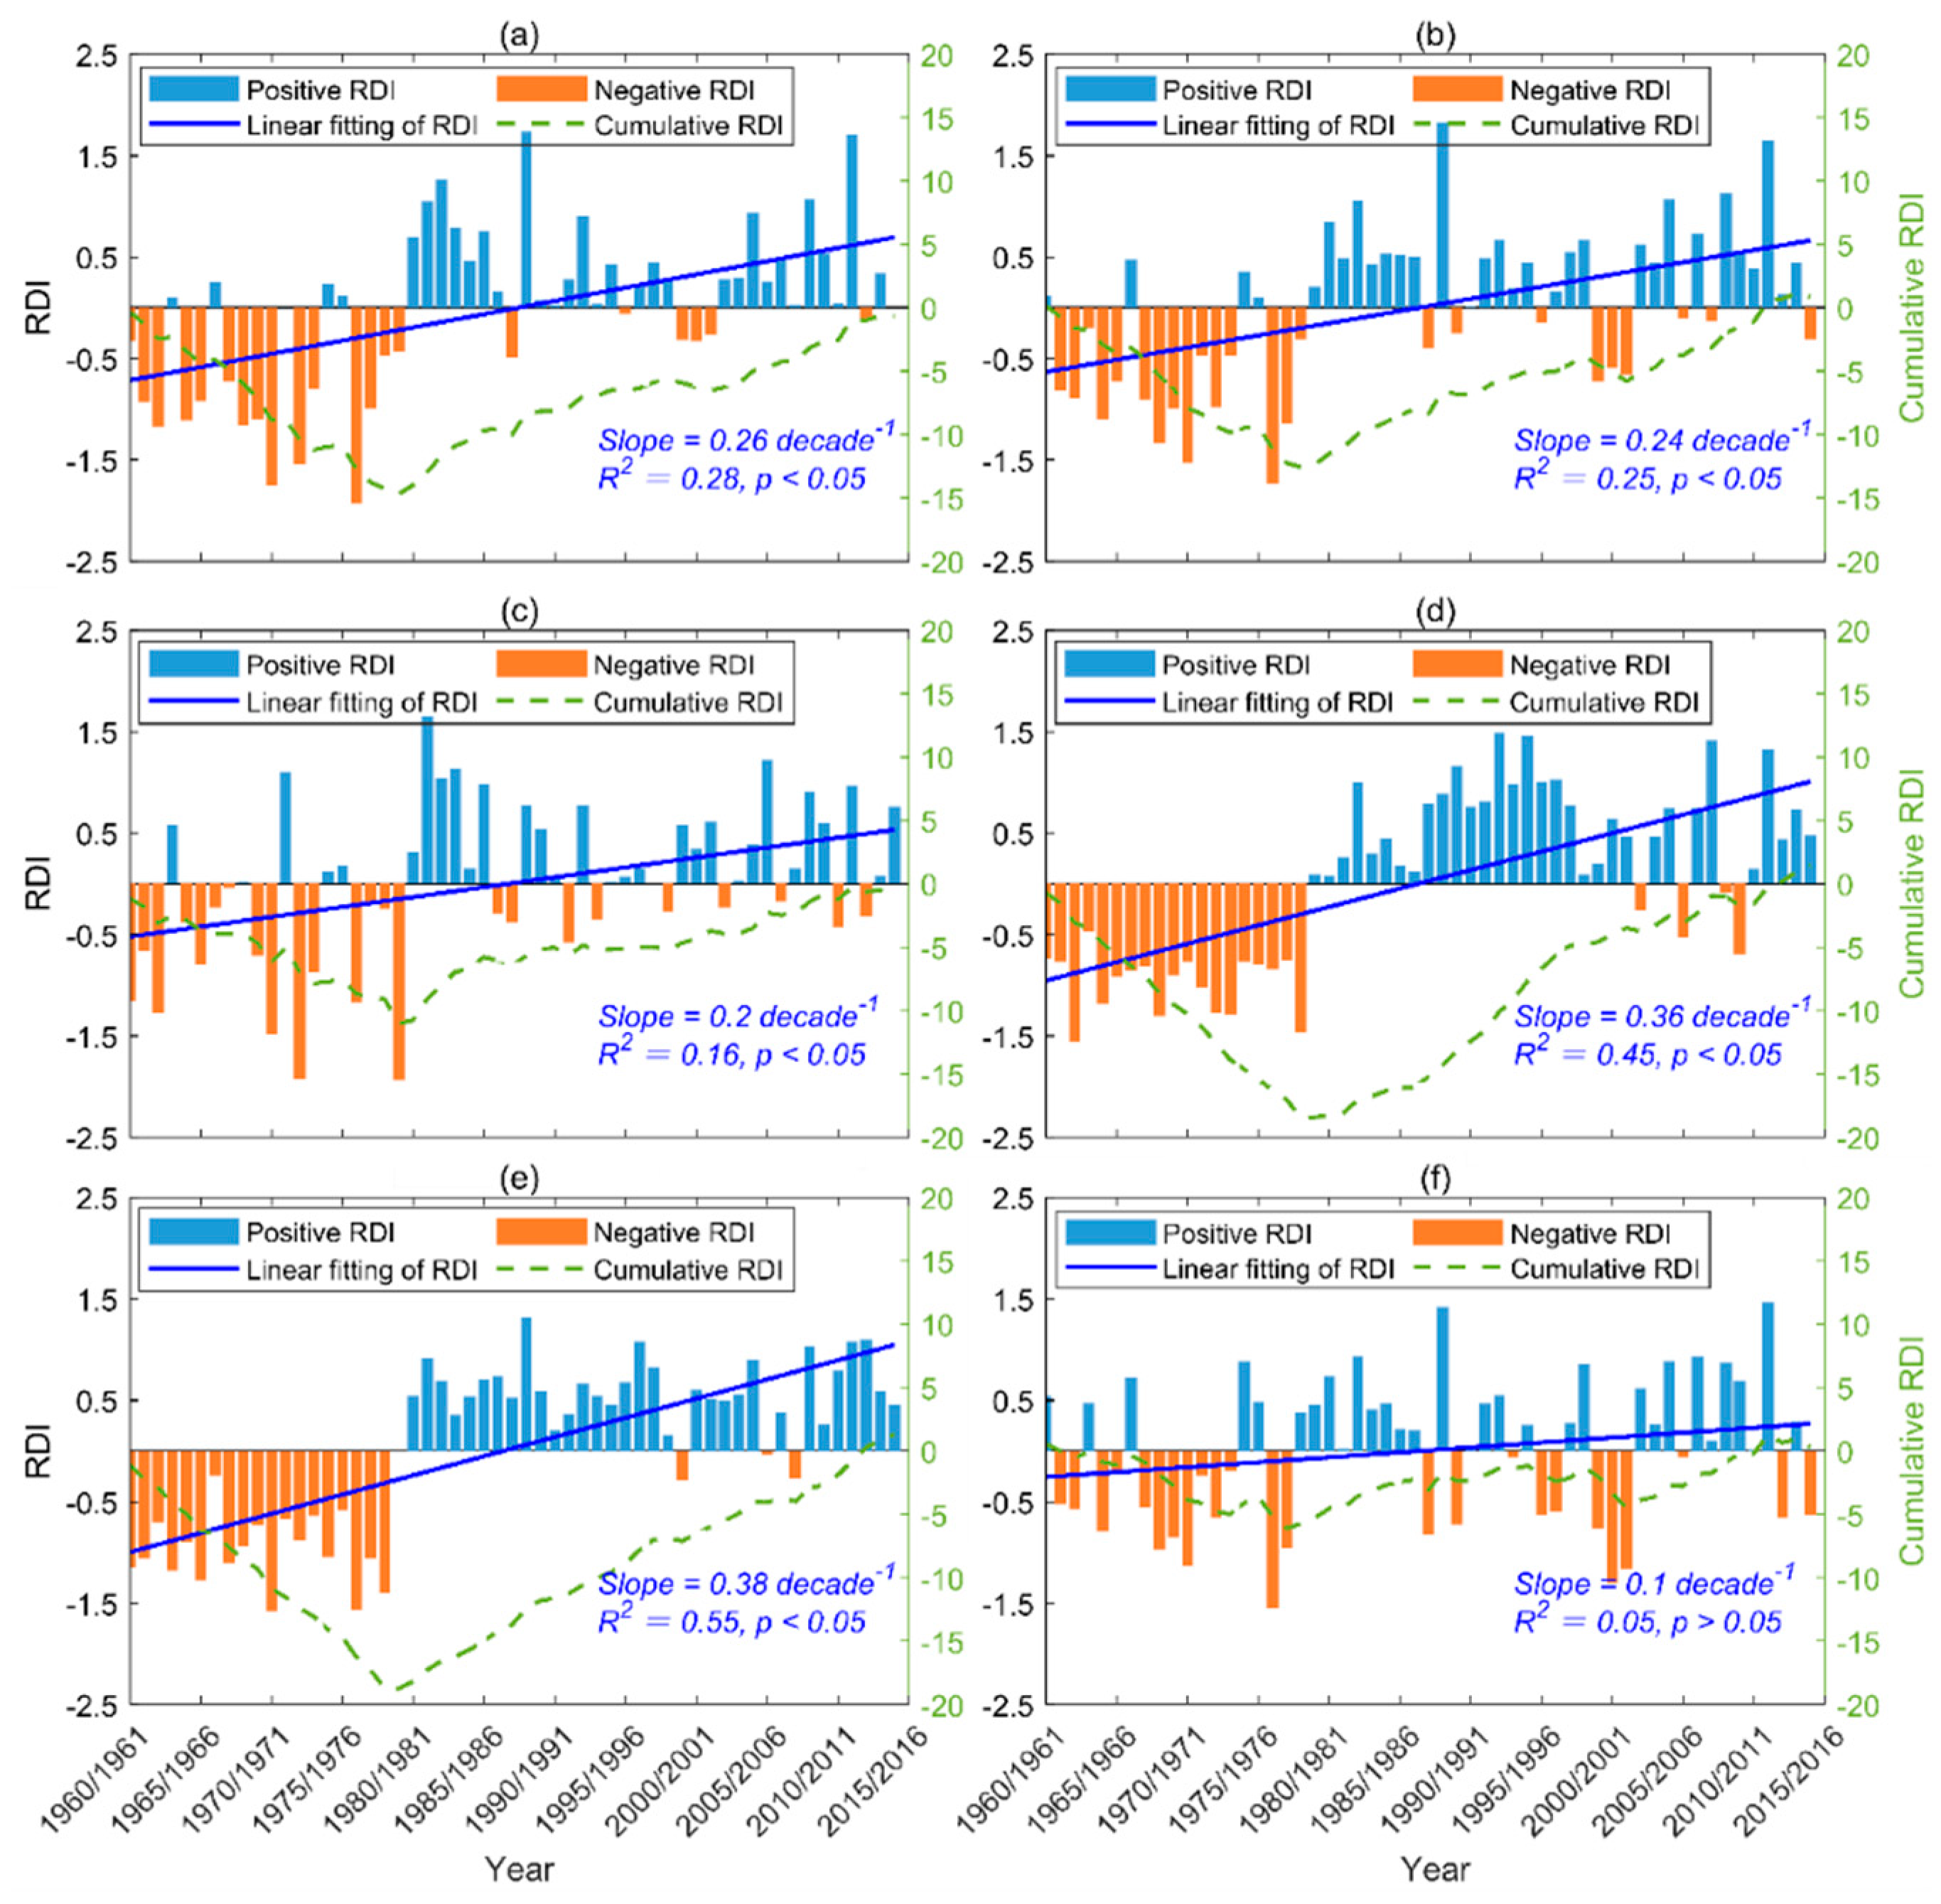
As shown in Figure 5, the interannual variations of RDI at different time scales were calculated over SRYRB during the study period. According to the variation of annual RDI shown in Figure 5a, the trend of annual RDI increased significantly from 1960/1961 to 2015/2016. Two stages can be found in the course of annual RDI variations. (1) The first stage, named the drought stage, was from 1960/1961 to 1979/1980. In this stage, the values of RDI were negative except during the years 1963/1964, 1966/1967, 1971/1972, 1974/1975 and 1975/1976. (2) The second stage, named the wetness stage, was from 1980/1981 to 2014/2015. During this stage, the majority of RDI values were positive, showing a clear trend of increasing wetness in comparison to the previous period. According to the cumulative curve of annual RDI, the change from drought to wetness was evident, with the turning point being in the early 1980s. As for VGS RDI (Figure 5b), its variation is very similar to that of annual RDI. On annual and VGS scales, the average change rates of RDI over SRYRB were 0.26 decade−1 and 0.24 decade−1, respectively.
On the seasonal scales (Figure 5c–f), RDI showed an increasing trend in autumn, winter and spring, but a slight and non-significant increasing trend in the summer. Among the four seasons, the change rate of RDI in spring was the largest, with a value of 0.38 decade−1, followed by that in winter (0.36 decade−1) and autumn (0.2 decade−1), and the smallest is in summer (0.1 decade−1). In terms of the stability of RDI variations, although RDI showed an increasing trend on seasonal scales, its interannual variation and fluctuation characteristics varied greatly in different seasons. In winter and spring, RDI changed significantly from drought to wetness, with the turning point of 1979/1980. Since the turning point, SRYRB has been in a wet state almost all the time in these two seasons. However, in autumn and summer, the fluctuation between drought and wetness is obvious, especially in summer.
3.3. Variation Characteristics of Drought and Wetness Events
3.3.1. Intra-Annual Variation Characteristics of Drought and Wetness Events
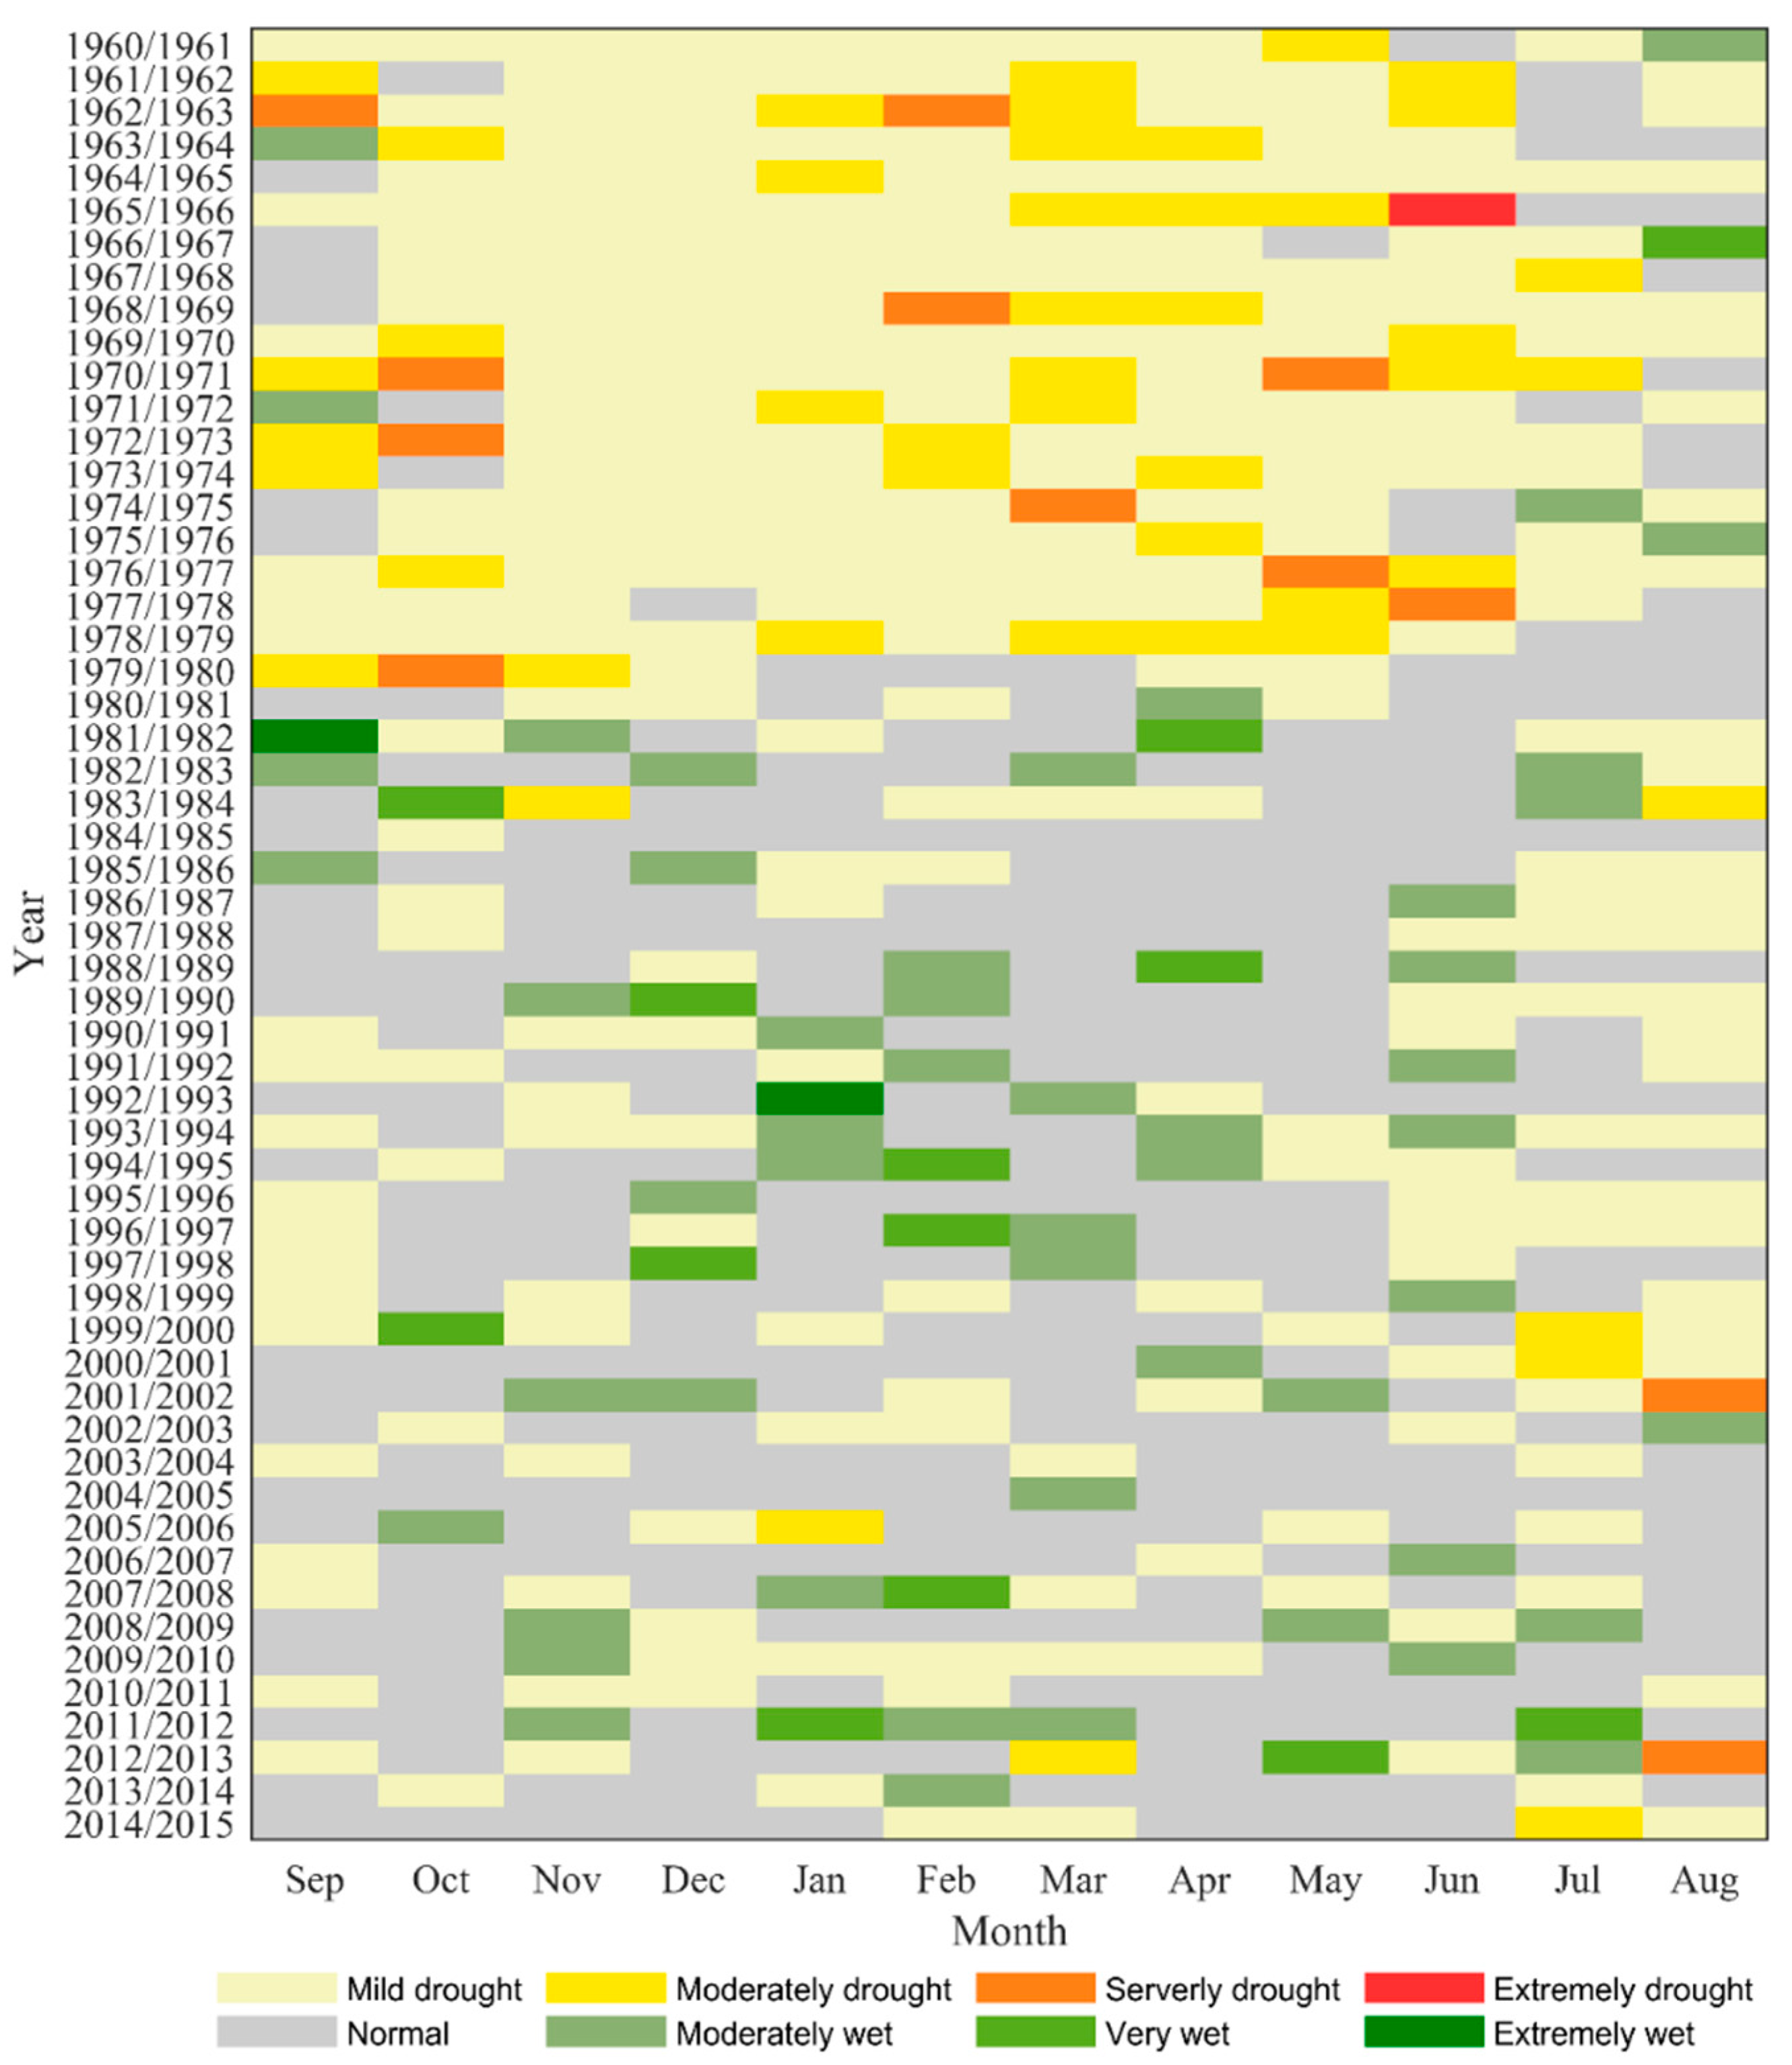
As presented in Figure 6 and Table 4, the frequency of droughts was high before 1980, including mainly the mild droughts. Among 240 months during 1960–1980, there were 149 months, 40 months and 10 months undergoing mild, moderate and severe drought, respectively. Additionally, there was one month showing extreme drought in June 1966. As for wetness events, there were only five months and one month experiencing moderately and severely wetness ones, respectively. Therefore, these observations suggest that SRYRB was mainly dominated by the drought before 1979/1980. However, since 1980/1981, drought frequency decreased significantly. Among 420 months during 1981–2015, only 114 months, 7 months and 2 months underwent mild, moderate and severe drought, respectively, with no extreme drought.
On the contrary, the frequency of wetness events increased significantly. According to the frequency of wetness events in each month during the study period, it shows the highest value of 14.6% in February. In terms of wetness events of different magnitudes, the highest frequency for moderate and severe ones was in June (12.7%) and February (5.5%), respectively, and for extreme wetness events, both September and January have the highest frequency (1.8%).
3.3.2. Variation Characteristics of Drought and Wetness Events on Annual and VGS Scales
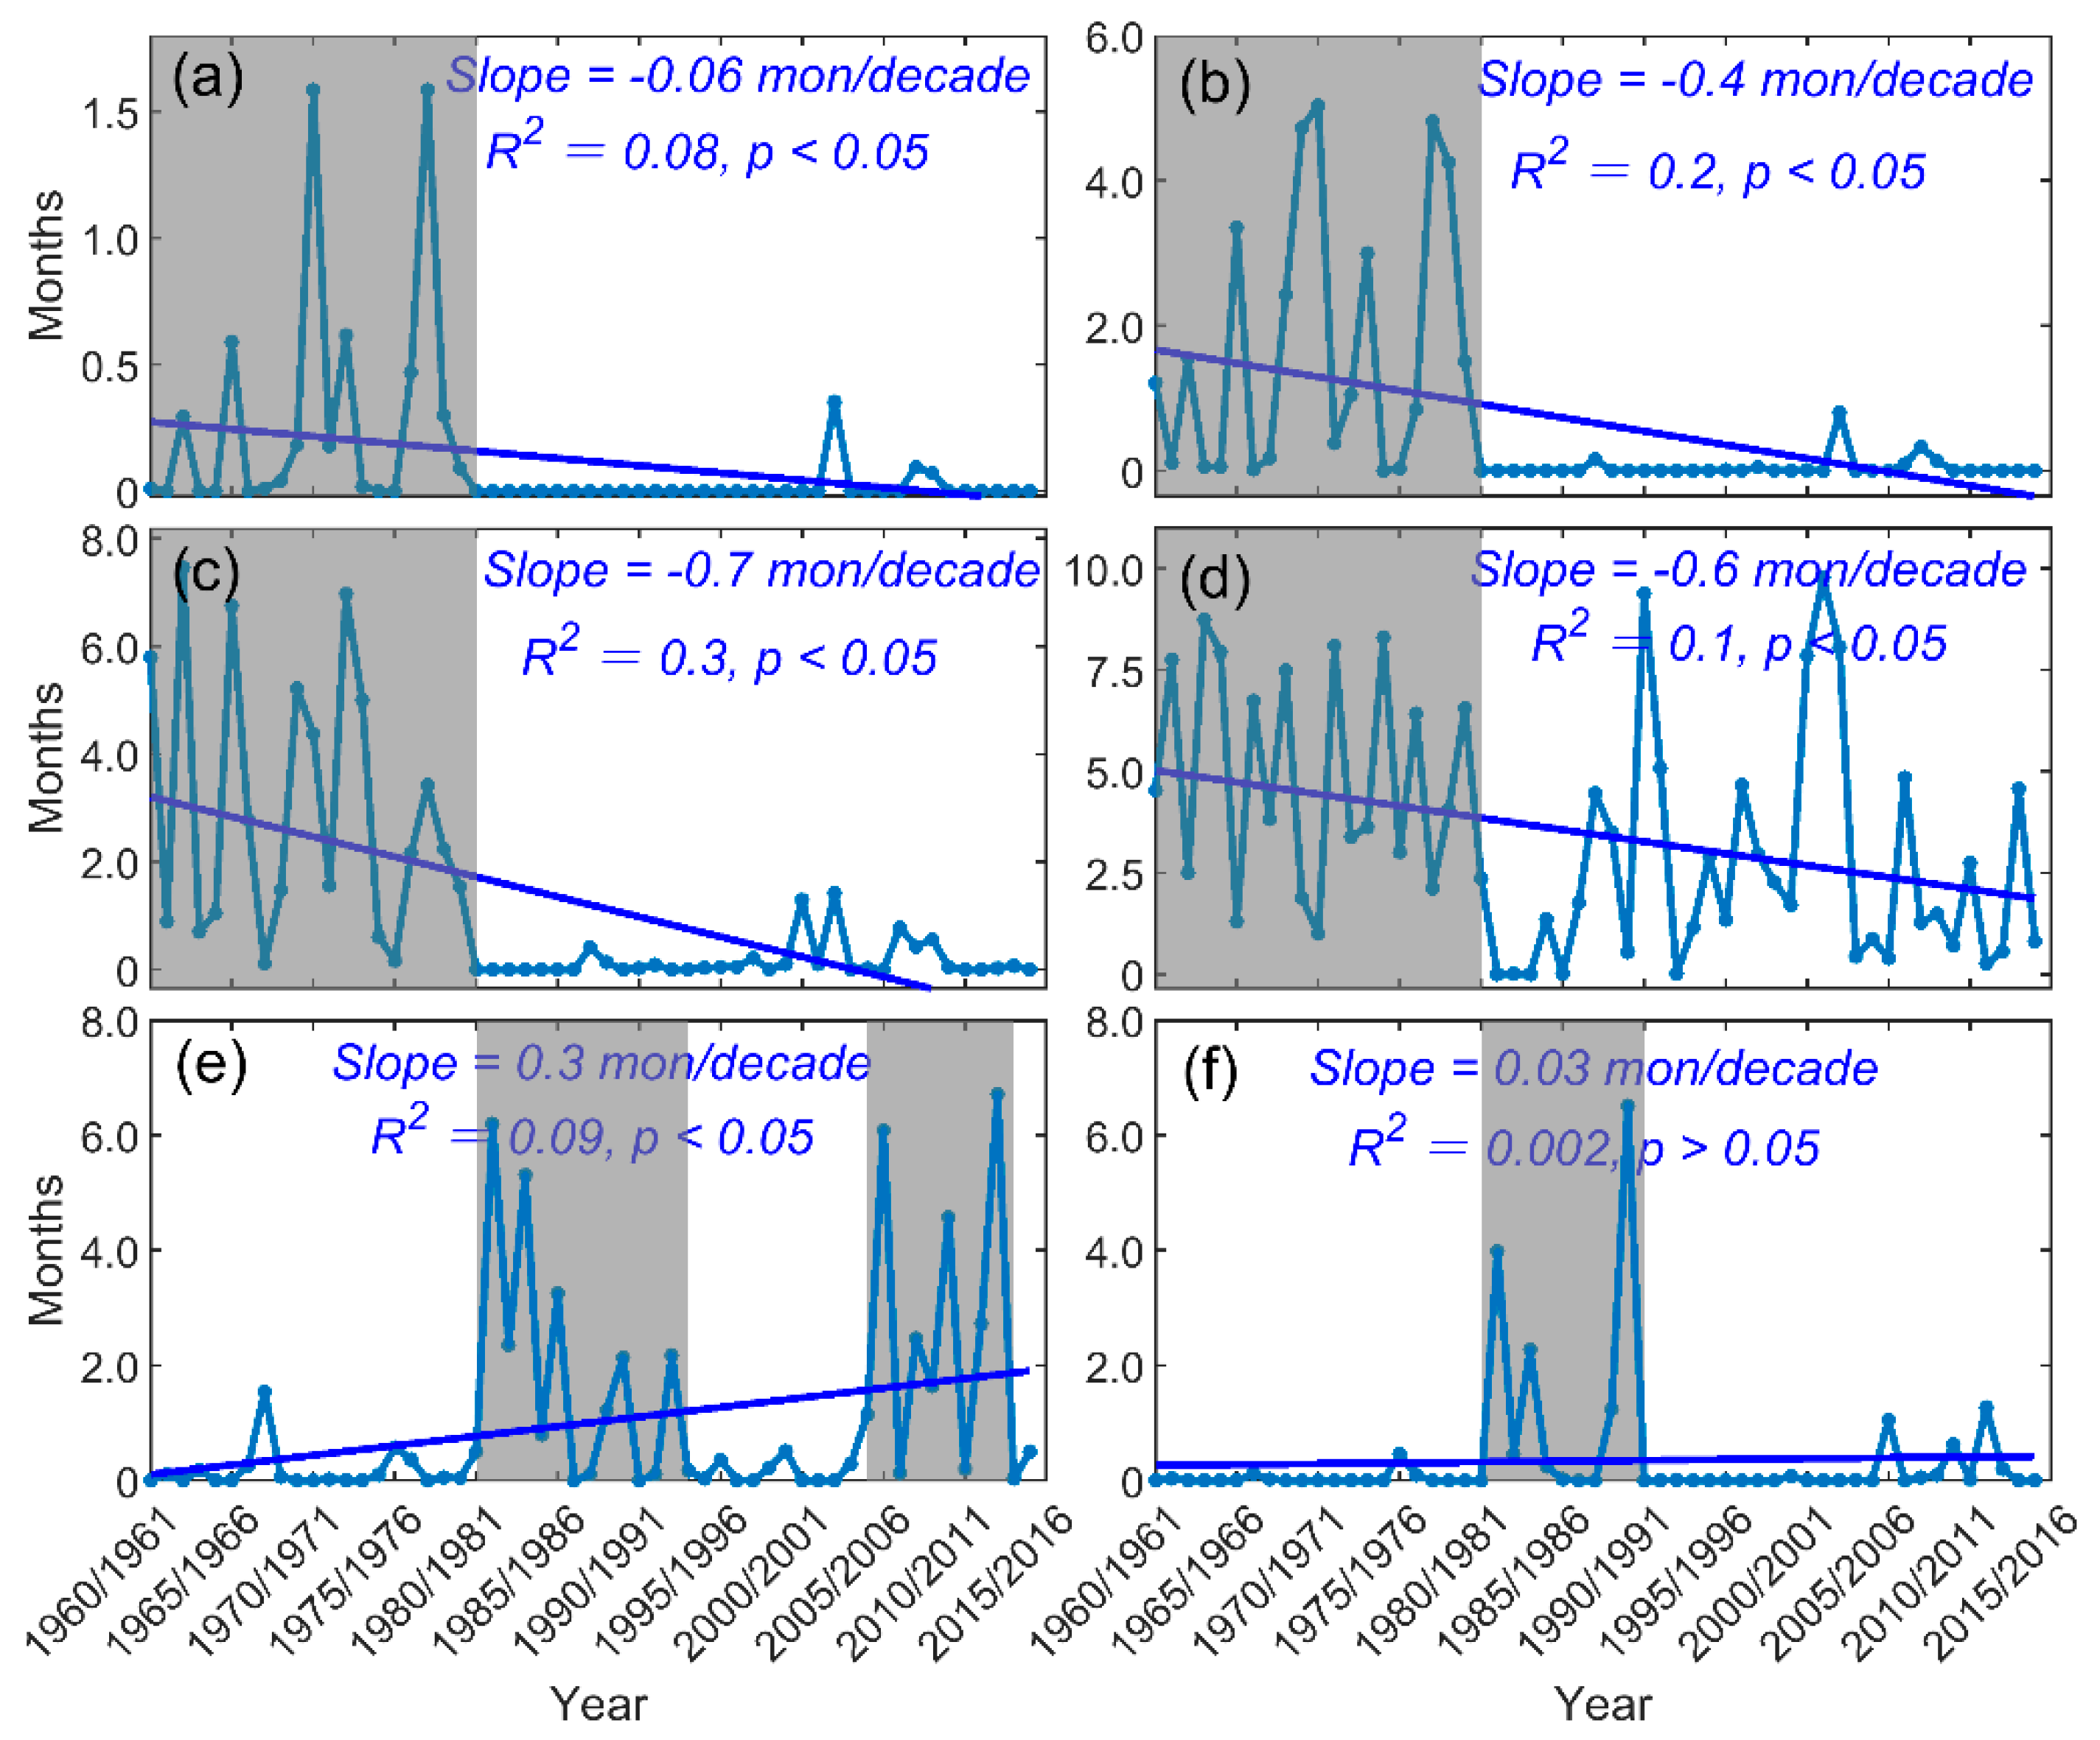
According to the dry and wetness event standard of RDI (Table 2), the frequency and associated trend of six levels of drought and wetness events on the annual scale in the SRYRB are illustrated in Figure 7. It should be noted that severe and extreme wetness events are combined (Figure 7f) for notably slight changes in extreme wetness events. It can be found from Figure 7 that, corresponding to the increase in RDI, drought events showed a decreasing trend, while wetness events showed an increasing trend. Except for severe and extreme wetness events, the changes of other drought and wetness events were statistically significant (p < 0.05). Among drought events, moderate drought events had the strongest change with a rate of −0.7 month/decade, followed the mild drought events (−0.6 month/decade) and severe drought events (−0.4 month/decade), and the extreme drought events had the smallest change, with a rate of −0.06 month/decade. Specifically, drought events were mainly concentrated in the period of 1960s to early 1980s. Since the early 1980s, moderate, severe and extreme drought events have rarely occurred, while mild drought events still occur over time, but its change trend is significantly decreasing. On the contrary, during 1960s to early 1980s, wetness events rarely occurred. Since the early 1980s, wetness events have increased apparently, in which the moderate wetness events mainly occurred in 1981–1993 and 2005–2012, and severe and extreme wetness events primarily occurred in 1981–1990.
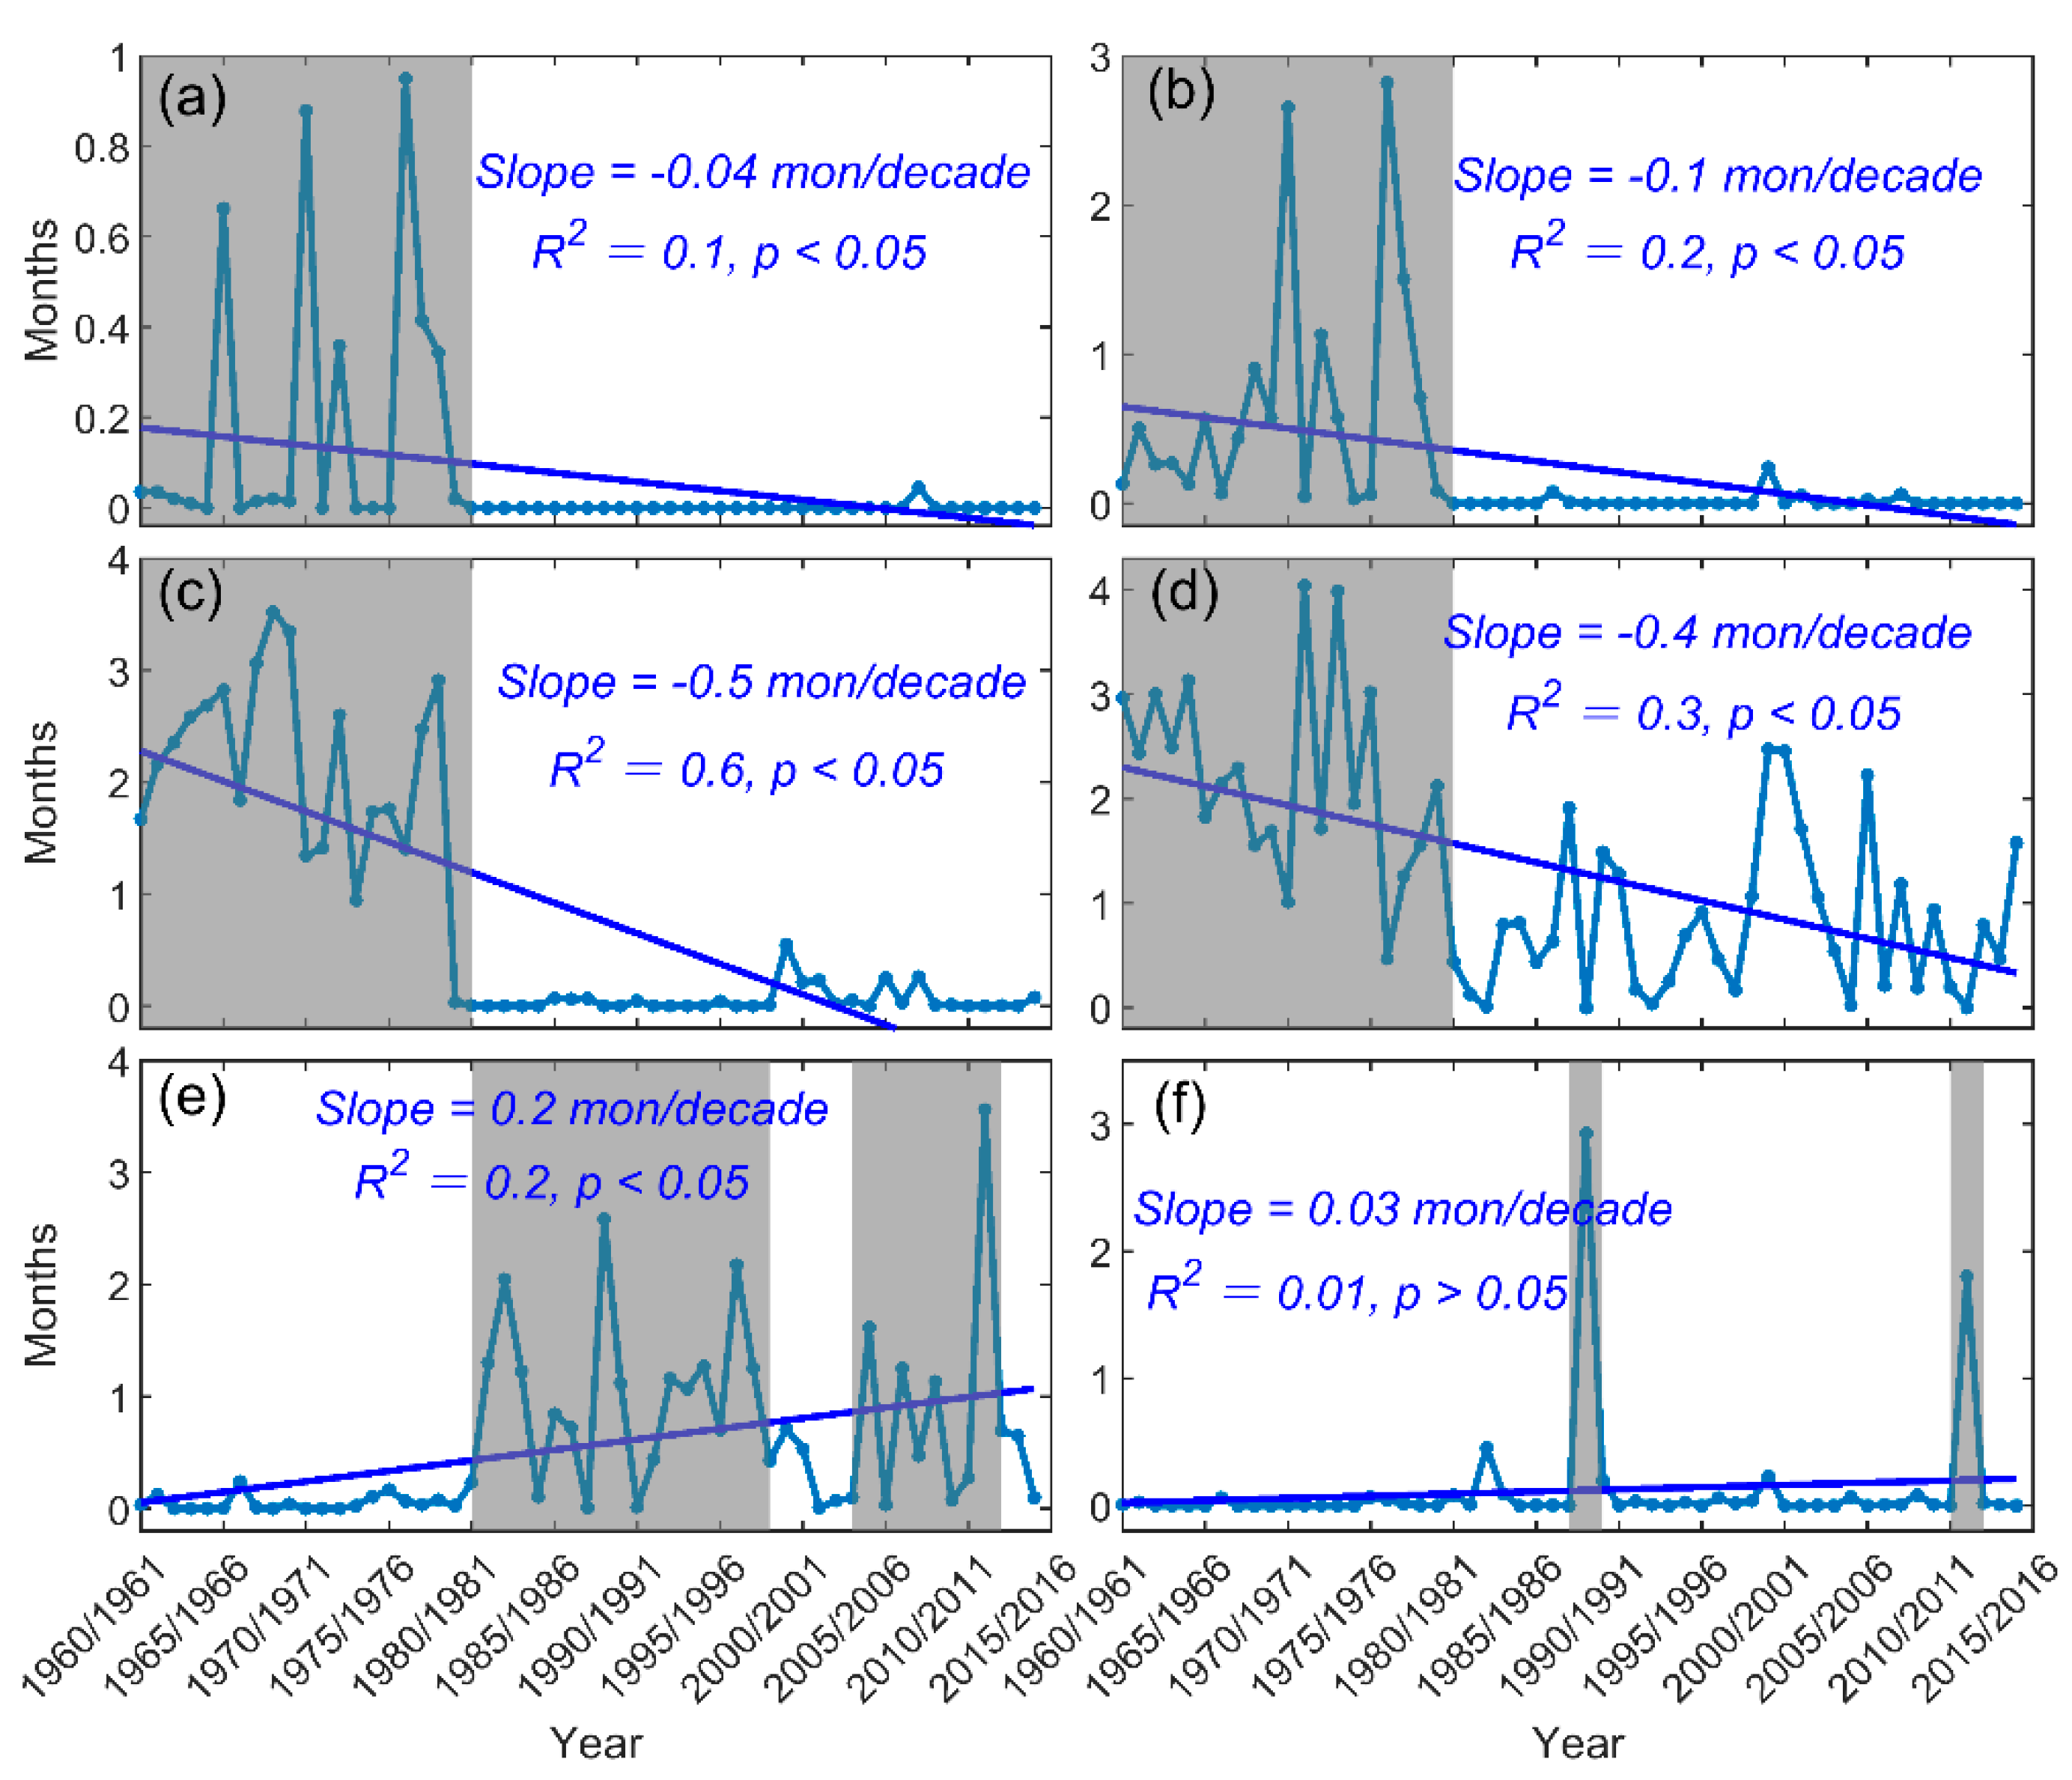
Figure 8 showed the inter-annual changes of drought and wetness events on the VGS scale, from which we can observe that the characteristics were similar to those on the annual scale. For example, all drought events underwent a decreasing trend during 1960–2015, while all wetness events experienced an increasing trend at the same period; both drought and wetness events had significant change trends except for severe and extreme wetness events (Figure 8f). However, some differences also exist in them, such as since the 1980s, the fluctuation of occurrence months of mild drought events (Figure 8d) on the VGS scale is smaller compared with that (Figure 7d) on the annual scale; the occurrence periods of wetness events were different at two scales (Figure 7e,f and Figure 8e,f).
3.3.3. Variation Characteristics of Drought and Wetness Events on Seasonal Scale
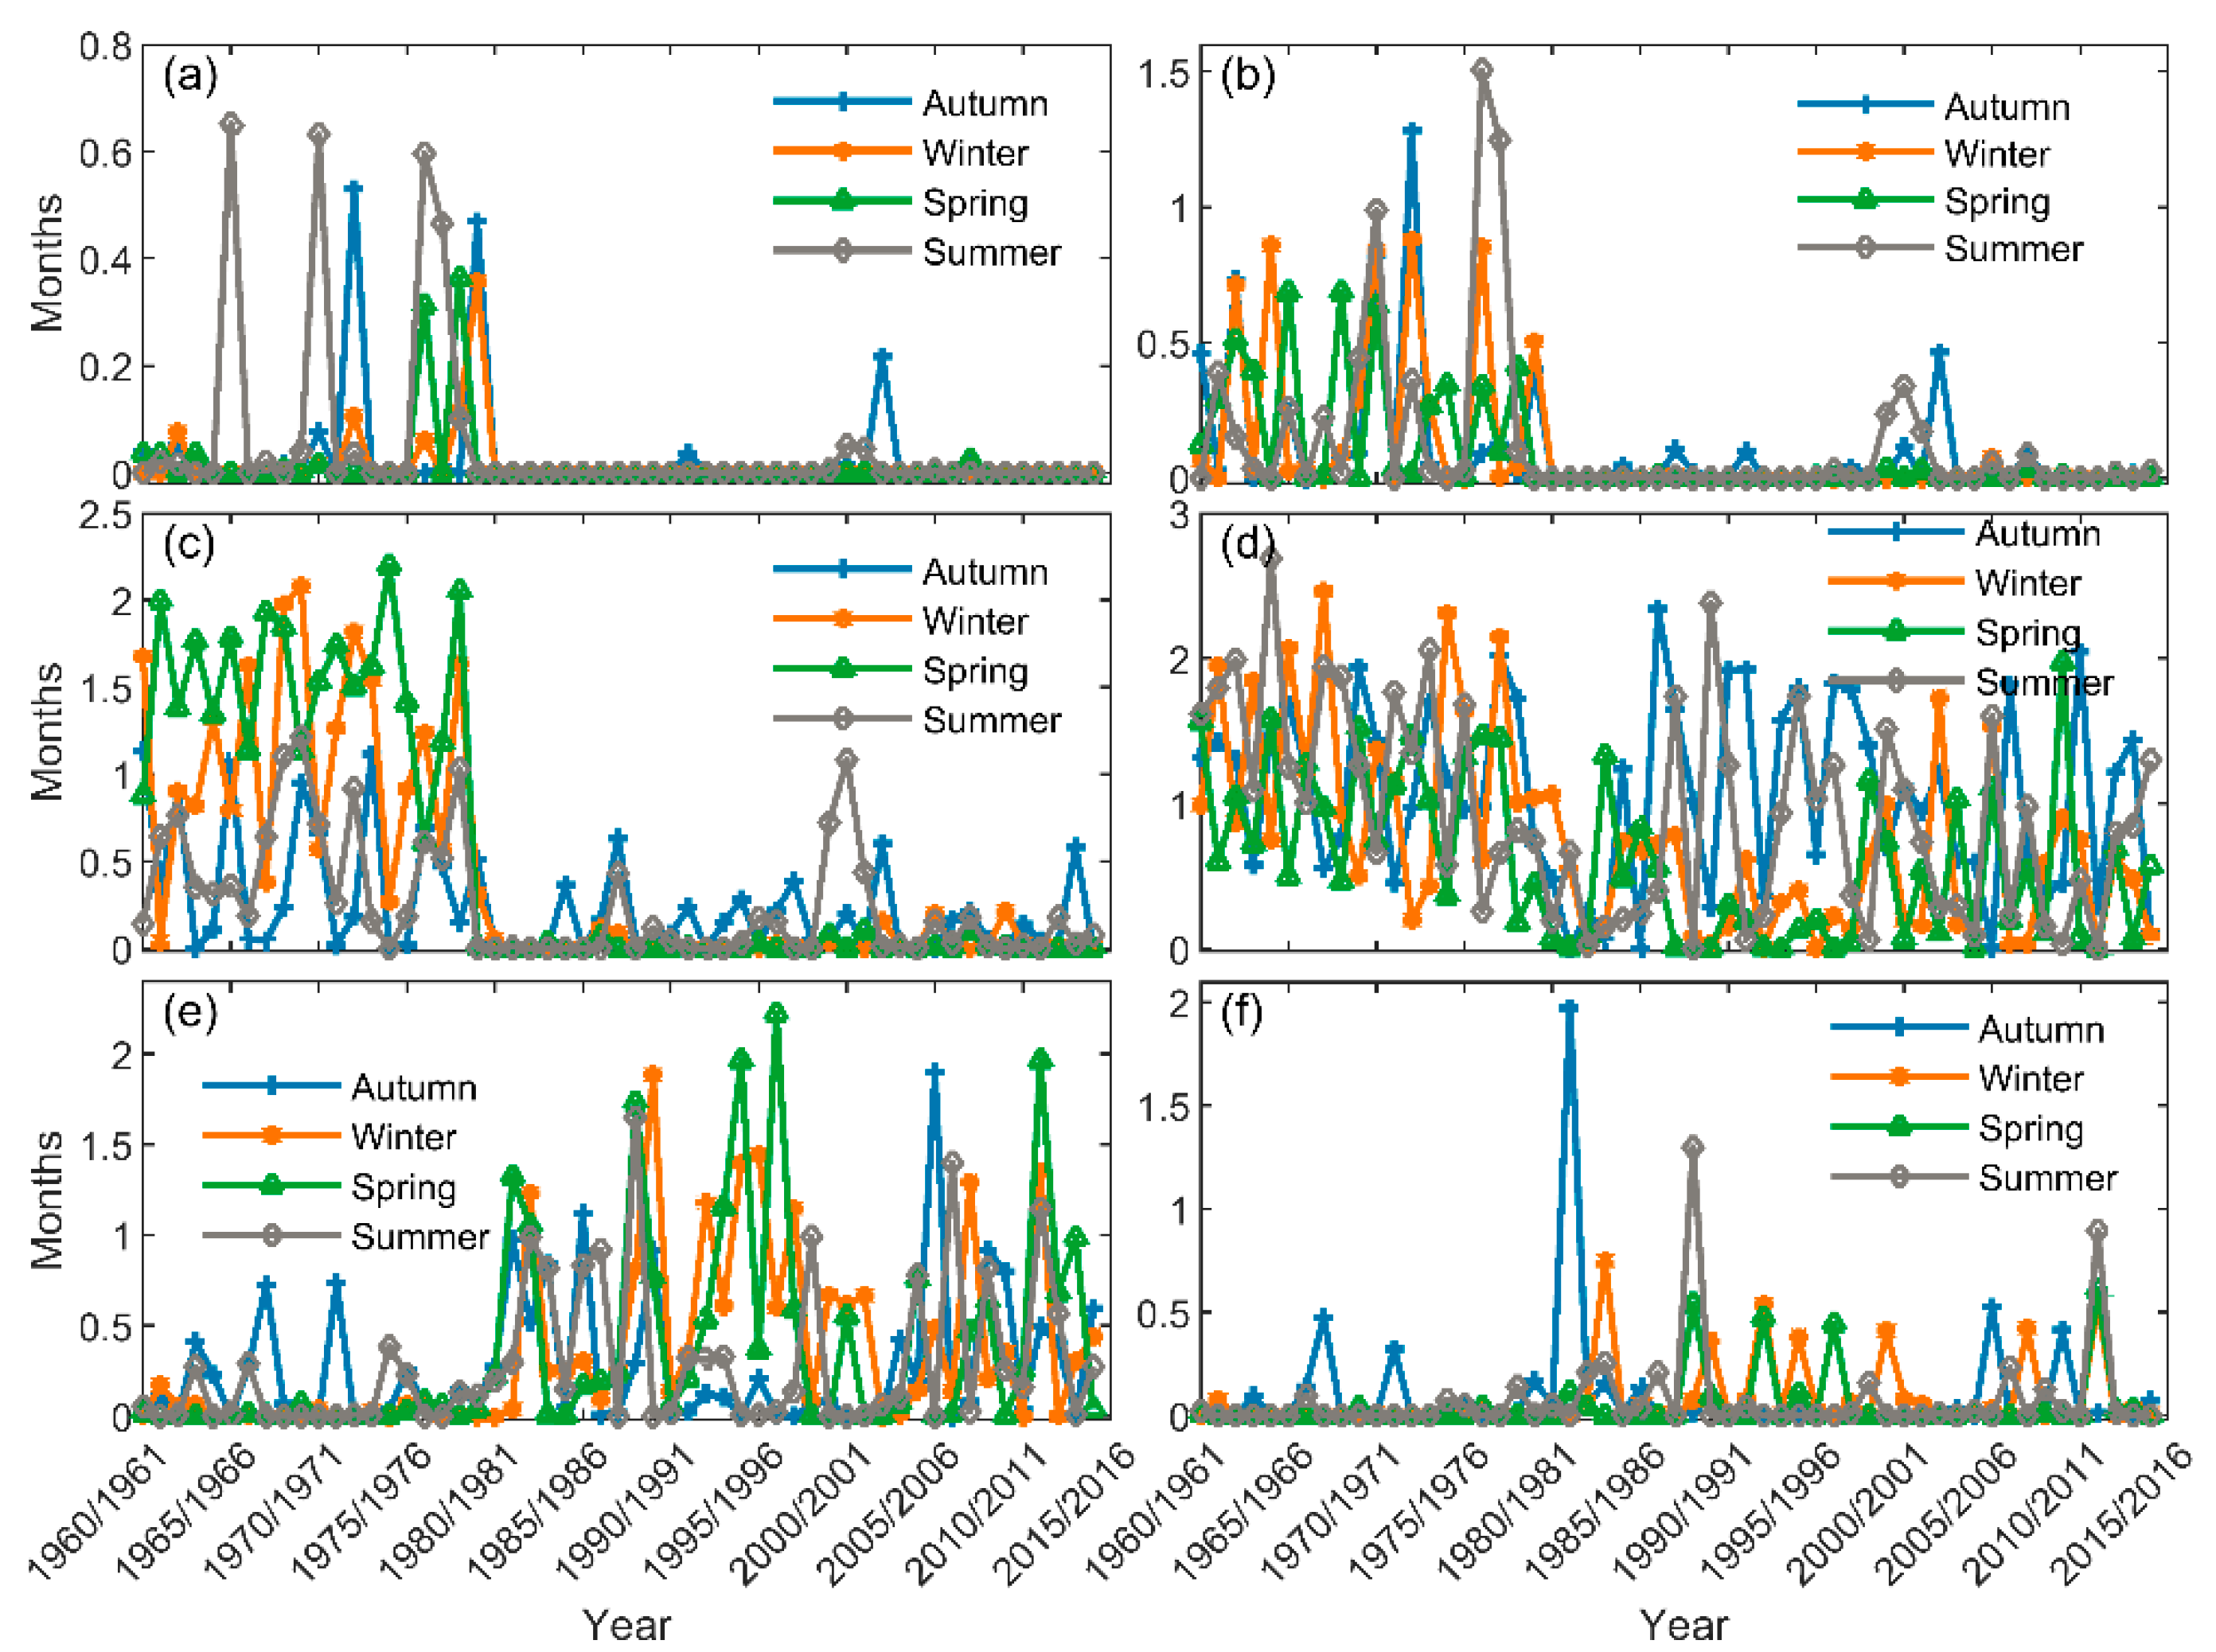
Figure 9 illustrates the change trends of 6 levels of drought and wetness events in the SRYRB during 1960–2015, and the associated change rates and significances are listed in Table 5. Combining Figure 9 and Table 5, we can observe that all drought events had a decreasing trend in four seasons. However, the associated significances have great differences. Among them, the variations of frequency in four seasons were statistically significant at the levels of 0.05 for both severe and moderate drought events, while they were significant only in summer for the extreme drought event. As for mild drought events, the variations were statistically significant in three seasons, including winter, spring and summer. Notably, among four seasons, the variations of severe and moderate drought events were relatively more intense in winter and spring, while it was in the summer for extreme drought events, and in winter, spring and summer for mild drought events. In terms of four classes of drought events, the variation of frequency at the moderate level was the most dramatic, with an average of −0.2 mon/decade, followed by the mild level, with an average of −0.15 mon/decade.
Generally, the change trends of wetness events are opposite to the drought events in different seasons, which is consistent with that on the annual and VGS scales. At the moderate level, wetness events presented a significant increasing trend in four seasons during the period of 1960–2015 except for autumn, and the relatively more intense variations occurred in winter and spring. As for severe and extreme wetness events, it showed an overall increasing trend without statistical significance.
4. Discussion
The present study investigated changes in drought and wetness phases in SRYRB by employing two commonly used indices of SPI and RDI. The SPI index is solely based on precipitation while RDI is more dependent on temperature and evapotranspiration. This negligible inconsistency in methodology has resulted in small mismatch between the values obtained by SPI and RDI values, which has not been significant in any of the time intervals considered. For example, the maximum was detected in Hongyuan and Zoigê station with the value of 19% on monthly, seasonal and annual scales, while the differences only at two stations of Henan and Jiuzhi were 22% on the VGS scale. All these stations are located in the southeast of SRYRB, where the region is characterized by low altitude, high temperatures [45] and precipitation [14,19]. However, since one of the major objectives of this research was the investigation of changes in wet/dry phases in vegetation growth period, we tended to use the RDI index since it is also dependent on the vegetation cover of any region [26,46]. According to Merabti et al. [47], RDI shows smaller differences among climate zones and time scales and, therefore, provides a better representation of drought and wet years.
A further analysis using the RDI index showed that the early 1980s was a turning point from drought to wetness in SRYRB on annual and vegetation growing seasonal (VGS) scales. Contrary to our findings, Xu et al. [27] evaluated the trend in drought events in China during 1961 to 2012 using three indices and detected an increasing trend in the frequency of drought events. Yet this discrepancy in findings might be attributed to the scale of the analysis and study area. Zhang and Gao [48] evaluated drought/wet years in Qinghai–Tibetan Plateau of China and, similarly to our study, found a noticeable rising trend in wet years and temperature in the area.
We investigated the trend in RDI index over different time scales. In terms of monthly changes, the frequency of wetness events increased significantly. Our results show that the highest RDI value by 14.6% occurred in February. In terms of wetness events of different magnitudes, the highest frequency for moderate and severe ones was in June (12.7%) and February (5.5%), respectively, and for extreme wetness events, both September and January had the highest frequency (1.8%). In total, it seems that the autumn and spring months are becoming increasingly wetter. On the seasonal scale, the spatiotemporal variation of RDI presents the most significant increasing trend in winter and spring [49]. The highest frequencies of severe and extreme wetness events are also in winter. In contrast, the frequency and contribution of moderately heavy rainfall events to total rainfall show a significant decreasing trend in summer [49] (Figure 4 and Figure 5). Among the four seasons, the change rate of RDI in spring is the largest, with a value of 0.38 decade−1, followed by that in winter (0.36 decade−1) and autumn (0.2 decade−1), and the smallest is in summer (0.1 decade−1). Similarly, Khan et al. [50] Found an increasing trend in winter precipitation and temperature in Songhua River Basin of China. Yet they found the majority of years during 1965–2013 to be in drought conditions.
In terms of the spatial changes in drought and wetness events, we found a warming–wetting trend in northwestern SRYRB [51], which is in accordance with the findings from Tian et al. [52]. From Figure 4, it is clear that mountainous areas are becoming wetter while plain areas are becoming dryer over the decades. Zhang and Gao [48] evaluated drought/wet years in Qinghai Tibetan Plateau of China and similar to our study found a noticeable rising trends in wet years and temperature in the area. They found that mountainous areas to the west were characterized with greater increases in wetness. According to these authors, most of the arid and humid regions in the QTP faced a reduction in precipitation, while the precipitation in semiarid regions was found to be on the rise.
An interesting finding regarding long-term temporal changes in RDI values is that changes in RDI become apparently more consistent when moving from shorter to longer time steps. On the annual and VGS scales, the average change rates of RDI over SRYRB were 0.26 decade−1 and 0.24 decade−1, respectively. Therefore, for VGS RDI (Figure 5b), its variation is very similar to that of annual RDI. This clearly indicates an increasing trend in precipitation during the vegetation growth season. Therefore, vegetation cover in the study area must have become denser and richer over the time period. To support this claim, Zhang et al. [53] reported that the growing-season Normalized Difference Vegetation Index (NDVI) increased during 1982–2015 in the Yellow River Basin area of China. In their work, the response of vegetation to climate variations became more prominent as time scales increased.
In total, we found a general increasing trend in wet years over SRYRB. Climate change has resulted in a heterogeneous pattern in wetness and drought distribution in China. The state of drought or wetness is directly affected by precipitation and temperature, whereas its intrinsic mechanism is influenced by the effect of large-scale climate. Wang et al. [52] revealed that the drought in SRYRB is highly related to the El Niño-Southern Oscillation (ENSO) and the North Atlantic and Arctic Oscillations (NAO). Climate change by changing planetary scale weather patterns could result in severe changes in wet and drought years in China. According to Liu and Cui [54], climate change has resulted in great heterogeneity in precipitation and temperature changes in the Yellow River Basin area. Contrary to our findings, they reported that, during 1961–2000, precipitation decreased in most stations in the area. Yet, Khan et al. [55], by projecting the current trend in climatic parameters using the HadCM3A2 global climate change model, found a warming and wetting trend in the Heilongjiang area of China until 2099. We believe that the intensity of wetness and drought events will increase in the future under climate change. The same was reported by Cheng et al. [56] in Guizhou in China, who showed an increasing trend in the frequency and intensity of drought events in China during the 21st century. Since the Yellow River Basin is a region with economic and population importance in China, the changes in wetness and drought could directly impact China’s economy and even the global economy given the position of China’s economy in global setting. Increasing population and socio-economic development have placed great pressures on water resources at the Yellow River Basin [57]. This region is already inflicted with water scarcity, pollution and ecosystem degradation and is accompanied with biodiversity declines that have been further aggravated by anthropogenic-induced climate change [58]. Therefore, the results of our paper, even though indicating a growing trend in wetness, show an intensification in drought and wet events, which aggravates water stress in the area. This important fact must be given serious thought when devising management plans to cope with climate change in the future. This study thoroughly investigated spatiotemporal drought and wetness changes in SRYRB. However, the relevant analyses of the change mechanism of drought and wetness were not implemented in this study. Therefore, this issue will be further studied in the future.
5. Conclusions
We explored the temporal and geographical variation of drought and wetness occurrences in SRYRB at the basin scale over 1960 to 2015 in this study. Temporally speaking, prior to 1979/1980, drought events dominated SRYRB. However, the frequency of droughts has dropped dramatically after 1980/1981. Instead, the number of wetness incidents has grown considerably. An increase in the intensity of transitory drought and wetness occurrences was also found in the latter period. Based on our findings, shorter time periods, such as monthly and seasonal, revealed notable discrepancies in wetness and drought episodes. However, when addressing wider time periods, we discovered that variations in wetness and drought became more consistent. For example, yearly and vegetative growth season RDI values were highly consistent. In line with this finding, we discovered an increase in precipitation throughout the vegetation growth phase, which may result in greater plant coverage in the region. Geographically speaking, our results indicated that mountainous areas are becoming wetter while plain areas are becoming dryer. In conclusion, we think that, in response to climate change, appropriate measures should be implemented to limit the effects of future flood and drought events due to their shifting patterns.
Author Contributions
Y.R. and J.L. conceived the idea; J.L. designed the experiment; Y.R. collected and analyzed the data; Y.R. and J.L. took the lead in writing the manuscript; Y.R., J.L., M.J.S. and A.A. were involved in the revision of the article; M.J.S. and A.A. polished the manuscript. Y.R., J.L., M.J.S., A.A., S.L., T.L. and H.T. provided critical feedback and helped shape the research, analyses and manuscript. All authors have read and agreed to the published version of the manuscript.
Funding
This research was jointly funded by K.C. Wong Education Foundation under Grant Number GJTD-2020-14, International Collaboration Project of CAS under Grant Number 131965KYSB20200029, The Second Tibetan Plateau Scientific Expedition and Research Program (STEP) under Grant Number 2019QZKK0903, The Belt and Road Special Foundation of the State Key Laboratory of Hydrology-Water Resources and Hydraulic Engineering under Grant Number 2021491411, and Key Laboratory of Water Cycle and Related Land Surface Processes, Institute of Geographic Sciences and Natural Resources Research, Chinese Academy of Sciences under Grant Number WL2019001.
Data Availability Statement
The data presented in this study are available upon request from the corresponding author.
Acknowledgments
The authors would like to thank the National Meteorological Information Center (NMIC) and National Aeronautics and Space Administration’s (NASA) for providing support with the observational data. Moreover, we thank the anonymous reviewers for their useful feedback that improved this paper.
Conflicts of Interest
The authors declare no conflict of interest.
References
- Zhong, S.; Wang, C.; Yang, Y.; Huang, Q. Risk assessment of drought in Yun-Gui-Guang of China jointly using the Standardized Precipitation Index and vulnerability curves. Geomat. Nat. Hazards Risk 2018, 9, 892–918. [Google Scholar] [CrossRef]
- Shi, J.; Cui, L.; Tian, Z. Spatial and temporal distribution and trend in flood and drought disasters in East China. Environ. Res. 2020, 185, 109406. [Google Scholar] [CrossRef] [PubMed]
- Wang, F.; Wang, Z.; Yang, H.; Zhao, Y. Study of the temporal and spatial patterns of drought in the Yellow River Basin based on SPEI. Sci. China Earth Sci. 2018, 61, 1098–1111. [Google Scholar] [CrossRef]
- Yang, Q.; Li, M.; Zheng, Z.; Ma, Z. Regional applicability of seven meteorological drought indices in China. Sci. China Earth Sci. 2017, 60, 745–760. [Google Scholar] [CrossRef]
- Ji, Y.; Zhou, G.; Wang, S.; Wang, L. Increase in flood and drought disasters during 1500–2000 in Southwest China. Nat. Hazards 2015, 77, 1853–1861. [Google Scholar] [CrossRef]
- Cook, B.I.; Mankin, J.S.; Anchukaitis, K.J. Climate Change and Drought: From Past to Future. Curr. Clim. Chang. Rep. 2018, 4, 164–179. [Google Scholar] [CrossRef]
- An, Q.; He, H.; Nie, Q.; Cui, Y.; Gao, J.; Wei, C.; Xie, X.; You, J. Spatial and Temporal Variations of Drought in Inner Mongolia, China. Water 2020, 12, 1715. [Google Scholar] [CrossRef]
- Alamgir, M.; Khan, N.; Shahid, S.; Yaseen, Z.M.; Dewan, A.; Hassan, Q.; Rasheed, B. Evaluating severity–area–frequency (SAF) of seasonal droughts in Bangladesh under climate change scenarios. Stoch. Environ. Res. Risk Assess. 2020, 34, 447–464. [Google Scholar] [CrossRef]
- Marengo, J.A. Characteristics and spatio-temporal variability of the Amazon River Basin Water Budget. Clim. Dyn. 2005, 24, 11–22. [Google Scholar] [CrossRef]
- Tramblay, Y.; Llasat, M.C.; Randin, C.; Coppola, E. Climate change impacts on water resources in the Mediterranean. Reg. Environ. Chang. 2020, 20, 83. [Google Scholar] [CrossRef]
- Chou, J.; Xian, T.; Dong, W.; Xu, Y. Regional Temporal and Spatial Trends in Drought and Flood Disasters in China and Assessment of Economic Losses in Recent Years. Sustainability 2019, 11, 55. [Google Scholar] [CrossRef] [Green Version]
- WMO. Reducing and managing risks of disasters in a changing climate. WMO Bull. 2013, 62, 23–31. [Google Scholar]
- Liang, S.; Ge, S.; Wan, L.; Zhang, J. Can climate change cause the Yellow River to dry up? Water Resour. Res. 2010, 46, W02505. [Google Scholar] [CrossRef]
- Li, Q.; Yang, M.; Wan, G.; Wang, X. Spatial and temporal precipitation variability in the source region of the Yellow River. Environ. Earth Sci. 2016, 75, 594. [Google Scholar] [CrossRef]
- She, D.; Xia, J. The spatial and temporal analysis of dry spells in the Yellow River Basin, China. Stoch. Environ. Res. Risk Assess. 2013, 27, 29–42. [Google Scholar] [CrossRef]
- Zhang, B.; Wang, Z.; Chen, G. A Sensitivity Study of Applying a Two-Source Potential Evapotranspiration Model in the Standardized Precipitation Evapotranspiration Index for Drought Monitoring. Land Degrad. Dev. 2017, 28, 783–793. [Google Scholar] [CrossRef]
- Zheng, H.; Zhang, L.; Liu, C.; Shao, Q.; Fukushima, Y. Changes in stream flow regime in headwater catchments of the Yellow River Basin since the 1950s. Hydrol. Processes 2007, 21, 886–893. [Google Scholar] [CrossRef]
- Wang, Y.; Wang, X.; Li, C.; Wu, F.; Yang, Z. Spatiotemporal analysis of temperature trends under climate change in the source region of the Yellow River, China. Theor. Appl. Climatol. 2015, 119, 123–133. [Google Scholar] [CrossRef]
- Gu, H.; Yu, Z.; Li, G.; Luo, J.; Ju, Q.; Huang, Y.; Fu, X. Entropy-Based Research on Precipitation Variability in the Source Region of China’s Yellow River. Water 2020, 12, 2486. [Google Scholar] [CrossRef]
- Morid, S.; Smakhtin, V.; Moghaddasi, M. Comparison of seven meteorological indices for drought monitoring in Iran. Int. J. Climatol. 2006, 26, 971–985. [Google Scholar] [CrossRef]
- McKee, T.; Doesken, N.J.; Kleist, J. The relationship of drought frequency and duration to time scales. In Proceedings of the 8th Conference on Applied Climatology, Anaheim, CA, USA, 17 January 1993. [Google Scholar]
- Palmer, W.C. Meteorological Drought; US Department of Commerce, Weather Bureau: Washington, DC, USA, 1965; Volume 30.
- Vicente-Serrano, S.M.; Beguería, S.; López-Moreno, J.I. A Multiscalar Drought Index Sensitive to Global Warming: The Standardized Precipitation Evapotranspiration Index. J. Clim. 2010, 23, 1696–1718. [Google Scholar] [CrossRef] [Green Version]
- Mohammed, R.; Scholz, M. The reconnaissance drought index: A method for detecting regional arid climatic variability and potential drought risk. J. Arid. Environ. 2017, 144, 181–191. [Google Scholar] [CrossRef]
- Tsakiris, G.; Vangelis, H. Establishing a Drought Index Incorporating Evapotranspiration. Eur. Water 2005, 9, 3–11. [Google Scholar]
- Asadi Zarch, M.A.; Sivakumar, B.; Sharma, A. Droughts in a warming climate: A global assessment of Standardized precipitation index (SPI) and Reconnaissance drought index (RDI). J. Hydrol. 2015, 526, 183–195. [Google Scholar] [CrossRef]
- Xu, K.; Yang, D.; Yang, H.; Li, Z.; Qin, Y.; Shen, Y. Spatio-temporal variation of drought in China during 1961–2012: A climatic perspective. J. Hydrol. 2015, 526, 253–264. [Google Scholar] [CrossRef]
- Ma, Q.; Jin, H.-J.; Bense, V.F.; Luo, D.-L.; Marchenko, S.S.; Harris, S.A.; Lan, Y.-C. Impacts of degrading permafrost on streamflow in the source area of Yellow River on the Qinghai-Tibet Plateau, China. Adv. Clim. Chang. Res. 2019, 10, 225–239. [Google Scholar] [CrossRef]
- Yuan, F.; Berndtsson, R.; Zhang, L.T.; Uvo, C.; Hao, Z.; Wang, X.-P.; Yasuda, H. Hydro Climatic Trend and Periodicity for the Source Region of the Yellow River. J. Hydrol. Eng. 2015, 20, 05015003. [Google Scholar] [CrossRef]
- Hu, Y.; Maskey, S.; Uhlenbrook, S.; Zhao, H. Streamflow trends and climate linkages in the source region of the Yellow River, China. Hydrol. Processes 2011, 25, 3399–3411. [Google Scholar] [CrossRef]
- Yihui, D.; Chan, J.C.L. The East Asian summer monsoon: An overview. Meteorol. Atmos. Phys. 2005, 89, 117–142. [Google Scholar] [CrossRef]
- Zhou, H.; Zhao, X.; Tang, Y.; Gu, S.; Zhou, L. Alpine grassland degradation and its control in the source region of the Yangtze and Yellow Rivers, China. Grassl. Sci. 2005, 51, 191–203. [Google Scholar] [CrossRef]
- Liu, J.; Zhang, W.; Liu, T.; Li, Q. Runoff Dynamics and Associated Multi-Scale Responses to Climate Changes in the Middle Reach of the Yarlung Zangbo River Basin, China. Water 2018, 10, 295. [Google Scholar] [CrossRef] [Green Version]
- Asadi Zarch, M.A.; Malekinezhad, H.; Mobin, M.H.; Dastorani, M.T.; Kousari, M.R. Drought Monitoring by Reconnaissance Drought Index (RDI) in Iran. Water Resour. Manag. 2011, 25, 3485. [Google Scholar] [CrossRef] [Green Version]
- Vangelis, H.; Tigkas, D.; Tsakiris, G. The effect of PET method on Reconnaissance Drought Index (RDI) calculation. J. Arid. Environ. 2013, 88, 130–140. [Google Scholar] [CrossRef]
- Ben Abdelmalek, M.; Nouiri, I. Study of trends and mapping of drought events in Tunisia and their impacts on agricultural production. Sci. Total Environ. 2020, 734, 139311. [Google Scholar] [CrossRef] [PubMed]
- Nedealcov, M.; Răileanu, V.; Sîrbu, R.; Cojocari, R. The Use Of Standardized Indicators (SPI And SPEI) In Predicting Droughts Over The Republic Of Moldova Territory. Present Environ. Sustain. Dev. 2015, 9, 149–158. [Google Scholar] [CrossRef]
- Kaczmarek, Z.; Strzepek, K.M.; Somlyody, L.; Priazhinskaya, V. Water Resources Management in the Face of Climatic/Hydrologic Uncertainties; Kluwer Academic Publishers: Dordrecht, The Netherlands, 1996; p. 407. [Google Scholar]
- Tigkas, D.; Vangelis, H.; Tsakiris, G. DrinC: A software for drought analysis based on drought indices. Earth Sci. Inform. 2015, 8, 697–709. [Google Scholar] [CrossRef]
- Hargreaves, G.H.; Samani, Z.A. Reference Crop Evapotranspiration from Temperature. Appl. Eng. Agric. 1985, 1, 96–99. [Google Scholar] [CrossRef]
- Thornthwaite, C.W. An Approach Toward a Rational Classification of Climate. Soil Sci. 1948, 66, 77. [Google Scholar] [CrossRef] [Green Version]
- Doorenbos, J.; Pruitt, W. Guidelines for predicting crop water requirements, FAO-ONU, Rome. Irrig. Drain. Pap. 1977, 24, 144. [Google Scholar]
- Hargreaves, G.H. Moisture Availability and Crop Production. Trans. ASAE 1975, 18, 980–0984. [Google Scholar] [CrossRef]
- Hargreaves, G.H.; Samani, Z.A. Estimating potential evapotranspiration. J. Irrig. Drain. Div. 1982, 108, 225–230. [Google Scholar] [CrossRef]
- Zhang, J.; Li, G.; Liang, S. The response of river discharge to climate fluctuations in the source region of the Yellow River. Environ. Earth Sci. 2012, 66, 1505–1512. [Google Scholar] [CrossRef]
- Khalili, D.; Farnoud, T.; Jamshidi, H.; Kamgar-Haghighi, A.A.; Zand-Parsa, S. Comparability Analyses of the SPI and RDI Meteorological Drought Indices in Different Climatic Zones. Water Resour. Manag. 2011, 25, 1737–1757. [Google Scholar] [CrossRef]
- Merabti, A.; Meddi, M.; Martins, D.S.; Pereira, L.S. Comparing SPI and RDI Applied at Local Scale as Influenced by Climate. Water Resour. Manag. 2018, 32, 1071–1085. [Google Scholar] [CrossRef]
- Zhang, L.; Gao, L. Drought and Wetness Variability and the Respective Contribution of Temperature and Precipitation in the Qinghai-Tibetan Plateau. Adv. Meteorol. 2021, 2021, 7378196. [Google Scholar] [CrossRef]
- Hu, Y.; Maskey, S.; Uhlenbrook, S. Trends in temperature and rainfall extremes in the Yellow River source region, China. Clim. Change 2012, 110, 403–429. [Google Scholar] [CrossRef] [Green Version]
- Khan, M.I.; Liu, D.; Fu, Q.; Dong, S.; Liaqat, U.W.; Faiz, M.A.; Hu, Y.; Saddique, Q. Recent Climate Trends and Drought Behavioral Assessment Based on Precipitation and Temperature Data Series in the Songhua River Basin of China. Water Resour. Manag. 2016, 30, 4839–4859. [Google Scholar] [CrossRef]
- Wang, Y.; Quan, Q.; Shen, B. Spatio-temporal variability of drought and effect of large scale climate in the source region of Yellow River. Geomat. Nat. Hazards Risk 2019, 10, 678–698. [Google Scholar] [CrossRef] [Green Version]
- Tian, H.; Lan, Y.; Wen, J.; Jin, H.; Wang, C.; Wang, X.; Kang, Y. Evidence for a recent warming and wetting in the source area of the Yellow River (SAYR) and its hydrological impacts. J. Geogr. Sci. 2015, 25, 643–668. [Google Scholar] [CrossRef]
- Zhang, W.; Wang, L.; Xiang, F.; Qin, W.; Jiang, W. Vegetation dynamics and the relations with climate change at multiple time scales in the Yangtze River and Yellow River Basin, China. Ecol. Indic. 2020, 110, 105892. [Google Scholar] [CrossRef]
- Liu, Q.; Cui, B. Impacts of climate change/variability on the streamflow in the Yellow River Basin, China. Ecol. Model. 2011, 222, 268–274. [Google Scholar] [CrossRef]
- Khan, M.I.; Liu, D.; Fu, Q.; Saddique, Q.; Faiz, M.A.; Li, T.; Qamar, M.U.; Cui, S.; Cheng, C. Projected Changes of Future Extreme Drought Events under Numerous Drought Indices in the Heilongjiang Province of China. Water Resour. Manag. 2017, 31, 3921–3937. [Google Scholar] [CrossRef]
- Cheng, Q.; Gao, L.; Chen, Y.; Liu, M.; Deng, H.; Chen, X. Temporal-Spatial Characteristics of Drought in Guizhou Province, China, Based on Multiple Drought Indices and Historical Disaster Records. Adv. Meteorol. 2018, 2018, 4721269. [Google Scholar] [CrossRef]
- Yin, Y.; Tang, Q.; Liu, X.; Zhang, X. Water scarcity under various socio-economic pathways and its potential effects on food production in the Yellow River Basin. Hydrol. Earth Syst. Sci. 2017, 21, 791–804. [Google Scholar] [CrossRef] [Green Version]
- Wohlfart, C.; Kuenzer, C.; Chen, C.; Liu, G. Social–ecological challenges in the Yellow River Basin (China): A review. Environ. Earth Sci. 2016, 75, 1066. [Google Scholar] [CrossRef]
Figure 1.
Geographical location of the source region of the Yellow River Basin and hydro-climatic stations settled in the area.
Figure 1.
Geographical location of the source region of the Yellow River Basin and hydro-climatic stations settled in the area.

Figure 2.
Differences and similarities (%) of drought classes on (a) monthly, (b) seasonal and (c) vegetation growing seasonal (VGS) and (d) annual scale according to SPI and RDI values.
Figure 2.
Differences and similarities (%) of drought classes on (a) monthly, (b) seasonal and (c) vegetation growing seasonal (VGS) and (d) annual scale according to SPI and RDI values.

Figure 3.
The geographical distribution of the mean RDI in 1961–2015 over SRYRB on the (a) annual, (b) vegetation growing seasonal (VGS) and (c–f) seasonal scale: (c) autumn, (d) winter, (e) spring and (f) summer.
Figure 3.
The geographical distribution of the mean RDI in 1961–2015 over SRYRB on the (a) annual, (b) vegetation growing seasonal (VGS) and (c–f) seasonal scale: (c) autumn, (d) winter, (e) spring and (f) summer.

Figure 4.
Changes in RDI over SRYRB during the period 1960–2015 on the (a) annual, (b) vegetation growing seasonal (VGS) and (c–f) seasonal scale: (c) autumn, (d) winter, (e) spring and (f) summer.
Figure 4.
Changes in RDI over SRYRB during the period 1960–2015 on the (a) annual, (b) vegetation growing seasonal (VGS) and (c–f) seasonal scale: (c) autumn, (d) winter, (e) spring and (f) summer.

Figure 5.
Time series and change trends of RDI at (a) annual, (b) vegetation growing seasonal (VGS) and (c–f) seasonal scales during 1960–2015: (c) autumn, (d) winter, (e) spring and (f) summer.
Figure 5.
Time series and change trends of RDI at (a) annual, (b) vegetation growing seasonal (VGS) and (c–f) seasonal scales during 1960–2015: (c) autumn, (d) winter, (e) spring and (f) summer.

Figure 6.
Intra-annual distribution of drought and wetness over SRYRB during 1960–2015.

Figure 7.
Changes in frequency of drought and wetness events of different magnitudes in SRYRB during 1960–2015 on the annual scale. (a) Extreme drought, (b) severe drought, (c) moderate drought, (d) mild drought, (e) moderate wetness and (f) severe and extreme wetness.
Figure 7.
Changes in frequency of drought and wetness events of different magnitudes in SRYRB during 1960–2015 on the annual scale. (a) Extreme drought, (b) severe drought, (c) moderate drought, (d) mild drought, (e) moderate wetness and (f) severe and extreme wetness.

Figure 8.
Changes in frequency of drought and wetness events of different magnitudes in SRYRB during 1960–2015 on the vegetation growing seasonal (VGS) scale. (a) Extreme drought, (b) severe drought, (c) moderate drought, (d) mild drought, (e) moderate wetness and (f) severe and extreme wetness.
Figure 8.
Changes in frequency of drought and wetness events of different magnitudes in SRYRB during 1960–2015 on the vegetation growing seasonal (VGS) scale. (a) Extreme drought, (b) severe drought, (c) moderate drought, (d) mild drought, (e) moderate wetness and (f) severe and extreme wetness.

Figure 9.
Changes in frequency of drought and wetness events of different magnitudes in SRYRB during 1960–2015 at the season scale. (a) Extreme drought, (b) severe drought, (c) moderate drought, (d) mild drought, (e) moderate wetness and (f) severe and extreme wetness.
Figure 9.
Changes in frequency of drought and wetness events of different magnitudes in SRYRB during 1960–2015 at the season scale. (a) Extreme drought, (b) severe drought, (c) moderate drought, (d) mild drought, (e) moderate wetness and (f) severe and extreme wetness.


Table 1.
Geographical characteristics and meteorological data of 12 sites in SRYRB during the hydrological year of 1960/1961 to 2014/2015.
Table 1.
Geographical characteristics and meteorological data of 12 sites in SRYRB during the hydrological year of 1960/1961 to 2014/2015.
| Code | Name | Longitude (°E) | Latitude (°N) | Elevation (m) | Tmax 1 (°C) | Tmin 2 (°C) | P 3 (mm) |
|---|---|---|---|---|---|---|---|
| 52943 | Xinghai | 99.98 | 35.58 | 3323.2 | 9.77 ± 0.74 | −5.78 ± 0.86 | 346.47 ± 75.2 |
| 52955 | Guinan | 100.75 | 35.58 | 8120.0 | 11.11 ± 0.76 | −4.32 ± 0.65 | 396.03 ± 90.96 |
| 56021 | Qumarleb | 95.78 | 34.13 | 4175.0 | 5.87 ± 0.97 | −8.54 ± 0.92 | 362.53 ± 109.92 |
| 56033 | Madoi | 98.22 | 34.92 | 4272.3 | 3.89 ± 0.98 | −9.51 ± 1.16 | 284.84 ± 88.61 |
| 56034 | Qingshuihe | 97.13 | 33.80 | 4415.4 | 3.97 ± 0.86 | −11.22 ± 0.83 | 431.68 ± 146.93 |
| 56043 | Golog | 100.25 | 34.47 | 3719.0 | 8.55 ± 0.75 | −7.21 ± 0.93 | 473.8 ± 90.42 |
| 56046 | Darlag | 99.65 | 33.75 | 3967.5 | 6.92 ± 0.82 | −6.78 ± 0.88 | 490.45 ± 119.44 |
| 56065 | Henan | 101.60 | 34.73 | 8500.0 | 8.96 ± 0.87 | −6.59 ± 1.07 | 539.76 ± 96.32 |
| 56067 | Jiuzhi | 101.48 | 33.43 | 3628.5 | 9.41 ± 0.85 | −5.67 ± 0.96 | 680.62 ± 126.81 |
| 56074 | Maqu | 102.08 | 34.00 | 3471.4 | 9.12 ± 0.72 | −4.52 ± 1.20 | 565.75 ± 97.8 |
| 56079 | Zoigê | 102.97 | 33.58 | 3439.6 | 9.41 ± 0.76 | −4.97 ± 0.94 | 649.92 ± 101.76 |
| 56173 | Hongyuan | 102.55 | 32.80 | 3491.6 | 10.27 ± 0.77 | −5.32 ± 1.01 | 749.36 ± 99.67 |
1 Tmax stands for average maximum monthly temperature in °C ± standard deviation (SD), 2 Tmin denotes average minimum monthly temperature and 3 P represents average annual precipitation in mm ± SD.
Table 2.
Classification of drought and corresponding probability according to SPI and RDI.
| SPI and RDI Range | Probability (%) | Drought Classes |
|---|---|---|
| 2.0 or more | 2.3 | Extreme wetness |
| 1.5 to 1.99 | 4.4 | Severe wetness |
| 1.0 to 1.49 | 9.2 | Moderate wetness |
| 0.99 to 0.0 | 34.1 | Normal |
| 0.0 to −0.99 | 34.1 | Mild drought |
| −1.0 to −1.49 | 9.2 | Moderate drought |
| −1.5 to −1.99 | 4.4 | Severe drought |
| −2.0 or less | 2.3 | Extreme drought |
Table 3.
Comparison of SPI and RDI at each meteorological station on annual scale.
| Name | SPI-12Min 1 | RDI-12Min | SPI-12Max 2 | RDI-12Max |
|---|---|---|---|---|
| Xinghai | −3.41 | −3.22 | 1.87 | 1.79 |
| Guinan | −2.88 | −2.70 | 2.05 | 2.06 |
| Qumarleb | −2.58 | −2.66 | 2.07 | 2.06 |
| Madoi | −2.32 | −2.32 | 1.63 | 1.79 |
| Qingshuihe | −2.29 | −2.16 | 1.56 | 1.44 |
| Golog | −2.79 | −2.58 | 2.16 | 2.30 |
| Darlag | −2.34 | −2.45 | 1.56 | 1.67 |
| Henan | −1.62 | −1.57 | 1.83 | 2.20 |
| Jiuzhi | −2.99 | −3.60 | 1.89 | 2.17 |
| Maqu | −3.18 | −3.00 | 2.37 | 2.44 |
| Zoigê | −2.30 | −2.41 | 2.73 | 2.67 |
| Hongyuan | −1.94 | −1.87 | 2.56 | 2.52 |
1 Min stands for minimum value and 2 Max denotes maximum value.
Table 4.
Intra-annual frequency (%) of drought and wetness over SRYRB during 1960–2015.
| Classes | September | October | November | December | January | February | March | April | May | June | July | August |
|---|---|---|---|---|---|---|---|---|---|---|---|---|
| Mild Drought | 34.5 | 34.5 | 52.7 | 50.9 | 41.8 | 43.6 | 27.3 | 36.4 | 34.5 | 36.4 | 41.8 | 43.6 |
| Moderately Drought | 9.1 | 5.5 | 3.6 | 0.0 | 9.1 | 3.6 | 16.4 | 10.9 | 7.3 | 9.1 | 9.1 | 1.8 |
| Severely Drought | 1.8 | 5.5 | 0.0 | 0.0 | 0.0 | 3.6 | 1.8 | 0.0 | 3.6 | 1.8 | 0.0 | 3.6 |
| Extremely Drought | 0.0 | 0.0 | 0.0 | 0.0 | 0.0 | 0.0 | 0.0 | 0.0 | 0.0 | 1.8 | 0.0 | 0.0 |
| Moderately Wetness | 7.3 | 1.8 | 10.9 | 7.3 | 7.3 | 9.1 | 10.9 | 7.3 | 3.6 | 12.7 | 9.1 | 5.5 |
| Severely Wetness | 0.0 | 3.6 | 0.0 | 3.6 | 1.8 | 5.5 | 0.0 | 3.6 | 1.8 | 0.0 | 1.8 | 1.8 |
| Extremely Wetness | 1.8 | 0.0 | 0.0 | 0.0 | 1.8 | 0.0 | 0.0 | 0.0 | 0.0 | 0.0 | 0.0 | 0.0 |
| Totally Wetness | 9.1 | 5.4 | 10.9 | 10.9 | 10.9 | 14.6 | 10.9 | 10.9 | 5.4 | 12.7 | 10.9 | 7.3 |
Table 5.
Change rates (mon/decade) and associated significances for drought and wetness events of different magnitudes in SRYRB during 1960–2015 on the season scale. Asterisks denote the significance of 0.05 level.
Table 5.
Change rates (mon/decade) and associated significances for drought and wetness events of different magnitudes in SRYRB during 1960–2015 on the season scale. Asterisks denote the significance of 0.05 level.
| Classes | Seasons | |||
|---|---|---|---|---|
| Autumn | Winter | Spring | Summer | |
| extreme drought | −0.01 | −0.01 | −0.01 | −0.03 * |
| severe drought | −0.05 * | −0.07 * | −0.06 * | −0.05 * |
| moderate drought | −0.08 * | −0.27 * | −0.37 * | −0.09 * |
| mild drought | −0.06 | −0.21 * | −0.14 * | −0.20 * |
| moderate wetness | 0.04 | 0.12 * | 0.13 * | 0.07 * |
| severe and extreme wetness | −0.01 | 0.02 | 0.02 | 0.02 |
* Represent that change rates are statistically significant at the level of 0.05.
Publisher’s Note: MDPI stays neutral with regard to jurisdictional claims in published maps and institutional affiliations. |
© 2022 by the authors. Licensee MDPI, Basel, Switzerland. This article is an open access article distributed under the terms and conditions of the Creative Commons Attribution (CC BY) license (https://creativecommons.org/licenses/by/4.0/).
Share and Cite
MDPI and ACS Style
Ren, Y.; Liu, J.; Shalamzari, M.J.; Arshad, A.; Liu, S.; Liu, T.; Tao, H. Monitoring Recent Changes in Drought and Wetness in the Source Region of the Yellow River Basin, China. Water 2022, 14, 861. https://doi.org/10.3390/w14060861
AMA Style
Ren Y, Liu J, Shalamzari MJ, Arshad A, Liu S, Liu T, Tao H. Monitoring Recent Changes in Drought and Wetness in the Source Region of the Yellow River Basin, China. Water. 2022; 14(6):861. https://doi.org/10.3390/w14060861
Chicago/Turabian StyleRen, Yanqun, Jinping Liu, Masoud Jafari Shalamzari, Arfan Arshad, Suxia Liu, Tie Liu, and Hui Tao. 2022. "Monitoring Recent Changes in Drought and Wetness in the Source Region of the Yellow River Basin, China" Water 14, no. 6: 861. https://doi.org/10.3390/w14060861
Note that from the first issue of 2016, this journal uses article numbers instead of page numbers. See further details here.