
Different Irrigation Pressure and Filter on Emitter Clogging in Drip Phosphate Fertigation Systems


1
Key Laboratory of Agricultural Soil and Water Engineering in Arid and Semiarid Areas, Ministry of Education, Northwest A&F University, Yangling 7121100, China
2
State Key Laboratory of Eco-Hydraulics in Northwest Arid Region of China, Xi’an University of Technology, Xi’an 710048, China
3
Department of Plant and Environmental Sciences, University of Copenhagen, 1353 Copenhagen, Denmark
*
Author to whom correspondence should be addressed.
Water 2022, 14(6), 853; https://doi.org/10.3390/w14060853
Submission received: 2 November 2021
/
Revised: 28 February 2022
/
Accepted: 1 March 2022
/
Published: 9 March 2022
(This article belongs to the Special Issue Agricultural Water Management: Strategies for Improving Irrigation Efficiency)
Abstract
:Irrigation pressures and filters have a significant influence on emitter clogging in drip fertigation systems. Exploring the anti-clogging performance of emitters at different irrigation pressures (80, 90, 100 kPa; 40, 50, 60 kPa) and filters (the disc filter with an aperture of 125 μm, the screen filter with an aperture of 125μm, and the screen filter with an aperture of 200 μm) can provide suitable guidance for the design and operation of drip fertigation systems. The average relative discharge (Dra), the Christiansen uniformity coefficient (CU), and the differential pressure (DP) were analyzed to study the anti-clogging performance of flat emitters (FE) and labyrinth emitters (LE). Meanwhile, the scanning electron microscope and energy dispersive spectrometer were used to observe the surface morphology and chemical composition of clogging substances in filters and emitters. Results showed that the irrigation pressure of 90 and 50 kPa did not cause a significant decrease in Dra, and the Dra of two types of emitters were all great than 95.22%. When the irrigation pressure was 80 and 40 kPa, the Dra decreased significantly (73.48–78.71%, 81.3–83.6% for FE and LE). The CU values of emitters were all greater than 90% except for the irrigation pressures of 80 and 40 kPa. The relative Dra and CU of LE were greater than those of FE, indicating that the LE had a better anti-clogging performance compared with the FE. The decrease in DP reflected an increase in the emitter clogging degree. Meanwhile, irrigation pressures and the interaction between irrigation pressures and filters imposed a significant effect on the CU at a significance level of p < 0.05, p < 0.01, respectively. The clogging process was mainly affected by physical and chemical factors, and the generated clogging substances included phosphate fertilizer, silicate, carbonate, and phosphate precipitations. In conclusion, the best operation mode of phosphate fertilizer in drip fertigation systems was to use the disc filter with an aperture of 125 μm and the LE at the irrigation pressure of 50 kPa. An appropriate irrigation pressure combined with effective filters can reduce emitter clogging while saving water and fertilizer.
1. Introduction
Drip fertigation is the most promising technology to improve water and fertilizer utilization and increase crop yield while minimizing the impacts of fertilizers on the environment [1,2]. However, emitter clogging caused by fertilizers has become one of the main barriers for the application of drip fertigation systems, which may lead to poor water and fertilizer distribution, resulting in a reduction of economic benefits. Meanwhile, the interaction between fertilizer and water is regarded as the most direct and main factor affecting emitter clogging in drip fertigation systems [3,4]. Although various methods have been proposed to solve the emitter clogging problem caused by fertilizers, it has not been fully resolved. Therefore, it is necessary to study the clogging issues of emitters in drip irrigation systems when using fertilizers.
Extensive research has been done on emitter clogging issues caused by fertilizers in drip fertigation systems [5,6]. Different operation modes of drip fertigation systems have been tried, for example, using different manifold layouts [7], different types of fertilizer injection [8], different fertilizer types, and flow channel structures [9]. Additionally, previous studies have shown that the use of phosphate fertilizer is a vital factor that may cause the emitter clogging in drip fertigation systems. The reason is that various sediments are formed because of the reaction between fertilizer and water [10]. Ma et al. [11] found that different types of phosphate fertilizers had different effects on emitter clogging. The better operation modes were a low concentration with long-term running or a high concentration with short-term running mode when using phosphate fertilizer. Wang et al. [12] believed that the fertilizer use efficiency was too low when directly using phosphate fertilizer. Therefore, applying phosphate fertilizer through drip irrigation is an efficient way of fertilizing, which can reduce the pollution of phosphate fertilizer to soil and achieve precise fertilization while saving water and fertilizer.
Although filters in drip fertigation systems can filter out most of the insoluble fertilizers in the water [13,14,15], they cannot remove the sediment generated by the subsequent chemical reaction, which eventually induces emitter clogging. Researchers applied different pressures in drip irrigation systems to reduce the emitter clogging degree [16,17,18]. Ma et al. [19] concluded that when the drip irrigation system was operated at the pressure of 40 kPa, it was possible to reduce emitter clogging by selecting the emitter flow channel size and using intermittent irrigation methods. Meanwhile, Zhang et al. [20] found that by adding pulsating pressure, the average emitter discharge and Christiansen uniformity coefficient of labyrinth emitters were improved, resulting in a reduction in emitter clogging. The turbulence intensity of emitters was more prominent when using fluctuating water pressure than using static pressure, and the strong turbulence could reduce the emitter clogging degree. Therefore, changing irrigation pressure is also an effective means to realize different operating modes of drip irrigation systems.
Studies have been conducted to evaluate the clogging of emitters in drip irrigation systems [21]. However, there is little information available about the clogging degree of the whole fertigation system when using phosphate fertilizer. Selecting an irrigation pressure which is beneficial to extending the operating life of phosphate drip fertigation systems is of great importance to reduce emitter clogging. Studies have been done to select the most suitable irrigation pressures [16,22], and many experts have also studied the impact of different filters on the clogging of emitters [23,24]. However, the combined influence of irrigation pressures and filters on the performance of emitters in the phosphate drip fertigation systems has not been well documented. The use of different irrigation pressures, filters, and emitters can induce different operating situations of drip phosphate fertigation systems, which in turn affects the clogging of emitters in the system.
The objectives of this paper were to: (1) analyze the clogging degree of emitters when using different irrigation pressures and different filters in drip fertigation systems; (2) explore the clogging substances and the formation process of clogging when using phosphate fertilizer; (3) provide a suitable application mode for the operation management in the process of water and fertilizer integration.
2. Materials and Methods
2.1. Experiment Materials
The field experiments were conducted at the Shiyang River Ecological Water Saving Experimental Station (102°50′ E, 37°52′ N) in Gansu Province, China, from June to September in 2017 and 2018. The station is a typical arid area, with a drought index of 5–25, an annual average rainfall of 160 mm and evaporation of 2000 mm. The average altitude of the station is 1581 m. Table 1 shows the characteristics of the irrigation water (samples were taken three times a year), in which the content of calcium ion, bicarbonate ions and sulfate ions are higher, and the water quality is weakly alkaline.
The single plot layout of field experiments is shown in Figure 1, which comprises a proportional fertilization pump (design flow discharge of 20 to 2500 L/h, Qifeng Modern Agricultural Engineering Co., Ltd., Yangling, China), precision digital display pressure gauge (measuring range of 0 to 0.25 MPa, with an accuracy of 0.25%, Mike Sensing Technology Co., Ltd., Hangzhou, China), water meters (with an accuracy of 2%), valves, filters (Lu-mei Water Saving Technology Co., Ltd., Jieyang, China), portable ultrasonic flowmeters (the accuracy is 1%, TUF2000H YOKE Instrument Co., Ltd.), and driplines with flat emitters (FE), driplines with flank labyrinth emitters (LE) (Shaanxi Yangling Fengyuan Agricultural Technology Engineering Co., Ltd.). Table 2 shows the detailed parameters of non-pressure compensating emitters, and the two types of emitters are commonly used in the local area. The injection ratio of the fertilization pump was 2%. Filters used in the experiments included the disc filter with aperture of 125 μm (DF125), and the screen filter with aperture of 125 μm (SF125) and 200 μm (SF200).
2.2. Experiment Methods
The experiments were carried out in a maize field which was divided into eight plots, and the same emitters were used for each of the four plots (A, B, C, D plots for flat emitters; E, F, G, H plot for labyrinth emitters). Three of the four plots were fertigation areas (50 m × 3.6 m), and one plot was a non-fertilized irrigation area (50 m × 2 m) as a control. Each irrigation plot had four 48 m driplines, and the driplines were equipped with DF125, SF125, SF200, and no filters, respectively. The single plot layout of the experiment is shown in Figure 1.
The rated pressure of FE and LE given by the manufacturer were 100 kPa and 60 kPa, which is relatively large to ensure the normal operation of emitters in different environments. However, the large working pressure would reduce the operating life and operating benefits of the drip irrigation system. Therefore, preliminary experiments on operating pressure of drip fertigation system were carried out in the Hydraulic Engineering Department of Northwest Agriculture and Forestry University, and it was found that the two types of emitters can work normally at the irrigation pressure of 80–100 kPa and 40–60 kPa, respectively. Therefore, the working pressures of emitters in the field experiment were selected according to the preliminary hydraulic performance experiments. The pressure of FE without using fertilizer was 80 kPa (plot A), and the fertigation plots of FE were set to 80 kPa (plot B), 90 kPa (plot C), and 100 kPa (plot D), respectively. As the driplines with LE have a thinner wall and are easy to rupture, the pressure setting of LE was lower than the driplines with FE. The pressure of LE without using fertilizer was 40 kPa (plot E), and the fertigation plots of LE were 40 kPa (plot F), 50 kPa (plot G), and 60 kPa (plot H), respectively. Plot A and plot E were not fertilized and served as the control group of the experiment. A total of twenty-four treatments were carried out, except for the control group, and the specific experimental treatments are shown in Table 3. Fertigation was carried out nine times a year in 2017 and 2018 throughout the growth cycle of maize. The number of irrigations is determined by the water demand during the maize growth period.
The types of fertilizer used in the field were nitrogen fertilizer (CO(NH2)2, Xinjiang Xinlianxin Energy Chemical Production), potash fertilizer (K2SO4, produced by Qinghai Lianyu), and diamine phosphate ((NH4)2HPO4, produced by Hubei Dayukou Chemical Industry). Thirty percent nitrogen fertilizer (200 kg/ha), and potash fertilizer (90 kg/ha) were applied as the base fertilizer before planting, then seventy percent urea was used on the jointing stage, and the whole growth period was fully irrigated. Phosphate fertilizer was applied to the field through drip fertigation systems. There were some gray-green powdery precipitates when phosphate fertilizer was dissolved in water. The diamine phosphate (200 kg/ha) was averaged into nine fertigation events, and the application amount for each plot was the same each time, which was 0.87 kg.
The irrigation process was performed in two stages, including the fertigation stage and the irrigation stage. First, fertigation was carried out with fertilizer solution, and the duration of the stage was about 24 min, and then irrigated with fresh water for one hour. The clogging substances were reduced by alternately using fertilizer solution and fresh water in drip fertigation systems. In the experiments, valves were used to control the pressure at the inlet of the feeder line. Pressures at the beginning and tail of driplines were measured during the fertigation period, and the differential pressure (DP) was recorded three times per minute. Driplines with a length of 48 m were divided into three parts: head (0–6 m), middle (21–27 m), and tail (42–48 m). The number of FE and LE on each part was 20 and 40, and the total measured number of FE and LE was 60 and 120, respectively. The discharge samples were collected on the head, middle, and tail sections of driplines during the fertigation period. Three repeated measurements on the required experimental data were carried out to reduce the influence of experimental error on the results. The filter screen is inside the screen filters, and the filter core is inside the disc filters. The screen is made of iron, while the core is made of plastic. Filter screen or core was taken out from filters when they were clogged, and placed in a ventilated and shaded place to dry. Clogging substances in filters and their corresponding emitters were collected, then classified and observed according to the types of filters and emitters. The scanning electron microscope (Hitachi S-4800) and energy spectrometer were used to observe and analyze the clogging substances.
2.3. Evaluation Indexes
The average relative discharge of emitters was calculated by Equation (1):
is the initial discharge of emitters when emitters are not clogged (L/h), which was measured at the beginning of experiments, is the discharge when emitters are clogged to a certain extent after using for a period of time (L/h), i = 1, 2, 3, ……, n, and n represents the number of emitters. The value decreases when emitters are clogged to a certain degree, which means a decrease of Dra. Dra decreases as emitter clogging degree increases. When the is less than 75%, the emitter is seriously clogged.
Irrigation uniformity is an important indicator to evaluate the design of drip irrigation systems and irrigation quality. The Christiansen uniformity coefficient (CU) was used to evaluate the emitter clogging degree and to measure the irrigation uniformity.
The Christiansen uniformity coefficient [25] was calculated as
CU is the Christiansen uniformity coefficient, %; is the mean of the discharge; is the i-th observed discharge value; n—total number of observations.
DP is the differential pressure, kPa; P1 is the pressures at the head of driplines, kPa; P2 is the pressures at the tail of driplines, kPa.
2.4. Statistical Analyses
A two-way analysis of variance (ANOVA) was carried out using SPSS. The correlation of different irrigation pressures, filter types, and their interactions on CU was analyzed. The significance was identified by the level of p. p < 0.05 and p < 0.01 represent the significant and extremely significant effects.
3. Results
3.1. Emitter Average Relative Discharge and Irrigation Uniformity
Table 4 shows the Dra of emitters at different positions of driplines. It can be seen from Table 4 that only B3, B4, F3 and F4 had a lower Dra and showed different clogging degrees. The Dra of B3 and B4 ranged between 73.48 and 78.71%, and B3 was less clogged than B4. The Dra of the head and tail sections of B4 was less than 73.74% (less than 75%), which represented severe clogging. Meanwhile, the Dra of F3 and F4 was greater than the head section, which was 91.04%, and no clogging occurred. However, the Dra values of the middle and tail sections of F3 and F4 were 80.92–84.36%. When running at the low pressure (the FE at 80 kPa, the LE at 40 kPa), the Dra at the tail of the driplines was small. However, the Dra was not obviously reduced if equipped with an appropriate filter (B1, B2, F1, F2) even when the irrigation pressure was low, which meant that low-pressure operation with a suitable filter could reduce emitter clogging. When using the DF125 and the SF125, the Dra of FE was greater than 91.82%, and the Dra of LF was greater than 95.41%, indicating that no emitter clogging was observed at low-pressure conditions (FE at 80 kPa, LE at 40 kPa). At the irrigation pressure of 90 and 50 kPa and the DF125 and SF125 filters were used, the Dra of two types of emitters was greater than 95.22%.
Figure 2 shows the variation of Christiansen uniformity along the length of driplines. On the whole, the CU at the head of driplines was better than that of the middle and tail. The CU value of most working conditions was greater than 90%. However, there were some special cases. The CU of B3 and B4 were between 70 and 80%, while the CU of FE at other working conditions was greater than 90%. The lowest CU of F3 and F4 was 82.7%, that appeared at the tail section of F4. In general, the CU at the head and middle of the two kinds of driplines was greater than the tail, and the CU was more than 90%, except for using the SF200 or no filter. At a low pressure operation, the use of the two types of emitters with the DF125 and the SF125 could improve irrigation uniformity.
3.2. Clogging of Emitters at Different Pressures
Differential pressure (DP) between the head and tail of the driplines represents the clogging degree of emitters in the field experiment. The smaller the DP is, the less the head loss is. The calculation formula for the head loss is , where v is the flow rate, g is gravity acceleration, and is the head loss coefficient, which is determined by the type of driplines. A reduction in head loss means a reduction in flow rate, and the emitter discharge becomes smaller, which means the clogging degree of emitter increases. Therefore, the DP was positively correlated with the emitter discharge and negatively correlated with the clogging degree. The changes of DP were observed to detect the clogging degree of emitters.
Figure 3 shows the changes of DP between the head and tail of driplines. The DP of driplines fluctuated in a small range with the increase of irrigation frequency, and the overall trend was gradually decreasing, which meant that the clogging degree of emitters was increasing. At the irrigation pressure of 80 kPa (B plot), the DP of B3 and B4 showed a more significant change than B1 and B2. Meanwhile, the DP decrease of B4 was 5 kPa after the 9th fertigation, followed by B3 (4 kPa). At the irrigation pressure of 90 kPa (C plot), the lowest DP appeared at the driplines of C3 and C4. The DP between C1 and C2 decreased slightly, while the DP of C3 and C4 was more pronounced. At the irrigation pressure of 100 kPa (D plot), the DP of D1 and D2 did not fluctuate obviously compared with 80 and 90 kPa. In general, the DP of FE decreased with the increase of irrigation pressure (the DP showed a decreasing trend). Meanwhile, when the FE is equipped with the SF200 and no filter at the same irrigation pressure, the trend line of DP decreased obviously.
The maximum decrease of DP in the F plot was at 4 kPa (at the irrigation pressure of 40 kPa). Although the DP values of F1 and F2 changed during fertigation, they returned to the initial value at the end of fertigation, thus the clogging had not been stubbornly persisted. The DP of F3 and F4 did not change significantly after the mid-term decrease until the end of the fertigation event. At the pressure of 50 kPa (G plot) and 60 kPa (H plot), the DP fluctuated within a narrow range, which was not significantly decreased compared with 40 kPa.
3.3. Clogging Substances
The clogging substances in DF125, SF125, and their corresponding emitters were collected for analysis. Clogging substances were determined qualitatively and quantitatively by scanning electron microscopy and energy spectrum analysis. The representative clogging substances are shown in Figure 4 and Figure 5.
Figure 5a–d shows the energy spectrum analysis of clogging substances in filters. The clogging substances in Figure 4a1 were a block as a whole. From the energy spectrum analysis (Figure 5a), the main element contained in the clogging substances was Fe, and the content was as high as 65%. The iron came from the filter since the filter screen is made of iron. In Figure 4a2, the clogging substances were a flocculent aggregated with an uneven surface. Figure 5b showed that P content was as high as 19%, which was the same as the P content in phosphate fertilizer, and the substances might originate from phosphate fertilizer. At the same time, the atomic ratio of phosphorus to oxygen was 1: 4, and PO43− could be formed at certain conditions. PO43− and Ca2+ formed insoluble precipitate substances because the water used in the experiment contained a large number of calcium ions. The clogging substances from Figure 4b1 were in a block shape with some impurities attached, where the mass fraction of Ca2+ was greater than 24%. There were precipitated crystals on the surface of the clogging substances in Figure 4b2, and the mass fraction of Si was high in the energy spectrum analysis.
Figure 5e–h shows the energy spectrum analysis of clogging substances in emitters. Among them, Figure 5e,f illustrated the clogging substances in LE. The clogging substances in Figure 5e contained Si, and the mass fraction was 24.5%. The content of Ca and P in the clogging substances in Figure 5f was relatively high, with mass fractions of 16.32 and 15.19%, respectively. In particular, S was found in the clogging substances, and this was due to the fact that the water in the Shiyang River contained a large amount of SO42−, so CaSO4 was generated. Figure 5g,h shows the clogging substances in FE. Si presented the highest content in the clogging substances of Figure 5g, with a mass fraction of 15.88%, followed by P and Ca with a content of 12.85 and 8.62%, respectively. The content of Si and Ca in the clogging substances of Figure 5h was relatively high, with mass fractions of 16.23 and 9.97%, respectively.
According to energy spectrum analysis, the main elements of clogging substances in emitters (except C and O) were Si, Ca, P, and Fe. After filtration, the contents of the main elements in the clogging substances were reduced. Si content in emitters was lower than that in filters, indicating that filters could effectively filter sand in the drip fertigation system. As calcium ions in water reacted with the phosphate ions in fertilizers and produced precipitations, the filtration system can effectively filter this flocculent precipitation, preventing calcium from entering emitters. The main element causing emitter clogging was Si from the analysis of the clogging substances in emitters (Figure 5e–h). In addition, undissolved phosphate fertilizer and the generated insoluble precipitation, such as CaCO3 and CaSO4, were also crucial factors that aggravated the clogging of emitters and filters.
4. Discussion
4.1. Operating Status of the System at Low Irrigation Pressures
For the B plot, the Dra values of FE were greater than 91.38% except for B3 and B4, and the Dra values of LE were greater than 94.90% except for F3 and F4 (Table 4). Dra values of the two types of emitters were all greater than 90% (except for B3 and B4, and F3 and F4), which showed that the drip fertigation system could operate normally at low-pressure operating conditions when using a suitable type of filter. From Figure 2, the CU values of FE were all greater than 90% (except B3 and B4), and the CU values of LE were all greater than 88% (except F3 and F4), indicating that the irrigation uniformity of the two types of emitters was different when operating at a low pressure. Table 4 and Figure 2 showed that the Dra and CU at the tail of the driplines were smaller than the head and middle sections, which meant that the clogging degree at the tail of the driplines was greater than that of the head and middle sections (except for B3, B4, F3 and F4). From Figure 2, the CU values of FE had a smaller change along the length of the dripline than LE, indicating that FE was more suitable for laying over longer distances.
It was found that the Dra of two types of emitters were better than the CU (except for B3, B4, F3 and F4, the values of Dra were all greater than 90%). The CU of two types of emitters was quite different at the same operating conditions. Therefore, it is necessary to analyze the influence of irrigation pressures and filters on the CU. The effects of different irrigation pressures, filter types, and their interactions on the CU were carried out through a two-way analysis of variance (F test). Results are shown in Table 5. From Table 5 we can see that irrigation pressures and the interaction between the irrigation pressure and filter imposed a significant effect on the CU at a significance level of p < 0.05 and p < 0.01, respectively. The CU of the same type of emitters were significantly different at different irrigation pressures (Figure 2). At the same irrigation pressure, the CU value changed significantly when the filter was not installed and the filter aperture was 200 μm (for example, B3 and B4). However, when the irrigation pressure was the same and the filter aperture was 125 μm (for example, B1 and B2), the corresponding CU was not significantly different, which was consistent with the statistical analysis results.
4.2. Irrigation Pressures on Emitter Clogging
Emitter clogging results decreased in DP. It can be seen from Figure 3 that neither of the two types of emitters was clogged when operating at high irrigation pressures (100 kPa, 60 kPa), indicating that high irrigation pressures were beneficial to improve the anti-clogging performance of emitters. However, the operating cost of irrigation systems would increase, and the operating life of drip phosphate fertigation systems would be reduced. When the Dra of B3 and B4 was 73.48–78.71%, the FE was clogged, and the decrease of DP exceeded 5 kPa. When the Dra of F3 and F4 was 80.92–93.52%, the LE was clogged, and the decrease of DP exceeded 4 kPa. A too small irrigation pressure reduced the flow rate in emitters, which then affected the water flow’s ability of carrying out clogging substances [26]. However, this experiment did not induce emitter clogging by using proper filters and emitters. The emitters of B1 and B2 were not clogged at the pressure of 80 kPa, while the emitters of B3 and B4 were clogged. Therefore, the clogging degree of emitters can be reduced through the proper coordination of irrigation pressures, filters, and emitters. When the irrigation pressures of the two types of driplines were 90 kPa and 50 kPa, respectively, emitters were not clogged.
The change of DP represents the clogging degree of emitters in a dripline. Although the DP of F1, G1 and H1 had changed, they eventually returned to the initial value, which showed that the LE was restored unobstructed (Figure 3F–H plot). Duran-Ros et al. [27] suggested that the recovery of clogging emitters was due to the flushing of clogging substances. The fluctuation of DP can induce the change of the flow velocity in emitters, leading to different water erosion degrees. The change of DP was similar to applying a small pulsating pressure in the drip fertigation systems. Zhang et al. [22] compared the operating status of emitters in drip irrigation systems at an irrigation pressure of 40 kPa and a pulsating pressure, and found that the pulsating pressure could reduce emitter clogging. Our experiment results agree with Zhang et al. [22]. The pressure pulsation caused the flow velocity change, resulting in an increase in the turbulent kinetic energy of flow, which intensified the erosion of water, and finally led to a reduction of clogging in emitters. Likewise, Yu et al. [28] found that the flushing pressure increased the sand carrying capacity of the flow, thereby reducing emitter clogging.
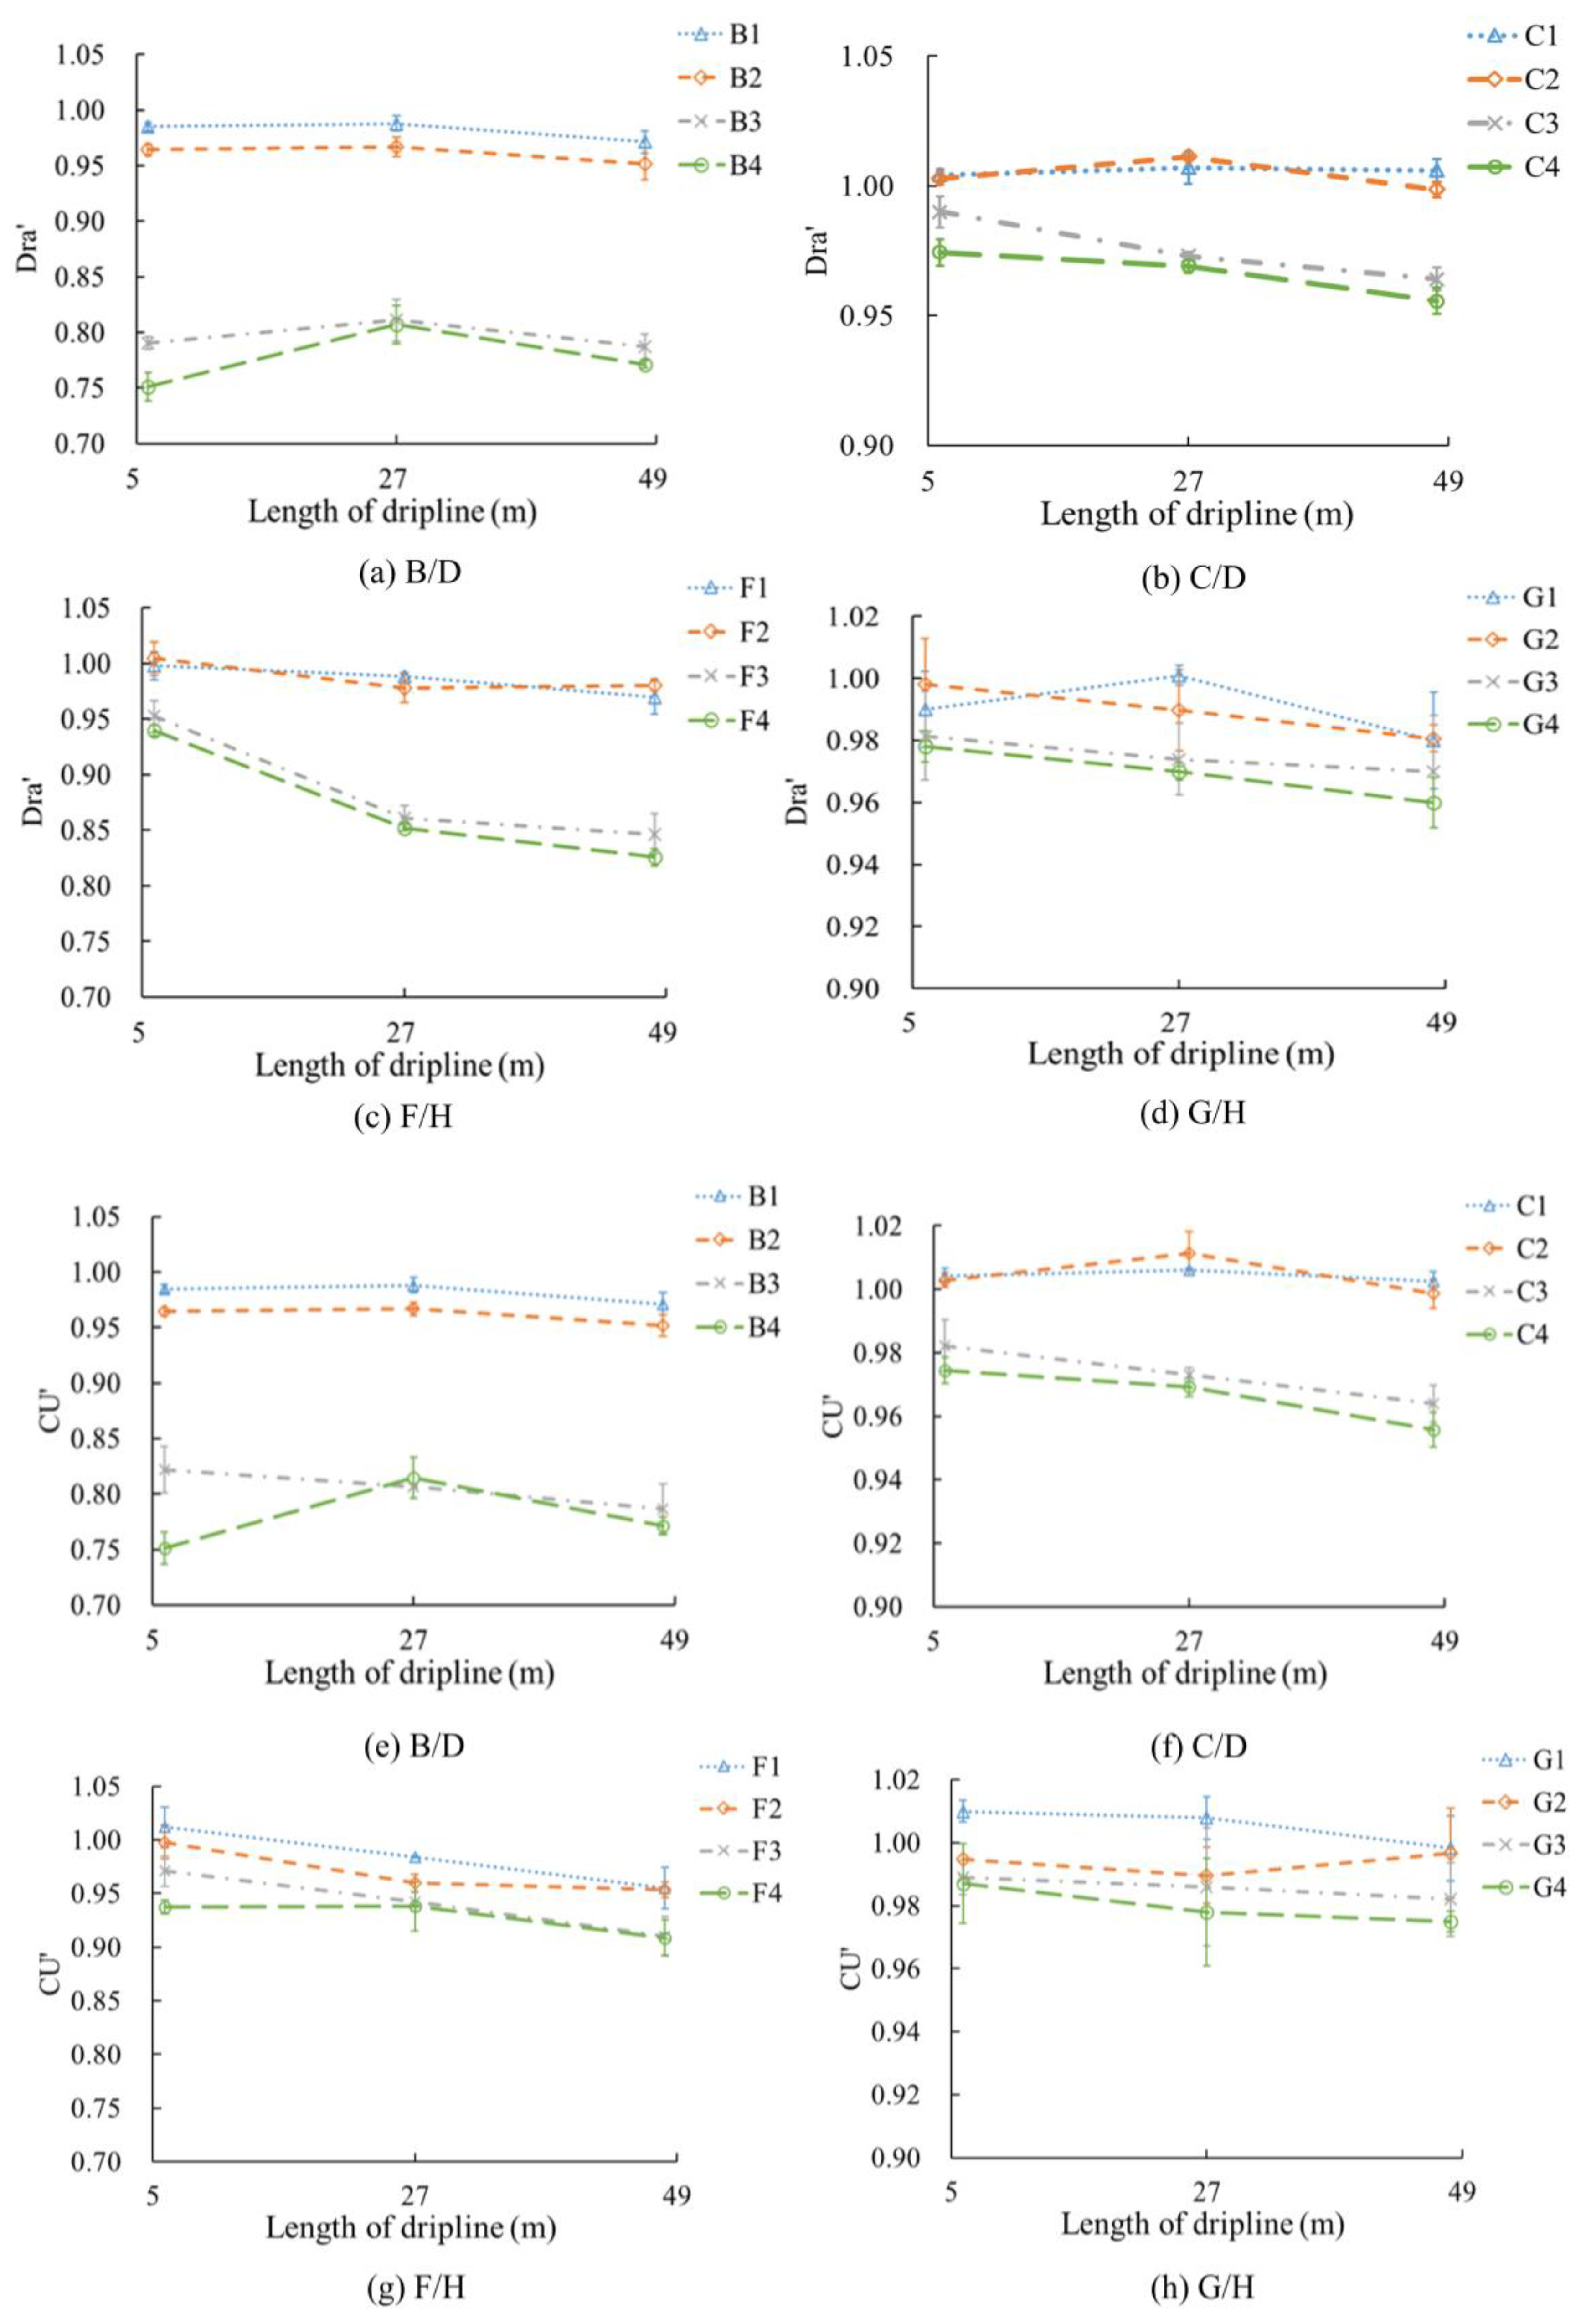
Which type of emitters have a better anti-clogging performance at a low-pressure operation needs further analysis. As the actual operating pressures of the two types of emitters were different, it was impossible to directly compare the data obtained from the two emitters. Therefore, the Dra and CU at a low-pressure operation and the corresponding values at the rated pressure (the ratio of Dra and CU in plot B to plot D, do the same operation to C. The ratio of the Dra and CU in plot F to plot H, do the same as the G plot) were compared, namely Dra’ and CU’, to analyze the sensitivity of the two types of emitters to pressure reduction, and then explain which emitter tape was more suitable for a low-pressure operation. The analysis result is shown in Figure 6. At the pressure of 90 and 50 kPa (C/D, G/H), the Dra’ at the head of the driplines was not obviously reduced when using the DF125 and SF125. However, the Dra’ at the tail section was affected by the pressure drop more obviously. FE was more affected by the irrigation pressure drop than LE. When the irrigation pressures were 80 and 40 kPa (B/D, F/H), the Dra’ of the two types of emitters was reduced. However, LE had a larger Dra’ and showed a better anti-clogging performance. In addition, it was found from Figure 6 that the CU’ value of LE was larger than FE when the irrigation system was operating at a low pressure. Therefore, LE had a better anti-clogging performance than FE. This could be due to several reasons. First, LE had a higher Dra’ and CU’ compared with FE. Secondly, the DP of LE (F, G and H plot) showed a small decrease, as shown in Figure 3, and the DP could be restored to the initial value with the increases of the irrigation frequency, meaning that the clogging degree of LE was small and the clogged emitters could return to their unclogged condition. It was also noticed that the labyrinth structure of LE increased the flow velocity of the flow and increased the turbulence intensity, which was beneficial to reduce the accumulation of clogging substances in the flow channel. Ma et al. [19] thought that the emitter flow channel structure had a more prominent impact on the anti-clogging performance, especially at the fluctuating pressure.
In summary, the two types of emitters were clogged to a certain extent at the pressure of 80 and 40 kPa, respectively. Among them, emitters did not appear to be clogged when the DF125 and the SF125 were used. Therefore, the most suitable operating pressures for the two types of emitters were 90 and 50 kPa, respectively. Meanwhile, the clogging degree of FE showed a trend of continuous increase with increasing fertigation frequency, while LE did not change significantly after a certain degree of clogging. Therefore, the best operation mode of the phosphate drip fertigation system was to use the DF125 and the LE when operating at the pressure of 50 kPa.
4.3. Clogging Substance Analysis
The clogging substances of drip fertigation systems included phosphate fertilizer, silicate, carbonate, and phosphate precipitations. Insoluble substances and precipitates were formed by the interaction of ions in water. Li Y. et al. [29] believed that the most direct influence factor of the clogging process was the deposition of solid particles, CaCO3 and MgCO3. Our results obtained are in agreement with the reference [29]. In addition, the clogging of emitters can become more severe due to the reaction of Ca2+ and SO42− [30]. The particles in clogging substances, which were bonded together through the hydrogen bond, were affected by the chemical precipitates [31]. In addition, Chen et al. [32] suggested that fine particles had a high specific surface energy, which accelerated the movement and collisions between the particles, making it easier for the particles to agglomerate together and eventually caused emitter clogging.
The phosphorus in drip fertigation systems was mainly phosphate fertilizer particles and some phosphate precipitations. On the one hand, carbonate precipitations combined with phosphate fertilizers induced an increasing risk of emitter clogging, which has been the main restriction for the application of drip fertigation systems. On the other hand, the use of phosphate fertilizer would accelerate the flocculation and ion replacement of impurities in water, which then led to an increase in flocs and sediment particles and affected the operating system [5,6]. Liu et al. [9] found that phosphate fertilizer reacted with Ca2+ and Mg2+ to form water-insoluble precipitates, and the clogging substances were CaHPO4 and MgHPO4. In our experiments, insoluble phosphate precipitates were produced in filters and emitters, which is consistent with the results of previous studies. Fertilizers promoted the formation of clogging substances and enhanced the aggregation of solid particles [10].
The clogging mechanism of drip irrigation systems caused by different types of water quality is different [33,34]. The mechanism of clogging induced by phosphate fertilizer solution included physical and chemical clogging and the interaction between them. Li et al. [5] studied the accelerated effect of fertilization on emitter clogging when using muddy water, and thought that fertilizer only aggravated the flocculation of sediment; Ca2+ and Mg2+ were not the leading cause of clogging. This is different from the results of our experiments. The reason could be that the sand in muddy water was high, and the clogging was mainly caused by sediment. Chemical clogging only worsened the clogging degree. Therefore, the prerequisite for the application of drip fertigation systems is to use clean water, and water sources with high sand content, sewage and poor water quality are not suitable for water and fertilizer integrated systems.
On the whole, the anti-clogging research of the whole drip fertigation system has been studied, and the optimal operation mode of the system can guide the operation of drip fertigation systems in the field. However, there are still some limitations that need to be further explored: (1) Our experiment investigated the anti-clogging performance of the whole drip fertigation system using phosphate fertilizer, which focused on the overall clogging degree of the system. So, only two types of emitters were used in the experiment; however, it is necessary to further analyze more types of emitters in field experiments. (2) The impact of different types of phosphate fertilizer on emitter clogging and environmental pollution needs further exploration.
5. Conclusions
The best operation mode of the drip fertigation system was proposed by systematic research on the anti-clogging performance of the whole drip fertigation system. Different pressures, filters, and different types of emitters were combined to analyze the clogging of the system. Meanwhile, the clogging substances were analyzed by scanning electron microscopy and the energy spectrum.
At the irrigation pressures of 90 and 50 kPa, the Dra values of emitters (greater than 95.22%) were not significantly reduced when using DF125 and SF125. However, the Dra decreased significantly at the irrigation pressure of 80 and 40 kPa, which were 73.48–78.71% and 81.3–83.6% for FE and LE, respectively. The CU values of emitters were all greater than 90%, except for the irrigation pressures of 80 and 40 kPa, and the values at the head of the two types of driplines were greater than the middle and tail section. Irrigation pressures mainly affected the Dra and CU values at the middle and tail section, while filter types mainly affected the clogging substances in emitters, and the interaction between irrigation pressures and filters led to the different operating status of drip fertigation systems. Through the analysis of variance, it is found that irrigation pressures and the interaction between irrigation pressures and filters imposed a significant effect on the CU at a significance level of p < 0.05 and p < 0.01, respectively. The Dra’ and CU’ of LE were greater than those of FE, which indicated that the LE had a better anti-clogging performance compared with the FE. Phosphate fertilizers, silicates, carbonate, and phosphate deposits produced by chemical reactions were founded by energy spectrum analysis. The best operation mode of the phosphate drip fertigation system was to use the DF125 and the LE when operating at the pressure of 50 kPa, which could simultaneously reduce emitter clogging and environmental pollution caused by the excessive use of phosphate fertilizer while increasing the use efficiency of water. The coordinated use of the irrigation pressure, filter and emitter can reduce the probability of emitter clogging in drip fertigation systems.
Author Contributions
Conceptualization, C.L. and W.W. (Wene Wang); methodology, C.L. and R.W.; validation, R.W. and W.W. (Wene Wang); formal analysis, C.L. and R.W.; data curation, R.W. and W.W. (Wanying Wu); writing—original draft preparation, C.L.; writing—review and editing, W.W. and X.H.; supervision, X.H. and F.L.; funding acquisition, W.W. (Wene Wang); All authors have read and agreed to the published version of the manuscript.
Funding
This research was funded by the National Natural Science Foundation of China (52079113), the Special Fund for Agro-scientific Research in the Public Interest of China (201503125), and the National Key Research and Development Program of China (2016YFC0400203).
Institutional Review Board Statement
Not applicable.
Informed Consent Statement
Not applicable.
Data Availability Statement
The data presented in this study are available on request from the corresponding author [email protected].
Conflicts of Interest
The authors declare no conflict of interest.
References
- Vaneeckhaute, C.; Janda, J.; Vanrolleghem, P.A.; Tack, F.; Meers, E. Phosphorus use efficiency of bio-based fertilizers: Bioavailability and fractionation. Pedosphere 2016, 26, 310–325. [Google Scholar] [CrossRef] [Green Version]
- Yu, C.Q.; Huang, X.; Chen, H.; Godfray, H.C.J.; Wright, J.S.; Hall, J.W.; Gong, P.; Ni, S.Q.; Qiao, S.C. Huang Managing nitrogen to restore water quality in China. Nature 2019, 567, 516–520. [Google Scholar] [CrossRef] [PubMed]
- Mikkelsen, R.L. Phosphorus fertilization through drip irrigation. J. Prod. Agric. 1989, 2, 279–286. [Google Scholar] [CrossRef]
- Wang, Z.; Yang, X.Q.; Li, J.S. Effect of phosphorus-coupled nitrogen fertigation on clogging in drip emitters when applying saline water. Irrig. Sci. 2020, 38, 337–351. [Google Scholar] [CrossRef]
- Li, K.Y.; Niu, W.Q.; Zhang, R.C.; Liu, L. Accelerative effect of fertigation on emitter clogging by muddy water irrigation. Trans. CSAE 2015, 31, 81–90. [Google Scholar]
- Zhou, H.X.; Li, Y.K.; Xiao, Y.; Liu, Z.Y. Different operation patterns on mineral components of emitters clogging substances in drip phosphorus fertigation system. Irrig. Sci. 2019, 37, 691–707. [Google Scholar] [CrossRef]
- Tang, P.; Li, H.; Issaka, Z.; Chen, C. Effect of manifold layout and fertilizer solution concentration on fertilization and flushing times and uniformity of drip irrigation systems. Agric. Water Manag. 2018, 200, 71–79. [Google Scholar] [CrossRef]
- Fan, J.L.; Zhang, F.C.; Wu, L.F.; Yan, S.C.; Xiang, Y.Z. Field evaluation of fertigation uniformity in drip irrigation system with pressure differential tank. Trans. CSAE 2016, 32, 96–101. [Google Scholar]
- Liu, L.; Niu, W.; Wu, Z.G.; Guan, Y.; Yuan, L.I. Risk and inducing mechanism of acceleration emitter clogging with fertigation through drip irrigation systems. Trans. CSAM 2017, 48, 228–236. [Google Scholar]
- Liu, L.; Niu, W.Q.; Guan, Y.H.; Wu, Z.G.; Ayantobo, O.O. Effects of urea fertigation on emitter clogging in drip irrigation system with muddy water. J. Irrig. Drain. Eng. 2019, 145, 04019020. [Google Scholar] [CrossRef]
- Ma, C.J.; Xiao, Y.; Puig-Bargués, J.; Shukla, M.K.; Tang, X.L.; Hou, P.; Li, Y.K. Using phosphate fertilizer to reduce emitter clogging of drip fertigation systems with high salinity water. J. Environ. Manag. 2020, 263, 110366. [Google Scholar] [CrossRef] [PubMed]
- Wang, J.; Chu, G. Science Phosphate fertilizer form and application strategy affect phosphorus mobility and transformation in a drip-irrigated calcareous soil. J. Plant Nutr. Soil Sci. 2015, 178, 914–922. [Google Scholar] [CrossRef]
- Capra, A.B. Scicolone Emitter and filter tests for wastewater reuse by drip irrigation. Agric. Water Manag. 2004, 68, 135–149. [Google Scholar] [CrossRef]
- Tripathi, V.K.; Rajput, T.B.S.; Patel, N. Performance of different filter combinations with surface and subsurface drip irrigation systems for utilizing municipal wastewater. Irrig. Sci. 2014, 32, 379–391. [Google Scholar]
- Wu, W.Y.; Huang, Y.; Liu, H.L.; Yin, S.Y.; Niu, Y. Reclaimed water filtration efficiency and drip irrigation emitter performance with different combinations of sand and disc filters. Irrig. Drain. 2015, 64, 362–369. [Google Scholar]
- Fan, X.K.; Wu, P.T.; Niu, W.Q.; Zhang, L.; Wang, F. The Methods of Improving System’s Irrigation Uniformity under Low-pressure Drip Irrigation. J. Irrig. Drain. 2008, 27, 18–20, (In Chinese with English Abstract). [Google Scholar]
- Kumar, M.; Rajput, T.; Patel, N. Patel Effect of system pressure and solute concentration on fertilizer injection rate of a venturi for fertigation. Indian Soc. Agric. Eng. 2012, 49, 9–13. [Google Scholar]
- Zheng, C.; Wu, P.T.; Zhang, L.; Zhu, D.L.; Chen, X.; Chen, J.Y. Flow characteristics in labyrinth channel under dynamic water pressure. Trans. CSAM 2015, 46, 167–172, (In Chinese with English Abstract). [Google Scholar]
- Ma, X.; Gong, S.; Wang, J.; Yu, Y. Anti-clogging Performance of Dental Labyrinth Emitters under Rated Pressure and Low Operating Pressure. Trans. CSAM 2011, 42, 86–90+134. [Google Scholar]
- Zheng, C.; Wu, P.; Zhang, L.; Zhu, D.; Zhao, X.; An, B.D. An Particles movement characteristics in labyrinth channel under different dynamic water pressure modes. Trans. CSAM 2017, 48, 294–301. [Google Scholar]
- Han, S.Q.; Li, Y.K.; Zhou, B.; Liu, Z.Y.; Feng, J.; Xiao, Y. An in-situ accelerated experimental testing method for drip irrigation emitter clogging with inferior water. Agric. Water Manag. 2019, 212, 136–154. [Google Scholar] [CrossRef]
- Zhang, L.; Wu, P.T.; Zhu, D.L.; Zheng, C. Zheng Effect of pulsating pressure on labyrinth emitter clogging. Irrig. Sci. 2017, 35, 267–274. [Google Scholar] [CrossRef]
- Duran-Ros, M.; Puig-Bargues, J.; Arbat, G.; Barragán, J.; de Cartagena, F.R. Performance and backwashing efficiency of disc and screen filters in microirrigation systems. Biosyst. Eng. 2009, 103, 35–42. [Google Scholar] [CrossRef]
- Solé-Torres, C.; Puig-Bargués, J.; Duran-Ros, M.; Arbat, G.; Pujol, J.; de Cartagena, F.R. Effect of different sand filter underdrain designs on emitter clogging using reclaimed effluents. Agric. Water Manag. 2019, 223, 105683. [Google Scholar] [CrossRef]
- Christiansen, J.E. Hydraulics of sprinkling systems for irrigation. Am. Soc. Civ. Eng. 1942, 107, 221–239. [Google Scholar] [CrossRef]
- Li, G.B.; Li, Y.K.; Xu, T.W.; Liu, Y.Z.; Jin, H.; Yang, P.L.; Ren, S.M.; Tian, Z.F. Effects of average velocity on the growth and surface topography of biofilms attached to the reclaimed wastewater drip irrigation system laterals. Irrig. Sci. 2012, 30, 103–113. [Google Scholar] [CrossRef]
- Duran-Ros, M.; Puig-Bargués, J.; Arbat, G.; Barragán, J.; De Cartagena, F.R. Effect of filter, emitter and location on clogging when using effluents. Agric. Water Manag. 2009, 96, 67–79. [Google Scholar] [CrossRef]
- Yu, L.M.; Li, N.; Yang, Q.L.; Liu, X.G. Liu Influence of Flushing Pressure before Irrigation on the Anti-Clogging Performance of Labyrinth Channel Emitters. Irrig. Drain. 2018, 67, 191–198. [Google Scholar] [CrossRef]
- Li, Q.; Song, P.; Zhou, B.; Xiao, Y.; Muhammad, T.; Liu, Z.; Zhou, H.; Li, Y. Mechanism of intermittent fluctuated water pressure on emitter clogging substances formation in drip irrigation system utilizing high sediment water. Agric. Water Manag. 2019, 215, 16–24. [Google Scholar] [CrossRef]
- Bozkurt, S.; Ozekici, B. The effects of fertigation management in the different type of in-line emitters on trickle irrigation system performance. J. Appl. Sci. 2006, 6, 1165–1171. [Google Scholar] [CrossRef]
- Rittman, B.E. The effect of shear stress on biofilm loss rate. Biotechnol. Bioeng. 1982, 24, 501–506. [Google Scholar] [CrossRef] [PubMed]
- Chen, M.H.; Zhao, H.M.; Fang, H.W.; Zhang, Y.F. Zhang Cross-sectional information on pore structure and element distribution of sediment particles by SEM and EDS. Scanning 2017, 2017, 9876935. [Google Scholar] [CrossRef] [PubMed] [Green Version]
- Hao, F.Z.; Li, J.S.; Wang, Z.; Li, Y.F. Li Effect of ions on clogging and biofilm formation in drip emitters applying secondary sewage effluent. Irrig. Drain. 2017, 66, 687–698. [Google Scholar] [CrossRef]
- Li, Y.K.; Feng, J.; Xue, S.; Muhammad, T.; Chen, X.Z.; Wu, N.Y.; Li, W.S.; Zhou, B. Formation mechanism for emitter composite-clogging in drip irrigation system. Irrig. Sci. 2019, 37, 169–181. [Google Scholar] [CrossRef]
Figure 1.
Single plot experiment layout. 1 Water inlet; 2 Valve; 3 Pressure gauge; 4 Water meter; 5 Proportional fertilizer pump; 6 Fertilizer solution bucket; 7 Water intake; 8 Filter; 9 Ultrasonic flowmeter; 10 Driplines.
Figure 1.
Single plot experiment layout. 1 Water inlet; 2 Valve; 3 Pressure gauge; 4 Water meter; 5 Proportional fertilizer pump; 6 Fertilizer solution bucket; 7 Water intake; 8 Filter; 9 Ultrasonic flowmeter; 10 Driplines.

Figure 2.
Christiansen uniformity coefficient at different lengths of driplines. Note: CU is the Christiansen uniformity coefficient; the values are the means ± standard error. A, B, C, D, E, F, G, H represent different experimental plots. The 1, 2, 3, and 4 after the same letter represent the working conditions of the same type of driplines matched with different filters at the same pressure, respectively. The 1, 2, 3, and 4 represent the working conditions with the disc filter with aperture of 125 μm, the screen filter with aperture of 125 μm, the screen filter with aperture of 200 μm and no filter, respectively.

Figure 3.
Changes of differential pressure with irrigation frequency. Note: DP is the differential pressure; irrigation frequency refers to the number of irrigations that were carried out; the values were the mean of the 95% confidence interval; and the different letters in the same group indicate significant differences (p < 0.05). B, C, D, F, G, H represent different experimental plots. The 1, 2, 3, and 4 after the same letter represent the working conditions of the same type of driplines matched with different filters at the same pressure, respectively. The 1, 2, 3, and 4 represent the working conditions with the disc filter with aperture of 125 μm, the screen filter with aperture of 125 μm, the screen filter with aperture of 200 μm and no filter, respectively.

Figure 4.
Scanning electron microscope images of clogging substances.

Figure 5.
Energy spectrum analysis of chemical elements of clogging substances. Note: (a,b)—the clogging substances in filter screen; (c,d)—the clogging substances in filter core; (e,f)—the clogging substances in labyrinth emitters; (g,h)—the clogging substances in flat emitters. Energy represents the X-ray energy, the X-ray intensity, which is related to the number of elements, and the higher the atomic number, the higher the X-ray intensity, K = 1000, and Cnt is the quantity. Wt is the mass fraction and At is the atomic percentage.

Figure 6.
Ratio of Dra and CU between low-pressure conditions and rated pressure. Note: Dra is the average relative discharge; Dra’ is the relative value of Dra (the ratio of Dra in plot B and C to plot D; the ratio of Dra in plot F and G to plot H); CU is the Christiansen uniformity coefficient; CU’ is the relative value of CU (the ratio of CU in plot B and C to plot D; the ratio of CU in plot F and G to plot H); the values are the means ± standard error. B, C, D, F, G and H represent different experimental plots. The 1, 2, 3, and 4 after the same letter represent the working conditions of the same type of driplines matched with different filters at the same pressure, respectively. The 1, 2, 3, and 4 represent the working conditions with the disc filter with aperture of 125 μm, the screen filter with aperture of 125 μm, the screen filter with aperture of 200 μm and no filter, respectively.


Table 1.
Chemical parameters of Shiyang River water.
| Water Source | pH | Total Hardness (mg/L) | Ca2+ (mg/L) | K+ (mg/L) | Mg2+ (mg/L) | HCO3− (mg/L) | SO42− (mg/L) | Cl− (mg/L) |
|---|---|---|---|---|---|---|---|---|
| Shiyang River Water | 7.9 | 275 | 78 | 38 | 28 | 216 | 124 | 40 |
Table 2.
Structural parameters of emitters.
| Emitters | Structure of the Emitter Flow Path | Rated Pressure (kPa) | Rated Discharge (Lh−1) | Discharge Coefficient | Flow Index | Emitter Spacing (cm) | Width w (mm) | Height h (mm) | Length l (mm) |
|---|---|---|---|---|---|---|---|---|---|
| Labyrinth emitters |  | 60 | 1.98 | 9.86 | 0.49 | 15 | 1 | 1.5 | 6 |
| Flat emitters |  | 100 | 2.03 | 6.12 | 0.48 | 30 | 1 | 2 | 2 |
Table 3.
Treatments and working conditions included in the experiments.
| Plots | Emitter Type | Dripline Number | Filter | Irrigation Pressure (kPa) | Plots | Emitter Type | Dripline Number | Filter | Irrigation Pressure (kPa) |
|---|---|---|---|---|---|---|---|---|---|
| A Control (no fertilizer) | FE | A1 | DF125 | 80 | E Control (no fertilizer) | LE | E1 | DF 125 | 40 |
| A2 | SF125 | E2 | SF 125 | ||||||
| A3 | SF200 | E3 | SF 200 | ||||||
| A4 | / | E4 | / | ||||||
| B | B1 | DF125 | 80 | F | F1 | DF 125 | 40 | ||
| B2 | SF125 | F2 | SF 125 | ||||||
| B3 | SF200 | F3 | SF 200 | ||||||
| B4 | / | F4 | / | ||||||
| C | C1 | DF125 | 90 | G | G1 | DF125 | 50 | ||
| C2 | SF125 | G2 | SF125 | ||||||
| C3 | SF200 | G3 | SF200 | ||||||
| C4 | / | G4 | / | ||||||
| D | D1 | DF125 | 100 | H | H1 | DF125 | 60 | ||
| D2 | SF125 | H2 | SF125 | ||||||
| D3 | SF200 | H3 | SF200 | ||||||
| D4 | / | H4 | / |
Note: FE is the flat emitter; LE is the labyrinth emitter; DF125 is the disc filter with aperture of 125 μm; SF125 is the screen filter with aperture of 125 μm; SF200 is the screen filter with aperture of 200 μm.
Table 4.
Average relative discharges of dripline at different positions (%).
| Dripline Number | Head | Middle | Tail | Dripline Number | Head | Middle | Tail |
|---|---|---|---|---|---|---|---|
| (0–6 m) | (21–27 m) | (42–48 m) | (0–6 m) | (21–27 m) | (42–48 m) | ||
| B1 | 96.85 | 96.85 | 94.03 | F1 | 98.27 | 97.50 | 95.95 |
| B2 | 94.13 | 93.51 | 91.82 | F2 | 97.99 | 96.07 | 95.41 |
| B3 | 76.23 | 78.71 | 75.44 | F3 | 93.52 | 83.63 | 81.30 |
| B4 | 73.48 | 78.52 | 73.74 | F4 | 91.04 | 84.36 | 80.92 |
| C1 | 98.74 | 98.62 | 97.72 | G1 | 97.38 | 99.85 | 96.37 |
| C2 | 97.90 | 98.79 | 96.34 | G2 | 98.24 | 96.63 | 95.22 |
| C3 | 96.25 | 94.98 | 92.42 | G3 | 96.37 | 98.97 | 95.71 |
| C4 | 95.34 | 93.41 | 91.38 | G4 | 98.16 | 97.01 | 94.90 |
| D1 | 98.33 | 98.02 | 96.79 | H1 | 98.47 | 97.27 | 98.90 |
| D2 | 97.61 | 96.73 | 96.47 | H2 | 97.57 | 98.62 | 97.09 |
| D3 | 96.42 | 97.61 | 95.87 | H3 | 98.18 | 97.13 | 96.04 |
| D4 | 97.85 | 96.38 | 95.61 | H4 | 96.91 | 98.98 | 98.01 |
Note: B, C, D, F, G, H represent different experimental plots. The 1, 2, 3, and 4 after the same letter represent the working conditions of the same type of driplines matched with different filters at the same pressure, respectively. The 1, 2, 3, and 4 represent the working conditions with the disc filter with aperture of 125 μm, the screen filter with aperture of 125 μm, the screen filter with aperture of 200 μm and no filter, respectively.
Table 5.
Variance analysis of CU.
| Emitter Type | Source | Significance Level | ||
|---|---|---|---|---|
| CU1 | CU2 | CU3 | ||
| FE | Irrigation pressure | 0.041 * | 0.037 * | 0.035 * |
| Filter type | 0.362 n.s. | 0.396 n.s. | 0.481 n.s. | |
| Irrigation pressure × Filter type | 0.008 ** | 0.008 ** | 0.006 ** | |
| LE | Irrigation pressure | 0.038 * | 0.034 * | 0.032 * |
| Filter type | 0.213 n.s. | 0.289 n.s. | 0.350 n.s. | |
| Irrigation pressure × Filter type | 0.007 ** | 0.006 ** | 0.004 ** | |
Note: n.s. indicates not significant, * indicates a significant (p < 0.05), ** indicates extremely significant (p < 0.01); CU1 is the irrigation uniformity coefficient of emitters in the head section of the dripline; CU2 is the irrigation uniformity coefficient of emitters in the middle section of the dripline; CU3 is the irrigation uniformity coefficient of emitters in the tail section of the dripline.
Publisher’s Note: MDPI stays neutral with regard to jurisdictional claims in published maps and institutional affiliations. |
© 2022 by the authors. Licensee MDPI, Basel, Switzerland. This article is an open access article distributed under the terms and conditions of the Creative Commons Attribution (CC BY) license (https://creativecommons.org/licenses/by/4.0/).
Share and Cite
MDPI and ACS Style
Liu, C.; Wang, R.; Wang, W.; Hu, X.; Wu, W.; Liu, F. Different Irrigation Pressure and Filter on Emitter Clogging in Drip Phosphate Fertigation Systems. Water 2022, 14, 853. https://doi.org/10.3390/w14060853
AMA Style
Liu C, Wang R, Wang W, Hu X, Wu W, Liu F. Different Irrigation Pressure and Filter on Emitter Clogging in Drip Phosphate Fertigation Systems. Water. 2022; 14(6):853. https://doi.org/10.3390/w14060853
Chicago/Turabian StyleLiu, Chunye, Rui Wang, Wene Wang, Xiaotao Hu, Wanying Wu, and Fulai Liu. 2022. "Different Irrigation Pressure and Filter on Emitter Clogging in Drip Phosphate Fertigation Systems" Water 14, no. 6: 853. https://doi.org/10.3390/w14060853
Note that from the first issue of 2016, this journal uses article numbers instead of page numbers. See further details here.