Article

Retrofitting of Existing Bar Racks with Electrodes for Fish Protection—An Experimental Study Assessing the Effectiveness for a Pilot Site

1
Unit of Hydraulic Engineering, Department of Infrastructure, University of Innsbruck, 6020 Innsbruck, Austria
2
Department of Water, Atmosphere and Environment, Institute of Hydrobiology and Aquatic Ecosystem Management, University of Natural Resources and Life Sciences, 1180 Vienna, Austria
3
HyFish GmbH, 6020 Innsbruck, Austria
*
Author to whom correspondence should be addressed.
Water 2022, 14(6), 850; https://doi.org/10.3390/w14060850
Submission received: 22 December 2021 / Revised: 25 February 2022 / Accepted: 6 March 2022 / Published: 9 March 2022
(This article belongs to the Special Issue Fish Passage at Hydropower Dams)

Abstract

:
Downstream-migrating fish in rivers tend to follow the main current, and are in danger of swimming through the turbines at run-of-river hydropower plants, possibly causing high mortality rates. To avoid these losses, fish must be prevented from entering the turbines. Most existing vertical bar rack systems (used for turbine protection) however usually do not ensure proper fish protection due to large bar spacings. FishProtector technology enables the retrofitting of existing bar racks (i.e., the mechanical barrier) with additional electrodes to create a hybrid barrier. The induced electric field in the water aims to create a behavioral barrier to prevent fish passage through the bar rack. In this study, ethohydraulic experiments to investigate the effect of such a behavioral barrier on fish were performed. In detail, the fish-protection rate at a bar rack with a bar spacing of 30 mm was tested in five different scenarios: (i) a bar rack without electrodes (reference), and four electrified setups with electrode spacings of (ii) 80 mm, (iii) 120 mm, (iv) 160 mm, and (v) 200 mm. A flow velocity of 0.23 m/s was chosen to replicate the situation at a planned pilot site. The study was conducted in an outdoor laboratory flume using small fish of several local riverine species, mostly cyprinids and minnows. The results show that the mean fish-protection rate in the experiments could be increased from 62% in the reference setup up to 96% in the electrified setups.

1. Introduction

Longitudinal connectivity plays an essential role in riverine ecosystems, and migration is an intrinsic need for the majority of aquatic organisms such as fish [1]. Fish migrate to satisfy certain needs which are not met in the current habitat; these may include the urge to reach spawning, feeding or resting habitats [2]. It is well-known that anthropogenic obstructions such as hydropower plants block instream migration routes, and the effects of habitat fragmentation are especially deleterious for potamodromous and diadromous fish species [3]. In recent decades, research has focused on studying the upstream migration of fish, in particular on diadromous species [4,5]. Nowadays well-functioning technical and nature-like solutions to ensure upstream passage exist [6]. Downstream migration, in contrast, has not been investigated to the same extent as upstream movements [4,5]. Downstream-migrating fish tend to follow the main flow [7] and therefore may be attracted towards the turbines of hydropower plants [8]. If no effective measures are taken to impede turbine entrainment, injuries can occur, eventually leading to high mortality rates due to turbine passage [9,10]. These mortality rates largely depend on biotic conditions (such as fish species, size or fitness) and abiotic/technical factors (such as turbine type and size, net head or rotational speed) [11].
The basic features in fish-protection measures for downstream migration include (i) a system preventing entrainment, (ii) concentration of the fish in a certain area preferably close to the bypass entrance, and (iii) attracting or alternatively forcing them into a bypass structure [12]. Regarding the first, the systems preventing entrainment can be divided into physical barriers, mechanical–behavioral and sensory–behavioral barriers [13]. Rack-type guidance structures with narrow bar spacing act as physical barriers, selectively blocking fish with greater dimensions than the clear bar spacing (sb) physically. For a physical barrier to be effective for fish protection, especially that of small-bodied or juvenile fish, sb has to be greatly reduced. The German association DWA, e.g., suggests a maximum bar spacing of sb = 20 mm, which provides efficient protection for most fish [14]. The bars can be oriented vertically or horizontally and at a certain angle to the flow [4]. Rectangular bars are the most common type but are replaced by curved or streamline shaped bars in some cases [14,15,16]. The smaller the sb, the higher not only the investments but also the hydraulic and thus economic losses—in addition to an aggravated maintenance of the facility (e.g., cleaning of the rack) [16,17]. In any case, these bar racks are only applicable at small-to-medium-scale hydropower plants [18]. One of the largest hydropower plants currently equipped with such a fine rack is located in Rothenburg (River Saale, Germany), with an average discharge of 68 m³/s [19].
The presence of a rigid structure impacts the hydraulics around the structure by creating eddies, turbulent flows and changed bed morphology—all of which can either attract or repel fish [20]. Mechanical barriers utilize hydrodynamic cues in front of the barrier, such as velocity and pressure gradients, to induce avoidance behavior in fish [15]. This avoidance may allow for an increased sb compared to purely physical barriers in order to reach the same fish-protection rate.
Behavioral barriers use avoidance and escape responses to keep fish from dangerous areas such as turbine intakes. These sensory barriers can include visual, hydraulic, acoustic or electrical signals. To achieve an escape into the right direction, the flow velocity must not exceed the swimming capabilities of the target fish species [14]. As a general rule, these systems are only applicable where the average flow velocities (vA) do not exceed vA = 0.5 m/s [4] so the fish has enough time to react to the stimulus [21] and is not drifted through the barrier [3]. Sometimes, even lower values for a proper function of a behavioral barrier in downstream direction are recommended in the literature (0.3 m/s) [14].
Physical barriers used in combination with behavior-influencing stimuli apart from the hydrodynamic cues of mechanical barriers are called hybrid barriers [3,22]. In this context, it is crucial that the fish have a strong sensory perception well above a threshold value of the barrier’s stimulus. In case of an electric field used for deterrence, the efficiency depends on the used current and pulse shape, conductivity of the water and of the fish [22], attenuation of the electric field [23], fish species or size and physical condition of the individual [23,24,25]. Since most fish cannot perceive electric fields spatially, the expansion of the field must be great enough to ensure a gradual intensity increase as the fish swim into the field, thereby allowing for an escape reaction into the desired direction away from the barrier [23,26,27]. The field intensity can be described by the voltage gradient (V/m) [28]. When fish orient themselves parallel to the field lines, the voltage gradient is maximized and thus a maximum current is transferred to the fish [23]. Therefore, the perceived body voltage (V) results from the body length (cm) multiplied with the voltage gradient (V/cm) and depends on the orientation of the fish to the field lines [22,29]. Hence, larger fish are more suceptible to electric fields than smaller ones [23,24,25]. Classical electric deterrence systems use two (or more) rows of electrodes in the direction of flow, mainly oriented vertically [3,22]. Therefore, if a fish passes the first row of electrodes and approaches the second row of electrodes directly, it is oriented parallel to the field lines and thus experiences maximum body voltage [23]. Immobilization of the fish, especially upstream of the electric field, must be prevented to avoid passive drift towards the undesired route [20]. Factors such as voltage, pulse parameters and electrode distance have to be optimized for the current application and fish species/size to prevent taxis, narcosis or tetany, as described in the literature [30,31,32]. A pulsed direct current (pDC) allows for more controlled escape reactions of fish when compared to direct current, in addition to showing a less harmful effect on deterred fish [22,33,34]. To reduce fish injuries in case of a passage through the electric barrier, the electrodes can be placed in one plane perpendicular to the direction of flow.
Intake structures at hydropower plants are usually equipped with trash racks to protect the turbine from damage caused by materials transported in the water and for personal protection. Most of these rack structures have a sb of several centimeters to filter drifting material of critical size while limiting hydraulic losses [18]. However, such racks do not ensure proper fish protection due to the great bar spacing and missing behavioral effects.
The FishProtector technology enables the retrofitting of existing bar racks by mounting electrodes on the upstream side of the bars, inducing an electric field in the water and thus creating a hybrid barrier called the “Bar-Screen-FishProtector” [35]. When a fish approaches the system, the mechanical barrier is perceived first and the fish orients itself in a rheotactically positive position (i.e., orientated upstream). Subsequently, it approaches cautiously and enters the electric field tail first. If the stimulus-triggering field strength is exceeded, an escape reaction in an upstream direction follows. This escape reaction is usually carried out by only a few centimeters to decimeters [36]. Another cautious approach follows. Thus, with a horizontal angle of incidence of the system, a guiding effect towards a bypass route could be achieved, preventing fish passage through the powerhouse [37]. Additionally, the system can be used as a barrier, purely preventing entrainment while oriented perpendicular to the flow without a guiding effect towards a bypass (pump-storage/cooling water intakes). The effective expansion of the electric field for fish protection varies with the clear spacing of the electrodes (se) with constant voltage, so that different spatial expansions can be generated as desired for certain site-specific conditions. Previous ethohydraulic experiments demonstrated the effectiveness of this hybrid fish-protection system [37]. Fish injuries due to the electric field, as mentioned in the literature, mostly occur when the fish is oriented parallel to the field lines in between the electrodes [9,23,24,38]. If a fish passes the barrier investigated in this study, it will not be parallel to the field lines in case of a passage, since it passes parallel to the direction of the flow in between the electrodes, and the duration spent in the zone of high field intensities is also minimized. Studies investigating electrical barriers using pDC of voltages between 50 and 113 V to block or guide fish have found no injured or killed fish [34,39,40].
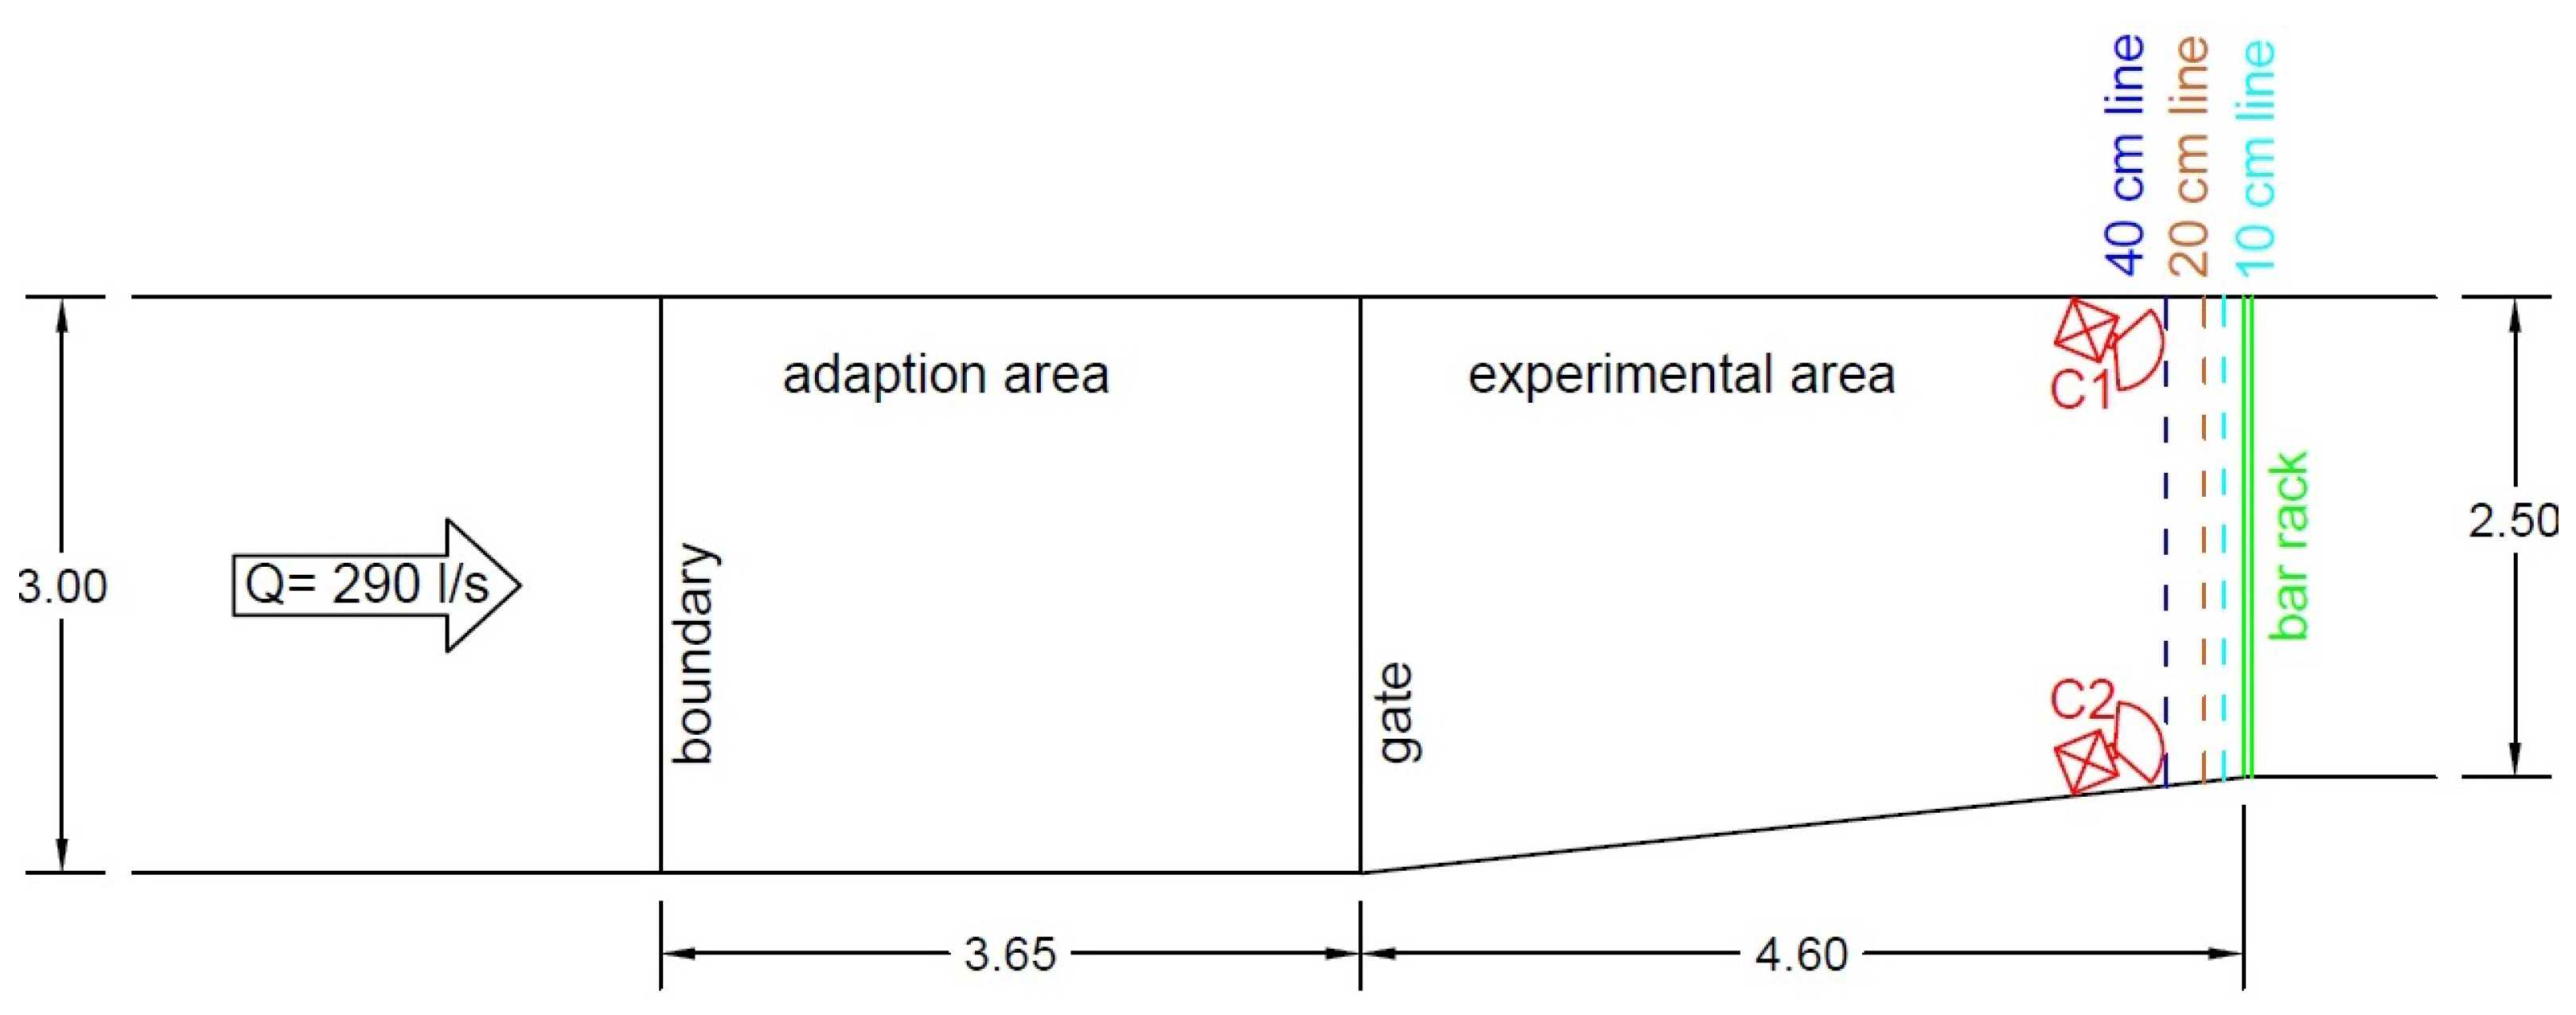
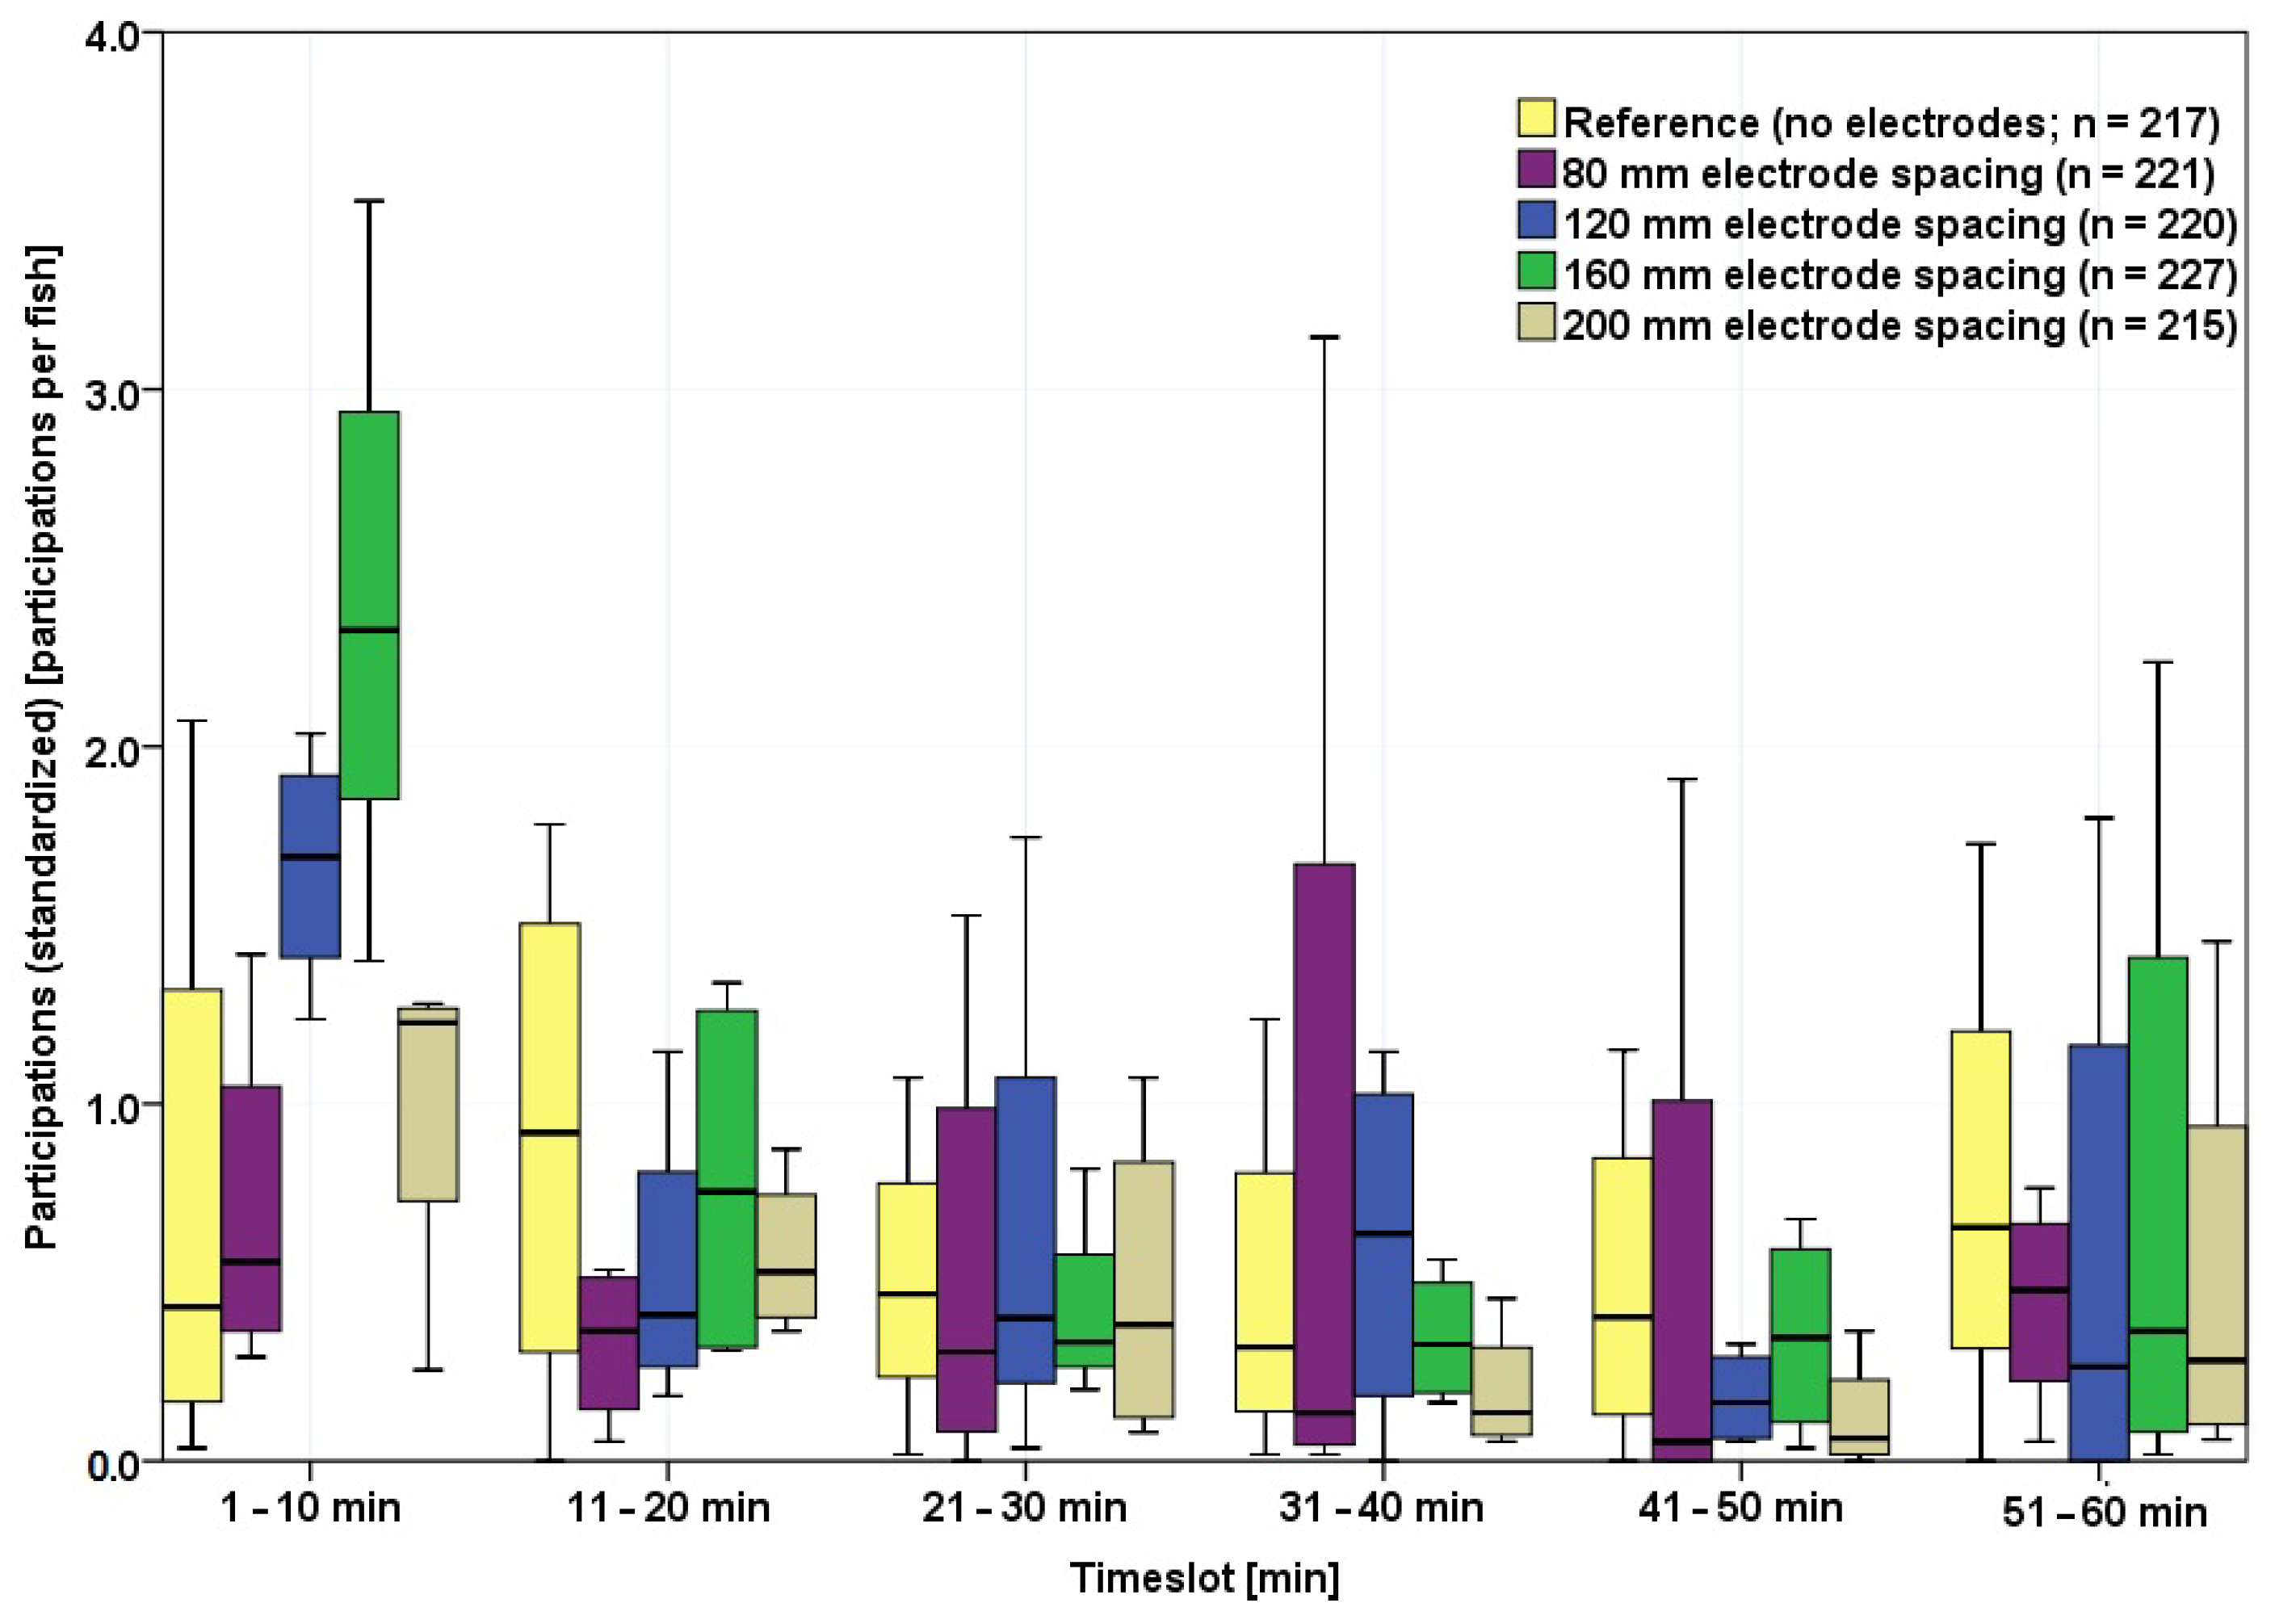
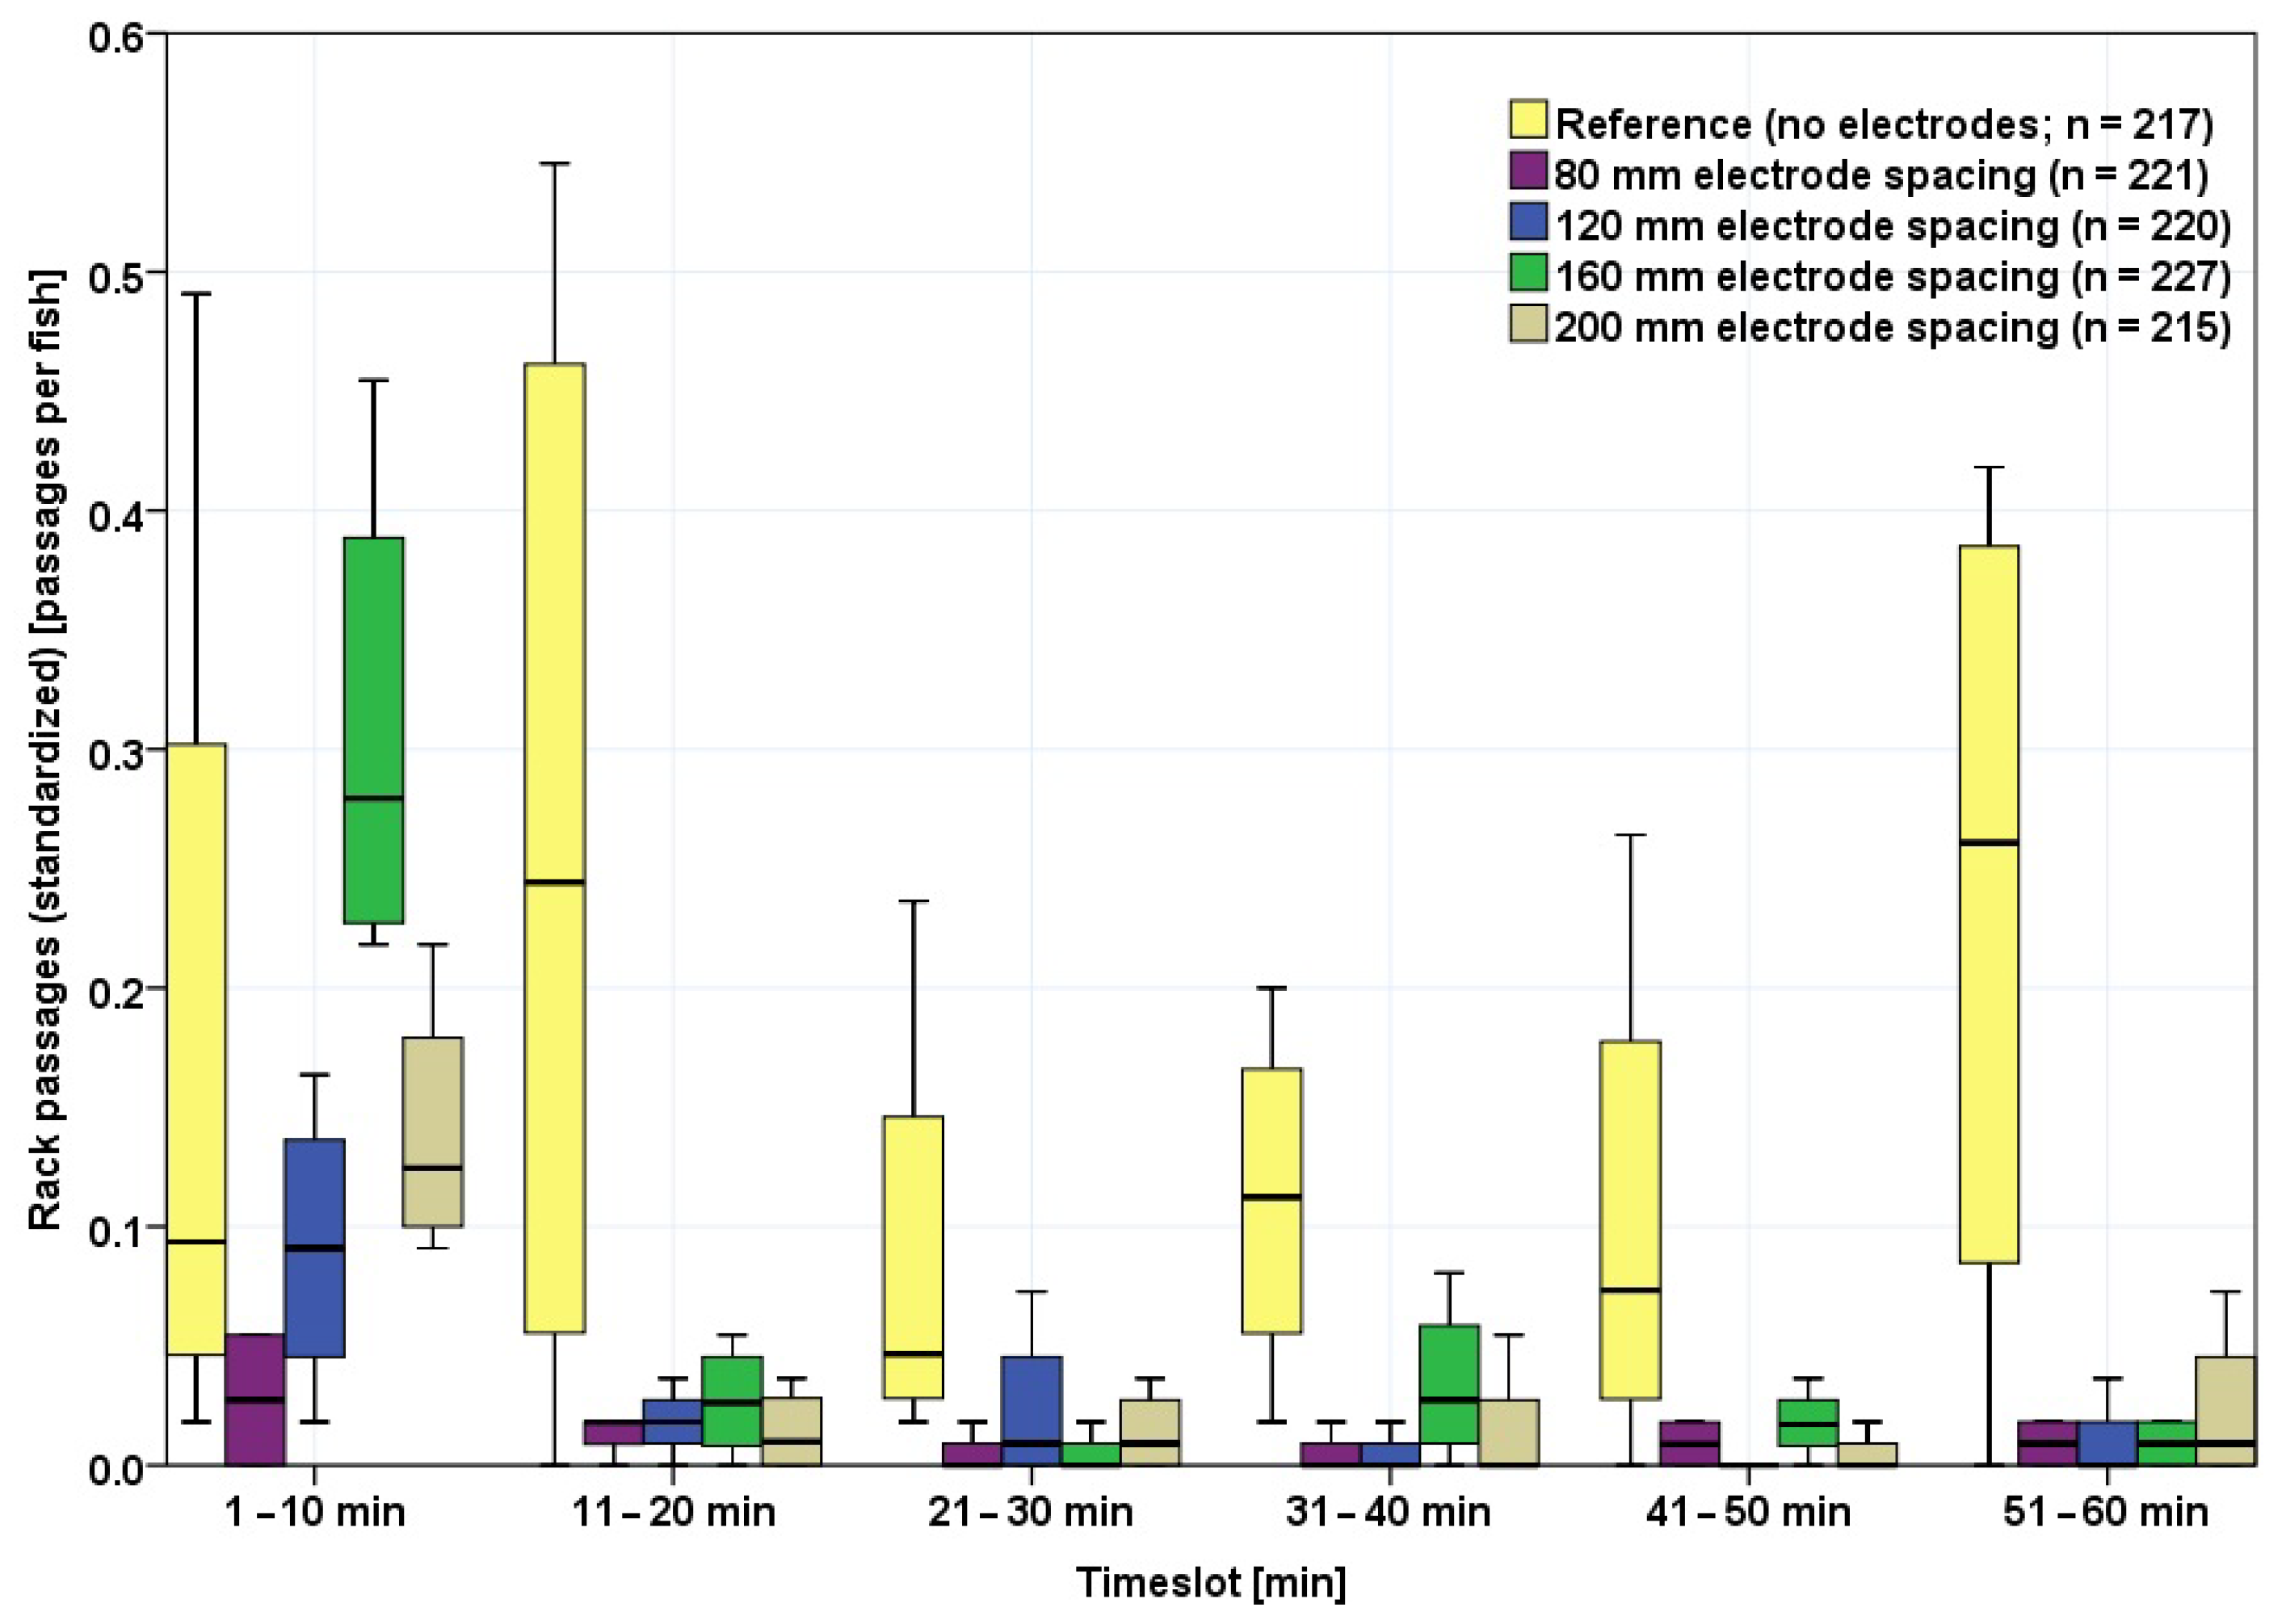
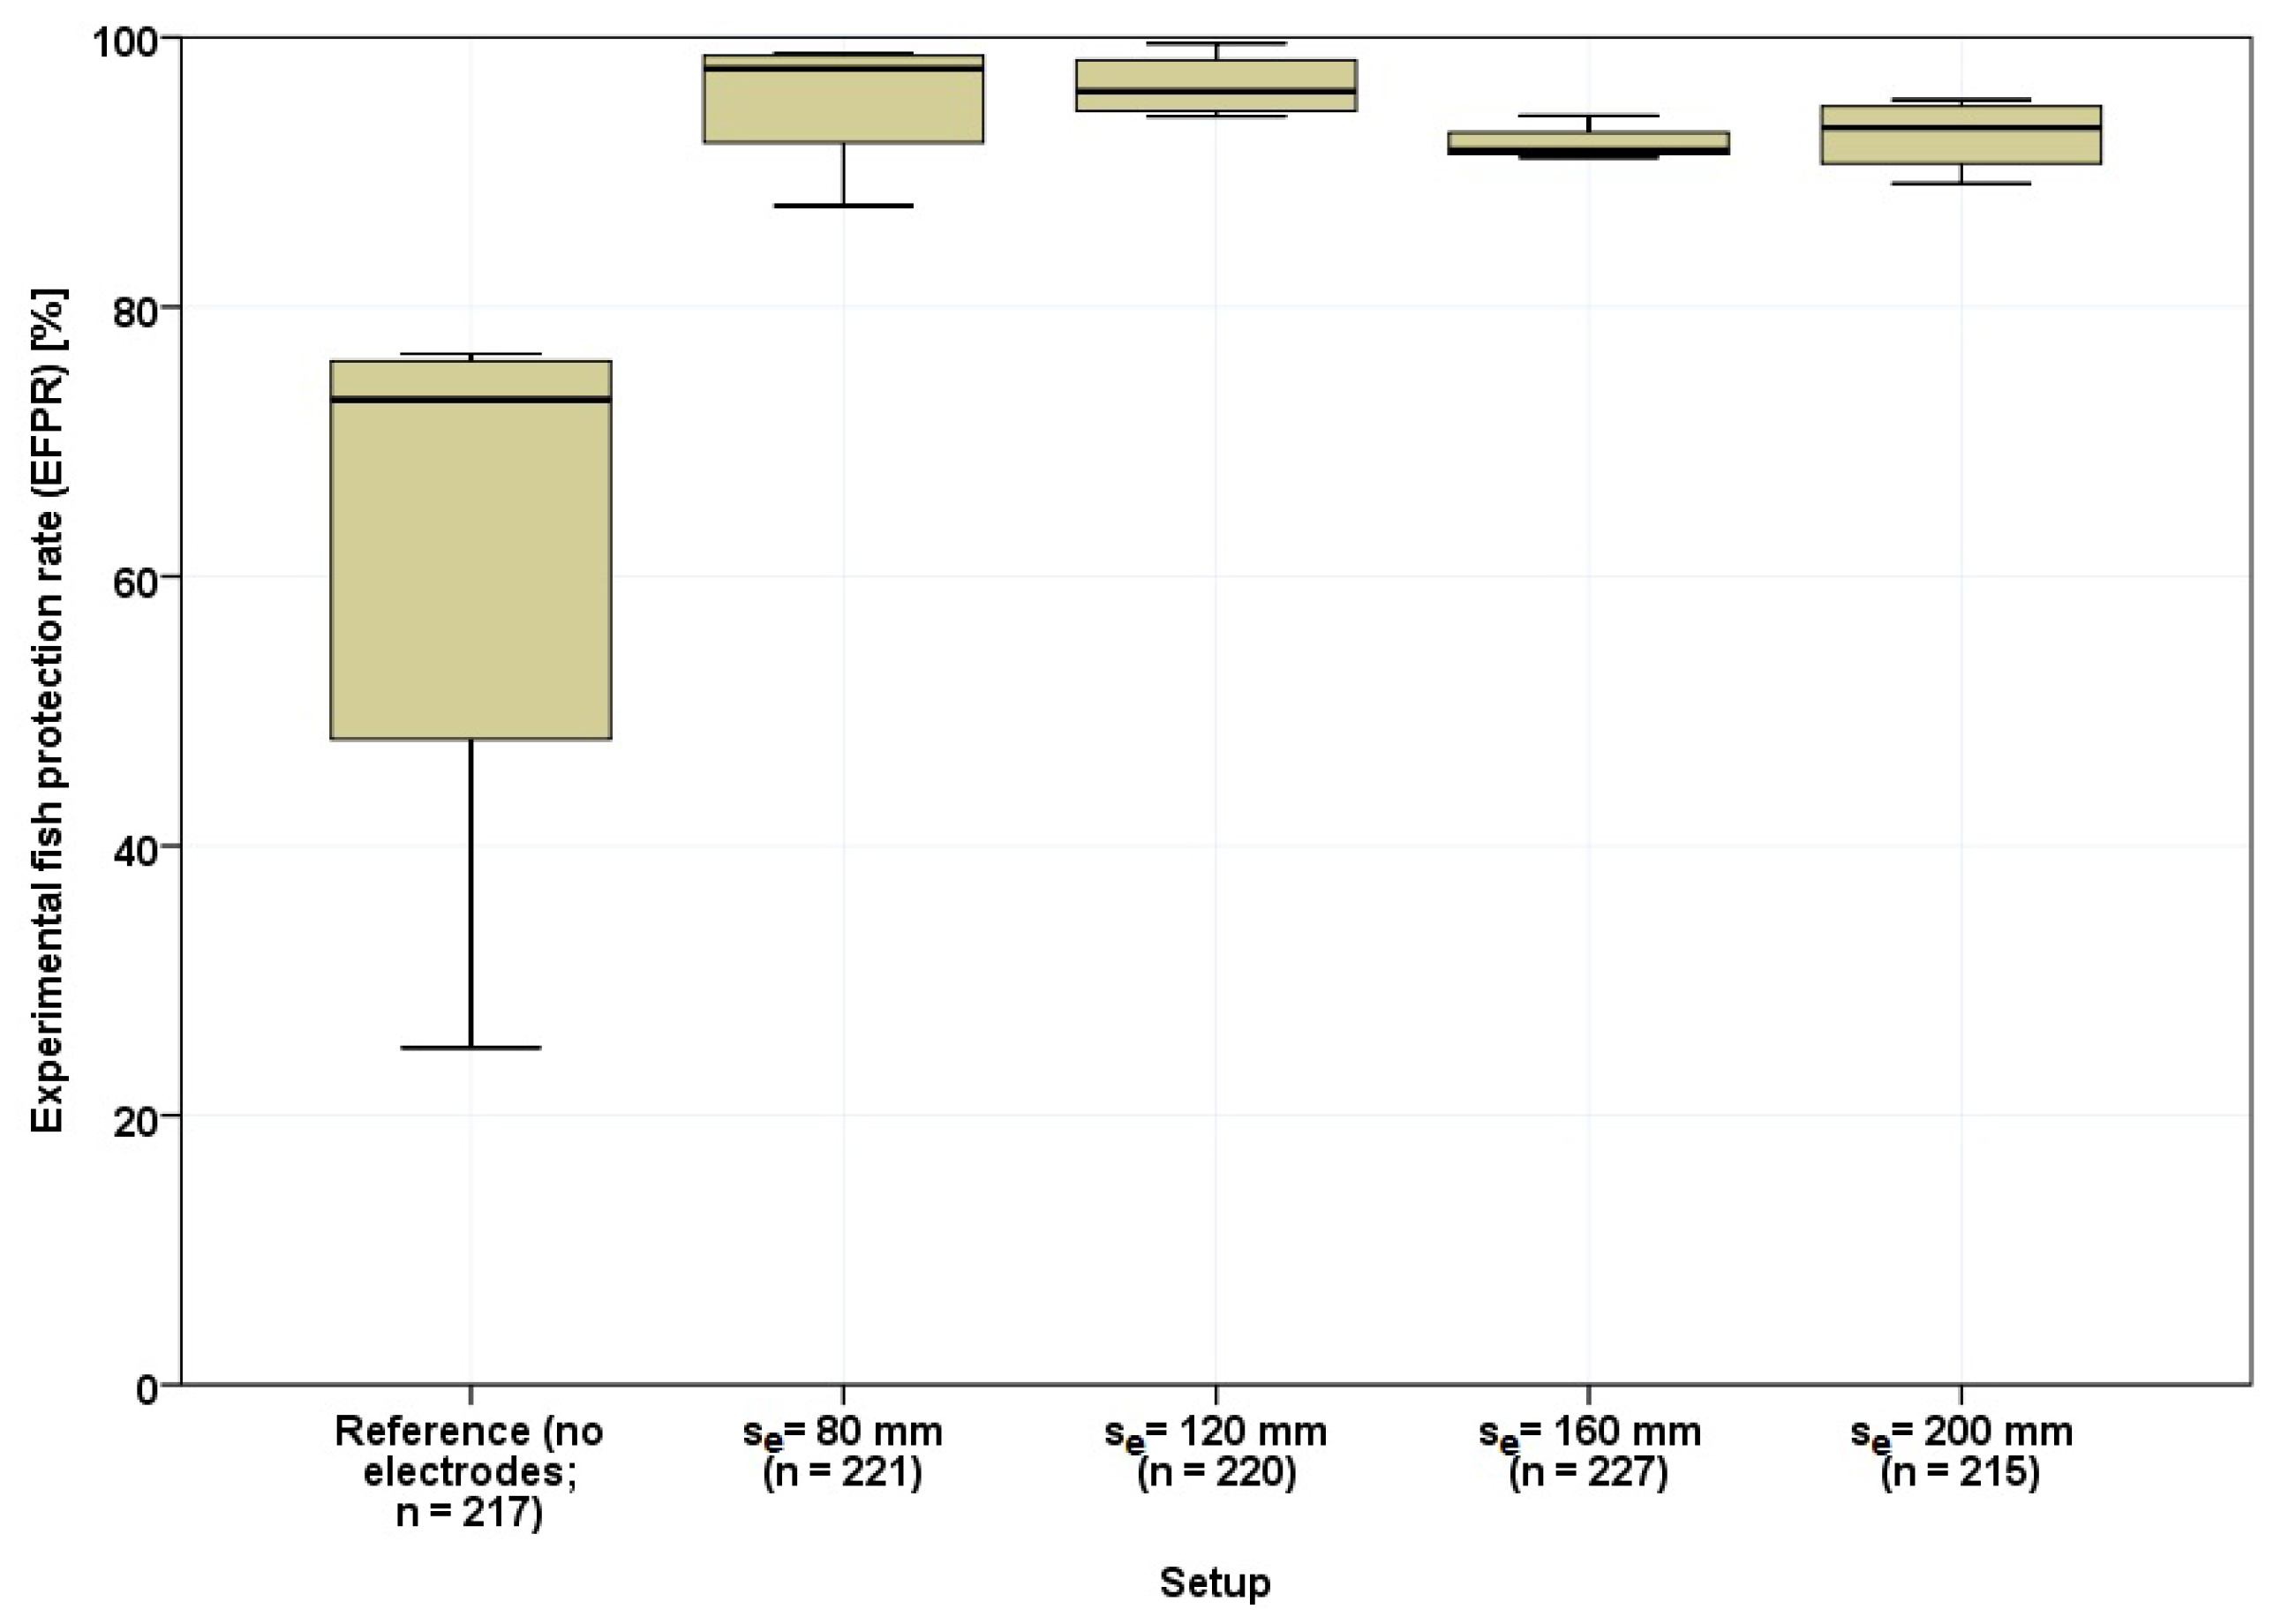
In this study, etohydraulic experiments at an unscaled section model of a vertical bar rack (sb = 30 mm) retrofitted with the FishProtector technology were conducted to investigate the situation at a pilot site. In detail, the experimental fish-protection rate (EFPR) at five different scenarios was assessed, including a bar rack without electrodes (reference) and four different electrified setups with se = 80 mm, 120 mm, 160 mm and 200 mm. Overall, the present study aims to achieve the following objectives: (i) to evaluate the EFPR of a purely mechanical barrier (a bar rack), (ii) to estimate the enhancement of the EFPR of the hybrid system with complementary electrodes, (iii) to detect an optimal electrode distance in terms of EFPR, and (iv) to evaluate the effect of anodes and cathodes on the location of rack passages.

2. Materials and Methods

2.1. Experimental Channel

In this study, ethohydraulic experiments were conducted at the outdoor HyTEC (Hydromorphological and Temperature Experimental Channels) facility in Lunz am See, Austria. This technical facility consists of two 40-metre-long and 6-metre-wide flumes, which receive water from nearby Lake Lunz. For the purpose of this study, the channels were connected by apertures to enable circular flow; in this setup, one channel serves as a water reservoir and contains a pump to supply the actual experimental channel with the necessary discharge exceeding the possible withdrawal rate from the lake. The water depth can be adapted via multiple flap-weirs in the downstream section of the experimental channel. For the experiments, a 4.6-metre-long, 2.5–3-metre-wide and 1-metre-deep section of the channel was used (Figure 1). The walls of the rectangular channel were made of wood amd the bottom substrate of coarse gravel (microlithal) with portions of fine and medium gravel (acal). The bar rack, set orthogonally to the channel flow, consisted of a steel frame (250 × 75 cm) in which the 10-millimetre-wide and 40-millimetre-deep flat steel bars were arranged (sb = 30 mm). Due to sb being 30 mm, the rack could be physically passed by all participating fish. To fit the bar rack, the channel was narrowed to 2.5 m in the downstream part of the experimental area, ensuring favorable inflow conditions on the rack and preserving the homogeneity of flow due to the gentle narrowing over the length of the entire experimental area (Figure 1). The upstream channel section contained an adaption area to allow fish to adapt to the prevailing flow and depth conditions without getting into contact with the barrier prior to the start of the actual experiment. The adaption area was separated from the experimental area by a fine-mesh net gate that could be opened via a cable pull. The channel area downstream of the rack had a length of five meters, ensuring fish that passed through the rack had sufficient undisturbed space. Escape of the experimental or adaptation area was prevented with fine-mesh nets and grids. In order to recreate the situation at the pilot site, an average flow velocity of vA = 0.23 m/s was chosen for the systematic investigation. To achieve the desired flow velocity of 0.23 m/s (prevailing at a possible pilot plant) at a water depth of 0.5 m at the rack, a flow rate of 290 L/s was required. VA was verified by averaging measurements 10 cm upstream of the bar rack in a regular raster with 27 points using a Vectrino ADV (Nortek Inc., Norway). These measurements showed that flow velocities were evenly distributed over the cross section. For data acquisition, two GoPro Hero 3 cameras 60 cm upstream of the bar rack visually covering the entire area were installed. To aid in video analyses of fish behavior with regards to their distance to the barrier, substrate markings were laid out 40 cm and 20 cm upstream of the barrier. Preceding investigations identified a first reaction of fish to the visible barrier approximately 40 cm upstream, which was followed by orienting rheotactically positively and indicating visual perception of the barrier. Prior studies also indicated an effective range of the used electric field for deterring reactions of approximately 20 cm upstream [41].
The bar rack was electrified with electrodes made of structural steel rods (8 mm diameter) which were attached with cable ties to the front side of the electrically disconnected bars. A Neptun pulse generator from Procom System S.A. (Poland) was used to generate the pDC of 80V, which has been proven to be effective and harmless for fish in prior studies [32,34,39]. Connection to the wiring was made with cable lugs attached by electrically conductive screws which were mounted to the upper end of the electrodes. For se = 80 mm, three electrodes were connected consecutively as anodes followed by three cathodes along the rack (3 + 3 −; Figure 2). Experience has shown that this pattern produces a homogeneous electric field with a uniform extension across the width of the barrier. However, with increasing se, the homogeneity of the electric field would be lost with this interconnection. The resulting field would be bulbous in its expansion and the effective areas would vary in distance from the rack across the channel width. Therefore, setups with se = 120 mm, 160 mm and 200 mm used electrodes alternately connected either as anodes and cathodes (+ −; Figure 2).
Previous studies showed that in comparable experimental facilities, most fish move mainly along the channel bottom and close to the side walls [15,37]. Therefore, additional electrodes were mounted horizontally at the bottom (also serving as a distance marker line) and vertically on the channel walls next to the rack in an upstream distance of 10 cm. These additional electrodes served the purpose of making the electric field as homogeneous as possible, even at the boundaries.

2.2. Fish for Ethohydraulic Experiments

The fish used in the ethohydraulic experiments (Table 1) originate mainly from wild fish or hatcheries from the vicinity of the test facility (Lower Austrian Danube catchment area). This limited possible effects of fish genetics or water chemistry on the results. Fish length was determined by measuring all fish (experiments V01, V02, V03, V10 and V11) or by taking representative length samples (all other experiments). Each experimental replicate consisted of around 55 fish of different species. To ensure comparability of experiments, emphasis was placed on a similar composition in terms of species distribution and size classes. The use of multiple holding tanks with circular flow ensured that fish were subjected to a minimum 48-hour observation period after participating in an experiment before individuals were considered for another experiment.

2.3. Experimental Procedure

All experiments were conducted between 3 and 13 October 2020. The general experimental procedure was adopted from Boettcher et al. [42] and Tutzer et al. [37]. Prior to each experiment, fish were retrieved from the holding tanks, examined for obvious injuries and then stocked in the adaptation area with minimum discharge (Q = 50 L/s) to avoid stress. The discharge was slowly increased to the desired amount and we used an adaption period of 30 min to allow acclimatization to flow and water conditions during the experiments. At the end of the adaption phase, the cameras were brought into position and activated; this procedure avoided visual contact with the fish and the triggering of escape reactions. The start of the 60-min experimental phase was marked by lifting the fine-mesh net gate via the cable pull, thereby allowing fish to swim from the adaptation to the experimental area.
At the end of each experiment, the flow was reduced to a minimum to allow for simple removal of the fish from the experimental area. After clearance, all fish were examined for apparent injuries, protocolled and then transferred to the observation tanks. Four replicates were conducted for the reference scenario and for each of the four electrified setups (N = 4), totaling 20 experiments. For each experiment, influential parameters such as water conductivity, temperature and weather conditions were recorded to test for possible influencing factors (Table A1).

2.4. Data Evaluation

The video data were analyzed visually due to the lack of suitable automatic software for the present experimental setup (insufficient contrast between fish and bed substrate). Each camera perspective was viewed for each of the 20 experiments by the same evaluator. Fish behavior was divided into five categories which were recorded with the time of occurrence. In this process, a fish was counted as participating in the experiment if it approached the bar rack and passed the 40 cm distance marker line (Figure 1). Passing a line was defined when a rheotactically negative-oriented fish crossed it with its nose or when a rheotactically positive-orientied fish crossed it with its tail. Fish which did not come close to the bar rack during the entire duration of the experiment were not included in the evaluation. If a fish left the 40 cm area and then approached the bar rack again, it could cause several actions within one experiment as it was not feasible to distinguish between most individuals. In detail, the following behavioral patterns were used to log fish behavior in the experiments:
  • Participation: Entering the defined area 40 cm upstream the bar rack.
  • Approaching: Entering the defined area 20 cm upstream of the bar rack.
  • Contact: Entering the defined area 10 cm upstream of the bar rack.
  • Passage: Passage through the bar rack.
  • Upstream: Leaving the defined 40 cm area upstream.
In addition to the five abovementioned patterns, a fish was supplementally noted as exhibiting searching behavior when it repeatedly swam from one side of the bar rack to the other, investigating the vicinity of the rack for an alternative passage route. The experimental fish-protection rate (EFPR), representing the percentage of fish protected from a “turbine passage”, is the ratio of fish leaving the defined area upstream and the total number of individuals entering the area (Equation (1)). The experimental passage rate (EPR) pertains to the share of fish entering the 40 cm area which pass through the rack in the downstream direction (Equation (2)).
EFPR = Upstream Participation ;
EPR = Passage Participation ;
Moreover, fish passing the 20 cm or 10 cm line were recorded in order to understand how the electric field influences the approach distance to the rack. Additionally, the location of the rack passage was recorded to quantify whether the fish tend to pass near the bottom or the side walls. This spatial assessment also enables an evaluation of the influence of the electrode polarization on the passage location, which is of interest since it is commonly known from electrofishing surveys that fish are attracted towards the anode [22]. Therefore, clear spacings right next to electrodes were attributed to the electrode (two spacings in case of se = 200 mm) and the remaining spacings were attributed to the class “in between”. For se = 80 mm, both spacings between the sets of anodes/cathodes were contributed to “in between”.
Additionally, an analysis of the temporal distribution of the counted actions was performed. Each test was split into six time slots of 10 min each, and the actions during each period were summed up. This allows for a differentiation between initial exploration behaviors and the change during the course of the experiments.

2.5. Statistical Analysis

To test if electrode spacing se influenced the EFPR, the chi-squared test was used. The null hypothesis H0 assumed that there was no correlation between the EFPR and the application of any electric field. The alternate hypothesis HA stated that the EFPR and se are correlated. The error probability (two-tailed) of p = 0.05 was used. Therefore, significance was assumed if the p-value was below 0.05 (* p < 0.05, ** p < 0.01 and *** p < 0.001). In order for H0 to be true, χ 2 must not exceed a critical value χ 2crit. If the χ 2 value exceeded the critical value ( χ 2 > χ 2crit) the alternate hypothesis HA had to be accepted. Additionally, Fisher’s test was used to verify the strength of the results by calculating the effect size ϕ /Cramer’s V. An effect size is assumed weak if ϕ /V = 0.1, moderate if ϕ /V = 0.3, and strong, if ϕ /V = 0.5 [43]. All calculations were performed using SPSS, Version 24.

3. Results

3.1. General Fish Behavior

Fish activity during the experimental phase was high in all experiments, and fish explored the entire available area. When approaching the rack, fish exhibited positive rheotaxis at a distance of around 50 cm upstream of the rack. In case of the reference experiments, fish continued to move towards the bar rack, even touching it with their caudal fin. In contrast, in the electrified setups, fish maintained a certain distance to the bar rack. Once fish approached closer than around 20 cm, first humble reactions could be observed, depending on the individual’s length. This reaction to the electric field usually consisted of slight twitches and an upstream movement of several centimeters to decimeters. Often, another careful approach followed. Most individuals that repeated this sequence of reactions did not do so only at one position but swam laterally along the rack from one side of the channel to the other. Some specimens resided at a distance of around 20 cm in front of the barrier where the effective boundary of the electric field was suspected; this residing behavior lasted between several seconds and 10 s of minutes. In the reference setup, fish that passed downstream through the rack exhibited both positive and negative rheotaxis. Usually, fish would approach the barrier tail first, showing thigmotactic scanning behavior, after which they would turn around and pass through the clearances in rheotactic negative orientation. At electrified setups, passages with positive rheotaxis could only be recorded in very few instances while most passages occurred with the fish facing downstream. If the barrier was passed with an electric field present, this primarily occurred headfirst after a clearly identifiable reaction to the electric field which was expressed as a sudden thrust in upstream direction followed by a sharp turn and escape in the downstream direction through the barrier. Returning upstream through the bar rack coming from the tailwater was most frequently observed during the reference experiments, but also occurred in all other setups. Regarding the electrified setups, the upstream passage frequency increased with increasing se.
During all experiments, fish of different species often shoaled together. The shoals responded to movements of single individuals. For example, if a shoaling fish showed a directional escape response during the approach to the electrified rack, the entire shoal—regardless of size and species composition—reacted by following in the same direction. Neither short-term learning effects within one experiment nor long-term learning effects over several experiments could be identified.

3.2. Activity during Experiments

Except for three experiments (V01, V05 and V06), the activity or recorded number of participations was consistently high. After releasing fish from the adaptation area at the start of the experimental phase, it occurred that a larger number of fish quickly entered the experimental area (in particular, those experiments with se = 120 mm and 160 mm). This is visualized in Figure 3, which shows the standardized participations (sum of recorded participations in all four trials of the setup divided by the number of stocked individuals) for each time slot of 10 min and the five investigated setups. In the case of rack passages within the first time slot, fish were rheotactically negatively oriented and followed the current with increased swimming speed towards the rack. This led to an increased number of detected participations as well as rack passages in the first minutes of the experiments (Figure 4). During these rack passages, a downstream “escape reaction” through the rack was observed. For electrified setups, the number of recorded rack passages was slightly increased within the first minutes, then stayed consistently low during the remaining duration of the experiments (Figure 4). For reference tests, a slightly increased share of passages was recorded within the second interval (11–20 min). Comparing the amount of recorded participations (Figure 3) and rack passages (Figure 4), the pattern over time was similar for reference experiments. For electrified experiments, the initially increased number of participations within the first minutes (especially for se = 120 mm, 160 mm and 200 mm) also manifested in the number of rack passages. For the remainder of the experiment, the number of rack passages stayed consistently low, even though the recorded participations varied. Results of individual experiments are presented in Table A2.

3.3. Experimental Fish-Protection Rate

The EFPR during reference experiments averaged 62.0% (±24.8% SD, Table 2) and was significantly lower than the EFPR in electrified setups, which had an average EFPR of 92.1% (±1.4% SD) to 96.4% (±2.4% SD) ( χ 2 = 337.8, p = 7.41 × 10 72 , V = 0.281). In detail, pairwise tests showed that the EFPR of the unelectrified barrier was on average 30.1–33.4% lower than for each of the electrified setups. These results are statistically significant in all four comparisons, which exhibit a moderate effect size of 0.23–0.33 (Table 3). Comparisons between the electrified setups reveal a slightly decreasing fish-protection rate between the first two (se = 80 mm and se = 120 mm) and the last two (se = 160 mm and se = 200 mm) setups (Figure 5). Although all of these four combinations are statistically significant, their effect sizes are rather low (Table 3). Pairwise tests of the first two (se = 80 mm vs. se = 120 mm) and last two electrical setups (se = 160 mm vs. se = 200 mm) do not show significant differences in their fish-protection rate (Table 3).

3.4. Approach Distance to the Rack Depending on the Electrode Distance

When averaging the approach rates (20 cm and 10 cm) of all four conducted trials of the reference experiments (N = 4), 76% of the participants (<40 cm) approached closer to the rack than 20 cm (category “approaching”) and 50% closer than 10 cm (category “contact”; Figure 6). These fractions were lower for all electrified setups (all N = 4), especially the fraction approaching closer than 10 cm. With se = 80 mm, only 23% approached as far as 20 cm and 5% up to 10 cm to the barrier. With increasing se, the fraction of fish approaching closer than 20 cm went up to 31% (se = 120 mm), peaked at 54% (se = 160 mm) and finally dropped to 45% (se = 200 mm). While 10% advanced as close as 10 cm to the electrified bar rack with se = 120 mm, this fraction increased to 11% and 18% for se = 160 mm and 200 mm, respectively.

3.5. Location of Rack Passage and Influence of Electrodes

Figure 7 visualizes the bar rack looking in the flow direction over the entire channel width and includes the percentage of rack passages at each location summed up over all performed experiments (N = 20; n = 1100; npassages,all = 392). No difference in the passage location pattern could be identified for the different setups. The results show that fish pass through the rack more frequently close to the bottom and to the side walls of the flume. Hardly any fish pass through the structure in mid-channel position close to the surface. Furthermore, regarding the effect of the position of the anodes and cathodes, the average over all setups shows an even distribution of fish passages close to the anodes (39%) and the cathodes (38%). The rest of the passages occured in the fields not attributed to either anodes or cathodes.

3.6. Rack- and Voltage-Induced Fish Injuries

During reference experiments, no fish injuries due to rack contact were detected. During experiments with electrified setups, individual fish were observed to be impaired by direct electrode contact, which in some cases caused discoloration of the skin and seldom anesthesia. The discoloration of the skin disappeared after a few days in all recorded cases and was not accompanied by spinal fracture or other obvious injury.
Only one individual was stunned during the four experiments with se = 80 mm (corresponding to 0.13% of the observed participations or 6.25% of rack passages), two stunned fish were counted with se = 120 mm (0.22% of participations or 6.25% of passages). While no stunned fish were recorded in experiments with se = 160 mm, three individuals were stunned during experiments with se = 200 mm (0.48% of participations or 6.67% of passages). After the end of the experiments, all fish with discolored skin were found vital and no following mortality was observed.

4. Discussion

4.1. General

The present study illustrates the possibility of improving the EFPR of a vertical bar rack by retrofitting it with electrodes. The application of a low-voltage pDC on the electrodes creates an electric field in the water. This electric field serves as a behavioral barrier complementing the bar rack as a barrier itself and thus creating an efficient hybrid barrier for fish protection. Prior studies regarding electrical deterrence or guiding systems have either focussed on horizontal electrode orientation [38,41] or on vertical electrode orientation in several planes in the direction of flow [22,34,39]. The current system uses vertical electrodes attached to an existing bar rack, thus positioning the electrodes in one plane perpendicular to the direction of flow and effectively minimizing the area with highest field intensities. Ethohydraulic experiments to investigate the EFPRs of the non-electrified bar rack and four different electrified hybrid barrier setups were performed. The electrified setups used different electrode spacings (se = 80 mm, 120 mm, 160 mm and 200 mm). In all experiments, fish approaching the bar rack first showed a reaction to the barrier at a distance of around 50 cm upstream of the barrier due to visual perception, orienting themselves in positive rheotaxis (Section 3.1). During the non-electrified setup, fish commonly proceeded to the bar rack and explored the barrier thigmotactically—a pattern also observed by Albayrak et al. [44], among others. Around 38.0% of all fish subsequently passed through the rack structure in downstream direction (Section 3.3). The electrified setups, in contrast, were able to reduce the rack passages to 3.6–7.9% on average, thereby ensuring a significantly higher EFPR (mean EFPR between 92.1% ± 1.4% SD and 96.4% ± 2.4% SD) than the non-electrified bar rack (mean EFPR 62.0% ± 24.8% SD). The EFPRs achieved in the ethohydraulic experiments are similar to those presented by Tutzer et al. [37].

4.2. Fish Activity Patterns and Approaching the Barrier

The recorded activity of the fish during almost all experiments was consistently high (Section 3.2). A higher number of passages over the 40 cm marker line (participations) was recorded in electrified experiments with se = 120 mm and 160 mm during the first minutes of the experiment (Figure 3). This was not recorded in reference trials or with se = 80 mm and 200 mm. Other influencing factors such as water temperature, date or time of day were not connected to the activity patterns of fish. In general, fish activity slightly decreased after opening the gate at the start of the experimental phase, which may be due to initial exploration behavior. Hence, it can be assumed that the increased number of approaches, and especially rack passages, in the first minutes only occurs in experiments and can not be transferred to sites in the field.
During experiments with electrified setups, fish did not approach the bar rack as closely as they did during experiments with the reference setup (Section 3.4). This behavior can be explained by the electric field. As a fish swims towards the barrier, it perceives an increase in electric field intensity, possibly stopping once a critical threshold value is reached. Results show that the fraction of participating fish (<40 cm to the barrier) approaching closer than 20 cm was greatly reduced in all electrified setups when compared to reference experiments. With an increasing electrode distance, more fish entered this area. Naturally, the fraction of fish closer than 10 cm to the rack is lower than the fraction closer than 20 cm. The fraction approaching closer than 10 cm to the rack was lowest for se = 80 mm and increased only slightly with increasing se. However, the effect of the electric field on the individual fish can vary depending on species and size [22,41,45]. It could be observed that smaller fish swam closer to the barrier before showing visible reactions than larger specimens did. Additionally, it seemed that smaller fish were more likely to pass through the bar rack than larger ones. This conclusion is supported by Tutzer et al. and Johnson et al., who have reported a slight dependency of passage probability and fish size with similar systems [39,41]. Since fish size is an important factor for the efficiency of an electric deterrence system, the electric field intensity has to be optimized for a certain target fish size. Investigation of the influence of fish size on the EFPR in the current setup is strongly recommended. In addition, future studies could perform numeric simulations and measurements of the electric field in the headwater and the tailwater section of the electrified bar rack in order to optimize the distance between electrodes as well as their polarization pattern.

4.3. Passing the Barrier

In reference experiments, the rack passages were evenly distributed over the experimental duration; and this was also the case for experiments with se = 80 mm (Figure 4). The increased fractions of recorded participation in experiments with se = 120 mm, 160 mm and 200 mm as described above resemble the trend of rack passages within the first minutes of the experiments. For the remaining duration of experiments, the rack passages of all electrified setups stayed at a constantly low rate. During those initial passages, fish were observed to approach the barrier with increased swimming speed, entering the electric field and subsequently passing through the rack with visible reactions to the electric stimulus. It is suspected that the electric field in these cases was perceived abruptly, leading to an instant escape reaction in the downstream direction since the fish could not locate its source and were already oriented rheotactically negative. This escape in the undesired direction through the bar rack is thought to be reduced during applications in the field, since the initial exploration behavior occuring in ethohydraulic experiments (after opening of the gate) will not be present.
No indication was found that the location of rack passage was related to the polarization of the electrodes as anodes or cathodes. Furthermore, the absence of anodic attraction and cathodic repulsion may be caused by the specific pulse pattern used for the electrification of the barrier. It is recommended to further study the barrier electrification effects by careful analysis of passages close to the electrodes. In any case, the majority of rack passages occurred close to the channel bed and the flume walls—a pattern that has already been reported by Albayrak et al. [44], Beck et al. [15] and Kammerlander et al. [46], among others. A bottom overlay might further improve the EFPR [47,48].
Distinct cross-species shoaling was observed, with entire shoals responding to behavioral impulses of single individuals. If an individual fish showed a directional escape response during the approach to the electrified bar rack, the entire shoal—regardless of size and species composition—reacted and swam in the same direction. Such behavior was also described by Adam et al. [21]. This pattern suggests that, for shoaling fish species, the EFPR may be even higher than for solitary fish species—a result which may be directly transferable to situations in the field.
In the investigated setups, the bar rack functioned merely as a barrier preventing entrainment into the turbines. This resembles the situation of an existing bar rack retrofitted with electrodes for fish protection. Usually, these bar racks are oriented perpendicular to the flow direction. In an integral approach to fish protection described by Calles et al. [12], a properly functioning bypass is essential for successful downstream migration [49]. The observed searching behavior of fish from one side of the bar rack to the other indicates a possible guiding effect, which might help fish to find a bypass located at the side of the bar rack. This guiding effect of pDC electrical barriers for downstream migration has also been reported by Johnson et al. and Tutzer et al. [39,41].
Once fish moved through the barrier, some individuals were found to re-enter the experimental area by upstream passage through the bar rack. In the electrified setups, these fish must have been confronted with the electric field during downstream movements. However, if the perception of the electric field upstream of the barrier did not lead to a learning effect, it might be assumed that the electric field is of different extent or field intensity at the downstream side of the bar rack. The bar rack itself is shielding the electric field in the downstream direction since it is constructed of metal (principle of faraday cage). This has also been confirmed by qualitative measurements of the electric field upstream and downstream of the hybrid barrier. However, due to the lack of observability of fish behavior behind the bar rack, no general statement can be made about facilitated passability from the tailwater to the headwater compared to passability in the direction of flow. Hence, future studies should investigate the correlation of the electric field downstream of the electrified bar rack and the ratio of fish moving again in the upstream direction and the possibility of developing a semi-permeable barrier.

4.4. Limitations

The tested flow velocity vA = 0.23 m/s has been chosen to replicate the situation at the pilot site but lies below the flow velocity of most considerable in situ applications. Comparable studies found that guiding of lamprey and rainbow trout with vertical electrodes and similar voltage and pulse patterns decreased with increasing flow velocity [39]. Therefore, the results cannot be transferred directly to all possible sites and further investigations with increased flow velocities are recommended.
The definition of the EFPR in the current study may differ from the fish-protection rate measured in the field, since a single fish, when leaving the defined observation area close to the rack upstream, can cause several counts for actions (participation) without passing through the barrier. In contrast, inactive fish permanently staying upstream of the surveyed area do not contribute towards actions. Additionally, information such as species and length of the participating fish could not be included in the visual evaluation of the video data but are crucial parameters in the function of the described hybrid barrier system. Thus, future studies must assess the fish-protection rate in the field, replacing the purely visual analysis used in this study with, for example, PIT technology. This facilitates the detection of fish at the locations of the antennas and enables a spatial and temporal evaluation including crucial information about each individual (species, length and weight).
In the current setup, the bar rack functioned exclusively as a barrier preventing fish from turbine entrainment and no bypass system was offered. Additionally, no option of migration into the headwater was provided. Consequently, there were only two options for the fish—either staying upstream of the barrier or passing through the bar rack. This strict limitation is not the case for the majority of in situ applications. Therefore, the duration of experiments might play a key role on the resulting EFPR. If the experimental time would be set to several hours, the EFPR could deviate substantially from the one established in this study. Hence, future investigations could be performed with an increased experimental duration and reduced spacial confinements for the participating individuals.
Fish size is one of the key factors influencing reactions to electric fields [23,24,25]. Fish size in the current study was limited to an average fork length of 50–125 mm per species. Therefore, a direct transfer of the results to larger specimens can not be drawn directly. Other studies found that larger fish (92–410 mm) were also prevented from passage through similar systems and could escape the electric field unharmed [34,41]. Further investigations including larger fish are strongly recommended.
Certain limitations have to be considered when transferring the results of the ethohydraulic experiments to sites in the field (e.g., shallow water, flow velocity, experiments exclusively during daytime, dimensions of the setup). Therefore, further studies at a pilot site are recommended. Special attention therein has to be payed to fish protection during migration periods and ultimately increased willingness to migrate.

5. Conclusions

This study served to investigate the effect of a vertical bar rack retrofitted with electrodes to create a behavioral barrier to prevent downstream fish passage, thereby contributing to a further improvement of fish-protection technologies at water intake structures. In detail, five different scenarios were tested: (i) a 30 mm bar rack without electrodes (reference), and four electrified setups with electrode spacings of (ii) 80 mm, (iii) 120 mm, (iv) 160 mm and (v) 200 mm. The results demonstrate that the fish-protection rate of the solely mechanical barrier can be increased significantly by the application of an electrified behavioral barrier. The main outcomes from this study can be summarized as follows:
  • The mean experimental fish-protection rate of a common vertical bar rack with 10 mm wide bars, a clear bar spacing of 30 mm and a flow velocity of 0.23 m/s in this study is 62%. This can be attributed to the reaction of fish to (the bar spacings of) the visual barrier.
  • Attaching electrodes at the front side of the rack bars and applying a pulsed direct current creates an electric field in the water which influences fish behavior. Overall, the electrified setups are able to significantly improve the fish-protection rate as far as 96% in the experimental setups.
  • In detail, the fish-protection rate of the hybrid barrier depends on the clear spacing of the electrodes and behaves inversely proportional to it while the bar spacings are kept constant; however, these differences are almost negligible from a practical point of view.
  • No connection between the behavior of fish close to electrodes and their polarization could be identified concerning the location of the rack passage. Therefore, neither anodic attraction nor cathodic repulsion could be observed with the applied pulse pattern.
  • Fish injuries in the form of temporal discoloration of the skin were only recorded in rare cases and only after direct contact with the electrodes.
However, further research is needed due to limitations within this study (size of the bar rack, flow velocity, day time, seasonality, water temperature, etc.). To gain more essential knowledge, implementation and extensive surveying at a pilot site in the field is recommended. Overall, the results show that retrofitting of existing bar racks with the presented technology ensures high fish-protection rates and significantly reduces rack passages compared to the unmodified bar rack under certain conditions.

Author Contributions

Conceptualization, J.H., S.A., C.F., B.B., R.T. and M.A.; methodology, J.H., S.A., C.F. and R.T.; software, J.H. and S.A.; validation, J.H., S.A. and C.F.; formal analysis, J.H. and C.F.; investigation, J.H., S.A., C.F. and D.S.H.; resources, B.B. and M.A.; data curation, J.H.; writing—original draft preparation, J.H.; writing—review and editing, J.H., S.A., C.F., D.S.H., B.B., R.T. and M.A.; visualization, J.H.; supervision, B.B. and M.A.; project administration, B.B.; funding acquisition, B.B. All authors have read and agreed to the published version of the manuscript.

Funding

This research was carried out using the University of Innsbruck’s own funds.

Institutional Review Board Statement

We confirm that the research meets the ethical guidelines and legal requirements. This manuscript was reviewed and approved by the University of Innsbruck and by the University of Natural Resources and Life Sciences, Vienna, Department of Water, Atmosphere and Environment, Institute of Hydrobiology and Aquatic Ecosystem Management, in accordance with its policy on objectivity in research.

Informed Consent Statement

Not applicable.

Data Availability Statement

The data presented are available upon request from the authors.

Conflicts of Interest

The authors declare no conflict of interest.

Abbreviations

The following abbreviations are used in this manuscript:
EFPRExperimental Fish-Protection Rate
EPRExperimental Passage Rate
sbClear Spacing between Rack Bars
seSpacing between Electrodes (Center to Center)
vAAverage Flow Velocity [m/s]
pDCPulsed Direct Current
nNumber of Participating Individuals
SDStandard Deviation
NNumber of Conducted Trials
npassages,allNumber of all Recorded Rack Passages

Appendix A

Table A1. Test program for the performed ethohydraulic experiment and main parameters: electrode spacing se, voltage applied to the electrodes [V], mean water temperature during experiment [°C], σ Water = electrical water conductivity during experiment [µS/cm] and number of individuals participating in the experiment n.
TestDateseVoltageTwater,mean σ Watern
[-][mm][V][°C][µS/cm][-]
V013 October 2020Reference-10.825255
V024 October 2020808011.425156
V034 October 2020Reference-11.425153
V044 October 2020Reference-11.425154
V055 October 2020808012.125155
V065 October 2020808011.425155
V075 October 2020808011.225155
V086 October 2020Reference-11.425255
V096 October 20202008011.225255
V107 October 20202008011.125150
V117 October 20202008011.425255
V127 October 20202008011.225155
V138 October 20201208011.125155
V148 October 20201208011.225155
V158 October 20201208011.425155
V169 October 20201208011.125155
V1712 October 20201608010.625155
V1812 October 20201608010.625155
V1913 October 20201608010.625155
V2013 October 20201608010.425162
Table A2. Video analysis results of the ethohydraulic experiments, participation = number of fish crossing the 40 cm line in downstream direction, passages = number of fish passing through the bar rack in downstream direction, upstream = number of fish leaving the area in upstream direction, EPR = experimental passage rate (=passages/participations), EFPR = experimental fish-protection rate (=1-EPR).
ExperimentParticipationsPassagesUpstreamEPREFPR
[-][-][-][%][%]
Reference
V0143175.025.0
V032365817824.675.4
V04137409729.270.8
V0846410935523.576.5
841208633
se = 80 mm
V0213221301.598.5
V05642623.196.9
V064053512.587.5
V0750965031.298.8
74516729
se = 120 mm
V13239142255.994.1
V1422212210.599.5
V1530792982.997.1
V1615881505.194.9
92632894
se = 160 mm
V17258152435.894.2
V18325292968.991.1
V19239202198.491.6
V20325272988.391.7
1147911056
se = 200 mm
V1015171444.695.4
V111028947.892.2
V121751915610.989.1
V13197111865.694.4
62545580

References

  1. Lucas, M.; Baras, E.; Thom, T.; Duncan, A.; Slavik, O. Migration of Freshwater Fishes; Blackwell Science Ltd.: London, UK; Oxford, UK, 2001. [Google Scholar]
  2. Dingle, H.; Drake, V.A. What is migration? Bioscience 2007, 57, 113–121. [Google Scholar] [CrossRef] [Green Version]
  3. Schwevers, U.; Adam, B. Fish Protection Technologies and Fish Ways for Downstream Migration; Springer: Berlin/Heidelberg, Germany, 2020. [Google Scholar]
  4. Ebel, G. Fischschutz und Fischabstieg an Wasserkraftanlagen: Handbuch Rechen- und Bypasssysteme: Ingenieurbiologische Grundlagen, Modellierung und Prognose, Bemessung und Gestaltung; Ebel, Büro für Gewässerökologie und Fischereibiologie: Halle (Saale), Germany, 2013. [Google Scholar]
  5. Schneider, J.; Ratschan, C.; Heisey, P.G.; Avalos, J.C.; Tuhtan, J.A.; Haas, C.; Reckendorfer, W.; Schletterer, M.; Zitek, A. Flussabwärts gerichtete Fischwanderung an mittelgroßen Fließgewässern in Österreich. Wasserwirtschaft 2017, 107, 39–44. [Google Scholar] [CrossRef]
  6. BMLFUW. Leitfaden zum Bau von Fischaufstiegshilfen; Bundesministerium für Land- und Forstwirtschaft, Umwelt und Wasserwirtschaft: Wien, Austria, 2012. [Google Scholar]
  7. Williams, J.G.; Armstrong, G.; Katopodis, C.; Larinier, M.; Travade, F. Thinking like a fish: A key ingredient for development of effective fish passage facilities at river obstructions. River Res. Appl. 2012, 28, 407–417. [Google Scholar] [CrossRef] [Green Version]
  8. Calles, O.; Greenberg, L. Connectivity is a two-way street—The need for a holistic approach to fish passage problems in regulated rivers. River Res. Appl. 2009, 25, 1268–1286. [Google Scholar] [CrossRef]
  9. Larinier, M.; Travade, F. Downstream Migration: Problems and Facilities; Bulletin Français de la Pêche et de la Pisciculture; EDP Sciences: Les Ulis, France, 2002; pp. 181–207. [Google Scholar]
  10. Harrison, P.M.; Martins, E.G.; Algera, D.A.; Rytwinski, T.; Mossop, B.; Leake, A.J.; Power, M.; Cooke, S.J. Turbine entrainment and passage of potadromous fish through hydropower dams: Developing conceptual frameworks and metrics for moving beyond turbine passage mortality. Fish Fish. 2019, 20, 403–418. [Google Scholar] [CrossRef]
  11. Keuneke, R.; Dumont, U. Vergleich von Prognosemodellen zur Berechnung der Turbinen bedingten Fischmortalität. Wasserwirtschaft 2010, 100, 39. [Google Scholar] [CrossRef]
  12. Calles, O.; Karlsson, S.; Hebrand, M.; Comoglio, C. Evaluating technical improvements for downstream migrating diadromous fish at a hydroelectric plant. Ecol. Eng. 2012, 48, 30–37. [Google Scholar] [CrossRef]
  13. Kriewitz-Byun, C.R. Leitrechen an Fischabstiegsanlagen: Hydraulik und fischbiologische Effizienz. Ph.D. Thesis, ETH Zürich, Zürich, Switzerland, 2015. [Google Scholar]
  14. DWA Deutsche Vereinigung für Wasserwirtschaft. Fischschutz- und Fischabstiegsanlagen—Bemessung, Gestaltung, Funktionskontrolle; Druckerei Brandt GmbH: Bonn, Germany, 2005. [Google Scholar]
  15. Beck, C.; Albayrak, I.; Meister, J.; Peter, A.; Selz, O.M.; Leuch, C.; Vetsch, D.F.; Boes, R.M. Swimming Behavior of Downstream Moving Fish at Innovative Curved-Bar Rack Bypass Systems for Fish Protection at Water Intakes. Water 2020, 12, 3244. [Google Scholar] [CrossRef]
  16. Albayrak, I.; Kriewitz, C.R.; Hager, W.H.; Boes, R.M. An experimental investigation on louvres and angled bar racks. J. Hydraul. Res. 2018, 56, 59–75. [Google Scholar] [CrossRef]
  17. Szabo-Meszaros, M.; Navaratnam, C.U.; Aberle, J.; Silva, A.T.; Forseth, T.; Calles, O.; Fjeldstad, H.P.; Alfredsen, K. Experimental hydraulics on fish-friendly trash-racks: An ecological approach. Ecol. Eng. 2018, 113, 11–20. [Google Scholar] [CrossRef]
  18. Giesecke, J.; Heimerl, S.; Mosonyi, E. Wasserkraftanlagen: Planung, Bau und Betrieb; Springer: Berlin/Heidelberg, Germany, 2014. [Google Scholar]
  19. Ebel, G. Biologische Wirksamkeit von Leitrechen-Bypass-Systemen—Aktueller Kenntnisstand. Wasserwirtschaft 2020, 110, 18–27. [Google Scholar] [CrossRef]
  20. Schilt, C.R. Developing fish passage and protection at hydropower dams. Appl. Anim. Behav. Sci. 2007, 104, 295–325. [Google Scholar] [CrossRef]
  21. Adam, B.; Lehmann, B. Ethohydraulik: Grundlagen, Methoden und Erkenntnisse; Springer: Berlin/Heidelberg, Germany, 2011. [Google Scholar]
  22. Beaumont, W. Electricity in Fish Research and Management; Wiley Online Library: Hoboken, NJ, USA, 2016. [Google Scholar]
  23. Bullen, C.R.; Carlson, T.J. Non-physical fish barrier systems: Their development and potential applications to marine ranching. Rev. Fish Biol. Fish. 2003, 13, 201–212. [Google Scholar] [CrossRef]
  24. Layhee, M.J.; Sepulveda, A.J.; Shaw, A.; Smuckall, M.; Kapperman, K.; Reyes, A. Effects of electric barrier on passage and physical condition of juvenile and adult rainbow trout. J. Fish Wildl. Manag. 2016, 7, 28–35. [Google Scholar] [CrossRef] [Green Version]
  25. Noatch, M.R.; Suski, C.D. Non-physical barriers to deter fish movements. Environ. Rev. 2012, 20, 71–82. [Google Scholar] [CrossRef]
  26. Rost, U.; Weibel, U.; Wüst, S.; Haupt, O. Versuche zum Scheuchen und Leiten von Fischen mit elektrischem Strom. Wasserwirtschaft 2014, 104, 60–65. [Google Scholar] [CrossRef]
  27. Egg, L.; Pander, J.; Mueller, M.; Geist, J. Effectiveness of the electric fish fence as a behavioural barrier at a pumping station. Mar. Freshw. Res. 2019, 70, 1459–1464. [Google Scholar] [CrossRef]
  28. Snyder, D.E. Electrofishing and Its Harmful Effects on Fish; Technical Report; Geological Survey Reston Va Biologicalresources DIV: Reston, VA, USA, 2003. [Google Scholar]
  29. Rous, A.M.; Forrest, A.; McKittrick, E.H.; Letterio, G.; Roszell, J.; Wright, T.; Cooke, S.J. Orientation and position of fish affects recovery time from electrosedation. Trans. Am. Fish. Soc. 2015, 144, 820–828. [Google Scholar] [CrossRef]
  30. Baranyuk, G.V. Orientation of the catfish in uniform and nonuniform electric fields. Neurosci. Behav. Physiol. 1981, 11, 459–463. [Google Scholar] [CrossRef]
  31. Basov, B.M. On electric fields of power lines and on their perception by freshwater fish. J. Ichthyol. 2007, 47, 656–661. [Google Scholar] [CrossRef]
  32. Tutzer, R.; Röck, S.; Walde, J.; Haug, J.; Brinkmeier, B.; Aufleger, M.; Unfer, G.; Führer, S.; Zeiringer, B. A Physical and Behavioral Barrier for Enhancing Fish Downstream Migration at Hydropower Dams: The Flexible FishProtector. Water 2022, 14, 378. [Google Scholar] [CrossRef]
  33. Halsband, E. Nur durch elektrischen Impulsstrom ist das Scheuchen und Leiten von Fischen wirksam möglich. Der Fischwirt 1989, 10, 1–4. [Google Scholar]
  34. Parasiewicz, P.; Wisniewolski, W.; Mokwa, M.; Ziola, S.; Prus, P.; Godlewska, M. A low-voltage electric fish guidance system-NEPTUN. Fish. Res. 2016, 181, 25–33. [Google Scholar] [CrossRef]
  35. Haug, J.; Brinkmeier, B.; Tutzer, R.; Aufleger, M. Hybrid barriers for adaption of bar-screens for fish protection. Wasserwirtschaft 2021, 111, 48–53. [Google Scholar] [CrossRef]
  36. Tutzer, R.; Brinkmeier, B.; Zeiringer, B.; Führer, S.; Unfer, G.; Aufleger, M. The fishprotector—An integral fish protection system. In Proceedings of the E-proceedings of the 38th IAHR World Congress, Panama City, Panama, 1–6 September 2019. [Google Scholar]
  37. Tutzer, R.; Brinkmeier, B.; Boettcher, H.; Aufleger, M. Der Elektro-Seilrechen als integrales Fischschutzkonzept. Wasserwirtschaft 2019, 109, 36–40. [Google Scholar] [CrossRef]
  38. Meister, J.; Moldenhauer-Roth, A.; Beck, C.; Selz, O.M.; Peter, A.; Albayrak, I.; Boes, R.M. Protection and Guidance of Downstream Moving Fish with Electrified Horizontal Bar Rack Bypass Systems. Water 2021, 13, 2786. [Google Scholar] [CrossRef]
  39. Johnson, N.S.; Miehls, S. Guiding out-migrating juvenile Sea Lamprey (Petromyzon marinus) with pulsed direct current. River Res. Appl. 2014, 30, 1146–1156. [Google Scholar] [CrossRef]
  40. Swink, W.D. Effectiveness of an electrical barrier in blocking a sea lamprey spawning migration on the Jordan River, Michigan. N. Am. J. Fish. Manag. 1999, 19, 397–405. [Google Scholar] [CrossRef]
  41. Tutzer, R.; Röck, S.; Walde, J.; Zeiringer, B.; Unfer, G.; Führer, S.; Brinkmeier, B.; Haug, J.; Aufleger, M. Ethohydraulic experiments on the fish protection potential of the hybrid system FishProtector at hydropower plants. Ecol. Eng. 2021, 171, 106370. [Google Scholar] [CrossRef]
  42. Böttcher, H.; Brinkmeier, B.; Aufleger, M. Der Seilrechen als neues Fischschutzkonzept—Untersuchung der technischen Machbarkeit. In Tagungsband Internationales Symposium 2014 in Zürich—Wasser- und Flussbau im Alpenraum, Versuchsanstalt für Wasserbau, Hydrologie und Glaziologie; ETH: Zurich, Switzerland, 2014. [Google Scholar]
  43. Cohen, J. Statistical Power Analysis for the Behavioral Sciences, 2nd ed.; L. Erlbaum Associates: Hillsdale, NJ, USA, 1988. [Google Scholar]
  44. Albayrak, I.; Boes, R.M.; Kriewitz-Byun, C.R.; Peter, A.; Tullis, B.P. Fish guidance structures: Hydraulic performance and fish guidance efficiencies. J. Ecohydraulics 2020, 5, 113–131. [Google Scholar] [CrossRef]
  45. Scheminzky, F.; Scheminzky, F. Körpergröße und Empfindlichkeit gegen den galvanischen Strom. Pflüger’s Archiv Gesamte Physiologie Menschen Tiere 1931, 228, 548–564. [Google Scholar] [CrossRef]
  46. Kammerlander, H.; Schlosser, L.; Zeiringer, B.; Unfer, G.; Zeileis, A.; Aufleger, M. Downstream passage behavior of potamodromous fishes at the fish protection and guidance system “Flexible Fish Fence”. Ecol. Eng. 2020, 143, 105698. [Google Scholar] [CrossRef]
  47. De Bie, J.; Peirson, G.; Kemp, P.S. Evaluation of horizontally and vertically aligned bar racks for guiding downstream moving juvenile chub (Squalius cephalus) and barbel (Barbus barbus). Ecol. Eng. 2021, 170, 106327. [Google Scholar] [CrossRef]
  48. Meister, J.; Fuchs, H.; Beck, C.; Albayrak, I.; Boes, R.M. Velocity fields at horizontal bar racks as fish guidance structures. Water 2020, 12, 280. [Google Scholar] [CrossRef] [Green Version]
  49. Feigenwinter, L.; Vetsch, D.F.; Kammerer, S.; Kriewitz, C.R.; Boes, R.M. Conceptual approach for positioning of fish guidance structures using CFD and expert knowledge. Sustainability 2019, 11, 1646. [Google Scholar] [CrossRef] [Green Version]
Figure 1. Plan view of the experimental channel with upstream boundary and gate between adaption and experimental area, camera position (C1 and C2) in red, bar rack within the flume (green), 40, 20 and 10 cm lines at the channel bed (blue, orange, cyan, respectively).
Water 14 00850 g001
Figure 2. Location and polarization of the electrodes attached to the bar rack and additional electrodes at flume walls and channel bed for reference and electrified setups in layout view, flow from bottom to top. (a) se = Reference, (b) se = 80 mm, (c) se = 120 mm, (d) se = 160 mm, (e) se = 200 mm electrode distance.
Water 14 00850 g002
Figure 3. Standardized participations (recorded participations/stocked individuals in experiment) during time slots of 10 min each for all five setups (each N = 4). Boxplots include representative statistic measures: minimum, first quartile, median, third quartile and maximum. Number of participating individuals per setup and four trials (N = 4) is denoted as n.
Water 14 00850 g003
Figure 4. Standardized rack passages (recorded rack passages/stocked individuals in experiment) during time slots of 10 min for all five setups (each N = 4). Boxplots include representative statistic measures: minimum, first quartile, median, third quartile and maximum. Number of participating individuals per setup and four trials (N = 4) is denoted as n.
Water 14 00850 g004
Figure 5. EFPRs [%] of reference and four electrified setups (each N = 4). Boxplots include representative statistic measures: minimum, first quartile, median, third quartile and maximum. Number of participating individuals per setup and four trials (N = 4) is denoted n.
Water 14 00850 g005
Figure 6. Approach rates [%] based on the number of participations in all setups (each N = 4). Boxplots include representative statistic measures: minimum, first quartile, median, third quartile and maximum. Number of participating individuals per setup and four trials (N = 4) is denoted as n.
Water 14 00850 g006
Figure 7. Location of rack passages [%] between bars (X-axis: distance from left side (mm)) and for three height levels (Y-axis: close to channel bed, middle and close to the water surface or distance from bottom (mm)) over all performed experiments in all setups (N = 20; n = 1100; npassages,all = 392).
Water 14 00850 g007
Table 1. Fish in the ethohydraulic experiments, number of participating individuals (n), mean fork length (FL) (mm) and standard deviation (SD) of mean fork length (mm).
FamilySpeciesnMean FLSD
[-][mm][mm]
CyprinidaeChub (Squalius cephalus)36584±14
Barbel (Barbus barbus)3152±17
Crucian carp (Carassius carassius)11125±21
LeuciscidaeBleak (Alburnus alburnus)266112±18
Roach (Rutilus rutilus)18961±17
Bream (Abramis brama)5882±6
Nase (Chondrostoma nasus)3057±10
Dace (Leuciscus leuciscus)1667±4
Minnow (Phoxinus phoxinus)1550±10
AcheilognathidaeBitterling (Rhodeus amarus)106105±6
GobionidaeGudgeon (Gobio gobio)4396±13
PercidaePerch (Perca fluviatilis)1167±10
Zingel (Zingel zingel)7100±9
GasterosteidaeStickle (Gasterosteus aculeatus)845±8
SalmonidaeBrown trout (Salmo trutta f. fario)475±3
Table 2. Video analysis results of the ethohydraulic experiments: mean participations (±SD), mean passages (±SD), mean EPR (±SD), mean EFPR (±SD) and mean number of stocked individuals n (±SD). Mean over the four conducted experiments in each setup (N = 4).
SetupParticipationsPassagesEPREFPRn
(±SD) [−](±SD) [−](±SD) [%](±SD) [%](±SD) [−]
Reference210.3 (±194.0)52.0 (±43.2)38.0 (±24.8)62.0 (±24.8)54.3 (±0.8)
se = 80 mm186.3 (±218.7)4.0 (±2.4)4.6 (±5.3)95.4 (±5.3)55.3 (±0.4)
se = 120 mm231.5 (±61.2)8.0 (±5.4)3.6 (±2.4)96.4 (±2.4)55.0 (±0.0)
se = 160 mm286.8 (±44.8)22.8 (±6.4)7.9 (±1.4)92.1 (±1.4)56.8 (±3.0)
se = 200 mm156.3 (±40.8)11.3 (±5.4)7.2 (±2.8)92.8 (±2.8)53.8 (±2.2)
Table 3. Chi-squared test-global and local (pairwise). χ 2, error probability p, significance, effect size ϕ and Cramer’s V. Significance: *** p < 0.001.
Compared Setups χ 2pSignificance ϕ Cramer’s V
all337.8 7.4 × 10 72 ***0.2810.281
Reference vs. 80 mm171.0 4.4 × 10 39 ***−0.3280.328
Reference vs. 120 mm172.6 2.0 × 10 39 ***−0.3130.313
Reference vs. 160 mm109.6 1.2 × 10 25 ***−0.2350.235
Reference vs. 200 mm77.1 1.6 × 10 18 ***−0.2290.229
80 mm vs. 120 mm3.1 7.6 × 10 2 n.s.0.0430.043
80 mm vs. 160 mm29.9 4.5 × 10 8 ***0.1260.126
80 mm vs. 200 mm22.8 1.8 × 10 6 ***0.1290.129
120 mm vs. 160 mm18.4 1.8 × 10 5 ***0.0940.094
120 mm vs. 200 mm11.9 5.6 × 10 4 ***0.0880.088
160 mm vs. 200 mm0.187 6.6 × 10 1 n.s.−0.0100.010
Publisher’s Note: MDPI stays neutral with regard to jurisdictional claims in published maps and institutional affiliations.

